nicaraguan demographic and health survey endesa 2006/07 · endesa 2006/07 contributes important...
TRANSCRIPT
National Institute for Development Information (INIDE)Ministry of Health (MINSA)
Special thanks to:
United Nations Population Fund (UNFPA)United Nations Children’s Fund (UNICEF)
United Nations Development Programme (UNDP)World Bank (WB)
United States Agency for International Development (USAID)Canadian Technical Assistance Program (CANTAP-3)
Centers for Disease Control and Prevention (CDC), Atlanta, Georgia. USA (Technical Assistance)
Nicaraguan Demographic and Health Survey
ENDESA 2006/07
Preliminary Report
REPUBLIC OF NICARAGUA
Photographs used on cover:
Afro - Caribbean girl from Bluefields, Southern Atlantic Coast.
Survey interviewer in the municipality of San Miguelito.
Young adults at the Central American University (UCA).
A pregnant young adult receiving antenatal care at the health center in the municipality of Mulukuku in the Northern Autonomous Atlantic Region (RAAN).
Doctors in the operation room in a hospital in Bluefields.
A one - year old boy, in his mother’s arms, receiving a medical check-up at the health center at Mulukuku.

ENDESA ProjectNational Institute for Development Information (INIDE)Ministry of Health (MINSA)Photographs and Cover: Fanix Urbina, Fátima PérezGraphic Design: Raquel MartínezInternet site: www.inide.gob.niFax: 2681790, Telephone: 2666178, 2662825.Post Box: 4031.Managua, Nicaragua, September, 2008

CONTENTS
Introduction ........................................................................................................................................1
Methodology .......................................................................................................................................2 Sample design and selection ..................................................................................................2 Data collection and processing ...............................................................................................3 Sample yield ...........................................................................................................................4
Characteristics of the Respondents .........................................................................................5
Fertility ...............................................................................................................................................7
Family Planning ...............................................................................................................................10 Maternal and Child Health .........................................................................................................13 Women’s Health ....................................................................................................................13 Prenatal care .........................................................................................................................13 Delivery assistance .................................................................................................................15 Child Health ..........................................................................................................................16 Nutrition ...............................................................................................................................17 Child Immunization ..............................................................................................................19 Childhood Illnesses ................................................................................................................20 Acute Respiratory Infections ...................................................................................................20 Diarrhea ..............................................................................................................................21
Infant and Child Mortality ..........................................................................................................23
HIV/AIDS ............................................................................................................................................26
Violence Against Women .............................................................................................................28
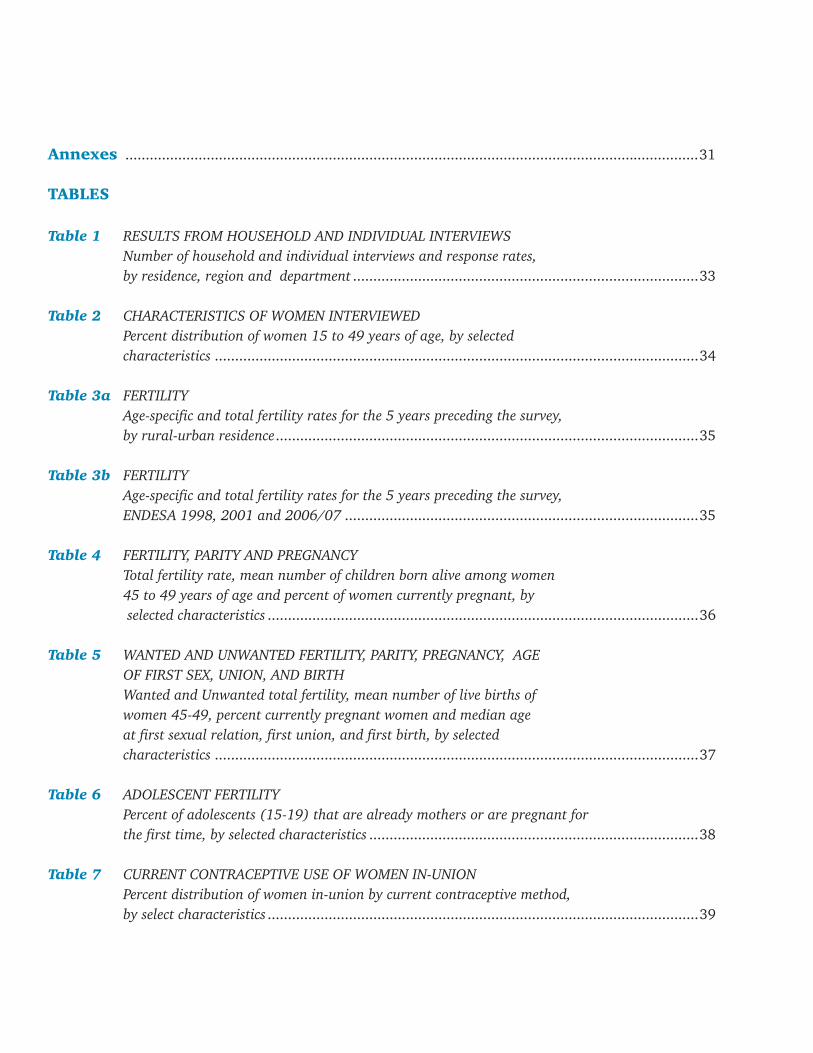
Annexes .............................................................................................................................................31
TABLES
Table 1 RESULTS FROM HOUSEHOLD AND INDIVIDUAL INTERVIEWS Number of household and individual interviews and response rates, by residence, region and department .....................................................................................33
Table 2 CHARACTERISTICS OF WOMEN INTERVIEWED Percent distribution of women 15 to 49 years of age, by selected characteristics .......................................................................................................................34
Table 3a FERTILITY Age-specific and total fertility rates for the 5 years preceding the survey, by rural-urban residence ........................................................................................................35
Table 3b FERTILITY Age-specific and total fertility rates for the 5 years preceding the survey, ENDESA 1998, 2001 and 2006/07 .......................................................................................35
Table 4 FERTILITY, PARITY AND PREGNANCY Total fertility rate, mean number of children born alive among women 45 to 49 years of age and percent of women currently pregnant, by selected characteristics ..........................................................................................................36
Table 5 WANTED AND UNWANTED FERTILITY, PARITY, PREGNANCY, AGE OF FIRST SEX, UNION, AND BIRTH Wanted and Unwanted total fertility, mean number of live births of women 45-49, percent currently pregnant women and median age at first sexual relation, first union, and first birth, by selected characteristics .......................................................................................................................37
Table 6 ADOLESCENT FERTILITY Percent of adolescents (15-19) that are already mothers or are pregnant for the first time, by selected characteristics .................................................................................38
Table 7 CURRENT CONTRACEPTIVE USE OF WOMEN IN-UNION Percent distribution of women in-union by current contraceptive method, by select characteristics ..........................................................................................................39
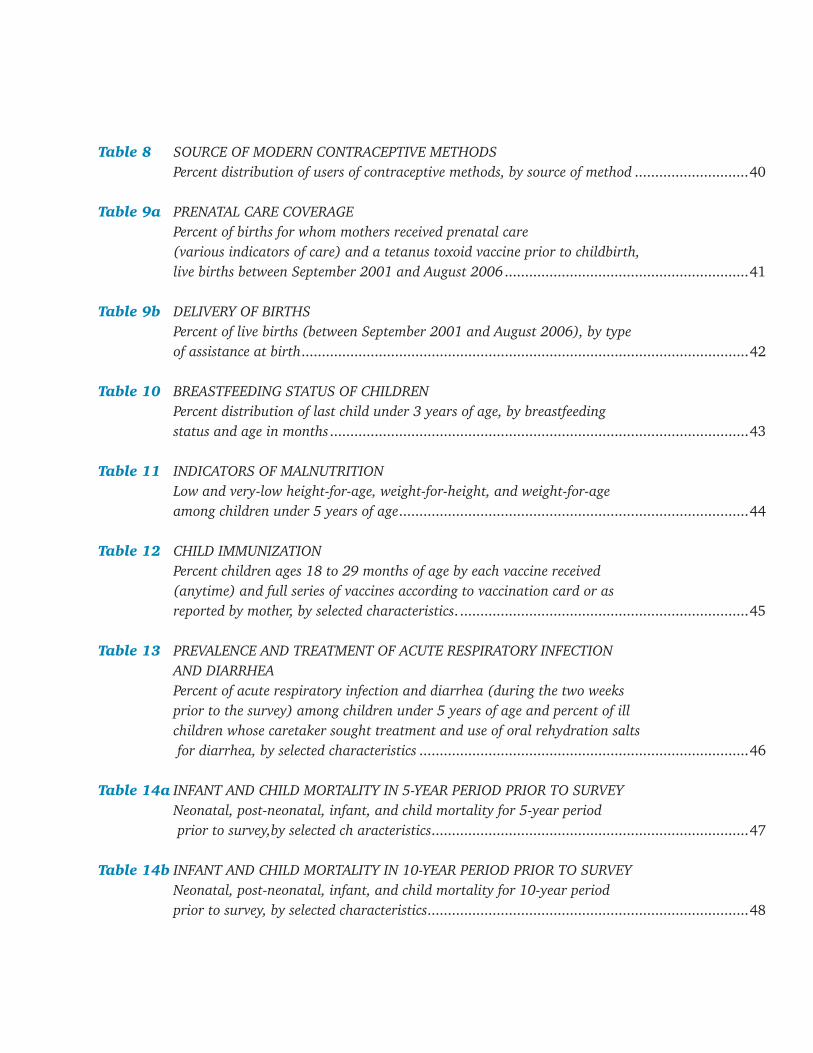
Table 8 SOURCE OF MODERN CONTRACEPTIVE METHODS Percent distribution of users of contraceptive methods, by source of method ............................40
Table 9a PRENATAL CARE COVERAGE Percent of births for whom mothers received prenatal care (various indicators of care) and a tetanus toxoid vaccine prior to childbirth, live births between September 2001 and August 2006 ............................................................41
Table 9b DELIVERY OF BIRTHS Percent of live births (between September 2001 and August 2006), by type of assistance at birth ..............................................................................................................42
Table 10 BREASTFEEDING STATUS OF CHILDREN Percent distribution of last child under 3 years of age, by breastfeeding status and age in months .......................................................................................................43
Table 11 INDICATORS OF MALNUTRITION Low and very-low height-for-age, weight-for-height, and weight-for-age among children under 5 years of age ......................................................................................44
Table 12 CHILD IMMUNIZATION Percent children ages 18 to 29 months of age by each vaccine received (anytime) and full series of vaccines according to vaccination card or as reported by mother, by selected characteristics. .......................................................................45
Table 13 PREVALENCE AND TREATMENT OF ACUTE RESPIRATORY INFECTION AND DIARRHEA Percent of acute respiratory infection and diarrhea (during the two weeks prior to the survey) among children under 5 years of age and percent of ill children whose caretaker sought treatment and use of oral rehydration salts for diarrhea, by selected characteristics .................................................................................46 Table 14a INFANT AND CHILD MORTALITY IN 5-YEAR PERIOD PRIOR TO SURVEY Neonatal, post-neonatal, infant, and child mortality for 5-year period prior to survey,by selected ch aracteristics ..............................................................................47
Table 14b INFANT AND CHILD MORTALITY IN 10-YEAR PERIOD PRIOR TO SURVEY Neonatal, post-neonatal, infant, and child mortality for 10-year period prior to survey, by selected characteristics ...............................................................................48

Table 15 KNOWLEDGE OF HIV / AIDS Percent of women who have heard of HIV/AIDS, know that there are different ways to prevent transmission, and know that condoms can prevent transmission, by selected characteristics .....................................................................49
Table 16a LIFETIME PREVALENCE OF DIFFERENT TYPES OF VIOLENCE Percent of ever-married women who have experienced verbal, physical or sexual violence during their lifetime, by selected characteristics ...............................................50
Table 16b PREVALENCE OF DIFFERENT TYPES OF VIOLENCE DURING THE LAST 12 MONTHS Percent of ever-married women who have experienced verbal, physical or sexual violence during the 12 months prior to the survey, by selected characteristics .......................................................................................................................51
LIST OF GRAPHS
Graph 1 Number of selected segments by department, ENDESAS 1998, 2001 and 2006/07 .................................................................................................................2
Graph 2 Marital status of women interviewed ........................................................................................5
Graph 3 Education level of women in reproductive ages, ENDESAS 1997/98, 2001 and 2006/07 .................................................................................................................6
Graph 4 Age-specific fertility by area of residence ...................................................................................8
Graph 5 Age-specific fertility ENDESA 1997/98, 2001 and 2006/07 .....................................................8
Graph 6 Total fertility rate by department .............................................................................................9
Graph 7 Percent distribution of current contraceptive method use ........................................................10
Graph 8 Current contraceptive method use of women in union, by age group .......................................11
Graph 9 Current contraceptive method use of women in union, by level of education ............................11
Graph 10 Principal sources of modern contraceptive Methods ................................................................12
Graph 11 Use of prenatal care for birth in the 5 years prior to the survey by area of residence, wealth quintile and birth order ......................................... .................................13
Graph 12 Use of prenatal care from a qualified medical personnel for births in 5 years prior to survey by area of residence, wealth quintile and birth order ...................................... 14
Graph 13 Deliveries of birth in the 5 years prior to the survey in a health care facility, by department ............................................................................................. ..........................15
Graph 14a Trends in nutritional status of children, ENDESAS 1997/98, 2001 and 2006/07 ................. 18
Graph 14b Chronic malnutrition (Height for Age) of children by age ..................................................... 19
Graph 15 Infant and child mortality in the 5 years prior to the survey ................................................... 23
Graph 16 Trends in infant and child mortality in Nicaragua and neighboring countries ......................... 24 Graph 17 Infant mortality in the 5 years prior to the survey by area of residence and region .................. 25 Graph 18 Knowledge of HIV/AIDS of women ages 15-49 years (Spontaneous response) ......................... 26
Graph 19 Percent of women, who know that abstinence, use of condoms in all relationships, and fidelity of partners can prevent HIV/AIDS transmission ................................................... 27
Graph 20 Percent of women who have ever experienced verbal, physical and/or sexual abuse, by marital status and level of education ................................................................................. 28
Graph 21 Percent of women who have experienced verbal, physical and/or sexual violence in the last year ...................................................................................................................... 29


PRESENTATION
The National Institute for Development Information (Instituto Nacional de Información de Desarrollo – INIDE), as governing organization of the National Statistics System (SEN), in collaboration with the Ministry of Health (MINSA), guarantor of the health of the people, in fulfillment of its fundamental mission of providing reliable and timely information for management and planning of health officials, cooperating agencies and others who represent public and private interests of the Nicaraguan people, has the honor of presenting the Preliminary Report of the Nicaraguan Demographic and Health Survey 2006/07 (ENDESA 2006/07).
ENDESA 2006/07 contributes important data for and on: 1) developing and pursuing a holistic approach to the health care of children in such areas as immunization, low birth weight, nutrition, and infant and child survival and development, 2) care for reproductive age women including prenatal care, and delivery assistance and postpartum care to prevent maternal mortality, 3) demand for family planning, 4) knowledge of HIV/AIDS, an epidemic which is still contained, and 5) family and partner violence.
On this occasion, INIDE and MINSA wish to acknowledge the United States Agency for International Development (USAID); the United Nations Development Programme (UNDP); the United Nations Population Fund (UNFPA); the United Nations Children’s Fund (UNICEF); the World Bank through Agreement No, 4050 NI; the Canadian Technical Assistance Program (CANTAP-3) through the Inter-American Development Bank (I.A.D.B.); and the Centers for Disease Control and Prevention (CDC) in Atlanta, Georgia., USA.
INIDE and MINSA are thankful for the efforts of the inter-institutional committees and technical personnel of ENDESA 2006/07, during the different stages of the survey. In addition, we acknowledge the self-sacrificing work of the field personnel in gathering the data, and especially thank the 14,221 women who provided the information asked for in the survey.
Ministry of HealthNational Institute for Development Information

National Institute for Development Information (INIDE) - Ministry of Health (MINSA)
1Preliminary Report
Demographic and reproductive health surveys are designed to provide information to family planning and reproductive health program administrators to assist them in the management and evaluation of their programs. In Nicaragua, Demographic and Health Surveys, known as ENDESAS, have been conducted by the National Institute for Development Information (INIDE) in collaboration with the Ministry of Health (MINSA) in 1997/98, 2001 and 2006/07. The 2006/07 survey received technical assistance from the Division of Reproductive Health of the U.S. Centers for Disease Control and Prevention in Atlanta, Georgia, and was funded by the United States Agency for International Development (USAID).
Nicaragua’s demographic and health survey ENDESA 2006/07 is the fourth survey of its kind and provides updated statistical information for the purpose of identifying the reproductive behavior of women in the reproductive ages and assessing changes in fertility and mortality. Topics that are examined include, among others:
1. Fertility rates and trends (including adolescent fertility).
2. Child mortality rates and trends.
Introduction
3. Prenatal, delivery and postnatal assistance.
4. Nutritional status of women and children under 5 years of age.
5. The health status of children and the prevalence of certain illnesses, such as acute respiratory infection (ARI) and diarrhea, and vaccination coverage.
6. Status of functional development of children under 5 years of age (between 7 and 59 months).
7. Sexual and reproductive health of women, including
a) Family planning.b) Marriage and exposure to pregnancy
risks.c) Knowledge of HIV/AIDS, STIs, and high
risk sexual activities.
This preliminary report of ENDESA 2006/07 provides a brief description of these topics illustrated with graphics in the text and tables in an appendix. The report contains an overall description and updated assessment of the health condition of women and children in Nicaragua.
2
Nicaraguan Demographic and Health Survey 2006/07
Preliminary Report
Methodology
Sample design and selection
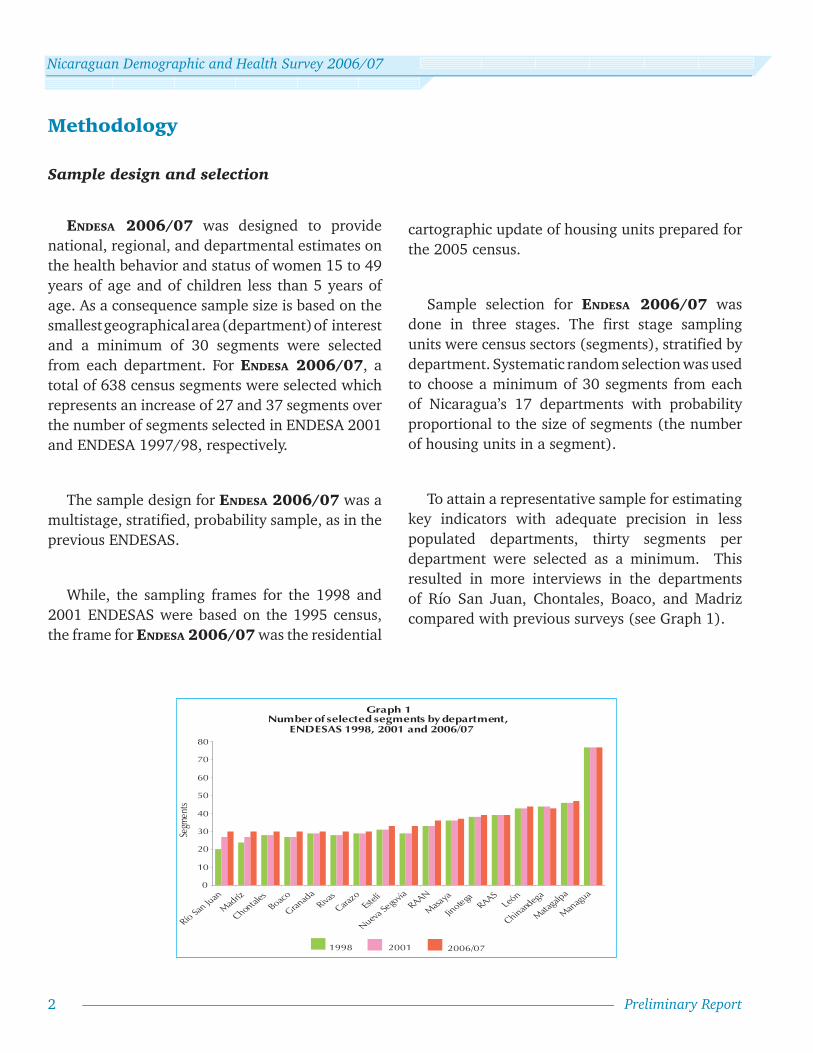
ENDESA 2006/07 was designed to provide national, regional, and departmental estimates on the health behavior and status of women 15 to 49 years of age and of children less than 5 years of age. As a consequence sample size is based on the smallest geographical area (department) of interest and a minimum of 30 segments were selected from each department. For ENDESA 2006/07, a total of 638 census segments were selected which represents an increase of 27 and 37 segments over the number of segments selected in ENDESA 2001 and ENDESA 1997/98, respectively.
The sample design for ENDESA 2006/07 was a multistage, stratified, probability sample, as in the previous ENDESAS.
While, the sampling frames for the 1998 and 2001 ENDESAS were based on the 1995 census, the frame for ENDESA 2006/07 was the residential
cartographic update of housing units prepared for the 2005 census.
Sample selection for ENDESA 2006/07 was done in three stages. The first stage sampling units were census sectors (segments), stratified by department. Systematic random selection was used to choose a minimum of 30 segments from each of Nicaragua’s 17 departments with probability proportional to the size of segments (the number of housing units in a segment).
To attain a representative sample for estimating key indicators with adequate precision in less populated departments, thirty segments per department were selected as a minimum. This resulted in more interviews in the departments of Río San Juan, Chontales, Boaco, and Madriz compared with previous surveys (see Graph 1).
0
10
20
30
40
50
60
70
80
Río San Ju
anMad
ríz
Chontal
esBoaco
Granad
aRiva
sCara
zoEst
elí
Nueva Se
goviaRAAN
Masaya
Jinotega
RAASLe
ón
Chinandega
Matagal
pa
Managu
a
1998 2001 2006/07
Segm
ents
Graph 1 Number of selected segments by department,
ENDESAS 1998, 2001 and 2006/07
National Institute for Development Information (INIDE) - Ministry of Health (MINSA)
3Preliminary Report
Since departments with a large rural population were over-sampled while departments with greater population density were under-sampled, the use of weights is required to obtain national and regional estimates, and weighting factors were created to adjust for this unequal selection probability.
The second stage sampling units were housing units. Thirty housing units were randomly selected from each of the 638 selected census sectors by randomly choosing a starting housing unit and selecting 29 consecutive housing units in a given direction, yielding a household sample of 19,140 housing units.
The third stage sampling units were women of reproductive age living in the selected households. One woman from each selected household was chosen for the sample. If more than one woman 15-49 years of age resided in a household, a random selection procedure was used to identify the woman eligible for the sample. The number of women selected for the sample was 14,847. The probability of selection of any woman was inversely proportional to the number of women of reproductive age living in her household. Therefore, weighting factors equal to the number of women of reproductive age in the household were created to adjust for this unequal probability of selection.
For interviewed women with children born since January of 2001, one child 0-5 years of age was randomly selected for administering a series of questions on postpartum care and the prevalence and treatment of respiratory infections and diarrhea, among other topics. The selection
of only one child per household reduced the time required for reliable data collection and allows for construction of national level estimates for children under 5 years of age. To analyze the data for children, weights were created and applied to adjust for the unequal probability of selection of children.
Data collection and processing
Two instruments were used for data collection, the household questionnaire and the individual questionnaire. The former was designed to collect information on the characteristics of the household, including dwelling characteristics such as structural materials and basic services, and goods and services available in the household. A household roster collected basic sociodemographic information (age, marital status, educational level, relationship to head of household) on every member of the household. The household questionnaire also included a section dedicated to the selection of the eligible reproductive-age woman to be interviewed.
The individual questionnaire was designed to collect information on the specific survey topics from the woman selected for interview. These topics included fertility history, knowledge and use of contraception, sexual and contraceptive behavior of young adults, knowledge and practices related to HIV/AIDS and STIs, maternal and child health practices, infant feeding practices, infant and child mortality, as well as social, economic, and demographic characteristics of the women interviewed. The individual questionnaire also included a section for recording the anthropometric information collected to assess the selected

4
Nicaraguan Demographic and Health Survey 2006/07
Preliminary Report
child’s nutrition status. The two questionnaires were pretested to assure appropriateness, comprehension, and logical sequencing of questions.
A two-week training was conducted for field personnel to establish dominance of the questionnaire, use of the field manual, and standardization of field procedures and interview norms. Field supervisors were responsible for the anthropometric measurement of children and were trained separately in measurement techniques and nutrition data collection.
Fieldwork began on September 20, 2006, and ended on April 18, 2007, with several interruptions due to presidential elections in the month of November, the Christmas and New Year holidays, and Holy Week. The fieldwork schedule allowed for up to five revisits to households where occupants were not at home or the selected woman was not available at the time of a visit. Extra visits were also conducted to correct inconsistencies found in questionnaires during review or data entry.
Fieldwork was conducted by nine teams, each comprising four interviewers, one supervisor, one editor (to review and evaluate completed questionnaires in the field), and a driver. There were also two field coordinators and an overall supervisor at the central office to support fieldwork logistics and data collection.
Respondents were assured of anonymity and confidentiality of the information they provided.
An additional six persons reviewed the questionnaires in the central office and data entry
was carried out by eight data-entry personnel. CSPro software was used to create a data entry/edit program that performed logic checks for skip patterns and range checks on all response entries. An extensive consistency check program was also used for data evaluation. Finally, double data entry was conducted to protect against data entry error.
Sample yield
Of the 19,140 housing units selected into the sample (see Table 1), 91.8 percent were found to be inhabited. The remaining 8.2 percent were unoccupied, destroyed, dwellings under construction, or structures converted to a nonresidential purpose.
Of the 17,570 occupied dwellings, the household response rate was 97.9 percent (17,209 households). Nonresponse included a low refusal rate of 0.5 percent (91 households). The remaining 1.5 percent (270 households) of nonresponse was attributable to no capable adult being present at the time of the first and subsequent visits.
Of the 17,209 households surveyed, 86.3 percent (14,847 households) had one or more women eligible for the individual interview.
Of the 14,847 households with one or more women 15-49 years of age, 14,221 of the selected women completed an individual interview, for a response rate of 95.8 percent. The combined response rate (household response rate x individual response rate) was 93.8 percent, higher than obtained in previous ENDESA surveys.
National Institute for Development Information (INIDE) - Ministry of Health (MINSA)
5Preliminary Report
Characteristics of the Respondents
Table 2 presents a profile of the respondents aged 15 to 49 years. One can observe that nearly 60 percent live in urban areas. By geographical region, higher percentages can be found in the Pacific region with 57 percent, North Central region with 30 percent, and 13 percent for the Northern and Southern Autonomous Regions (RAAN and RAAS, respectively) and the Department of Río San Juan that make up the Atlantic Coastal Region. Among departments, Managua has the largest share with 27 percent, Matagalpa with 9 percent, followed by León and Chinandega with 8 percent each, RAAS and Masaya with 6 percent each, and Jinotega with 5 percent; for each of the remaining departments
women in reproductive ages comprise less than 5 percent of the national total.
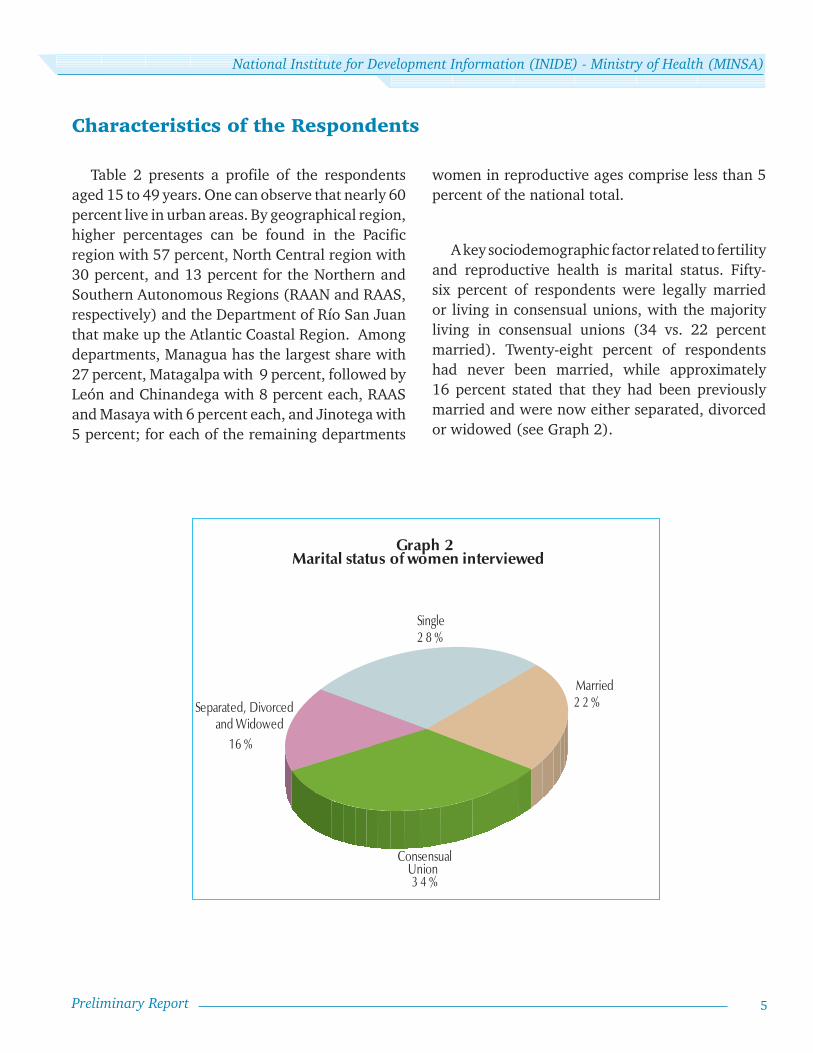
A key sociodemographic factor related to fertility and reproductive health is marital status. Fifty-six percent of respondents were legally married or living in consensual unions, with the majority living in consensual unions (34 vs. 22 percent married). Twenty-eight percent of respondents had never been married, while approximately 16 percent stated that they had been previously married and were now either separated, divorced or widowed (see Graph 2).
Married2 2 %
3 4 %
1 6 %
Single2 8 %
ConsensualUnion
Separated, Divorcedand Widowed
Graph 2 Marital status of women interviewed
6
Nicaraguan Demographic and Health Survey 2006/07
Preliminary Report
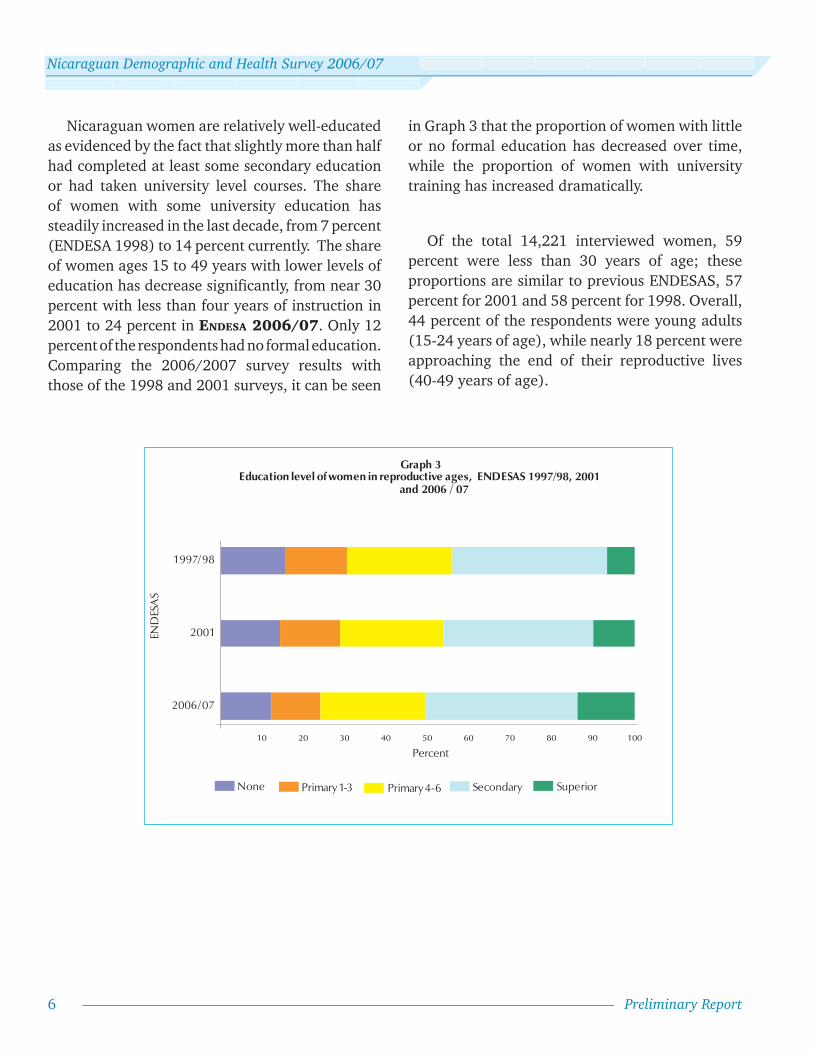
Nicaraguan women are relatively well-educated as evidenced by the fact that slightly more than half had completed at least some secondary education or had taken university level courses. The share of women with some university education has steadily increased in the last decade, from 7 percent (ENDESA 1998) to 14 percent currently. The share of women ages 15 to 49 years with lower levels of education has decrease significantly, from near 30 percent with less than four years of instruction in 2001 to 24 percent in ENDESA 2006/07. Only 12 percent of the respondents had no formal education. Comparing the 2006/2007 survey results with those of the 1998 and 2001 surveys, it can be seen
10 20 30 40 50 60 70 80 90 100
2006/07
2001
1997/98
Graph 3 Education level of women in reproductive ages, ENDESAS 1997/98, 2001
and 2006 / 07
Percent
None Primary 1-3 Primary 4-6 Secondary Superior
END
ESA
S
in Graph 3 that the proportion of women with little or no formal education has decreased over time, while the proportion of women with university training has increased dramatically.
Of the total 14,221 interviewed women, 59 percent were less than 30 years of age; these proportions are similar to previous ENDESAS, 57 percent for 2001 and 58 percent for 1998. Overall, 44 percent of the respondents were young adults (15-24 years of age), while nearly 18 percent were approaching the end of their reproductive lives (40-49 years of age).
National Institute for Development Information (INIDE) - Ministry of Health (MINSA)
7Preliminary Report
Fertility
Different data sources for Nicaragua reveal that for the better part of the last three decades fertility has been declining. The evidence, from various sources, (Population censuses of 1995 and 2005, Family health survey 1992/93, ENDESA 1997/98 and ENDESA 2001) indicates that these decreases have been more intense during the current and last decade. ENDESA 2006/07 corroborates this downward trend.
From a demographic perspective this behavior constitutes an unique opportunity, a “demographic window of opportunity,” in which birth rates decline, and changes occur in the population age structure with a reduction in the relative weight of younger age groups and a significant increase in the proportion of working aged persons (15 to 64 years of age), resulting in slower rates of population growth. This produces a general stability in the overall number of births with the potential for a decline in numbers of births and associated positive benefits for the educational sector, the environment, and health.
This section of the report analyses the evolution and present state of fertility, as well as differentials by geographic area, the link between fertility rate and socioeconomic status (as indicated by quintiles of wealth, measured by household goods and services), the relationship between fertility and the use of family planning, women’s education and other characteristics.
Information provided by survey respondents included detailed information on women’s reproductive behavior. For each respondent a birth history was obtained that included the number
of live births and the date and sex of each birth. This information is used to estimate fertility rates by age within specific periods of time, as well as an overall estimate of fertility, the total fertility rate (TFR). The total fertility rate is a summary indicator of recent fertility that combines the age-specific fertility rates of a given time period. It is interpreted as the average number of births per woman at the completion of their reproductive life that would occur if women were to experience the age-specific rates of the current period over their lifetimes.
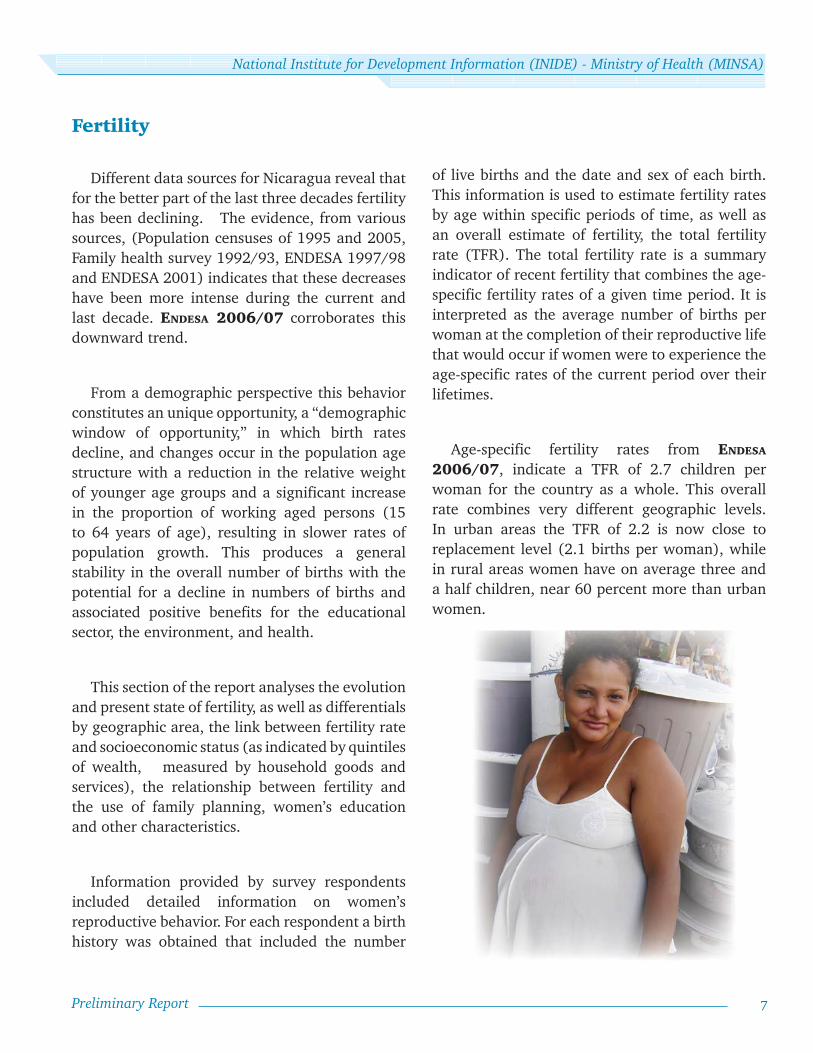
Age-specific fertility rates from ENDESA 2006/07, indicate a TFR of 2.7 children per woman for the country as a whole. This overall rate combines very different geographic levels. In urban areas the TFR of 2.2 is now close to replacement level (2.1 births per woman), while in rural areas women have on average three and a half children, near 60 percent more than urban women.

8
Nicaraguan Demographic and Health Survey 2006/07
Preliminary Report
0
50
100
150
200
250
15-19 20-24 25-29 30-34 35-39 40-44 45-49
2006/07 2001 1998
Graph 5 Age-specific fertility
ENDESA 1997/98, 2001 and 2006/07 Bi
rths
per
1,0
00 w
omen
Age Group
Table 3a presents age-specific fertility rates, by place of residence. These rates give the annual number of live births per 1,000 reproductive age women in 5-year age groups for the 5-year period prior to ENDESA 2006/07. As seen in Table 3a and Graph 4, Nicaraguan women initiate childbearing at an early age. For both urban and rural women, peak fertility occurs at ages 20-24. Most of the difference between rural and urban fertility rates is due to higher age-specific fertility rates among rural residents aged 15-29 years.
Graph 5 and Table 3b show the age-specific fertility rates for each of the surveys in Nicaragua. As can be seen, declines occurred with different intensity for all age groups. The TFR estimated from the ENDESA 2006/07 was 2.7 births per woman, which represents a decline of 0.6 births per woman from the TFR of 3.3 estimated in 2001 (ENDESA 2001), and a decline of 1.2 births from the TFR of 3.9 estimated in 1998. Thus, there has been a dramatic decline in fertility in Nicaragua
over the past 10 years, and the decline has been concentrated principally among women aged 15-29 years.
Table 4 shows differentials in the ENDESA 2006/07 TFRs, by area of residence, socioeconomic level, and completed education. On average, rural women have 1.3 more live births per woman than do urban women. Fertility differentials are largest when women are classified by educational and socioeconomic levels. The difference between
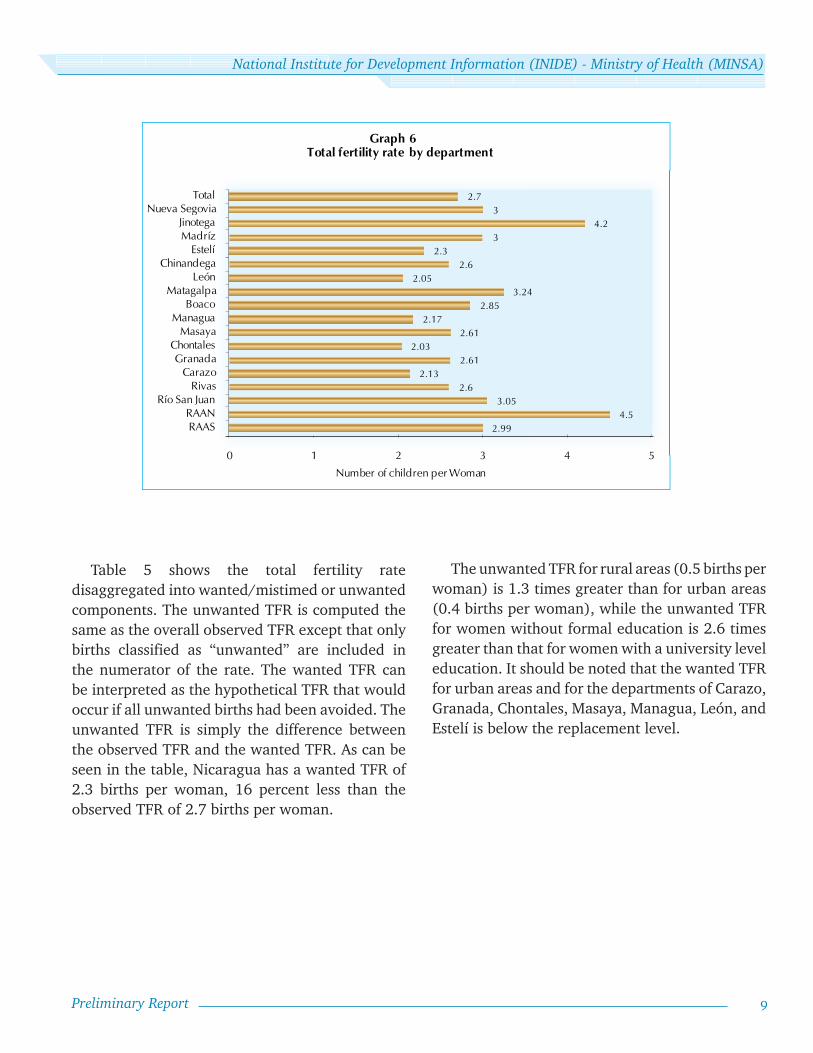
the highest and lowest categories of these characteristics was 2.8 and 2.7 births per woman, respectively. Department level estimates of the TFR ranged from 2.0 births per woman in Chontales to 4.5 in the RAAN (Graph 6). Departments with a TFR of 3.0 or greater include Nueva Segovia, Jinotega, Madriz, Matagalpa, Rio San Juan, the RAAN, and the RAAS. It should be noted that five departments are at or are approaching the fertility rate of replacement: Carazo, Chontales, Managua, León, and Estelí.
0
50
100
150
200
15-19 20-24 25-29 30-34 35-39 40-44 45-49
Urban Rural Total
Graph 4 Age-specific fertility by area of residence
Birt
hs p
er 1
,000
wom
en
Age Group
National Institute for Development Information (INIDE) - Ministry of Health (MINSA)
9Preliminary Report
Table 5 shows the total fertility rate disaggregated into wanted/mistimed or unwanted components. The unwanted TFR is computed the same as the overall observed TFR except that only births classified as “unwanted” are included in the numerator of the rate. The wanted TFR can be interpreted as the hypothetical TFR that would occur if all unwanted births had been avoided. The unwanted TFR is simply the difference between the observed TFR and the wanted TFR. As can be seen in the table, Nicaragua has a wanted TFR of 2.3 births per woman, 16 percent less than the observed TFR of 2.7 births per woman.
The unwanted TFR for rural areas (0.5 births per woman) is 1.3 times greater than for urban areas (0.4 births per woman), while the unwanted TFR for women without formal education is 2.6 times greater than that for women with a university level education. It should be noted that the wanted TFR for urban areas and for the departments of Carazo, Granada, Chontales, Masaya, Managua, León, and Estelí is below the replacement level.
2.994.5
3.052.6
2.132.61
2.032.61
2.172.85
3.242.05
2.62.3
34.2
32.7
0 1 2 3 4 5
RAASRAAN
Río San JuanRivas
CarazoGranada
ChontalesMasaya
ManaguaBoaco
MatagalpaLeón
ChinandegaEstelí
MadrízJinotega
Nueva SegoviaTotal
Graph 6 Total fertility rate by department
Number of children per Woman

10
Nicaraguan Demographic and Health Survey 2006/07
Preliminary Report
Family Planning
The use of contraceptive methods is the most important proximate determinant of fertility, and constitutes the most effective practice to reduce unintended pregnancy in women of reproductive age. It is also an important factor in increasing infant and child survival. Knowledge of the level of use of contraceptive methods allows for the evaluation of the effectiveness of family planning programs and the identification of groups with poor access to services and women at risk of an unplanned or unwanted pregnancy.
In Nicaragua, almost all women (99 percent) had heard of at least one method of contraception, a result which is similar to the 98 percent found in ENDESA 2001.
Overall, 72 percent of in-union (married or consensual) women aged 15-49 years were using a contraceptive method in the 30 days prior to the interview. Corresponding percentages for ENDESA 2001 and ENDESA 1997/98 are 69 and 60 percent, respectively. Thus, in less than 10 years, contraceptive prevalence has increased by 12 percentage points, with most of the increase occurring between 1998 and 2001.
In urban areas, current contraceptive use was 75 percent compared to 69 percent in rural areas, for a difference of 6 percentage points. As can be seen in Table 7, contraceptive prevalence was highest in the departments of Río San Juan (79 percent), Chontales (77 percent), and Managua (76 percent), while it was lowest in Jinotega (63 percent) and in the RAAN (57 percent).
Female sterilization was the most widely used method in the country (24 percent), followed by the hormone injection (23 percent), and the pill (13 percent). The use of traditional methods such as Rhythm/Billings and Withdrawal was very low – about 3 percent (see Graph 7).
Female sterilization, injectables, and the pill, are very effective methods, and are used by 61 percent of in-union women, representing 85 percent of all contraceptive users. Female sterilization is the most prevalent method in the departments which constitute the Pacific region while injections are widely used in the North Central and Atlantic regions.
Table 7 shows the use of birth control methods by age for women in union. Women in-union from
3%
13%
25%
28%
Periodic abstinence 2%Withdrawal 1%
LAM 1%23%
Condom*4%
Graph 7 Percent distribution of current contraceptive method use
Hormone injection
None
Female sterilization
Pill
IUD
National Institute for Development Information (INIDE) - Ministry of Health (MINSA)
11Preliminary Report
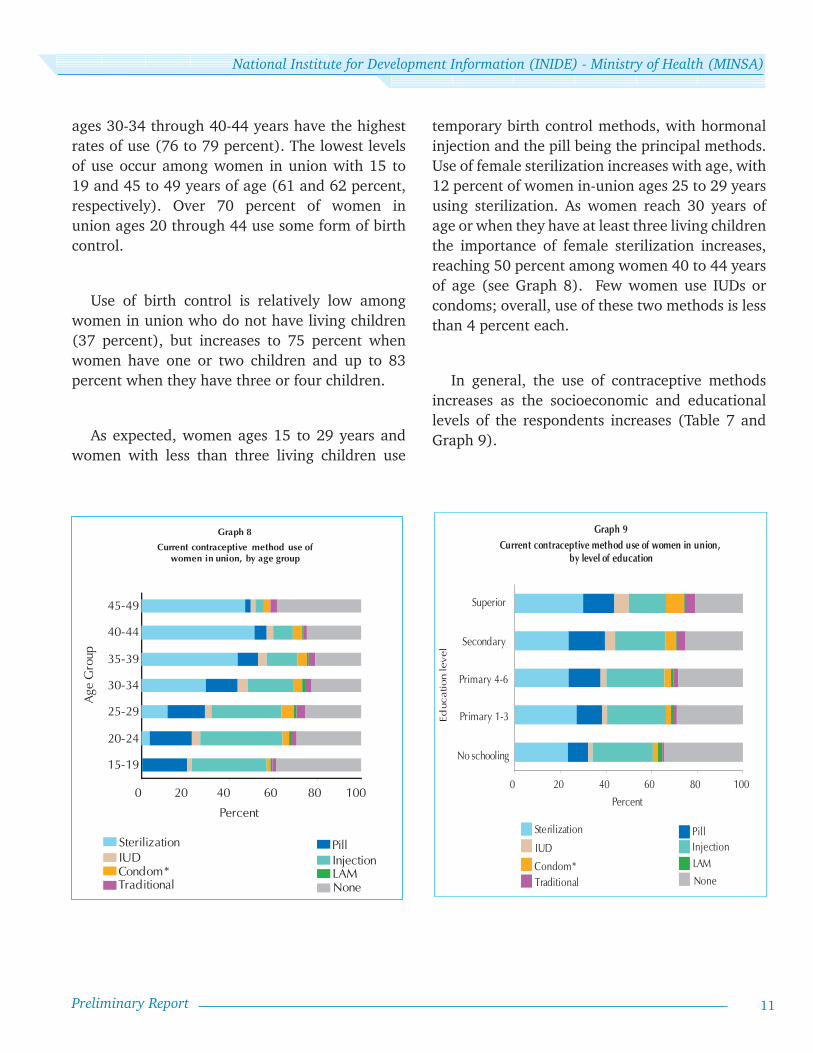
ages 30-34 through 40-44 years have the highest rates of use (76 to 79 percent). The lowest levels of use occur among women in union with 15 to 19 and 45 to 49 years of age (61 and 62 percent, respectively). Over 70 percent of women in union ages 20 through 44 use some form of birth control.
Use of birth control is relatively low among women in union who do not have living children (37 percent), but increases to 75 percent when women have one or two children and up to 83 percent when they have three or four children.
As expected, women ages 15 to 29 years and women with less than three living children use
0 20 40 60 80 100
15-19
20-24
25-29
30-34
35-39
40-44
45-49
Current contraceptive method use of women in union, by age group
Age
Gro
up
Sterilization PillIUD InjectionCondom* LAMTraditional None
Percent
Graph 8
0 20 40 60 80 100
Superior
Graph 9Current contraceptive method use of women in union,
by level of education
Educ
atio
n le
vel Secondary
Primary 4-6
Primary 1-3
No schooling
Sterilization PillIUD Injection
Condom* LAM
Traditional None
Percent
temporary birth control methods, with hormonal injection and the pill being the principal methods. Use of female sterilization increases with age, with 12 percent of women in-union ages 25 to 29 years using sterilization. As women reach 30 years of age or when they have at least three living children the importance of female sterilization increases, reaching 50 percent among women 40 to 44 years of age (see Graph 8). Few women use IUDs or condoms; overall, use of these two methods is less than 4 percent each.
In general, the use of contraceptive methods increases as the socioeconomic and educational levels of the respondents increases (Table 7 and Graph 9).

12
Nicaraguan Demographic and Health Survey 2006/07
Preliminary Report
Contraceptive use among women in union in the lowest socioeconomic quintile or with no formal education is 65 and 66 percent, respectively, and gradually increases among intermediate groups, reaching 79 percent among women with higher education or socioeconomic status.
Women in-union aged 15-49 years who used a modern method of contraception during the 30 days prior to interview were asked where they obtained their method. As shown in Table 8 and Graph 10, 67 percent obtained their method from a public sector entity, with health centers and public hospitals being the principal suppliers (35 and 30 percent, respectively). An additional 32 percent of the women obtained their method from the private sector, with pharmacies being the main
Graph 10
Pharmacy, 14%
Others 4 %
PROFAM ILIA, 5 %IXCHEN, 2 %
Principal sources of modern contraceptive methods
Public Hospital29 %
Health Center36 %
Health Post 2 %
Private Hospitalor Clinic, 4%
Social Security related
Health Providers4%
source (15 percent), followed by PROFAMILIA clinics. Less than 1 percent of the women stated that their source of contraceptives was from community groups (0.6 percent).
With regards to sources of specific methods, certain sources standout. Seven out of 10 sterilized women had their tubal ligation performed in a public sector entity, principally a public hospital, while 28 percent of the procedures were performed in a private sector entity, notably at PROFAMILIA clinics (11 percent). The public sector is also the most utilized source for obtaining hormonal injections (78 percent) and oral contraceptives (54 percent). Private drugstores are the most common supplier of male condoms (68 percent) and the second most important source for oral contraceptives (36 percent) and hormonal injection (14 percent).
National Institute for Development Information (INIDE) - Ministry of Health (MINSA)
13Preliminary Report
Maternal and Child Health
Women’s Health
A number of factors can have a considerable impact on the health of a woman, the outcome of her pregnancy and the health of her baby, and as result the use of health care services related to pregnancy, the place and type of assistance at delivery, and postpartum behavior are all very important. The use of preventive health services such as the receipt of tetanus toxoid and childhood vaccinations can also save the lives of mothers and infants. These topics along with others are examined in this section.
Prenatal care
Prenatal care is important for preventing, identifying, and treating conditions that can affect the health of an expectant mother or her baby. For the optimal health of mother and child, it is recommended that every pregnant woman start seeing a health care provider for prenatal care examinations during her first trimester of pregnancy. The number of prenatal visits a woman should make during her pregnancy depends on the evolution of the pregnancy. In Nicaragua, a minimum of four visits is recommended by the Ministry of Health. The Ministry of Health also recommends that all pregnant women receive at least one dose of tetanus toxoid, even though a woman may have been vaccinated several times in the past.
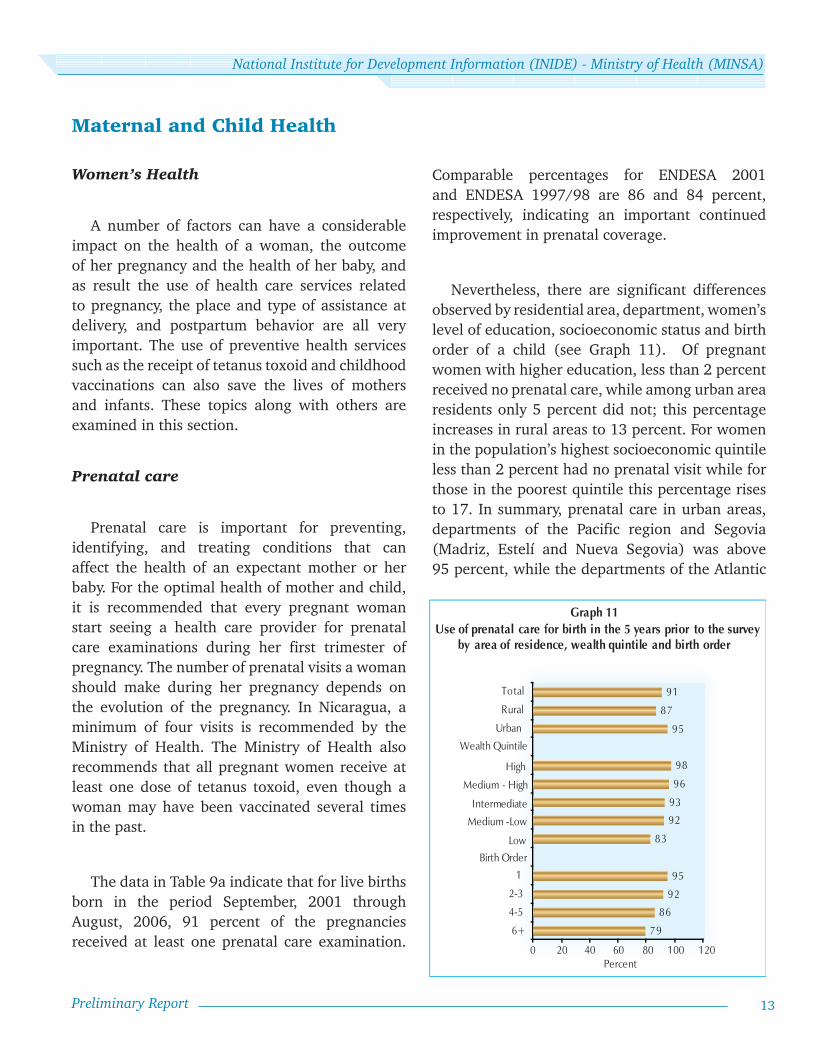
The data in Table 9a indicate that for live births born in the period September, 2001 through August, 2006, 91 percent of the pregnancies received at least one prenatal care examination.
Comparable percentages for ENDESA 2001 and ENDESA 1997/98 are 86 and 84 percent, respectively, indicating an important continued improvement in prenatal coverage.
Nevertheless, there are significant differences observed by residential area, department, women’s level of education, socioeconomic status and birth order of a child (see Graph 11). Of pregnant women with higher education, less than 2 percent received no prenatal care, while among urban area residents only 5 percent did not; this percentage increases in rural areas to 13 percent. For women in the population’s highest socioeconomic quintile less than 2 percent had no prenatal visit while for those in the poorest quintile this percentage rises to 17. In summary, prenatal care in urban areas, departments of the Pacific region and Segovia (Madriz, Estelí and Nueva Segovia) was above 95 percent, while the departments of the Atlantic
Graph 11
79
86
92
95
83
92
93
96
98
95
87
91
0 20 40 60 80 1 00 1 20
6+
4-5
2-3
1
Urban
Rural
Total
Use of prenatal care for birth in the 5 years prior to the surveyby area of residence, wealth quintile and birth order
Percent
Birth OrderLow
Medium -Low
Intermediate
Medium - High
High
Wealth Quintile

14
Nicaraguan Demographic and Health Survey 2006/07
Preliminary Report
status and educational level of the respondents. The opposite is the case when birth order is examined.
Of all pregnancies ending in live births in the period September 2001 through August 2006, 91 percent received at least one dose of tetanus toxoid. The percent who did not receive at least one dose of tetanus toxoid was greatest in the Atlantic region (81 percent) and among pregnant women with no formal education (84 percent).
The proportion of women who received prenatal care during the first trimester of pregnancy and four or more examinations, and at least one dose of tetanus toxoid is 63 percent. This proportion varies from 72 percent in urban areas to 55 percent in rural areas, and from 80 percent in the department of Estelí to 37 percent in the RAAN. Satisfying all three of these norms is directly related to the socioeconomic status and educational level of the respondents.
region and Jinotega share levels similar or lower than that of rural areas, at 87 percent.
As expected, the percentage of pregnancies receiving a prenatal examination increases as socioeconomic status and educational attainment increases. In contrast, the probability of receiving an examination decreases as birth order increases.
Some achievements, and disparities, are not captured by a single simple indicator of prenatal coverage until other aspects of care are considered: timing of first prenatal visit, number of visits, and qualifications of practitioners providing care.
ENDESA 2006/07 indicates that 90 percent of the prenatal visits were attended by a health professional (general medical doctor, gynecologist / obstetrician or nurse).
The likelihood of being attended by a health professional is greater in urban areas than in rural areas, and increases with socioeconomic status and educational attainment (Graph 12). As with prenatal coverage, the disparities widen when considering prenatal visits with a qualified health professional.
Seventy percent of pregnant women begin receiving prenatal care during the first trimester of pregnancy and nearly 78 percent receive four or more prenatal examinations. Urban women are more likely than their rural counterparts to begin prenatal care during the first trimester of pregnancy, and to receive four or more prenatal examinations. Similarly, receipt of early prenatal care and at least four or more examinations is directly associated with the socioeconomic
Graph 12
78
85
91
95
82
92
92
96
97
95
86
90
0 20 40 60 80 100 120
6+
4-5
2-3
1
Urban
Rural
Total
Percent
Birth Order
Low
Medium - Low
Intermediate
Medium - High
High
Wealth Quintile
Use of prenatal care from a qualified medical personel for births in 5 years prior to survey by area of residence, wealth quintile and birth order
National Institute for Development Information (INIDE) - Ministry of Health (MINSA)
15Preliminary Report
Delivery assistance
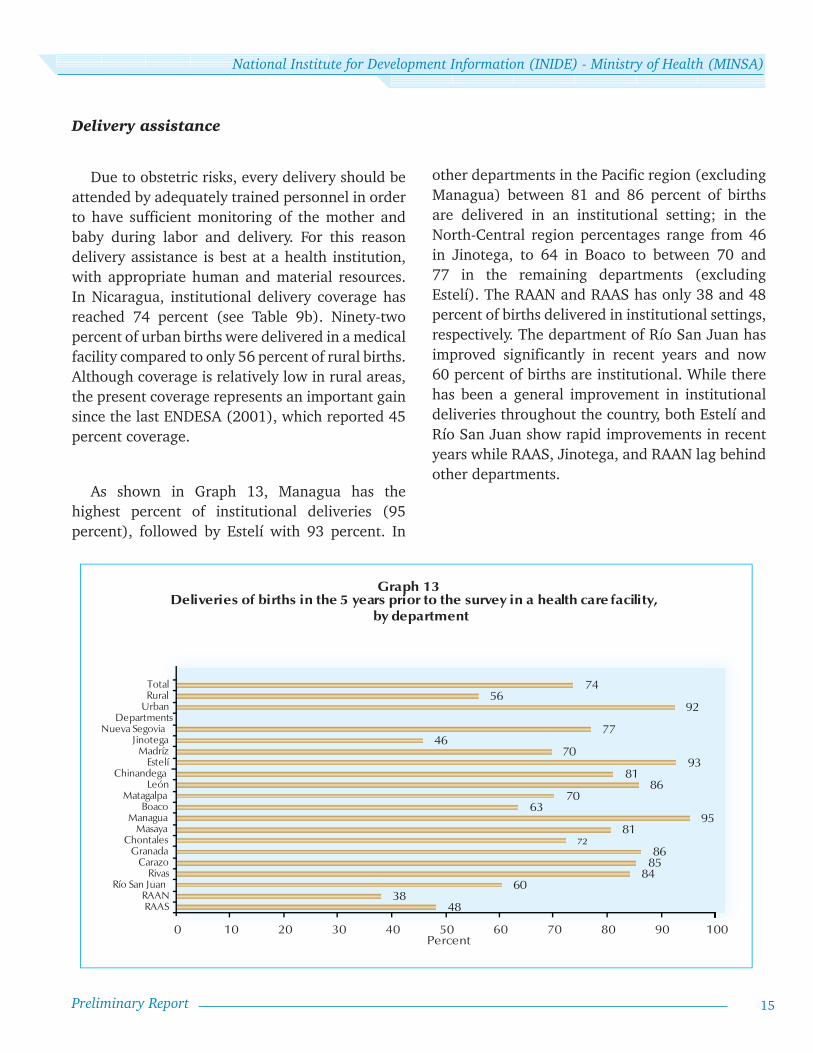
Due to obstetric risks, every delivery should be attended by adequately trained personnel in order to have sufficient monitoring of the mother and baby during labor and delivery. For this reason delivery assistance is best at a health institution, with appropriate human and material resources. In Nicaragua, institutional delivery coverage has reached 74 percent (see Table 9b). Ninety-two percent of urban births were delivered in a medical facility compared to only 56 percent of rural births. Although coverage is relatively low in rural areas, the present coverage represents an important gain since the last ENDESA (2001), which reported 45 percent coverage.
As shown in Graph 13, Managua has the highest percent of institutional deliveries (95 percent), followed by Estelí with 93 percent. In
4838
60848586
7281
9563
7086
8193
7046
77
9256
74
0 10 20 30 40 50 60 70 80 90 100
RAASRAAN
Río San JuanRivas
CarazoGranada
ChontalesMasaya
ManaguaBoaco
MatagalpaLeón
ChinandegaEstelí
MadrízJinotega
Nueva SegoviaDepartments
UrbanRuralTotal
Percent
Graph 13 Deliveries of births in the 5 years prior to the survey in a health care facility,
by department
other departments in the Pacific region (excluding Managua) between 81 and 86 percent of births are delivered in an institutional setting; in the North-Central region percentages range from 46 in Jinotega, to 64 in Boaco to between 70 and 77 in the remaining departments (excluding Estelí). The RAAN and RAAS has only 38 and 48 percent of births delivered in institutional settings, respectively. The department of Río San Juan has improved significantly in recent years and now 60 percent of births are institutional. While there has been a general improvement in institutional deliveries throughout the country, both Estelí and Río San Juan show rapid improvements in recent years while RAAS, Jinotega, and RAAN lag behind other departments.

16
Nicaraguan Demographic and Health Survey 2006/07
Preliminary Report
Considering other factors, it is worth noting that institutional deliveries are highest among women having their first child (85 percent) and among women with high school and higher education (above 90 percent). As noted above, advances in all categories and territories have been observed; however, women in high risk categories (low education, living in the poorest socioeconomic quintile households, ages above 35, and having 6 or more children) have persistently low proportions of institutional births.
As can be seen in Table 9b, younger mothers were more likely to deliver in a medical facility than older mothers (75 vs. 64 percent). One can also appreciate that birth order influences the place of delivery. Medical facility deliveries drop from 85 percent among first births to 44 percent among sixth or higher order births. It is precisely these groups that could benefit the most from obstetric care during delivery.
In its plan to reduce maternal mortality, the Pan American Health Organization (PAHO) has indicated that the percentage of all births in a country by cesarean section should range from 5 to 15 percent. If the percentage falls below 5 percent, this indicates lack of accessibility to the procedure, while if it is above 15 percent, this indicates abuse in the use of this procedure.
As shown in Table 9b, almost 20 percent of all deliveries were cesarean, the percentage increases to 28 percent in urban areas but decreases to 12 percent in rural areas. The highest cesarean rates (greater than 30 percent) are found in the departments of León, Managua, Granada, and Carazo, while the lowest rates (less than 10 percent) are found in Matagalpa, the RAAS, and the RAAN.
The cesarean rate is especially high among women with a university level education (51 percent) and among high socioeconomic status women (44 percent), indicating that many of their cesarean sections were performed for reasons related to convenience rather than for medical necessity.
Child Health
Since the early 1990s, there have been improvements in child survival in Nicaragua. Despite these improvements, much work remains to be done in reducing levels of infant and under-five mortality and morbidity.
This section of the report covers a number of topics related to the health of the child, such as breastfeeding and weaning practices, the nutritional status of children less than 5 years of age, child immunizations, and the prevalence of acute respiratory infections and diarrhea during the two weeks prior to interview.
National Institute for Development Information (INIDE) - Ministry of Health (MINSA)
17Preliminary Report
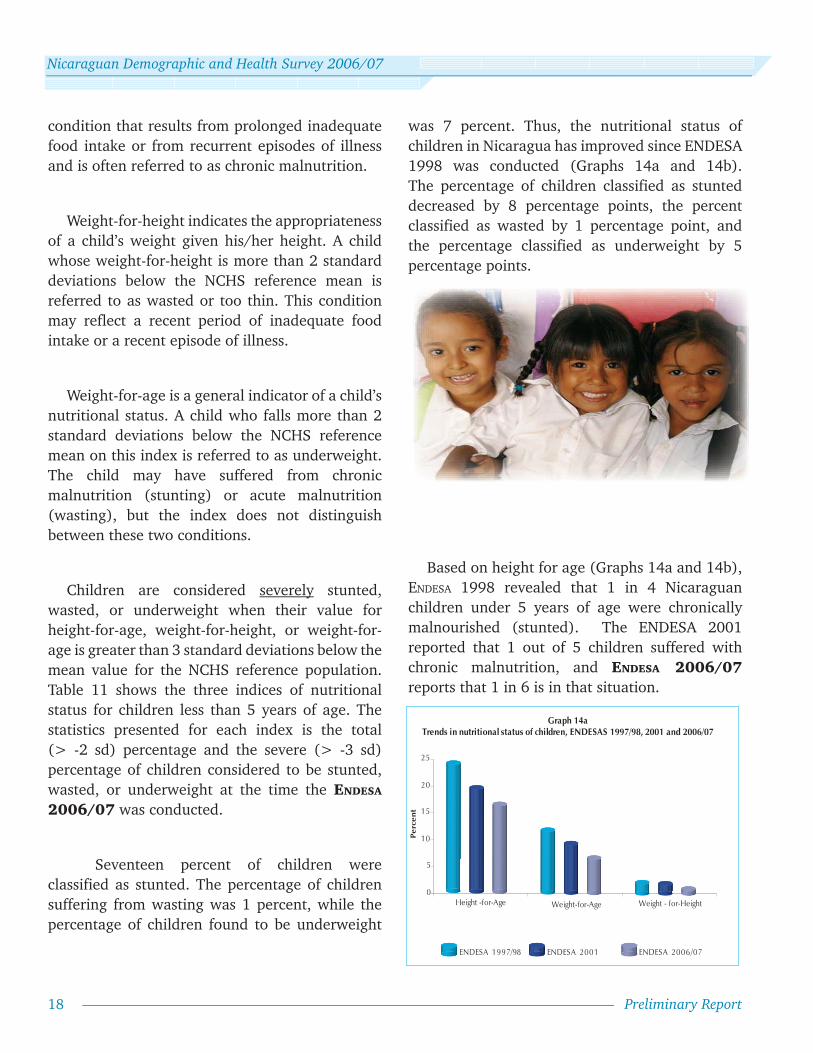
Nutrition
Scientific evidence indicates that breastfeeding provides the greatest nutritional contribution for physical growth, mental and affective development of the child. Early initiation of breastfeeding permits the newborn to benefit immediately from colostrum, which is highly nutritious and contains the antibodies necessary to protect babies from infection before their immune systems are fully mature. In general, breastfeeding benefits are recognized as valuable for the psychic and physical health of the newborn, the mother and the family.
The Ministry of Health of Nicaragua recommends that all infants be fed (on demand) exclusively on breast milk from birth to 6 months of age, and that supplementary breastfeeding continues until the child is two years of age.
Table 10 shows the percent distribution of children less than three years of age, by foods other than breast milk that they received in the previous 24 hours, classified by current age. According to ENDESA 2006/07, there is a tendency of discontinuing any breastfeeding (exclusive or supplementary) at an early stage: when the child’s age reaches 4 or 5 months, 10 percent are no longer being breastfed at all. Only 46 percent of those less than 2 months old received breast milk exclusively. For the group 2-3 months of age, this percentage declines to 28 percent and then to 13 percent in the 4-5 month age group. Thus, the percentage of children who are being exclusively breastfed decreases rapidly as the age of the children increases. The most common supplements given among infants ages 0-1 month are other milks (38 percent) and water (12 percent). But already in the 4-5 month age group, solids and
semi-solids are common (46 percent). There has been little progress since 2001 in fostering the Health Ministry’s (MINSA’s) recommendations despite the programs promoted by the Ministry of Health.
Nutrition status of children is the product of a series of social, environment, biological, and cultural factors. It is reflected in their growth in height and weight and is influenced by feeding practices and illness recurrence. In order to objectively assess the nutritional status of children, the height and weight of children under 5 years of age were measured in ENDESA 2006/07. These measurements, in conjunction with a child’s age, allow for the calculation of three standard measures of physical growth: height-for-age, weight-for-height, and weight-for-age. Each indicator provides insight into different aspects of nutritional status.
The nutritional status of children as measured by these indices can be evaluated by comparing their distributions on a specific index to that of a well-nourished, healthy population of children. The reference population used is that developed by the U.S. National Center for Health Statistics (NCHS) and accepted by the World Health Organization (WHO) and used in previous ENDESA surveys. The ENDESA 2006/07 Final Report presents results based on the NCHS as well as the new reference developed by the World Health Organization.
Height-for-age is a measure of physical growth over the child’s life. A child whose height is greater than 2 standard deviations below the mean of the NCHS reference population is considered stunted or very short for his or her age. Stunting is a
18
Nicaraguan Demographic and Health Survey 2006/07
Preliminary Report
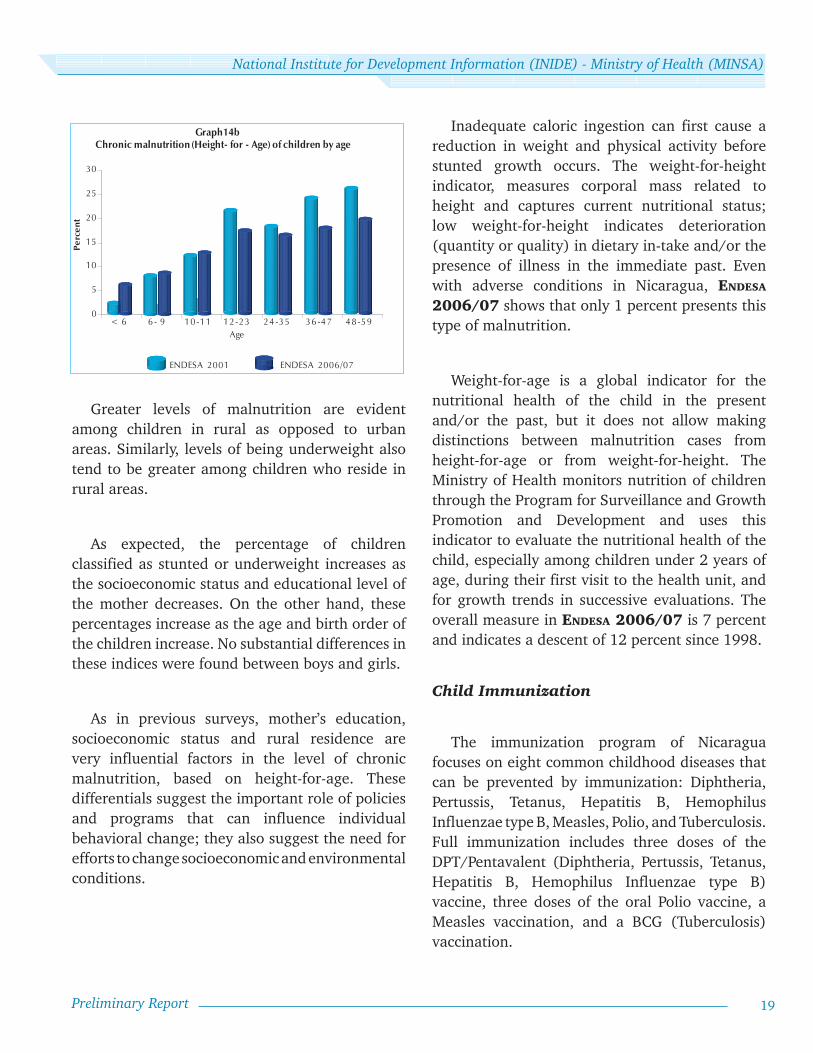
was 7 percent. Thus, the nutritional status of children in Nicaragua has improved since ENDESA 1998 was conducted (Graphs 14a and 14b). The percentage of children classified as stunted decreased by 8 percentage points, the percent classified as wasted by 1 percentage point, and the percentage classified as underweight by 5 percentage points.
Based on height for age (Graphs 14a and 14b), ENDESA 1998 revealed that 1 in 4 Nicaraguan children under 5 years of age were chronically malnourished (stunted). The ENDESA 2001 reported that 1 out of 5 children suffered with chronic malnutrition, and ENDESA 2006/07reports that 1 in 6 is in that situation.
condition that results from prolonged inadequate food intake or from recurrent episodes of illness and is often referred to as chronic malnutrition.
Weight-for-height indicates the appropriateness of a child’s weight given his/her height. A child whose weight-for-height is more than 2 standard deviations below the NCHS reference mean is referred to as wasted or too thin. This condition may reflect a recent period of inadequate food intake or a recent episode of illness.
Weight-for-age is a general indicator of a child’s nutritional status. A child who falls more than 2 standard deviations below the NCHS reference mean on this index is referred to as underweight. The child may have suffered from chronic malnutrition (stunting) or acute malnutrition (wasting), but the index does not distinguish between these two conditions.
Children are considered severely stunted, wasted, or underweight when their value for height-for-age, weight-for-height, or weight-for-age is greater than 3 standard deviations below the mean value for the NCHS reference population. Table 11 shows the three indices of nutritional status for children less than 5 years of age. The statistics presented for each index is the total (> -2 sd) percentage and the severe (> -3 sd) percentage of children considered to be stunted, wasted, or underweight at the time the ENDESA 2006/07 was conducted.
Seventeen percent of children were classified as stunted. The percentage of children suffering from wasting was 1 percent, while the percentage of children found to be underweight
0
5
10
15
20
25
ENDESA 1997/98 ENDESA 2001 ENDESA 2006/07
Graph 14a Trends in nutritional status of children, ENDESAS 1997/98, 2001 and 2006/07
Pe
rce
nt
Height -for-Age Weight-for-Age Weight - for-Height
National Institute for Development Information (INIDE) - Ministry of Health (MINSA)
19Preliminary Report
Greater levels of malnutrition are evident among children in rural as opposed to urban areas. Similarly, levels of being underweight also tend to be greater among children who reside in rural areas.
As expected, the percentage of children classified as stunted or underweight increases as the socioeconomic status and educational level of the mother decreases. On the other hand, these percentages increase as the age and birth order of the children increase. No substantial differences in these indices were found between boys and girls.
As in previous surveys, mother’s education, socioeconomic status and rural residence are very influential factors in the level of chronic malnutrition, based on height-for-age. These differentials suggest the important role of policies and programs that can influence individual behavioral change; they also suggest the need for efforts to change socioeconomic and environmental conditions.
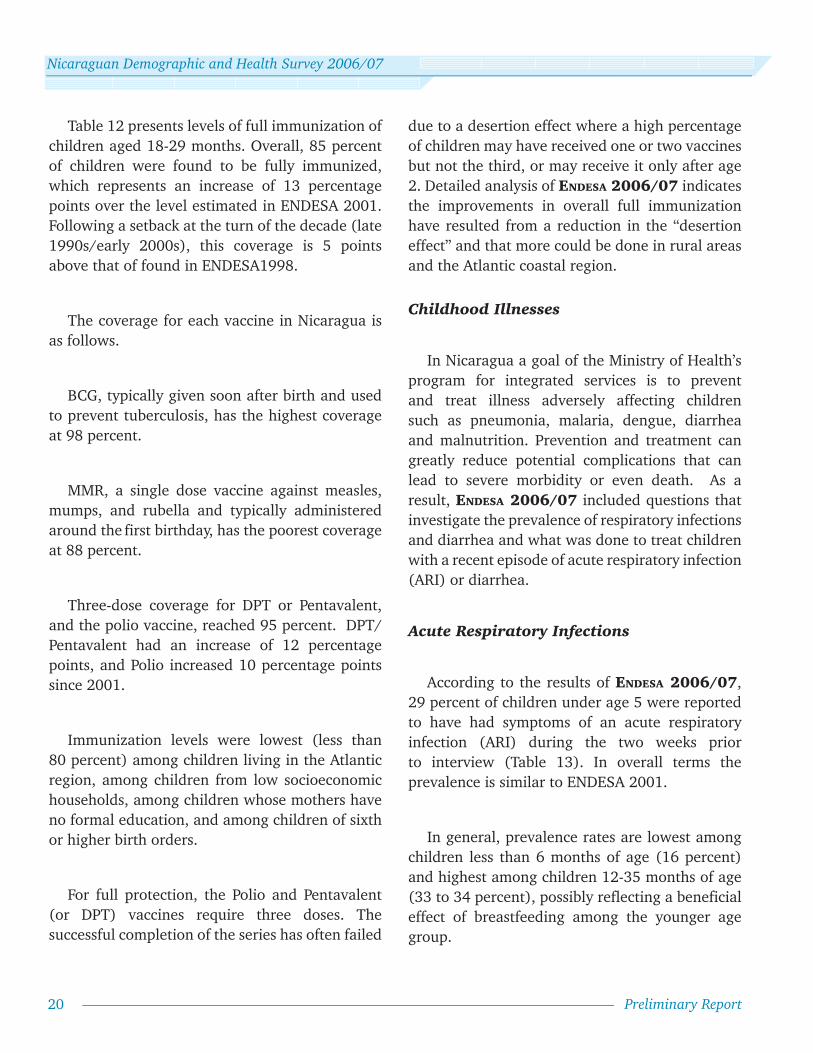
Inadequate caloric ingestion can first cause a reduction in weight and physical activity before stunted growth occurs. The weight-for-height indicator, measures corporal mass related to height and captures current nutritional status; low weight-for-height indicates deterioration (quantity or quality) in dietary in-take and/or the presence of illness in the immediate past. Even with adverse conditions in Nicaragua, ENDESA 2006/07 shows that only 1 percent presents this type of malnutrition.
Weight-for-age is a global indicator for the nutritional health of the child in the present and/or the past, but it does not allow making distinctions between malnutrition cases from height-for-age or from weight-for-height. The Ministry of Health monitors nutrition of children through the Program for Surveillance and Growth Promotion and Development and uses this indicator to evaluate the nutritional health of the child, especially among children under 2 years of age, during their first visit to the health unit, and for growth trends in successive evaluations. The overall measure in ENDESA 2006/07 is 7 percent and indicates a descent of 12 percent since 1998.
Child Immunization
The immunization program of Nicaragua focuses on eight common childhood diseases that can be prevented by immunization: Diphtheria, Pertussis, Tetanus, Hepatitis B, Hemophilus Influenzae type B, Measles, Polio, and Tuberculosis. Full immunization includes three doses of the DPT/Pentavalent (Diphtheria, Pertussis, Tetanus, Hepatitis B, Hemophilus Influenzae type B) vaccine, three doses of the oral Polio vaccine, a Measles vaccination, and a BCG (Tuberculosis) vaccination.
0
5
10
15
20
25
30
< 6 6 - 9 10 -11 12 -23 24 -35 36 -47 48 -59
ENDESA 2001 ENDESA 2006/07
Age
Graph14b Chronic malnutrition (Height- for - Age) of children by age
Perc
ent
20
Nicaraguan Demographic and Health Survey 2006/07
Preliminary Report
Table 12 presents levels of full immunization of children aged 18-29 months. Overall, 85 percent of children were found to be fully immunized, which represents an increase of 13 percentage points over the level estimated in ENDESA 2001. Following a setback at the turn of the decade (late 1990s/early 2000s), this coverage is 5 points above that of found in ENDESA1998.
The coverage for each vaccine in Nicaragua is as follows.
BCG, typically given soon after birth and used to prevent tuberculosis, has the highest coverage at 98 percent.
MMR, a single dose vaccine against measles, mumps, and rubella and typically administered around the first birthday, has the poorest coverage at 88 percent.
Three-dose coverage for DPT or Pentavalent, and the polio vaccine, reached 95 percent. DPT/Pentavalent had an increase of 12 percentage points, and Polio increased 10 percentage points since 2001.
Immunization levels were lowest (less than 80 percent) among children living in the Atlantic region, among children from low socioeconomic households, among children whose mothers have no formal education, and among children of sixth or higher birth orders.
For full protection, the Polio and Pentavalent (or DPT) vaccines require three doses. The successful completion of the series has often failed
due to a desertion effect where a high percentage of children may have received one or two vaccines but not the third, or may receive it only after age 2. Detailed analysis of ENDESA 2006/07 indicates the improvements in overall full immunization have resulted from a reduction in the “desertion effect” and that more could be done in rural areas and the Atlantic coastal region.
Childhood Illnesses
In Nicaragua a goal of the Ministry of Health’s program for integrated services is to prevent and treat illness adversely affecting children such as pneumonia, malaria, dengue, diarrhea and malnutrition. Prevention and treatment can greatly reduce potential complications that can lead to severe morbidity or even death. As a result, ENDESA 2006/07 included questions that investigate the prevalence of respiratory infections and diarrhea and what was done to treat children with a recent episode of acute respiratory infection (ARI) or diarrhea.
Acute Respiratory Infections
According to the results of ENDESA 2006/07, 29 percent of children under age 5 were reported to have had symptoms of an acute respiratory infection (ARI) during the two weeks prior to interview (Table 13). In overall terms the prevalence is similar to ENDESA 2001.
In general, prevalence rates are lowest among children less than 6 months of age (16 percent) and highest among children 12-35 months of age (33 to 34 percent), possibly reflecting a beneficial effect of breastfeeding among the younger age group.
National Institute for Development Information (INIDE) - Ministry of Health (MINSA)
21Preliminary Report
Differences by residence area are not statistically significant, but rates are particularly high in the departments of Jinotega and Chinandega (40 percent).
It can be observed in Table 13 that prevalence of ARI decreases as the socioeconomic status and education levels increase, from 31 percent among children from low socioeconomic households to 18 percent among those from high socioeconomic households, and from 31 percent among children whose mothers have no formal education to 19 percent among children whose mothers have a university level education.
Eighty-three percent of the mothers with a child who had a recent episode of ARI consulted with someone about the disease. This is much higher than that found in ENDESA 2001, where 57 percent sought help. Urban mothers were more likely than rural mothers to consult with someone.
In general, the probability of consulting with someone decreases as the age of the child increases and as the socioeconomic status and educational level of the mother decreases. In ENDESA 2006/07, more than 95 percent of children with ARI whose mothers have a higher level of education sought assistance, while for children of women without education; assistance was sought in 72 percent of cases.
Thus, children of mothers with higher levels of education and better socioeconomic conditions not only benefit from a lower incidence of infection and illness, they also have the advantage of seeking and receiving more prompt attention and medical treatment.
Acute Diarrheal Illness
Diarrheal illnesses among Nicaragua’s children under 5 years of age are caused mainly by viruses and parasites and, to a lesser extent, by bacteria. Primary transmission is via contamination of food and water by fecal matter. When feces are not disposed of adequately, contagion can occur by direct contact or by animals.
Almost 16 percent of children under age 5 were reported to have had diarrhea during the two weeks prior to interview (Table 13). As is previous ENDESAS, the rural prevalence rate is higher than the urban rate (18 vs. 13 percent). While the department of Carazo has the lowest rate (7 percent) the highest rate is found in the RAAN (24 percent).
In general, prevalence rates are lowest among children less than 6 months of age (8 percent) and children 48-59 months of age (8 percent), and highest among children 6-23 months of age (25 to 26 percent). The latter finding is expected as children are weaned and become exposed to other foods and are more active in contaminated environments. Unlike ARI, the prevalence of diarrhea is significantly reduced among those children older than 3 years of age.
As was the case with ARI, the prevalence of diarrhea decreases as the socioeconomic status and educational level of the mother increases. It is noteworthy that only 8 percent of high socioeconomic mothers and 6 percent of mothers with university level education report that their children had diarrhea during the two weeks prior to interview.

22
Nicaraguan Demographic and Health Survey 2006/07
Preliminary Report
Another important aspect of diarrheal illness is mother’s recognition of danger signs and the timely decision to take a child to the doctor. ENDESA 2006/07 shows an increase of more than 10 percentage points of the proportion of children taken to a doctor or other appropriate health personnel, since 2001 (58 vs. 44 percent).
A major problem with diarrhea is dehydration, especially if the child has had recurrent episodes. Severe dehydration can lead to permanent health impairment, and even death. Complications due to dehydration can be prevented, with increases in liquid intake or, better still, with oral rehydration salts (ORS)
In Nicaragua, more than in many other Latin American countries, health education campaigns have been an extremely important strategy against disease. Health campaigns have extensively promoted the use of ORS (that are freely distributed) or, in their place, home-made solutions for children with diarrhea. Campaigns have also stressed the need to maintain levels of intake of liquids and foods. In spite of the wide-spread knowledge of ORS among Nicaraguan mothers, when asked, only 59 percent of sick children had been given ORS. Use of ORS is greater in urban compared to rural areas (64 vs. 55 percent) and ranged from a high of 81 percent in the department of Nueva Segovia to a low of 39 percent in the RAAN.
National Institute for Development Information (INIDE) - Ministry of Health (MINSA)
23Preliminary Report
Infant and Child Mortality
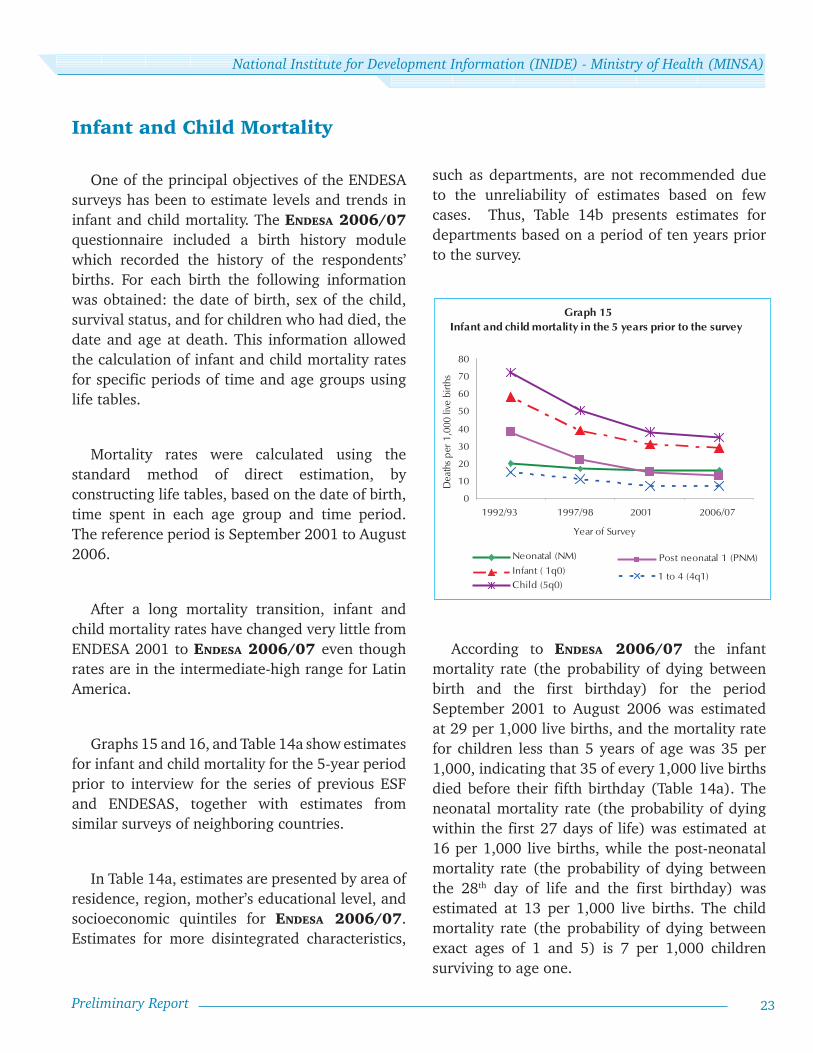
One of the principal objectives of the ENDESA surveys has been to estimate levels and trends in infant and child mortality. The ENDESA 2006/07 questionnaire included a birth history module which recorded the history of the respondents’ births. For each birth the following information was obtained: the date of birth, sex of the child, survival status, and for children who had died, the date and age at death. This information allowed the calculation of infant and child mortality rates for specific periods of time and age groups using life tables.
Mortality rates were calculated using the standard method of direct estimation, by constructing life tables, based on the date of birth, time spent in each age group and time period. The reference period is September 2001 to August 2006.
After a long mortality transition, infant and child mortality rates have changed very little from ENDESA 2001 to ENDESA 2006/07 even though rates are in the intermediate-high range for Latin America.
Graphs 15 and 16, and Table 14a show estimates for infant and child mortality for the 5-year period prior to interview for the series of previous ESF and ENDESAS, together with estimates from similar surveys of neighboring countries.
In Table 14a, estimates are presented by area of residence, region, mother’s educational level, and socioeconomic quintiles for ENDESA 2006/07. Estimates for more disintegrated characteristics,
such as departments, are not recommended due to the unreliability of estimates based on few cases. Thus, Table 14b presents estimates for departments based on a period of ten years prior to the survey.
According to ENDESA 2006/07 the infant mortality rate (the probability of dying between birth and the first birthday) for the period September 2001 to August 2006 was estimated at 29 per 1,000 live births, and the mortality rate for children less than 5 years of age was 35 per 1,000, indicating that 35 of every 1,000 live births died before their fifth birthday (Table 14a). The neonatal mortality rate (the probability of dying within the first 27 days of life) was estimated at 16 per 1,000 live births, while the post-neonatal mortality rate (the probability of dying between the 28th day of life and the first birthday) was estimated at 13 per 1,000 live births. The child mortality rate (the probability of dying between exact ages of 1 and 5) is 7 per 1,000 children surviving to age one.
0
10
20
30
40
50
60
70
80
2006/07 20011997/981992/93
1 to 4 (4q1)Infant ( 1q0)Neonatal (NM)
Child (5q0)
Post neonatal 1 (PNM)
Dea
ths p
er 1
,000
live
birt
hs
Year of Survey
Graph 15 Infant and child mortality in the 5 years prior to the survey
24
Nicaraguan Demographic and Health Survey 2006/07
Preliminary Report
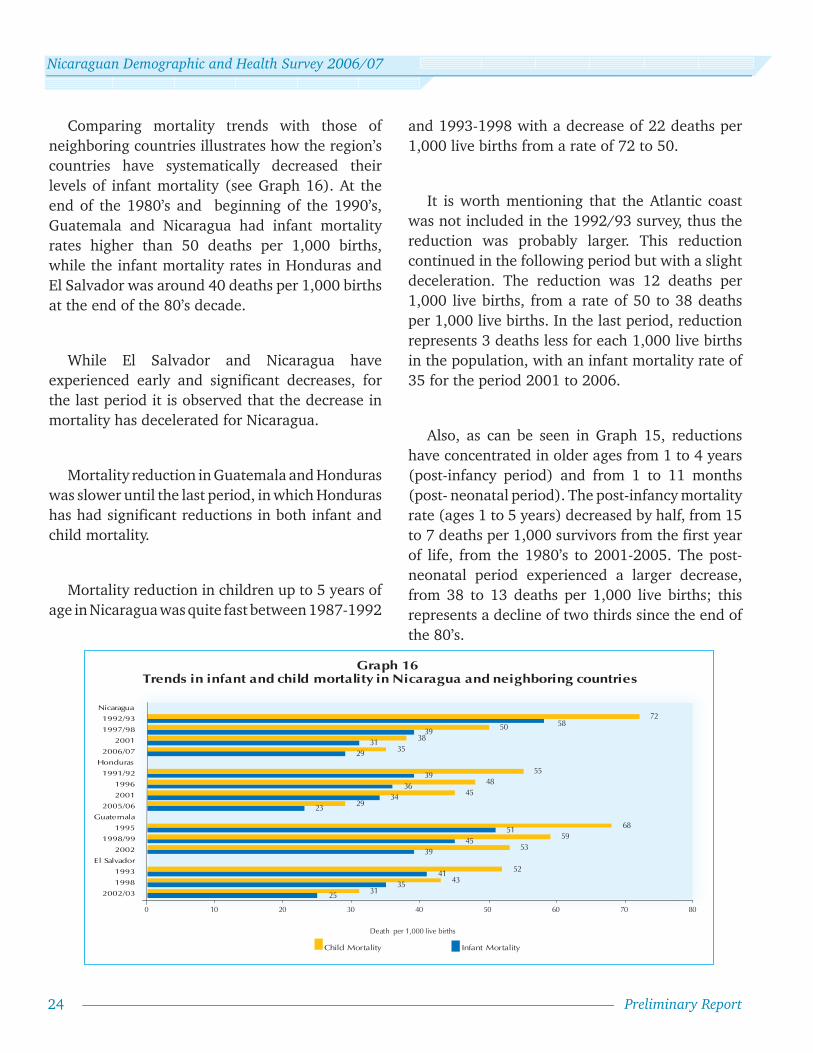
Comparing mortality trends with those of neighboring countries illustrates how the region’s countries have systematically decreased their levels of infant mortality (see Graph 16). At the end of the 1980’s and beginning of the 1990’s, Guatemala and Nicaragua had infant mortality rates higher than 50 deaths per 1,000 births, while the infant mortality rates in Honduras and El Salvador was around 40 deaths per 1,000 births at the end of the 80’s decade.
While El Salvador and Nicaragua have experienced early and significant decreases, for the last period it is observed that the decrease in mortality has decelerated for Nicaragua.
Mortality reduction in Guatemala and Honduras was slower until the last period, in which Honduras has had significant reductions in both infant and child mortality.
Mortality reduction in children up to 5 years of age in Nicaragua was quite fast between 1987-1992
2535
41
3945
51
2334
3639
2931
3958
3143
52
5359
68
2945
4855
3538
5072
0 10 20 30 40 50 60 70 80
2002/03
1998
1993
El Salvador
2002
1998/99
1995
Guatemala
2005/06
2001
1996
1991/92
Honduras
2006/07
2001
1997/98
1992/93
Nicaragua
Child Mortality Infant Mortality
Death per 1,000 live births
Graph 16 Trends in infant and child mortality in Nicaragua and neighboring countries
and 1993-1998 with a decrease of 22 deaths per 1,000 live births from a rate of 72 to 50.
It is worth mentioning that the Atlantic coast was not included in the 1992/93 survey, thus the reduction was probably larger. This reduction continued in the following period but with a slight deceleration. The reduction was 12 deaths per 1,000 live births, from a rate of 50 to 38 deaths per 1,000 live births. In the last period, reduction represents 3 deaths less for each 1,000 live births in the population, with an infant mortality rate of 35 for the period 2001 to 2006.
Also, as can be seen in Graph 15, reductions have concentrated in older ages from 1 to 4 years (post-infancy period) and from 1 to 11 months (post- neonatal period). The post-infancy mortality rate (ages 1 to 5 years) decreased by half, from 15 to 7 deaths per 1,000 survivors from the first year of life, from the 1980’s to 2001-2005. The post-neonatal period experienced a larger decrease, from 38 to 13 deaths per 1,000 live births; this represents a decline of two thirds since the end of the 80’s.

National Institute for Development Information (INIDE) - Ministry of Health (MINSA)
25Preliminary Report
Mortality rates in the neonatal period experienced small reductions until the middle of the 1990’s and have been constant for the last two surveys with a rate of 16 deaths per 1,000 live births.
The Infant mortality rate is estimated at 29 deaths per 1,000 live births for the 5-year period previous to the survey, which is an indication of the large potential for mortality reduction in both the post-neonatal and neonatal periods.
Estimates of differential mortality, among sub-groups of the population, provide an opportunity to understand factors that are associated with death or survival of children. Differentials can help identify determinants or causes that distinguish survival opportunities among children and identify populations or groups that deserve special attention from health authorities or from broader programs or policies.
The estimated infant mortality rate for rural areas in 2006/07 is 34 deaths per 1,000 live births and reflects a reduction in the gap between urban and rural areas when compared to previous periods. Nevertheless it is still 42 percent higher than in urban areas. Infant mortality for urban areas is estimated at 24 deaths per 1,000 live births. Higher mortality rates predominate in the Atlantic region, with an infant mortality rate of 43 per 1,000 live births, while the mortality rates for the Pacific and North Central regions are lower for all ages (see Graph 17 and Table 14a).
Department variations can be seen in Table 14b for the 10-year period prior to the survey.
Departments of the Pacific region share child mortality rates lower than 40 with the exception of Managua and Carazo that are 40 and 45, respectively.
The lowest rates are found in Rivas, followed by León, Granada and Estelí. With the exception of Estelí, all North Central departments have child mortality rates above 30 and below 50. The highest child mortality rates are found in RAAN, RAAS, Jinotega, Chontales, and Matagalpa.
Infant and child mortality in the last five years are clearly associated with the socioeconomic level of the household and the education level of the mother and the gap between extremes has not changed much according to previous ENDESA surveys. Infant mortality of children whose mother has no education stayed at 54 deaths per 1,000 live births in the population, the same as in ENDESA 2001, and is almost three times higher than child mortality of women with higher education (Table 14a)
26
27
43
24
34
29
0 10 20 30 40 50
Pacific
North-Central
Atlantic
Region
Urban
Rural
Total
Infant mortality in the 5 years prior to the survey by area of residence and region
Graph 17
Deaths per 1,000 live births

26
Nicaraguan Demographic and Health Survey 2006/07
Preliminary Report
0 10 20 30 40 50 60 70 80 90 100
SuperiorSecondaryPrimary 4-6Primary 1-3
No schoolingEducation Level
Pacific
Knowledge of HIV/AIDS of women ages 15-49 years (Spontaneous response)
Graph 18
Percent
TotalAreaRural
UrbanRegion
AtlanticNorth - Central
HIV/AIDS
The first case of acquired immune deficiency syndrome (AIDS) in Nicaragua was registered in 1987. Since then, the number of persons infected with HIV has increased at a constant pace, particularly since 2003. Nicaragua’s Commission for the Fight against AIDS (CONISIDA) estimates an accumulated total of 7,300 persons living with HIV in Nicaragua. In 1998, the percentage of males with HIV/AIDS was much higher than that of females, with a ratio of seven infected men for each woman. In 2004, this ratio had been reduced to three to one. The main transmission route of HIV in Nicaragua is by sexual contact, principally heterosexual.
The results of ENDESA 2006/07 indicate that 98 percent of women aged 15-49 years are aware
of the existence of AIDS, although only 76 percent of them mentioned it spontaneously (Table 15 and Graph 18). The percentage of women who spontaneously mentioned AIDS is greater in urban than in rural areas (82 vs. 67 percent), and ranges from a high of 82 percent in the Pacific region to a low of 63 percent in the Atlantic region.
Spontaneous knowledge varies by socioeconomic and educational levels, from 58 percent among women of low socioeconomic status to 85 percent among high socioeconomic status women, and from 51 percent among women without formal education to 87 percent among women with university level education. It is encouraging that a relatively high percentage of never-married women spontaneously mentioned AIDS.
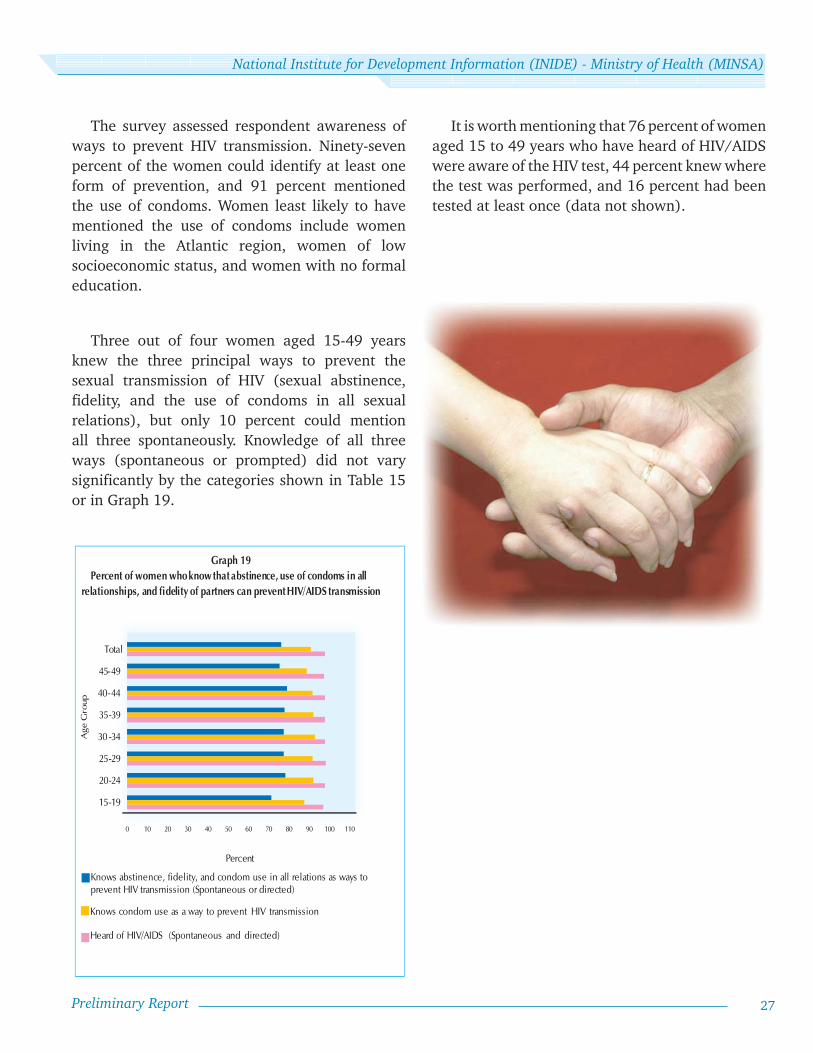
National Institute for Development Information (INIDE) - Ministry of Health (MINSA)
27Preliminary Report
The survey assessed respondent awareness of ways to prevent HIV transmission. Ninety-seven percent of the women could identify at least one form of prevention, and 91 percent mentioned the use of condoms. Women least likely to have mentioned the use of condoms include women living in the Atlantic region, women of low socioeconomic status, and women with no formal education.
Three out of four women aged 15-49 years knew the three principal ways to prevent the sexual transmission of HIV (sexual abstinence, fidelity, and the use of condoms in all sexual relations), but only 10 percent could mention all three spontaneously. Knowledge of all three ways (spontaneous or prompted) did not vary significantly by the categories shown in Table 15 or in Graph 19.
0 10 20 30 40 50 60 70 80 90 100 110
15-19
20-24
25-29
30 -34
35-39
40-44
45-49
Total
Percent
Age
Gro
up
Graph 19 Percent of women who know that abstinence, use of condoms in all
relationships, and fidelity of partners can prevent HIV/AIDS transmission
Knows condom use as a way to prevent HIV transmission
Heard of HIV/AIDS (Spontaneous and directed)
Knows abstinence, fidelity, and condom use in all relations as ways to prevent HIV transmission (Spontaneous or directed)
It is worth mentioning that 76 percent of women aged 15 to 49 years who have heard of HIV/AIDS were aware of the HIV test, 44 percent knew where the test was performed, and 16 percent had been tested at least once (data not shown).

28
Nicaraguan Demographic and Health Survey 2006/07
Preliminary Report
45
47
48
49
50
62
44
48
21
26
27
30
30
38
24
27
11
14
13
15
13
20
11
13
10 20 30 40 50 60 70
Superior
Secondary
Primary 4-6
Primary 1-3
No schooling
Education level
Separated, divorced, widowed
Married/In-union
Marital status
Total
PercentSexual violence Physical violence Verbal violence
20 30 40 50 60
Graph 20 Percent of women who have ever experienced verbal, physical and/or sexual abuse,
by marital status and level of education
Violence Against Women
Violence against women occurs in all cultures and affects women of all ages and all socioeconomic and educational backgrounds. It includes physical violence, such as slapping, kicking or beating, forced sexual intercourse, and psychological abuse, such as intimidation, behavior control, and isolation from family and friends (WHO, “World Report on Violence and Health, 2002”).
ENDESA 2006/07 included a series of questions to assess the burden of domestic violence in Nicaragua. The design of the module followed the recommendations of an expert panel convened by the World Health Organization, which reported its recommendations in a preliminary report in 2005 (WHO “ Researching Violence Against Women: a practical guide for researchers and activists”, 2005).
Recommendations developed by the U.S. Centers for Disease Control and Prevention, which set forth standardized definitions for various forms of domestic violence (verbal/psychological, physical and sexual violence) were also followed.
The two basic measures of the prevalence of domestic violence are lifetime abuse in adulthood by current or former husbands or partners (Table 16a), and current abuse, defined as abuse in the last 12 months (Table 16b).
Focusing first on lifetime abuse, we can see in Table 16a and Graph 20 that nearly 48 percent of ever-married women aged 15-49 years have been subjected to verbal/psychological abuse, while 27 percent have been subjected to physical violence and 13 percent to sexual violence. Almost one in every three women (29 percent) reported having experienced physical or sexual violence in their life.
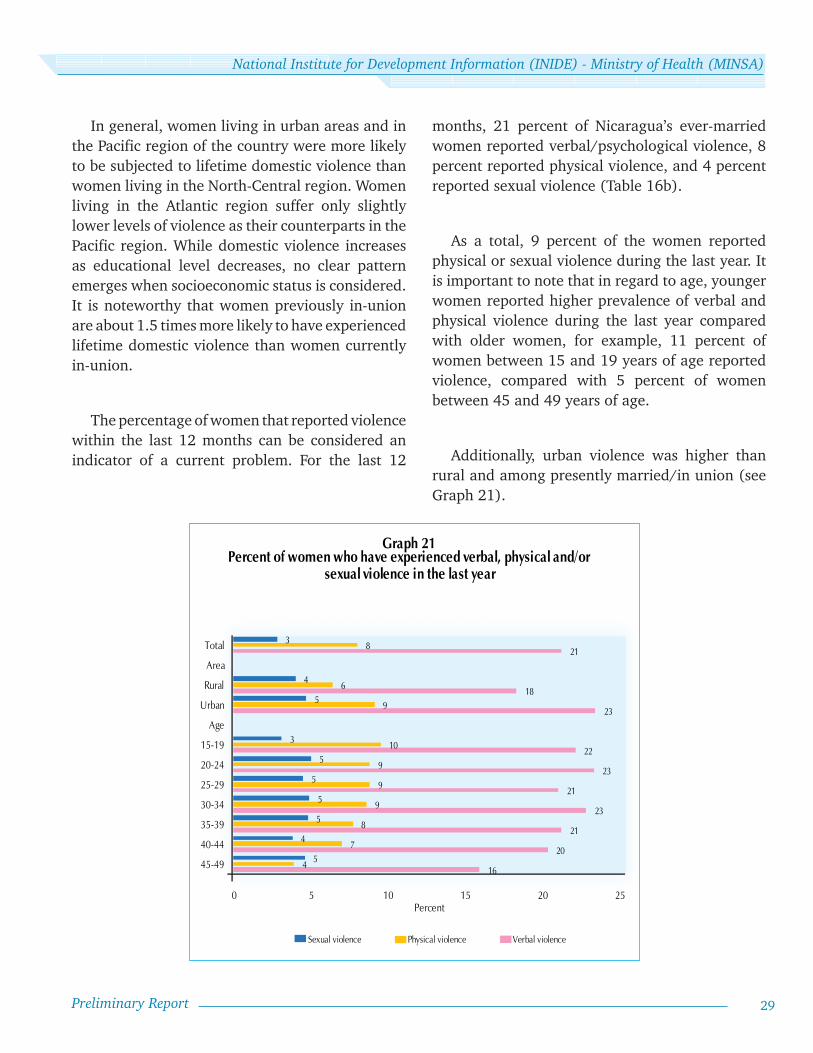
National Institute for Development Information (INIDE) - Ministry of Health (MINSA)
29Preliminary Report
In general, women living in urban areas and in the Pacific region of the country were more likely to be subjected to lifetime domestic violence than women living in the North-Central region. Women living in the Atlantic region suffer only slightly lower levels of violence as their counterparts in the Pacific region. While domestic violence increases as educational level decreases, no clear pattern emerges when socioeconomic status is considered. It is noteworthy that women previously in-union are about 1.5 times more likely to have experienced lifetime domestic violence than women currently in-union.
The percentage of women that reported violence within the last 12 months can be considered an indicator of a current problem. For the last 12
months, 21 percent of Nicaragua’s ever-married women reported verbal/psychological violence, 8 percent reported physical violence, and 4 percent reported sexual violence (Table 16b).
As a total, 9 percent of the women reported physical or sexual violence during the last year. It is important to note that in regard to age, younger women reported higher prevalence of verbal and physical violence during the last year compared with older women, for example, 11 percent of women between 15 and 19 years of age reported violence, compared with 5 percent of women between 45 and 49 years of age.
Additionally, urban violence was higher than rural and among presently married/in union (see Graph 21).
16
20
21
23
21
23
22
23
18
21
4
7
8
9
9
9
10
9
6
8
5
4
5
5
5
5
3
5
4
3
0 5 10 15 20 25
45-49
40-44
35-39
30-34
25-29
20-24
15-19
Age
Urban
Rural
Area
Total
Percent
Sexual violence Physical violence Verbal violence
Graph 21 Percent of women who have experienced verbal, physical and/or
sexual violence in the last year


ANNEXES


Preliminary Report - Annexes 33
National Institute for Development Information (INIDE) - Ministry of Health (MINSA)
TABLE 1
RESULTS FROM HOUSEHOLD AND INDIVIDUAL INTERVIEWS
Number of household and individual interviews and response rates, by residence, region and department
CHARACTERISTICSSELECTED INHABITED
HOUSEHOLDS INTERVIEWED
RESPONSE RATE
HOUSEHOLDS WITH 1 OR MORE WRA
INTERVIEWS WITH WRA
RESPONSE RATE
N N N % N N %
AREA
Urban 9,600 8,862 8,677 97.9 7,431 7,118 95.8
Rural 9,540 8,708 8,532 98.0 7,416 7,103 95.8
REGION
Pacifi c 8,730 8,072 7,890 97.7 6,647 6,376 95.9
North-Central 7,260 6,580 6,433 97.8 5,578 5,329 95.5
Atlantic 3,150 2,918 2,886 98.9 2,622 2,516 96.0
DEPARTMENT
Nueva Segovia 990 908 896 98.7 768 740 96.4
Jinotega 1,170 1,061 1,038 97.8 908 869 95.7
Madriz 900 822 807 98.2 717 679 94.7
Estelí 990 908 894 98.5 759 730 96.2
Chinandega 1,290 1,203 1,183 98.3 998 959 96.1
León 1,320 1,216 1,196 98.4 1,023 974 95.2
Matagalpa 1,410 1,266 1,248 98.6 1,086 1,051 96.8
Boaco 900 809 781 96.5 667 636 95.4
Managua 2,310 2,168 2,084 96.1 1,813 1,733 95.6
Masaya 1,110 1,030 1,002 97.3 866 828 95.6
Chontales 900 806 769 95.4 673 624 92.7
Granada 900 826 815 98.7 662 638 96.4
Carazo 900 811 799 98.5 640 620 96.9
Rivas 900 818 811 99.1 645 624 96.7
Río San Juan 900 837 836 99.9 759 735 96.8
RAAN 1,080 999 981 98.2 877 827 94.3
RAAS 1,170 1,082 1,069 98.8 986 954 96.8
TOTAL 19,140 17,570 17,209 97.9 14,847 14,221 95.8
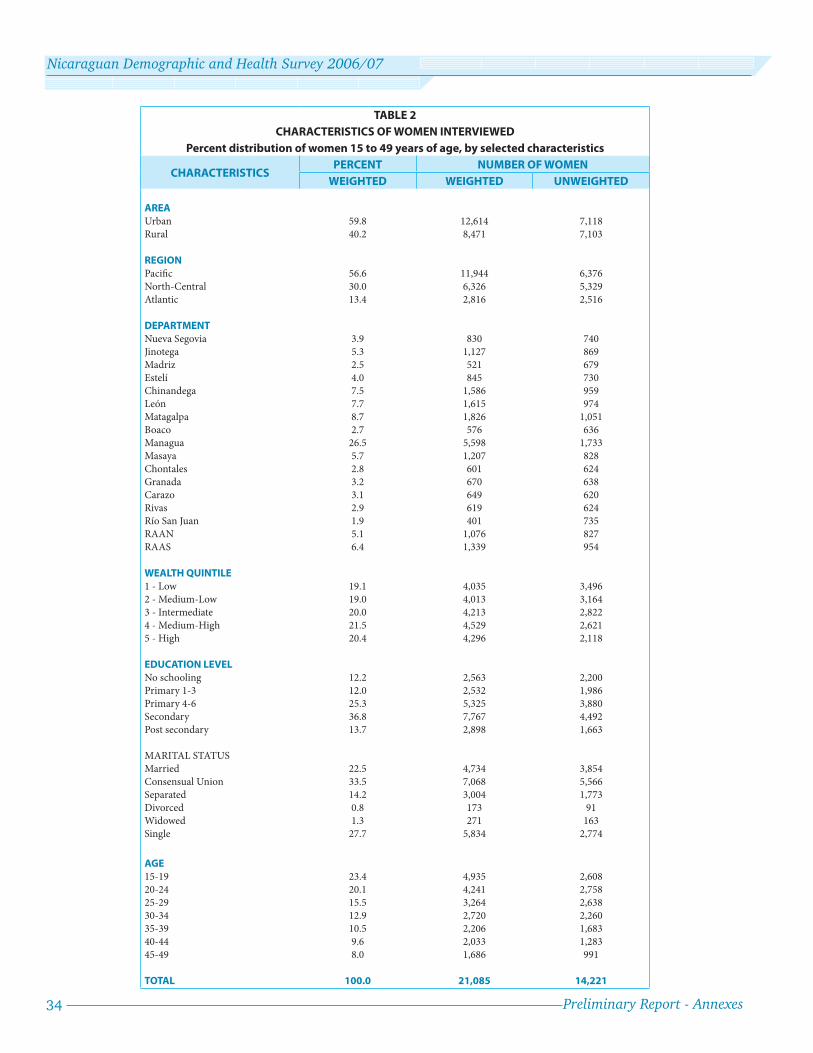
34 Preliminary Report - Annexes
Nicaraguan Demographic and Health Survey 2006/07
TABLE 2
CHARACTERISTICS OF WOMEN INTERVIEWED
Percent distribution of women 15 to 49 years of age, by selected characteristics
CHARACTERISTICSPERCENT NUMBER OF WOMEN
WEIGHTED WEIGHTED UNWEIGHTED
AREA
Urban 59.8 12,614 7,118
Rural 40.2 8,471 7,103
REGION
Pacifi c 56.6 11,944 6,376
North-Central 30.0 6,326 5,329
Atlantic 13.4 2,816 2,516
DEPARTMENT
Nueva Segovia 3.9 830 740
Jinotega 5.3 1,127 869
Madriz 2.5 521 679
Estelí 4.0 845 730
Chinandega 7.5 1,586 959
León 7.7 1,615 974
Matagalpa 8.7 1,826 1,051
Boaco 2.7 576 636
Managua 26.5 5,598 1,733
Masaya 5.7 1,207 828
Chontales 2.8 601 624
Granada 3.2 670 638
Carazo 3.1 649 620
Rivas 2.9 619 624
Río San Juan 1.9 401 735
RAAN 5.1 1,076 827
RAAS 6.4 1,339 954
WEALTH QUINTILE
1 - Low 19.1 4,035 3,496
2 - Medium-Low 19.0 4,013 3,164
3 - Intermediate 20.0 4,213 2,822
4 - Medium-High 21.5 4,529 2,621
5 - High 20.4 4,296 2,118
EDUCATION LEVEL
No schooling 12.2 2,563 2,200
Primary 1-3 12.0 2,532 1,986
Primary 4-6 25.3 5,325 3,880
Secondary 36.8 7,767 4,492
Post secondary 13.7 2,898 1,663
MARITAL STATUS
Married 22.5 4,734 3,854
Consensual Union 33.5 7,068 5,566
Separated 14.2 3,004 1,773
Divorced 0.8 173 91
Widowed 1.3 271 163
Single 27.7 5,834 2,774
AGE
15-19 23.4 4,935 2,608
20-24 20.1 4,241 2,758
25-29 15.5 3,264 2,638
30-34 12.9 2,720 2,260
35-39 10.5 2,206 1,683
40-44 9.6 2,033 1,283
45-49 8.0 1,686 991
TOTAL 100.0 21,085 14,221
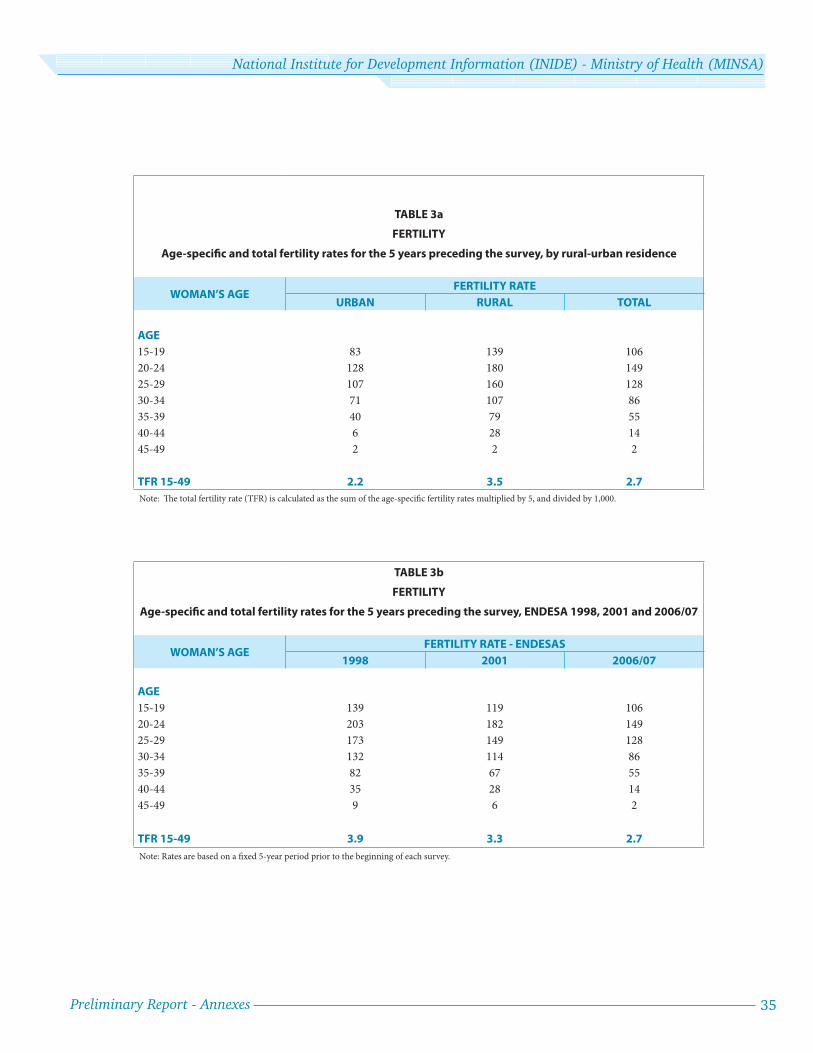
Preliminary Report - Annexes 35
National Institute for Development Information (INIDE) - Ministry of Health (MINSA)
TABLE 3a
FERTILITY
Age-specifi c and total fertility rates for the 5 years preceding the survey, by rural-urban residence
WOMAN’S AGEFERTILITY RATE
URBAN RURAL TOTAL
AGE
15-19 83 139 106
20-24 128 180 149
25-29 107 160 128
30-34 71 107 86
35-39 40 79 55
40-44 6 28 14
45-49 2 2 2
TFR 15-49 2.2 3.5 2.7
Note: Th e total fertility rate (TFR) is calculated as the sum of the age-specifi c fertility rates multiplied by 5, and divided by 1,000.
TABLE 3b
FERTILITY
Age-specifi c and total fertility rates for the 5 years preceding the survey, ENDESA 1998, 2001 and 2006/07
WOMAN’S AGEFERTILITY RATE - ENDESAS
1998 2001 2006/07
AGE
15-19 139 119 106
20-24 203 182 149
25-29 173 149 128
30-34 132 114 86
35-39 82 67 55
40-44 35 28 14
45-49 9 6 2
TFR 15-49 3.9 3.3 2.7
Note: Rates are based on a fi xed 5-year period prior to the beginning of each survey.
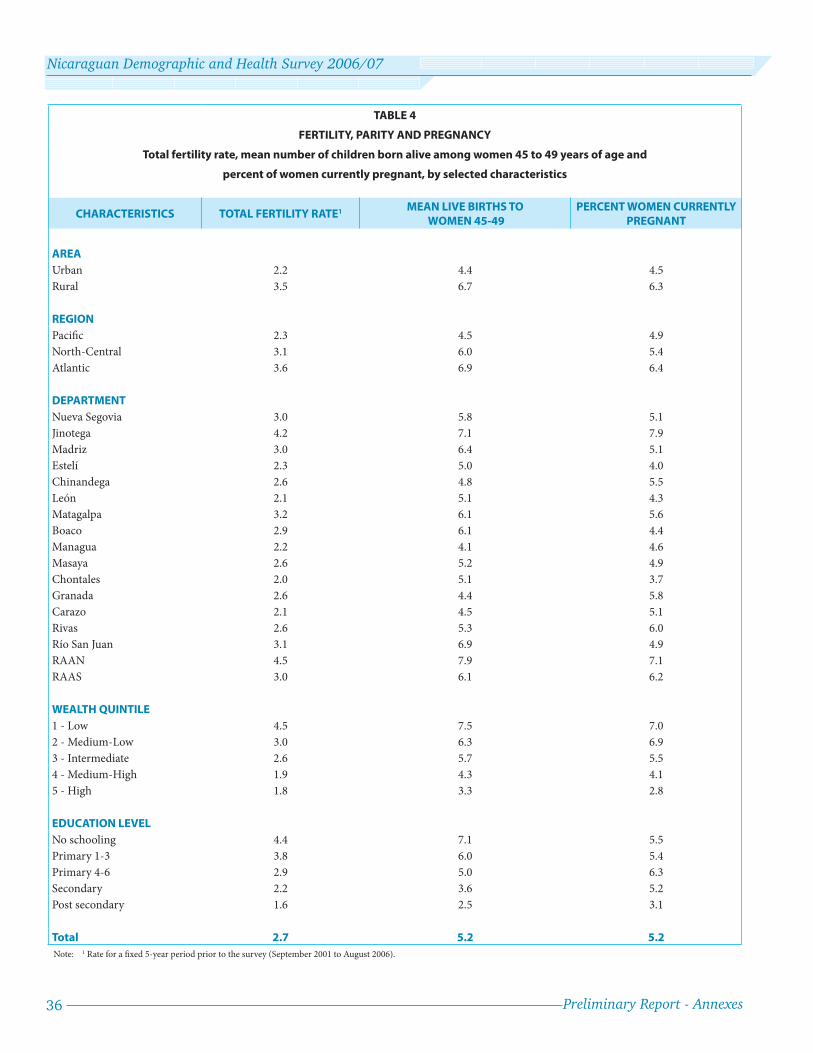
36 Preliminary Report - Annexes
Nicaraguan Demographic and Health Survey 2006/07
TABLE 4
FERTILITY, PARITY AND PREGNANCY
Total fertility rate, mean number of children born alive among women 45 to 49 years of age and
percent of women currently pregnant, by selected characteristics
CHARACTERISTICS TOTAL FERTILITY RATE1 MEAN LIVE BIRTHS TO WOMEN 45-49
PERCENT WOMEN CURRENTLY PREGNANT
AREA
Urban 2.2 4.4 4.5
Rural 3.5 6.7 6.3
REGION
Pacifi c 2.3 4.5 4.9
North-Central 3.1 6.0 5.4
Atlantic 3.6 6.9 6.4
DEPARTMENT
Nueva Segovia 3.0 5.8 5.1
Jinotega 4.2 7.1 7.9
Madriz 3.0 6.4 5.1
Estelí 2.3 5.0 4.0
Chinandega 2.6 4.8 5.5
León 2.1 5.1 4.3
Matagalpa 3.2 6.1 5.6
Boaco 2.9 6.1 4.4
Managua 2.2 4.1 4.6
Masaya 2.6 5.2 4.9
Chontales 2.0 5.1 3.7
Granada 2.6 4.4 5.8
Carazo 2.1 4.5 5.1
Rivas 2.6 5.3 6.0
Río San Juan 3.1 6.9 4.9
RAAN 4.5 7.9 7.1
RAAS 3.0 6.1 6.2
WEALTH QUINTILE
1 - Low 4.5 7.5 7.0
2 - Medium-Low 3.0 6.3 6.9
3 - Intermediate 2.6 5.7 5.5
4 - Medium-High 1.9 4.3 4.1
5 - High 1.8 3.3 2.8
EDUCATION LEVEL
No schooling 4.4 7.1 5.5
Primary 1-3 3.8 6.0 5.4
Primary 4-6 2.9 5.0 6.3
Secondary 2.2 3.6 5.2
Post secondary 1.6 2.5 3.1
Total 2.7 5.2 5.2
Note: 1 Rate for a fi xed 5-year period prior to the survey (September 2001 to August 2006).
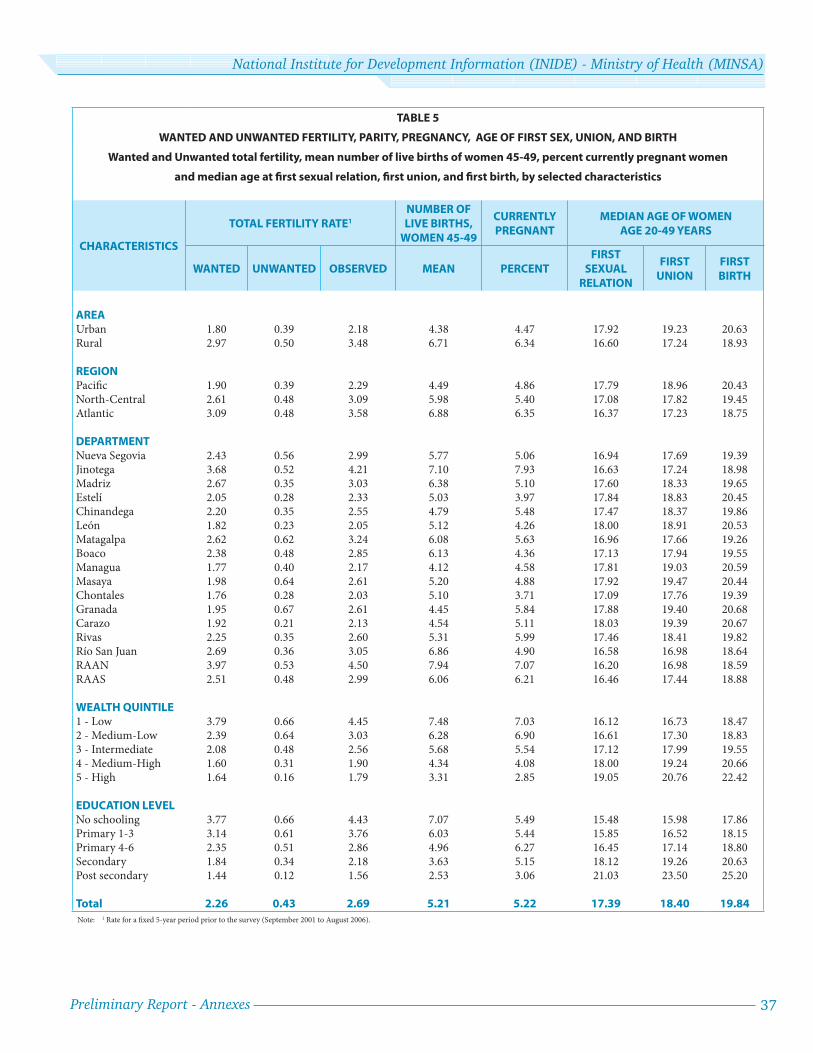
Preliminary Report - Annexes 37
National Institute for Development Information (INIDE) - Ministry of Health (MINSA)
TABLE 5
WANTED AND UNWANTED FERTILITY, PARITY, PREGNANCY, AGE OF FIRST SEX, UNION, AND BIRTH
Wanted and Unwanted total fertility, mean number of live births of women 45-49, percent currently pregnant women
and median age at fi rst sexual relation, fi rst union, and fi rst birth, by selected characteristics
CHARACTERISTICS
TOTAL FERTILITY RATE1
NUMBER OF LIVE BIRTHS,
WOMEN 45-49
CURRENTLY PREGNANT
MEDIAN AGE OF WOMEN AGE 20-49 YEARS
WANTED UNWANTED OBSERVED MEAN PERCENTFIRST
SEXUAL RELATION
FIRST UNION
FIRST BIRTH
AREAUrban 1.80 0.39 2.18 4.38 4.47 17.92 19.23 20.63Rural 2.97 0.50 3.48 6.71 6.34 16.60 17.24 18.93
REGIONPacifi c 1.90 0.39 2.29 4.49 4.86 17.79 18.96 20.43North-Central 2.61 0.48 3.09 5.98 5.40 17.08 17.82 19.45Atlantic 3.09 0.48 3.58 6.88 6.35 16.37 17.23 18.75
DEPARTMENTNueva Segovia 2.43 0.56 2.99 5.77 5.06 16.94 17.69 19.39Jinotega 3.68 0.52 4.21 7.10 7.93 16.63 17.24 18.98Madriz 2.67 0.35 3.03 6.38 5.10 17.60 18.33 19.65Estelí 2.05 0.28 2.33 5.03 3.97 17.84 18.83 20.45Chinandega 2.20 0.35 2.55 4.79 5.48 17.47 18.37 19.86León 1.82 0.23 2.05 5.12 4.26 18.00 18.91 20.53Matagalpa 2.62 0.62 3.24 6.08 5.63 16.96 17.66 19.26Boaco 2.38 0.48 2.85 6.13 4.36 17.13 17.94 19.55Managua 1.77 0.40 2.17 4.12 4.58 17.81 19.03 20.59Masaya 1.98 0.64 2.61 5.20 4.88 17.92 19.47 20.44Chontales 1.76 0.28 2.03 5.10 3.71 17.09 17.76 19.39Granada 1.95 0.67 2.61 4.45 5.84 17.88 19.40 20.68Carazo 1.92 0.21 2.13 4.54 5.11 18.03 19.39 20.67Rivas 2.25 0.35 2.60 5.31 5.99 17.46 18.41 19.82Río San Juan 2.69 0.36 3.05 6.86 4.90 16.58 16.98 18.64RAAN 3.97 0.53 4.50 7.94 7.07 16.20 16.98 18.59RAAS 2.51 0.48 2.99 6.06 6.21 16.46 17.44 18.88
WEALTH QUINTILE1 - Low 3.79 0.66 4.45 7.48 7.03 16.12 16.73 18.472 - Medium-Low 2.39 0.64 3.03 6.28 6.90 16.61 17.30 18.833 - Intermediate 2.08 0.48 2.56 5.68 5.54 17.12 17.99 19.554 - Medium-High 1.60 0.31 1.90 4.34 4.08 18.00 19.24 20.665 - High 1.64 0.16 1.79 3.31 2.85 19.05 20.76 22.42
EDUCATION LEVELNo schooling 3.77 0.66 4.43 7.07 5.49 15.48 15.98 17.86Primary 1-3 3.14 0.61 3.76 6.03 5.44 15.85 16.52 18.15Primary 4-6 2.35 0.51 2.86 4.96 6.27 16.45 17.14 18.80Secondary 1.84 0.34 2.18 3.63 5.15 18.12 19.26 20.63Post secondary 1.44 0.12 1.56 2.53 3.06 21.03 23.50 25.20
Total 2.26 0.43 2.69 5.21 5.22 17.39 18.40 19.84
Note: 1 Rate for a fi xed 5-year period prior to the survey (September 2001 to August 2006).
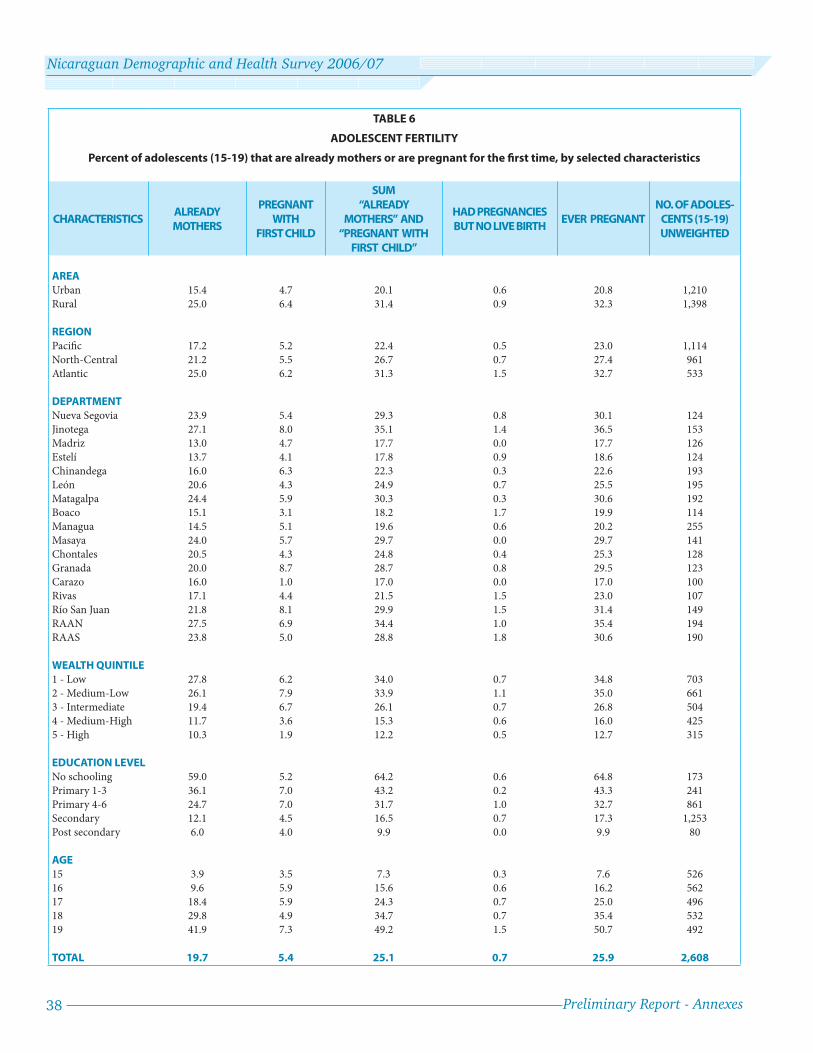
38 Preliminary Report - Annexes
Nicaraguan Demographic and Health Survey 2006/07
TABLE 6
ADOLESCENT FERTILITY
Percent of adolescents (15-19) that are already mothers or are pregnant for the fi rst time, by selected characteristics
CHARACTERISTICSALREADY MOTHERS
PREGNANT WITH
FIRST CHILD
SUM “ALREADY
MOTHERS” AND “PREGNANT WITH
FIRST CHILD”
HAD PREGNANCIES BUT NO LIVE BIRTH
EVER PREGNANTNO. OF ADOLES-
CENTS (15-19) UNWEIGHTED
AREA
Urban 15.4 4.7 20.1 0.6 20.8 1,210
Rural 25.0 6.4 31.4 0.9 32.3 1,398
REGION
Pacifi c 17.2 5.2 22.4 0.5 23.0 1,114
North-Central 21.2 5.5 26.7 0.7 27.4 961
Atlantic 25.0 6.2 31.3 1.5 32.7 533
DEPARTMENT
Nueva Segovia 23.9 5.4 29.3 0.8 30.1 124
Jinotega 27.1 8.0 35.1 1.4 36.5 153
Madriz 13.0 4.7 17.7 0.0 17.7 126
Estelí 13.7 4.1 17.8 0.9 18.6 124
Chinandega 16.0 6.3 22.3 0.3 22.6 193
León 20.6 4.3 24.9 0.7 25.5 195
Matagalpa 24.4 5.9 30.3 0.3 30.6 192
Boaco 15.1 3.1 18.2 1.7 19.9 114
Managua 14.5 5.1 19.6 0.6 20.2 255
Masaya 24.0 5.7 29.7 0.0 29.7 141
Chontales 20.5 4.3 24.8 0.4 25.3 128
Granada 20.0 8.7 28.7 0.8 29.5 123
Carazo 16.0 1.0 17.0 0.0 17.0 100
Rivas 17.1 4.4 21.5 1.5 23.0 107
Río San Juan 21.8 8.1 29.9 1.5 31.4 149
RAAN 27.5 6.9 34.4 1.0 35.4 194
RAAS 23.8 5.0 28.8 1.8 30.6 190
WEALTH QUINTILE
1 - Low 27.8 6.2 34.0 0.7 34.8 703
2 - Medium-Low 26.1 7.9 33.9 1.1 35.0 661
3 - Intermediate 19.4 6.7 26.1 0.7 26.8 504
4 - Medium-High 11.7 3.6 15.3 0.6 16.0 425
5 - High 10.3 1.9 12.2 0.5 12.7 315
EDUCATION LEVEL
No schooling 59.0 5.2 64.2 0.6 64.8 173
Primary 1-3 36.1 7.0 43.2 0.2 43.3 241
Primary 4-6 24.7 7.0 31.7 1.0 32.7 861
Secondary 12.1 4.5 16.5 0.7 17.3 1,253
Post secondary 6.0 4.0 9.9 0.0 9.9 80
AGE
15 3.9 3.5 7.3 0.3 7.6 526
16 9.6 5.9 15.6 0.6 16.2 562
17 18.4 5.9 24.3 0.7 25.0 496
18 29.8 4.9 34.7 0.7 35.4 532
19 41.9 7.3 49.2 1.5 50.7 492
TOTAL 19.7 5.4 25.1 0.7 25.9 2,608

Preliminary Report - Annexes 39
National Institute for Development Information (INIDE) - Ministry of Health (MINSA)
TABLE 7
CURRENT CONTRACEPTIVE USE OF WOMEN IN-UNION
Percent distribution of women in-union by current contraceptive method, by select characteristics
CHARACTERISTICS ANY METHODTOTAL
MODERN
MODERN METHODS TOTAL
TRADI-
TIONAL
TRADITIONAL METHODS
NONE
NO. WOMEN IN-UNION
FEMALE
STERILIZATIONVASECTOMY PILL IUD
HORMONE
INJECTIONCONDOM* LAM
PERIODIC
ABSTINENCEWITHDRAWAL WEIGHTED UN-WEIGHTED
AREAUrban 74.9 71.3 28.9 0.7 13.1 4.9 18.3 5.0 0.5 3.6 2.4 1.2 25.1 6,351 4,214Rural 69.5 68.0 19.0 0.0 14.0 1.6 29.4 2.4 1.6 1.5 0.8 0.6 30.5 5,451 5,206
REGIONPacifi c 75.1 71.6 29.8 0.6 13.4 4.6 17.9 5.0 0.5 3.5 2.3 1.2 24.9 6,373 4,035North-Central 70.4 68.6 18.3 0.2 13.9 2.5 29.9 2.4 1.3 1.8 1.0 0.7 29.6 3,708 3,612Atlantic 66.8 65.6 17.1 0.1 12.9 1.1 29.9 2.3 2.3 1.1 0.7 0.5 33.2 1,720 1,773
DEPARTMENTNueva Segovia 74.0 71.8 18.9 0.0 13.5 0.8 34.6 3.3 0.7 2.1 1.1 1.0 26.0 474 496Jinotega 63.5 62.4 10.4 0.0 15.9 1.4 31.0 1.7 2.1 1.0 0.8 0.3 36.5 719 632Madriz 68.2 64.2 15.2 0.2 14.3 1.3 29.4 2.3 1.5 4.0 2.7 1.3 31.8 280 440Estelí 75.1 73.4 28.1 0.3 15.0 3.9 21.4 4.1 0.5 1.7 0.3 1.4 24.9 469 469Chinandega 74.0 70.7 29.1 0.0 13.2 2.8 20.4 4.3 0.9 3.3 2.2 1.1 26.0 902 639León 73.7 71.5 34.2 0.0 12.6 2.6 17.2 4.0 0.9 2.2 1.5 0.6 26.3 831 605Matagalpa 68.8 66.8 15.8 0.4 11.8 3.7 31.2 2.2 1.7 1.9 1.3 0.7 31.2 1,097 732Boaco 74.3 73.0 19.4 0.0 13.6 2.6 34.5 1.9 0.9 1.3 0.7 0.6 25.7 329 425Managua 76.1 72.0 30.3 1.2 13.2 7.3 14.4 5.5 0.1 4.1 2.7 1.4 23.9 2,929 1,065Masaya 73.6 68.6 25.3 0.0 13.2 2.9 21.2 5.4 0.6 5.1 3.0 2.1 26.4 631 510Chontales 76.7 75.7 30.7 0.0 15.7 1.9 25.0 1.8 0.6 1.0 0.4 0.6 23.3 339 418Granada 75.6 73.0 23.0 0.2 19.8 0.9 21.6 6.1 1.3 2.5 1.7 0.8 24.4 363 401Carazo 75.6 72.2 30.4 0.0 11.3 1.2 25.3 3.8 0.2 3.4 2.4 1.0 24.4 364 405Rivas 75.1 73.9 30.9 0.2 13.0 1.2 24.5 3.5 0.6 1.2 0.6 0.6 24.9 353 410Río San Juan 78.5 77.1 25.5 0.2 19.8 2.1 25.1 3.1 1.2 1.5 0.3 1.2 21.5 261 538RAAN 57.0 55.9 9.5 0.1 7.4 0.5 32.2 2.4 3.9 1.1 0.9 0.3 43.0 675 591RAAS 71.2 70.2 20.9 0.0 15.4 1.2 29.5 2.1 1.2 1.0 0.6 0.4 28.8 784 644
WEALTH QUINTILELow 65.2 63.7 12.6 0.1 12.6 1.0 32.9 2.2 2.4 1.5 0.7 0.8 34.8 2,674 2,629Medium-Low 69.8 68.4 21.9 0.1 13.6 2.4 27.0 2.3 1.1 1.4 0.7 0.7 30.2 2,377 2,163Intermediate 74.7 72.6 28.6 0.1 15.3 2.6 22.1 3.5 0.4 2.1 1.5 0.6 25.3 2,340 1,817Medium-High 75.5 72.5 28.7 0.1 13.7 5.2 19.3 5.0 0.4 3.0 1.8 1.2 24.5 2,294 1,585High 78.6 73.1 32.4 1.8 12.3 6.4 13.5 6.4 0.4 5.6 4.0 1.6 21.4 2,117 1,226
EDUCATION LEVELNo schooling 65.7 64.8 22.9 0.3 9.2 1.9 26.2 2.3 2.1 0.9 0.4 0.5 34.3 1,869 1,725Primary 1-3 71.1 69.6 27.0 0.1 11.3 2.1 25.8 2.2 1.3 1.5 0.7 0.8 28.9 1,790 1,550Primary 4-6 71.7 69.4 23.4 0.1 14.2 2.5 25.4 2.7 1.0 2.3 1.1 1.2 28.3 3,181 2,695Secondary 74.7 71.1 23.1 0.4 16.1 4.4 21.8 4.7 0.5 3.6 2.5 1.1 25.3 3,601 2,519Post secondary 78.9 74.4 28.2 1.7 13.7 6.5 16.2 7.8 0.3 4.5 3.9 0.6 21.1 1,360 931
AGE15-19 61.1 59.7 0.5 0.1 20.4 1.9 34.0 1.9 0.9 1.4 0.3 1.2 38.9 1,194 87120-24 70.5 68.3 4.0 0.0 19.1 3.8 37.4 2.9 1.1 2.3 0.9 1.3 29.5 2,212 1,83425-29 74.4 70.8 11.8 0.1 16.9 3.3 31.9 5.3 1.5 3.6 2.3 1.3 25.6 2,247 2,04330-34 77.5 74.5 29.1 0.3 14.7 4.5 20.8 4.0 1.3 2.9 2.2 0.7 22.5 1,970 1,76035-39 78.9 76.2 43.4 0.4 9.2 3.9 14.2 4.3 0.8 2.7 2.1 0.6 21.1 1,658 1,30940-44 75.5 73.8 49.8 1.5 5.5 3.2 9.0 4.1 0.6 1.7 1.4 0.4 24.5 1,402 92245-49 61.8 58.8 46.5 0.9 2.4 2.1 4.0 2.9 0.0 3.0 2.1 1.0 38.2 1,118 681
LIVE BIRTHS0 36.9 34.2 0.4 0.0 17.9 0.3 12.3 3.1 0.1 2.8 1.9 0.9 63.1 1,150 8181-2 75.0 71.8 13.1 0.4 17.8 4.7 30.5 4.4 0.8 3.2 2.1 1.1 25.0 5,302 4,3883-4 83.3 80.8 43.7 0.6 10.2 2.6 19.2 3.5 1.0 2.5 1.7 0.9 16.7 3,267 2,6315+ 68.4 67.1 35.8 0.2 5.1 2.9 18.1 3.1 2.0 1.3 0.5 0.8 31.6 2,083 1,583
TOTAL 72.4 69.8 24.3 0.4 13.5 3.4 23.4 3.8 1.0 2.6 1.7 1.0 27.6 11,802 9,420
Note: * includes 1 user of female condoms.
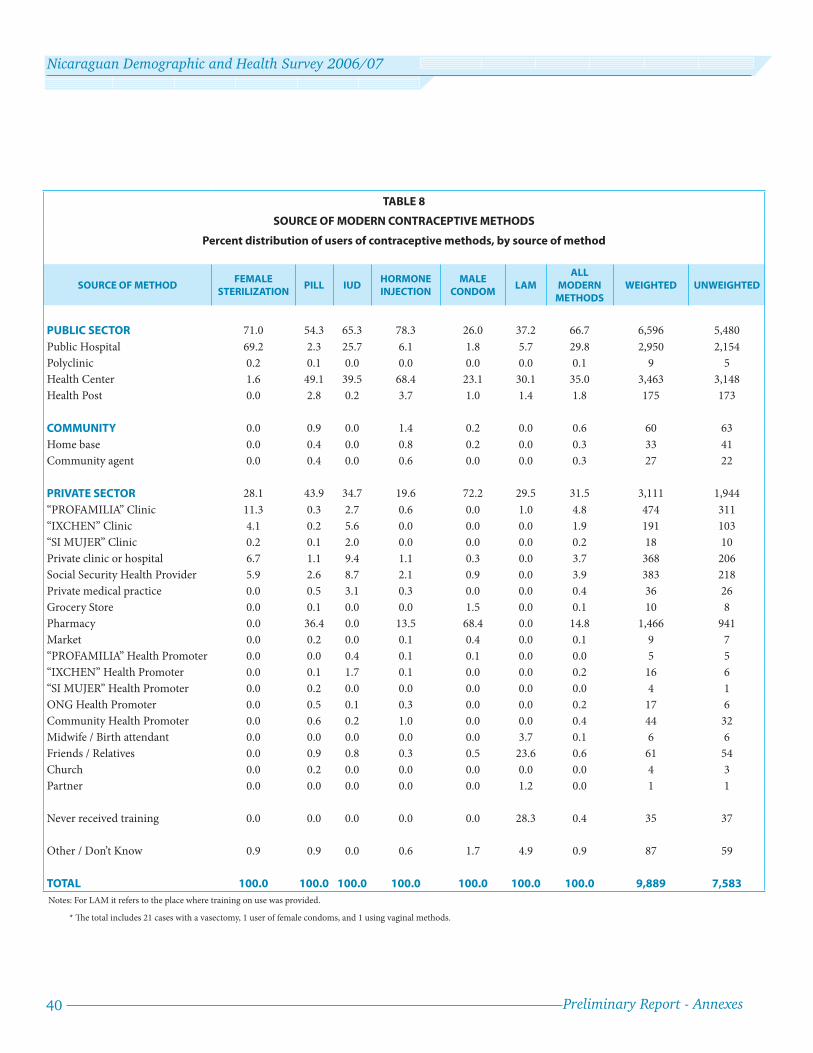
40 Preliminary Report - Annexes
Nicaraguan Demographic and Health Survey 2006/07
TABLE 8
SOURCE OF MODERN CONTRACEPTIVE METHODS
Percent distribution of users of contraceptive methods, by source of method
SOURCE OF METHODFEMALE
STERILIZATIONPILL IUD
HORMONE INJECTION
MALE CONDOM
LAMALL
MODERN METHODS
WEIGHTED UNWEIGHTED
PUBLIC SECTOR 71.0 54.3 65.3 78.3 26.0 37.2 66.7 6,596 5,480
Public Hospital 69.2 2.3 25.7 6.1 1.8 5.7 29.8 2,950 2,154
Polyclinic 0.2 0.1 0.0 0.0 0.0 0.0 0.1 9 5
Health Center 1.6 49.1 39.5 68.4 23.1 30.1 35.0 3,463 3,148
Health Post 0.0 2.8 0.2 3.7 1.0 1.4 1.8 175 173
COMMUNITY 0.0 0.9 0.0 1.4 0.2 0.0 0.6 60 63
Home base 0.0 0.4 0.0 0.8 0.2 0.0 0.3 33 41
Community agent 0.0 0.4 0.0 0.6 0.0 0.0 0.3 27 22
PRIVATE SECTOR 28.1 43.9 34.7 19.6 72.2 29.5 31.5 3,111 1,944
“PROFAMILIA” Clinic 11.3 0.3 2.7 0.6 0.0 1.0 4.8 474 311
“IXCHEN” Clinic 4.1 0.2 5.6 0.0 0.0 0.0 1.9 191 103
“SI MUJER” Clinic 0.2 0.1 2.0 0.0 0.0 0.0 0.2 18 10
Private clinic or hospital 6.7 1.1 9.4 1.1 0.3 0.0 3.7 368 206
Social Security Health Provider 5.9 2.6 8.7 2.1 0.9 0.0 3.9 383 218
Private medical practice 0.0 0.5 3.1 0.3 0.0 0.0 0.4 36 26
Grocery Store 0.0 0.1 0.0 0.0 1.5 0.0 0.1 10 8
Pharmacy 0.0 36.4 0.0 13.5 68.4 0.0 14.8 1,466 941
Market 0.0 0.2 0.0 0.1 0.4 0.0 0.1 9 7
“PROFAMILIA” Health Promoter 0.0 0.0 0.4 0.1 0.1 0.0 0.0 5 5
“IXCHEN” Health Promoter 0.0 0.1 1.7 0.1 0.0 0.0 0.2 16 6
“SI MUJER” Health Promoter 0.0 0.2 0.0 0.0 0.0 0.0 0.0 4 1
ONG Health Promoter 0.0 0.5 0.1 0.3 0.0 0.0 0.2 17 6
Community Health Promoter 0.0 0.6 0.2 1.0 0.0 0.0 0.4 44 32
Midwife / Birth attendant 0.0 0.0 0.0 0.0 0.0 3.7 0.1 6 6
Friends / Relatives 0.0 0.9 0.8 0.3 0.5 23.6 0.6 61 54
Church 0.0 0.2 0.0 0.0 0.0 0.0 0.0 4 3
Partner 0.0 0.0 0.0 0.0 0.0 1.2 0.0 1 1
Never received training 0.0 0.0 0.0 0.0 0.0 28.3 0.4 35 37
Other / Don’t Know 0.9 0.9 0.0 0.6 1.7 4.9 0.9 87 59
TOTAL 100.0 100.0 100.0 100.0 100.0 100.0 100.0 9,889 7,583
Notes: For LAM it refers to the place where training on use was provided.
* Th e total includes 21 cases with a vasectomy, 1 user of female condoms, and 1 using vaginal methods.

Preliminary Report - Annexes 41
National Institute for Development Information (INIDE) - Ministry of Health (MINSA)
TABLE 9a
PRENATAL CARE COVERAGE
Percent of births for whom mothers received prenatal care (various indicators of care) and a tetanus toxoid vaccine prior to childbirth,
live births between September 2001 and August 2006
CHARACTERISTICS
INDICATORS OF PRENATAL CARE LIVE BIRTHS
ANY PRENATAL
CARE
QUALIFIED WITH DOCTOR
/ NURSE
WITH 4 OR MORE PRENATAL
VISITS
DURING THE FIRST
TRIMESTER
WITH AT LEAST ONE VACCINE OF TETANUS
TOXOID
QUALIFIED, IN 1ST TRIMESTER WITH 4+ VISITS
AND A TETANUS TOXOID VACCINE
WEIGHTED UNWEIGHTED
AREAUrban 95.2 94.8 86.2 78.6 93.2 72.0 4,310 2,842Rural 87.0 85.9 69.7 62.2 89.3 55.1 4,547 4,386
REGIONPacifi c 95.0 94.5 85.7 78.6 93.5 71.7 4,325 2,799North-Central 92.1 91.4 76.6 67.8 93.0 61.2 3,033 2,893Atlantic 77.0 75.3 57.2 50.8 81.0 43.4 1,499 1,536
DEPARTMENTNueva Segovia 98.0 97.6 87.8 71.7 95.7 67.6 390 388Jinotega 87.3 86.5 62.6 58.4 91.8 48.7 753 677Madriz 99.3 99.3 87.0 68.6 98.8 67.4 229 354Estelí 97.9 97.9 94.7 83.5 97.3 80.4 301 300Chinandega 98.0 97.8 86.1 76.2 95.8 71.1 633 446León 96.4 96.0 89.0 78.4 92.0 72.0 535 392Matagalpa 90.4 89.1 74.8 67.7 89.5 59.8 917 606Boaco 90.3 89.8 78.4 69.1 94.6 64.5 252 329Managua 94.3 93.6 84.5 78.2 92.9 70.4 1,900 697Masaya 90.2 89.8 83.2 75.8 93.4 69.4 498 399Chontales 91.9 91.6 73.7 70.7 92.9 63.0 191 239Granada 96.4 95.9 85.7 82.9 95.1 73.7 272 295Carazo 96.1 96.1 90.0 84.0 92.6 78.8 226 257Rivas 96.6 96.1 87.7 83.3 95.8 77.7 262 313Río San Juan 91.4 89.2 70.8 63.1 92.1 55.6 178 399RAAN 73.4 71.7 51.7 42.6 78.4 36.5 682 614RAAS 76.8 75.3 59.2 56.0 80.7 47.5 639 523
WEALTH QUINTILE1 - Low 82.8 81.4 60.8 54.0 87.8 46.4 2,674 2,6272 - Medium-Low 92.5 92.3 79.2 71.8 92.0 64.3 1,921 1,7163 - Intermediate 92.9 92.3 84.4 75.5 92.5 69.5 1,731 1,2674 - Medium-High 96.3 95.9 88.1 79.0 92.7 72.9 1,384 9555 - High 97.9 97.2 92.3 86.6 94.2 80.0 1,148 663
EDUCATION LEVELNo schooling 76.2 75.1 55.9 51.6 83.6 43.2 1,644 1,557Primary 1-3 88.7 88.0 68.7 65.3 89.7 55.9 1,416 1,258Primary 4-6 93.9 93.0 81.2 70.4 92.5 63.8 2,368 2,022Secondary 96.5 95.8 88.1 78.3 94.6 73.2 2,655 1,846Post secondary 98.5 98.5 94.7 90.2 94.7 84.4 773 545
MOTHER’S AGEAT BIRTH< 20 90.7 89.8 77.3 67.7 89.3 60.2 2,459 1,83220-34 91.9 91.1 79.1 72.0 92.2 65.4 5,684 4,854 35+ 84.9 84.0 68.9 64.5 90.6 57.2 715 542
BIRTH ORDER 1 95.1 94.5 84.3 76.2 91.6 69.1 3,206 2,3492-3 92.0 91.1 79.8 71.4 92.1 65.4 3,543 3,0044-5 85.8 85.1 68.1 63.5 90.3 55.3 1,215 1,1236+ 79.3 78.0 59.5 53.1 87.8 45.1 893 752
TOTAL 91.0 90.2 77.8 70.2 91.2 63.3 8,857 7,228
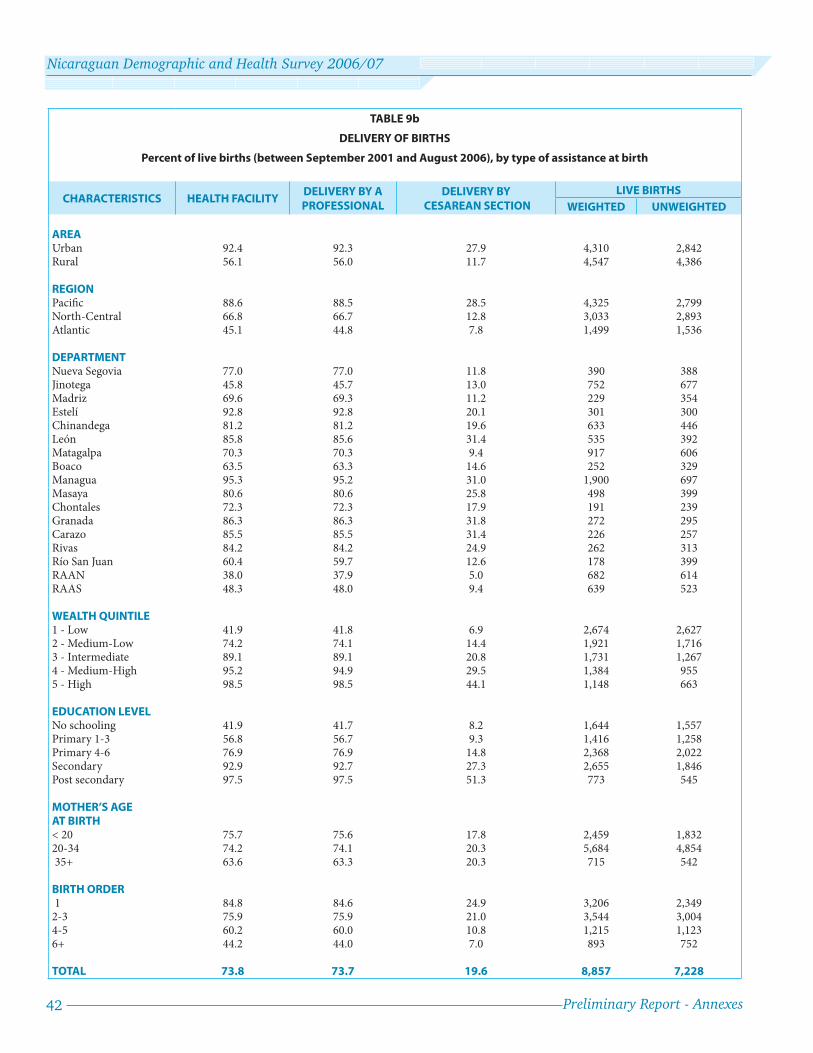
42 Preliminary Report - Annexes
Nicaraguan Demographic and Health Survey 2006/07
TABLE 9b
DELIVERY OF BIRTHS
Percent of live births (between September 2001 and August 2006), by type of assistance at birth
CHARACTERISTICS HEALTH FACILITYDELIVERY BY A PROFESSIONAL
DELIVERY BY CESAREAN SECTION
LIVE BIRTHS
WEIGHTED UNWEIGHTED
AREAUrban 92.4 92.3 27.9 4,310 2,842Rural 56.1 56.0 11.7 4,547 4,386
REGIONPacifi c 88.6 88.5 28.5 4,325 2,799North-Central 66.8 66.7 12.8 3,033 2,893Atlantic 45.1 44.8 7.8 1,499 1,536
DEPARTMENTNueva Segovia 77.0 77.0 11.8 390 388Jinotega 45.8 45.7 13.0 752 677Madriz 69.6 69.3 11.2 229 354Estelí 92.8 92.8 20.1 301 300Chinandega 81.2 81.2 19.6 633 446León 85.8 85.6 31.4 535 392Matagalpa 70.3 70.3 9.4 917 606Boaco 63.5 63.3 14.6 252 329Managua 95.3 95.2 31.0 1,900 697Masaya 80.6 80.6 25.8 498 399Chontales 72.3 72.3 17.9 191 239Granada 86.3 86.3 31.8 272 295Carazo 85.5 85.5 31.4 226 257Rivas 84.2 84.2 24.9 262 313Río San Juan 60.4 59.7 12.6 178 399RAAN 38.0 37.9 5.0 682 614RAAS 48.3 48.0 9.4 639 523
WEALTH QUINTILE1 - Low 41.9 41.8 6.9 2,674 2,6272 - Medium-Low 74.2 74.1 14.4 1,921 1,7163 - Intermediate 89.1 89.1 20.8 1,731 1,2674 - Medium-High 95.2 94.9 29.5 1,384 9555 - High 98.5 98.5 44.1 1,148 663
EDUCATION LEVELNo schooling 41.9 41.7 8.2 1,644 1,557Primary 1-3 56.8 56.7 9.3 1,416 1,258Primary 4-6 76.9 76.9 14.8 2,368 2,022Secondary 92.9 92.7 27.3 2,655 1,846Post secondary 97.5 97.5 51.3 773 545
MOTHER’S AGEAT BIRTH< 20 75.7 75.6 17.8 2,459 1,83220-34 74.2 74.1 20.3 5,684 4,854 35+ 63.6 63.3 20.3 715 542
BIRTH ORDER 1 84.8 84.6 24.9 3,206 2,3492-3 75.9 75.9 21.0 3,544 3,0044-5 60.2 60.0 10.8 1,215 1,1236+ 44.2 44.0 7.0 893 752
TOTAL 73.8 73.7 19.6 8,857 7,228
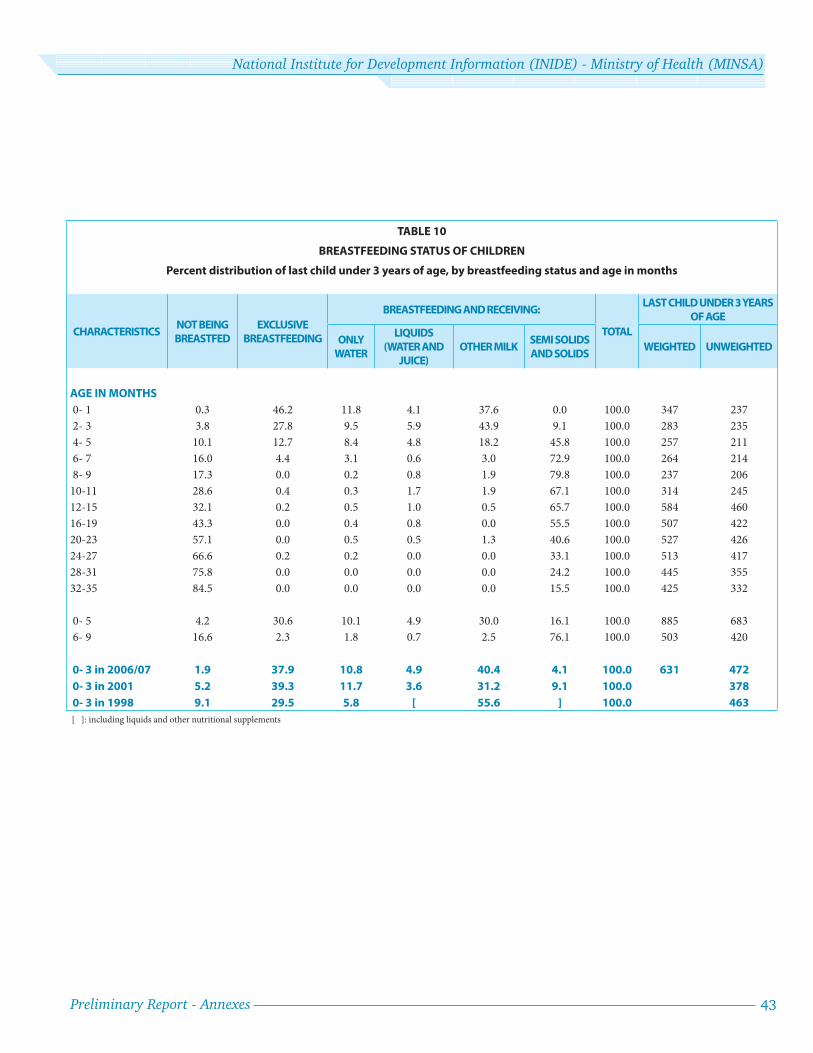
Preliminary Report - Annexes 43
National Institute for Development Information (INIDE) - Ministry of Health (MINSA)
TABLE 10
BREASTFEEDING STATUS OF CHILDREN
Percent distribution of last child under 3 years of age, by breastfeeding status and age in months
CHARACTERISTICSNOT BEING
BREASTFED
EXCLUSIVE
BREASTFEEDING
BREASTFEEDING AND RECEIVING:
TOTAL
LAST CHILD UNDER 3 YEARS
OF AGE
ONLY
WATER
LIQUIDS
(WATER AND
JUICE)
OTHER MILKSEMI SOLIDS
AND SOLIDSWEIGHTED UNWEIGHTED
AGE IN MONTHS
0- 1 0.3 46.2 11.8 4.1 37.6 0.0 100.0 347 237
2- 3 3.8 27.8 9.5 5.9 43.9 9.1 100.0 283 235
4- 5 10.1 12.7 8.4 4.8 18.2 45.8 100.0 257 211
6- 7 16.0 4.4 3.1 0.6 3.0 72.9 100.0 264 214
8- 9 17.3 0.0 0.2 0.8 1.9 79.8 100.0 237 206
10-11 28.6 0.4 0.3 1.7 1.9 67.1 100.0 314 245
12-15 32.1 0.2 0.5 1.0 0.5 65.7 100.0 584 460
16-19 43.3 0.0 0.4 0.8 0.0 55.5 100.0 507 422
20-23 57.1 0.0 0.5 0.5 1.3 40.6 100.0 527 426
24-27 66.6 0.2 0.2 0.0 0.0 33.1 100.0 513 417
28-31 75.8 0.0 0.0 0.0 0.0 24.2 100.0 445 355
32-35 84.5 0.0 0.0 0.0 0.0 15.5 100.0 425 332
0- 5 4.2 30.6 10.1 4.9 30.0 16.1 100.0 885 683
6- 9 16.6 2.3 1.8 0.7 2.5 76.1 100.0 503 420
0- 3 in 2006/07 1.9 37.9 10.8 4.9 40.4 4.1 100.0 631 472
0- 3 in 2001 5.2 39.3 11.7 3.6 31.2 9.1 100.0 378
0- 3 in 1998 9.1 29.5 5.8 [ 55.6 ] 100.0 463
[ ]: including liquids and other nutritional supplements

44 Preliminary Report - Annexes
Nicaraguan Demographic and Health Survey 2006/07
TABLE 11
INDICATORS OF MALNUTRITION
Low and very-low height-for-age, weight-for-height, and weight-for-age among children under 5 years of age
CHARACTERISTICS PERCENT CHRONIC MALNUTRITION PERCENT ACUTE MALNUTRITION PERCENT GLOBAL MALNUTRITION NUMBER OF CHILDREN
(STUNTED) (WASTED) (UNDERWEIGHT)
WEIGHTED UNWEIGHTED(HEIGHT-FOR-AGE) (WEIGHT-FOR-HEIGHT) (WEIGHT-FOR-AGE)
SEVERE TOTAL SEVERE TOTAL SEVERE TOTAL
AREAUrban 2.6 10.6 0.1 1.0 0.5 4.8 3,642 2,426Rural 6.0 22.7 0.1 0.9 0.7 8.9 3,886 3,746
REGIONPacifi c 2.3 11.4 0.1 0.8 0.4 5.3 3,701 2,422North-Central 7.0 24.0 0.2 1.0 1.0 9.6 2,536 2,424Atlantic 4.9 18.6 0.1 1.2 0.4 6.5 1,292 1,326
DEPARTMENTNueva Segovia 5.3 20.8 0.5 2.7 1.0 9.2 323 328Jinotega 11.6 32.6 0.3 1.2 1.6 15.4 646 579Madriz 7.6 29.7 0.0 0.3 0.3 7.3 198 309Estelí 1.8 11.0 0.3 0.9 0.3 4.0 260 259Chinandega 2.8 16.7 0.0 0.2 1.1 6.9 530 375León 2.0 10.4 0.0 0.2 0.7 4.7 484 349Matagalpa 6.6 26.2 0.0 0.3 0.8 8.9 774 514Boaco 2.9 10.9 0.0 2.0 1.6 6.8 191 250Managua 2.3 10.6 0.3 1.5 0.4 5.5 1,581 584Masaya 4.0 14.4 0.0 0.2 0.0 4.1 422 339Chontales 5.7 13.5 0.0 0.0 0.5 4.2 145 185Granada 0.6 8.6 0.0 0.6 0.3 3.4 244 263Carazo 2.2 10.0 0.0 0.4 0.0 4.1 195 220Rivas 1.1 5.9 0.3 1.1 0.0 6.5 244 292Río San Juan 5.2 17.0 0.0 0.8 0.3 5.4 153 339RAAN 6.5 24.2 0.1 1.7 0.6 9.4 584 528RAAS 3.1 13.1 0.0 0.7 0.3 3.7 555 459
WEALTH QUINTILE1 - Low 8.2 28.0 0.2 1.2 1.2 11.3 2,290 2,2502 - Medium-Low 3.6 18.5 0.1 0.7 0.3 7.0 1,610 1,4463 - Intermediate 3.7 13.6 0.1 1.0 0.5 6.9 1,465 1,0824 - Medium-High 1.6 7.5 0.0 1.1 0.3 2.3 1,189 8345 - High 0.8 4.5 0.2 0.5 0.2 2.2 974 560
EDUCATION LEVELNo schooling 8.9 29.1 0.2 1.3 1.3 11.6 1,366 1,305Primary 1-3 5.5 23.4 0.1 0.6 0.6 10.1 1,203 1,079Primary 4-6 3.7 17.2 0.2 1.4 0.6 7.2 1,983 1,715Secondary 2.4 9.5 0.1 0.8 0.4 3.8 2,302 1,602Post secondary 1.5 4.8 0.0 0.0 0.0 1.4 674 471
AGE OF CHILD (MONTHS)< 6 0.8 6.4 0.0 0.6 0.0 0.7 394 3276-9 1.9 9.0 0.3 0.3 0.2 3.2 513 41910-11 2.4 13.2 0.2 1.5 0.5 8.1 325 25312-23 5.8 17.9 0.2 1.5 1.4 9.0 1,661 1,33024-35 3.9 16.8 0.1 0.7 0.6 7.8 1,567 1,26136-47 4.6 18.5 0.0 0.9 0.4 7.2 1,573 1,30248-59 5.1 20.4 0.2 0.9 0.4 6.1 1,497 1,280
SEX OF CHILDMale 4.3 17.2 0.2 0.7 0.6 7.0 3,770 3,097Female 4.4 16.6 0.1 1.2 0.7 6.9 3,759 3,075
MOTHER’S AGE AT BIRTH< 20 4.3 18.0 0.1 0.7 0.4 6.6 2,031 1,49920-34 4.3 16.0 0.1 1.0 0.7 6.8 4,876 4,186 35+ 5.2 19.9 0.2 1.0 0.6 9.2 621 487
BIRTH ORDER 1 2.7 12.9 0.2 0.9 0.4 4.7 2,746 1,9802-3 4.3 15.9 0.1 0.8 0.7 6.9 2,993 2,5774-5 6.0 21.5 0.2 1.2 0.7 10.0 1,021 9526+ 8.3 29.0 0.2 1.4 1.1 10.9 768 663
PREVIOUS BIRTHINTERVAL (MONTHS)1st Birth 2.7 12.9 0.2 0.9 0.4 4.7 2,746 1,980< 24 9.0 25.7 0.1 0.8 1.0 11.2 831 69924-47 6.3 24.0 0.2 1.6 0.8 9.4 1,911 1,665 48+ 2.9 11.9 0.0 0.5 0.6 5.7 2,026 1,820
TOTAL 4.3 16.9 0.1 1.0 0.6 6.9 7,515 6,164Notes: Low and very-low values on each indicator refer to being more than 2 and 3 standard deviations below the mean value based on the reference population and indicate total and severe or extreme values, respectively. Th e reference is the NCHS/CDC/WHO. Subsequent publications will include both the NCHS and the recent WHO reference.
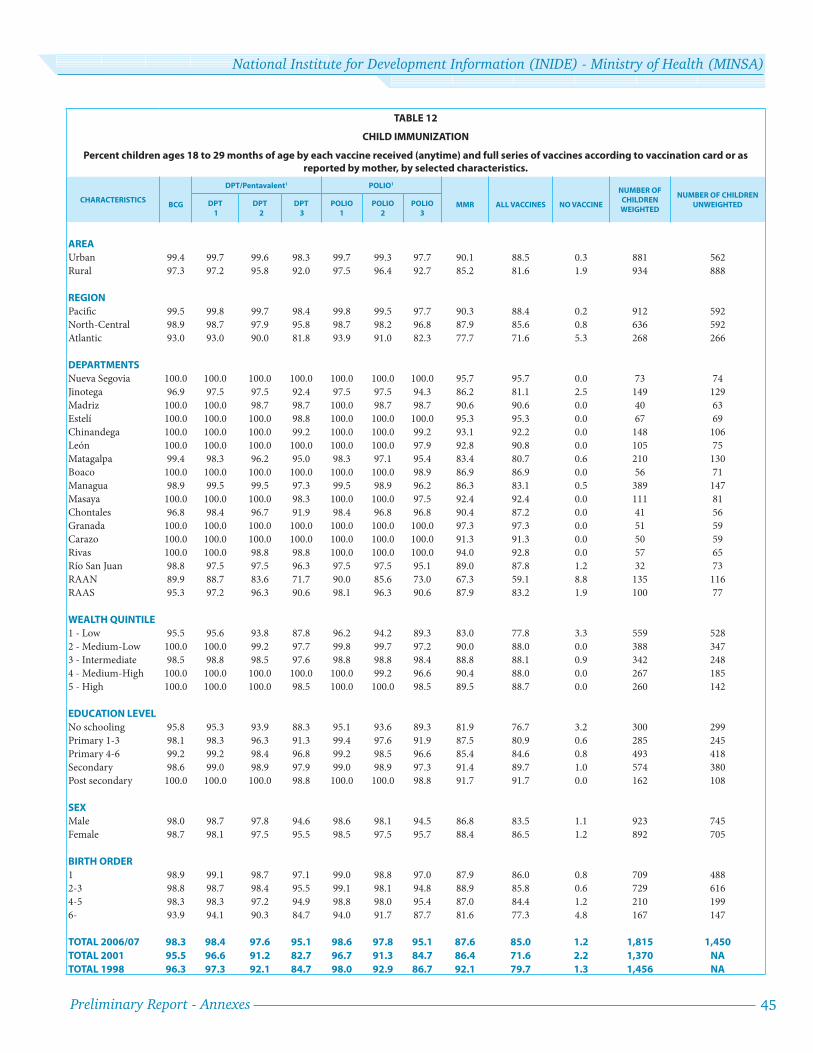
Preliminary Report - Annexes 45
National Institute for Development Information (INIDE) - Ministry of Health (MINSA)
TABLE 12
CHILD IMMUNIZATION
Percent children ages 18 to 29 months of age by each vaccine received (anytime) and full series of vaccines according to vaccination card or as reported by mother, by selected characteristics.
CHARACTERISTICSBCG
DPT/Pentavalent1 POLIO1
MMR ALL VACCINES NO VACCINE
NUMBER OF
CHILDREN
WEIGHTED
NUMBER OF CHILDREN
UNWEIGHTEDDPT
1
DPT
2
DPT
3
POLIO
1
POLIO
2
POLIO
3
AREA
Urban 99.4 99.7 99.6 98.3 99.7 99.3 97.7 90.1 88.5 0.3 881 562
Rural 97.3 97.2 95.8 92.0 97.5 96.4 92.7 85.2 81.6 1.9 934 888
REGION
Pacifi c 99.5 99.8 99.7 98.4 99.8 99.5 97.7 90.3 88.4 0.2 912 592
North-Central 98.9 98.7 97.9 95.8 98.7 98.2 96.8 87.9 85.6 0.8 636 592
Atlantic 93.0 93.0 90.0 81.8 93.9 91.0 82.3 77.7 71.6 5.3 268 266
DEPARTMENTS
Nueva Segovia 100.0 100.0 100.0 100.0 100.0 100.0 100.0 95.7 95.7 0.0 73 74
Jinotega 96.9 97.5 97.5 92.4 97.5 97.5 94.3 86.2 81.1 2.5 149 129
Madriz 100.0 100.0 98.7 98.7 100.0 98.7 98.7 90.6 90.6 0.0 40 63
Estelí 100.0 100.0 100.0 98.8 100.0 100.0 100.0 95.3 95.3 0.0 67 69
Chinandega 100.0 100.0 100.0 99.2 100.0 100.0 99.2 93.1 92.2 0.0 148 106
León 100.0 100.0 100.0 100.0 100.0 100.0 97.9 92.8 90.8 0.0 105 75
Matagalpa 99.4 98.3 96.2 95.0 98.3 97.1 95.4 83.4 80.7 0.6 210 130
Boaco 100.0 100.0 100.0 100.0 100.0 100.0 98.9 86.9 86.9 0.0 56 71
Managua 98.9 99.5 99.5 97.3 99.5 98.9 96.2 86.3 83.1 0.5 389 147
Masaya 100.0 100.0 100.0 98.3 100.0 100.0 97.5 92.4 92.4 0.0 111 81
Chontales 96.8 98.4 96.7 91.9 98.4 96.8 96.8 90.4 87.2 0.0 41 56
Granada 100.0 100.0 100.0 100.0 100.0 100.0 100.0 97.3 97.3 0.0 51 59
Carazo 100.0 100.0 100.0 100.0 100.0 100.0 100.0 91.3 91.3 0.0 50 59
Rivas 100.0 100.0 98.8 98.8 100.0 100.0 100.0 94.0 92.8 0.0 57 65
Río San Juan 98.8 97.5 97.5 96.3 97.5 97.5 95.1 89.0 87.8 1.2 32 73
RAAN 89.9 88.7 83.6 71.7 90.0 85.6 73.0 67.3 59.1 8.8 135 116
RAAS 95.3 97.2 96.3 90.6 98.1 96.3 90.6 87.9 83.2 1.9 100 77
WEALTH QUINTILE
1 - Low 95.5 95.6 93.8 87.8 96.2 94.2 89.3 83.0 77.8 3.3 559 528
2 - Medium-Low 100.0 100.0 99.2 97.7 99.8 99.7 97.2 90.0 88.0 0.0 388 347
3 - Intermediate 98.5 98.8 98.5 97.6 98.8 98.8 98.4 88.8 88.1 0.9 342 248
4 - Medium-High 100.0 100.0 100.0 100.0 100.0 99.2 96.6 90.4 88.0 0.0 267 185
5 - High 100.0 100.0 100.0 98.5 100.0 100.0 98.5 89.5 88.7 0.0 260 142
EDUCATION LEVEL
No schooling 95.8 95.3 93.9 88.3 95.1 93.6 89.3 81.9 76.7 3.2 300 299
Primary 1-3 98.1 98.3 96.3 91.3 99.4 97.6 91.9 87.5 80.9 0.6 285 245
Primary 4-6 99.2 99.2 98.4 96.8 99.2 98.5 96.6 85.4 84.6 0.8 493 418
Secondary 98.6 99.0 98.9 97.9 99.0 98.9 97.3 91.4 89.7 1.0 574 380
Post secondary 100.0 100.0 100.0 98.8 100.0 100.0 98.8 91.7 91.7 0.0 162 108
SEX
Male 98.0 98.7 97.8 94.6 98.6 98.1 94.5 86.8 83.5 1.1 923 745
Female 98.7 98.1 97.5 95.5 98.5 97.5 95.7 88.4 86.5 1.2 892 705
BIRTH ORDER
1 98.9 99.1 98.7 97.1 99.0 98.8 97.0 87.9 86.0 0.8 709 488
2-3 98.8 98.7 98.4 95.5 99.1 98.1 94.8 88.9 85.8 0.6 729 616
4-5 98.3 98.3 97.2 94.9 98.8 98.0 95.4 87.0 84.4 1.2 210 199
6- 93.9 94.1 90.3 84.7 94.0 91.7 87.7 81.6 77.3 4.8 167 147
TOTAL 2006/07 98.3 98.4 97.6 95.1 98.6 97.8 95.1 87.6 85.0 1.2 1,815 1,450
TOTAL 2001 95.5 96.6 91.2 82.7 96.7 91.3 84.7 86.4 71.6 2.2 1,370 NA
TOTAL 1998 96.3 97.3 92.1 84.7 98.0 92.9 86.7 92.1 79.7 1.3 1,456 NA
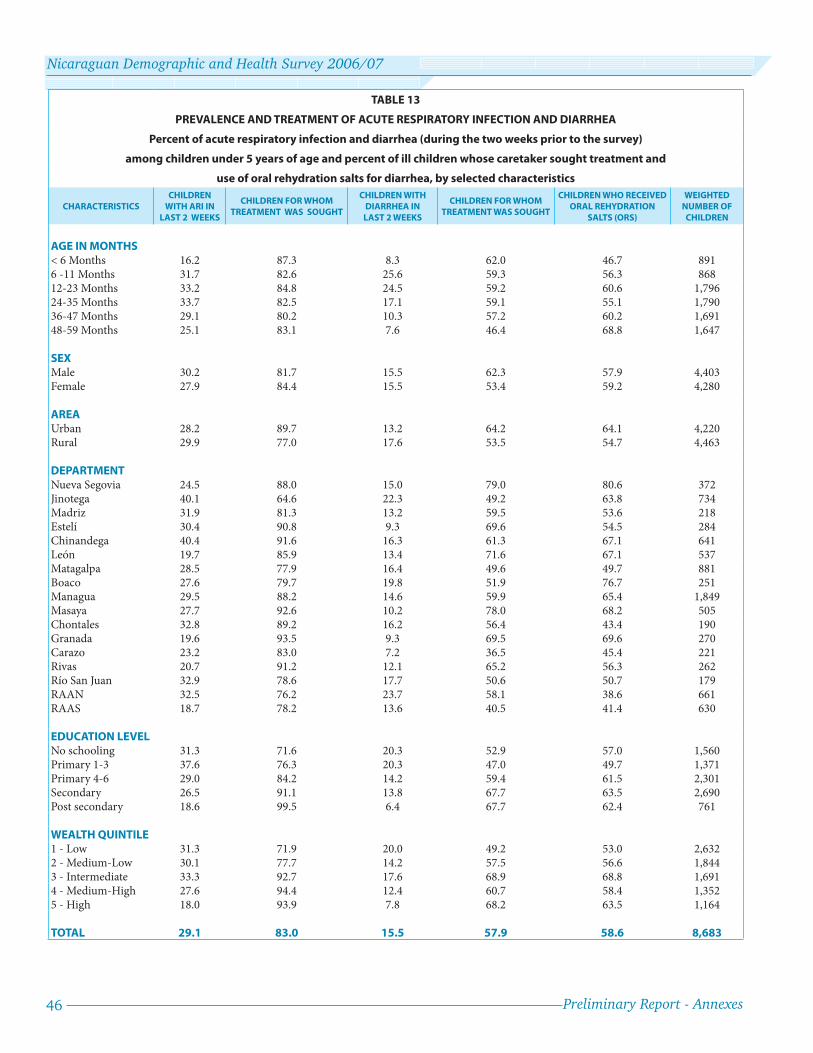
46 Preliminary Report - Annexes
Nicaraguan Demographic and Health Survey 2006/07
TABLE 13
PREVALENCE AND TREATMENT OF ACUTE RESPIRATORY INFECTION AND DIARRHEA
Percent of acute respiratory infection and diarrhea (during the two weeks prior to the survey)
among children under 5 years of age and percent of ill children whose caretaker sought treatment and
use of oral rehydration salts for diarrhea, by selected characteristics
CHARACTERISTICS
CHILDREN
WITH ARI IN
LAST 2 WEEKS
CHILDREN FOR WHOM
TREATMENT WAS SOUGHT
CHILDREN WITH
DIARRHEA IN
LAST 2 WEEKS
CHILDREN FOR WHOM
TREATMENT WAS SOUGHT
CHILDREN WHO RECEIVED
ORAL REHYDRATION
SALTS (ORS)
WEIGHTED
NUMBER OF
CHILDREN
AGE IN MONTHS< 6 Months 16.2 87.3 8.3 62.0 46.7 8916 -11 Months 31.7 82.6 25.6 59.3 56.3 86812-23 Months 33.2 84.8 24.5 59.2 60.6 1,79624-35 Months 33.7 82.5 17.1 59.1 55.1 1,79036-47 Months 29.1 80.2 10.3 57.2 60.2 1,69148-59 Months 25.1 83.1 7.6 46.4 68.8 1,647
SEXMale 30.2 81.7 15.5 62.3 57.9 4,403Female 27.9 84.4 15.5 53.4 59.2 4,280
AREAUrban 28.2 89.7 13.2 64.2 64.1 4,220Rural 29.9 77.0 17.6 53.5 54.7 4,463
DEPARTMENTNueva Segovia 24.5 88.0 15.0 79.0 80.6 372Jinotega 40.1 64.6 22.3 49.2 63.8 734Madriz 31.9 81.3 13.2 59.5 53.6 218Estelí 30.4 90.8 9.3 69.6 54.5 284Chinandega 40.4 91.6 16.3 61.3 67.1 641León 19.7 85.9 13.4 71.6 67.1 537Matagalpa 28.5 77.9 16.4 49.6 49.7 881Boaco 27.6 79.7 19.8 51.9 76.7 251Managua 29.5 88.2 14.6 59.9 65.4 1,849Masaya 27.7 92.6 10.2 78.0 68.2 505Chontales 32.8 89.2 16.2 56.4 43.4 190Granada 19.6 93.5 9.3 69.5 69.6 270Carazo 23.2 83.0 7.2 36.5 45.4 221Rivas 20.7 91.2 12.1 65.2 56.3 262Río San Juan 32.9 78.6 17.7 50.6 50.7 179RAAN 32.5 76.2 23.7 58.1 38.6 661RAAS 18.7 78.2 13.6 40.5 41.4 630
EDUCATION LEVELNo schooling 31.3 71.6 20.3 52.9 57.0 1,560Primary 1-3 37.6 76.3 20.3 47.0 49.7 1,371Primary 4-6 29.0 84.2 14.2 59.4 61.5 2,301Secondary 26.5 91.1 13.8 67.7 63.5 2,690Post secondary 18.6 99.5 6.4 67.7 62.4 761
WEALTH QUINTILE1 - Low 31.3 71.9 20.0 49.2 53.0 2,6322 - Medium-Low 30.1 77.7 14.2 57.5 56.6 1,8443 - Intermediate 33.3 92.7 17.6 68.9 68.8 1,6914 - Medium-High 27.6 94.4 12.4 60.7 58.4 1,3525 - High 18.0 93.9 7.8 68.2 63.5 1,164
TOTAL 29.1 83.0 15.5 57.9 58.6 8,683

Preliminary Report - Annexes 47
National Institute for Development Information (INIDE) - Ministry of Health (MINSA)
TABLE 14a
INFANT AND CHILD MORTALITY IN 5-YEAR PERIOD PRIOR TO SURVEY
Neonatal, post-neonatal, infant, and child mortality for 5-year period prior to survey,
by selected characteristics
RESIDENCENEONATAL
( < 29 DAYS) (NM)POST-NEONATAL 1 (1-11 MOS.) (PNM)
INFANT (< 12 MOS.) (1q0)
CHILD (1-4 YEARS) (4q1)
0-4 YEARS (5q0)
AREA
Urban 14 10 24 7 31
Rural 18 16 34 6 40
REGION
Pacifi c 15 10 26 5 30
North-Central 14 13 27 9 35
Atlantic 22 21 43 7 50
WEALTH QUINTILE
1 - Low 17 18 35 8 43
2 - Medium-Low 17 17 33 8 41
3 - Intermediate 14 11 24 4 28
4 - Medium-High 17 8 25 8 33
5 - High 13 6 19 2 21
EDUCATION LEVEL
No schooling 22 32 54 12 66
Primary 1-3 21 12 33 7 40
Primary 4-6 13 13 25 5 31
Secondary 12 5 17 5 22
Post secondary 15 4 19 0 19
TOTAL 2006/07 16 13 29 7 35
TOTAL 2001 16 15 31 7 38
TOTAL 1998 17 22 39 11 50
TOTAL 1992/93 20 38 58 15 72
Note: All rates based on more than 500 cases (person-time at risk)
1 Calculated as the diff erence between infant and neonatal mortality.

48 Preliminary Report - Annexes
Nicaraguan Demographic and Health Survey 2006/07
TABLE 14b
INFANT AND CHILD MORTALITY IN 10-YEAR PERIOD PRIOR TO SURVEY
Neonatal, post-neonatal, infant, and child mortality for 10-year period prior to survey,
by selected characteristics
RESIDENCENEONATAL
( < 29 DAYS) (NM) POST-NEONATAL 1 (1-11 MOS.) (PNM)
INFANT (< 12 MOS.) (1q0)
CHILD (1-4 YEARS) (4q1)
0-4 YEARS (5q0)
AREAUrban 16 13 29 6 35Rural 19 18 37 11 47
REGIONPacifi c 18 13 31 4 35North-Central 16 15 31 12 42Atlantic 20 24 44 14 57
DEPARTMENTNueva Segovia 18 10 28 11 38Jinotega 14 22 36 14 50Madriz 21 12 33 11 43Estelí 8 15 23 3 26Chinandega 18 10 28 6 34León 12 12 24 3 27Matagalpa 18 13 31 15 45Boaco 16 8 24 10 34Managua 20 16 36 4 40Masaya 17 9 25 7 32Chontales 22 17 39 7 45Granada 16 9 25 0 25Carazo 22 22 44 1 45Rivas 10 4 14 1 16Río San Juan 14 14 28 6 33R.A.A.N. 22 32 54 17 70R.A.A.S. 19 19 38 13 51
WEALTH QUINTILE1 - Low 19 20 38 14 512 - Medium-Low 16 21 38 10 473 - Intermediate 15 14 29 5 334 - Medium-High 20 9 28 5 34
5 - High 18 7 25 2 26
EDUCATION LEVELNo schooling 19 32 51 18 67Primary 1-3 21 18 39 10 49Primary 4-6 17 12 29 6 35Secondary 14 8 22 4 26Post secondary 24 3 27 1 29
TOTAL 2006/07 18 16 33 8 41
TOTAL 2001 17 19 35 10 45
TOTAL 1998 20 25 45 11 56
Note: All rates based on more than 500 cases (person-time at risk)
1 Calculated as the diff erence between infant and neonatal mortality.

Preliminary Report - Annexes 49
National Institute for Development Information (INIDE) - Ministry of Health (MINSA)
TABLE 15
KNOWLEDGE OF HIV / AIDS
Percent of women who have heard of HIV/AIDS, know that there are diff erent ways to prevent transmission,
and know that condoms can prevent transmission, by selected characteristics
CHARACTERISTICSHEARD OF HIV/AIDS -
SPONTANEOUS
HEARD OF HIV/AIDS - DIRECTED
HEARD OF HIV/AIDS - SPONTA-
NEOUSLY OR DIRECTED
KNOWS ONE OR MORE WAYS
TO PREVENT INFECTION
KNOWS CONDOMS AS A
WAY TO PREVENT INFECTION
KNOWS ABSTINENCE, ONLY ONE SEXUAL PARTNER, AND USE
OF CONDOMS IN ALL RELATIONSHIPS (SPONTANEOUS OR
DIRECTED)
KNOWS SPONTANEOUSLY ABSTINENCE, ONLY
ONE SEXUAL PARTNER, AND USE OF CONDOMSIN ALL RELATIONSHIPS
NUMBER OF WOMEN WEIGHTED
NUMBER OF WOMEN
UNWEIGHTED
AREAUrban 82.0 17.5 99.4 97.8 93.1 77.1 12.7 12,614 7,118Rural 66.8 28.2 95.0 94.8 87.4 75.0 6.8 8,471 7,103
REGIONPacifi c 82.1 17.1 99.2 97.7 93.1 76.7 12.4 11,944 6,376North-Central 70.2 26.3 96.4 95.6 89.2 76.4 7.7 6,326 5,329Atlantic 62.5 31.4 93.9 93.8 84.9 74.0 7.7 2,816 2,516
DEPARTMENTNueva Segovia 74.9 20.9 95.8 96.7 88.4 73.2 11.3 830 740Jinotega 67.9 25.9 93.8 97.0 92.5 79.9 4.7 1,127 869Madriz 80.1 16.6 96.7 95.3 91.3 82.1 8.2 521 679Estelí 73.7 25.6 99.3 97.7 93.7 82.5 6.5 845 730Chinandega 82.3 17.2 99.5 95.2 92.0 75.1 10.8 1,586 959León 82.3 16.9 99.2 97.1 90.8 69.2 8.5 1,615 974Matagalpa 65.7 30.9 96.5 94.7 87.0 74.0 10.1 1,826 1,051Boaco 64.6 32.3 96.9 92.0 85.2 71.1 3.9 576 636Managua 83.9 15.5 99.4 98.2 93.8 77.5 15.2 5,598 1,733Masaya 76.3 22.6 98.9 98.9 94.9 84.5 11.6 1,207 828Chontales 73.2 23.9 97.1 94.9 86.6 72.9 6.4 601 624Granada 79.4 18.1 97.5 98.2 89.4 75.4 8.5 670 638Carazo 80.4 18.8 99.2 98.3 93.9 76.9 9.0 649 620Rivas 80.0 19.3 99.3 98.6 95.2 79.4 11.2 619 624Río San Juan 72.6 26.6 99.2 97.5 92.5 76.2 3.0 401 735RAAN 58.3 30.6 88.9 91.4 82.1 73.2 5.3 1,076 827RAAS 62.9 33.4 96.3 94.4 84.6 73.8 10.9 1,339 954
WEALTH QUINTILE1 - Low 58.4 33.6 92.0 92.8 83.5 72.6 4.5 4,035 3,4962 - Medium-Low 71.8 25.2 97.0 96.3 89.9 76.2 7.5 4,012 3,1643 - Intermediate 80.0 19.5 99.5 96.7 92.1 76.8 9.1 4,213 2,8224 - Medium-High 83.0 16.4 99.4 97.9 94.3 78.5 12.3 4,529 2,6215 - High 84.6 15.3 99.9 98.6 93.3 76.6 17.5 4,296 2,118
EDUCATION LEVELNo schooling 51.3 38.4 89.7 92.7 83.1 72.7 3.9 2,563 2,200Primary 1-3 63.2 32.7 95.9 95.8 87.4 75.4 6.1 2,532 1,986Primary 4-6 74.6 23.5 98.2 96.0 90.2 75.3 7.1 5,325 3,880Secondary 84.8 14.9 99.6 97.8 93.5 77.4 12.6 7,767 4,492Post secondary 87.1 12.9 100.0 98.3 94.2 78.4 19.2 2,898 1,663
MARITAL STATUSMarried / In-union 73.1 24.4 97.5 97.0 91.5 77.8 10.8 11,802 9,420Sep./Div./Widowed 73.5 24.2 97.7 96.4 90.8 75.3 10.3 3,449 2,027Never in union 82.9 15.0 97.9 95.8 89.6 73.7 9.7 5,834 2,774
AGE15-19 78.8 18.1 96.9 95.3 87.6 71.3 7.6 4,935 2,60820-24 79.7 18.3 98.0 96.8 92.3 78.2 11.0 4,241 2,75825-29 75.7 22.5 98.2 96.8 91.9 77.5 10.9 3,264 2,63830-34 74.8 22.9 97.7 97.0 92.9 77.5 11.1 2,720 2,26035-39 73.4 24.4 97.7 97.3 92.1 78.0 12.2 2,206 1,68340-44 73.4 24.5 97.9 97.0 91.6 79.3 11.9 2,033 1,28345-49 66.2 31.3 97.6 97.6 89.0 75.5 11.0 1,686 991
TOTAL 75.9 21.8 97.7 96.6 90.9 76.3 10.4 21,085 14,221

50 Preliminary Report - Annexes
Nicaraguan Demographic and Health Survey 2006/07
TABLE 16a
LIFETIME PREVALENCE OF DIFFERENT TYPES OF VIOLENCE
Percent of ever-married women who have experienced verbal, physical or sexual violence during their lifetime,
by selected characteristics
CHARACTERISTICSVERBAL
VIOLENCE (LIFETIME)
PHYSICAL VIOLENCE (LIFETIME)
SEXUAL VIOLENCE (LIFETIME)
PHYSICAL OR SEXUAL VIOLENCE (LIFETIME)
TOTAL
NO. OF WOMEN WEIGHTED
NO. OF WOMEN UNWEIGHTED
AREAUrban 51.5 29.7 14.9 32.6 8,664 5,407Rural 42.9 23.2 10.6 25.1 6,504 5,986
REGIONPacifi c 50.3 29.2 15.1 32.0 8,353 4,936North-Central 42.6 22.1 10.2 24.0 4,700 4,362Atlantic 49.7 29.0 11.8 30.7 2,114 2,095
DEPARTMENTNueva Segovia 44.3 18.6 8.5 20.9 635 622Jinotega 41.3 20.6 9.8 22.7 875 746Madriz 40.5 19.1 6.9 20.2 344 521Estelí 47.2 24.5 14.1 27.7 600 570Chinandega 50.5 26.4 15.3 29.9 1,118 750León 52.7 25.6 13.9 27.2 1,057 732Matagalpa 39.7 22.3 8.9 23.5 1,384 877Boaco 39.8 22.0 10.5 23.9 414 510Managua 50.7 30.8 16.3 34.1 4,046 1,379Masaya 48.7 31.0 16.5 34.9 801 622Chontales 49.8 28.1 13.8 30.5 448 516Granada 51.1 29.2 11.6 30.5 449 482Carazo 41.9 24.4 9.8 24.7 437 472Rivas 49.9 31.6 12.1 33.0 445 499Río San Juan 60.4 26.4 13.3 29.0 312 626RAAN 51.8 31.7 14.8 33.6 809 685RAAS 44.6 27.7 9.0 28.8 993 784
WEALTH QUINTILE1 - Low 42.4 23.9 10.2 25.9 3,166 3,0132 - Medium-Low 47.4 27.5 12.9 29.2 3,029 2,6143 - Intermediate 52.6 30.2 15.7 32.5 3,086 2,2564 - Medium-High 50.4 28.5 13.4 31.3 3,051 1,9795 - High 46.2 24.7 13.2 27.7 2,834 1,531
EDUCATION LEVELNo schooling 50.1 30.3 13.3 31.8 2,353 2,078Primary 1-3 49.1 30.3 15.0 33.2 2,211 1,804Primary 4-6 47.6 26.8 12.5 29.0 4,064 3,229Secondary 47.5 26.2 13.5 29.1 4,735 3,108Post secondary 44.6 20.8 10.7 22.8 1,804 1,174
MARITAL STATUSMarried / In-union 43.7 23.8 11.1 25.8 11,730 9,369Separated/Div./Widowed 61.7 37.9 20.0 41.4 3,437 2,024
AGE15-19 32.8 14.5 6.3 16.0 1,486 1,00320-24 41.8 20.2 9.1 22.9 2,796 2,13225-29 46.3 26.1 12.1 28.5 2,793 2,37830-34 49.5 28.8 13.2 31.1 2,464 2,11235-39 52.3 31.2 16.0 33.1 2,089 1,60040-44 56.8 33.5 17.1 35.6 1,926 1,22245-49 55.6 35.3 19.3 39.2 1,613 946
TOTAL 47.8 27.0 13.1 29.3 15,167 11,393
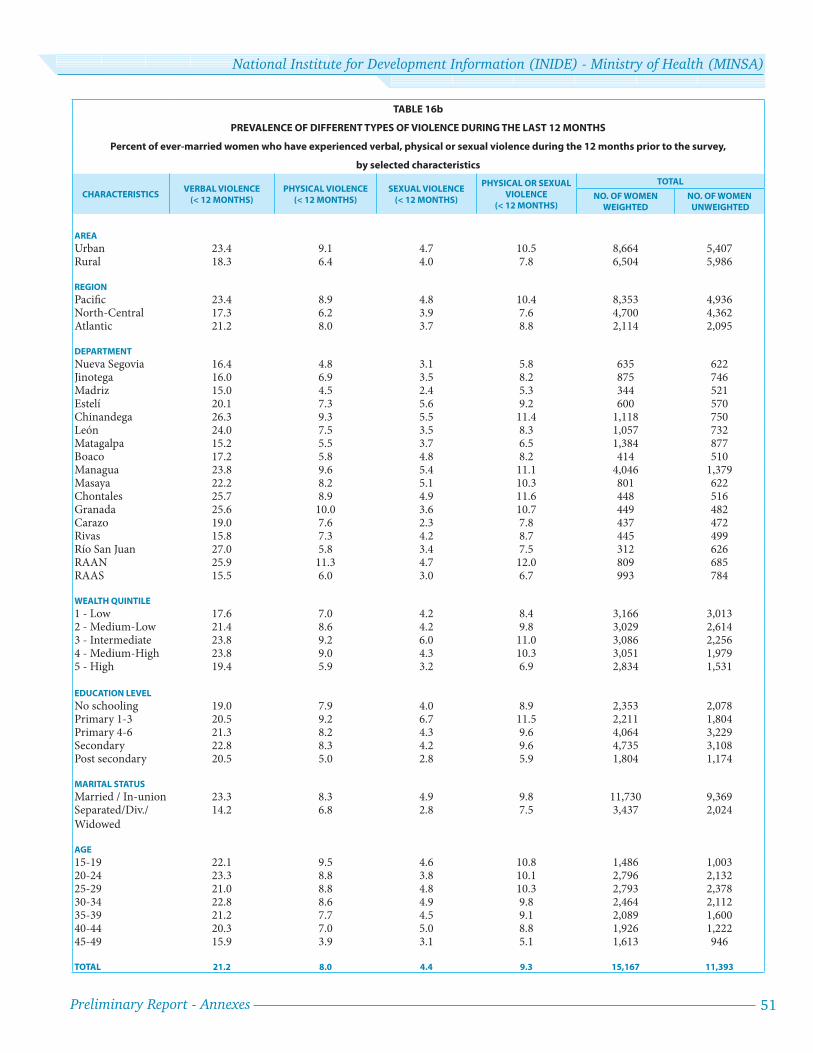
Preliminary Report - Annexes 51
National Institute for Development Information (INIDE) - Ministry of Health (MINSA)
TABLE 16b
PREVALENCE OF DIFFERENT TYPES OF VIOLENCE DURING THE LAST 12 MONTHS
Percent of ever-married women who have experienced verbal, physical or sexual violence during the 12 months prior to the survey,
by selected characteristics
CHARACTERISTICSVERBAL VIOLENCE
(< 12 MONTHS)
PHYSICAL VIOLENCE
(< 12 MONTHS)
SEXUAL VIOLENCE
(< 12 MONTHS)
PHYSICAL OR SEXUAL
VIOLENCE
(< 12 MONTHS)
TOTAL
NO. OF WOMEN
WEIGHTED
NO. OF WOMEN
UNWEIGHTED
AREA
Urban 23.4 9.1 4.7 10.5 8,664 5,407Rural 18.3 6.4 4.0 7.8 6,504 5,986
REGION
Pacifi c 23.4 8.9 4.8 10.4 8,353 4,936North-Central 17.3 6.2 3.9 7.6 4,700 4,362Atlantic 21.2 8.0 3.7 8.8 2,114 2,095
DEPARTMENT
Nueva Segovia 16.4 4.8 3.1 5.8 635 622Jinotega 16.0 6.9 3.5 8.2 875 746Madriz 15.0 4.5 2.4 5.3 344 521Estelí 20.1 7.3 5.6 9.2 600 570Chinandega 26.3 9.3 5.5 11.4 1,118 750León 24.0 7.5 3.5 8.3 1,057 732Matagalpa 15.2 5.5 3.7 6.5 1,384 877Boaco 17.2 5.8 4.8 8.2 414 510Managua 23.8 9.6 5.4 11.1 4,046 1,379Masaya 22.2 8.2 5.1 10.3 801 622Chontales 25.7 8.9 4.9 11.6 448 516Granada 25.6 10.0 3.6 10.7 449 482Carazo 19.0 7.6 2.3 7.8 437 472Rivas 15.8 7.3 4.2 8.7 445 499Río San Juan 27.0 5.8 3.4 7.5 312 626RAAN 25.9 11.3 4.7 12.0 809 685RAAS 15.5 6.0 3.0 6.7 993 784
WEALTH QUINTILE
1 - Low 17.6 7.0 4.2 8.4 3,166 3,0132 - Medium-Low 21.4 8.6 4.2 9.8 3,029 2,6143 - Intermediate 23.8 9.2 6.0 11.0 3,086 2,2564 - Medium-High 23.8 9.0 4.3 10.3 3,051 1,9795 - High 19.4 5.9 3.2 6.9 2,834 1,531
EDUCATION LEVEL
No schooling 19.0 7.9 4.0 8.9 2,353 2,078Primary 1-3 20.5 9.2 6.7 11.5 2,211 1,804Primary 4-6 21.3 8.2 4.3 9.6 4,064 3,229Secondary 22.8 8.3 4.2 9.6 4,735 3,108Post secondary 20.5 5.0 2.8 5.9 1,804 1,174
MARITAL STATUS
Married / In-union 23.3 8.3 4.9 9.8 11,730 9,369Separated/Div./Widowed
14.2 6.8 2.8 7.5 3,437 2,024
AGE
15-19 22.1 9.5 4.6 10.8 1,486 1,00320-24 23.3 8.8 3.8 10.1 2,796 2,13225-29 21.0 8.8 4.8 10.3 2,793 2,37830-34 22.8 8.6 4.9 9.8 2,464 2,11235-39 21.2 7.7 4.5 9.1 2,089 1,60040-44 20.3 7.0 5.0 8.8 1,926 1,22245-49 15.9 3.9 3.1 5.1 1,613 946
TOTAL 21.2 8.0 4.4 9.3 15,167 11,393

