new york state green bank report
TRANSCRIPT

Client Logo
New York State Green Bank Business Plan Development
Final Report, September 3rd 2013

Booz & Company 1
Legal Disclaimers
General
The terms of this disclaimer (hereinafter referred to as "Disclaimer") apply to this document, entitled "New York State Green Bank: Business Plan Development"
and any later versions of this document. Please read this Disclaimer carefully. By accessing this document you agree to be bound by this Disclaimer.
Use of this Document
This document was prepared by Booz & Company (N.A.) Inc. (“Booz”) at the request of NYSERDA and is based on information provided by NYSERDA and other
sources deemed to be reliable. Analyses and projections represent Booz’s judgment, based on the data sources cited and are subject to the validity of the
assumptions noted in this document. For purposes of the analysis in this document, Booz has relied upon and considered accurate and complete, and at the time
of initial issuance of this document is not aware of any error in, data obtained from the sources cited but has not independently verified the completeness or
accuracy of the data. All estimates and projections contained in this document are based on data obtained from the sources cited and involve elements of
subjective judgment and analysis.
Exclusion of Liability
Neither Booz & Company nor any of its agents or subcontractors shall be liable for any direct, indirect, special, incidental, consequential, punitive, or exemplary
damages, including lost profits arising in any way from, including but not limited to, (i) the information provided in this document, and (ii) claims of third parties in
connection with the use of this document.
Applicable Law
This document and its Disclaimer shall be governed by and construed in accordance with the laws of New York State. All disputes arising out of or in connection
with this Disclaimer shall be submitted to the exclusive jurisdiction of the courts of New York State.

Booz & Company
Booz & Company concludes that the Green Bank is a viable use of ratepayer funds to accelerate the deployment of clean energy in NY
2
In January 2013, Governor Andrew Cuomo proposed the creation of a $1B Green Bank to mobilize private capital and accelerate the deployment of
clean energy; pursuant to this, Booz & Company was retained to assess the market opportunity of this proposal
After conducting market interviews, concept testing workshops, industry research, and financial modeling, Booz & Company has found that the
New York Green Bank is a viable endeavor that will, when implemented consistent with the guidance provided herein, add significant
value to the State's clean energy portfolio
– There are multiple clean energy financial barriers the Green Bank can eliminate to facilitate the flow of private capital to areas of the market that are not served by traditional and non-traditional lenders
– Market participants indicate a high degree of enthusiasm for partnering with the Green Bank
– The proposed $1B in capitalization is consistent with Booz & Company’s market sizing analysis (estimated market size of ~$85B)
– A Green Bank offers multiple unique benefits, including increased value of ratepayer dollars through leveraging private capital, catalyzing market transformation, and generating a host of other public goods (e.g. cleaner environment, system resilience, job creation, etc.)
– This type of public / private partnership is an emerging trend that is slowly gaining traction both domestically and globally; NY State has an opportunity to become a market leader with the Green Bank
The Green Bank model should be enabled by the following:
– Flexibility: The Green Bank management team must operate with a flexible mandate in order to be able to respond to a dynamic marketplace and to manage a portfolio that optimizes the risk / reward trade-off; the risks of being inflexible include potentially “crowding out” the private sector and “getting stuck in an unfavorable market”
– Strategic Partnerships: Strategic partnerships are a key success factor for the Green Bank to operate as a wholesaler
– Longitudinal Sustainability: There must be public confidence that the institution will be capitalized with the required level of funding to meet the Governor’s stated objectives and remain in place for multiple years
– Supporting Policy: A policy framework must be created to ensure that Green Bank products are coordinated with other state/ rate-payer funded incentives to optimize the return to the ratepayers and to the State at large
However, multiple risk factors require management attention:
– Financial risk: Green Bank leadership must have a solid understanding of credit markets to enable dynamic risk management, i.e. the ability to identify and mitigate risks as they arise
– Market positioning: The Green Bank will introduce a new business model into the marketplace and in order to maximize its effectiveness needs to carefully position itself alongside private sector entities and coordinate with State and utility incentives, grants and rebate programs
– Organizational standup: Successful capital deployment depends on the Green Bank’s ability to rapidly build a unique set of capabilities, hire and retain personnel with relevant backgrounds and skill sets, and implement supporting governance structures

Booz & Company
Green Bank Overview
Market Assessment
Quantitative Analysis
Operating Model
Appendix
3

Booz & Company
In January 2013, Governor Cuomo proposed a $1B Green Bank to mobilize private capital and accelerate clean energy deployment
4
Mandate of the Green Bank:
Source: 2013 State of the State - NY Rising, NY State Green Bank Steering Committee
Green Bank Overview
To accelerate deployment of clean energy by removing barriers in financing markets. It will
not compete with private sector entities but will instead partner with them, nor will its principal
role be to provide subsidy. The Bank will focus its activities on clean energy projects that are
economically viable but not currently financeable.
Key objectives of the Green Bank:
1. Provide a bridge to a sustainable and efficient private market that offers clean energy financing services
2. Remove barriers to financing energy efficiency and renewables, and move on once a market is established
3. Partner alongside financial institutions to leverage both their capabilities and investment dollars
4. Work with other entities to evolve clean energy capital markets (in particular, the bond markets)
5. Enhance market confidence in clean energy investing
1
2
3
4
5

Booz & Company
The primary benefit of the Green Bank is its ability to expand private investment in clean energy at a lower cost to ratepayers
5
Drive Value for
Ratepayers by
Leveraging Private
Capital
Benefits of the Green Bank
Provide Public
Benefits
Transform
the Market
One of the key strengths of the Green Bank is its ability to expand private investment in clean
energy at a lower cost to ratepayers by leveraging multiples of private capital and to redeploy
them once investments mature
The Green Bank can drive more value for the public dollar by preserving/ growing its capital – This is achieved by operating the Green Bank as a self-sufficient financial entity – As a result of capital preservation, the funds can be repurposed or redeployed once the Green
Bank’ s objectives have been achieved
The clean energy deployed will generate public benefits, such as a cleaner environment, a more
resilient energy system, economic benefits (e.g. creation of well-paying jobs) and lowered costs of
energy
Green Bank Overview
The Green Bank is expected to increase investor confidence in clean energy financing by
improving understanding of the value of clean energy and reducing perceived risk
In addition, the bank can enable the transition to a formal, standardized, scalable and more
predictable clean energy financing market with a reduced need for state/ rate-payer funded
incentives and lower transaction costs, the outcomes of which can be measured in terms of
reduced cost of capital and expansion into broader market segments
1
2
3

Booz & Company
Firstly, expanding private investment in clean energy is enabled by leveraging public capital and recycling funds
6
Green Bank Overview
Source: Booz & Company analysis, market research (including stakeholder interviews, concept testing interviews and industry research)
Leverage of Private Capital
Example – How is Capital Recycled?
Year 0: Initial
investment
attracts 3-4x
private capital
Original Investment
First Recycling of Funds
Second Recycling of Funds
Year 6: Funds are
recycled into a new
investment, attracting
3-4x private capital
Year 6:
Investment is
repaid
Public funds are lent
Public funds are repaid
Year 12:
Investment is
repaid
Year 12: Funds are recycled into
a new investment, attracting 3-4x
private capital
Year 18:
Investment is
repaid
ILLUSTRATIVE EXAMPLE
1
Green Bank versus Incentive Approach
0 2 4 6 8 10 12 14 16
Pu
blic
Ca
pit
al
Dep
loye
d
Public Capital Deployed Under
Incentive Scheme
Public Capital Deployed Under
Green Bank Mechanism
Years
0 2 4 6 8 10 12 14 16
Pu
blic
Ca
pit
al
Dep
loye
d
Years
Initial Capital
Deployment
Simplified capital
preservation and
recycling of a
growing capital base
Simplistic model of
incentive scheme
intended to illustrate the
one-time deployment of
capital
Green Bank investments are
anticipated to attract multiples of
private capital as they are initially
deployed. As the bank recoups its
investment, funds are re-deployed
into new investments (i.e. “recycled”)

Booz & Company
Capital recycling allows the Green Bank to achieve higher upside total leverage, while the downside is similar to “business as usual”
7
Green Bank Overview
Discussion
Maximum upside potential of Green Bank Total Leverage (as denoted by blue squares on graph) occurs where projects supported by Green Bank financing are not subsidized with incremental public funds (i.e. clean energy state/ rate-payer funded incentives)
However, Green Bank Total Leverage is reduced where projects supported by Green Bank financing also receive state/ rate-payer funded incentives
In these scenarios, the downside is not significantly different than BAU1 Total Leverage, and the differential dissipates over time; at 40 years, for example, there is almost no difference between the lower end of the range and BAU1
Calculations based on conservative assumption that current grant / incentive programs are not redesigned or reduced
Note: Some level of state/ rate-payer funded incentives may still be necessary to drive demand
25
20
15
10
5
0
Total leverage
BAU1 Total
Leverage
= 3.8
40 Year
22.9
3.0
20 Year
13.8
2.7
10 Year
7.9
2.3
5 Year
5.2
2.0
1) BAU denotes “business as usual”
Note: Assumptions and additional methodology can be found in the Appendix
Source: Booz & Company analysis
Calculation Period
Total leverage as captured in the chart does not recognize that the Green Bank will receive a return
of its capital beyond the calculation period
Assumes
incentives and
grant levels remain
at current levels
Green Bank Total Leverage
This example is based on a
hypothetical product suite (Slide 24)
for the Green Bank. Leverage will
depend on the actual product suite that
the Green Bank management team
selects and interaction with state/ rate-
payer funded incentives. Please refer
to Appendix for additional detail.
ILLUSTRATIVE EXAMPLE
100% of Green Bank loans receive incentives at today’s levels 0% of Green Bank loans receive incentives
1

Booz & Company
Secondly, the Green Bank can drive market transformation
8
Transformation Drivers
The root cause of current market barriers /
inefficiencies is existing lenders’ insufficient
understanding of the risk profile and track
record of clean energy projects
In conjunction with NYSERDA, the Green
Bank will have the knowledge, experience,
and operational capability to identify and
support projects that are economically viable
but not currently financeable
The Green Bank can facilitate capital
markets by increasing transparency and
confidence; for example, by aggregating data
and developing conformity standards
Results / Benefits
Transparency: The public track record of
Green Bank investments drives market
transparency and generates baseline for the
market to efficiently price a new asset class
Market confidence: Increased transparency
enables private sector understanding of new
asset class and willingness to invest
Reduced cost of capital: Efficient pricing of
clean energy project financing effectively
reduces the levelized cost of energy
Market expansion: Green Bank credit
enhancements for clean energy projects for a
broader tier of creditworthiness (currently
inefficiently priced) will help build a track
record for the private sector to expand its
current coverage
Green Bank Overview 2
Example on following slide

Booz & Company
Financing can be expanded, for instance, in both the residential and commercial segments
9
Green Bank Overview
1) 8,000,000 x (5% + 6%); based on expanding eligibility from 0% of 600-649 and 50% of 650-699 range to 50% of 600-649 and 100% of 650-699 range
2) Based on market interviews, desk research and market sizing analysis
3) Assumes that Green Bank will expand served market from 50% of Class 3 to between 60% and 70% of Class 3. This is equivalent to incremental 4% (10% * 40%) to 8% (20% * 40%)
Source: 2013 NYSERDA Strategic Plan, market research/ interviews, Booz analysis
ILLUSTRATIVE
US FICO Score Distribution
18%19%
16%
10%9%6%
300-499 800-850 750-799 700-749 650-699
12%
600-649
10%
550-599 500-549
59% Traditionally Served
70% Served with Green Bank
Green Bank can expand access to financing to lower tier of FICO
scores, expanding access to financing to incremental 11% of NY
households
Total New York households is ~ 8,000,000
Impact is equivalent to an additional ~880,000 households in NY1
Traditionally served1
Traditionally underserved Green Bank expanded eligibility
Example for Residential Market Expansion Example for Commercial Market Expansion
Traditionally served markets are Class 1, Class 2 and a percentage of
Class 3 (~50% of businesses)
The Green Bank can provide service to more businesses within Class 3
and as a result cover an additional 4%-8% of businesses3
The Green Bank would expand eligibility from 50% of businesses to
54%-58% of businesses
US Dun and Bradstreet Commercial Credit Score
(“CCS”) Distribution
Traditionally served2
Traditionally underserved Green Bank expanded eligibility
Class 1
10%
Class 2
20%
Class 3
40%
Class 4
20%
Class 5
10%
2
Booz & Company
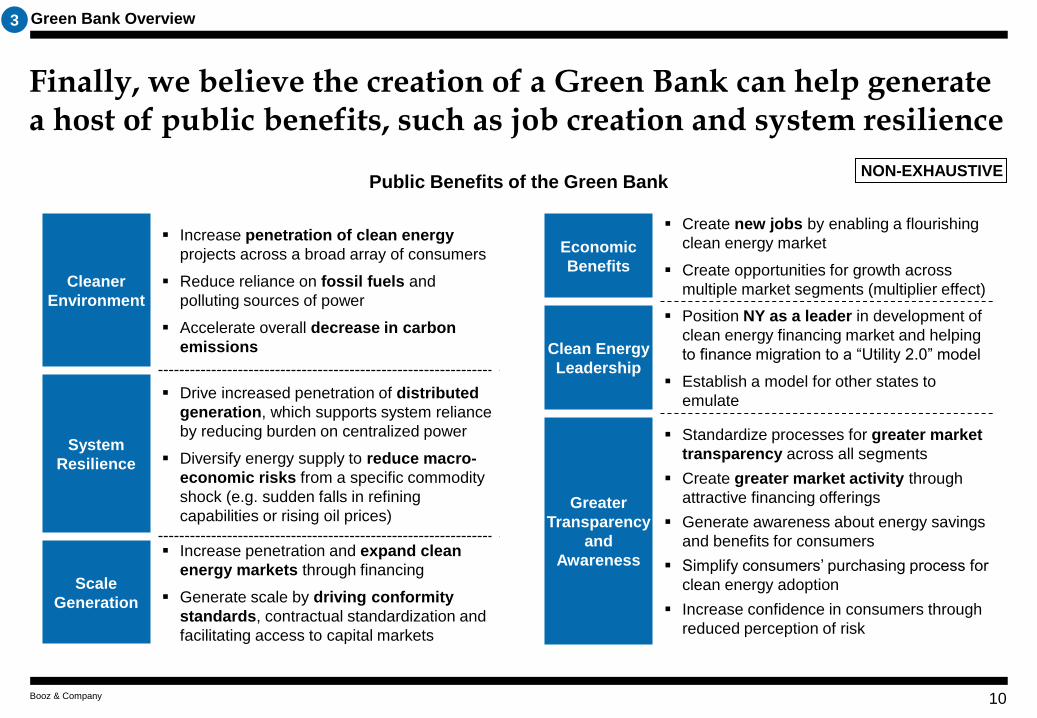
Finally, we believe the creation of a Green Bank can help generate a host of public benefits, such as job creation and system resilience
10
Public Benefits of the Green Bank
Green Bank Overview
NON-EXHAUSTIVE
3
Economic
Benefits
Create new jobs by enabling a flourishing
clean energy market
Create opportunities for growth across
multiple market segments (multiplier effect)
Clean Energy
Leadership
Position NY as a leader in development of
clean energy financing market and helping
to finance migration to a “Utility 2.0” model
Establish a model for other states to
emulate
Greater
Transparency
and
Awareness
Standardize processes for greater market
transparency across all segments
Create greater market activity through
attractive financing offerings
Generate awareness about energy savings
and benefits for consumers
Simplify consumers’ purchasing process for
clean energy adoption
Increase confidence in consumers through
reduced perception of risk
Cleaner
Environment
Increase penetration of clean energy
projects across a broad array of consumers
Reduce reliance on fossil fuels and
polluting sources of power
Accelerate overall decrease in carbon
emissions
System
Resilience
Drive increased penetration of distributed
generation, which supports system reliance
by reducing burden on centralized power
Diversify energy supply to reduce macro-
economic risks from a specific commodity
shock (e.g. sudden falls in refining
capabilities or rising oil prices)
Scale
Generation
Increase penetration and expand clean
energy markets through financing
Generate scale by driving conformity
standards, contractual standardization and
facilitating access to capital markets

Booz & Company
Our research indicates that the public-private financing model is starting to gain traction both domestically and internationally…
11
Green Bank Overview
International
Institution Year
Established Initial Capital
Clean Energy Finance
and Investment
Authority
(Connecticut)
2011 $48M repurposed
funds as initial
capital
New York City Energy
Efficiency Corporation
(New York)
2011 $45M federal/city
funds and private
donations
Keystone Home Energy
Loan Program and
Warehouse for Energy
Efficiency Loans
(Pennsylvania)
2006 $20M initial
capital
Green Energy Market
Securitization (Hawaii)
2014 start
date
$100M initial
capitalization
anticipated from
bond issuance
NON-EXHAUSTIVE
Institution Year
Established Initial Capital
Kreditanstalt für
Wiederaufbau
(Germany)
1948 $98B initial
capital
Green Investment
Bank (U.K.)
2012 $4.7B initial
capital
Clean Energy Finance
Corporation
(Australia)
2013 start
date
$10B initial
capital
1
2
3
4
5
6
7
Sources: Coalition for Green Capital; Institution Websites; Interviews; Booz & Company analysis
Domestic

Booz & Company
… and the Green Bank is collaborating with these organizations to benefit from key lessons learned
12
Entity Organization Overview Best Practices
CEFIA (Clean Energy
Finance and
Investment Authority,
Connecticut)
Quasi-public agency commissioned by the Connecticut Governor’s Office
Mission: To support the governor’s and legislature’s energy strategy to
achieve cleaner, cheaper and more reliable sources of energy while creating
jobs and supporting local economic development
Focus: Solar, fuel-cell, geothermal, biomass and energy efficiency
Key Products: Smart-E Loan (loan loss reserve for longer tenor loans)
and Solar Lease II (developed for warehouse of leases)
Launch programs in the first three months to avoid stalling and losing
public interest
Strive to yield benefits that steadily decrease incentive dependence
Establish strong partnerships with NGOs, banks, installers, etc.
Work with private lenders rather than competing against them
Use addressable market assessments to help establish quarterly targets
NYCEEC (New York
City Energy Efficiency
Corporation)
Legally independent 501 (c)(3) funded by the New York City Mayor’s Office
Mission: To support New York City’s energy and climate action goals by
catalyzing an efficiency retrofit financing market for private building owners
Focus: energy efficiency, fuel conversion, CHP, eligible distributed
generation for large buildings
Key Products: Energy Service Agreements, credit enhancement facilities
for Fannie Mae/ NYC Housing Development Corporation mortgage-linked
loans, ConEdison multifamily energy efficiency program
Focus on large buildings to meet NYC policy goals
Partner with established organizations who already have target
audiences (e.g. Fannie Mae, New York City Housing Development
Corporation)
Adopt commercial lending practices to enhance credibility and facilitate
partnerships
Use credit enhancements to induce energy efficiency mortgage products
Build staff with expertise in finance and engineering
Keystone HELP/
WHEEL (Home Energy
Loan Program and
Warehouse for Energy
Efficiency Loans,
Pennsylvania)
Program run by Pennsylvania State Treasury
Mission: Helping Pennsylvania homeowners and contractors with true fixed
rate financing programs for affordable energy efficiency and home comfort
Focus: Residential energy efficiency
Key Products: Direct loans for residential efficiency retrofits, warehouse
for energy efficiency loans to establish secondary market
Leverage partnerships with private sector administrator and contractor
networks to improve outreach
Strive to achieve scale attractive to private sector partners
Align Green Bank incentives with contractor incentives to encourage
contractors to advertise Green Bank programs
Structure Green Bank underwriting standards around Fannie Mae
standards to drive conformity
GEMS (Green Energy
Market Securitization,
Hawaii)
Program to be run by Hawaii Public Utilities Commission
Mission: To create a mechanism to secure low-cost capital for clean
energy projects to help Hawaii reach 70% clean energy goal
Focus: Solar and energy efficiency
Key Products: Program combining on-bill financing with bond issuance
(securitized by public benefit charge)
Start with a simple structure, purpose and target market
Use underserved markets as a sales strategy (targeting underserved
markets fills a market gap and supports state policy objectives)
Develop large partnership network early on (unions, banks, developers,
utilities, environmentalists, chamber of commerce, etc.)
Work with existing players, products, and services (e.g. utilize pre-existing
developers and encourage competition among them)
Organizational Overview and Best Practices of Domestic Green Banks
1
2
3
4
Sources: Booz & Company analysis; Coalition for Green Capital; market research (including stakeholder interviews, concept testing interviews and industry research)
Green Bank Overview

Booz & Company
Green Bank Overview
Market Assessment
Quantitative Analysis
Operating Model
Appendix
13
Booz & Company
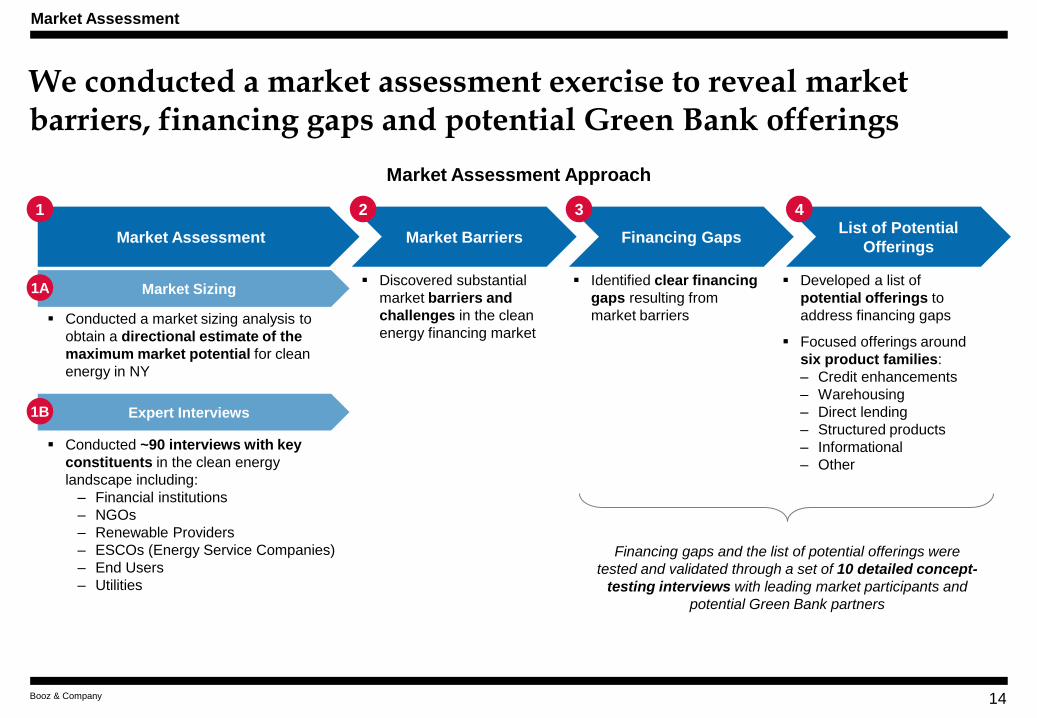
We conducted a market assessment exercise to reveal market barriers, financing gaps and potential Green Bank offerings
14
Market Assessment
Expert Interviews
Conducted ~90 interviews with key
constituents in the clean energy
landscape including:
‒ Financial institutions
‒ NGOs
‒ Renewable Providers
‒ ESCOs (Energy Service Companies)
‒ End Users
‒ Utilities
Conducted a market sizing analysis to
obtain a directional estimate of the
maximum market potential for clean
energy in NY
Market Barriers Financing Gaps List of Potential
Offerings
Discovered substantial
market barriers and
challenges in the clean
energy financing market
Market Sizing Identified clear financing
gaps resulting from
market barriers
Developed a list of
potential offerings to
address financing gaps
Focused offerings around
six product families:
‒ Credit enhancements
‒ Warehousing
‒ Direct lending
‒ Structured products
‒ Informational
‒ Other
2 3 4 1
1A
1B
Financing gaps and the list of potential offerings were
tested and validated through a set of 10 detailed concept-
testing interviews with leading market participants and
potential Green Bank partners
Market Assessment Approach
Market Assessment

Booz & Company
This analysis revealed a substantial market opportunity for clean energy projects in the State of NY
15
Market Sizing Overview DIRECTIONAL
Market Assessment
Note: Additional market sizing is required to determine specific size of gaps, and to assess the product-specific market sizes
Source: Booz and Company analysis; see appendix for detailed market sizing approach and sources
Selected
Technologies
Est. Market
Size ($B) Approach
Energy Efficiency $55
Assumes an average retrofit cost by square foot for all pre-2008 buildings in New York
Removes demand addressed by private sector and demand unaddressed due to low credit quality
Assumes entire remaining market participates (i.e. all pre-2008 building / units)
Solar PV $13 Calculates the difference between current, 2013 PV generation and the anticipated 2023 PV generation
of 5 MW and applies a $ / MW cost
Does not assume entire market participates
CHP $8 Estimates total new potential in NY for CHP sites, deducts 50% as addressable based on prior
NYSERDA experience, and applies average site cost
Does not assume entire market participates
Biomass $4
Estimates total annual forest biomass wood chip supply in NY and converts annual energy production
into capacity based on biomass capacity factor
Applies estimated biomass installation costs per Watt to size aggregate addressable potential
Assumes utilization of entire residual wood chip supply from New York logging / lumber industry
Onshore Wind $4 Takes 5 year average of new wind installations and assumes the same current rate for the next 10
years and applies an average estimated onshore wind installation cost per Watt to size aggregate
addressable potential
Anaerobic
Digesters (ADG) <$1
Estimates maximum potential annual energy production from all NY animal waste, food manufacturing,
and municipal wastewater and converts annual energy production into generation capacity
Applies estimated ADG installation costs per Watt to size aggregate addressable potential
Assumes entire supply of waste is utilized
Total market size of ~$85 B excludes potential for utility scale generation, fuel cells, charging stations,
solar hot water systems, and other emerging clean energy technologies
1A

Booz & Company
We also conducted ~90 interviews with constituents who provided a wide range of perspectives on potential roles for the Green Bank
16
Financial
Institutions
(34 interviews)
Stakeholders/
NGO
(11 interviews)
Renewables
Providers
(13 interviews)
ESCOs
(8 interviews)
End Users
(9 interviews)
Green Bank should not get in the way of private capital, but instead enable and facilitate capital flow
High transaction costs can be addressed through scale and standardization
Green Bank should play a role in helping financial institutions with longer term loans given regulatory constraints on bank capital
Green Bank should help aggregate smaller loans to attain volume levels that interest financial institutions
Market Feedback
Limited demand exists for clean energy across multiple segments, income levels and credit ratings
However, end users lack technical expertise and have limited awareness of the value proposition and savings
As such, the Green Bank should be an ecosystem contributor and facilitator in the market by providing credit enhancements, serving
as an information center, and pushing for simplicity of offerings / underwriting transparency
The market for renewables is heavily reliant on the monetization of tax credits, with particular challenges around tax law reform
uncertainty and the illiquid and overpriced nature of the tax equity market
Furthermore, NY’s unregulated energy market is a challenge for renewables providers who desire long term price certainty, and the
absence of PPAs (Power Purchase Agreements) and a thin market for hedges makes it difficult for them to penetrate the market
The Green Bank can play a role in the funding of pre-development costs by providing conditional loans based on end-user project
adoption guarantee if post-audit expected savings exceed pre-defined threshold
The Green Bank can help address the lack of project and financing standards for selling retrofits
The Green Bank can aggregate a project portfolio to diversify credit risk and attain sufficient scale for take-out
Source: Interviews with market constituents and stakeholders
NON-EXHAUSTIVE
Market Assessment
Utilities and
Others
(13 interviews)
Enthusiasm for Green Bank varies across utilities, but general consensus exists that there is a an opportunity for loans in the
medium credit quality space (1-2 standard deviations lower than prime) if loan guarantees are put in place
Green Bank should be active in simplifying and standardizing end-user options and providing adequate flexibility in financing
Potential for on-bill repayment to be expanded and used as an enabler for Green Bank financing
The Green Bank should aggregate information and data around payments and performance track record
The Green Bank should help end users understand the value of energy efficiency and renewables projects through educational
campaigns to drive demand
The Green Bank should facilitate the financing of currently unfunded mandates, such as energy audits
1B

Booz & Company
The interview questions focused on market barriers, financing gaps and product ideas for the Green Bank
17
How much of your business is currently
done in New York State?
How do you create value in the market?
How do you generate demand and
acquire customers? Is there latent
demand, in what segments, and how
much?
How is project capital sourced, and from
whom?
What constraints (both financial and non-
financial) do you face?
What types of financial instruments do
you primarily use when raising capital?
How could the Green Bank help you grow
your business?
How could the Green Bank assist your
customers?
What is your current level of annual
capital expenditure on energy efficiency
and renewable energy?
How do you make your energy efficiency
and renewable energy capital decisions?
How is capital sourced, and from whom?
What constraints (both financial and non-
financial) do you face?
What financial instruments do you use?
How could the Green Bank help you grow
your business’ investment in energy
efficiency and renewable energy?
How much of your energy-related business
is currently done in New York State?
Is there a mismatch between the demand
for energy-focused capital and the supply of
capital?
How would you characterize end-use
customer demand for energy projects, and
what are the key drivers?
How does your organization generate deal
flow?
What would drive increased end user
demand? What about investor demand?
What financial instruments exist in the
market? What are investor preferences?
Are there any gaps in the financial products
landscape? By energy segment, by project
size, other?
If you see an information gap, what specific
information is hindering investment?
Financial Institution
Questions
Energy Efficiency & Renewable
Provider Questions
End-Use Customer
Questions
NON-EXHAUSTIVE
Market Assessment 1B

Booz & Company
Key barriers revealed by the interviews include underdeveloped secondary markets, high upfront costs and de-prioritization
18
Barrier Description
High
Severity
Barriers
Undeveloped secondary market
Non-conformity of existing energy financial products and limited track record
for rating agencies
Low volume of transactions makes it challenging to securitize loans
Large upfront costs
End users not willing to incur large pre-development costs in order to
determine whether energy benefits are net positive
Energy projects require large initial capital outlay
De-prioritization of energy projects Energy projects compete for funding with other capital-intensive projects
Energy efficiency loans are
oftentimes unsecured Energy efficiency loans typically lack a collateral asset
Insufficient understanding of value
proposition
Outside of large, sophisticated C&I (commercial and industrial) customers,
clean energy project savings are not well understood
Split incentives Split incentives arise from the fact that landlords pay for energy upgrades
while tenants reap savings from energy bill
Medium
Severity
Barriers
Inability to scale underwriting
process
Energy projects oftentimes necessitate custom loan structures
Limited availability of information re: energy savings and vendor quality
burdens underwriters, resulting in high upfront transaction costs
Limited track record of performance
and payments history
Direct energy savings are site-specific and can be difficult to cost-effectively
quantify and measure at most sites
Performance and payments data is decentralized, oftentimes proprietary
and of limited duration vis-a-vis tenor of lease/loan transactions
Tax credit uncertainty PTC (Production Tax Credit) expires at end off 2013; ITC (Investment Tax
Credit) falls from 30% to 10% at end of 2016
Existing debt burden of potential
energy customer
Restrictive debt covenants/mortgage lender limitations on external financing
High loan-to-value leaves little/no room for additional debt
Inability/ unwillingness of end-user to add additional debt to balance sheet
Low
Severity
Barriers
Fragmented vendor landscape Uncertainty of vendor quality/ reputation results in lower demand for energy
efficiency
Risk aversion of lenders in the
current regulatory environment Existing regulations curtail ability of banks to lend on balance sheet
Source: ~90 interviews with market constituents and stakeholders
Green Bank Barriers
NON-EXHAUSTIVE
2
Financing Gaps
Medium Credit
Quality Financing
Small Scale
Financing
Financing for
Commercially Viable
Technologies yet to
Achieve Scale
Tax Equity Funding
Long Tenor
Financing
Additional detail in
subsequent page

Booz & Company
These barriers have led to areas with clear financing gaps, such as medium credit quality customers and small scale projects
19
Financing Gap Description Potential Offerings to Address Gap
Medium Credit
Quality Financing
Financing for customers with FICO scores of
~640-700 or a subset of Class 3 businesses
Small Scale Financing Financing for projects $2M or less in size
Financing for
Commercially Viable
Technologies yet to
Achieve Scale
Financing for technologies with limited
deployment to date (e.g., biomass, microgrids,
anaerobic digesters, fuel cells, battery storage,
electric vehicle charging stations)
Tax Equity Funding Financing for projects eligible for tax credits
Long Tenor Financing Financing for projects with a tenor longer than
5-7 years
Source: ~90 interviews with market constituents and stakeholders
Credit
Enhancement
Warehouses for
Securitization
Direct Lending/
Investing
Warehouses for
Securitization
Direct Lending/
Investing
Credit
Enhancement Informational
Structured
Products
Direct Lending/
Investing
Credit
Enhancement Informational
Financing Gaps
NON-EXHAUSTIVE
3
Additional detail in subsequent page
Informational
Direct Lending/
Investing
Structured
Products

Booz & Company
Several financing gaps can be addressed through a list of potential offerings that the Green Bank can take to market (1 of 2)
20
Offering Technology1 High-Level Description
Credit
Enhancements
Loan loss reserve for C-PACE
All technologies The Green Bank commits capital to a loan loss reserve fund to backstop the repayment of a
portion of loans by sub-investment grade municipalities participating in the C-PACE
(Commercial Property Assessed Clean Energy) financing program
Loan loss reserve for financing
appended to existing mortgage
loans
All technologies The Green Bank commits capital to a loan loss reserve fund to backstop the repayment of
the clean energy portion of loans as part of an overall mortgage loan extended by an existing
mortgage provider
Loan loss reserve for tax equity
lease funds
Solar, wind The Green Bank commits capital to a loan loss reserve fund associated with a tax equity
lease structure developed by a third party to enable renewable providers to broaden access
to financing to the next best tier of customer credit quality
Technology guarantee
Energy efficiency The Green Bank guarantees specific energy efficiency technologies to protect financing
providers against technology performance risk
The Green Bank may reinsure technology guarantee to other private entities
Warehouses for
Securitization
Funding of warehouse for
consumer loans
Energy efficiency,
solar
The Green Bank directly purchases a corpus of residential, clean energy loans and holds
them for pre-determined period (e.g. 3 years)
Once loans build track record, the Green Bank can offload them via a take-out2
Funding of warehouse for medium
credit quality loans
All technologies The Green Bank entirely, or partially, directly funds a corpus of medium credit quality loans
and holds them for pre-determined period (e.g. 3 years)
Once loans build track record, the Green Bank can offload them via a take-out2
Direct Lending/
Investing
Subordinated debt for solar loan
fund
Solar The Green Bank finances a subordinated debt tranche of a solar loan fund, alongside senior
debt holders, and assumes risk of first loss
This enables the solar loan fund to attract senior debt investors into new markets
Operational revolver loan to fund
origination capabilities
All technologies The Green Bank extends a revolving operational loan or credit line to an entity in order to
help it build loan origination capabilities and additional scale
The loan earns a spread above prime rate based on portion of funds accessed
List of Potential Green Bank Offerings NON-EXHAUSTIVE
1) “All technologies” indicates energy efficiency, solar, wind and CHP
2) Take-out could potentially occur with the help of a Green Bank credit enhancement
List of Potential Offerings
Several offerings were
validated in concept
testing interviews with
leading market
participants
4
Illustrative examples provided in the Appendix

Booz & Company
Several financing gaps can be addressed through a list of potential offerings that the Green Bank can take to market (2 of 2)
21
Offering Technology1 High-Level Description
Structured
Products
Funding for tax equity lease fund
Solar, wind, fuel cells The Green Bank provides sponsor equity as well as subordinated debt into a tax equity
lease fund for renewable energy, in conjunction with additional funding from tax equity
providers and senior debt providers
Research project to broaden
appeal of tax equity products
Solar, wind The Green Bank funds a two-year research project to identify, structure and roll out a
program that broadens access of tax equity beyond niche, large investors with passive
income to other investors that can monetize the tax equity
Informational
Tracking and analysis of
performance and payment data
All technologies The Green Bank aggregates, stores, analyzes and shares market data related to the
performance history and payments track record of financed clean energy projects to improve
transparency and enhance market understanding of risk
Development of financing and
project standardization
All technologies The Green Bank takes an active role, in coordination with strategic partners, in defining loan
conformity standards and developing evaluation and certification criteria for contractors and
lenders
Platform to match clean energy
providers and borrowers
All technologies The Green Bank establishes platforms / online exchanges to match clean energy providers
and borrowers in order to drive increased competition by facilitating price transparency for
consumers
Forum to drive adoption of
products with complex accounting
(off balance sheet)
All technologies The Green Bank moderates a forum of participants encompassing large accounting firms
and CFOs to clarify accounting treatment and requirements to achieve broader adoption of
off-balance sheet products (e.g. ESAs – Energy Service Agreements)
Other
RFP issuance to financial
institutions for specific partnership
opportunities
All technologies The Green Bank issues an RFP to major financial institutions to solicit existing project
opportunities which could become more viable through Green Bank support
This arrangement shifts the product structuring burden to the private sector
Provision of low cost financing that
leverages unique Green Bank
positioning
All technologies The Green Bank leverages its unique capabilities to structure products that broaden the
appeal of clean energy financing (e.g., by working with PSC (Public Service Commission) to
arrange a backstop for loan repayments through a rate reduction bond structure
Financing of commercially viable
technologies with limited
deployment
Micro-grids, ADG,
biomass, fuel cells,
battery storage
The Green Bank can participate with a network of lenders who provide capital for niche,
emerging technologies such as biomass, anaerobic digesters, micro-grids, solar water
heating systems, battery storage and fuel cells
List of Potential Green Bank Offerings NON-EXHAUSTIVE
1) “All technologies” indicates energy efficiency, solar, wind and CHP
List of Potential Offerings
Several offerings were
validated in concept
testing interviews with
leading market
participants
4
Illustrative examples provided in the Appendix
Booz & Company
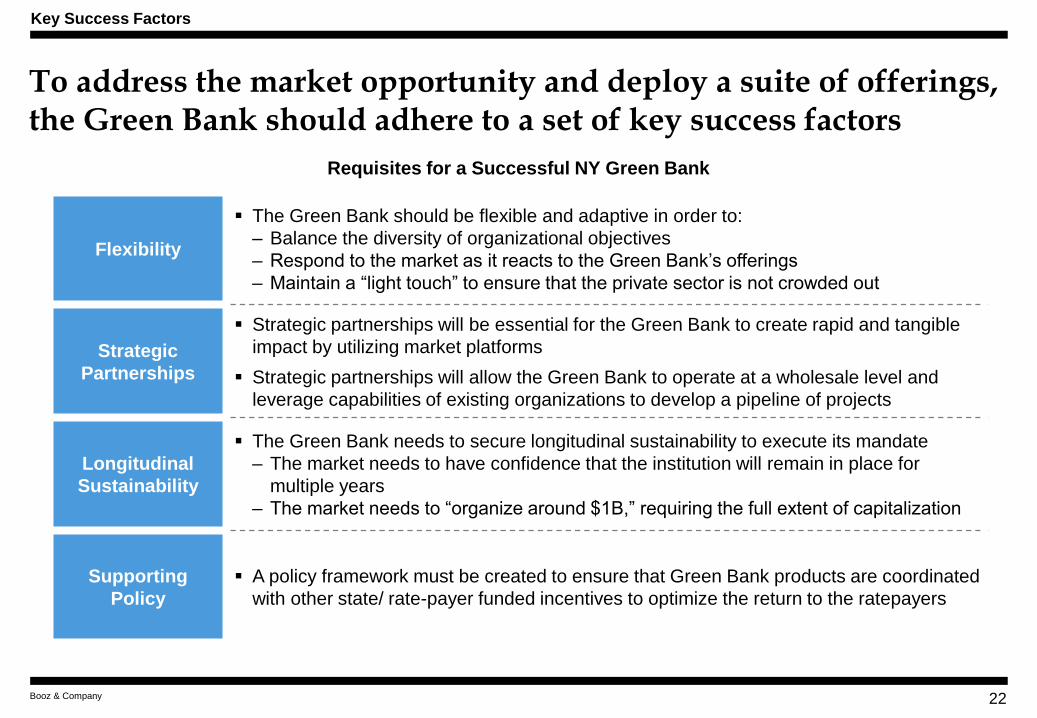
To address the market opportunity and deploy a suite of offerings, the Green Bank should adhere to a set of key success factors
22
Key Success Factors
Requisites for a Successful NY Green Bank
Flexibility
The Green Bank should be flexible and adaptive in order to:
– Balance the diversity of organizational objectives
– Respond to the market as it reacts to the Green Bank’s offerings
– Maintain a “light touch” to ensure that the private sector is not crowded out
Strategic
Partnerships
Strategic partnerships will be essential for the Green Bank to create rapid and tangible
impact by utilizing market platforms
Strategic partnerships will allow the Green Bank to operate at a wholesale level and
leverage capabilities of existing organizations to develop a pipeline of projects
Longitudinal
Sustainability
The Green Bank needs to secure longitudinal sustainability to execute its mandate
– The market needs to have confidence that the institution will remain in place for
multiple years
– The market needs to “organize around $1B,” requiring the full extent of capitalization
Supporting
Policy
A policy framework must be created to ensure that Green Bank products are coordinated
with other state/ rate-payer funded incentives to optimize the return to the ratepayers

Booz & Company
Green Bank Overview
Market Assessment
Quantitative Analysis
Operating Model
Appendix
23

Booz & Company
To better understand the viability of a Green Bank, we conducted a quantitative analysis based on a hypothetical product suite
24
Quantitative Analysis of the Green Bank
Product Modeling Green Bank Modeling Sensitivity Analysis
Estimated input parameters for
a hypothetical suite of
product families were used to
develop a quantitative model of
the Green Bank
Metrics such as net yield on
assets, leverage, and the
recycling of funds were used
to analyze the behavior of
product families
By aggregating the individual
product families, an overall
model of the Green Bank was
developed
The model does not incorporate
Green Bank overhead or
administrative costs
Several financial and non-
financial risks were identified for
the Green Bank
Sensitivity analysis on the
Green Bank’s overall ROI1 was
conducted for key risks to
understand the ability of the
model to withstand adverse
events
Quantitative Analysis
1) See slide 25

Booz & Company
Four hypothetical products were used to model the Green Bank’s impact and financial evolution over time
25
Description of Product Families
Credit
Enhancement /
LLRF1
Includes loan loss reserves and credit enhancement products funded by a reserve
Products assist private sector lenders by taking on a portion of the risk associated with
loans in return for a fee
Warehouses for
Securitization
Direct provision of financing with the intention of bundling loans for securitization
Build pool of loans through direct lending to borrowers and replenish funds by selling pool
into capital markets
Direct Lending/
Investing
Simple loan products to be held on balance sheet
Examples of direct investments include subordinated debt, revolving credit facilities, and
term loans
Structured
Products
(Tax Equity Fund)
More complex investments that may serve multiple functions in a single bespoke
arrangement
Examples of structured products include a tax equity fund that combines a debt investment,
an equity investment and a loan loss reserve to support parallel private investments
Hypothetical Green Bank Product Families
HYPOTHETICAL
Quantitative Analysis
1) LLRF stands for Loan Loss Reserve Fund

Booz & Company
The outcomes and effectiveness of the Green Bank’s hypothetical suite of products are measured using two key metrics
26
Leverage Ratio
Total Energy
Investment
Public Dollars
= Leverage
Ratio
Initial
Leverage
Cumulative
Leverage
Measure of initial leverage
based on product design
Excludes impact of recycling
and recapitalization over time
Static measure calculated from
product inputs
Measures leverage achieved
over time based on initial
leverage, recycling of money
and recapitalization
Leverage increases over time
as capital is collected and
redeployed multiple times
Key Green Bank Metrics
Quantitative Analysis
Loss-Adjusted ROI
Measures product-based income
Net of product losses
Does not include product admin costs or
organization overhead costs
Gross Product Revenue
– Product Losses (e.g. Defaults)
= Loss Adjusted Revenue
Loss Adjusted Revenue
Initial Product
Capitalization
=
Loss-
Adjusted
ROI

Booz & Company
0.0
0.5
1.0
1.5
2.0
2.5
3.0
3.5
4.0
4.5
5.0
5.5
Based on product modeling, direct lending and investments into lease structures may drive ROI for the Green Bank
27
1) ROI is equal to (gross product revenue minus product losses) divided by initial capitalization. Based on 20 year projection of hypothetical product set; analysis assumes that the Green Bank maintains an unlevered balance sheet. High end based on +50% sensitivity testing of loan interest rates and upfront fees. Low end based on -50% sensitivity testing of loan interest rates and fees. Additional methodology in Appendix. Green Bank range based on midpoint of low and high scenarios illustrated in ROI discussion
Source: Booz & Company analysis; market research (including stakeholder interviews, concept testing interviews and industry research)
Quantitative Analysis
Discussion
The hypothetical Green Bank portfolio is expected to
earn an ROI of approximately 1.5% - 4.1%
– This range is a function of the prices the Green Bank can charge for its capital
Credit Enhancements have an expected ROI of
approximately 0.4% - 4.2%
– This wide range reflects the products’ sensitivity to the fees the Green Bank is able to charge.
Warehouse products have an expected ROI of
approximately 1.4% to 3.2%
Direct lending products have an expected ROI of
approximately 1.8% - 4.2%, driven by receipt of
interest payments of fees
Structured products are expected to have the
highest potential ROI, ranging from approximately
3.2% - 5.4%
– This higher ROI is possible due to the higher required return for the equity portion of investment
Annualized ROI by Product1
%
Green Bank
Wt. Avg.
Structured
Products
Direct Lending/
Investing
Warehouse Credit Enhan.
/ LLRF
HYPOTHETICAL

Booz & Company
The initial leverage achieved by Green Bank products will be multiplied over time as capital is recycled and redeployed
28
1) Leverage by Product calculated as Total Energy Investment divided by Public Dollars
Source: Booz & Company analysis; market research (including stakeholder interviews, concept testing interviews and industry research)
Quantitative Analysis
HYPOTHETICAL
Discussion
The Green Bank will leverage private dollars
upfront and over time
The Green Bank portfolio may achieve an initial
leverage of 3x-4x, redeploying its capital and
achieving further rounds of leverage up to 4 times
over 20 years
Initial leverage is a function of product design and
will attract private investment upon initial capital
deployment
– For example, upon initial investment, a loan loss reserve with a 20% loss share will leverage 5 dollars for every public dollar
– The design of product parameters, based on interviews with current market actors, will drive initial leverage
Leverage is also created by cash recycling over
time
– As loan and product terms end, cash is returned to the Green Bank and redeployed, once again leveraging private dollars at the upfront ratio
3x-4x 2x-5x 3x-5x
1x – 1.5X
5x – 10x
Initial Leverage by Product1
Initial
Leverage 5x-10x Varies 3x-5x Varies 3x-4x
Tenor 5-20 7-15 7-15 Varies 5-20
Recycling
of Funds 1x -4x Varies with sales
of loans 1x-2x 1x 1x-4x
Green
Bank Wt.
Avg.
Structured
Products
Direct
Lending/
Investing
Warehouse
Credit
Enhan. /
LLRF

Booz & Company
While product impact is expected to be high, a set of financial and non-financial risks needs to be considered and mitigated
29
Financial Risks
Key Risk Categories
Non-Financial Risks
Default Risk
Balance Sheet
Risk
Capital
Deployment
Risk
Capabilities
Risk
Partnership
Risk
Legal/
Regulatory
Risk
Political
Risk
Risk that borrower defaults due to
inability to make payments on time or
at all, or due to project performance
reasons
Risk that the Green Bank is unable to
off-load assets (e.g. warehouse) from
its balance sheet, thereby tying up
capital and forgoing recycle rate
Risk that capital allocated is not
deployed rapidly enough due to lower
demand than expected for segment-
specific or market related reasons
Risk that capabilities required to
implement offerings are not fully met
or not met in a timely manner, leading
to a delay in offering roll-out
Risk that partners back out or revoke
existing agreements due to changes in
priorities or financial inability to meet
requirements
Risk that legal or regulatory changes
adversely impact offering demand or
the ability to structure products as
originally designed
Risk that political or public events
adversely impact the perception or
outcome of Green Bank’s objectives,
resulting in overall entity risk
Source: Booz & Company analysis
Quantitative Analysis

Booz & Company
Green Bank ROI is not highly sensitive to the amount of
time it takes to deploy capital
This is because many Green Bank offerings recycle and
redeploy capital relatively quickly and multiple times over
the 20-year evaluation period
Therefore the negative impact of a delayed deployment is
negated by positive impact of regular redeployments over
time
While Green Bank overall ROI is significantly sensitive to default risk, effect of capital deployment risk is minimal
30
HYPOTHETICAL
Quantitative Analysis
Default Risk
Green Bank ROI is sensitive to default risk because defaults
are the primary non-operating cost for all products
Higher defaults lead to increased loss coverage for LLR
(Loan Loss Reserve) products, and reduced interest
income for lending/warehouse products
Impact is partially minimized due to fees on several
products that are upfront and independent of defaults
Capital Deployment Risk
3.1% -25%
2.9% Base
+50%
+100%
2.4%
+300% 0.8%
2.0%
+50%
+100%
2.9% Base
2.1% +300%
3.0%
2.5%
2.7%
-25%
Impact of Default Ratio
Scenarios on ROI1
Impact of Capital Deployment
Time on ROI1
1) Sensitivities presented are on the annualized 20-year ROI of the Green Bank. ROI is risk-adjusted, which accounts for default-related losses but no other admin or overhead expenses.
Source: Booz & Company analysis

Booz & Company
Green Bank Overview
Market Assessment
Quantitative Analysis
Operating Model
Appendix
31

Booz & Company 32
Operating Model
We believe that the Green Bank will require four capability sets: energy, financial, business development and operational
Source: Booz & Company analysis; market research (including stakeholder interviews, concept testing interviews and industry research)
Capability Requirements Capability Set Capability Description
Energy
Capabilities
Technology expertise Expertise by technology type e.g., distributed generation, energy efficiency, biomass etc.
Market expertise Knowledge about customer segment needs
Expertise on landscape of energy initiatives
Policy expertise Knowledge over breadth of relevant energy policies, both federal and state
Evaluation and measurement Ability to make energy specific calculations and measurements
Financial
Capabilities
Portfolio/ Project risk
assessment
Ability to assess and price: credit, operational, liquidity, origination, underwriting, and structuring
risks
Opportunity identification Identify, assess and value opportunities, e.g., loan loss reserve for energy efficiency fund
Product development Expertise to develop and structure financial products;
Program / Asset management Day-to-day management of programs, e.g., liaising with warehousing partner
Business
Development
Partner identification Knowledge of partner landscape and screening criteria (e.g., underwriting capabilities)
Partnership management Partner relationship development and management
Partnership negotiation Defining of terms and conditions with partners; closing transactions
Partner compliance assessment Robust tool to assess partner regulatory compliance, e.g., consumer protection
Operational
Capabilities
Account management Customer and client service including complaint processing
Subsidy tracking Coordination and assessment of external subsidy programs and grants
Performance measurement Metrics tracking, evaluation and documentation
Servicing Loan repayment and claims processing
Treasury and accounting Preparation of financial statements and budget tracking
Legal and compliance Contract drafting and regulatory compliance
Marketing and communication Program marketing and news communication
Government policy and affairs Management of relationships with public entities, e.g., NY DPS (Department of Public Service)
HR Staff management, including benefit administration, hiring, on-boarding and training
IT Management and set up of information systems and infrastructure
PRELIMINARY & NON-EXHAUSTIVE
While capability sets are distinct, there will be significant interplay among capabilities, especially financial and energy

Booz & Company
We recommend that the Green Bank develop over two phases
33
Operating Model
2013
Implementation Roadmap
2014
ILLUSTRATIVE
Establishment Implementation
Filing of PSC petitions
Board/advisory group appointment
Leadership establishment &
staffing: Appoint Board /
advisory group, determine in-
house functionality, hire
executive director and other key
personnel
Strategy & organizational
structure: Conduct capability
assessment, finalize
organizational structure
Additional staffing
Operational launch
Finalization of initial product
suite
Operations launch: finalize
paperwork, capitalize,
establish financial framework
Product launch: Develop
Initial products, launch
products
Communication: Create
communication materials
Facilities Set Up: Set up
interim IT infrastructure
Additional capitalization
Existing product ramp-up and new product
launch
Further operational capability development
Investment and operations review, e.g.,
financial reporting
Additional capitalization and scaling of activity
Additional personnel hiring as appropriate
Additional product roll-out
Partnership development
Assess and evaluate product and program
effectiveness
Number of board / advisory
group and leadership
positions filled
Number of staff positions filled
Initial product interest, e.g.,
applications, funding requests
Environmental impact e.g., KWh saved,
capacity deployed
Financial impact e.g., dollars deployed, capital
invested, project default rates
Frequency and severity of process, system
errors
Milestones
KPI (Key
Performance
Indicators)
Key
Activities
Activities in “Early Stage Plan”

Booz & Company
To launch operations, the Green Bank will need to execute on key steps across 6 areas
34
Operating Model
Month 1 Month 2 Month 3
Finalize application process
Set up interim IT and communication infrastructure e.g., telephones, copiers
Develop investment plan
Finalize initial product suite
Create communication materials and protocols, including website
Coordinate partnerships for first set of product launch
Establish corporate planning and reporting structures
Develop Board / Advisory group charter, investment and operating strategy
Establish appropriate sub-committees
Activity
Establish risk management protocols
Launch initial set of products
Determine inquiry and response process
Document operational policies & procedures e.g., financial, HR
Legally establish organization if required
Set up financial accounts e.g., bank accounts
Capitalize the Green Bank
Implement and test management processes, e.g., financial, record keeping
Conduct capability diagnostic of NYSERDA
Finalize organizational structure
Recruit key personnel
Determine in-house functionality and staffing levels
Hire senior executives
Retain consultants
Establish Green Bank Board or Advisory Group
Leadership
Establishment &
Staffing
Strategy &
Organizational
Structure
Facilities Set Up
Operations
Launch
Communications
Product Launch
Source: Booz & Company analysis
Key Areas
PRELIMINARY
Preliminary Early Stage Plan

Booz & Company
Green Bank Overview
Market Assessment
Quantitative Analysis
Operating Model
Appendix
Illustrative Examples
Market Sizing Methodology
Modeling Methodology
Glossary
35

Booz & Company
Illustrative Offering No. 1: The Green Bank can fund a loan loss reserve to support projects through existing mortgage providers
36
Appendix
Source: 1) Based on Green Bank addressable market by technology, segment, and credit quality distribution. See market sizing analysis for more details
Note: All parameters are illustrative only and represent Booz and Company’s opinion based on market research and industry analysis
Average Loan Tenor 6-9 years
Average Loan Size $300,000 – $3,250,000
Assumed Default Rate 0.8% Annually
Target Segment Multifamily, C&I, MUSH
Technology EE, Solar PV, CHP
Other Linked to Existing Mortgage
Lenders
Loan Loss
Reserve Fund
Green
Bank
RE and EE
Loans
Loan Loss Reserve Fund Model Retail Loan Parameters
Product Description
First Loss % 20%
Loss Share 90%
Upfront Fee 4-6%
Annual Charge 3-5%
Interest Earned E.g., Prevailing Money Market
Rate
Loan Loss Reserve Fund Parameters
Establish a Loan Loss Reserve Fund to entice C&I and multifamily mortgage lenders to develop
energy efficiency and renewable energy loan products for their existing borrowers
Cover first losses on a portfolio of Energy Efficiency and Renewable loans; lending partner
assumes remainder of the risk
Encourage lenders to incorporate projected energy savings into underwriting process
Facilitate the provision of technical/ engineering assistance to underwriters
Capital
Investment
interest
Reserve covers
lender in case
of losses
Financing Org
makes loans
Fees earned
Multifamily & C&I
Financing
Organizations
Green Bank Addressable Market1
Segment EE Solar
PV CHP
Multifamily $19.7 $1.6B
C&I $3.2B $6.8B
Multiple $9.7B

Booz & Company
Illustrative Offering No. 2: The Green Bank can also fund a warehouse to purchase loans from originators
37
Average Loan Tenor 12 - 15 years
Average Loan Size $10,000 – $15,000
Credit Rating Range High Credit Quality
Assumed Default Rate 0.8% Annually
Target Segment Residential
Technology EE and Solar PV
Securitization Model Retail Loan Parameters
Product Description
Private to Public
Funds Ratio Recycle Rate Dependent
Securitization Fee 1%
Securitization Parameters
Develop loan conformity standards for establishing a warehouse
Purchase conforming loans issued by third-party lenders and hold on balance sheet
Potential to partner with private sector entity to fund the warehouse
Partner with rating agencies to provide rating for each class of structured notes
Sell portfolio or securitize loans when warehouse reaches proposed minimum of $100M
Key challenge: managing exposure to interest rate risk
Pool of loans
issued by
complementary
programs and
private lenders Investors in
Securitized
Loans
Capital
investment
Interest payments
(administered through the
servicer)
Capital to purchase
loans meeting pre-determined
criteria
Loans
Green Bank
Structured notes
Warehouse of Loans
Ownership
Securitization
Green Bank Addressable Market1
Segment EE Solar
PV
Residential $24.2B $1.4B
Appendix
Source: 1) Based on Green Bank addressable market by technology, segment, and creditworthiness distribution. Disparity between EE and Solar PV addressable market is due to relative size of the residential segment for each of these technologies (residential is 50% of the addressable market for EE, 16% of the addressable market for solar PV.) See market sizing analysis for more details
Note: All parameters are illustrative only and represent Booz and Company’s opinion based on market research and industry analysis

Booz & Company
Illustrative Offering No. 3: For solar, the Green Bank can contribute subordinated debt in loan funds of large scale solar providers
38
Source: 1) Based on currently implemented programs in the market, with potential to achieve higher leverage with NY Green Bank (e.g., 5:1)
2) Based on Green Bank addressable market by technology, segment, and creditworthiness distribution. See market sizing analysis for more details
Note: All parameters are illustrative only and represent Booz and Company’s opinion based on market research and industry analysis
Average Loan Size $22,000-$23,000
Average Loan Duration 15 years
Credit Rating Range High Credit Quality
Assumed Default Rate 0.8% Annually for Host
Customer
Target Segment Residential
Technology Distributed Solar
Solar Loan
Fund
Solar Loan Fund Model Retail Loan Parameters
Product Description
Private to Public Funds
Ratio1 3:1
Total Debt as % of Fund 100%
Interest Earned Risk Adjusted Returns
Solar Loan Fund Parameters
Provide subordinate debt for a solar loan fund to reduce risk for lenders
Enable home-owners to receive tax credits through 100% ownership of assets, bypassing
expensive tax equity capital
Broaden consumer access to solar financing by lowering interest rate or extending loan tenors
Potential for secondary market exit for corpus of loans
Senior debt
Lenders
Green Bank
Interest payments
Subordinate debt
Interest payments
Loan
payments
Solar loans Solar
Panels
Green Bank Addressable Market2
Segment Solar PV
Residential $1.4B
Host customers
Loan
Originator /
Contractor
Origination Fee Sale of Loans
Government
Tax
credits
Appendix

Booz & Company
Illustrative Offering No. 4: In order to support small solar installers, the Green Bank can create a lease fund
39
Average Lease Size $18,000-$40,000
Average Lease Duration 20 years
Credit Rating Range High Credit Quality
Assumed Default Rate 0.8% Annually
Target Segment Residential
Technology Solar PV, Onshore Wind,
Fuel Cell
Tax Equity Lease Fund Model Retail Lease Parameters
Product Description
Private to Public Funds
Ratio 3:1
Total Debt as % of Fund 50%
GB Debt as % of Total
Debt 10%
Tax Equity Lease Fund Parameters1
Create a residential solar tax equity lease fund by providing sponsor equity, subordinated debt
and credit enhancements
Partner with tax equity investors and lenders to support financing for residential solar leases
Finance and foster competition among smaller-scale solar installers
Partner with other entities to develop an ecosystem (e.g., insurers, service providers)
Addresses high upfront costs, risk aversion of lenders and fragmented vendor landscape
Go to market expected to be longer than one year and via RFP process
Equity capital
Host
Customer Lease/ PPA
Payments
Tax
Equity
Investor
Senior
Lender
Tax credits
Debt capital
Loan Payments
Tax Equity
Lease Fund
Green Bank
Sponsor Equity and
Subordinated Debt Equity and Debt
Returns
Insurance/
Servicing
Provider
Insurance/ Servicing Fee
Insurance/
Servicing
Coverage
Installer Installation Cost Payment
Installation
Loan Loss
Reserve
(Optional)
First Loss
Funding
Green Bank Addressable Market2
Segment Solar PV Onshore
Wind Fuel Cell
Residential $1.4B
Multiple $3.9B TBD
Source: 1) In this offering, the Green Bank would make three investments: a loan loss reserve fund with a 20% First Loss, 90% Loss Share, 1-3% upfront frees and 0.5-1.0% annual charges; a subordinated debt investment with 3-5% interest, and an equity investment with an expected IRR of 9%.
2) Based on Green Bank addressable market by technology, segment, and credit quality distribution. See market sizing analysis for more details
Note: All parameters are illustrative only and represent Booz and Company’s opinion based on market research and industry analysis
Appendix

Booz & Company
Green Bank Overview
Market Assessment
Quantitative Analysis
Operating Model
Appendix
Illustrative Examples
Market Sizing Methodology
Modeling Methodology
Glossary
40

Booz & Company
The market sizing analysis was used to obtain a directional estimate of the maximum market potential for clean energy in NY
41
Appendix: Market Sizing Methodology
Market Sizing Objectives & Scope
Establish a directional estimate of the total
investment potential by segment in NY for energy
efficiency
– Estimate the Green Bank addressable potential by removing the un-addressable and addressed potential from the total technical potential
Establish a directional estimate of the total
investment potential by segment in NY for
renewable generation technologies in the
intermediate future (next 10 years)
Establish a directional estimate of the total
investment potential in NY for other generation
technologies like CHP, biomass, onshore wind,
anaerobic digester
Market Sizing Limitations
Scope only includes potential for energy
efficiency and specific generation technologies
Does not encompass:
– Total potential for utility scale generation
– Total potential for any other generation types aside from distributed solar PV, CHP, onshore wind, biomass, or anaerobic digesters
Analysis does not provide:
– Forecast of potential into long term future (e.g., greater than 10 year horizon)
– Distinction between fuels (e.g. electricity, gas, petroleum) for energy efficiency opportunities
– Estimated size of specific market gaps
Analysis does not incorporate key risks such as:
– Change in average retrofit costs
– Technological innovation in renewables
– Change in legislation and regulation, including incentives

Booz & Company
The addressable potential for each technology is sized through a tailored approach
42
Appendix: Market Sizing Methodology
Market Approach
Energy
Efficiency
Total the number of buildings / units or square feet by building type in each sector in New York
Estimate portion of buildings that could benefit from retrofit (all pre-2008 buildings)
Assume an average retrofit cost by building type or square foot per segment
Distributed
Solar PV
Generation
Estimate new PV installations over next 10 years in NY State from NYSERDA research (2023 estimate) and EIA (Energy
Information Administration) current installations (2013 base)
Apply estimated PV installation costs per Watt to size aggregate addressable potential
Onshore Wind
Estimate potential onshore wind installations over the next 10 years in NY State by extrapolating the average annual new
installations from 2008-2012
Apply estimated onshore wind installation costs per Watt to size aggregate addressable potential
CHP
Determine state-wide technical potential for new CHP sites per NYSERDA report
Reduce technical potential by 50% per NYSERDA program experience
Apply historical construction costs per MW to size aggregate addressable potential
Deducts 20% as un-credit worthy
Biomass
Estimate maximum annual energy production based on total forest biomass wood chip supply in New York
Convert annual energy production into generation capacity based on biomass capacity factor
Apply estimated biomass installation costs per Watt to size aggregate addressable potential
Anaerobic
Digesters
Estimate maximum potential annual energy production from animal waste, food manufacturing, and municipal wastewater
Convert annual energy production into generation capacity
Apply estimated anaerobic digester installation costs per Watt to size aggregate addressable potential

Booz & Company
The energy efficiency total technical potential of $78.1B is sized by estimating building stock or floor space and retrofit estimates
Residential
Multifamily
C&I
MUSH
$78.1 B
$40.2 B
$27.5 B
$4.5 B
$6.0 B
Source: See sizing inputs and source slide
43
Total Technical Potential for
Energy Efficiency
965,679 square feet Amount of pre-2008 square feet
Retrofit cost of $6.2 / square foot
See following page for additional details x
2,240,536,000 square feet Amount of pre-2008 square feet
Retrofit cost of $2.0 / square foot
See following page for additional details x
4,093,286 houses Number of pre-2009 buildings/units
Retrofit cost of $9,810 / house
See following page for cost by house type x
4,145,651 units Number of pre-2009 buildings/units
Retrofit cost of $6,639 / unit
See following page for cost by unit type x
DIRECTIONAL ONLY
Appendix: Market Sizing Methodology

Booz & Company
The energy efficiency total technical potential inputs incorporate NYSERDA, NYCEEC, and government and market report data
44
Residential Pre-2009 NY Buildings Retrofit Cost Per Building Investment ($ B)
Single-Family 3,891,000 $9,810.0 $38.2
Mobile 202,286 $9,810.0 $2.0
Total 4,093,286 $9,810.0 $40.2
Multifamily Pre-2009 NY Units Retrofit Cost Per Unit Investment ($ B)
2-4 units 1,531,407 $9,810.0 $15.0
5+ units 2,614,244 $4,781.0 $12.5
Total 4,145,651 $6,799.6 $27.5
C&I Square feet (in Thousands) Retrofit costs per square foot Investment ($ B)
Office and Bank 750,356 $2 $1.5
Stores and Restaurants 615,918 $2 $1.2
Warehouses 347,820 $2 $0.7
Parking Garage and Auto Service 188,925 $2 $0.4
Amusement 164,340 $2 $0.3
Hotel/Motel 100,546 $2 $0.2
Miscellaneous Nonresidential 72,631 $2 $0.1
Total 2,240,536 $2 $4.5
MUSH Square feet (in Thousands) Retrofit costs per square foot Investment ($B)
Schools, Libraries, Labs 484,333 $5 $2.4
Hospitals and Other Health 228,071 $10 $2.3
Religious 163,203 $5 $0.8
Government Service 90,072 $5 $0.5
Total 965,679 $6.2 $6.0
Detailed Segment Assumptions
Note: Retrofit costs per building for residential ,multi-family, and C&I incorporate NYSERDA estimates based on historical program data; MUSH segments represent estimates per NYCEEC market sizing analysis based on historical experience Number of buildings in NY State based on EIA RECS 2009 (multi-family 5+ units provided by Multifamily Performance Program Market Penetration Estimate); square footage by McGraw Hill per Navigant Existing Facilities Program Report
Source: See sizing inputs and source slide
DIRECTIONAL ONLY
Appendix: Market Sizing Methodology

Booz & Company
The Green Bank addressable potential for distributed solar PV generation is $13.4B per NYSERDA growth estimates…
$2.1B
$1.6B
$6.8B
$2.8B
Residential
Multifamily
C&I
MUSH1
$13.4B
1) MUSH buildings in EIA commercial categorization include Education, Public Assembly, Religious Worship, Health Care, Public Order & Safety
2) Cost per installed Watt represents expected average decline over the next 10 years of 7%, which is an average based on the anticipated decline rates per the US DOE SunShot report Shows installation cost non-inclusive of any rebates
Note: Growth potential of PV may be subject to pending increases in the New York net metering limits
Source: NYSERDA survey, DOE (Department of Energy), EIA, U.S. Census Bureau, - 2009 American Community Survey, Booz & Company analysis
45
x
% Residential in
NY (US Census)
57%
2013 distributed
PV residential
capacity (EIA)
- x
Residential cost
per installed Watt
(NYSERDA)2
x
% PV generation
capacity in NY
relative to U.S. in
2013 (EIA)
x
% Multifamily
residential in NY
(US Census) 4.2 GW $3.5 / W 3.1%
43%
Commercial cost
per installed Watt
(NYSERDA)2
% PV generation
capacity in NY
relative to U.S. in
2013 (EIA)
$2.6 / W 3.1%
x
% of non-MUSH
buildings (EIA)1
71%
x
% of MUSH
buildings (EIA)1
29%
2013 distributed
PV commercial
capacity (EIA)
- x
4.9 GW
x
Total Green Bank Addressable
Potential for Solar PV DG
2023 DG PV commercial capacity
estimated through market survey
and focus of state incentives
(NYSERDA)
3.8 GW
2023 DG PV residential capacity
estimated through market survey
and focus of state incentives
(NYSERDA)
1.2 GW
DIRECTIONAL ONLY
Appendix: Market Sizing Methodology

Booz & Company
…while the Green Bank addressable potential for other generation technologies is $16B
46
DIRECTIONAL ONLY
Appendix: Market Sizing Methodology
$7.7 B
Biomass
Onshore
Wind
Anaerobic
Digester
$16.2 B
CHP
$4.1 B
$3.9 B
$0.4 B
Total Green Bank Addressable
Potential for non-Solar PV DG
8,760 h/yr Hours per year
$3.5 / W Biomass installation cost
per National Institute of
Building Sciences
85% Biomass capacity factor
per Booz proprietary data
300 MW 50% $3,100 x x
195 MW 50% $1,950 x x
1,240 MW 50% $4,900 x x
1,584 MW 50% $3,625 x x
Industry sector: 50-500kW
Industry sector: 500-1,000kW
Commercial sector: 50-500kW
Commercial sector: 500-1,000kW
+
+
+
1) Installed CHP System Cost per EPA “Combined Heat and Power Partnership Economic Benefits”
Source: See sizing inputs and source slide
Potential market in NY
State per NYSERDA report
Addressable market as
% of Total Potential per
NYSERDA experience
Average Site Cost ($,k/MW)
per NYSERDA data
5,159 MW 50% $1,2001 x x All sectors: >1MW +
10 years Intermediate-term timeframe
$1.61 / W Onshore wind installation cost per
Global Wind Energy Council
x 243 MW
Average wind installations in NY
State from 2008-2012 per NREL
x
610,000 NY dairy cows (USDA)
100,000 NY beef cows (USDA)
x
x
385 kwh/year Electricity equivalent (OSU)
230 kwh/year Electricity equivalent (OSU) 8,760 h/yr
Hours per year
20% Filters out
those not
credit
worthy
-
75% Anaerobic
digester capacity
factor per Booz
data
x /
x x x /
4.8 M oven dry tons /
yr
Estimated total forest
biomass woodchips in NY
per NYSERDA
1.83 MWh/oven dry
ton per year Electricity equivalent of
oven dry ton of woodchips
per Atlas Technologies
3,952,975 NY poultry (USDA)
x 2.5 kwh/year Electricity equivalent (OSU)
85,741 NY pigs (USDA)
x 32 kwh/year Electricity equivalent (OSU)
6,672,065,000 cf/yr Municipal Wastewater Biogas
Potential (NYSERDA) x
0.04 kwh/cf Electricity Equivalent assuming
25% efficiency (NYSERDA)
3,828,500,000 cf/yr Food Manufacturing Biogas
Potential (NYSERDA) x
0.04 kwh/cf Electricity Equivalent assuming
25% efficiency (NYSERDA) 8,760 h/yr Hours per year
/

Booz & Company
The Green Bank addressable potential removes unaddressable and addressed potential from the total technical potential
47
GB EE Addressable Market as of 2013
$27.8 B
$27.5 B
$19.7 B
$6.0 B
$9.9 B
$40.2 B
$5.6 B
$3.2 B
$4.5 B
$1.5 B
$4.4 B
Residential
Multifamily
C&I
MUSH
Green Bank Addressable Potential
$55.2 B
Potential Addressed
Through Private Funding
$6.5 B
$2.4 B $2.2 B $0.4 B
Unaddressable Potential - Credit Worthiness
$16.4 B $0.9 B
Total Technical Potential
$78.1 B
Uses ESCO penetration for
Multifamily (10%) C&I (10%) and
MUSH (26%)
Uses 8% for residential per
penetration rate achieved by
Connecticut’s home energy
solutions program (~75K of ~950K
homes eligible have participated)
Source: See sizing inputs and source slide
Uses % of households with FICO
score <600 for residential (25%)
Uses S&P companies rated B and
below which are “more vulnerable”
(20%) for multifamily and C&I
Assumes MUSH is primarily credit
worthy
DIRECTIONAL ONLY
• Estimate of the addressable
technical potential that the Green
Bank could potentially finance
• Directional estimate of the total
potential for investment in NY for
energy efficiency (for 20%-25%
savings)
• Based on number of NY buildings
or square feet and average
retrofit costs
• Estimate of addressable
technical potential that the private
market is funding
• Based on ESCO penetration and
CT residential program
participation rates
• Estimate of total technical
potential excluding incentive
misalignment with credit
worthiness too risky for financing
• Based on sub-B S&P rated
companies and sub-600 FICO
scores
Includes portions of the market with
barriers (e.g., incentive
misalignment) that may make be
challenging to immediately address
Appendix: Market Sizing Methodology

Booz & Company
Low credit worthiness is represented by FICO score for residential and S&P ratings for multifamily and C&I
Credit Worthiness Distribution by Segment
48
DIRECTIONAL ONLY
Appendix: Market Sizing Methodology
Source: Fair Isaac Corporation, SolarCity, S&P
Residential: US FICO Score Distribution Source: Fair Isaac Corporation; Data for FY 2011 per SolarCity
% of
Distribution
300 - 499 6.2%
500 - 549 8.7%
550 - 599 9.8%
600 - 649 10.0%
650 - 699 12.1%
700 - 749 15.5%
750 - 799 19.4%
800 - 850 18.3%
Medium-High
Credit
Worthiness
Low Credit
Worthiness
Multifamily and C&I: S&P Companies rated B and below Source: S&P
Calculation
Number of companies
rated B and below by S&P
(“more vulnerable to
adverse business,
financial and economic
conditions”)
674
Total Companies in S&P
rated database 3,305
Estimated share that is of
low credit worthiness 20%

Booz & Company
The credit worthiness distribution for other sectors is based on small business lending and S&P ratings
Source: US Census Bureau, Pepperdine “State of Small Business” Report, S&P
Large
Medium
Small
NY Relative Size of Companies
by Number of Employees
7.6M
3.7M (48%)
2.5M (33%)
1.5M (19%)
For all US companies rated by the S&P:
High Credit Worthiness: AAA to BBB– = 57%
Low-Medium Credit Worthiness: BB+ to D =
43%
Does not include companies “Not Rated”
According to the Pepperdine “State of Small
Business” report, in 2011 53% of small business
in New York state were unsuccessful receiving
a bank loan
Medium C&I assumed to be average of “small”
and “large” C&I
Low-Medium
Credit Worthiness
High Credit
Worthiness
53% 47%
Low-Medium
Credit Worthiness
High Credit
Worthiness
48% 53%
49
Size Classification Credit Worthiness Distribution
Low-Medium
Credit Worthiness
High Credit
Worthiness
43% 57%
1-19
Employees
20-499
Employees
500+
Employees
DIRECTIONAL ONLY
Appendix: Market Sizing Methodology

Booz & Company
Green Bank Overview
Market Assessment
Quantitative Analysis
Operating Model
Appendix
Illustrative Examples
Market Sizing Methodology
Modeling Methodology
Glossary
50

Booz & Company
Modeling makes several simplifying assumptions which do not detract from the comparison of the Green Bank vs. BAU
51
Appendix: Model Assumptions
PRELIMINARY AND NON-EXHAUSTIVE
Assumptions Description Commentary
Disregards return of Green Bank capital
to ratepayer
Model and selected metrics do not
capture effect of return of capital at
the end of the 10,15,20, 40 year
period
Not modeled but would favor the Green Bank relative to the BAU if
modeled in detail
Hypothetical nature of investments Model assumes that financing
extended or an incentive
approved/allocated will always result
in an energy deployment
Same assumption is applied to both scenarios, will not affect
comparison
Separate from loan default rates which are modeled
Only key cashflows are modeled Model captures only material
cashflows, sufficient to enable the
comparison of the Green Bank to the
BAU scenario
Only material cashflows (value of financing, certain fees and
changes) are modeled
Holistic model of the Green Bank or BAU capturing overhead,
program managers is unnecessary to facilitate the comparison
Any changes to current incentive levels
are driven by Green Bank activities
Model captures hypothetical
situations in which incentive levels
may fall, but only for Green Bank
scenario
Any changes to incentive levels in the BAU scenario, absent the
creation of the Green Bank, would be the result of economic forces
or policy decision external the existence of a Green Bank
Therefore modeling BAU scenarios in which incentives change is not
within the scope of this analysis
Source: Booz & Company analysis, Market research
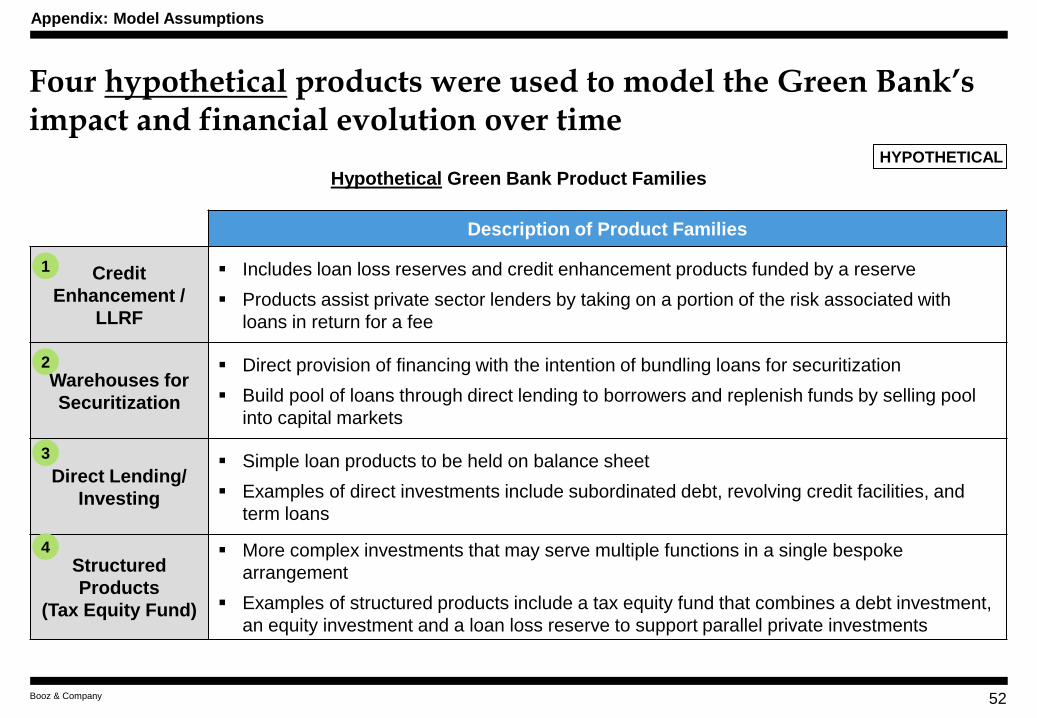
Booz & Company
Description of Product Families
Credit
Enhancement /
LLRF
Includes loan loss reserves and credit enhancement products funded by a reserve
Products assist private sector lenders by taking on a portion of the risk associated with
loans in return for a fee
Warehouses for
Securitization
Direct provision of financing with the intention of bundling loans for securitization
Build pool of loans through direct lending to borrowers and replenish funds by selling pool
into capital markets
Direct Lending/
Investing
Simple loan products to be held on balance sheet
Examples of direct investments include subordinated debt, revolving credit facilities, and
term loans
Structured
Products
(Tax Equity Fund)
More complex investments that may serve multiple functions in a single bespoke
arrangement
Examples of structured products include a tax equity fund that combines a debt investment,
an equity investment and a loan loss reserve to support parallel private investments
Four hypothetical products were used to model the Green Bank’s impact and financial evolution over time
52
1
2
3
4
Appendix: Model Assumptions
Hypothetical Green Bank Product Families
HYPOTHETICAL

Booz & Company
Four basic types of cashflow models are used to develop the total leverage ratio
53
Discussion
Four basic model types: credit
enhancement / loan-loss return
funds, warehouses for
securitization, direct
lending/investing and structured
products
Models calculate Green Bank
capital deployment and total energy
investment
Metrics are combined from the
various models
These metrics are then combined
as a weighted average to get Green
Bank overall metrics or product
family metrics
Model is also used to generate ROI,
sensitivity analysis and additional
scenarios where necessary
Green Bank
Combined Product Metrics
Credit-
enhance-
ment
/ LLRF
Ware-
houses for
securiti-
zation
Direct
lending/
investing
Structured
products
1 2 3 4
PRELIMINARY
Appendix: Model Assumptions

Booz & Company
Product family modeling captures how funds invested in product offerings generate investments
54
Illustrative Example
Discussion
Description of model logic for loan
loss reserve fund example
– Credit enhancement and loss guarantees are backed by a reserve fund
– Loans are enabled by credit enhancement/loss guarantees
– Loans are reissued on full repayment of loans
– Excess cashflows are not automatically used to make new loans
Key cashflows modeled:
– Loan defaults
– Loss covered by Green Bank,
– Money-market investment
returns
– Fee and charges (upfront fee,
annual charge, admin fee)
Loan Loss
Reserve Fund
Loans Issued Loans Issued
Key assumption
Model Logic – Loan Loss Reserve Fund Example
Investments
Enabled
Invested Funds
First Loss %
Time To Deploy
Term of loan
Explanatory Note
When original loans supported
are fully repaid, reserves can
be committed to new loans
Debt to Value (“DTV”) Ratio
Pr Pu Private Funds Public Funds
Pr Pr
Pu
Reserves are committed to
support loans
Incentives Pu
PRELIMINARY
Appendix: Model Assumptions
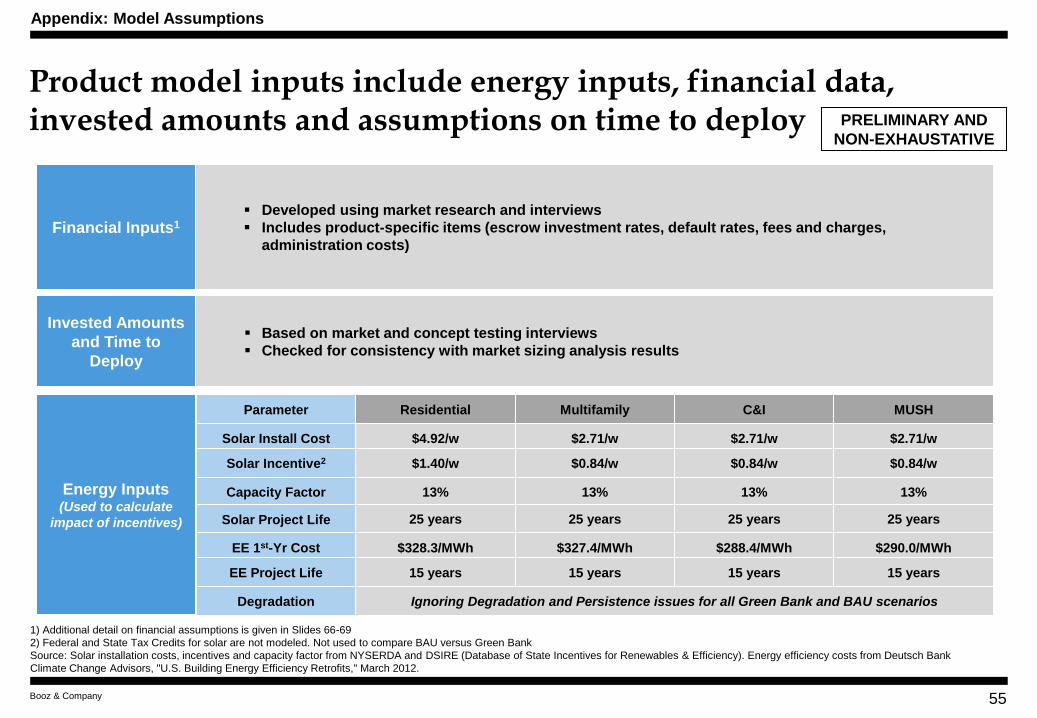
Booz & Company
Product model inputs include energy inputs, financial data, invested amounts and assumptions on time to deploy
55
Financial Inputs1
Based on market and concept testing interviews
Checked for consistency with market sizing analysis results
Developed using market research and interviews
Includes product-specific items (escrow investment rates, default rates, fees and charges,
administration costs)
Energy Inputs (Used to calculate
impact of incentives)
Parameter Residential Multifamily C&I
Solar Install Cost $4.92/w $2.71/w $2.71/w
Solar Incentive2 $1.40/w $0.84/w $0.84/w
Capacity Factor 13% 13% 13%
Solar Project Life 25 years 25 years 25 years
EE 1st-Yr Cost $328.3/MWh $327.4/MWh $288.4/MWh
EE Project Life 15 years 15 years 15 years
Degradation Ignoring Degradation and Persistence issues for all Green Bank and BAU scenarios
MUSH
$2.71/w
$0.84/w
13%
25 years
$290.0/MWh
15 years
Invested Amounts
and Time to
Deploy
PRELIMINARY AND
NON-EXHAUSTATIVE
1) Additional detail on financial assumptions is given in Slides 66-69
2) Federal and State Tax Credits for solar are not modeled. Not used to compare BAU versus Green Bank
Source: Solar installation costs, incentives and capacity factor from NYSERDA and DSIRE (Database of State Incentives for Renewables & Efficiency). Energy efficiency costs from Deutsch Bank
Climate Change Advisors, "U.S. Building Energy Efficiency Retrofits," March 2012.
Appendix: Model Assumptions

Booz & Company
Leverage of public dollars in the BAU is fixed, but leverage for Green Bank depends on period of analysis and usage of incentives
56
PRELIMINARY
Note: Upfront leverage ratios generated from separate model than 10 year or 20 year Impact Analysis model results.
Source: Allocation data is from NYSERDA’s July 10th draft of the NY Green Bank Capitalization and Resource Constraint Analysis.
Total
Leverage
Ratio
Business
As Usual
(“BAU”)
0% of Green Bank
Dollars Use Incentives
100% of Green Bank
Dollars Use Incentives
Upfront (Ignoring
Recycling)
3.8
3.5 2.1
10 Years 7.9 2.3
20 Years 13.8 2.7
Discussion
BAU leverage ratio is fixed, and is
dependent on the share of incentive
contribution v. owner contribution to
an investment
Green Bank leverage increases over
time as money is recycled
However, Green Bank leverage
decreases based on the extent to
which Green Bank investments also
use incentives, as more public dollars
support the same private investment
While many Green Bank products
may target market segments
presently covered by incentives, not
all customers receiving Green Bank
financing will necessarily seek or
receive incentives
Therefore the true Green Bank
leverage ratio will fall between the 0%
and 100% ratios in the table
Green Bank Usage of Incentives
Pe
rio
d o
f A
naly
sis
Real world scenarios will fall in between the scenarios in which 0% and 100% of
Green Bank investments receive subsidies
1
2 3
Appendix: Calculation of Total Leverage Ratio

Booz & Company
The overall BAU leverage ratio is a weighted average of the leverage ratios of the underlying programs
57
1) EEPS Energy Efficiency Portfolio Standard
2) RPS Renewable Portfolio Standard
Source: Allocation data is from NYSERDA’s July 10th draft of the NY Green Bank Capitalization and Resource Constraint Analysis.
PRELIMINARY
Appendix: Calculation of Total Leverage Ratio
Discussion
BAU leverage ratio is based on the
weighted average leverage ratios of
energy efficiency and renewable energy
programs
The BAU leverage ratio equals total
energy investment (both public and private
contribution) divided by incentives
provided
Leverage ratios calculated based on
program specific data where available and
assumptions where no data was available
Two leverage ratios are combined as a
weighted average, with weightings based
on the number of dollars potentially
reallocated from each portfolio to the
Green Bank in the initial funding request
BAU Leverage
Ratio Leverage Ratio
Potentially
Reallocated Funds
($M)
Energy Efficiency1 4.2 $115.6
Renewable
Energy2 2.8 $50.0
Weighted
Average 3.8 $165.6
A
B
1

Booz & Company
Energy
Efficiency
Leverage
Ratio
Incentive
Budget ($M)
Incentive Share
of Total
Investment
Estimated
Owner
Contribution
($M)
Total
Investment
($M)
Low Income $153 73% $57 $210
Residential $184 19% $807 $992
Multifamily $98 35% $183 $281
C&I $775 22% $2,720 $3,493
Total/
Wtd. Average $1,211 24% $3,767 $4,977
The BAU leverage ratio for Energy Efficiency programs is based on EEPS2 programs
58
Source: NYSERDA Data is taken directly from NYSERDA’s leverage data gathered for NY Works Task Force; in the absence of publicly available information, utility cost-share estimates
were developed for this illustrative analysis.
PRELIMINARY
Appendix: Calculation of Total Leverage Ratio
Discussion
BAU leverage ratio for EEPS
programs is based on data and
incentive share assumptions and is
for illustrative purposes only.
Leveraging of public funding is not a
performance metric that DPS
requires EEPS program
administrators to measure or report
on. Therefore, there is very little
publicly available information on
utility program leveraging.
Sector-specific incentive share
figures represent weighted average
of underlying programs addressing
each sector
Leverage ratio is calculated as 1
divided by incentive share
Leverage ratio only captures public
dollars spent on incentives, not the
entire program budget
1
Incentive Share = Leverage Ratio
1
24% = 4.2 A

Booz & Company
Renewable
Energy
Leverage
Ratio
Incentive
Budget ($M)
Incentive Share
of Total
Investment
Estimated
Owner
Contribution
($M)
Total
Investment
($M)
Main Tier $2,234 37% $3,842 $6,076
PV $160 33% $324 $484
NY-Sun $227 30% $529 $756
Solar Thermal $20 32% $43 $64
Anaerobic
Digesters $76 36% $135 $211
Fuel Cells $23 39% $35 $58
Small Wind $21 37% $37 $58
Total/
Wtd. Average $2,761 36% $4,945 $7,707
The BAU leverage ratio for Renewable Energy is based on RPS programs
59
1) CST denotes Customer- Sited Tier
Source: CST leveraging is taken directly from NYSERDA’s leverage data gathered for NY Work Task Force and NYSERDA estimates of Main Tier Leveraging.
PRELIMINARY
Appendix: Calculation of Total Leverage Ratio
Discussion
BAU leverage ratio for NYSERDA
RPS programs is based on
incentive share data gathered by
NYSERDA for each program
Leverage ratio is calculated as 1
divided by incentive share
Leverage ratio only captures public
dollars spent on incentives, not the
entire program budget
1
Incentive Share = Leverage Ratio
1
36% = 2.8 B

Booz & Company
Potential
Green Bank
Products
Hypothetical
Allocation ($M)
Typical Product
Upfront Leverage
Leverage of
Hypothetical GB
Products
Loan Loss
Reserve Funds $57 5x – 10x 5.18
Loan
Warehouses $55 1x – 1.5x 1.25
Direct Lending
Products $30 3x – 5x 4.7
Structured
Products $24 2x – 5x 3.4
Total/
Wtd. Average $166 3.5
If no Green Bank investments use incentives, the leverage ratio is the average of a hypothetical set of products
60
2
Source: Market Research and Interviews for hypothetical product suite
PRELIMINARY
Appendix: Calculation of Total Leverage Ratio
Discussion
Green Bank initial leverage ratio is
equal to the weighted average of
the initial leverage ratios of each
hypothetical product
Leverage ratios illustrated on this
page represent the leverage
achieved through initial product
design, not through recycling and
recapitalization
Estimates for the range of leverage
ratios applicable to each product
were obtained through market
research
Leverage ratios are weighted based
on hypothetical allocation of capital
to each group of products
INITIAL LEVERAGE RATIOS USED ONLY TO ILLUSTRATE METRIC. GREEN
BANK LEVERAGE RATIOS INCREASE OVER TIME THROUGH RECYCLING AND
RECAPITALIZATION

Booz & Company
If all Green Bank investments use incentives, the leverage ratio only depends on BAU and Green Bank leverage with no incentives
61
2.1
Total Investment Dollars
Public Dollars
GB Generated Investment + Incentives
GB Dollars + Incentives =
GB Generated Investment = GB Dollars x GB Leverage GB Generated Investment
(BAU Leverage – 1) Incentives =
(GB Dol x GB Lev) (GB Dol x GB Lev)
(BAU Lev – 1) +
GB Dol + (GB Dol x GB Lev)
(BAU Lev – 1)
(GB Dol x GB Lev) x (BAU Lev – 1) + (GB Dol x GB Lev)
(BAU Lev – 1)
GB Dol x (BAU Lev – 1) + (GB Dol x GB Lev)
(BAU Lev – 1)
=>
GB Dol x GB Lev x [(BAU Lev – 1) + 1]
GB Dol x [(BAU Lev – 1) +GB Lev]
=>
=>
GB Lev x BAU Lev
GB Lev + BAU Lev - 1
Leverage
Ratio =
3.5 x 3.8
3.5 + 3.8 - 1 => 3
PRELIMINARY
Appendix: Calculation of Total Leverage Ratio
INITIAL LEVERAGE RATIOS USED ONLY TO ILLUSTRATE METRIC. GREEN BANK LEVERAGE RATIOS INCREASE OVER TIME THROUGH
RECYCLING AND RECAPITALIZATION

Booz & Company
= $311M + $2,063M
$166M + $82M
$2,374M
$248M = 9.6 GB Total Leverage Ratio =
Example: 10% of Green Bank investments also receive incentives
62
$166M x GB Total Leverage Ratio of
13.8 = $2,292M
10% goes to
projects with
subsidies
90% goes to
projects with no
subsidies
SIMPLIFIED AND ILLUSTRATIVE
$166M
GB
Unleveraged
Capital
GB
Leveraged
Capital
Option 2: Invest in the Green
Bank
Total Energy
Investment
$2,292M x 10% = $229M invested
$229M of GB Private Capital attracts incentives at the
BAU leverage ratio of 3.8 to 1
$229M / (3.8 -1) = $82M in incentives
Total investment (gross of subsidies) = $311M
$2.292 x 90% = $2,063M
invested
Incentives
$82M of
Incentives
Assumptions
BAU Leverage = 3.8
– Includes 1 public and 2.8 private dollars, totaling 3.8
GB Leverage = 13.8 (based on 20 year projections)
Commission decision to deploy $166M to incentive programs or Green Bank
BAU Leverage Ratio of
3.8
Option 1: Invest $166M in incentives as
currently earmarked
For this example, where 10%
of GB investments receive
subsidies, GB Lev.> BAU
1
1
3
2
4
4
2
3
Appendix: Calculation of Total Leverage Ratio

Booz & Company
3.4
Example: 90% of Green Bank investments also receive incentives
63
$166M x GB Total Leverage Ratio of
13.8 = $2,292M
90% goes to
projects with
subsidies
10% goes to
projects with no
subsidies
SIMPLIFIED AND ILLUSTRATIVE
$166M
GB
Unleveraged
Capital
GB
Leveraged
Capital
Option 2: Invest in the Green
Bank
Total Energy
Investment
$2.292M x 90% = $2,063M invested
$2,063M of GB Private Capital attracts incentives at
the BAU leverage ratio of 3.8 to 1
$2,063M / (3.8 -1) = $737 in incentives
Total investment (gross of subsidies) = $2,800M
$2,292M x 10% = $229M
invested
Incentives
$737M of
Incentives
Assumptions
BAU Leverage = 3.8
– Includes 1 public and 2.8 private dollars, totaling 3.8
GB Leverage = 13.8 (based on 20 year projections)
Commission decision to deploy $166M to incentive programs or Green Bank
BAU Leverage Ratio of
3.8
For this example, where 90%
of GB investments receive
subsidies, GB Lev. <BAU
$2,800M + $229M
$166M + $737M
$3,029M
$903M = GB Total Leverage Ratio = =
1
3
4
2
1 2
4 3
Appendix: Calculation of Total Leverage Ratio
Option 1: Invest $166M in incentives as
currently earmarked

Booz & Company
The Green Bank’s leverage ratio exceeds that of the BAU when less than 70% of Green Bank dollars also use incentives
64
Discussion
As more Green Bank investments use state-
funded/ ratepayer incentives, the Green
Bank’s leverage ratio falls
Over a 20-year window of analysis, the
Green Bank’s leverage may range from ~3 to
~14, depending on usage of incentives
This range is based on a hypothetical suite of
Green Bank products and capital allocation
Under this hypothetical situation, the Green
Bank leverage ratio exceeds BAU when less
than 70% of Green Bank dollars also use
incentives
Figures represent a HYPOTHETICAL suite of products and allocation of Green Bank capital.
ILLUSTRATIVE
Source: Booz & Company analysis
Appendix: Calculation of Total Leverage Ratio
20-Year Leverage Ratio
0
2
4
6
8
10
12
14
16
18
0 10 20 30 40 50 60 70 80 90 100
% of Green Bank Investments Receiving
State/ Ratepayer Funded Incentives
BAU Leverage Ratio = 3.8
Leverage
Ratio

Booz & Company
20-Year Cumulative Leverage Ratio
(Static Incentive Levels)
0
2
4
6
8
10
12
14
16
18
0% 25% 50% 75% 100%
Level of Incentives Available to Green Bank
as a % of Current Incentive Level
Leverage
Ratio
Source: Booz & Company analysis
If limited to 75% or less of existing incentive levels, Green Bank investments achieve leverage that is at least as good as the BAU
65
Discussion
The Green Bank leverage ratio is slightly lower
than the BAU leverage ratio when Green Bank
projects receive the full level of incentives (i.e.,
100%)
If we conservatively assume that 100% of
Green Bank investments use incentives, then
the 20-year leverage ratio of the Green Bank
exceeds that of the BAU when incentives are
reduced to roughly 75% of the current level
As the incentive levels that Green Bank
investments are eligible for increases, the
leverage ratio climbs significantly
The chart on the left assumes that
– Incentives are static over time
– 100% of Green Bank investments receive incentives
BAU Leverage
Ratio = 3.8
Appendix: Calculation of Total Leverage Ratio
For example, if the current
solar incentive is $1.4/W, the
50% line implies that the
Green Bank investments
only get $0.7/W.

Booz & Company
Key Assumptions And Sourcing (1 of 4): Energy Inputs
66
ILLUSTRATIVE
Appendix: Additional Model Assumptions
EE First-Year Cost $/MWh Source
Residential $328.3 DB Climate Change Advisors, "U.S. Building Energy Efficiency Retrofits," March 2012.
Multifamily $327.4 DB Climate Change Advisors, "U.S. Building Energy Efficiency Retrofits," March 2012.
MUSH $288.4 DB Climate Change Advisors, "U.S. Building Energy Efficiency Retrofits," March 2012.
C&I $290.0 DB Climate Change Advisors, "U.S. Building Energy Efficiency Retrofits," March 2012.
Technical Inputs Source
Project Life (Years) 15 Interviews with Existing Market Participants
GWh/Tbtu Conversion 293.07 EIA
MWh/Dth Conversion 0.2931 EIA
ENERGY EFFICIENCY INPUTS
Installation Cost $/watt Source
Residential $4.92 NYSERDA
Multifamily $2.71 NYSERDA; Governor's July 9, 2013 Press Release
MUSH $2.71 NYSERDA; Governor's July 9, 2013 Press Release
C&I $2.71 NYSERDA; Governor's July 9, 2013 Press Release
NY Incentive $/watt Source
Residential $1.40 DSIRE; NYSERDA Website
Multifamily $0.84 NYSERDA; Governor's July 9, 2013 Press Release
MUSH $0.84 NYSERDA; Governor's July 9, 2013 Press Release
C&I $0.84 NYSERDA; Governor's July 9, 2013 Press Release
Technical Inputs Source
Capacity Factor 13% NYSERDA
Project Life (Yrs) 25 Interviews with Existing Market Participants
SOLAR ENERGY INPUTS

Booz & Company
Key Assumptions And Sourcing (2 of 4): LLRF Examples in Hypothetical Set
67
Appendix: Additional Model Assumptions
ILLUSTRATIVE
Parameter Input Source
Annual Default Rate 0.80% Based on GJGNY Residential EE Loan Performance
Years to Deploy 2 Interviews with Existing Market Participants
Loan Term 9 Interviews with Existing Market Participants
Interest on Loan 7% Interviews with Existing Market Participants
LLRF Coverage Years 4 Interviews with Existing Market Participants
First Loss % 20% Interviews with Existing Market Participants
Loss Share 90% Typical product structure
Escrow Interest Rate 0.10% Assumed Money Market Rate
Upront Fee 5.00% Market interviews, concept testing and industry research.
Annual Charge 4.50% Market interviews, concept testing and industry research.
Assumed DTV of Project 80% Energy Efficiency Finance Corp. LLRF Example
LLRF - LOAN EXTENSION - MF EE
Parameter Input Source
Annual Default Rate 0.80% Based on GJGNY Residential EE Loan Performance
Years to Deploy 2 Interviews with Existing Market Participants
Loan Term 6 Interviews with Existing Market Participants
Interest on Loan 7% Interviews with Existing Market Participants
LLRF Coverage Years 3 Interviews with Existing Market Participants
First Loss % 10% Interviews with Existing Market Participants
Loss Share 90% Typical product structure
Escrow Interest Rate 0.10% Assumed Money Market Rate
Upront Fee 7.50% Market interviews, concept testing and industry research.
Annual Charge 4.50% Market interviews, concept testing and industry research.
Assumed DTV of Project 80% Energy Efficiency Finance Corp. LLRF Example
LLRF - PACE - EE INPUTS
Parameter Input Source
Annual Default Rate 0.80% Based on GJGNY Residential EE Loan Performance
Years to Deploy 2 Interviews with Existing Market Participants
Loan Term 15 Interviews with Existing Market Participants
Interest on Loan 7.00% Interviews with Existing Market Participants
LLRF Coverage Years 7 Interviews with Existing Market Participants
First Loss % 10% Interviews with Existing Market Participants
Loss Share 90% Typical product structure
Escrow Interest Rate 0.10% Assumed Money Market Rate
Upront Fee 7.50% Market interviews, concept testing and industry research.
Annual Charge 4.50% Market interviews, concept testing and industry research.
Assumed DTV of Project 80% Energy Efficiency Finance Corp. LLRF Example
LLRF - PACE - SOLAR INPUTS
Parameter Input Source
Annual Default Rate 0.80% Based on GJGNY Residential EE Loan Performance
Years to Deploy 2 Interviews with Existing Market Participants
Loan Term 20 Interviews with Existing Market Participants
Interest on Loan 9.00% Interviews with Existing Market Participants
LLRF Coverage Years 10 Interviews with Existing Market Participants
First Loss % 20% Interviews with Existing Market Participants
Loss Share 90% Typical product structure
Escrow Interest Rate 0.10% Assumed Money Market Rate
Upront Fee 5.00% Market interviews, concept testing and industry research.
Annual Charge 4.50% Market interviews, concept testing and industry research.
Assumed DTV of Project 50% Based on Tax Equity Fund Structure
LLRF - TAX EQUITY FUND - RESIDENTIAL SOLAR

Booz & Company
Key Assumptions And Sourcing (3 of 4): Warehousing & Direct Debt in Hypothetical Set
68
ILLUSTRATIVE
Appendix: Additional Model Assumptions
Parameter Input Source
Annual Default Rate 0.80% Based on GJGNY Residential EE Loan Performance
Years to Deploy 3 Interviews with Existing Market Participants
Term 12 Interviews with Existing Market Participants
GB % of Total Capital 80% Interviews with Existing Market Participants
Interst Rate 3.50% Interviews with Existing Market Participants
Escrow Interest Rate 0.40% Assumed Money Market Rate
Securitization Fee 1.00% Bloomberg
Profit Margin in Pool 1.50% Product-based assumption.
WAREHOUSE - NYSERDA - RESIDENTIAL EE
Parameter Input Source
Annual Default Rate 0.80% Based on GJGNY Residential EE Loan Performance
Years to Deploy 3 Interviews with Existing Market Participants
Term 8 Interviews with Existing Market Participants
GB % of Total Capital 80% Interviews with Existing Market Participants
Interst Rate 3.50% Interviews with Existing Market Participants
Escrow Interest Rate 0.40% Assumed Money Market Rate
Securitization Fee 1.00% Bloomberg
Profit Margin in Pool 1.50% Product-based assumption.
WAREHOUSE - C&I EE
Parameter Input Source
Annual Default Rate 0.80% Based on GJGNY Residential EE Loan Performance
Term 15 Interviews with Existing Market Participants
Years to Deploy 2 Interviews with Existing Market Participants
GB Debt as a % of Total Debt 25.00% Interviews with Existing Market Participants
Interst Rate 6.00% Interviews with Existing Market Participants
Escrow Interest Rate 0.40% Assumed Money Market Rate
SUBORDINATED DEBT - RESIDENTIAL SOLAR
Parameter Input Source
Annual Default Risk 0.80% Interviews with Existing Market Participants
% of Facility Used 50.00% Interviews with Existing Market Participants
Annual Charge on Total 0.50% Interviews with Existing Market Participants
Interest Rate 8.00% Interviews with Existing Market Participants
Borrower Leverage 5 Interviews with Existing Market Participants
REVOLVER - C&I EE

Booz & Company
Key Assumptions And Sourcing (4 of 4): Hypothetical Structured Products
69
ILLUSTRATIVE
Appendix: Additional Model Assumptions
Parameter Input Source
Total Fund Size $80.0M Interviews with Existing Market Participants
Sponsor Equity Share 16.6% Based on CEFIA's Solar Lease 2 Product
Tax Equity Share 33.4% Based on CEFIA's Solar Lease 2 Product
Senior Debt Share 45.0% Based on CEFIA's Solar Lease 2 Product
Subordinated Debt Share 5.0% Based on CEFIA's Solar Lease 2 Product
LLR Size $6.3M Based on CEFIA's Solar Lease 2 Product
Term 20 Based on CEFIA's Solar Lease 2 Product
Years to Deploy 2 Interviews with Existing Market Participants
LLR Fund
Annual Default Rate 0.8% Based on GJGNY Residential EE Loan Performance
Interest on Loan 9% Based on CEFIA's Solar Lease 2 Product
LLRF Coverage Years 10 Interviews with Existing Market Participants
First Loss % 16% Based on Tax Equity Fund Structure
Loss Share 90% Interviews with Existing Market Participants
Escrow Interest Rate 0.10% Assumed Money Market Rate
Upront Fee 5.00% Market interviews, concept testing and industry research.
Annual Charge 4.50% Market interviews, concept testing and industry research.
Subordinated Debt
Default Rate 16.00% Based on GJGNY Residential EE Loan Performance
Interst Rate 3.00% Based on CEFIA's Solar Lease 2 Product
Escrow Interest Rate 0.40% Assumed Money Market Rate
Sponsor Equity
Expected IRR 9% Based on CEFIA's Solar Lease 2 Product
GREEN BANK TAX EQUITY FUND

Booz & Company
Green Bank Overview
Market Assessment
Quantitative Analysis
Operating Model
Appendix
Illustrative Examples
Market Sizing Methodology
Modeling Methodology
Glossary
70

Booz & Company
Glossary
71
Abbreviation Term Definition
ADG/ AD Anaerobic Digestion Production of methane gas through the breakdown of biodegradable material by microorganisms
C&I Commercial and Industrial Buildings used for commercial and industrial purposes
CEFC Clean Energy Finance Corporation The Australian Green Bank launched in July 2013 to overcome capital market barriers that hinder the financing, commercialization
and deployment of renewable energy, energy efficiency and low emissions technologies
CEFIA Clean Energy Finance and Investment Authority The Connecticut Green Bank established in 2011; offers a variety of renewable energy and energy efficiency programs
CHP Combined Heat Power Use of wasted heat or power to generate electricity
C-PACE Commercial-Property Assessed Clean Energy Program for commercial, industrial, and multifamily buildings that enables homeowners to make energy efficiency repayments
through their tax assessment
EE Energy Efficiency Products and construction that lead to more efficient use of energy and reduce the amount of energy consumed
EEPS Energy Efficiency Portfolio Standard Order instituted by the Public Service Commission in 2007 with the goal of reducing electricity usage in New York by 15% from
projected electricity usage in 2015
ESA Energy Service Agreement Contract that permits energy efficiency to be packaged as a service so that building owners provide no or minimal upfront capital and
pay for the energy efficiency installation over time through passing on accumulated savings to the service provider
ITC Investment Tax Credit Federal tax policy that offers 30% tax credit for residential solar systems and will remain in effect through December 31, 2016
LLR Loan Loss Reserve Reserve held against total loans on the asset sheet, representing the amount adequate to cover estimated losses
LMI Low to Moderate Income Income range defined by US Department of Housing and Urban Development
LTV Loan to Value Ratio Ratio of a loan to the value of an asset purchased
MESA Managed Energy Service Agreement Similar structure to ESA but where the customer's energy service is managed by a special purpose vehicle
NRDC Natural Resources Defense Council New York City-based non-profit environmental advocacy group; promotes renewable energy sources, conservation, energy
efficiency, and clean fuels as solutions to reduce the impact of climate change
NYCEEC New York City Energy Efficiency Corporation Non-profit financial corporation that catalyzes energy efficiency projects throughout the five boroughs of New York City
PPA Power Purchase Agreement Financial arrangement where a third-party owner owns, operates, and maintains a solar system and the customer agrees to site the
system and purchase the electric output
PTC Production Tax Credit Federal per-kilowatt-hour tax credit for electricity generated by qualified energy resources and sold by the taxpayer to an unrelated
person during the taxable year
RFP Request for Proposal Solicitation by an agency interested in procurement of a commodity or service, often made through a bidding process
RGGI Regional Greenhouse Gas Initiative Market-based regulatory program to reduce greenhouse gas emissions through government auctions of carbon allowances in the
Mid-Atlantic and Northeastern regions of the U.S.
ROI Return on Investment Net benefit resulting from an investment relative to the amount of capital required
RPS Renewable Portfolio Standard Fund gathered through a surcharge on each kilowatt-hour sold by the state’s investor-owned utilities to increase the portion of
renewable electricity consumed in New York
SBC Systems Benefit Charge Charge on customer’s bill for all non-exempt New York Utilities that is used to fund NYSERDA energy efficiency and renewable
energy programs
UK GIB United Kingdom Green Investment Bank The United Kingdom Green Bank established in 2012 with the mission to accelerate the UK's transition to a green economy and to
create an enduring Institution, operating independently of Government
Appendix
Sources: National Non-Food Crops Centre, CEFC, Clark Energy, DSIRE, Energy RealPlay, EPA, Investopedia, NRDC, NYCEEC, NYSERDA, RGGI, UK Green Investment Bank. SEIA