new york city police pension fund ...new york city police pension fund (the plan), a pension trust...
TRANSCRIPT

NEW YORK CITY POLICE PENSION FUND
SUBCHAPTER TWO
A PENSION TRUST FUND OF THE CITY OF NEW YORK
COMPREHENSIVE ANNUAL FINANCIAL REPORT
FISCAL YEAR ENDED
June 30, 2004
NEW YORK, NEW YORK


NEW YORK CITY POLICE PENSION FUND
A PENSION TRUST FUND OF THE CITY OF NEW YORK
Comprehensive Annual Financial Report
FISCAL YEAR ENDED
June 30, 2004
New York, New York

NEW YORK CITY
POLICE PENSION FUND
COMPREHENSIVE ANNUAL FINANCIAL REPORTA PENSION TRUST FUND OF THE CITY OF NEW YORK
FOR THEFISCAL YEAR ENDED JUNE 30, 2004
Prepared By : Accounting Unit under the direction of: MICHAEL WELSOME - Executive Director New York City Police Pension Fund
Actuary ROBERT C. NORTH JR. Chief Actuary
Custodian of the Fund WILLIAM C. THOMPSON Jr.- Comptroller of the City of New York
Headquarters Address New York City Police Pension Fund 233 Broadway, 25th Floor New York, N.Y. 10279
Board of Trustees Hon. MICHAEL R. BLOOMBERG, Mayor Hon. RAYMOND W. KELLY, Police Commissioner, Chairman Hon. WILLIAM C. THOMPSON Jr., Comptroller, Treasurer Hon. MARTHA E. STARK, Finance Commissioner of the City of New York P.O. PATRICK J. LYNCH, President of the Patrolmen's Benevolent Association
P.O. JOHN PUGLISI, First Vice-President of the Patrolmen's Benevolent Association P.O. MUBARAK ABDUL-JABBAR, Second Vice-President of the Patrolmen's Benevolent Assoc. P.O. JOHN FLYNN, Board of Trustees, Patrolmen's Benevolent association
Capt. JOHN DRISCOLL, President of the Captains' Endowment AssociationLt. ANTHONY GARVEY, President of the Lieutenants' Benevolent Association
Sgt. EDWARD MULLINS, President of the Sergeants' Benevolent AssociationDet. MICHAEL J. PALLADINO, President of the Detectives' Endowment Association
1


NEW YORK CITY POLICE PENSION FUNDCOMPREHENSIVE ANNUAL FINANCIAL REPORT
A PENSION TRUST FUND OF THE CITY OF NEW YORKTABLE OF CONTENTS
PAGE1. INTRODUCTORY SECTION
Certificate of Achievement for Excellence in Financial Reporting 6 Letter of Transmittal 8 Administrative Organization 15
II. FINANCIAL SECTION
Independent Auditor's Report 17 Management Discussion and Analysis 19
Basic Financial Statements
A. Statements of Plan Net Assets 23B. Statements of Changes in Plan Net Assets 24C. Notes to Basic Financial Statements 25
Required Supplementary Information
Schedule 1- Schedule of Funding Progress 36 Schedule 2- Schedule of Employer Contributions 38 Schedule 3- Actuarial Methods and Assumptions 39
Optional Financial Reports
Schedule 4- Schedule of Administrative Expenses 40 Schedule 5- Broker's Commission Report 41 Schedule 6- Management Fees 49
III. INVESTMENT SECTION
Investment Policy 53 Consolidated Performance Report 56 Asset Allocation 6-30-93 to 6-30-03 66 Fixed Income Holdings 67 Equity Holdings 69 Investment Summary 71 Schedule 6- Management Fees 72
3
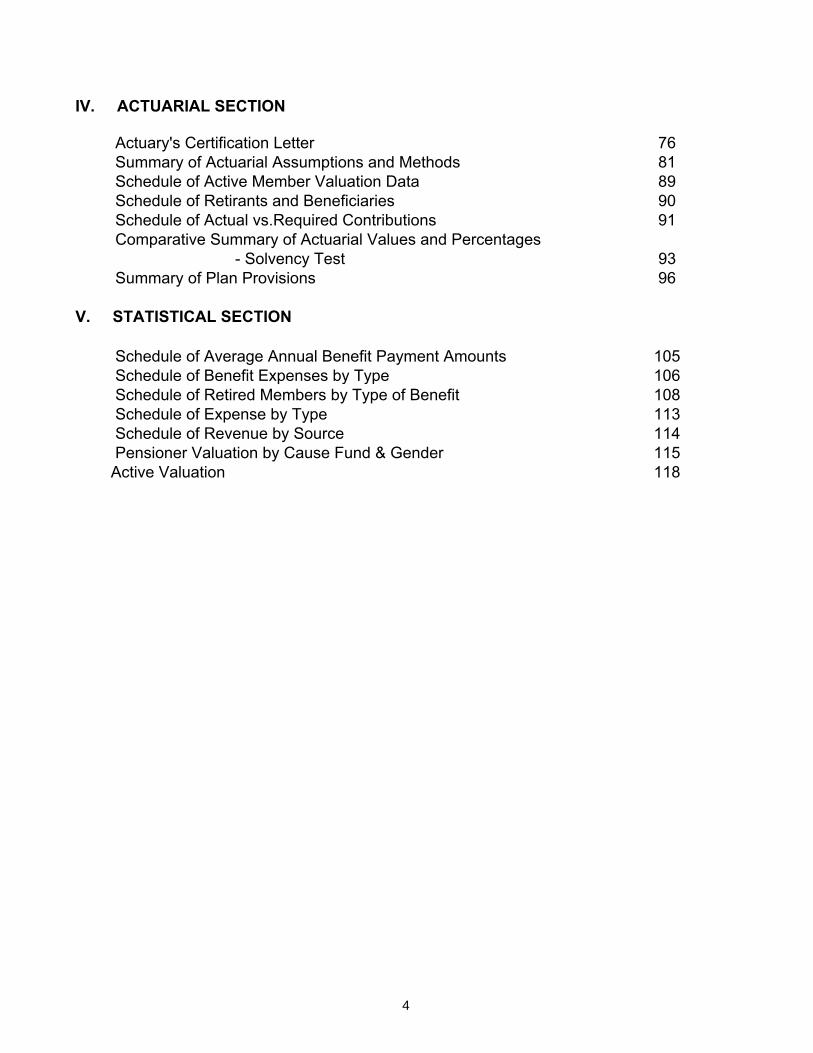
IV. ACTUARIAL SECTION
Actuary's Certification Letter 76 Summary of Actuarial Assumptions and Methods 81 Schedule of Active Member Valuation Data 89 Schedule of Retirants and Beneficiaries 90 Schedule of Actual vs.Required Contributions 91 Comparative Summary of Actuarial Values and Percentages - Solvency Test 93 Summary of Plan Provisions 96
V. STATISTICAL SECTION
Schedule of Average Annual Benefit Payment Amounts 105 Schedule of Benefit Expenses by Type 106 Schedule of Retired Members by Type of Benefit 108 Schedule of Expense by Type 113 Schedule of Revenue by Source 114 Pensioner Valuation by Cause Fund & Gender 115 Active Valuation 118
4

NEW YORK CITY POLICE PENSION FUND
COMPREHENSIVE ANNUAL FINANCIAL REPORT
A PENSION TRUST FUND OF THE CITY OF NEW YORK
INTRODUCTORY SECTION
PART I
FISCAL YEAR ENDED
June 30, 2004

6


New York City Police Pension Fund 233 Broadway
New York, New York 10279 (212) 693 – 5100 Executive Director – Michael D. Welsome
December 15, 2004
To the Members of the Board of Trustees, New York City Police Pension Fund.
I am pleased to present the Comprehensive Annual Financial Report, (CAFR) of the New York City Police Pension Fund (the Plan), a Pension Trust Fund of the City of New York for the fiscal year ended June 30, 2004. Responsibility for both the accuracy of the data and the completeness and fairness of the presentation, including all disclosures, rests with the management of the Plan. To the best of our knowledge and belief, the enclosed data is accurate in all material respects and are reported in a manner designed to present fairly the financial position and results of the operation of the Pension System. All disclosures necessary to enable the reader to gain an understanding of the Pension System’s Financial Activities have been included.
Our independent auditors, Deloitte & Touche have audited our financial statements and have submitted an independent auditor report, which is included in this book. The audit was conducted in accordance with generally accepted auditing standards. This report was prepared in accordance with the principles of Governmental Accounting and Reporting promulgated by the Governmental Accounting Standards Board.
This report will be forwarded to the Government Finance Officers Association for review in the Certificate of Achievement for Excellence in Financial Reporting Program. This report consists of five sections:
a) The Introductory Section, which contains the Executive Director’s Letter of Transmittal, the Administrative Organization and consulting services utilized by the system.
b) The Financial Section, which contains the opinion of the Independent Certified Public Accountants as well as the Financial Statements of the Plan. The Management Discussion and Analysis narrative in this section provides an overview of the plan’s financial activities for the fiscal year ended June 30, 2004.
c) The Investment Section, which includes reports on investment activities and policies.
d) The Actuarial Section, which contains the system’s Actuarial Data and the Actuarial Certification Letter.
e) The Statistical section, which contains statistical tables with significant data pertaining to the New York City Police Pension Fund.
Background of the Fund
The New York City Police Pension Fund, Subchapter 2, was incorporated on March 1, 1940 and commenced business on March 29, 1940. On January 30, 1940 the fund operated on an actuarial basis covering persons appointed to the police force after June 1, 1940. The fund succeeded the Subchapter 1 (Article 1) pension fund established for New York City Police prior to 1940.
In 1995, legislation was enacted merging Subchapter 1 with Subchapter 2. In addition, legislation was passed in 1995 allowing the New York City Transit Authority and Housing Authority Police Officers to transfer out of New York City Employees Retirement System (NYCERS) and merge with the fund. Three different police departments thus became one
8
unified police force under the direct control of the Police Commissioner. Chapter 292 of the laws of 2001 provided Corpus Funding of administrative expenses for the Plan as of July 1, 2001 with the Executive Director as the administrator of the Fund. The New York City Police Pension Fund is organized primarily to provide retirement and disability benefits for all uniform members of the service of the New York City PoliceDepartment. Additionally, death benefits are provided for the dependents of slain police officers. These obligations are sustained through members’ and employer’s contributions as well as by returns realized from investment of those contributions.
The New York City Police Pension Fund or New York City Police Department Subchapter Two Pension Fund is synonymous.
Economic Condition and Outlook
The most recent economic news makes it clear that the national economy is moving in a positive direction. Consumer spending, retail sales, industrial production and housing construction and sales have been trending upward. Businesses are moving ahead with increased volume of orders and new outlays for equipment. Mortgage applications remain high, unemployment is down and consumers remain confident. On August 25th 2004, oil prices fell below $44 per barrel nearly $6 below their recent peak and gasoline prices also declined.
The fiscal year 2004 GDP growth was the most rapid since fiscal year 2000 at 4.5%. The GDP represents the total dollars spent on goods and service produced in the United States. The four main parts of GDP are consumption, investment, government and net exports. In addition the average unemployment and inflation rates continued to be low in fiscal year 2004 compared to prior years. For example the unemployment rate fell to 5.8% down from 5.9% in fiscal year 2003. The inflation rate in 2004 was a low 2.2% the same as fiscal year 2003.
The city's economy improved along with the national economy during fiscal year 2004. For example the city's unemployment rate fell to 8.1% in Fiscal year 2004 from the previous year. The city and the pension funds outlook for fiscal year 2005 is positive. Leading economic indicators reflect signs of economic growth for the city and in the pension plans. Federal aid is helping the city to recover and rebuild after the September 11th attack on the World Trade Center. "As long as overall corporate profits and the gross domestic product continue to rise, Wall Street will eventually get more business and do hiring", stated James Brown, a leading economist with the New York State Department of Labor.
Consumers are spending more money, individuals are seeking to invest more, industry is investing more of its assets in machinery and technology. Home sale prices are at record levels and coop prices and sales have performed in a like manner. Visitors and tourists are also sparking robust gains at Broadway Theaters, Movies, Hotels and Restaurants. This increased volume of tourism will increase the city's revenue and employment. Accounting firms continue to hire more people to handle changes in its policies which require these public firms to undergo far greater scrutiny of their accounting practices.
We believe that FY 2005 will be a good one for the Fund and that the market value of our investments will continue to grow. Our economy is heading towards growth and prosperity. The Police Pension Fund remains in sound financial and actuarial condition. 9

Major Initiatives of the year
The Plan’s assets are invested for the benefit of the system's participants and beneficiaries. We continue with asset diversification, which is expected to reduce the annual volatility of expected returns. In Fiscal year 2004 the assets of the fund continued to increase in market value.
Since the September 11th attack on the Twin Towers, the city received $11.3 billion of the promised $21 billion in federal aid. The president has pledged to continue this help with the clean-up and recovery tasks.
This pension fund and the city's other pension funds filed litigation action against Adelphia Communication Corporation, World Com Inc. and National Century Financial Enterprise Inc, which are now pending before the courts. The Fund entered into a settlement agreement with Citibank to recover a loss the fund sustained from its Security Lending program. The city’s other pension funds did the likewise under the direction of the NYC Law Department
In fiscal year 2004 the fund increased its activity in Private Equity and continued its policy to economically targeted investments. This program provides affordable housing for New Yorkers. This has been profitable for the system and has improved living conditions for New Yorkers. The Bank of New York has replaced Citibank as the Global Custodian Bank. We look forward in working with the Bank of New York and the city comptroller’s office in achieving our common goal to better serve the members of New York City Police Pension Fund.
The New York City Police Pension Fund (NYCPPF) was given corpus funding in 2001 to improve service to our active and retired members. Corpus funding has enabled NYCPPF to establish a new headquarters and initiate a major upgrade to its computer infrastructure and technological capabilities. Over the past three years, NYCPPF has implemented the following information Technology enhancements:
Agency website (www.nyc.gov/nycppf) : This site contains important information for members about their pension, downloadable pension forms, and an online newsletter. In 2004, an email subscription was added that automatically notifies members about new information on the NYCPPF website.
Office automation : New desktop computers have enabled our staff to become more productive and helped them in managing their daily workload. For example, starting in 2004, our staff can access individual members’ electronic blue cards (members’ present and historical data) and electronic folders.
Business continuity location : We are in the process of developing an alternative office location within the New York City area. This location will enable mission-critical member functions to continue in the event of an emergency which prevents PPF from using our primary office.
Document image management : We have completed a large imaging scanning project, which converted over 76,000 paper member folders into
10
digital images. In-house staff is responsible for keeping these electronic folders current. This project increased our disaster recovery capabilities by allowing us to safely store electronic records off-site.
Comprehensive Officer Pension System (COPS) : NYCPPF is in the process of developing a comprehensive computer system that will enable us to take member service to a new level. We are now converting 40,000 paper blue cards into an electronic blue card database to be used by the new COPS application for fast accurate member information access.
Web COPS : We are also developing a self service kiosk to allow our members to personally access their pension data and provide other services on their own without requiring the services of a PPF counselor. Scheduled for release six months after the release of COPS, web COPS is being built in-house.
Financial and Budgetary Controls
The management of the plan is responsible for establishing and maintaining an internal control structure designed to ensure that the Fund’s assets are protected from loss, theft, or misuse and that preparation of financial statements is done in conformity with generally accepted accounting principles. The internal control structure is designed to provide reasonable but not absolute assurance that these objectives are met. The plan also maintains budgetary controls. An annual examination of existing Internal Controls is performed in compliance with Directive #1, the City Manager Financial Integrity Directive. The fund is administered by the City Comptroller who is also the treasurer and custodian of the Fund. This study and evaluation disclosed no material weakness. As a further quality control, the Audit Committee for the City of New York, which includes experts in Accounting and Municipal Finance from the private sector, oversees the independent audit process. This process includes the independent auditors’ reports and the Auditors’ Management letter, as well as the Retirement System’s response. The committee operates independently and issues its own annual report.
Investment Policy
The investment policies are adopted by the Board of Trustees. The Comptroller of the City of New York is the Treasurer, Chief Custodian and Investment Manager of the assets of the Fund. It is the aim of our investment advisors to provide safe and high rates of return for all our investments. Investments are made in a variety of securities including Domestic and International Stocks as well as Short-Term Investments which minimize risks and maintain a high competitive return. The Fund continued to diversify assets among different types of securities. The Police Pension Fund continues to spend less for investment and management fees than most otherretirement systems. This diversification has increased investment results and provided greater security for the assets of the retirement system. By increasing the investment returns, the Fund thus remains more secure. In addition, the City’s budget appropriation to the System can be reduced, potentially saving the taxpayers millions of dollars.
11

The following table reflects increases and decreases in revenues and expenses for selected items intended for Fiscal Years 2004 and 2003 respectively. Amounts are in thousands. In Thousands-Dollars
Net increase Description Amount 2004 Amount 2003 Decrease
Member Contributions $118,565 $110,839 7.0% Employer Contributions 811,978 625,379 29.80% Interest Income 242,050 270,804 (10.60)% Dividend Income 134,169 125,364 7.0% Net Appreciation (Depreciation in Fair Value of investments) 1,982,627 (20,349) 9843%
Investment Expenses 29,894 19,823 50.80% Net Investment Income (Loss) 2,333,744 345,690 575.10% Benefit Payments & Withdrawals $1,393,776 $1,307,757 6.6%
As a result net assets available for pension benefits increased from $14,271,631 in fiscal year 2003 to $16,136,719 in fiscal year 2004, reflecting an increase of 13.1%.
A twelve-member board of trustees administers the fund. The board consists of representatives of the Police Commissioner, the Mayor, the City Comptroller and the Commissioner of Finance each with one and one-half vote; four specified officers of the Patrolmen’s Benevolent Association with one vote each, and four presidents of the following Police unions: the Detectives Endowment Association, the Sergeants Benevolent Association, the Lieutenants Benevolent Association and the Captains Endowment Association, each with one half votes. Meetings are held every month. Special meetings may be called by the chairman or by a request of members of the board with a combined vote of not less than five.
Financial Overview and Fund Structure
This report includes all funds of the Police Pension Fund, which are as follow:
1. The Annuity Saving Fund comprised of contributions received from active members, usually through payroll deductions.
2. The Contingent Reserve Fund comprised of employer contributions.
3. The Annuity Reserve Fund comprised of member contributions transferred at retirement to provide the annuity portion retirement allowance.
4. The Pension Reserve Fund comprised of employer contributions transferred at retirement to provide the pension portion at retirement allowance.
5. The Group Life Insurance Fund comprised of employer contributions used to provide death benefits payable to the beneficiary or estate of a member. The portion of the benefits derived from City contributions (not exceeding $50,000) shall be paid as insurance from the Group Life Insurance Fund.
12
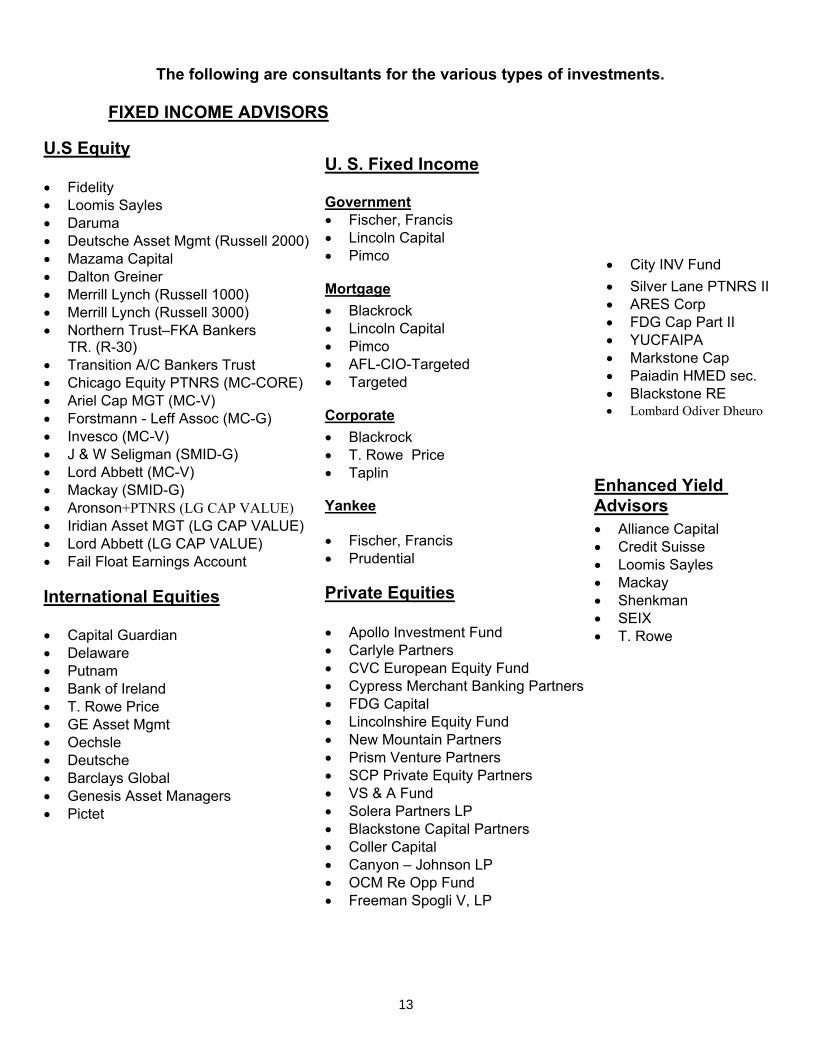
The following are consultants for the various types of investments.
FIXED INCOME ADVISORS
U.S Equity
Fidelity Loomis Sayles Daruma Deutsche Asset Mgmt (Russell 2000) Mazama Capital Dalton Greiner Merrill Lynch (Russell 1000) Merrill Lynch (Russell 3000) Northern Trust–FKA Bankers
TR. (R-30) Transition A/C Bankers Trust Chicago Equity PTNRS (MC-CORE) Ariel Cap MGT (MC-V) Forstmann - Leff Assoc (MC-G) Invesco (MC-V) J & W Seligman (SMID-G) Lord Abbett (MC-V) Mackay (SMID-G) Aronson+PTNRS (LG CAP VALUE) Iridian Asset MGT (LG CAP VALUE) Lord Abbett (LG CAP VALUE) Fail Float Earnings Account
International Equities
Capital Guardian Delaware Putnam Bank of Ireland T. Rowe Price GE Asset Mgmt Oechsle Deutsche Barclays Global Genesis Asset Managers Pictet
U. S. Fixed Income
Government Fischer, Francis Lincoln Capital Pimco
Mortgage Blackrock Lincoln Capital Pimco AFL-CIO-Targeted Targeted
Corporate Blackrock T. Rowe Price Taplin
Yankee
Fischer, Francis Prudential
Private Equities
Apollo Investment Fund Carlyle Partners CVC European Equity Fund Cypress Merchant Banking Partners FDG Capital Lincolnshire Equity Fund New Mountain Partners Prism Venture Partners SCP Private Equity Partners VS & A Fund Solera Partners LP Blackstone Capital Partners Coller Capital Canyon – Johnson LP OCM Re Opp Fund Freeman Spogli V, LP
City INV Fund Silver Lane PTNRS II ARES Corp FDG Cap Part II YUCFAIPA Markstone Cap Paiadin HMED sec. Blackstone RE
Lombard Odiver Dheuro
Enhanced Yield Advisors Alliance Capital Credit Suisse Loomis Sayles Mackay Shenkman SEIX T. Rowe
13

The Comptroller of the City of New York is the custodian of the pension fund assets and provides investment services through independent advisors. Actuarial services are provided to the system by the City's Chief Actuary employed by the Board of Trustees of the City's main pension systems. The City's Corporation Counsel provides legal services to the fund. All financial information is discussed in the financial section.
Other Information
The Government Finance Officers Association of the United States and Canada (GFOA) awarded Certificates of Achievement for Excellence in Financial Reporting to the New York City Police Pension Fund Subchapter 2 for its Financial Report for the fiscal years ended June 30, 1986 through June 30, 2003. In order to be awarded a Certificate of Achievement, a government unit must publish an easily readable and efficiently organized financial report, whose contents conform to program standards. Such reports must satisfy both generally accepted accounting principles and applicable legal requirements. A Certificate of Achievement is valid for a period of one year only.
We believe our current report continues to conform to the Certificate of Achievement Program requirements, and we are submitting it to the GFOA to determine its eligibility for another certificate. This certificate, if awarded, would be the eighteenth consecutive award, a record of which we are quite proud.
Acknowledgements
The compilation of this report reflects the combined effort of the staff of the Pension Plan, the Chief Actuary of the City of New York and the Comptroller's Office. It is intended to provide complete and reliable information as a basis for making management decisions, for determining compliance with legal provisions, and as a means of indicating stewardship of the assets of the system. I would like to take this opportunity to thank the staff, the advisors and the many people who have worked so diligently to assure the successful operations of the Fund. I also want to express my appreciation to the Accounting Unit, especially to our Chief Accountant Abraham Papilsky and Assistant Chief Accountant Louis Dory. Their efforts, which have continued to be of primary importance in preparation of all accounting and statistical data for this report, are truly deserving of my gratitude and my admiration.
In closing, without the leadership and support of the Board of Trustees, preparation of this report would not have been possible.
Respectfully submitted,
Michael Welsome Executive Director New York City Police Pension Fund
14
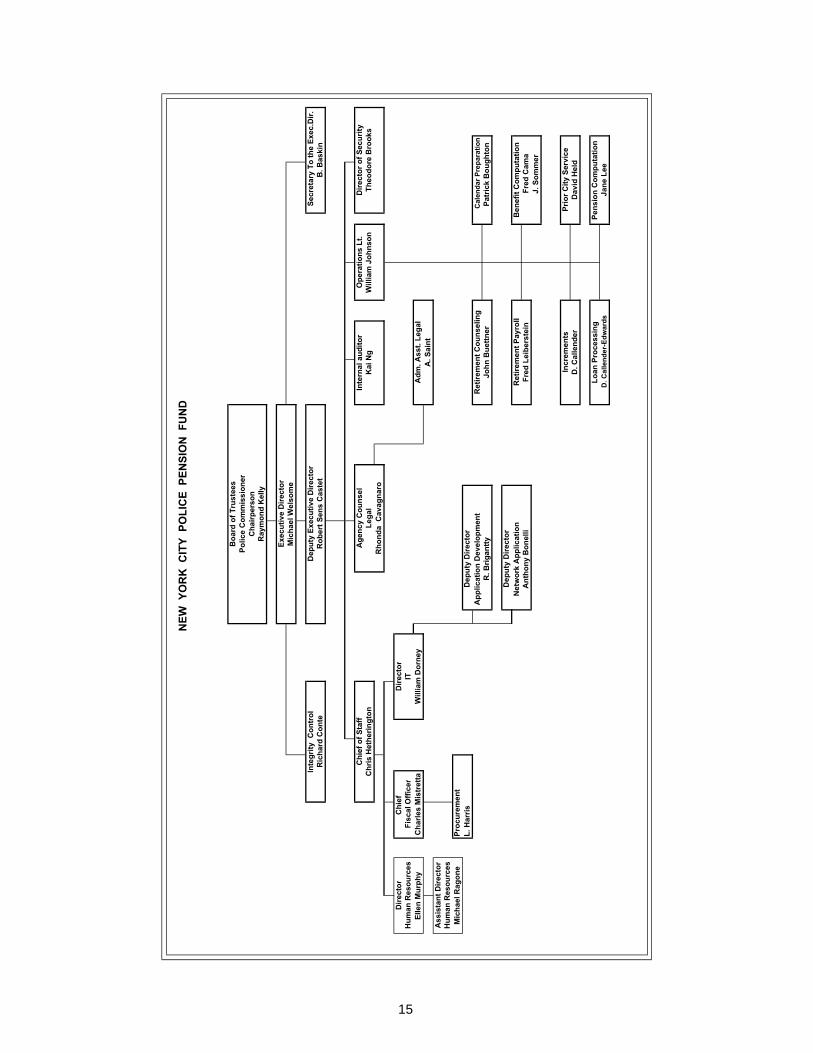
NEW
YO
RK
CIT
Y P
OLI
CE
PEN
SIO
N F
UN
D
Boa
rd o
f Tru
stee
sPo
lice
Com
mis
sion
erC
hairp
erso
nR
aym
ond
Kel
ly
Exec
utiv
e D
irect
o rM
icha
el W
elso
me
Inte
grity
Con
trol
Dep
uty
Exec
utiv
e D
irect
orSe
cret
ary
To th
e Ex
ec.D
ir.R
icha
rd C
onte
Rob
ert S
ens
Cas
tet
B. B
aski
n
Chi
ef o
f Sta
ffA
genc
y C
ouns
elIn
tern
al a
udito
rO
pera
tions
Lt.
Dire
ctor
of S
ecur
ityC
hris
Het
herin
gton
Lega
lK
ai N
gW
illia
m J
ohns
onTh
eodo
re B
rook
sR
hond
a C
avag
naro
Dire
ctor
Chi
ef
Dire
ctor
Hum
an R
esou
rces
Fisc
al O
ffice
rIT
Elle
n M
urph
yC
harle
s M
istr
etta
Will
iam
Dor
ney
Adm
. Ass
t. Le
gal
A. S
aint
Ass
ista
nt D
irect
orH
uman
Res
ourc
esM
icha
el R
agon
ePr
ocur
emen
tL.
Har
risD
eput
y D
irect
orA
pplic
atio
n D
evel
opm
ent
Ret
irem
ent C
ouns
elin
gC
alen
dar P
repa
ratio
nR
. Brig
antty
John
Bue
ttner
Patr
ick
Bou
ghto
n
Dep
uty
Dire
cto r
Net
wor
k A
pplic
atio
nR
etire
men
t Pay
roll
Ben
efit
Com
puta
tion
Ant
hony
Bon
elli
Fred
Lei
bers
tein
F
red
Cam
aJ.
Som
me r
Incr
emen
tsPr
ior C
ity S
ervi
ceD
. Cal
lend
erD
avid
Hel
d
Loan
Pro
cess
ing
Pens
ion
Com
puta
tion
D. C
alle
nder
-Edw
ards
Jane
Lee
15

NEW YORK CITY POLICE PENSION FUND
COMPREHENSIVE ANNUAL FINANCIAL REPORT
A PENSION TRUST FUND OF THE CITY OF NEW YORK
FINANCIAL SECTION
PART II
FISCAL YEAR ENDED
June 30, 2004


17

18
-2-
NEW YORK CITY POLICE PENSION FUND
MANAGEMENT’S DISCUSSION AND ANALYSIS (UNAUDITED) JUNE 30, 2004 AND 2003
This narrative discussion and analysis of New York City Police Pension Fund (“Police” or the “Plan”), also known as the New York City Police Department Subchapter Two Pension Fund, financial performance provides an overview of the Plan’s financial activities for the fiscal years ended June 30, 2004 and 2003. It is meant to assist the reader in understanding the Plan’s financial statements by providing an overall review of the financial activities during the years and the effects of significant changes, as well as a comparison with the prior year’s activity and results. This discussion and analysis is intended to be read in conjunction with the Plan’s financial statements which begin on page 6.
Overview of Basic Financial Statements
The following discussion and analysis are intended to serve as an introduction to the Plan’s basic financial statements. The basic financial statements are:
The Statement of Plan Net Assets - presents the financial position of the Plan at fiscal year-end. It indicates the assets available for payment of future benefits and any current liabilities that are owed as of the statement date. Investments are shown at fair value. All assets and liabilities are determined on an accrual basis.
The Statement of Changes in Plan Net Assets - presents the results of activities during the year. All changes affecting the assets and liabilities of the Plan are reflected on an accrual basis when the activity occurred, regardless of the timing of the related cash flows. In that regard, changes in the fair values of investments are included in the year’s activity as net appreciation (depreciation) in fair value of investments.
The Notes to Financial Statements - provide additional information that is essential to a full understanding of the data provided in the financial statements. The notes present information about the Plan’s accounting policies, significant account balances and activities, material risks, obligations, contingencies, and subsequent events, if any.
Required Supplementary information - as required by the Governmental Accounting Standards Board (GASB) is presented after the Notes to the Financial Statements.
The financial statements are prepared in accordance with GASB Pronouncements.
FINANCIAL HIGHLIGHTS
The Plan’s net assets held in trust for pension benefits increased by $1,865.1 million, or 13% to $16.1 billion in fiscal year 2004 compared to 2003 and decreased by $233.2 million, or 2% to $14.3 billion in fiscal year 2003 compared to 2002. The decrease in the Plan’s net assets in fiscal year 2003 was primarily due to a loss of about $15 million in the security lending program and to the increase in the number of retirees.
19
-3-
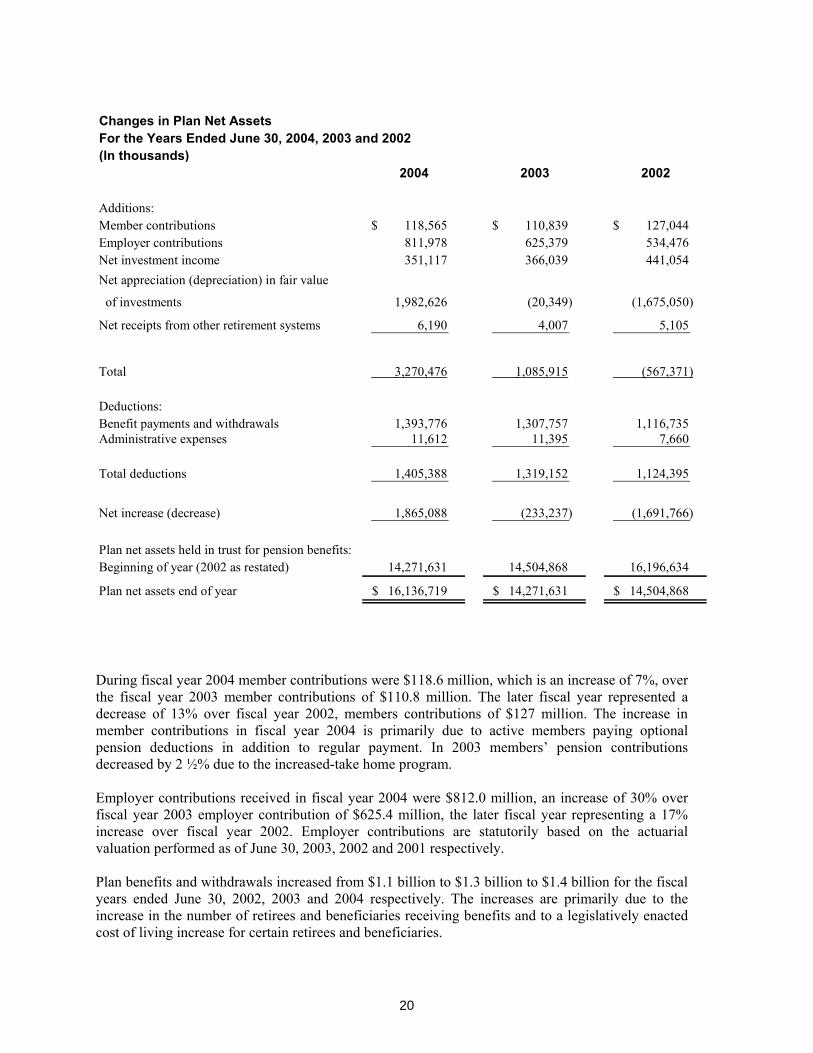
Changes in Plan Net AssetsFor the Years Ended June 30, 2004, 2003 and 2002(In thousands)
2004 2003 2002
Additions:Member contributions 118,565$ 110,839$ 127,044$ Employer contributions 811,978 625,379 534,476 Net investment income 351,117 366,039 441,054 Net appreciation (depreciation) in fair value
of investments 1,982,626 (20,349) (1,675,050)
Net receipts from other retirement systems 6,190 4,007 5,105
Total 3,270,476 1,085,915 (567,371)
Deductions: Benefit payments and withdrawals 1,393,776 1,307,757 1,116,735 Administrative expenses 11,612 11,395 7,660
Total deductions 1,405,388 1,319,152 1,124,395
Net increase (decrease) 1,865,088 (233,237) (1,691,766)
Plan net assets held in trust for pension benefits:Beginning of year (2002 as restated) 14,271,631 14,504,868 16,196,634
Plan net assets end of year 16,136,719$ 14,271,631$ 14,504,868$
During fiscal year 2004 member contributions were $118.6 million, which is an increase of 7%, over the fiscal year 2003 member contributions of $110.8 million. The later fiscal year represented a decrease of 13% over fiscal year 2002, members contributions of $127 million. The increase in member contributions in fiscal year 2004 is primarily due to active members paying optional pension deductions in addition to regular payment. In 2003 members’ pension contributions decreased by 2 ½% due to the increased-take home program.
Employer contributions received in fiscal year 2004 were $812.0 million, an increase of 30% over fiscal year 2003 employer contribution of $625.4 million, the later fiscal year representing a 17% increase over fiscal year 2002. Employer contributions are statutorily based on the actuarial valuation performed as of June 30, 2003, 2002 and 2001 respectively.
Plan benefits and withdrawals increased from $1.1 billion to $1.3 billion to $1.4 billion for the fiscal years ended June 30, 2002, 2003 and 2004 respectively. The increases are primarily due to the increase in the number of retirees and beneficiaries receiving benefits and to a legislatively enacted cost of living increase for certain retirees and beneficiaries.
20
-4-
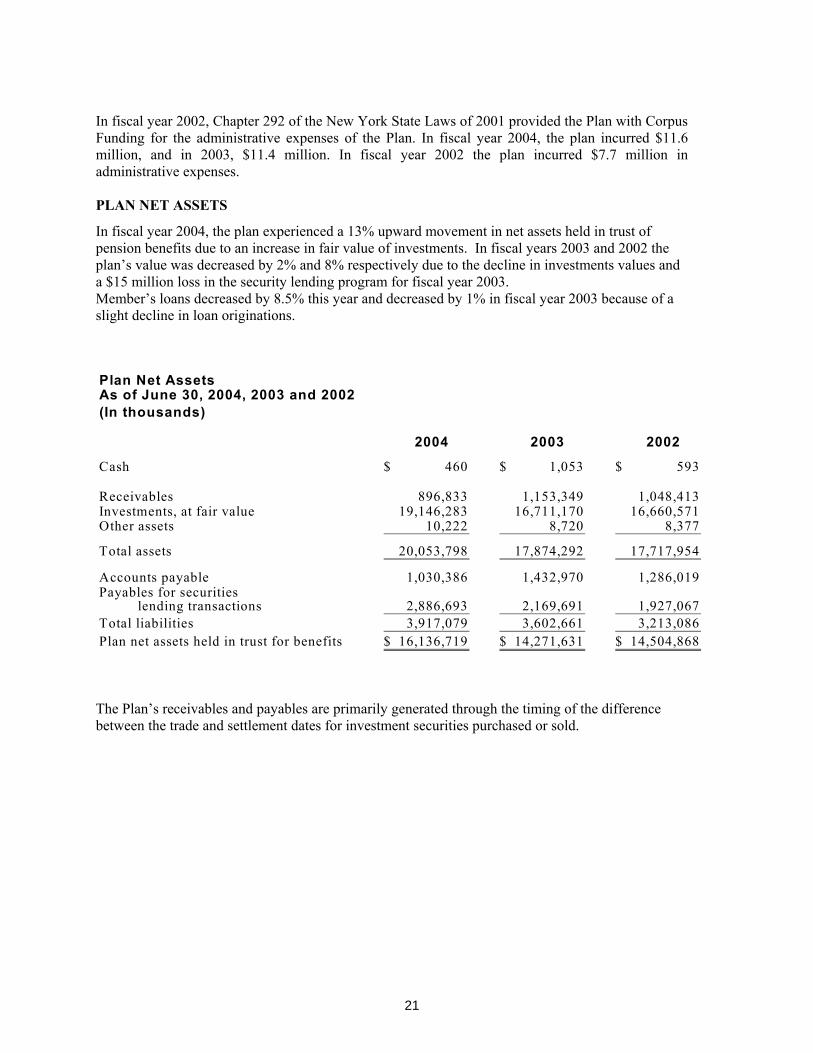
In fiscal year 2002, Chapter 292 of the New York State Laws of 2001 provided the Plan with Corpus Funding for the administrative expenses of the Plan. In fiscal year 2004, the plan incurred $11.6 million, and in 2003, $11.4 million. In fiscal year 2002 the plan incurred $7.7 million in administrative expenses.
PLAN NET ASSETS
In fiscal year 2004, the plan experienced a 13% upward movement in net assets held in trust of pension benefits due to an increase in fair value of investments. In fiscal years 2003 and 2002 the plan’s value was decreased by 2% and 8% respectively due to the decline in investments values and a $15 million loss in the security lending program for fiscal year 2003. Member’s loans decreased by 8.5% this year and decreased by 1% in fiscal year 2003 because of a slight decline in loan originations.
Plan Net AssetsAs of June 30, 2004, 2003 and 2002(In thousands)
2004 2003 2002
Cash 460$ 1,053$ 593$
Receivables 896,833 1,153,349 1,048,413 Investments, at fair value 19,146,283 16,711,170 16,660,571 Other assets 10,222 8,720 8,377
Total assets 20,053,798 17,874,292 17,717,954
Accounts payable 1,030,386 1,432,970 1,286,019 Payables for securities lending transactions 2,886,693 2,169,691 1,927,067 Total liabilities 3,917,079 3,602,661 3,213,086 Plan net assets held in trust for benefits 16,136,719$ 14,271,631$ 14,504,868$
The Plan’s receivables and payables are primarily generated through the timing of the difference between the trade and settlement dates for investment securities purchased or sold.
21

-5-
Investment Summary(In thousands) June 30 June 30 June 30Fair Value 2004 2003 2002
Type of InvestmentShort-term investments 515,400$ 821,156$ 523,015$ U.S. debt securities 4,283,805 3,990,573 4,445,172 Yankee bonds 86,241 273,306 300,748 U.S. equity securities 7,771,167 6,701,073 6,590,857 Mutual fund 20,968 20,973 - International equity 3,385,387 2,621,818 2,799,837 Security lending transactions 2,872,785 2,154,691 1,927,067 Private equity 210,530 127,580 73,875
Total 19,146,283$ 16,711,170$ 16,660,571$
Due to the long-term nature of the Plan’s liabilities, the Plan’s assets are invested with a long-term investment horizon. Assets are invested in a diversified portfolio of capital market securities. Investments in these assets are expected to produce higher returns but are also subject to greater volatility and may produce negative returns. For example, the Russell 3000 Index, a broad measure of the United States Stock market gained 20% in fiscal year 2004. Overall in fiscal years 2004 and 2003, the Plan’s investments gained 9.84%. For the three year period ended June 30, 2004, the overall rate of return on investments was a gain of 0.14%.
Contact information This financial report is designed to provide a general overview of the New York City Police Pension Fund’s finances. Questions concerning any data provided in this report or requests for additional information should be directed to Chief Accountant, New York City Police Pension Fund, 233 Broadway, 25th Floor, New York , N.Y.10279.
22
- 6 -
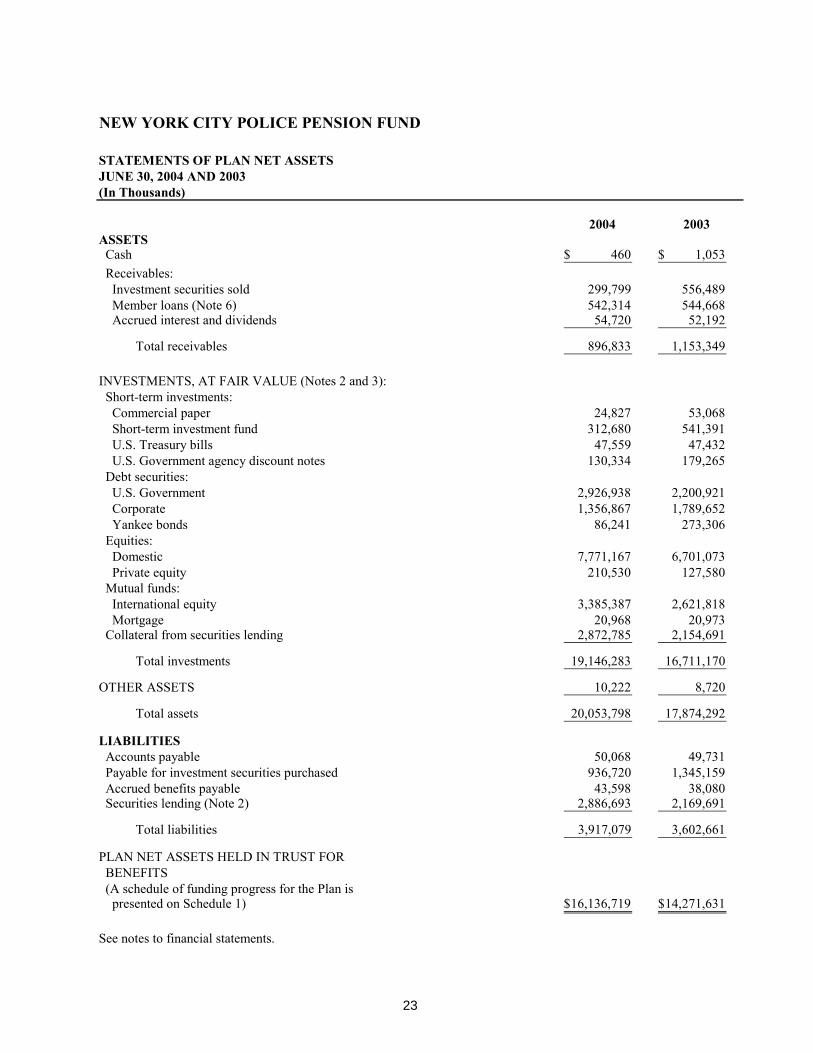
NEW YORK CITY POLICE PENSION FUND
STATEMENTS OF PLAN NET ASSETSJUNE 30, 2004 AND 2003(In Thousands)
2004 2003ASSETS Cash 460$ 1,053$ Receivables: Investment securities sold 299,799 556,489 Member loans (Note 6) 542,314 544,668 Accrued interest and dividends 54,720 52,192
Total receivables 896,833 1,153,349
INVESTMENTS, AT FAIR VALUE (Notes 2 and 3): Short-term investments: Commercial paper 24,827 53,068 Short-term investment fund 312,680 541,391 U.S. Treasury bills 47,559 47,432 U.S. Government agency discount notes 130,334 179,265 Debt securities: U.S. Government 2,926,938 2,200,921 Corporate 1,356,867 1,789,652 Yankee bonds 86,241 273,306 Equities: Domestic 7,771,167 6,701,073 Private equity 210,530 127,580 Mutual funds: International equity 3,385,387 2,621,818 Mortgage 20,968 20,973 Collateral from securities lending 2,872,785 2,154,691
Total investments 19,146,283 16,711,170
OTHER ASSETS 10,222 8,720
Total assets 20,053,798 17,874,292
LIABILITIES Accounts payable 50,068 49,731 Payable for investment securities purchased 936,720 1,345,159 Accrued benefits payable 43,598 38,080 Securities lending (Note 2) 2,886,693 2,169,691
Total liabilities 3,917,079 3,602,661
PLAN NET ASSETS HELD IN TRUST FOR BENEFITS (A schedule of funding progress for the Plan is presented on Schedule 1) 16,136,719$ 14,271,631$
See notes to financial statements.
23
- 7 -
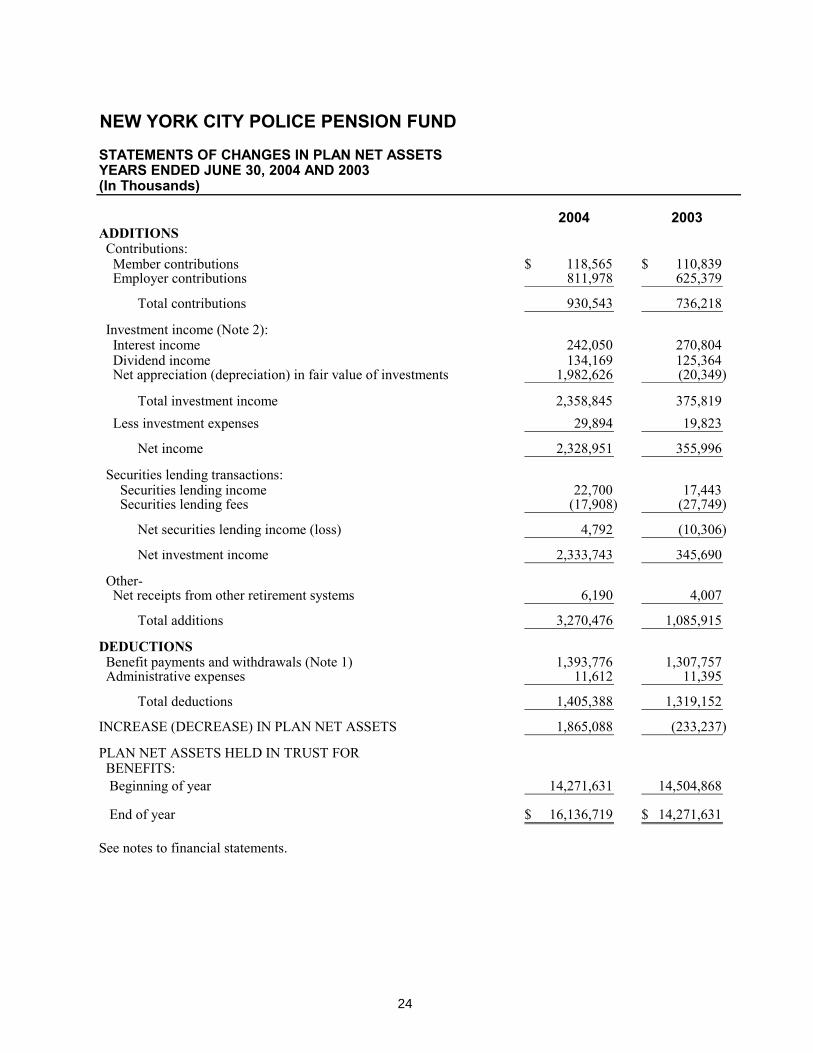
NEW YORK CITY POLICE PENSION FUND
STATEMENTS OF CHANGES IN PLAN NET ASSETSYEARS ENDED JUNE 30, 2004 AND 2003(In Thousands)
2004 2003ADDITIONS Contributions: Member contributions 118,565$ 110,839$ Employer contributions 811,978 625,379
Total contributions 930,543 736,218
Investment income (Note 2): Interest income 242,050 270,804 Dividend income 134,169 125,364 Net appreciation (depreciation) in fair value of investments 1,982,626 (20,349)
Total investment income 2,358,845 375,819 Less investment expenses 29,894 19,823
Net income 2,328,951 355,996
Securities lending transactions: Securities lending income 22,700 17,443 Securities lending fees (17,908) (27,749)
Net securities lending income (loss) 4,792 (10,306)
Net investment income 2,333,743 345,690
Other-Net receipts from other retirement systems 6,190 4,007
Total additions 3,270,476 1,085,915
DEDUCTIONS Benefit payments and withdrawals (Note 1) 1,393,776 1,307,757 Administrative expenses 11,612 11,395
Total deductions 1,405,388 1,319,152
INCREASE (DECREASE) IN PLAN NET ASSETS 1,865,088 (233,237)
PLAN NET ASSETS HELD IN TRUST FOR BENEFITS: Beginning of year 14,271,631 14,504,868
End of year 16,136,719$ 14,271,631$
See notes to financial statements.
24

- 8 -
NEW YORK CITY POLICE PENSION FUND
NOTES TO FINANCIAL STATEMENTS YEARS ENDED JUNE 30, 2004 AND 2003
1. PLAN DESCRIPTION
The City of New York (the “City”) maintains a number of pension systems providing benefits for employees of its various agencies (as defined within New York State (“State”) statutes and City laws). The City’s five main pension systems are the New York City Police Pension Fund (the “Plan”), the New York City Employees’ Retirement System (“NYCERS”), the Teachers’ Retirement System of the City of New York Qualified Pension Plan (“TRS”), the New York City Board of Education Retirement System Qualified Pension Plan (“BERS”) and the New York City Fire Pension Fund (“FIRE”). Each pension system is a separate Public Employee Retirement System (“PERS”) with a separate oversight body and is financially independent of the others.
In conjunction with the establishment of an administrative staff separate from the New York City Police Department in accordance with Chapter 292 of the Laws of 2001, the New York City Police Department, Subchapter Two Pension Fund is generally being referred to herein as the New York City Police Pension Fund as set forth in Administrative Code of the City of New York Section 13-214.1.
The Plan is a single-employer PERS. The Plan provides pension benefits for full-time uniformed employees of the New York City Police Department (the “Employer”). All full-time uniformed employees of the New York City Police Department become members of the Plan upon employment.
The Plan functions in accordance with existing State statutes and City laws. It combines features of a defined benefit pension plan with those of a defined contribution pension plan. Contributions are made by the Employer and the members.
In June 1991, the Governmental Accounting Standards Board (the “GASB”) issued Statement No. 14, The Financial Reporting Entity. The definition of the reporting entity is based primarily on the notion of financial accountability. In determining financial accountability for legally separate organizations, the Plan considered whether its officials appoint a voting majority of an organization’s governing body and is either able to impose its will on that organization or if there is a potential for the organization to provide specific financial benefits to, or to impose specific financial burdens on, the Plan. The Plan also considered whether there are organizations that are fiscally dependent on it. It was determined that there are no component units of the Plan.
The Plan is included in the Pension and Other Employee Benefit Trust Funds section of the City’s Comprehensive Annual Financial Report (“CAFR”).
25
- 9 -
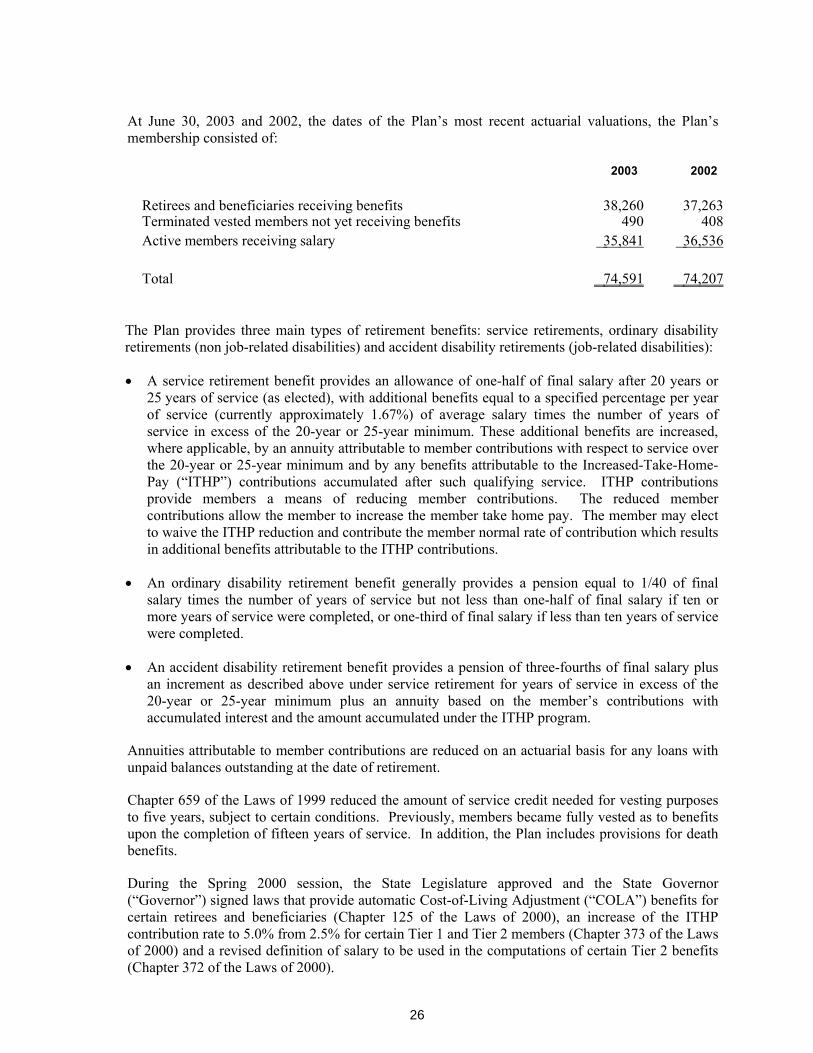
At June 30, 2003 and 2002, the dates of the Plan’s most recent actuarial valuations, the Plan’s membership consisted of:
2003 2002
Retirees and beneficiaries receiving benefits 38,260 37,263Terminated vested members not yet receiving benefits 490 408Active members receiving salary 35,841 36,536
Total 74,591 74,207
The Plan provides three main types of retirement benefits: service retirements, ordinary disability retirements (non job-related disabilities) and accident disability retirements (job-related disabilities):
A service retirement benefit provides an allowance of one-half of final salary after 20 years or 25 years of service (as elected), with additional benefits equal to a specified percentage per year of service (currently approximately 1.67%) of average salary times the number of years of service in excess of the 20-year or 25-year minimum. These additional benefits are increased, where applicable, by an annuity attributable to member contributions with respect to service over the 20-year or 25-year minimum and by any benefits attributable to the Increased-Take-Home-Pay (“ITHP”) contributions accumulated after such qualifying service. ITHP contributions provide members a means of reducing member contributions. The reduced member contributions allow the member to increase the member take home pay. The member may elect to waive the ITHP reduction and contribute the member normal rate of contribution which results in additional benefits attributable to the ITHP contributions.
An ordinary disability retirement benefit generally provides a pension equal to 1/40 of final salary times the number of years of service but not less than one-half of final salary if ten or more years of service were completed, or one-third of final salary if less than ten years of service were completed.
An accident disability retirement benefit provides a pension of three-fourths of final salary plus an increment as described above under service retirement for years of service in excess of the 20-year or 25-year minimum plus an annuity based on the member’s contributions with accumulated interest and the amount accumulated under the ITHP program.
Annuities attributable to member contributions are reduced on an actuarial basis for any loans with unpaid balances outstanding at the date of retirement.
Chapter 659 of the Laws of 1999 reduced the amount of service credit needed for vesting purposes to five years, subject to certain conditions. Previously, members became fully vested as to benefits upon the completion of fifteen years of service. In addition, the Plan includes provisions for death benefits.
During the Spring 2000 session, the State Legislature approved and the State Governor (“Governor”) signed laws that provide automatic Cost-of-Living Adjustment (“COLA”) benefits for certain retirees and beneficiaries (Chapter 125 of the Laws of 2000), an increase of the ITHP contribution rate to 5.0% from 2.5% for certain Tier 1 and Tier 2 members (Chapter 373 of the Laws of 2000) and a revised definition of salary to be used in the computations of certain Tier 2 benefits (Chapter 372 of the Laws of 2000).
26
- 10 -
Finally, certain service retirees also receive supplemental benefits under the New York City Police Department Variable Supplements Funds, which are not included in these financial statements.
The State Constitution provides that the pension rights of public employees are contractual and shall not be diminished or impaired. In 1973, amendments were made to the State Retirement and Social Security Law (“RSSL”) to modify certain benefits for employees joining the Plan on or after the effective date of such amendments. These amendments, which affect employees who joined the Plan on and after July 1, 1973, established certain benefit limitations relating to eligibility for retirement, the salary base for benefits and maximum benefits. Recent laws, Chapter 372 of the Laws of 2000 which provides a revised definition of salary base to be used in the computation of certain benefits for Tier 2 members of the Plan and Chapter 589 of the Laws of 2001 which eliminated the Tier 2 maximum 30 years of service limitation, have lessened these limitations.
2. SUMMARY OF SIGNIFICANT ACCOUNTING POLICIES AND PLAN ASSET MATTERS
Basis of Accounting - The Plan uses the accrual basis of accounting where the measurement focus is on the flow of economic resources. Revenues are recognized in the accounting period in which they are earned and expenses are recognized in the period incurred. Contributions from members are recognized when the employer makes payroll deductions from Plan members. Employer contributions are recognized when due and the employer has made a formal commitment to provide the contributions. Benefits and refunds are recognized when due and payable in accordance with the terms of the Plan.
Investment Valuation - Investments are reported at fair value. Securities purchased pursuant to agreements to resell are carried at the contract price, exclusive of interest, at which the securities will be resold. Fair value is defined as the quoted market value on the last trading day of the period, except for the Short-Term Investment Fund (the “STIF”) (a money market fund), the International Investment funds (the “IIF”) and Private Equity (the “PE”). The IIF and PE are privately traded funds which are managed by various investment managers on behalf of the Plan. Fair value is determined by Plan management based on information provided by the various investment managers.
Purchases and sales of securities are reflected on the trade date.
Dividend income is recorded on the ex-dividend date. Interest income is recorded as earned on the accrual basis.
No investment in any one security represents 5% or more of the Plan net assets held in trust for benefits.
Income Taxes - Income earned by the Plan is not subject to Federal income tax.
Accounts Payable - Accounts payable is principally comprised of amounts owed to the Plan’s banks for overdrawn bank balances. The Plan’s practice is to fully invest cash balances in most bank accounts on a daily basis. Overdrawn balances result primarily from outstanding benefit checks that are presented to the banks for payment on a daily basis and these balances are routinely settled each day.
Securities Lending Transactions - State statutes and Board policies permit the Plan to lend its investments to broker-dealers and other entities for collateral, for the same securities in the future with a simultaneous agreement to return the collateral in the form of cash, treasury and U.S.
27

- 11 -
Government securities. The Plan’s custodian lends the following types of securities: short-term securities, common stock, long-term corporate bonds, U.S. Government and U.S. Government agency bonds, asset-backed securities and international equities and bonds held in collective investment funds. In return, it receives collateral in the form of cash, U.S. Treasury and U.S. Government agency securities at 100 percent to 105 percent of the principal plus accrued interest for reinvestment. At June 30, 2004, management believes, the Plan had no credit risk exposure to borrowers because the amounts the Plan owed the borrowers equaled or exceeded the amounts the borrowers owed the Plan. The contracts with the Plan’s custodian require borrowers to indemnify the Plan if the borrowers fail to return the securities and if the collateral is inadequate to replace the securities loaned or fail to pay the Plan for income distributions by the securities’ issuers while the securities are on loan. All securities loans can be terminated on demand within a period specified in each agreement by either the Plan or the borrowers. Cash collateral is invested in the lending agents’ short-term investment pools, which have a weighted average maturity of 90 days. The underlying fixed income securities which comprise these pools have an average maturity of ten years.
During Fiscal Year 2003, the value of certain underlying securities became impaired because of the credit failure of the issuer. Accordingly, the carrying amount of the collateral reported in the Plan’s statements of plan net assets for FY 2003 was reduced by $15 million to reflect this impairment and reflect the net realizable value of the securities purchased with collateral from securities lending transactions. In May 2004, the Plan received $1.1 million from a distribution in bankruptcy proceeds from the defaulted issuer. In August 2004, the Plan received $2.8 million as partial settlement from parties involved in the initial purchase of the impaired security.
The securities lending program in which the Plan participates only allows pledging or selling securities in the case of borrower default.
GASB Statement No. 28, Accounting and Financial Reporting for Securities Lending Transactions,requires that securities loaned as assets and related liabilities be reported in the statement of plan net assets. Cash received as collateral on securities lending transactions and investments made with that cash are reported as assets. Securities received as collateral are also reported as assets if the government entity has the ability to pledge or sell them without a borrower default. Accordingly, the Plan recorded the investments purchased with the cash collateral as collateral from securities lending with a corresponding liability for securities lending.
Pronouncement Issued But Not Yet Effective – In March 2003, GASB issued Statement No. 40, Deposit and Investment Risk Disclosures, an amendment of GASB Statement No. 3. Statement No. 40 establishes and modifies Note disclosure requirements related to investment risks, which includes credit risk, interest rate risk and foreign currency risk. The implementation of Statement No. 40 will expand Note disclosure regarding the Plan’s investments and their related investment and deposit risks. Statement No. 40 will not impact the Plan’s financial statements. Statement No. 40 is effective for financial statement periods beginning after June 15, 2004, which requires the Plan to implement its requirements for the Plan’s Fiscal Year ending June 30, 2005.
New Accounting Standards Adopted
In fiscal year 2004, the Plan adopted two new statements of financial accounting standards issued by the Governmental Accounting Standards Board (GASB):
— Statement No. 42 Accounting and Financial Reporting for Impairment of Capital Assets and for Insurance Recoveries
28
- 12 -
— Statement No. 44 Economic Condition Reporting: The Statistical Section, an amendment of NCGA Statement 1
Statement No. 42 establishes accounting and reporting standards for the impairment of capital assets as its primary objective since current standards do not have a specific requirement to reduce the carrying value of a capital asset other than through the application of depreciation. The Statement improves financial reporting because it requires the Plan to report the effects of capital asset impairments in its financial statements when they occur rather than as a part of the ongoing depreciation expense for the capital asset or upon disposal of the capital asset. Users of the Plan’s financial statements will better understand when impairments have occurred and what their financial impact is on the Plan. A capital asset is considered impaired when its service utility has declined significantly and unexpectedly. Another objective of Statement No. 42 is to establish and clarify guidance for accounting for insurance recoveries which applies to all such recoveries, not just those associated with impairment of capital assets. The Statement also enhances comparability of the Plan’s financial statements with other pension plans by requiring all the entities to account for insurance recoveries in the same manner.
There was no impact on the Plan’s financial statements as a result of the implementation of Statement No. 42.
Statement No. 44 amends the portions of NCGA Statement 1, Governmental Accounting and Financial Reporting Principles that guide the preparation of the statistical section whose objectives are to provide financial statement users with additional historical perspective, context, and detail to assist in using the information in the financial statements, notes to the financial statements, and required supplementary information to understand and assess the Plan’s economic condition. This Statement improves the understandability and usefulness of statistical section information by addressing the comparability problems that have developed in practice and by adding information from the new financial reporting model for state and local governments required by Statement No. 34, Basic Financial Statements—and Management’s Discussion and Analysis—for State and Local Governments.
Statement No. 44 requires the following information be included in the statistical section of a separately issued pension plan report:
Retired members by type of benefit for the current year. Average benefit payments for the last ten years including monthly benefit, average final salary and number of retired members organized by years of credited service in five year increments. Principal participating employers for multiple-employer plans for the last ten years.
3. INVESTMENTS AND DEPOSITS
The Comptroller of the City of New York (the “Comptroller”) acts as an investment advisor to the Plan. In addition, the Plan employs an independent investment consultant as an investment advisor. The Plan utilizes several investment managers to manage long-term debt and equity portfolios. Managers are reviewed for ongoing performance and adherence to investment guidelines.
The Administrative Code of the City of New York (“ACNY”) authorizes the investment of Plan assets (other than equities) subject to the terms, conditions, limitations and restrictions imposed by law for investment by savings banks.
29

- 13 -
The criteria for the Plan investments are as follows:
(a) Fixed income investments may be made only in U.S. Government securities, securities of U.S. Government agencies backed by the U.S. Government, securities of companies rated “BBB” or better by both Standard & Poor’s Corporation and Moody’s Investors Service and any bond on the Legal Investments for New York Savings Banks list published annually by the State Banking Department.
(b) Equity investments may be made only in those stocks that meet the qualifications of the RSSL.
(c) Short-term investments may be made in the following instruments:
(i) U.S. Government securities or U.S. Government agency securities fully guaranteed by the U.S. Government.
(ii) Commercial paper rated Al or Pl by Standard & Poor’s Corporation or Moody’s Investors Service, respectively.
(iii) Repurchase agreements collateralized in a range of 100% to 103% of matured value purchased through primary dealers of U.S. Government securities.
(d) Investments in banker’s acceptances and certificates of deposit may be made with any of the ten largest banks with either the highest or next to the highest rating categories of the leading independent bank rating firms.
(e) Investments up to 7.5% of total pension fund assets may be made in instruments not specifically covered by the RSSL.
Citibank, N.A. was the primary custodian for substantially all of the securities of the Plan for the periods prior to March 31, 2004. Bank of New York (“BONY”) became custodian on April 1, 2004 to present.
Cash deposits are insured by the Federal Deposit Insurance Corporation for up to $100,000 per Plan member and are, therefore, fully insured.
At June 30, 2004, investments of the Plan are categorized by level of custodial credit risk (the risk that a counter party to an investment transaction will not fulfill its obligations) as defined by GASB Statement No. 3. Category 1, the lowest risk, includes investments that are insured or registered or for which the securities are held by the entity or its agent in the entity’s name. Category 2 includes uninsured and unregistered investments for which the securities are held by the counter party’s trust department or agent in the entity’s name. Category 3, the highest risk, includes uninsured and unregistered investments for which the securities are held by the counter party, or by its trust department or agent, but not in the entity’s name. Investments in the short-term investment fund, international investment fund, mutual funds and guaranteed investment contracts are not categorized.
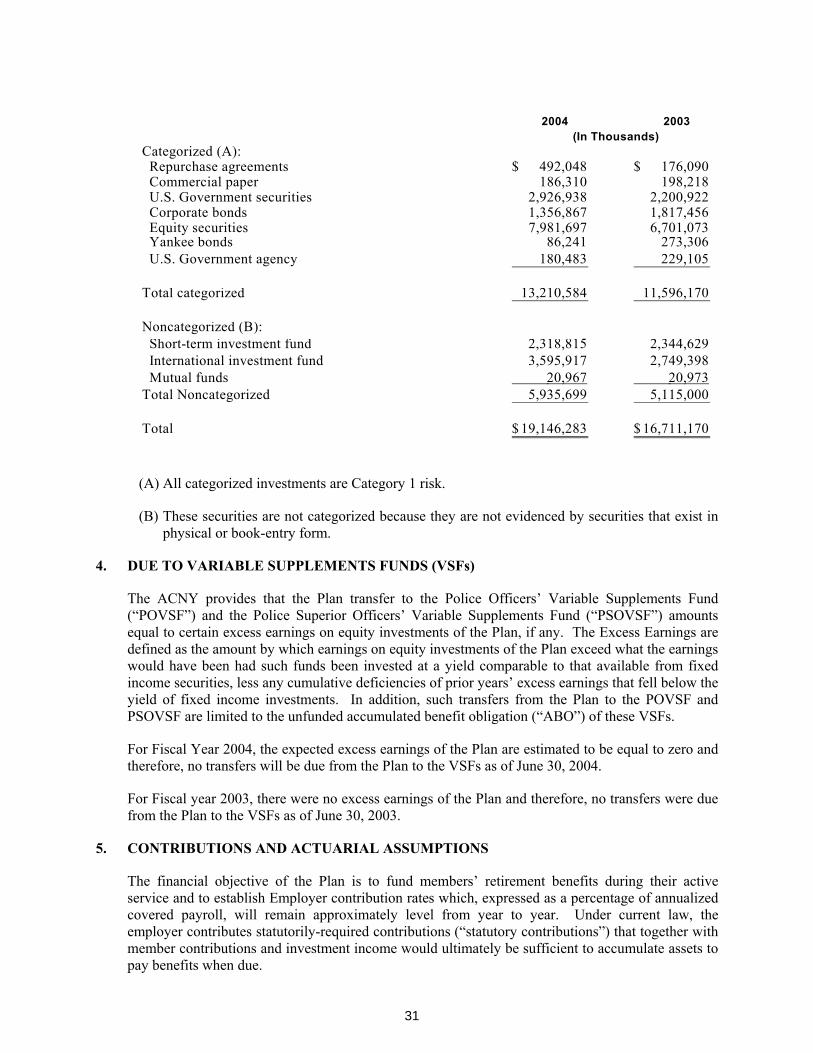
Investments held by the Plan, including the collateral from securities lending transactions of approximately $2,873 and $2,155 million at June 30, 2004 and 2003, respectively, are listed according to their investment classification in the following table:
30
- 14 -
2004 2003
Categorized (A): Repurchase agreements 492,048$ 176,090$ Commercial paper 186,310 198,218 U.S. Government securities 2,926,938 2,200,922 Corporate bonds 1,356,867 1,817,456 Equity securities 7,981,697 6,701,073
Yankee bonds 86,241 273,306 U.S. Government agency 180,483 229,105
Total categorized 13,210,584 11,596,170
Noncategorized (B):
Short-term investment fund 2,318,815 2,344,629International investment fund 3,595,917 2,749,398
Mutual funds 20,967 20,973 Total Noncategorized 5,935,699 5,115,000
Total 19,146,283$ 16,711,170$
(In Thousands)
(A) All categorized investments are Category 1 risk.
(B) These securities are not categorized because they are not evidenced by securities that exist in physical or book-entry form.
4. DUE TO VARIABLE SUPPLEMENTS FUNDS (VSFs)
The ACNY provides that the Plan transfer to the Police Officers’ Variable Supplements Fund (“POVSF”) and the Police Superior Officers’ Variable Supplements Fund (“PSOVSF”) amounts equal to certain excess earnings on equity investments of the Plan, if any. The Excess Earnings are defined as the amount by which earnings on equity investments of the Plan exceed what the earnings would have been had such funds been invested at a yield comparable to that available from fixed income securities, less any cumulative deficiencies of prior years’ excess earnings that fell below the yield of fixed income investments. In addition, such transfers from the Plan to the POVSF and PSOVSF are limited to the unfunded accumulated benefit obligation (“ABO”) of these VSFs.
For Fiscal Year 2004, the expected excess earnings of the Plan are estimated to be equal to zero and therefore, no transfers will be due from the Plan to the VSFs as of June 30, 2004.
For Fiscal year 2003, there were no excess earnings of the Plan and therefore, no transfers were due from the Plan to the VSFs as of June 30, 2003.
5. CONTRIBUTIONS AND ACTUARIAL ASSUMPTIONS
The financial objective of the Plan is to fund members’ retirement benefits during their active service and to establish Employer contribution rates which, expressed as a percentage of annualized covered payroll, will remain approximately level from year to year. Under current law, the employer contributes statutorily-required contributions (“statutory contributions”) that together with member contributions and investment income would ultimately be sufficient to accumulate assets to pay benefits when due.
31
- 15 -
Member Contributions - Members contribute by salary deductions on the basis of a normal rate of contribution which is assigned by the Plan at membership. This member normal rate, which is dependent upon age and actuarial tables in effect at the time of membership, is determined so as to provide approximately one-third of the service retirement allowance at the earliest age for service retirement. For Tier 1, the average member normal rate is approximately 7.6%. For Tier 2, the average member normal rate is approximately 7.2%.
In recent years prior to October 1, 2000, these member contribution rates were reduced by 2.5% under the ITHP program. Effective as of October 1, 2000, member ITHP contribution rates increased to 5.0% from 2.5% and, in general, their member contribution rates were reduced in a similar manner.
Members may voluntarily increase their rates of contribution by 50% for the purpose of purchasing an additional annuity. Members are permitted to borrow up to 90% (increased from 75% with the passage of Chapter 588 of the laws of 2001) of their own contributions including accumulated interest.
Employer Contributions - Statutory contributions to the Plan, determined by the Plan’s Chief Actuary of the Office of the Actuary (the “Actuary”) in accordance with State statutes and City laws, are generally funded by the Employer within the appropriate fiscal year.
The June 30, 2003 and 2002 actuarial valuations used to determine Fiscal Years 2004 and 2003 Employer contributions, respectively, were, in general, based on actuarial assumptions and methods recommended by the Actuary. Where required, the Board of Trustees of the Plan adopted those changes to the actuarial assumptions and methods that required Board approval and the State Legislature and the Governor enacted Chapter 85 of the Laws of 2000 (“Chapter 85/00”) to provide for those changes to the actuarial assumptions and methods that required legislation, including the investment rate of return assumption of 8.0% per annum.
The Frozen Initial Liability Actuarial Cost Method is utilized by the Plan’s Actuary to calculate the contributions from the Employer. Under this actuarial cost method, the Initial Liability was reestablished by the Entry Age Actuarial Cost Method as of June 30, 1999, but with the Unfunded Actuarial Accrued Liability (“UAAL”) not less than zero. The excess of the Actuarial Present Value of projected benefits of members as of the valuation date, over the sum of the Actuarial Value of Assets plus UAAL, if any and the present value of future employee contributions is allocated on a level basis over the future earnings of members who are on payroll as of the valuation date. Actuarial gains and losses are reflected in the Employer normal contribution rate.
Chapter 85/00 reestablished the UAAL and eliminated the Balance Sheet Liability (“BSL”) for actuarial purposes as of June 30, 1999. The schedule of payments toward the reestablished UAAL provides that the UAAL, if any, be amortized over a period of 11 years beginning Fiscal Year 2000, where each annual payment after the first equals 103% of its preceding annual payment.
Additionally, the Actuarial Asset Valuation Method (“AAVM”) was changed as of June 30, 1999 to reflect a market basis for investments held by the Plan. This AAVM recognizes expected investment returns immediately and phases in investment returns greater or less than expected (i.e., Unexpected Investment Returns (“UIR”)).
Under this AAVM, any UIR for Fiscal Years 2000 and later are phased into the Actuarial Asset Value (“AAV”) beginning the following June 30 at a rate of 10%, 15%, 20%, 25% and 30% per year (or at a cumulative rate of 10%, 25%, 45%, 70% and 100% over five years).
32
- 16 -
Chapter 125/00 provided eligible retirees and eligible beneficiaries with increased Supplementation as of September 2000 and with automatic Cost-of-Living Adjustments (“COLA”) beginning September 2001. Chapter 125/00 also provided for a five-year phase-in schedule for funding the additional actuarial liabilities created by the benefits provided by this law. Chapter 278 of the Laws of 2002 (“Chapter 278/02”) required the Actuary to revise the methodology and timing for determining the statutory contributions on account of the additional actuarial liabilities attributable to the benefits provided under Chapter 125/00 by extending the phase-in period for funding these liabilities from five years to ten years.
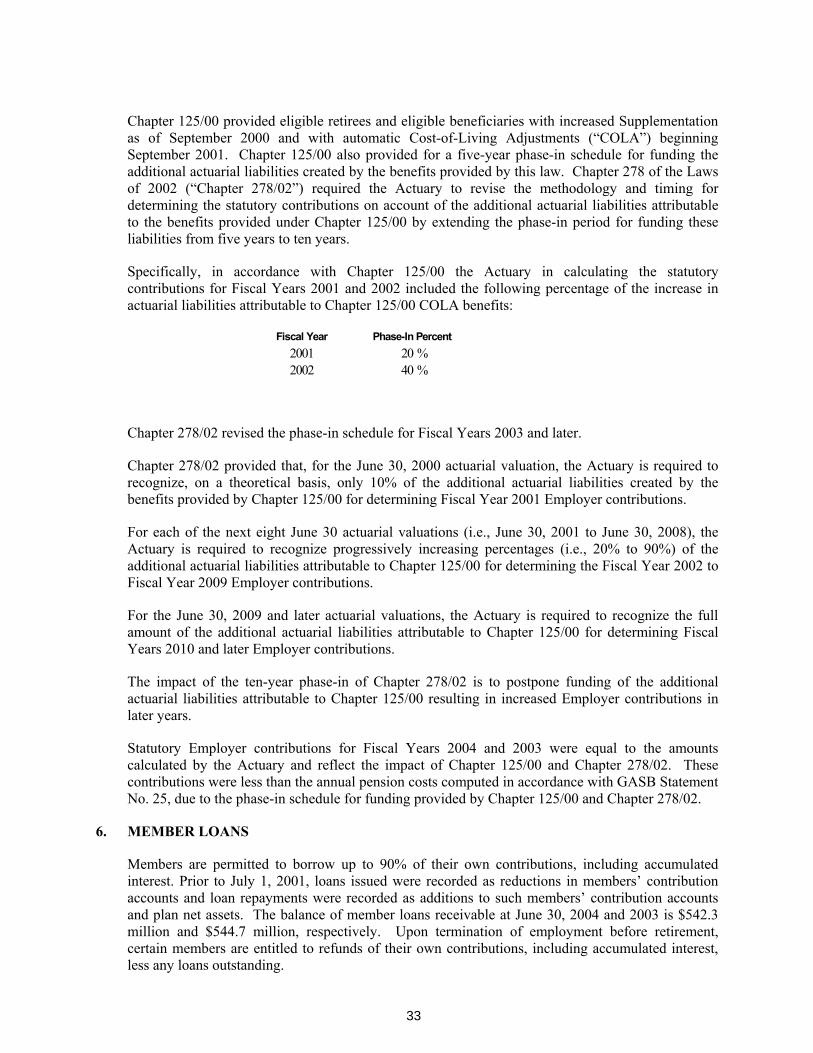
Specifically, in accordance with Chapter 125/00 the Actuary in calculating the statutory contributions for Fiscal Years 2001 and 2002 included the following percentage of the increase in actuarial liabilities attributable to Chapter 125/00 COLA benefits:
Fiscal Year Phase-In Percent2001 20 %2002 40 %
Chapter 278/02 revised the phase-in schedule for Fiscal Years 2003 and later.
Chapter 278/02 provided that, for the June 30, 2000 actuarial valuation, the Actuary is required to recognize, on a theoretical basis, only 10% of the additional actuarial liabilities created by the benefits provided by Chapter 125/00 for determining Fiscal Year 2001 Employer contributions.
For each of the next eight June 30 actuarial valuations (i.e., June 30, 2001 to June 30, 2008), the Actuary is required to recognize progressively increasing percentages (i.e., 20% to 90%) of the additional actuarial liabilities attributable to Chapter 125/00 for determining the Fiscal Year 2002 to Fiscal Year 2009 Employer contributions.
For the June 30, 2009 and later actuarial valuations, the Actuary is required to recognize the full amount of the additional actuarial liabilities attributable to Chapter 125/00 for determining Fiscal Years 2010 and later Employer contributions.
The impact of the ten-year phase-in of Chapter 278/02 is to postpone funding of the additional actuarial liabilities attributable to Chapter 125/00 resulting in increased Employer contributions in later years.
Statutory Employer contributions for Fiscal Years 2004 and 2003 were equal to the amounts calculated by the Actuary and reflect the impact of Chapter 125/00 and Chapter 278/02. These contributions were less than the annual pension costs computed in accordance with GASB Statement No. 25, due to the phase-in schedule for funding provided by Chapter 125/00 and Chapter 278/02.
6. MEMBER LOANS
Members are permitted to borrow up to 90% of their own contributions, including accumulated interest. Prior to July 1, 2001, loans issued were recorded as reductions in members’ contribution accounts and loan repayments were recorded as additions to such members’ contribution accounts and plan net assets. The balance of member loans receivable at June 30, 2004 and 2003 is $542.3 million and $544.7 million, respectively. Upon termination of employment before retirement, certain members are entitled to refunds of their own contributions, including accumulated interest, less any loans outstanding.
33

- 17 -
7. RELATED PARTIES
The Comptroller has been appointed by law as custodian for the assets of the Plan. Securities are held by certain banks under custodial agreements with the Comptroller. The Comptroller also provides cash receipt and cash disbursement services to the Plan. Actuarial services are provided to the Plan by the Office of the Actuary employed by the Boards of Trustees of the City’s main pension systems. The City’s Corporation Counsel provides legal services to the Plan. Other administrative services are also provided by the City. The aforementioned services may be provided by employees or officers of the City who may also be participants in the Plan. The cost of providing such services amounted to $2,214,071 and $2,461,666 in Fiscal Years 2004 and 2003, respectively.
8. ADMINISTRATIVE AND INVESTMENT EXPENSES
Chapter 292 of the Laws of 2001 provides Corpus Funding of administrative expenses for the Plan commencing July 1, 2001 and allows for the appointment of an executive director for the Plan. In Fiscal Year 2004, total non-investment expenses attributable to the Plan were approximately $13.4 million, of which $11.2 million were paid from the assets of the Plan and $2.2 million were paid by the City on behalf of the Plan. In Fiscal Year 2003, total non-investment expenses paid by the Plan were $11.4 million, of which $2.5 million were incurred on behalf of the Plan by other City agencies, primarily the Comptroller’s Office. Investment expenses charged to the investment earnings of the Plan, exclusive of expenses relating to securities-lending transactions, amounted to approximately $29.9 million in 2004 and $19.8 million in 2003.
During Fiscal Year 2002, the Plan entered into a lease agreement to rent office space. The agreement will expire in Fiscal Year 2012 with an option to renew through Fiscal Year 2017. The future minimum rental payments required under this operating lease are as follows:
Lease Year Amount
2005 $ 2,023,056 2006 2,023,056 2007 2,060,988 2008 2,191,644 2009 2,191,644 2010-2014 (5 years) 11,333,328 2015 to April 2017 (2 years) 4,189,412
9. CONTINGENT LIABILITIES AND OTHER MATTERS
Contingent Liabilities - The Plan has claims pending against it and has been named as defendant in lawsuits and also has certain other contingent liabilities. Management of the Plan, on the advice of legal counsel, believes that such proceedings and contingencies will not have a material effect on the Plan’s net assets or changes in the Plan’s net assets. Under the State statutes and City laws that govern the functioning of the Plan, increases in the obligation of the Plan to members and beneficiaries ordinarily result in increases in the obligations of the City to the Plan.
Other Matters - During Fiscal Years 2004 and 2003, certain events described below took place which, in the opinion of Plan management, could have the effect of increasing benefits to members and/or their beneficiaries and therefore would increase the obligations of the Plan. The effect of such events has not been fully quantified. However, it is the opinion of Plan management that such
34

- 18 -
developments would not have a material effect on the Plan net held in trust for pension benefit or cause changes in Plan net assets held in trust for pension benefits.
Actuarial Audit - Pursuant to Section 96 of the New York City Charter, studies of the actuarial assumptions used to value liabilities of the five actuarially funded New York City Retirement Systems (“NYCRS”) are conducted every two years. The most recent study was published by Gabriel Roeder Smith & Company (“GRS”) dated October 2003 and analyzed experience for Fiscal Years 1998 through 2001. The Actuary is currently reviewing this study and may recommend changes to the actuarial assumptions and methods applicable to the determination of the Fiscal Year 2005 Employer contribution.
Revised Actuarial Assumptions and Methods - In accordance with the ACNY and with appropriate practice, the Boards of Trustees of the five actuarially funded NYCRS are to periodically review and adopt actuarial assumptions as recommended by the Actuary for use in the determination of Employer contributions.
Based upon a review of the October 1999 independent actuarial study, the Actuary proposed changes to certain actuarial assumptions and methods to be used by the NYCRS for Fiscal Years beginning on and after July 1, 1999 (i.e., Fiscal Years beginning 2000). Where required, the Board of Trustees of the Plan has adopted those changes to actuarial assumptions and methods that required Board approval and the State Legislature and the Governor have enacted Chapter 85/00 to provide for those changes to the actuarial assumptions and methods that required legislation, including the investment rate of return assumption of 8.0% per annum.
New York State Legislation - Chapter 133 of the Laws of 2004 extends certain provisions of Chapter 85/00 through Fiscal Years 2005. Thus, for Fiscal Year 2005, the interest rate to use for Tier 1 and Tier 2 member contributions and ITHP Reserves remains at 8.25% per annum. The investment rate of return assumption for determining Employer Contributions for Fiscal Year 2005 remains at 8.0% per annum until and unless changed following the recommendation of the Actuary and the actions by the Board of Trustees, the State Legislature and the Governor.
35

- 19 -
NEW YORK CITY POLICE PENSION FUNDSchedule 1
SCHEDULE OF FUNDING PROGRESS (UNAUDITED)(IN CONFORMITY WITH THE PLAN’S FUNDING METHOD)(in Thousands)
(1) (2) (3) (4) (5) (6)Actuarial Actuarial Actuarial UAAL as aValuation Asset Accrued Unfunded Percentage
Date Value Liability AAL Funded Covered of CoveredJune 30 (AAV) (AAL)* (UAAL) Ratio Payroll Payroll
(A) (A) & (B) (C)(2)-(1) (1)÷(2) (3)÷(5)
2003 18,781,359$ 18,781,359$ - $ 100.0 % 2,433,897$ 0.0 %2002 18,913,634 18,913,634 - 100.0 2,496,249 0.0 2001 18,141,670 18,141,670 - 100.0 2,500,130 0.0 2000 17,601,913 17,601,913 - 100.0 2,465,682 0.0 1999 16,877,765 16,877,765 - 100.0 2,331,957 0.0
Notes:
* Frozen Entry Age (1998), Frozen Initial Liability (2003).
(A) As of June 30, 1995 and June 30, 1999, the economic and noneconomic assumptions were revised due to experience review. The AAVM was changed as of June 30, 1995 and June 30, 1999 to reflect a market basis for investments held by the Plan and was made as one component of an overall revision of actuarial assumptions and methods as of June 30, 1995 and June 30, 1999.
Under the AAVM used as of June 30, 1995, the AAV was reset to Market Value (i.e., Market Value Restart) Prior to June 30, 1995, this AAVM recognized expected investment returns immediately and phased in investment returns greater or less than expected (i.e., UIR) over five years at a rate of 20% per year (or at a cumulative rate of 20%, 40%, 60%, 80% and 100% over five years).
The AAVM used as of June 30, 1996 was a modified version of that used prior to June 30, 1995.
Under this modified AAVM, any UIR for Fiscal Years 1997 and later were phased into the AAV beginning the following June 30 at a rate of 10%, 15%, 20%, 25% and 30% per year (or at a cumulative rate of 10%, 25%, 45%, 70% and 100% over five years). The UIR for Fiscal Year 1996 was phased in beginning June 30, 1996 at a cumulative rate of 20%, 35%, 45%, 70% and 100% over five years.
(Schedule of Funding Progress is continued to the next page)
36
- 20 -
Schedule 1
(Schedule of Funding Progress continued from the previous page)
Under the AAVM used as of June 30, 1999, any UIR for Fiscal Years 2000 and later are phased into the AAV beginning the following June 30 at a rate of 10%, 15%, 20%, 25% and 30% per year (or at a cumulative rate of 10%, 25%, 45%, 70% and 100% over five years).
(B) To effectively assess the funding progress of the Plan, it is necessary to compare the AAV and the AAL calculated in a manner consistent with the Plan’s funding method over a period of time. The AAL is the portion of the Actuarial Present Value of pension plan benefits and expenses which is not provided for by future normal costs and future member contributions.
(C) The Unfunded Actuarial accrued Liability is the excess of the AAL over the AAV. This is the same as the unfunded frozen Actuarial Accrued Liability, which is not adjusted from one actuarial valuation to the next to reflect actuarial gains and losses.
(Schedule of Funding Progress concluded)
37

- 21 -
NEW YORK CITY POLICE PENSION FUND Schedule 2
SCHEDULE OF EMPLOYER CONTRIBUTIONS (UNAUDITED)(In Thousands)
Annual PercentageFiscal Year Required of ARC
Ended June 30 Contribution (ARC) Contributed
2004 917,731$ 88.5 %2003 821,387 76.12002 636,481 84.02001 543,758 76.02000 250,021 100.01999 486,780 100.0
The statutorily-required contributions of $812.0 million, $625.4 million, $534.5 million and $413.2 million for Fiscal Years 2004, 2003, 2002 and 2001, respectively, were computed in accordance with Chapter 125/00, which provides for a five-year phase-in of the additional actuarial liabilities attributable to Chapter 125/00 and Chapter 278/02 which extended the phase-in period for funding these liabilities from five years to ten years.
38

- 22 -
Schedule 3
NEW YORK CITY POLICE PENSION FUND
SCHEDULE OF ACTUARIAL METHODS AND ASSUMPTIONS (UNAUDITED)
The information presented in the required supplementary schedules was determined as part of the actuarial valuations as of June 30, 2003 and June 30, 2002. These actuarial valuations were used to determine Employer Contributions for Fiscal Years 2004 and 2003, respectively. Additional information as of the last two actuarial valuations follows:
June 30, 2003 June 30, 2002
Actuarial cost method Frozen Initial Liability1. Frozen Initial Liability1.
Amortization method for Unfunded Actuarial Accrued Liabilities Not applicable.2 Not applicable.2
Remaining amortization period Not applicable.2 Not applicable.2
Actuarial asset valuation method Modified five-year moving average Modified five-year moving average of market values with market value of market values with market restart as of June 30, 1999. value restart as of June 30, 1999.
Actuarial assumptions: Investment assumed rate of return 8.0% per annum.3 8.0% per annum.3
Post-retirement mortality Tables based on recent experience. Tables based on recent experience.
Active service: withdrawal, death, disability, service retirement Tables based on recent experience. Tables based on recent experience.
Salary increases In general, merit and promotion In general, merit and promotion increases plus assumed general increases plus assumed general wage increases of 3.0% per year.3 wage increases of 3.0% per year.3
Cost-of-Living Adjustments 1.3% per annum.3 1.3% per annum.3
1 Under this Actuarial Cost Method, the Initial Liability was reestablished as of June 30, 1999 by the Entry Age Actuarial Cost Method but with the UAAL not less than $0.
2 In conjunction with Chapter 85/00, there is an amortization method. However, the UAAL for the Plan equaled $0 and no amortization period was required.
3 Developed assuming a long-term Consumer Price Inflation assumption of 2.5% per year.
39

SCHEDULE 4
NEW YORK CITY
POLICE PENSION FUND
SCHEDULE OF ADMINISTRATIVE EXPENSES
YEAR ENDED JUNE 30, 2004
Salaries Paid to Plan Personnel $8,253,325
Professional Services:
Administration 367,555 Trading and Investments 771,225 Management Division 35,071 Legal 498,540
Total Professional Services 1,672,391
Communication and General Services:
Printing and Computer Services 61,797 Heat, light and telephone 5,945 Postage 195,285 General Services 61,556
Total Communication and General Services 324,583
Miscellaneous Expenses:
Office Management and Budget 217,097 Pension overhead expenses 5,101,589
Total Miscellaneous Expenses 5,318,686
Total Administrative Expenses $15,568,985 *
* This amount represents expenses incurred by the Fund and also by other City agencies. From these expenses, $ 11,612,000 are incurred andpaid by NYCPPF and the balance is incurred by other city agencies and paid by the City of New York on behalf of the Fund.
40

SCHEDULE 5
NEW YORKK CITYPOLICE PENSION FUND
BROKER COMMISSIONS REPORTFOR FISCAL YEAR ENDED JUNE 30, 2004
Broker Name Total Shares Commissions Commissions per share
ABEL NOSER CORP THRU 100 166,700.00 6,516.00 0.04 CBABEL NOSER CORPORATION 340,400.00 7,146.00 0.02 BNYABN AMRO SECURITIES LLC 12,000.00 600 0.05 BNYADAMS, HARKNESS & HILL IN 194,142.00 4,981.10 0.03 CBADAMS, HARKNESS & HILL IN 25,100.00 447 0.02 BNYADVEST,INC 2,800.00 112 0.04 BNYADVEST,INC 4,300.00 172 0.04 CBALLEN & COMPANY LLC 268,400.00 13,277.00 0.05 CBALLEN & COMPANY LLC 43,100.00 2,155.00 0.05 BNYAMERICAN TECHNOLOGY RESEARCH INC 9,200.00 460 0.05 BNYAMERICAN TECHNOLOGY RESEARCH INC 23,200.00 1,160.00 0.05 CBARNHOLD & S BLEICHROEDER INC 9,800.00 294 0.03 BNYARNHOLD & S BLEICHROEDER INC 18,200.00 827 0.05 CBAUTRANET,INC THRU 0443 76,700.00 3,068.00 0.04 CBAVALON RESEARCH GROUP INC 102,900.00 5,145.00 0.05 CBBAIRD ROBERT W & CO INC 485,708.00 21,736.40 0.04 CBBAIRD ROBERT W & CO INC 324,220.00 13,921.00 0.04 BNYBANC AMERICA SECUR LLC 1,297,692.00 59,028.00 0.05 BNYBEAR STEARNS & CO 1,597,059.00 53,602.01 0.03 CBBEAR STEARNS & CO INC 2,815,145.00 95,291.73 0.03 CBBEAR STEARNS & CO INC 1,112,005.00 39,527.50 0.04 BNYBEARS STEARNS & COMPANY 586,997.00 19,493.71 0.03 BNYBEARS STEARNS & COMPANY 19,100.00 783 0.04 BNYBEREAN CAPITAL, INC. #2 19,900.00 964 0.05 CBBEREAN CAPITAL, INC. #2 14,900.00 596 0.04 BNYBERNSTEIN SANFORD C. & CO INC 1,382,431.00 61,731.30 0.04 CBBERNSTEIN, SANFORD C., & 15,800.00 632 0.04 BNYBHC SECS INC 2,000.00 100 0.05 CBBHF SECURITIES CORP 93,500.00 4,440.00 0.05 CBBISHOP ROSEN 8,800.00 440 0.05 CBBISHOP ROSEN 3,300.00 132 0.04 BNYBK OF AMERICA LOAN GRP 37,199.00 1,301.99 0.04 CBBLACKBURN & CO THRU 0011 35,100.00 1,554.00 0.04 CBBLACKWATCH BROKERAGE INC. 28,000.00 1,267.00 0.05 CBBLAIR WILLIAM & CO 699,985.00 30,522.00 0.04 CBBLAIR WILLIAM & COMPANY L 146,100.00 7,305.00 0.05 BNYBLAYLOCK & PARTNERS, L.P. 346,900.00 13,214.00 0.04 CBBLAYLOCK & PARTNERS, L.P. 23,500.00 940 0.04 BNYBMO NESBITT BURNS CORP 117,900.00 3,459.00 0.03 BNYBNP PARIBAS SECURITIES CORP IB 216,600.00 4,332.00 0.02 BNYBNP PARIBAS SECURITIES CORP IB 205,600.00 4,112.00 0.02 CBBNY BROKERAGE INC 147,881.00 4,458.85 0.03 BNYBOSTON INSTITUTIONAL SVCS 21,800.00 1,090.00 0.05 BNYBOSTON INSTITUTIONAL THRU 0551 411,050.00 20,552.50 0.05 CBBREAN MURRAY FOSTER THRU 0352 23,400.00 936 0.04 CBBRIDGE TRADING CO. 97,954.00 4,668.66 0.05 BNY
41

SCHEDULE 5
NEW YORKK CITYPOLICE PENSION FUND
BROKER COMMISSIONS REPORTFOR FISCAL YEAR ENDED JUNE 30, 2004
Broker Name Total Shares Commissions Commissions per share
BRIDGE TRADING THRU 573 196,900.00 9,392.00 0.05 CBBROAD COURT CORP THRU 0161 83,300.00 3,914.00 0.05 CBBROADCORT CAPITAL CORP-SU 85,000.00 2,550.00 0.03 BNYBROCK HOUSE & COOPER INC THRU 0443 19,950.00 997.5 0.05 CBBT ALEX BROWN INC 6,140,104.00 164,064.41 0.03 CBB-TRADE SERVICES LLC 2,436,295.00 61,174.15 0.03 CBB-TRADE SERVICES LLC 1,168,775.00 23,961.00 0.02 BNYBUCKINGHAM RESEARCH GROUP INC 579,900.00 28,860.00 0.05 CBBUCKINGHAM RESEARCH GROUP 152,000.00 7,204.00 0.05 BNYBUNTING WARBURG INC -NSCC 3,800.00 121.6 0.03 CBBUNTING WARBURG INCORPORA 109,800.00 3,513.60 0.03 BNYBURNS FRY HOARE GOVETT INC 230,988.00 7,111.54 0.03 CBC.E. UNTERBERG, TOWBIN 23,700.00 1,185.00 0.05 BNYCAIN BROTHERS THRU 0443 18,697.43 - - CBCANTOR, FITZGERALD & CO., 1,421,370.00 50,023.75 0.04 CBCANTOR, FITZGERALD & CO., 453,850.00 14,771.50 0.03 BNYCAP INSTITUTIONAL SERV INC-EQUITI 260,804.00 9,861.58 0.04 CBCAP INSTL SVCS INC-EQUITI 278,100.00 6,762.00 0.02 BNYCAPITAL INSTIT SEC INC THRU 0030 475,300.00 19,232.00 0.04 CBCHARLES, SCHWAB & CO., IN 169,275.00 7,486.75 0.04 BNYCIBC OPPENNHEIMER CORP 862,028.00 40,893.69 0.05 CBCIBC WORLD MARKETS CORP 207,552.00 9,920.31 0.05 BNYCITATION GROUP THRU 0161 414,700.00 20,679.00 0.05 CBCITIGROUP GLOBAL MARKETS 635,892.00 28,401.60 0.04 BNYCJS SECURITIES 19,700.00 985 0.05 CBCJS SECURITIES 21,500.00 1,075.00 0.05 BNYCORRESPONDENT SVCS CORP THRU 022 3,900.00 - - CBCOWEN & CO 1,492,398.00 69,875.90 0.05 CBCREDIT SUISSE FIRST BOSTON 2,070,779.00 69,640.97 0.03 BNYCREDIT SUISSE FIRST BOSTON 3,098,347.00 133,262.04 0.04 CBDAIN RAUSCHER INCORPORATED 486,561.00 20,220.35 0.04 CBDAVENPORT & COMPANY LLC 13,900.00 695 0.05 BNYDAVIDSON D.A & CO INC NSC 803,366.00 7,093.30 0.01 CBDAVIDSON D.A & CO INC NSC 137,900.00 - - BNYDAVIS,MENDEL & REGENSTEIN 167,525.00 8,376.25 0.05 BNYDEUTSCHE BANC/ALEX BROWN 5,115,757.00 8,755.25 0 BNYDICKINSON, RG THRU 0942 11,600.00 232 0.02 CBDIRECT BROKERAGE SERV THRU 0443 13,400.00 670 0.05 CBDONALDSON,LUFKIN AND JENRETTE SEC 67,317.00 1,424.34 0.02 CBDOWLING & PARTNERS SECS, 8,200.00 328 0.04 BNYEDWARDS, A.G., & SONS, IN 200,260.00 9,840.00 0.05 CBEDWARDS, A.G., & SONS, IN 26,200.00 817 0.03 BNYEMERGING GROWTH EQUITIES LTD 200 - - CBEMPIRICAL RES PARTNERS LL 21,300.00 1,065.00 0.05 BNY
42

SCHEDULE 5
NEW YORKK CITYPOLICE PENSION FUND
BROKER COMMISSIONS REPORTFOR FISCAL YEAR ENDED JUNE 30, 2004
Broker Name Total Shares Commissions Commissions per share
ENTIRE CALL FOR REDEMPTIO 3,750.00 - - BNYEXECUTION SERVICES INC 445,687.00 16,579.08 0.04 CBFACTSET DATA SYSTEMS INC 678,830.00 32,867.50 0.05 CBFACTSET DATA SYSTEMS THRU 0352 238,133.00 11,686.65 0.05 CBFACTSET DATA SYSTMES INC. 19,800.00 990 0.05 BNYFACTSET DATA SYSTMES INC. 117,325.00 5,866.25 0.05 BNYFAHNESTOCK & CO 195,660.00 3,781.00 0.02 CBFERRIS, BAKER WATTS THRU 0039 1,000.00 50 0.05 CBFERRIS, BAKER WATTS, INC 4,600.00 - - BNYFIDELITY CAP MKTS (NFSC)THRU 0226 4,200.00 188 0.04 CBFIRSERV SECURITIES INC 21,200.00 1,060.00 0.05 CBFIRST ALBANY CORP 767,476.00 35,538.20 0.05 CBFIRST ALBANY CORP 243,690.00 10,975.50 0.05 BNYFIRST CLEARING, LLC 92,700.00 4,635.00 0.05 CBFIRST CLEARING, LLC 27,600.00 1,380.00 0.05 BNYFIRST MARATHON SECURITIES 29,000.00 1,274.00 0.04 CBFIRST OF AMERICA BANK-MICH - IPA 26,800.00 1,340.00 0.05 CBFIRST SOUTHWEST CO 211,558.00 10,430.90 0.05 CBFIRST SOUTHWEST CO 33,000.00 1,566.00 0.05 BNYFIRST UNION CAPITAL MARKETS CORP 299,141.00 14,089.25 0.05 CBFIRST UNION CAPITAL MKTS THRU 0250 423,725.00 18,832.25 0.04 CBFISERV SECURITIES INC 13,600.00 680 0.05 BNYFLEET SECS INC 2,300.00 46 0.02 CBFOX PITT KELTON INC THRU 0221 70,700.00 3,646.00 0.05 CBFOX-PITT KELTON INC. 53,075.00 2,653.75 0.05 BNYFRIEDMAN BILLNGS & RAMSY THRU 0352 792,200.00 25,457.00 0.03 CBFRIEDMAN, BILLINGS & RAMS 131,500.00 1,955.00 0.01 BNYFULCRUM GLOBAL PARTNERS LLC 53,900.00 2,591.00 0.05 BNYFULCRUM GLOBAL PARTNERS LLC 110,100.00 5,341.00 0.05 CBG.G.E.T. LLC 21,400.00 781 0.04 CBGABELLI & CO 12,900.00 645 0.05 BNYGARDNER RECH & CO THRU 0792 245,600.00 11,983.00 0.05 CBGARDNER RICH & COMPANY 37,100.00 1,500.00 0.04 BNYGENESIS MERCHANT GRP SEC THRU 079 67,800.00 3,283.00 0.05 CBGERARD KLAEUR MATTISON THRU 0352 144,094.00 4,834.70 0.03 CBGOLDMAN,SACHS & CO 6,448,206.00 38,187.49 0.01 BNYGOLDMAN,SACHS & CO 4,592,446.00 169,526.67 0.04 CBGREEN STREET ADVISORS INC 66,600.00 2,852.00 0.04 CBGREENTREE BROKERAGE SERVICES 8,800.00 352 0.04 BNYGREENTREE BROKERAGE SERVICES 11,126.00 556.3 0.05 CBGRISWOLD COMPANY 384,250.00 12,218.50 0.03 CBGRISWOLD COMPANY 65,900.00 2,306.50 0.04 BNYGUZMAN & COMPANY 1,016,400.00 30,492.00 0.03 CBGUZMAN & COMPANY 534,600.00 15,121.00 0.03 BNY
43
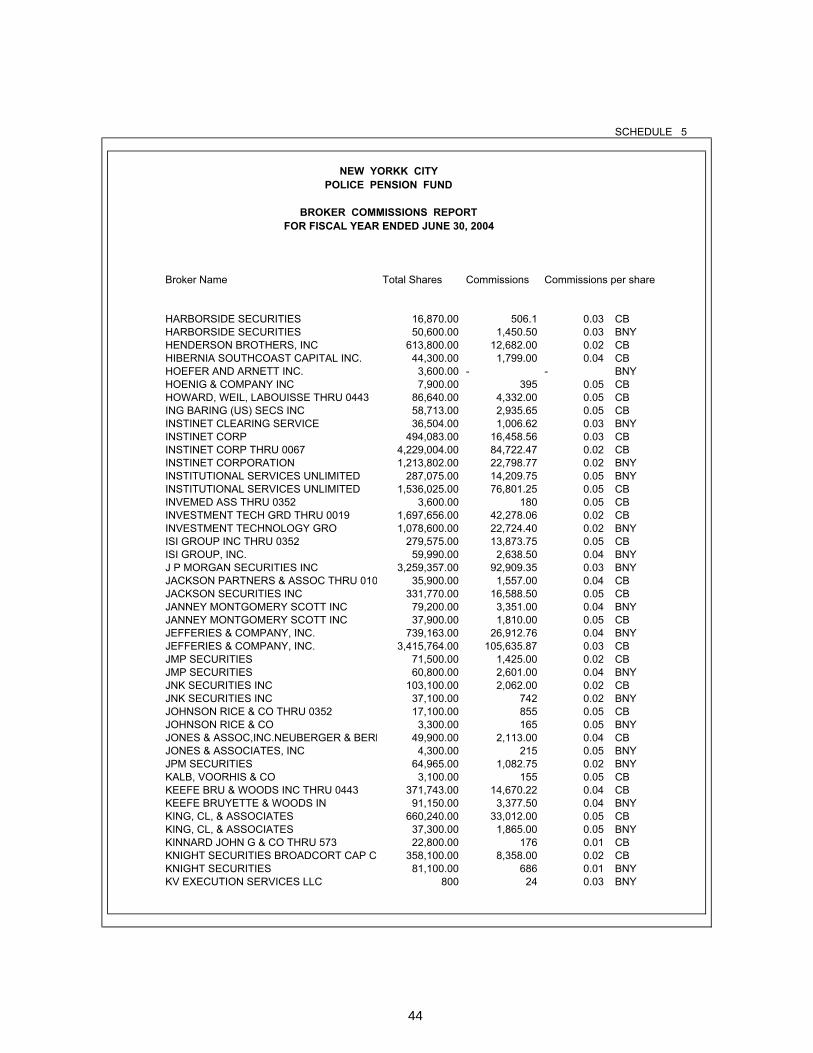
SCHEDULE 5
NEW YORKK CITYPOLICE PENSION FUND
BROKER COMMISSIONS REPORTFOR FISCAL YEAR ENDED JUNE 30, 2004
Broker Name Total Shares Commissions Commissions per share
HARBORSIDE SECURITIES 16,870.00 506.1 0.03 CBHARBORSIDE SECURITIES 50,600.00 1,450.50 0.03 BNYHENDERSON BROTHERS, INC 613,800.00 12,682.00 0.02 CBHIBERNIA SOUTHCOAST CAPITAL INC. 44,300.00 1,799.00 0.04 CBHOEFER AND ARNETT INC. 3,600.00 - - BNYHOENIG & COMPANY INC 7,900.00 395 0.05 CBHOWARD, WEIL, LABOUISSE THRU 0443 86,640.00 4,332.00 0.05 CBING BARING (US) SECS INC 58,713.00 2,935.65 0.05 CBINSTINET CLEARING SERVICE 36,504.00 1,006.62 0.03 BNYINSTINET CORP 494,083.00 16,458.56 0.03 CBINSTINET CORP THRU 0067 4,229,004.00 84,722.47 0.02 CBINSTINET CORPORATION 1,213,802.00 22,798.77 0.02 BNYINSTITUTIONAL SERVICES UNLIMITED 287,075.00 14,209.75 0.05 BNYINSTITUTIONAL SERVICES UNLIMITED 1,536,025.00 76,801.25 0.05 CBINVEMED ASS THRU 0352 3,600.00 180 0.05 CBINVESTMENT TECH GRD THRU 0019 1,697,656.00 42,278.06 0.02 CBINVESTMENT TECHNOLOGY GRO 1,078,600.00 22,724.40 0.02 BNYISI GROUP INC THRU 0352 279,575.00 13,873.75 0.05 CBISI GROUP, INC. 59,990.00 2,638.50 0.04 BNYJ P MORGAN SECURITIES INC 3,259,357.00 92,909.35 0.03 BNYJACKSON PARTNERS & ASSOC THRU 010 35,900.00 1,557.00 0.04 CBJACKSON SECURITIES INC 331,770.00 16,588.50 0.05 CBJANNEY MONTGOMERY SCOTT INC 79,200.00 3,351.00 0.04 BNYJANNEY MONTGOMERY SCOTT INC 37,900.00 1,810.00 0.05 CBJEFFERIES & COMPANY, INC. 739,163.00 26,912.76 0.04 BNYJEFFERIES & COMPANY, INC. 3,415,764.00 105,635.87 0.03 CBJMP SECURITIES 71,500.00 1,425.00 0.02 CBJMP SECURITIES 60,800.00 2,601.00 0.04 BNYJNK SECURITIES INC 103,100.00 2,062.00 0.02 CBJNK SECURITIES INC 37,100.00 742 0.02 BNYJOHNSON RICE & CO THRU 0352 17,100.00 855 0.05 CBJOHNSON RICE & CO 3,300.00 165 0.05 BNYJONES & ASSOC,INC.NEUBERGER & BERM 49,900.00 2,113.00 0.04 CBJONES & ASSOCIATES, INC 4,300.00 215 0.05 BNYJPM SECURITIES 64,965.00 1,082.75 0.02 BNYKALB, VOORHIS & CO 3,100.00 155 0.05 CBKEEFE BRU & WOODS INC THRU 0443 371,743.00 14,670.22 0.04 CBKEEFE BRUYETTE & WOODS IN 91,150.00 3,377.50 0.04 BNYKING, CL, & ASSOCIATES 660,240.00 33,012.00 0.05 CBKING, CL, & ASSOCIATES 37,300.00 1,865.00 0.05 BNYKINNARD JOHN G & CO THRU 573 22,800.00 176 0.01 CBKNIGHT SECURITIES BROADCORT CAP C 358,100.00 8,358.00 0.02 CBKNIGHT SECURITIES 81,100.00 686 0.01 BNYKV EXECUTION SERVICES LLC 800 24 0.03 BNY
44
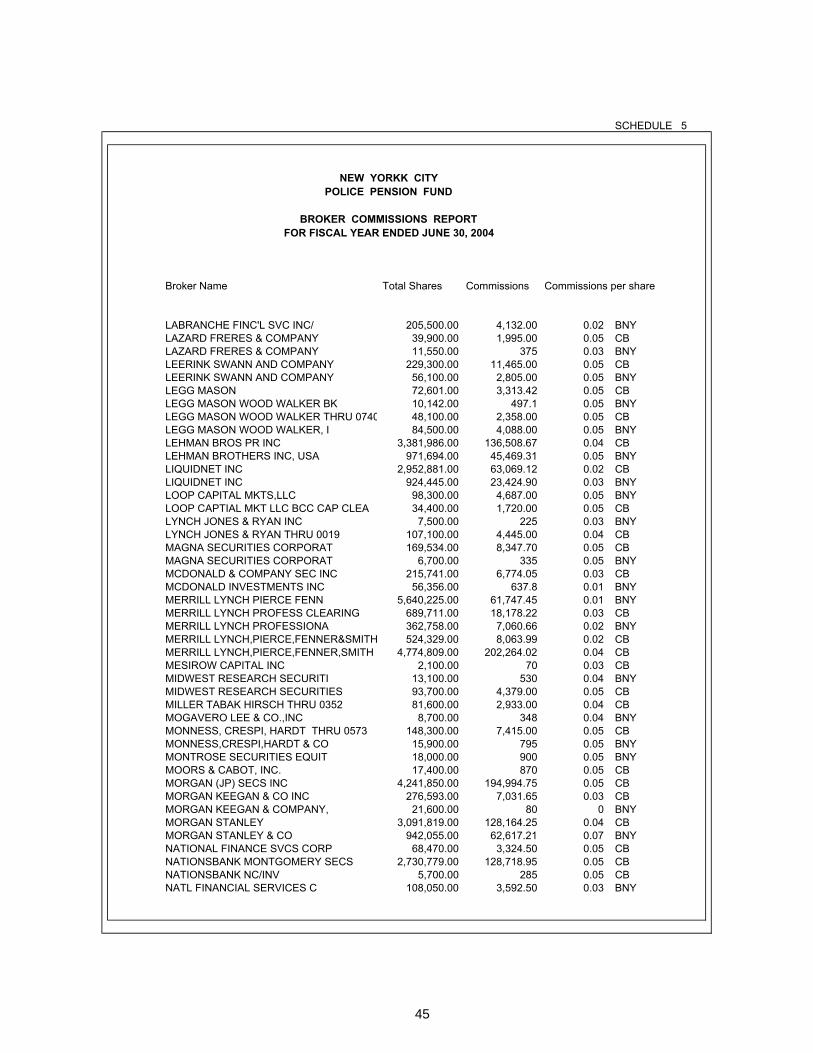
SCHEDULE 5
NEW YORKK CITYPOLICE PENSION FUND
BROKER COMMISSIONS REPORTFOR FISCAL YEAR ENDED JUNE 30, 2004
Broker Name Total Shares Commissions Commissions per share
LABRANCHE FINC'L SVC INC/ 205,500.00 4,132.00 0.02 BNYLAZARD FRERES & COMPANY 39,900.00 1,995.00 0.05 CBLAZARD FRERES & COMPANY 11,550.00 375 0.03 BNYLEERINK SWANN AND COMPANY 229,300.00 11,465.00 0.05 CBLEERINK SWANN AND COMPANY 56,100.00 2,805.00 0.05 BNYLEGG MASON 72,601.00 3,313.42 0.05 CBLEGG MASON WOOD WALKER BK 10,142.00 497.1 0.05 BNYLEGG MASON WOOD WALKER THRU 0740 48,100.00 2,358.00 0.05 CBLEGG MASON WOOD WALKER, I 84,500.00 4,088.00 0.05 BNYLEHMAN BROS PR INC 3,381,986.00 136,508.67 0.04 CBLEHMAN BROTHERS INC, USA 971,694.00 45,469.31 0.05 BNYLIQUIDNET INC 2,952,881.00 63,069.12 0.02 CBLIQUIDNET INC 924,445.00 23,424.90 0.03 BNYLOOP CAPITAL MKTS,LLC 98,300.00 4,687.00 0.05 BNYLOOP CAPTIAL MKT LLC BCC CAP CLEA 34,400.00 1,720.00 0.05 CBLYNCH JONES & RYAN INC 7,500.00 225 0.03 BNYLYNCH JONES & RYAN THRU 0019 107,100.00 4,445.00 0.04 CBMAGNA SECURITIES CORPORAT 169,534.00 8,347.70 0.05 CBMAGNA SECURITIES CORPORAT 6,700.00 335 0.05 BNYMCDONALD & COMPANY SEC INC 215,741.00 6,774.05 0.03 CBMCDONALD INVESTMENTS INC 56,356.00 637.8 0.01 BNYMERRILL LYNCH PIERCE FENN 5,640,225.00 61,747.45 0.01 BNYMERRILL LYNCH PROFESS CLEARING 689,711.00 18,178.22 0.03 CBMERRILL LYNCH PROFESSIONA 362,758.00 7,060.66 0.02 BNYMERRILL LYNCH,PIERCE,FENNER&SMITH 524,329.00 8,063.99 0.02 CBMERRILL LYNCH,PIERCE,FENNER,SMITH 4,774,809.00 202,264.02 0.04 CBMESIROW CAPITAL INC 2,100.00 70 0.03 CBMIDWEST RESEARCH SECURITI 13,100.00 530 0.04 BNYMIDWEST RESEARCH SECURITIES 93,700.00 4,379.00 0.05 CBMILLER TABAK HIRSCH THRU 0352 81,600.00 2,933.00 0.04 CBMOGAVERO LEE & CO.,INC 8,700.00 348 0.04 BNYMONNESS, CRESPI, HARDT THRU 0573 148,300.00 7,415.00 0.05 CBMONNESS,CRESPI,HARDT & CO 15,900.00 795 0.05 BNYMONTROSE SECURITIES EQUIT 18,000.00 900 0.05 BNYMOORS & CABOT, INC. 17,400.00 870 0.05 CBMORGAN (JP) SECS INC 4,241,850.00 194,994.75 0.05 CBMORGAN KEEGAN & CO INC 276,593.00 7,031.65 0.03 CBMORGAN KEEGAN & COMPANY, 21,600.00 80 0 BNYMORGAN STANLEY 3,091,819.00 128,164.25 0.04 CBMORGAN STANLEY & CO 942,055.00 62,617.21 0.07 BNYNATIONAL FINANCE SVCS CORP 68,470.00 3,324.50 0.05 CBNATIONSBANK MONTGOMERY SECS 2,730,779.00 128,718.95 0.05 CBNATIONSBANK NC/INV 5,700.00 285 0.05 CBNATL FINANCIAL SERVICES C 108,050.00 3,592.50 0.03 BNY
45

SCHEDULE 5
NEW YORK CITY
POLICE PENSION FUND
BROKER COMMISSIONS REPORT
YEAR ENDED JUNE 30, 2004
Broker Name Total Shares Commissions Commissions per share
NBC CLEARING SERVICES 1,735.00 86.75 0.05 BNYNBC CLEARING SERVICES 1,735.00 - - BNYNEEDHAM & CO INC THRU 0352 885,950.00 8,766.50 0.01 CBNEEDHAM & CO 204,300.00 4,200.00 0.02 BNYNESBITT THOMPSON DEACON INC 33,445.00 1,680.89 0.05 CBNEUBERGER & BERMAN, LLC 5,200.00 260 0.05 BNYNEUBERGER & BERMAN, LLC 117,518.00 4,834.90 0.04 CBNEW VERNON SECURITIES LLC 25,100.00 1,053.00 0.04 BNYNIKKO SECURITIES INTL 60,000.00 1,200.00 0.02 CBNOT AVAILABLE 2,612,020.26 - - BNYNUTMEG SECS THRU 0443 71,500.00 3,575.00 0.05 CBNUTMEG SECURITIES 70,300.00 3,515.00 0.05 BNYNYFIX TRANSACTION SERVICE 10,500.00 420 0.04 BNYO'NEIL, WILLIAM & CO.,INC./BCG CL 134,550.00 6,727.50 0.05 CBOSCAR GRUSS & SON INC THRU 0019 88,200.00 4,410.00 0.05 CBPACIFIC CREST SECS 670,125.00 30,466.25 0.05 BNYPACIFIC GROWTH EQUITIES 30,000.00 - - BNYPACIFIC GROWTH THRU 0158 354,500.00 - - CBPAINE WEBBER INC 90,829.00 4,467.45 0.05 CBPAULSEN DOWLING SECS THRU 0352 36,000.00 1,800.00 0.05 CBPCS SECS INC THRU 0352 334,560.00 16,728.00 0.05 CBPELLINOR SECURITIES CORP 10,900.00 545 0.05 CBPENSON FINANCIAL SERVICES, INC. 54,300.00 2,592.00 0.05 BNYPENSON FINANCIAL SERVICES, INC. 147,300.00 6,257.00 0.04 CBPERSHING & COMPANY 171,267.00 6,340.30 0.04 BNYPERSHING DIV DONALDSON LUFKIN JENR 720,901.00 34,933.73 0.05 CBPERSHING DIV OF DONALDSON 42,300.00 925 0.02 BNYPETRIE PARKMAN & CO 48,400.00 2,420.00 0.05 CBPRUDENTIAL EQUITY GROUP 958,668.00 46,072.40 0.05 CBPRUDENTIAL EQUITY GROUP 389,800.00 17,807.00 0.05 BNYPRUDENTIAL SECS INC 290,861.00 13,532.05 0.05 CBPULSE TRADING LLC 117,300.00 4,430.00 0.04 CBPULSE TRADING LLC 5,700.00 228 0.04 BNYQUAKER SECS INC THRU 0501 50,700.00 1,032.00 0.02 CBQUAKER SECURITIES INC 21,400.00 428 0.02 BNYRAYMOND JAMES & ASSOCIATES INC 486,681.00 22,768.05 0.05 CBRAYMOND JAMES & ASSOCIATES INC 1,800.00 90 0.05 BNYRAYMOND, JAMES & ASSOC., 127,000.00 6,004.00 0.05 BNYRBC DOMINION SECURITIES CORP 123,040.00 4,618.00 0.04 CBRBC DOMINION SECURITIES,C 100 5 0.05 BNYRBC DOMINION SECURITIES,C 157,330.00 5,626.50 0.04 BNYROCHDALE SEC CORP THRU 0443 68,833.00 2,753.32 0.04 CBROCHDALE SECURITIES CORP 68,200.00 2,728.00 0.04 BNYROSENBLATT SECURITIES INC 170,500.00 3,410.00 0.02 BNY
46
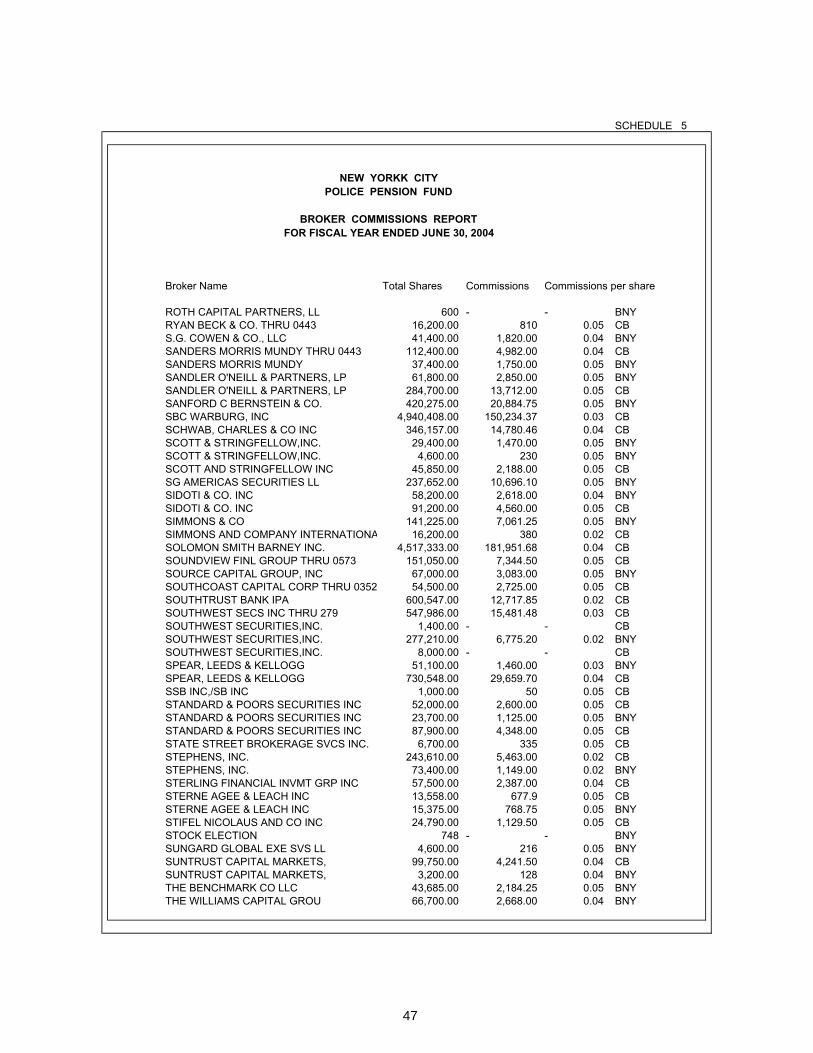
SCHEDULE 5
NEW YORKK CITYPOLICE PENSION FUND
BROKER COMMISSIONS REPORTFOR FISCAL YEAR ENDED JUNE 30, 2004
Broker Name Total Shares Commissions Commissions per share
ROTH CAPITAL PARTNERS, LL 600 - - BNYRYAN BECK & CO. THRU 0443 16,200.00 810 0.05 CBS.G. COWEN & CO., LLC 41,400.00 1,820.00 0.04 BNYSANDERS MORRIS MUNDY THRU 0443 112,400.00 4,982.00 0.04 CBSANDERS MORRIS MUNDY 37,400.00 1,750.00 0.05 BNYSANDLER O'NEILL & PARTNERS, LP 61,800.00 2,850.00 0.05 BNYSANDLER O'NEILL & PARTNERS, LP 284,700.00 13,712.00 0.05 CBSANFORD C BERNSTEIN & CO. 420,275.00 20,884.75 0.05 BNYSBC WARBURG, INC 4,940,408.00 150,234.37 0.03 CBSCHWAB, CHARLES & CO INC 346,157.00 14,780.46 0.04 CBSCOTT & STRINGFELLOW,INC. 29,400.00 1,470.00 0.05 BNYSCOTT & STRINGFELLOW,INC. 4,600.00 230 0.05 BNYSCOTT AND STRINGFELLOW INC 45,850.00 2,188.00 0.05 CBSG AMERICAS SECURITIES LL 237,652.00 10,696.10 0.05 BNYSIDOTI & CO. INC 58,200.00 2,618.00 0.04 BNYSIDOTI & CO. INC 91,200.00 4,560.00 0.05 CBSIMMONS & CO 141,225.00 7,061.25 0.05 BNYSIMMONS AND COMPANY INTERNATIONA 16,200.00 380 0.02 CBSOLOMON SMITH BARNEY INC. 4,517,333.00 181,951.68 0.04 CBSOUNDVIEW FINL GROUP THRU 0573 151,050.00 7,344.50 0.05 CBSOURCE CAPITAL GROUP, INC 67,000.00 3,083.00 0.05 BNYSOUTHCOAST CAPITAL CORP THRU 0352 54,500.00 2,725.00 0.05 CBSOUTHTRUST BANK IPA 600,547.00 12,717.85 0.02 CBSOUTHWEST SECS INC THRU 279 547,986.00 15,481.48 0.03 CBSOUTHWEST SECURITIES,INC. 1,400.00 - - CBSOUTHWEST SECURITIES,INC. 277,210.00 6,775.20 0.02 BNYSOUTHWEST SECURITIES,INC. 8,000.00 - - CBSPEAR, LEEDS & KELLOGG 51,100.00 1,460.00 0.03 BNYSPEAR, LEEDS & KELLOGG 730,548.00 29,659.70 0.04 CBSSB INC,/SB INC 1,000.00 50 0.05 CBSTANDARD & POORS SECURITIES INC 52,000.00 2,600.00 0.05 CBSTANDARD & POORS SECURITIES INC 23,700.00 1,125.00 0.05 BNYSTANDARD & POORS SECURITIES INC 87,900.00 4,348.00 0.05 CBSTATE STREET BROKERAGE SVCS INC. 6,700.00 335 0.05 CBSTEPHENS, INC. 243,610.00 5,463.00 0.02 CBSTEPHENS, INC. 73,400.00 1,149.00 0.02 BNYSTERLING FINANCIAL INVMT GRP INC 57,500.00 2,387.00 0.04 CBSTERNE AGEE & LEACH INC 13,558.00 677.9 0.05 CBSTERNE AGEE & LEACH INC 15,375.00 768.75 0.05 BNYSTIFEL NICOLAUS AND CO INC 24,790.00 1,129.50 0.05 CBSTOCK ELECTION 748 - - BNYSUNGARD GLOBAL EXE SVS LL 4,600.00 216 0.05 BNYSUNTRUST CAPITAL MARKETS, 99,750.00 4,241.50 0.04 CBSUNTRUST CAPITAL MARKETS, 3,200.00 128 0.04 BNYTHE BENCHMARK CO LLC 43,685.00 2,184.25 0.05 BNYTHE WILLIAMS CAPITAL GROU 66,700.00 2,668.00 0.04 BNY
47

SCHEDULE 5
NEW YORKK CITYPOLICE PENSION FUND
BROKER COMMISSIONS REPORTFOR FISCAL YEAR ENDED JUNE 30, 2004
Broker Name Total Shares Commissions Commissions per share
THOMAS WEISEL PARTNERS LL 206,575.00 9,124.75 0.04 BNYTHOMAS WEISEL PTNS. LLC THRU 352 1,140,988.00 53,383.40 0.05 CBTHOMSON INSTITUTINAL SERVICES INC 56,000.00 2,800.00 0.05 CBU.S. BANCORP PIPER JAFFRAY INC 167,510.00 5,585.50 0.03 BNYU.S. BANCORP PIPER JAFFRAY INC 564,283.00 21,027.00 0.04 CBUBS FINANCIAL SERVICES IN 2,600.00 130 0.05 BNYUBS SECURITIES LLC 857,184.00 28,402.94 0.03 BNYUNTERBERG HARRIS THRU 0221 101,100.00 3,716.00 0.04 CBUS CLEARING CORP 1,600.00 - - BNYUS CLEARING INSTITUTIONAL 42,000.00 1,680.00 0.04 CBUS CLEARING INSTITUTIONAL 1,300.00 52 0.04 BNYUTTENDAHL CAPITAL PARTNERS 5,100.00 204 0.04 BNYUTTENDAHL CAPITAL PARTNERS 17,200.00 721 0.04 CBVIANET DIRECT, INC. 9,300.00 186 0.02 BNYWACHOVIA SECS CAPITAL MAR 57,205.00 2,489.25 0.04 BNYWACHOVIA SECURITIES,LLC 192,236.00 8,251.80 0.04 BNYWACHOVIA SECURITIES,LLC 23,300.00 1,165.00 0.05 BNYWAVE SECURITIES LLC 36,032.00 540.48 0.02 BNYWEDBUSH MORGAN SECURITIES 206,206.00 7,040.30 0.03 CBWEDBUSH MORGAN SECURITIES 9,683.00 99.15 0.01 BNYWEEDEN & CO 231,195.00 9,468.95 0.04 BNYWEEDON & CO THRU 0443 1,012,879.00 44,516.55 0.04 CBWELLS FARGO SECURITIES LLC 112,800.00 875 0.01 BNYWELLS FARGO SECURITIES LLC 769,700.00 7,026.00 0.01 CBWESTMINISTER RESEARCH ASS 313,700.00 14,549.00 0.05 BNYWESTMINSTER RES ASSOC/BROADCORT 231,800.00 11,590.00 0.05 CBWESTMINSTER RESEARCH ASSOCIATION 1,286,700.00 63,540.00 0.05 CBWESTMINSTER RESEARCH ASSOCIATION 126,400.00 3,845.00 0.03 BNYWEXFORD CLEARING SVCS CORP/IPO TR 74,900.00 2,552.00 0.03 CBWHITE CAP TRADING LLC 44,500.00 890 0.02 BNYWILLIAMS CAPITAL GROUP, L. P. 376,600.00 13,977.00 0.04 CBWILLIAMS CAPITAL GROUP, L. P. 447,400.00 22,224.00 0.05 CBWILSHIRE ASSN - NSCC 52,700.00 1,929.00 0.04 CBWR HAMBRECHT & CO 18,500.00 925 0.05 CB
151,488,878.69 4,856,182.07 0.03
48

SCHEDULE 6
NEW YORK CITYPOLICE PENSION FUND
REPORT ON INVESTMENT MANAGEMENT FEESYEAR ENDED JUNE 30, 2004
INTERNATIONAL Estimated Fees Performance Total2004 Fee Max Fee
BK OF IRELAND ASSET MGT (US) LTD/CHASE $987,420 $987,420CAPITAL GUARDIAN TRUST CO/CHASE 958,884 958,884DELAWARE MGT. CO. 1,124,194 1,124,194GE INVEST. MGMT, INC./ST. STREET BK&TR 543,806 543,806INVISTA CAPITAL MGT. 83,904 83,904OECHSLE INT'L ADVISORS 766,755 766,755PUTNAM ADVISORY CO. 330,953 330,953ROWE PRICE-FLEMING 722,760 722,760SCHRODER CAPITAL MGT INT'L/CHASE 289,658 289,658 SUBTOTAL ACTIVE $5,808,334 $5,808,334
BARCLAYS GLOBAL INVESTORS, N.A. $53,879 $53,879
SUBTOTAL INDEX $53,879 $53,879
GENESIS ASSET MGRS LTD/BANKERS TRUST $627,549 $627,549PICTET INT'L MGT LTD/BROWN BROS. 958,567 958,567 SUBTOTAL EMERGING MARKETS $1,586,116 $1,586,116 TOTAL INTERNAT'L $7,394,450 $7,394,450
NORTHERN ASSET MGRS LTD/BANKERS TRUST $47,857 $47,857MERRILL LYNCH ASSET MGT/INDEX 34,705 34,705 MERRILL -VALUE R 1000 0 EQUITY INDEX $82,562 $82,562
FIDELITY MGMT. TRUST COMPANY/GROWTH $1,322,491 $1,322,491LOOMIS SAYLES & CO. L.P. /- GROWTH 649,623 649,623ARONSON JOHNSON 666,006 666,006IRIDIAN ASSET 955,184 955,184LORD ABBETT (LCV) 945,833 945,833
SUBTOTAL CURRENT ACTIVE $4,539,137 $4,539,137
49

SCHEDULE 6
NEW YORK CITYPOLICE PENSION FUND
REPORT ON INVESTMENT MANAGEMENT FEESYEAR ENDED JUNE 30, 2004
Estimated Fees Performance TotalFee Max Fee
ARIEL CAPITAL/MID CAP $319,307 $319,307CHICAGO EQUITY PARTNERS 248,972 248,972DALTON GREINER HARMAN MAHER, & Co. 792,693 792,693DARUMA ASSET MGT, Inc. 298,843 298,843DEUTSCHE ASSET MGT 332,027 332,027FORSTMANN - LEFF ASSOC. (MID CAP) 167,706 167,706INVESCO 183,773 183,773J&W SELIGMAN 257,812 257,812LORD, ABBETT 381,859 381,859MACKAY SHIELDS 216,566 216,566MAZAMA CAPITAL MGT, Inc. 589,550 589,550 TOTAL - Small/Mid Cap $3,789,108 $3,789,108
SUBTOTAL NEW MGRS $4,539,137 $4,539,137 TOTAL US ACTIVE EQUITY 3,789,108 3,789,108 SUBTOTAL US EQUITY $8,328,245 $8,328,245
ALTERNATIVE INVESTMENTSAPPOLO INVESTMENT FUND $525,000 $525,000ARES CORP. 612,500 612,500BLACKSTONE IV 750,000 750,000BLACKSTONE RE 0 0CANYON JOHNSON 175,000 175,000CARLYLE PARTNERS III, L.P. 375,000 375,000CITY INVESTMENT FUND 437,500 437,500COLLER 315,000 315,000CVC EUROPEAN EQUITY FUND 375,000 375,000CYPRESS MRECHANT BANKING PARTNERS 750,000 750,000FDG CAPITAL 875,000 875,000FREEMAN SPOGLI V LP 225,000 225,000LINCOLNSHIRE EQUITY FUND 240,000 240,000NEW MOUNTAIN PARTNERS 300,000 300,000OCM RE OPP FUND 187,500 187,500PRISM VENTURE PARTNERS 562,500 562,500SCP PRIVATE EQUITY PARTNERS 500,000 500,000SOLERA PARTNERS 250,000 250,000VS&A FUND 400,000 400,000TOTAL ALTERNATIVES $7,855,000 $7,855,000
TOTAL - EQUITIES $23,714,136 $23,714,136
50
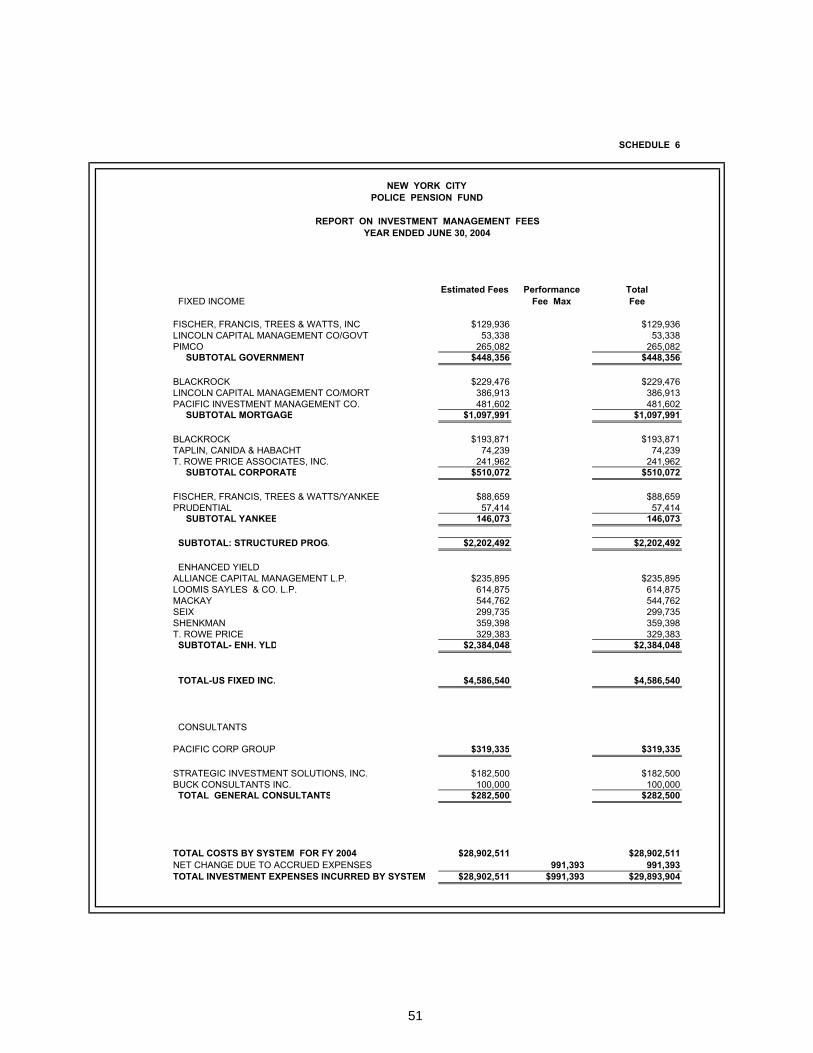
SCHEDULE 6
NEW YORK CITYPOLICE PENSION FUND
REPORT ON INVESTMENT MANAGEMENT FEESYEAR ENDED JUNE 30, 2004
Estimated Fees Performance Total FIXED INCOME Fee Max Fee
FISCHER, FRANCIS, TREES & WATTS, INC $129,936 $129,936LINCOLN CAPITAL MANAGEMENT CO/GOVT 53,338 53,338PIMCO 265,082 265,082 SUBTOTAL GOVERNMENT $448,356 $448,356
BLACKROCK $229,476 $229,476LINCOLN CAPITAL MANAGEMENT CO/MORT 386,913 386,913PACIFIC INVESTMENT MANAGEMENT CO. 481,602 481,602 SUBTOTAL MORTGAGE $1,097,991 $1,097,991
BLACKROCK $193,871 $193,871TAPLIN, CANIDA & HABACHT 74,239 74,239T. ROWE PRICE ASSOCIATES, INC. 241,962 241,962 SUBTOTAL CORPORATE $510,072 $510,072
FISCHER, FRANCIS, TREES & WATTS/YANKEE $88,659 $88,659PRUDENTIAL 57,414 57,414 SUBTOTAL YANKEE 146,073 146,073
SUBTOTAL: STRUCTURED PROG. $2,202,492 $2,202,492
ENHANCED YIELDALLIANCE CAPITAL MANAGEMENT L.P. $235,895 $235,895LOOMIS SAYLES & CO. L.P. 614,875 614,875MACKAY 544,762 544,762SEIX 299,735 299,735SHENKMAN 359,398 359,398T. ROWE PRICE 329,383 329,383 SUBTOTAL- ENH. YLD $2,384,048 $2,384,048
TOTAL-US FIXED INC. $4,586,540 $4,586,540
CONSULTANTS
PACIFIC CORP GROUP $319,335 $319,335
STRATEGIC INVESTMENT SOLUTIONS, INC. $182,500 $182,500BUCK CONSULTANTS INC. 100,000 100,000 TOTAL GENERAL CONSULTANTS $282,500 $282,500
TOTAL COSTS BY SYSTEM FOR FY 2004 $28,902,511 $28,902,511NET CHANGE DUE TO ACCRUED EXPENSES 991,393 991,393TOTAL INVESTMENT EXPENSES INCURRED BY SYSTEM $28,902,511 $991,393 $29,893,904
51


NEW YORK CITY POLICE PENSION FUND
COMPREHENSIVE ANNUAL FINANCIAL REPORT
A PENSION TRUST FUND OF THE CITY OF NEW YORK
INVESTMENT SECTION
PART III
FISCAL YEAR ENDED
June 30, 2004


Investment Section
This section is prepared from data provided by the investment advisors of the Police Pension Fund, and the Comptroller of the City of New York. We wish to express our thanks to Horatio Sparkes, Assistant Comptroller for pension and her staff for providing assistance in the preparation of this section. The information contained herein was prepared in conformance with presentation standards of the association for Investment Management & Research. The Comptroller administers the funds investments subject to the management and control of the Board of Trustees. The investment advisors seek to increase investment returns and provide greater safety for the assets of the fund. The Board of Trustees have the ultimate responsibility of ensuring that all the assets of the fund are managed prudently in compliance with the administrative code of the City of New York and the State Retirement Social Security Laws. The Board monitors and measures market and various other risk factors associated with investments. The performance of investment advisors is reviewed frequently to insure that their activities in securities are consistent with the best practices in the industry.
Investment Policy
Investment Policy is approved by the Board of Trustees. The New York City Comptroller is the Treasurer and Chief Custodian and Investment Advisor to the Board. The primary objective of the Board is to provide retirement and other benefits for its members. The Board realizes that increasing investment returns will strengthen the fund and significantly enhance benefits enjoyed by members. Increased returns will further assure the safety of assets held in trust for pension benefits. The investment policy adopted by the Board of Trustees is the one that minimizes credit and market risks, while maintaining a competitive yield on the funds’ portfolio. All returns are time weighted rates of return. For periods greater than one year, returns are analyzed.
Investment Philosophy
The investment philosophy of the Board is influenced by key factors that affect investment and strategy, i.e. Risk Tolerance, Returns, Diversification and Liquidity.
1-Risk Tolerance The Board shall always act to assure that the level of investment risk in the
portfolio will be prudent and not exceed levels that may jeopardize the primary objective.
2-ReturnsThe Board believes that over the long term there is a relationship between the
level of investment risk taken and the rate of investment return realized. In order to enhance the level of returns the assumption of a moderate level of risks is therefore reasonable and justified.
53
3-Diversification
The Board seeks diversification through investing in a broad array of instruments in order to reduce overall portfolio risks.
Liquidity Requirements
The system anticipates positive cash flow over the near and intermediate term. Liquidity requirements for payment of current and intermediate benefits will therefore not be an issue for the future.
Investment Objectives
The Board has adopted the following general investment objectives in order to enhance returns, providing greater benefits and ensuring the safety of assets held in trust for benefits.
1. In recognition that obligations of the fund will increase as a result of inflation, the Board seeks to maximize the total return on assets held in trust for pension benefits, while operating within the bounds of regulatory restrictions and prudent parameters of risk.
2. The board also aims to protect the system from depreciation of assets during adverse market conditions, and to attain a level of return competitive not only with similar funds but also with the wider market. These results are attained through broad diversification, careful review of risks and emphasis on Long Term results.
3. The Board of Trustees, where possible and not in conflict with other provisions was interested in increased economic activity in local communities. The Comptroller’s Office has made substantial efforts to broaden the Pension Fund’s activity in economically targeted investments in the City of New York. This will promote growth in communities, while increasing returns. All existing targeted investments are guaranteed by government agencies and earn a rate of return commensurate with risk.
Asset Allocation
The Board’s investment policy is implemented using a strategic allocation of assets that meet their objectives, while working within the confines of the Administrative Code of New York City and the State Retirement and Social Security Laws. The code authorizes the investment of Plan Assets, except equities, subject to the terms, conditions, limitations and restrictions imposed by law for investment by Savings Banks. The code imposes specific criteria for plan investments. Fixed income investments may be made mostly in U.S. Government securities or agencies backed by the U.S Government, companies rated BBB or better by the Standard and Poor’s Corporation or Moody’sInvestors Services or in companies on the Legal Investments lists published by the New York Banking Department.
54
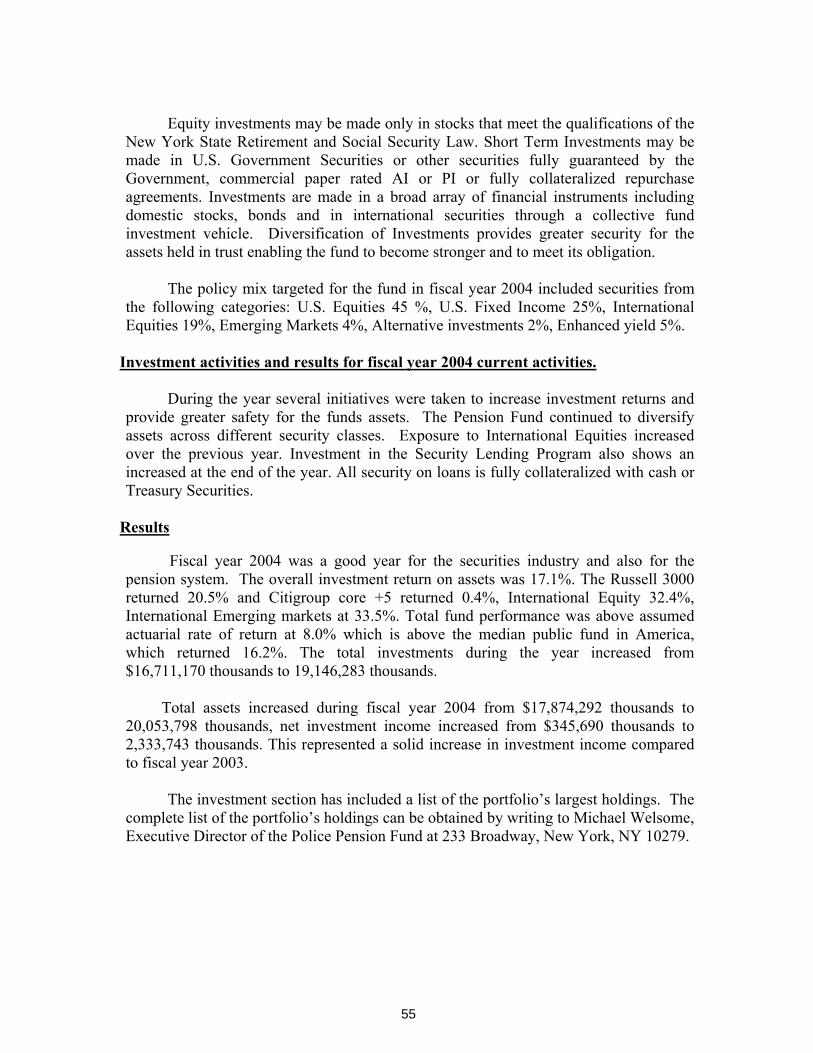
Equity investments may be made only in stocks that meet the qualifications of the New York State Retirement and Social Security Law. Short Term Investments may be made in U.S. Government Securities or other securities fully guaranteed by the Government, commercial paper rated AI or PI or fully collateralized repurchase agreements. Investments are made in a broad array of financial instruments including domestic stocks, bonds and in international securities through a collective fund investment vehicle. Diversification of Investments provides greater security for the assets held in trust enabling the fund to become stronger and to meet its obligation.
The policy mix targeted for the fund in fiscal year 2004 included securities from the following categories: U.S. Equities 45 %, U.S. Fixed Income 25%, International Equities 19%, Emerging Markets 4%, Alternative investments 2%, Enhanced yield 5%.
Investment activities and results for fiscal year 2004 current activities.
During the year several initiatives were taken to increase investment returns and provide greater safety for the funds assets. The Pension Fund continued to diversify assets across different security classes. Exposure to International Equities increasedover the previous year. Investment in the Security Lending Program also shows an increased at the end of the year. All security on loans is fully collateralized with cash or Treasury Securities.
Results
Fiscal year 2004 was a good year for the securities industry and also for the pension system. The overall investment return on assets was 17.1%. The Russell 3000 returned 20.5% and Citigroup core +5 returned 0.4%, International Equity 32.4%, International Emerging markets at 33.5%. Total fund performance was above assumed actuarial rate of return at 8.0% which is above the median public fund in America, which returned 16.2%. The total investments during the year increased from $16,711,170 thousands to 19,146,283 thousands.
Total assets increased during fiscal year 2004 from $17,874,292 thousands to 20,053,798 thousands, net investment income increased from $345,690 thousands to 2,333,743 thousands. This represented a solid increase in investment income compared to fiscal year 2003.
The investment section has included a list of the portfolio’s largest holdings. The complete list of the portfolio’s holdings can be obtained by writing to Michael Welsome, Executive Director of the Police Pension Fund at 233 Broadway, New York, NY 10279.
55

NEW
YO
RK
CIT
YPO
LIC
E P
ENSI
ON
FU
ND
YEA
R E
ND
ED J
UN
E 30
, 200
4C
ON
SOLI
DA
TED
PER
FOR
MA
NC
E R
EPO
RT
Thro
ugh
Jun
e 30
, 200
43
Mos
YTD
1 Yr
3 Yr
s5
Yrs
10 Y
rs15
Yrs
Ass
ets
%A
pr-0
4Ja
n-04
Jul-0
4Ju
l-01
Jul-9
9Ju
l-94
Jul-8
9($
MM
)To
tal
Jun-
04Ju
n-04
Jun-
04Ju
n-04
Jun-
04Ju
n-04
Jun-
04
EQU
ITY
MA
NA
GEM
ENT
SMA
LL C
AP
81.4
6
0.
52
M
azam
a C
apita
l-7
.72
-1.3
731
.93
****
****
****
****
81.4
6
0.
52
To
tal S
mal
l Cap
Gro
wth
-7.7
2-1
.37
31.9
3**
****
****
****
**R
usse
ll 20
00 G
row
th0.
10
5.69
31
.56
****
****
****
****
Sm
all C
ap G
row
th M
edia
n0.
26
2.89
23
.89
****
****
****
****
110.
12
0.70
DA
LTO
N G
REI
NER
5.75
11
.64
41.0
2**
****
****
****
**11
0.12
0.
70
To
tal S
mal
l Cap
Val
ue5.
75
11.6
4
41
.02
****
****
****
****
Rus
sell
2000
Val
ue0.
85
7.83
35
.18
****
****
****
****
Sm
all C
ap V
alue
Med
ian
1.26
7.
99
34.1
8**
****
****
****
**
55.1
6
0.
35
D
AR
UM
A4.
77
12.9
0
36
.56
****
****
****
****
39..6
10.
25
D
euts
che
Ass
et M
gmt
0.58
5.
01
24.6
9**
****
****
****
**94
.78
0.60
Tota
l Sm
all C
ap C
ore
2.75
9.
02
30.6
7**
****
****
****
**R
usse
ll 20
00
0.47
6.
77
33.3
7**
****
****
****
**S
mal
l Cap
Cor
e M
edia
n0.
50
6.69
31
.60
****
****
****
****
286.
36
1.83
Tota
l Sm
all C
ap0.
67
6.89
35
.35
****
****
****
****
Rus
sell
2000
0.
47
6.77
33
.37
****
****
****
****
SMA
LL M
ID/C
AP
50.1
1
0.
32
J
& W
Sel
igm
an1.
17
6.91
26
.64
****
****
****
****
50.3
0
0.
32
M
acka
y S
hiel
ds0.
46
4.94
27
.01
****
****
****
****
100.
41
0.64
Tota
l Sm
all/
Mid
Cap
0.82
5.
95
26.8
1**
****
****
****
**R
usse
ll 25
00 G
row
th0.
14
5.65
30
.12
****
****
****
****
56

NEW
YO
RK
CIT
YPO
LIC
E P
ENSI
ON
FU
ND
YEA
R E
ND
ED J
UN
E 30
, 200
4C
ON
SOLI
DA
TED
PER
FOR
MA
NC
E R
EPO
RT
Thro
ugh
Jun
e 30
, 200
43
Mos
YTD
1 Yr
3 Yr
s5
Yrs
10 Y
rs15
Yrs
Ass
ets
%A
pr-0
4Ja
n-04
Jul-0
4Ju
l-01
Jul-9
9Ju
l-94
Jul-8
9($
MM
)To
tal
Jun-
04Ju
n-04
Jun-
04Ju
n-04
Jun-
04Ju
n-04
Jun-
04
MID
CA
P60
.48
0.39
Fors
tman
n Le
ff4.
74
1.96
21
.85
****
****
****
****
55.8
7
0.
36
In
vesc
o1.
22
4.39
20
.98
****
****
****
****
116.
35
0.74
Tota
l Mid
Cap
Gro
wth
3.02
3.
11
21.4
2**
****
****
****
**R
usse
ll M
id C
ap G
row
th1.
06
5.94
27
.33
****
****
****
****
Mid
cap
Gro
wth
Med
ian
2.61
5.
84
25.7
6**
****
****
****
**
102.
86
0.66
AR
IEL
CA
PIT
AL
MA
NA
GE
ME
NT
-0.1
63.
90
21.1
3**
****
****
****
**11
6.43
0.
74
Lo
rd A
bbet
t2.
77
10.0
5
31
.04
****
****
****
****
219.
29
1.40
Tota
l Mid
Cap
Val
ue1.
40
7.11
26
.26
****
****
****
****
Rus
sell
Mid
Cap
Val
ue1.
73
7.16
30
.81
****
****
****
****
Mid
Cap
Val
ue M
edia
n2.
14
7.67
31
.00
****
****
****
****
112.
580.
72C
hica
go E
quity
1.07
8.47
30.3
0**
****
****
****
**11
2.58
0.72
Tota
l Mid
Cap
Cor
e1.
078.
4730
.30
****
****
****
****
S&
P M
id C
ap In
dex
400
0.97
6.09
28.0
0**
****
****
****
**M
id C
ap C
ore
Med
ian
1.32
4.70
22.7
0**
****
****
****
**
448.
222.
86To
tal M
id C
ap
1.72
6.44
25.9
5**
****
****
****
**R
usse
ll M
id C
ap1.
456.
6729
.40
****
****
****
****
LAR
GE
CA
P43
2.68
2.76
Fide
lity
1.72
2.82
15.5
0-3
.31
-3.3
111
.22
****
280.
741.
82Lo
omis
-Gro
wth
3.10
6.15
24.0
71.
49-2
.35
****
****
718.
394.
58To
tal L
arge
Cap
Gro
wth
2.27
4.12
18.4
8-2
.96
-3.9
810
.18
****
Rus
sell
1000
Gro
wth
1.94
2.74
17.8
9-3
.74
-6.4
810
.11
****
Larg
e C
ap G
row
th M
edia
n1.
662.
8915
.95
-2.7
5-2
.44
12.2
4**
**
57

NEW
YO
RK
CIT
YPO
LIC
E P
ENSI
ON
FU
ND
YEA
R E
ND
ED J
UN
E 30
, 200
4C
ON
SOLI
DA
TED
PER
FOR
MA
NC
E R
EPO
RT
Thro
ugh
Jun
e 30
, 200
43
Mos
YTD
1 Yr
3 Yr
s5
Yrs
10 Y
rs15
Yrs
Ass
ets
%A
pr-0
4Ja
n-04
Jul-0
4Ju
l-01
Jul-9
9Ju
l-94
Jul-8
9($
MM
)To
tal
Jun-
04Ju
n-04
Jun-
04Ju
n-04
Jun-
04Ju
n-04
Jun-
04
243.
95
1.56
AR
ON
SO
N J
OH
NS
ON
0.23
5.94
24.0
9**
****
****
****
**23
9.90
1.
53
Iri
dian
Ass
et0.
557.
7428
.50
****
****
****
****
362.
50
2.31
Lord
Abb
ett
1.53
4.58
23.1
1**
****
****
****
**84
6.35
5.
40
To
tal L
arge
Cap
Val
ue0.
885.
8924
.95
****
****
****
****
Rus
sell
1000
Val
ue0.
883.
9321
.13
****
****
****
****
Larg
e C
ap V
alue
Med
ian
1.86
4.36
22.5
7**
****
****
****
**
1,56
4.74
9.97
Tota
l Lar
ge C
ap1.
515.
0821
.94
****
****
****
****
Rus
sell
1000
1.40
3.32
19.4
7**
****
****
****
**
RU
SSEL
L 30
002,
624.
57#
16.7
3M
erril
l Qua
nt R
usse
ll 30
001.
303.
6520
.38
0.21
****
****
****
2,81
1.68
#17
.92
Nor
ther
n Tr
ust R
usse
ll 30
001.
403.
6320
.40
0.28
-0.9
511
.70
11.2
25,
436.
25#
34.6
5To
tal R
usse
ll 30
001.
353.
6420
.39
0.25
-0.9
211
.72
11.2
3 R
usse
ll 30
001.
333.
5920
.45
0.14
-1.0
811
.66
11.2
4
2,39
9.73
15.3
0To
tal A
ctiv
e D
omes
tic E
quity
1.42
5.60
24.4
2-1
.36
-5.3
68.
618.
825,
436.
26
34
.65
Tota
l Pas
sive
-Dom
Equ
ity1.
353.
6420
.36
0.64
0.00
12.2
411
.57
7,83
5.99
49.9
5To
tal D
om E
quity
1.37
4.24
21.6
20.
56-0
.84
11.5
711
.04
Not
e: L
arge
Cap
com
posi
te e
ffect
ive
with
pro
gram
ince
ptio
n of
3/3
1/03
58

NEW
YO
RK
CIT
YPO
LIC
E P
ENSI
ON
FU
ND
YEA
R E
ND
ED J
UN
E 30
, 200
4C
ON
SOLI
DA
TED
PER
FOR
MA
NC
E R
EPO
RT
Thro
ugh
Jun
e 30
, 200
43
Mos
YTD
1 Yr
3 Yr
s5
Yrs
10 Y
rs15
Yrs
Ass
ets
%A
pr-0
4Ja
n-04
Jul-0
4Ju
l-01
Jul-9
9Ju
l-94
Jul-8
9($
MM
)To
tal
Jun-
04Ju
n-04
Jun-
04Ju
n-04
Jun-
04Ju
n-04
Jun-
04
INTE
RN
ATI
ON
AL
EQU
ITIE
SEA
FE M
AR
KET
S
541.
27
3.45
Ban
k of
Irel
and
-0.0
72.
6325
.03
0.97
0.44
7.46
****
612.
75
3.91
Bar
clay
s G
loba
l0.
414.
7932
.40
4.55
0.55
4.46
****
553.
86
3.53
Cap
ital G
uard
ian
-1.6
42.
8230
.78
3.62
2.23
****
****
261.
72
1.67
GE
Inve
stm
ents
0.11
2.08
28.7
31.
770.
81**
****
**54
3.70
3.
47D
elaw
are
1.97
4.33
28.9
79.
58**
****
****
**35
1.00
2.
24O
echs
le-0
.62
2.95
24.6
4-0
.56
****
****
****
0.57
0P
utna
m**
****
****
****
****
****
****
**32
1.52
2.
05R
owe
Pric
e-Fl
emin
g-1
.87
2.22
24.7
61.
90-0
.59
****
****
0.22
0B
GI T
rans
ition
(Inv
ista
)**
****
****
****
****
****
****
**2,
573.
85
16
.41
Tota
l Act
ive
Dev
elop
ed M
arke
ts-0
.30
2.92
27.5
42.
360.
876.
52**
**61
2.75
3.
91To
tal P
assi
ve D
evel
oped
Mar
kets
0.41
4.79
32.4
04.
140.
284.
37**
**3,
186.
60
20
.31
Tota
l EA
FE M
arke
ts-0
.16
3.22
28.3
92.
720.
635.
75**
**M
SC
I EA
FE (N
et D
ivid
end)
0.22
4.56
32.3
73.
87..0
64.
05**
**In
tern
atio
nal E
quity
Med
ian
-0.3
83.
5730
.83
5.45
2.96
6.95
****
EMER
GIN
G M
AR
KET
S95
.77
0.61
Gen
esis
Ass
et M
anag
ers
-7.0
41.
5640
.08
17.9
58.
21**
****
**10
3.78
0.
66P
icte
t Int
erna
tiona
l-9
.86
-2.1
338
.83
18.9
****
****
****
199.
55
1.27
Tota
l Em
ergi
ng M
arke
ts-8
.52
-0.3
939
.42
18.4
37.
4**
****
**M
SC
I Em
ergi
ng M
arke
t Fre
e-9
.57
-0.7
833
.51
13.1
3.28
1.21
****
Em
ergi
ng M
arke
t Med
ian
-9.7
2-1
.43
34.3
813
.96
5.33
4.38
****
3,38
6.15
21.5
9To
tal I
nter
natio
nal E
quity
-0.7
03.
0029
.00
3.43
0.98
5.76
****
59

NEW
YO
RK
CIT
YPO
LIC
E P
ENSI
ON
FU
ND
YEA
R E
ND
ED J
UN
E 30
, 200
4C
ON
SOLI
DA
TED
PER
FOR
MA
NC
E R
EPO
RT
Thro
ugh
Jun
e 30
, 200
43
Mos
YTD
1 Yr
3 Yr
s5
Yrs
10 Y
rs15
Yrs
Ass
ets
%A
pr-0
4Ja
n-04
Jul-0
4Ju
l-01
Jul-9
9Ju
l-94
Jul-8
9($
MM
)To
tal
Jun-
04Ju
n-04
Jun-
04Ju
n-04
Jun-
04Ju
n-04
Jun-
04
PRIV
ATE
EQ
UIT
Y IN
VEST
MEN
TS
13.2
7
0.
08A
ppol
o In
vest
men
ts F
und
****
****
****
****
****
****
****
1,17
5.00
0.07
AR
ES
Cor
p.**
****
****
****
****
****
****
**17
.54
0.11
Bla
ckst
one
iv**
****
****
****
****
****
****
**4.
98
0.
03C
anyo
n Jo
hnso
n**
****
****
****
****
****
****
**19
.94
0.13
Car
lyle
Par
tner
s III
****
****
****
****
****
****
****
1.34
0.01
City
Inve
stm
ent F
und
****
****
****
****
****
****
****
7.20
0.05
Col
ler
****
****
****
****
****
****
****
13.9
5
0.
09C
VC
Eur
opea
n E
quity
Par
tner
s**
****
****
****
****
****
****
**32
.21
0.21
Cyp
ress
Mer
chan
t Ban
k**
****
****
****
****
****
****
**26
.54
0.17
FDG
Cap
ital
****
****
****
****
****
****
****
0.59
0Fr
eem
an S
pogl
y LP
****
****
****
****
****
****
****
6.97
0.04
Linc
olns
hire
Equ
ity F
und
****
****
****
****
****
****
****
9.07
0.06
New
Mou
ntai
n P
artn
ers
6.34
0.04
OC
M R
e O
PP
-FD
8.78
0.06
Pris
m V
entu
re P
artn
ers
IV**
****
****
****
****
****
****
**11
.77
0.08
SC
P P
riv E
quity
Par
tner
s**
****
****
****
****
****
****
**3.
44
0.
02S
oler
a P
artn
ers
****
****
****
****
****
****
****
12.6
0
0.
08V
S&
A F
und
****
****
****
****
****
****
****
210.
52
1.34
Tota
l Priv
ate
Equi
ty**
****
****
****
****
****
****
**
60
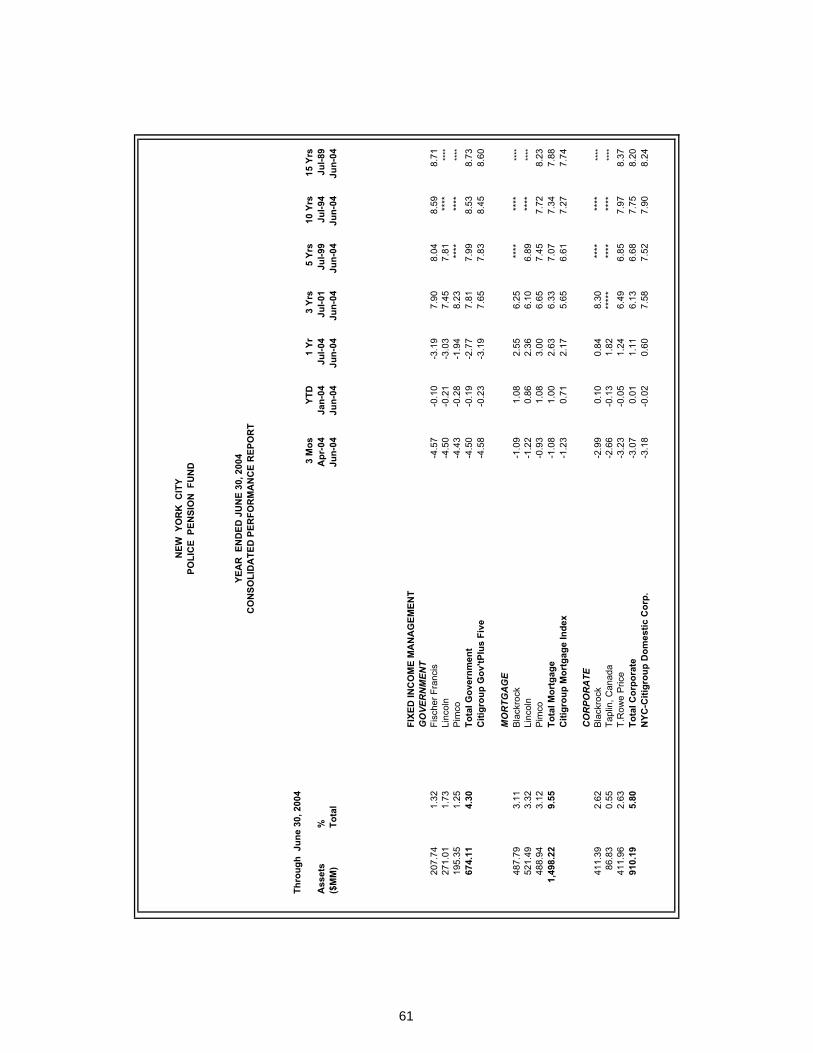
NEW
YO
RK
CIT
YPO
LIC
E P
ENSI
ON
FU
ND
YEA
R E
ND
ED J
UN
E 30
, 200
4C
ON
SOLI
DA
TED
PER
FOR
MA
NC
E R
EPO
RT
Thro
ugh
Jun
e 30
, 200
43
Mos
YTD
1 Yr
3 Yr
s5
Yrs
10 Y
rs15
Yrs
Ass
ets
%A
pr-0
4Ja
n-04
Jul-0
4Ju
l-01
Jul-9
9Ju
l-94
Jul-8
9($
MM
)To
tal
Jun-
04Ju
n-04
Jun-
04Ju
n-04
Jun-
04Ju
n-04
Jun-
04
FIXE
D IN
CO
ME
MA
NA
GEM
ENT
GO
VER
NM
ENT
207.
74
1.32
Fisc
her F
ranc
is-4
.57
-0.1
0-3
.19
7.90
8.04
8.59
8.71
271.
01
1.73
Linc
oln
-4.5
0-0
.21
-3.0
37.
457.
81**
****
**19
5.35
1.
25P
imco
-4.4
3-0
.28
-1.9
48.
23**
****
****
**67
4.11
4.
30To
tal G
over
nmen
t-4
.50
-0.1
9-2
.77
7.81
7.99
8.53
8.73
Citi
grou
p G
ov'tP
lus
Five
-4.5
8-0
.23
-3.1
97.
657.
838.
458.
60
MO
RTG
AG
E48
7.79
3.
11B
lack
rock
-1.0
91.
082.
556.
25**
****
****
**52
1.49
3.
32Li
ncol
n-1
.22
0.86
2.36
6.10
6.89
****
****
488.
94
3.12
Pim
co-0
.93
1.08
3.00
6.65
7.45
7.72
8.23
1,49
8.22
9.55
Tota
l Mor
tgag
e-1
.08
1.00
2.63
6.33
7.07
7.34
7.88
Citi
grou
p M
ortg
age
Inde
x-1
.23
0.71
2.17
5.65
6.61
7.27
7.74
CO
RPO
RA
TE41
1.39
2.
62B
lack
rock
-2.9
90.
100.
848.
30**
****
****
**86
.83
0.55
Tapl
in, C
anad
a-2
.66
-0.1
31.
82**
***
****
****
****
411.
96
2.63
T.R
owe
Pric
e-3
.23
-0.0
51.
246.
496.
857.
978.
3791
0.19
5.
80To
tal C
orpo
rate
-3.0
70.
011.
116.
136.
687.
758.
20N
YC-C
itigr
oup
Dom
estic
Cor
p.-3
.18
-0.0
20.
607.
587.
527.
908.
24
61
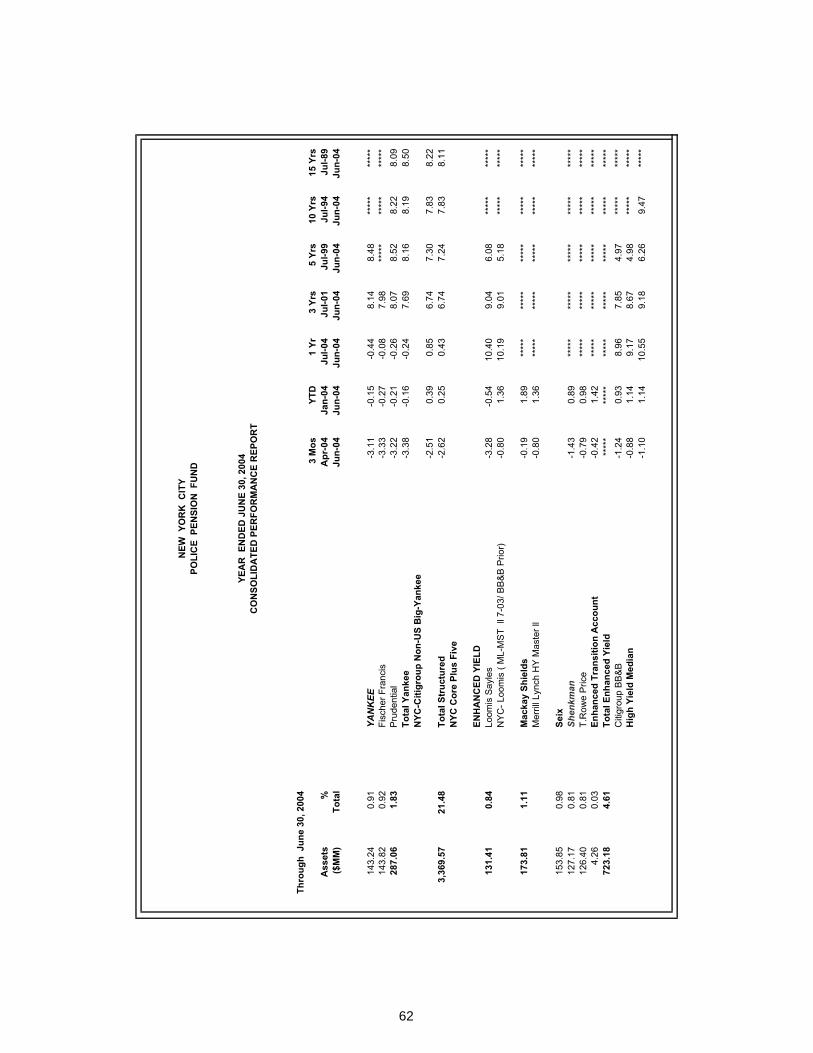
NEW
YO
RK
CIT
YPO
LIC
E P
ENSI
ON
FU
ND
YEA
R E
ND
ED J
UN
E 30
, 200
4C
ON
SOLI
DA
TED
PER
FOR
MA
NC
E R
EPO
RT
Thro
ugh
Jun
e 30
, 200
43
Mos
YTD
1 Yr
3 Yr
s5
Yrs
10 Y
rs15
Yrs
Ass
ets
%A
pr-0
4Ja
n-04
Jul-0
4Ju
l-01
Jul-9
9Ju
l-94
Jul-8
9($
MM
)To
tal
Jun-
04Ju
n-04
Jun-
04Ju
n-04
Jun-
04Ju
n-04
Jun-
04
143.
24
0.91
YAN
KEE
-3.1
1-0
.15
-0.4
48.
148.
48**
***
****
*14
3.82
0.
92Fi
sche
r Fra
ncis
-3.3
3-0
.27
-0.0
87.
98**
***
****
***
***
287.
06
1.83
Pru
dent
ial
-3.2
2-0
.21
-0.2
68.
078.
528.
228.
09To
tal Y
anke
e-3
.38
-0.1
6-0
.24
7.69
8.16
8.19
8.50
NYC
-Citi
grou
p N
on-U
S B
ig-Y
anke
e-2
.51
0.39
0.85
6.74
7.30
7.83
8.22
3,36
9.57
21.4
8To
tal S
truc
ture
d-2
.62
0.25
0.43
6.74
7.24
7.83
8.11
NYC
Cor
e Pl
us F
ive
ENH
AN
CED
YIE
LD13
1.41
0.
84Lo
omis
Say
les
-3.2
8-0
.54
10.4
09.
046.
08**
***
****
*N
YC
- Loo
mis
( M
L-M
ST
ll 7
-03/
BB
&B
Prio
r)-0
.80
1.36
10.1
99.
015.
18**
***
****
*
173.
81
1.11
Mac
kay
Shie
lds
-0.1
91.
89**
***
****
***
***
****
***
***
Mer
rill L
ynch
HY
Mas
ter l
l-0
.80
1.36
****
***
***
****
***
***
****
*
153.
85
0.98
Seix
127.
17
0.81
Shen
kman
-1.4
30.
89**
***
****
***
***
****
***
***
126.
40
0.81
T.R
owe
Pric
e-0
.79
0.98
****
***
***
****
***
***
****
*4.
26
0.
03En
hanc
ed T
rans
ition
Acc
ount
-0.4
21.
42**
***
****
***
***
****
***
***
723.
18
4.61
Tota
l Enh
ance
d Yi
eld
****
***
***
****
***
***
****
***
***
****
*C
itigr
oup
BB
&B
-1
.24
0.93
8.96
7.85
4.97
****
***
***
Hig
h Yi
eld
Med
ian
-0.8
81.
149.
178.
674.
98**
***
****
*-1
.10
1.14
10.5
59.
186.
269.
47**
***
62
NEW
YO
RK
CIT
YPO
LIC
E P
ENSI
ON
FU
ND
YEA
R E
ND
ED J
UN
E 30
, 200
4C
ON
SOLI
DA
TED
PER
FOR
MA
NC
E R
EPO
RT
Thro
ugh
Jun
e 30
, 200
43
Mos
YTD
1 Yr
3 Yr
s5
Yrs
10 Y
rs15
Yrs
Ass
ets
%A
pr-0
4Ja
n-04
Jul-0
4Ju
l-01
Jul-9
9Ju
l-94
Jul-8
9($
MM
)To
tal
Jun-
04Ju
n-04
Jun-
04Ju
n-04
Jun-
04Ju
n-04
Jun-
04
TAR
GET
ED20
.97
0.13
AF-
LCIO
Hou
sing
Inv.
Tru
st-2
.50
0.19
-0.0
3**
***
****
***
***
****
*46
.57
0.30
Targ
eted
Inve
stm
ent
.-3.8
0-1
.81
1.93
5.30
5.22
8.13
9.47
67.5
4
0.
43To
tal
Targ
eted
-3
.40
-1.2
01.
405.
325.
238.
149.
47Le
hman
U.S
Agg
rega
te B
ond
Inde
x-2
.44
0.15
0.33
6.36
6.95
7.39
7.75
4,25
1.00
27.1
0To
tal D
om F
ixed
-2
.24
0.44
2.19
6.74
6.79
7.64
8.07
3.57
0.02
Sec
uriti
es L
endi
n g**
***
****
***
***
****
***
***
****
***
***
-
90.7
0
0.
58S
hort
Term
Inve
stm
ents
0.22
0.51
1.06
****
***
***
****
***
***
0.02
0.00
BN
Y- C
B**
***
****
***
***
****
***
***
****
***
***
15,6
87.2
5
100.
00TO
TAL
PO
LIC
E0.
013.
0317
.04
3.56
2.18
9.88
9.77
63

NY
C P
OL
ICE
PE
NSI
ON
FU
ND
ASS
ET
AL
LO
CA
TIO
NJu
ne 3
0, 1
994
-Jun
e 30
, 200
4
0102030405060
1994
1995
1996
1997
1998
1999
2000
2001
2002
2003
2004
% of Portfolio
US
Equi
tyU
S Fi
xed
Inco
me
Non
-US
Equi
tyN
on-U
S Fi
xed
Inco
me
64

Asse
t Allo
catio
n - N
YCPP
F
20%
1%23%
5%1%
Dom
Equ
ityEA
FE M
kts
Emer
ging
Mkt
sDo
m F
ixed
Enha
nced
Yiel
dPv
t Equ
ity
65

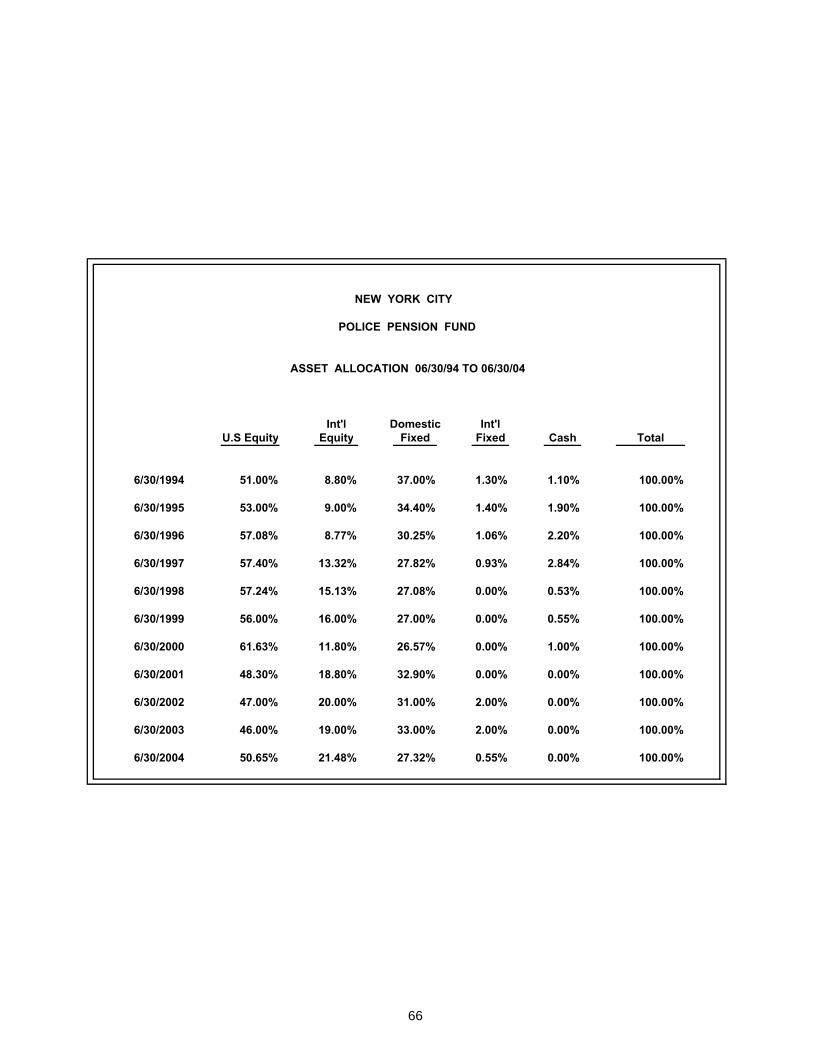
NEW YORK CITY
POLICE PENSION FUND
ASSET ALLOCATION 06/30/94 TO 06/30/04
Int'l Domestic Int'lU.S Equity Equity Fixed Fixed Cash Total
6/30/1994 51.00% 8.80% 37.00% 1.30% 1.10% 100.00%
6/30/1995 53.00% 9.00% 34.40% 1.40% 1.90% 100.00%
6/30/1996 57.08% 8.77% 30.25% 1.06% 2.20% 100.00%
6/30/1997 57.40% 13.32% 27.82% 0.93% 2.84% 100.00%
6/30/1998 57.24% 15.13% 27.08% 0.00% 0.53% 100.00%
6/30/1999 56.00% 16.00% 27.00% 0.00% 0.55% 100.00%
6/30/2000 61.63% 11.80% 26.57% 0.00% 1.00% 100.00%
6/30/2001 48.30% 18.80% 32.90% 0.00% 0.00% 100.00%
6/30/2002 47.00% 20.00% 31.00% 2.00% 0.00% 100.00%
6/30/2003 46.00% 19.00% 33.00% 2.00% 0.00% 100.00%
6/30/2004 50.65% 21.48% 27.32% 0.55% 0.00% 100.00%
66

NEW YORK CITY
POLICE PENSION FUND
FIXED INCOME HOLDINGS
YEAR ENDED JUNE 30, 2004
DESCRIPTION SHARES MKT VALUE
U S TREASURY BONDS 236,271,000.00 $300,898,704.70NYC CUSTOM STIF 152,546,028.72 152,546,028.72FNMA TBA 30YR 5.00% JUL 112,355,000.00 108,492,796.88UNITED STATES TREAS NTS 101,712,000.00 102,528,367.53FNMA TBA 30YR 6.00% JUL 74,115,000.00 75,643,621.88FEDERAL HOME LN MTG CORP 69,395,936.45 72,012,657.89FHLMC TBA 30YR GOLD SFM 05.50% JUL 70,610,000.00 70,279,015.63FEDERAL NATL MTGE ASSN DISCOUNT NT 61,400,000.00 61,249,023.61U S TREASURY BILLS 47,600,000.00 47,559,430.87FEDERAL HOME LOAN BANK DISCOUNT 47,100,000.00 47,083,400.39FHLMC TBA 30YR GOLD SFM 05.00% JUL 44,085,000.00 42,542,025.00GNMA I TBA 30YR SFM 05.50% JUL 41,375,000.00 41,297,421.88FEDERAL NATL MTG ASSN 39,679,000.00 39,229,795.63FNMA TBA 15YR SFM 05.00% AUG 39,300,000.00 39,201,750.00FNMA TBA 15YR SFM 05.00% JUL 37,145,000.00 37,179,823.44FEDERAL NAT'L MTGE ASSN POOL # 725232 37,976,227.81 36,804,661.18FNMA TBA 15YR SFM 05.50% JUL 27,905,000.00 28,532,862.50FEDERAL HOME LN BKS 23,620,000.00 23,165,412.50FEDERAL HOME LN MTG CORP DISC NTS 22,100,000.00 22,001,401.45AFL-CIO HOUSING INV TRUST 19,012.22 20,967,249.90FEDERAL NATL MTG ASSN REMIC TR 28,352,888.58 19,814,970.04FHLMC TBA 15YR GOLD SFM 05.00% JUL 19,000,000.00 19,005,937.50FHLMC GOLD TBA 30 YR TBA 6.00% 18,595,000.00 18,984,332.81J P MORGAN CHASE & CO 17,930,000.00 18,647,865.50FEDERAL HOME LN MTG CORP REMIC TR 16,763,781.74 16,971,645.25FNMA TBA 30YR 6.50% 16,050,000.00 16,707,046.88CITIGROUP INC 16,525,000.00 16,602,254.05U S TREASURY NOTES 15,190,000.00 16,191,844.39FEDERAL NAT'L MTGE ASSN POOL # 757460 15,737,620.29 15,707,718.81RESIDENTIAL ACCREDIT LNS INC 16,839,535.18 15,424,637.82GNMA TBA 30 YR 6.00% JUL 15,030,000.00 15,386,962.50FED'L HOME LOAN MTGE CORP GRP # B10422 15,094,246.43 15,143,000.84FEDERAL NAT'L MTGE ASSN POOL # 255077 14,922,702.44 14,975,827.26CITIBANK CR CARD ISSUANCE TR 13,640,000.00 13,727,313.40MORGAN STANLEY 14,065,000.00 13,474,140.60FNMA TBA 30YR SFM 04.50% JUL 14,405,000.00 $13,468,675.00
67

NEW YORK CITY
POLICE PENSION FUND
FIXED INCOME HOLDINGS
YEAR ENDED JUNE 30, 2004
DESCRIPTION SHARES MKT VALUE
FNMA TBA 15YR SFM 04.00% JUL 14,060,000.00 $13,387,756.25FEDERAL NATL MTG ASSN GTD 20,772,938.94 13,374,119.69BANC AMER ALTERNATIVE LN TR 13,160,095.66 13,333,959.27UNITED MEXICAN STS M/T/N 12,718,000.00 13,011,536.50U S TREASURY BOND 11,855,000.00 12,992,339.06U S TREASURY BD STRIPPED 25,400,000.00 12,921,488.00FEDERAL NAT'L MTGE ASSN POOL # 555272 12,499,999.72 12,783,749.71SLM STUDENT LN TR V/R 12,254,863.45 12,297,792.14FORD MTR CR CO 11,505,000.00 12,085,751.85FED'L HOME LOAN MTGE CORP GRP # C01622 12,449,679.26 12,056,269.39CHASE CR CARD OWNER TR 12,020,000.00 12,037,123.69FEDERAL NAT'L MTGE ASSN POOL # 753794 12,015,340.60 11,992,511.45FHLMC TBA 30YR GOLD SFM 06.50% JUL 11,500,000.00 11,981,562.50MBNA CR CARD MASTER NT TR 11,730,000.00 11,886,508.41SPRINT CAP CORP 10,940,000.00 11,437,914.70FEDERAL NAT'L MTGE ASSN POOL # 725205 11,774,554.14 11,411,309.15GOV'T NAT'L MTGE ASSN II POOL # 3488 11,255,734.53 11,252,582.93FEDERAL NAT'L MTGE ASSN POOL # 750377 11,025,302.20 11,064,552.28CAPITAL AUTO RECEIVABLES ASSET 10,746,260.72 10,748,067.41FEDERAL NAT'L MTGE ASSN 22,550,000.00 10,624,432.50AMERICAN EXPRESS MASTER TR 10,465,000.00 10,468,442.43GNMA I TBA 30YR SFM 05.00% JUL 10,760,000.00 10,423,750.00FEDERAL HOME LN BKS DEB 11,050,000.00 10,377,568.13U S TREAS NTS 10,400,000.00 10,302,500.00CWABS INC 9,897,823.89 9,952,610.11FEDERAL NAT'L MTGE ASSN POOL # 357457 9,836,040.22 9,817,351.74FEDERAL FARM CR BKS CONS 9,800,000.00 9,712,687.50KRAFT FOODS INC 9,340,000.00 9,590,057.60FEDERAL NAT'L MTGE ASSN POOL # 555549 9,503,703.15 9,537,536.34RESOLUTION FDG CORP FED BOOK 16,455,000.00 9,477,024.30FORD MOTOR CREDIT CO 9,365,000.00 9,453,031.00LEHMAN BROTHERS HLDGS INC 9,450,000.00 9,354,772.05GENERAL ELEC CAP CORP M/T/N 8,900,000.00 9,299,104.00GENERAL MTRS CORP 8,815,000.00 9,232,942.15TENNESSEE VALLEY AUTHORITY PWR 8,700,000.00 9,084,018.00GEORGIA PAC CORP 8,420,000.00 $8,951,087.50
68
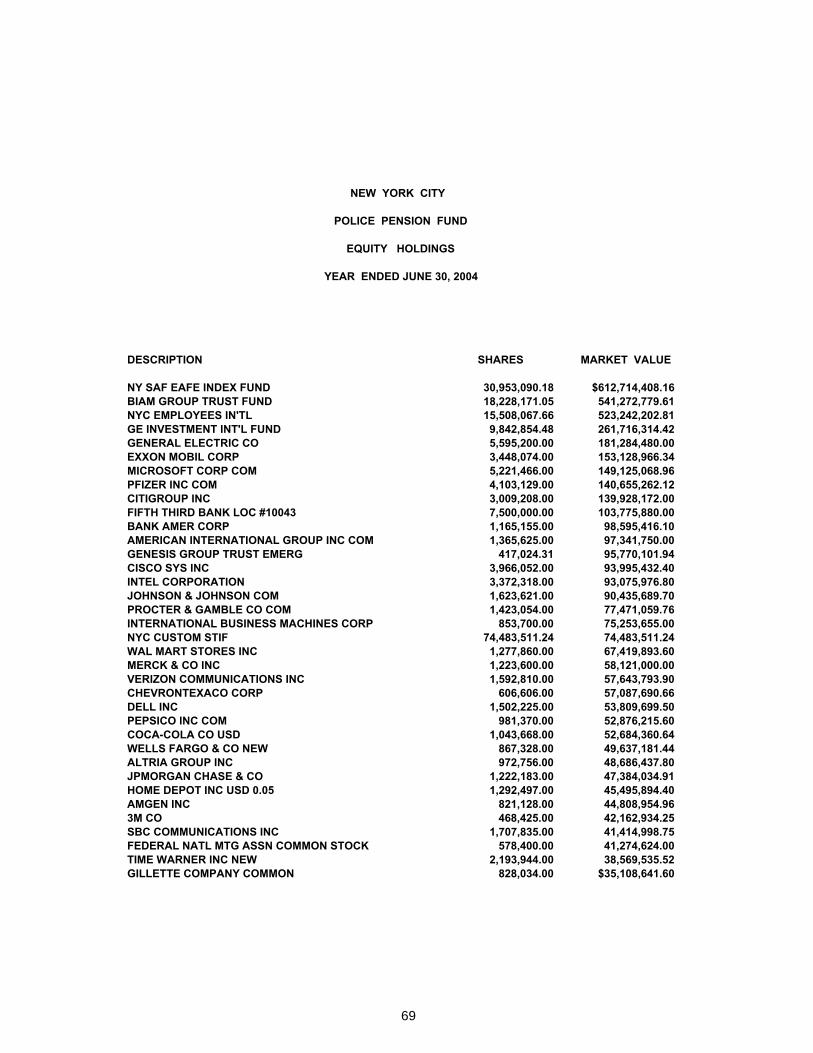
NEW YORK CITY
POLICE PENSION FUND
EQUITY HOLDINGS
YEAR ENDED JUNE 30, 2004
DESCRIPTION SHARES MARKET VALUE
NY SAF EAFE INDEX FUND 30,953,090.18 $612,714,408.16BIAM GROUP TRUST FUND 18,228,171.05 541,272,779.61NYC EMPLOYEES IN'TL 15,508,067.66 523,242,202.81GE INVESTMENT INT'L FUND 9,842,854.48 261,716,314.42GENERAL ELECTRIC CO 5,595,200.00 181,284,480.00EXXON MOBIL CORP 3,448,074.00 153,128,966.34MICROSOFT CORP COM 5,221,466.00 149,125,068.96PFIZER INC COM 4,103,129.00 140,655,262.12CITIGROUP INC 3,009,208.00 139,928,172.00FIFTH THIRD BANK LOC #10043 7,500,000.00 103,775,880.00BANK AMER CORP 1,165,155.00 98,595,416.10AMERICAN INTERNATIONAL GROUP INC COM 1,365,625.00 97,341,750.00GENESIS GROUP TRUST EMERG 417,024.31 95,770,101.94CISCO SYS INC 3,966,052.00 93,995,432.40INTEL CORPORATION 3,372,318.00 93,075,976.80JOHNSON & JOHNSON COM 1,623,621.00 90,435,689.70PROCTER & GAMBLE CO COM 1,423,054.00 77,471,059.76INTERNATIONAL BUSINESS MACHINES CORP 853,700.00 75,253,655.00NYC CUSTOM STIF 74,483,511.24 74,483,511.24WAL MART STORES INC 1,277,860.00 67,419,893.60MERCK & CO INC 1,223,600.00 58,121,000.00VERIZON COMMUNICATIONS INC 1,592,810.00 57,643,793.90CHEVRONTEXACO CORP 606,606.00 57,087,690.66DELL INC 1,502,225.00 53,809,699.50PEPSICO INC COM 981,370.00 52,876,215.60COCA-COLA CO USD 1,043,668.00 52,684,360.64WELLS FARGO & CO NEW 867,328.00 49,637,181.44ALTRIA GROUP INC 972,756.00 48,686,437.80JPMORGAN CHASE & CO 1,222,183.00 47,384,034.91HOME DEPOT INC USD 0.05 1,292,497.00 45,495,894.40AMGEN INC 821,128.00 44,808,954.963M CO 468,425.00 42,162,934.25SBC COMMUNICATIONS INC 1,707,835.00 41,414,998.75FEDERAL NATL MTG ASSN COMMON STOCK 578,400.00 41,274,624.00TIME WARNER INC NEW 2,193,944.00 38,569,535.52GILLETTE COMPANY COMMON 828,034.00 $35,108,641.60
69

NEW YORK CITY
POLICE PENSION FUND
EQUITY HOLDINGS
YEAR ENDED JUNE 30, 2004
DESCRIPTION SHARES MARKET VALUE
WACHOVIA CORP 786,746.00 $35,010,197.00US BANCORP DEL 1,267,066.00 34,920,338.96HEWLETT PACKARD COMPANY 1,641,446.00 34,634,510.60BANK ONE CORP 678,181.00 34,587,231.00ABBOTT LABORATORIES 847,200.00 34,531,872.00MOTOROLA INC COM 1,874,293.00 34,205,847.25DISNEY (WALT) COMPANY . 1,319,625.00 33,637,241.25MBNA CORP 1,299,212.00 33,506,677.48QUALCOMM INC 456,000.00 33,278,880.00ELI LILLY & CO COM 465,424.00 32,537,791.84UNITED HEALTH GROUP INC 518,597.00 32,282,663.25CYPRESS MERCHANT BANKING PARTNERS II,LP 1 32,209,674.00WYETH 888,600.00 32,131,776.00MERRILL LYNCH & CO INC 589,700.00 31,832,006.00EBAY INC 340,420.00 31,301,619.00AMERICAN EXPRESS COMPANY 600,346.00 30,845,777.48MEDTRONIC INC 629,396.00 30,664,173.12CG PUBLIC INT NON _US 1,196,627.95 30,621,709.11YAHOO INC 835,044.00 30,337,148.52VIACOM INC CL B 843,251.00 30,120,925.72MORGAN STANLEY GROUP INC 559,594.00 29,529,775.38FIRST DATA CORP COM 651,159.00 28,989,598.68CONOCOPHILLIPS 374,420.00 28,564,501.80UNITED TECHNOLOGIES CORP 287,177.00 26,270,951.96FDG CAPITAL PARTNERS ,LP 1 26,221,269.00BELLSOUTH CORPORATION 988,828.00 25,927,070.16FEDERAL HOME LN MTG CORP 405,300.00 25,655,490.00BIOGEN IDEC INC 390,880.00 24,723,160.00ALLSTATE CORP COM 526,305.00 24,499,497.75NEXTEL COMMUNICATIONS INC CL A 886,665.00 23,638,488.90ZIMMER HLDGS INC 267,051.00 23,553,898.20UNITED PARCEL SVC INC CL B 311,538.00 23,418,311.46COMCAST CORP NEW CL A 833,218.00 23,355,100.54E I DU PONT DE NEMOURS & CO COMM 525,657.00 23,349,683.94BRISTOL MYERS SQUIBB CO COM 947,460.00 23,212,770.00LOWES COMPANIES INC COM 437,541.00 22,992,779.55MC DONALDS CORPORATION COMMON 857,900.00 22,305,400.00KIMBERLY-CLARK CORP COM 338,445.00 22,296,756.60BOEING COMPANY 435,192.00 22,233,959.28CARDINAL HEALTH INC COM 316,412.00 $22,164,660.60
70

NEW YORK CITY
POLICE PENSION FUND
INVESTMENT SUMMARY
YEAR ENDED JUNE 30, 2004
(In Thousands)
Percentage of TotalType of Investments: Market Value Market Value
Fixed Income: Corporate Bonds 1,356,866,996$ 8% U.S Government Securities 2,926,937,716 18% Yankee Bonds 86,241,101 1% Mortgages 20,967,250 0%
Total Fixed Income 4,391,013,063 27%
Domestic Equities: 7,771,166,919 48%
International Equities: 3,385,387,398 21%
Private Equity-Other 210,530,000 1%
Short-term Investments: Short-term Investments 312,680,129 2% Commercial Paper 24,826,890 0.18% Discount Notes 130,333,825 0.76% Treasury Bills 47,559,431 0.06%
Total Short-term 515,400,275 3%
Total Market Value* 16,273,497,655$ 100%
*Security lending transactions of $2,872,785,022 not included in total.
71

SCHEDULE 6
NEW YORK CITYPOLICE PENSION FUND
REPORT ON INVESTMENT MANAGEMENT FEESYEAR ENDED JUNE 30, 2004
INTERNATIONAL Estimated Fees Performance Total2004 Fee Max Fee
BK OF IRELAND ASSET MGT (US) LTD/CHASE $987,420 $987,420CAPITAL GUARDIAN TRUST CO/CHASE 958,884 958,884DELAWARE MGT. CO. 1,124,194 1,124,194GE INVEST. MGMT, INC./ST. STREET BK&TR 543,806 543,806INVISTA CAPITAL MGT. 83,904 83,904OECHSLE INT'L ADVISORS 766,755 766,755PUTNAM ADVISORY CO. 330,953 330,953ROWE PRICE-FLEMING 722,760 722,760SCHRODER CAPITAL MGT INT'L/CHASE 289,658 289,658 SUBTOTAL ACTIVE $5,808,334 $5,808,334
BARCLAYS GLOBAL INVESTORS, N.A. $53,879 $53,879
SUBTOTAL INDEX $53,879 $53,879
GENESIS ASSET MGRS LTD/BANKERS TRUST $627,549 $627,549PICTET INT'L MGT LTD/BROWN BROS. 958,567 958,567 SUBTOTAL EMERGING MARKETS $1,586,116 $1,586,116 TOTAL INTERNAT'L $7,394,450 $7,394,450
NORTHERN ASSET MGRS LTD/BANKERS TRUST $47,857 $47,857MERRILL LYNCH ASSET MGT/INDEX 34,705 34,705 MERRILL -VALUE R 1000 0 EQUITY INDEX $82,562 $82,562
FIDELITY MGMT. TRUST COMPANY/GROWTH $1,322,491 $1,322,491LOOMIS SAYLES & CO. L.P. /- GROWTH 649,623 649,623ARONSON JOHNSON 666,006 666,006IRIDIAN ASSET 955,184 955,184LORD ABBETT (LCV) 945,833 945,833
SUBTOTAL CURRENT ACTIVE $4,539,137 $4,539,137
72

SCHEDULE 6
NEW YORK CITYPOLICE PENSION FUND
REPORT ON INVESTMENT MANAGEMENT FEESYEAR ENDED JUNE 30, 2004
Estimated Fees Performance TotalFee Max Fee
ARIEL CAPITAL/MID CAP $319,307 $319,307CHICAGO EQUITY PARTNERS 248,972 248,972DALTON GREINER HARMAN MAHER, & Co. 792,693 792,693DARUMA ASSET MGT, Inc. 298,843 298,843DEUTSCHE ASSET MGT 332,027 332,027FORSTMANN - LEFF ASSOC. (MID CAP) 167,706 167,706INVESCO 183,773 183,773J&W SELIGMAN 257,812 257,812LORD, ABBETT 381,859 381,859MACKAY SHIELDS 216,566 216,566MAZAMA CAPITAL MGT, Inc. 589,550 589,550 TOTAL - Small/Mid Cap $3,789,108 $3,789,108
SUBTOTAL NEW MGRS $4,539,137 $4,539,137 TOTAL US ACTIVE EQUITY 3,789,108 3,789,108 SUBTOTAL US EQUITY $8,328,245 $8,328,245
ALTERNATIVE INVESTMENTSAPPOLO INVESTMENT FUND $525,000 $525,000ARES CORP. 612,500 612,500BLACKSTONE IV 750,000 750,000BLACKSTONE RE 0 0CANYON JOHNSON 175,000 175,000CARLYLE PARTNERS III, L.P. 375,000 375,000CITY INVESTMENT FUND 437,500 437,500COLLER 315,000 315,000CVC EUROPEAN EQUITY FUND 375,000 375,000CYPRESS MRECHANT BANKING PARTNERS 750,000 750,000FDG CAPITAL 875,000 875,000FREEMAN SPOGLI V LP 225,000 225,000LINCOLNSHIRE EQUITY FUND 240,000 240,000NEW MOUNTAIN PARTNERS 300,000 300,000OCM RE OPP FUND 187,500 187,500PRISM VENTURE PARTNERS 562,500 562,500SCP PRIVATE EQUITY PARTNERS 500,000 500,000SOLERA PARTNERS 250,000 250,000VS&A FUND 400,000 400,000TOTAL ALTERNATIVES $7,855,000 $7,855,000
TOTAL - EQUITIES $23,714,136 $23,714,136
73

SCHEDULE 6
NEW YORK CITYPOLICE PENSION FUND
REPORT ON INVESTMENT MANAGEMENT FEESYEAR ENDED JUNE 30, 2004
Estimated Fees Performance Total FIXED INCOME Fee Max Fee
FISCHER, FRANCIS, TREES & WATTS, INC $129,936 $129,936LINCOLN CAPITAL MANAGEMENT CO/GOVT 53,338 53,338PIMCO 265,082 265,082 SUBTOTAL GOVERNMENT $448,356 $448,356
BLACKROCK $229,476 $229,476LINCOLN CAPITAL MANAGEMENT CO/MORT 386,913 386,913PACIFIC INVESTMENT MANAGEMENT CO. 481,602 481,602 SUBTOTAL MORTGAGE $1,097,991 $1,097,991
BLACKROCK $193,871 $193,871TAPLIN, CANIDA & HABACHT 74,239 74,239T. ROWE PRICE ASSOCIATES, INC. 241,962 241,962 SUBTOTAL CORPORATE $510,072 $510,072
FISCHER, FRANCIS, TREES & WATTS/YANKEE $88,659 $88,659PRUDENTIAL 57,414 57,414 SUBTOTAL YANKEE 146,073 146,073
SUBTOTAL: STRUCTURED PROG. $2,202,492 $2,202,492
ENHANCED YIELDALLIANCE CAPITAL MANAGEMENT L.P. $235,895 $235,895LOOMIS SAYLES & CO. L.P. 614,875 614,875MACKAY 544,762 544,762SEIX 299,735 299,735SHENKMAN 359,398 359,398T. ROWE PRICE 329,383 329,383 SUBTOTAL- ENH. YLD $2,384,048 $2,384,048
TOTAL-US FIXED INC. $4,586,540 $4,586,540
CONSULTANTS
PACIFIC CORP GROUP $319,335 $319,335
STRATEGIC INVESTMENT SOLUTIONS, INC. $182,500 $182,500BUCK CONSULTANTS INC. 100,000 100,000 TOTAL GENERAL CONSULTANTS $282,500 $282,500
TOTAL COSTS BY SYSTEM FOR FY 2004 $28,902,511 $28,902,511NET CHANGE DUE TO ACCRUED EXPENSES 991,393 991,393TOTAL INVESTMENT EXPENSES INCURRED BY SYSTEM $28,902,511 $991,393 $29,893,904
74


NEW YORK CITY POLICE PENSION FUND
COMPREHENSIVE ANNUAL FINANCIAL REPORT
A PENSION TRUST FUND OF THE CITY OF NEW YORK
ACTUARIAL SECTION
PART IV
FISCAL YEAR ENDED
June 30, 2004

76

77

78

79
80

NEW YORK CITY POLICE PENSION FUND
SUMMARY OF ACTUARIAL ASSUMPTIONS AND METHODS IN EFFECT AS OF JUNE 30, 2003
(1) The investment rate of return assumption is 8.0% per annum.
(2) The mortality tables for service and disability pensioners were developed from an experience study of the Plan’s and the predecessor Plan’s pensioners. Sample probabilities are shown in Table 1.
(3) Active Service tables are used to estimate various withdrawals from active service. Sample probabilities are shown in Table 2 for members eligible for Service Retirement and in Table 3 for members not eligible for Service Retirement.
(4) A Salary Scale is used to estimate salaries at termination, retirement or death. Sample percentage increases are shown in Table 4. The Salary Scale includes an assumed General Wage Increase (“GWI”) rate of 3.0% per annum.
(5) The economic assumptions (i.e., the assumed investment return rate, GWI rate and Cost-of-Living Adjustments (“COLA”)) were developed assuming a long-term Consumer Price Inflation assumption of 2.5% per annum. The COLA assumption is 1.3% per annum.
(6) The valuation method assumes a closed group. Salaries of members on the valuation date are assumed to increase in accordance with the Salary Scale.
(7) The Frozen Initial Liability Actuarial Cost Method is utilized by the Plan’s Actuary to calculate the contribution from the employer. Under this Actuarial Cost Method, the Initial Liability was reestablished by the Entry Age Actuarial Cost Method as of June 30, 1999 but with the Unfunded Actuarial Accrued Liability (“UAAL”) not less than $0.
81
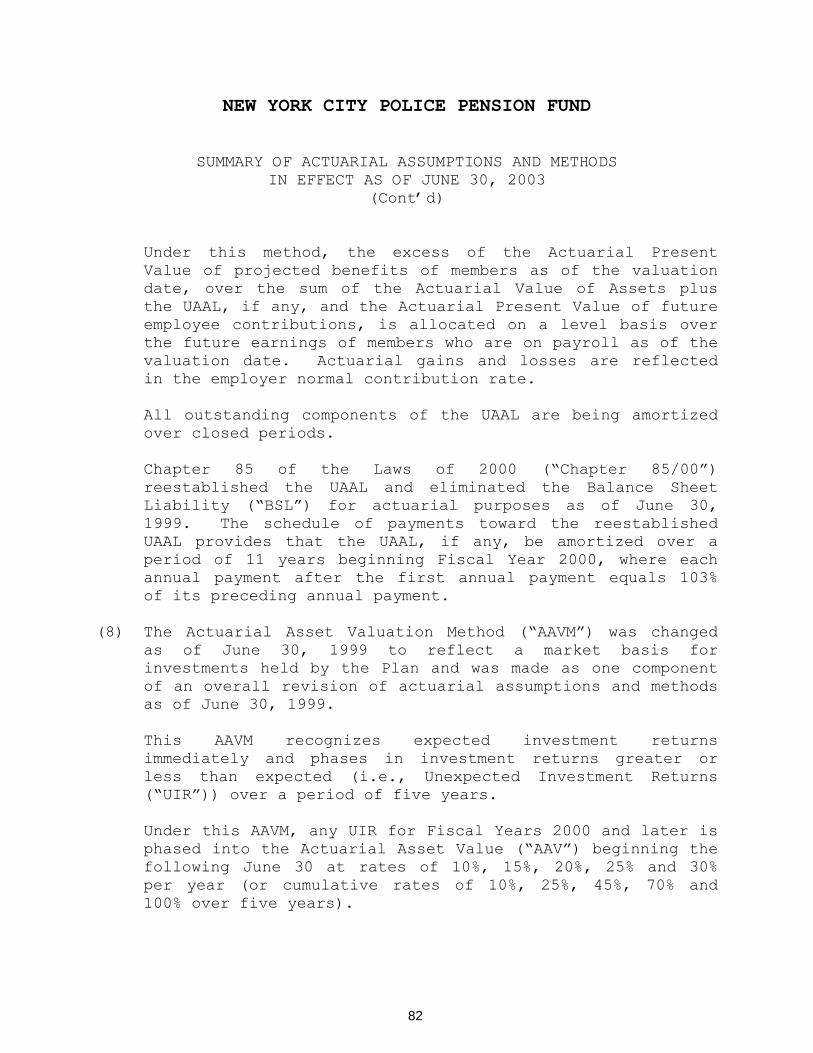
NEW YORK CITY POLICE PENSION FUND
SUMMARY OF ACTUARIAL ASSUMPTIONS AND METHODS IN EFFECT AS OF JUNE 30, 2003
(Cont’d)
Under this method, the excess of the Actuarial Present Value of projected benefits of members as of the valuation date, over the sum of the Actuarial Value of Assets plus the UAAL, if any, and the Actuarial Present Value of future employee contributions, is allocated on a level basis over the future earnings of members who are on payroll as of the valuation date. Actuarial gains and losses are reflected in the employer normal contribution rate.
All outstanding components of the UAAL are being amortized over closed periods.
Chapter 85 of the Laws of 2000 (“Chapter 85/00”) reestablished the UAAL and eliminated the Balance Sheet Liability (“BSL”) for actuarial purposes as of June 30, 1999. The schedule of payments toward the reestablished UAAL provides that the UAAL, if any, be amortized over a period of 11 years beginning Fiscal Year 2000, where each annual payment after the first annual payment equals 103% of its preceding annual payment.
(8) The Actuarial Asset Valuation Method (“AAVM”) was changed as of June 30, 1999 to reflect a market basis for investments held by the Plan and was made as one component of an overall revision of actuarial assumptions and methods as of June 30, 1999.
This AAVM recognizes expected investment returns immediately and phases in investment returns greater or less than expected (i.e., Unexpected Investment Returns (“UIR”)) over a period of five years.
Under this AAVM, any UIR for Fiscal Years 2000 and later is phased into the Actuarial Asset Value (“AAV”) beginning the following June 30 at rates of 10%, 15%, 20%, 25% and 30% per year (or cumulative rates of 10%, 25%, 45%, 70% and 100% over five years).
82

NEW YORK CITY POLICE PENSION FUND
SUMMARY OF ACTUARIAL ASSUMPTIONS AND METHODS IN EFFECT AS OF JUNE 30, 2003
(Cont’d)
(9) The obligations of the Plan to the Police Officers’ Variable Supplements Fund (“POVSF”) and the Police Superior Officers’ Variable Supplements Fund (“PSOVSF”) are recognized through the use of the Liability Valuation Method.
Under this methodology the Actuarial Present Value of the potential excess earnings transfers from the Plan to the POVSF and PSOVSF are included directly as an actuarial liability of the Plan. This amount is computed as the excess, if any, of the Actuarial Present Value of benefits of the POVSF and PSOVSF over the Actuarial Value of Assets of the POVSF and PSOVSF, respectively.
(10) In a report dated October 1999 entitled Report on the Experience Study of the New York City Retirement Systems for the Four Years ended June 30, 1997, Watson Wyatt and Company, an independent actuarial auditor, presented an actuarial study and made recommendations for changes in certain actuarial assumptions and methods. Based upon a review of that study, the Actuary, in a Report dated December 27, 1999, proposed changes to certain actuarial assumptions and methods to be used by the Plan for Fiscal Years beginning on and after July 1, 1999 (i.e., Fiscal Years beginning 2000).
Where required, the Board of Trustees of the Plan adopted those changes to actuarial assumptions and methods that required Board approval and the New York State Legislature and the Governor enacted Chapter 85/00 to provide for those changes to the actuarial assumptions and methods that required legislation, including the investment rate of return assumption of 8.0% per annum.
83
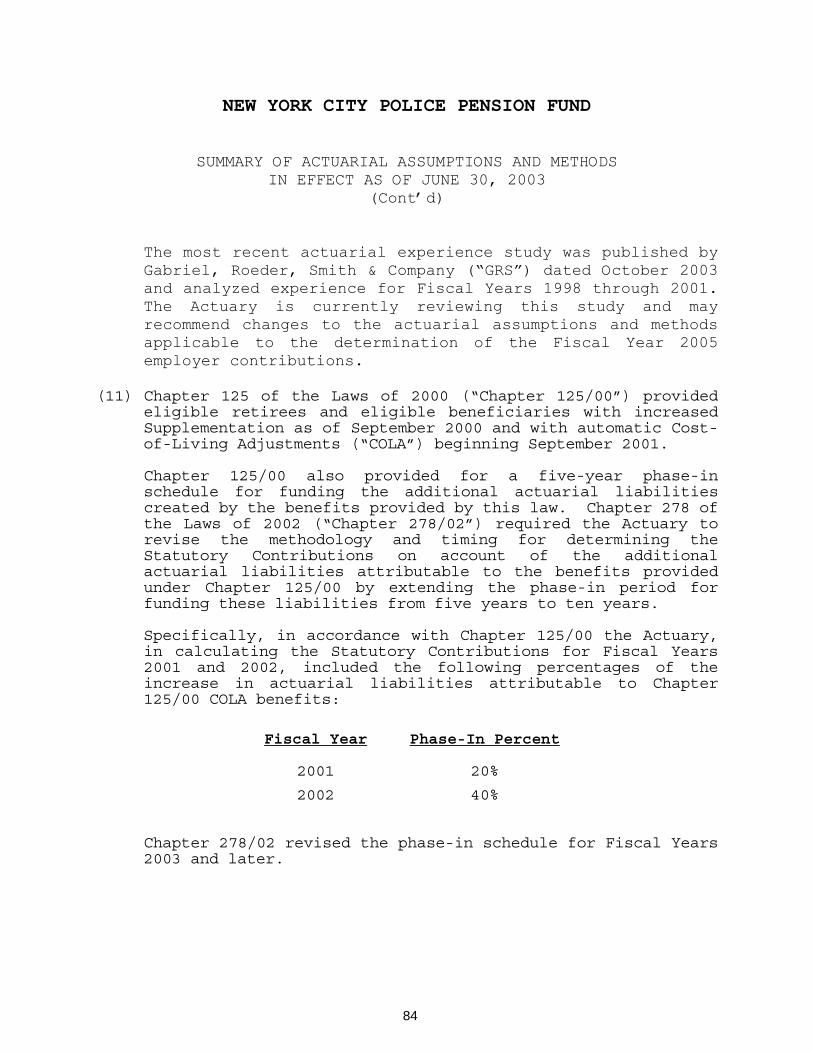
NEW YORK CITY POLICE PENSION FUND
SUMMARY OF ACTUARIAL ASSUMPTIONS AND METHODS IN EFFECT AS OF JUNE 30, 2003
(Cont’d)
The most recent actuarial experience study was published by Gabriel, Roeder, Smith & Company (“GRS”) dated October 2003 and analyzed experience for Fiscal Years 1998 through 2001. The Actuary is currently reviewing this study and may recommend changes to the actuarial assumptions and methods applicable to the determination of the Fiscal Year 2005 employer contributions.
(11) Chapter 125 of the Laws of 2000 (“Chapter 125/00”) provided eligible retirees and eligible beneficiaries with increasedSupplementation as of September 2000 and with automatic Cost-of-Living Adjustments (“COLA”) beginning September 2001.
Chapter 125/00 also provided for a five-year phase-in schedule for funding the additional actuarial liabilities created by the benefits provided by this law. Chapter 278 of the Laws of 2002 (“Chapter 278/02”) required the Actuary to revise the methodology and timing for determining the Statutory Contributions on account of the additional actuarial liabilities attributable to the benefits provided under Chapter 125/00 by extending the phase-in period for funding these liabilities from five years to ten years.
Specifically, in accordance with Chapter 125/00 the Actuary, in calculating the Statutory Contributions for Fiscal Years 2001 and 2002, included the following percentages of the increase in actuarial liabilities attributable to Chapter 125/00 COLA benefits:
Fiscal Year Phase-In Percent
2001 20%
2002 40%
Chapter 278/02 revised the phase-in schedule for Fiscal Years 2003 and later.
84

NEW YORK CITY POLICE PENSION FUND
SUMMARY OF ACTUARIAL ASSUMPTIONS AND METHODS IN EFFECT AS OF JUNE 30, 2003
(Cont’d)
Chapter 278/02 provided that, for the June 30, 2000 actuarial valuation, the Actuary is required to recognize, on a theoretical basis, only 10% of the additional actuarial liabilities attributable to the benefits provided by Chapter 125/00 for determining Fiscal Year 2001 employer contributions.
For each of the next eight June 30 actuarial valuations (i.e., June 30, 2001 to June 30, 2008), the Actuary is required to recognize progressively increasing percentages (i.e., 20% to 90%) of the additional actuarial liabilities attributable to Chapter 125/00 for determining Fiscal Year 2002 to Fiscal Year 2009 employer contributions.
For the June 30, 2009 and later actuarial valuations, the Actuary is required to recognize the full amount of the additional actuarial liabilities attributable to Chapter 125/00 for determining Fiscal Years 2010 and later employer contributions.
(12) Distinct male and female probabilities for mortality are used effective June 30, 1995.
(13) A dual overtime assumption (i.e., a baseline overtime assumption for most years and a separate overtime assumption for the years included in the calculation of Final Average Salary) was introduced as of June 30, 1995. Baseline overtime of 6% is assumed. For actuarial valuations from June 30, 1995 to June 30, 1999 the following overtime assumptions were used in Final Average Salary (“FAS”):
12% for Tier I Service Retirements 9% for Tier II Service Retirements 2% for Tier I Disability Retirements 4% for Tier II Disability Retirements 6% for all other benefits.
85
NEW YORK CITY POLICE PENSION FUND
SUMMARY OF ACTUARIAL ASSUMPTIONS AND METHODS IN EFFECT AS OF JUNE 30, 2003
(Cont’d)
For actuarial valuations on and after June 30, 2000, in recognition of Chapter 372 of the Laws of 2000 that provides for the use of one-year FAS for Tier II members of the Plan, the following overtime assumptions are used in FAS:
12% for Service Retirements 2% for Disability Retirements except 2% for Tier II Ordinary Disability Retirements with respect to the first 20 Years of Service and 4% thereafter 6% for all other benefits.
(14) The salary data as of June 30, 2003 presented herein was adjusted to reflect overtime earnings by an assumed baseline overtime rate of 6%.
86

NEW YORK CITY POLICE PENSION FUND
SUMMARY OF ACTUARIAL ASSUMPTIONS AND METHODS IN EFFECT AS OF JUNE 30, 2003
(Cont’d)
Table 1
Deaths among Service and Disability Pensioners
Percentage of Pensioners Dying within Next Year
Service Pensioners Disability Pensioners
Age Males Females Males Females
40 .1151% .0677% .1477% .0817% 50 .2781 .2205 .4574 .2788 60 1.0416 .7143 1.2209 .8895 70 2.2892 1.7416 2.7024 2.1653 80 5.1995 4.6138 6.0431 5.6527 90 13.7899 12.2729 16.4676 15.1220 100 30.1977 28.6331 36.7152 34.8130 110 100.0000 100.0000 100.0000 100.0000
Table 2
Retirements and Deaths after Eligibility for Service Benefits
Percentage of Eligible Active Members Retiring Or Dying within Next Year
Service Retirement Years of Service Since First Eligible
AccidentDisabilityRetirement
OrdinaryDisabilityRetirement
Ordinary Death Males Females
AccidentalDeath
Age 1 2 Ultimate
40 40.00% 20.00% 12.00% 1.60% .30% .1151% .0645% .02%
45 40.00 20.00 12.00 1.80 .40 .2030 .0980 .02
50 40.00 20.00 12.00 2.00 .50 .3635 .1598 .02
55 40.00 20.00 12.00 2.50 1.00 .5702 .2465 .01
60 40.00 20.00 12.00 4.00 6.00 .8517 .4114 .00
63 100.00 100.00 100.00 N/A N/A N/A N/A N/A
87

NEW YORK CITY POLICE PENSION FUND
SUMMARY OF ACTUARIAL ASSUMPTIONS AND METHODS IN EFFECT AS OF JUNE 30, 2003
(Cont’d)
Table 3
Withdrawals from Active Service (Other than for Service Retirement)
Percentage of Active Members Separating within Next Year
Age WithdrawalAccidentalDisability
OrdinaryDisability
Ordinary Death Males Females
AccidentalDeath
20 3.00% .20% .01% .0351% .0183% .02% 25 2.50 .35 .05 .0432 .0245 .02 30 1.50 .70 .10 .0565 .0332 .02 35 0.75 1.40 .20 .0800 .0462 .02 40 0.50 1.60 .30 .1151 .0645 .02 45 0.50 1.80 .40 .2030 .0980 .02 50 0.50 2.00 .50 .3635 .1598 .02 55 0.50 2.50 1.00 .5702 .2465 .01 60 0.50 4.00 6.00 .8517 .4114 .00
Table 4
Salary Scale
Years of Service
Assumed Annual Percentage Increases Within Next Year*
0 9.50% 5 4.00 10 4.30 15 4.50 20 4.00 25 4.00 30 4.00 35 4.00 40 4.00
* Salary Scale includes an assumed General Wage Increase rate of 3.0% per annum.
88
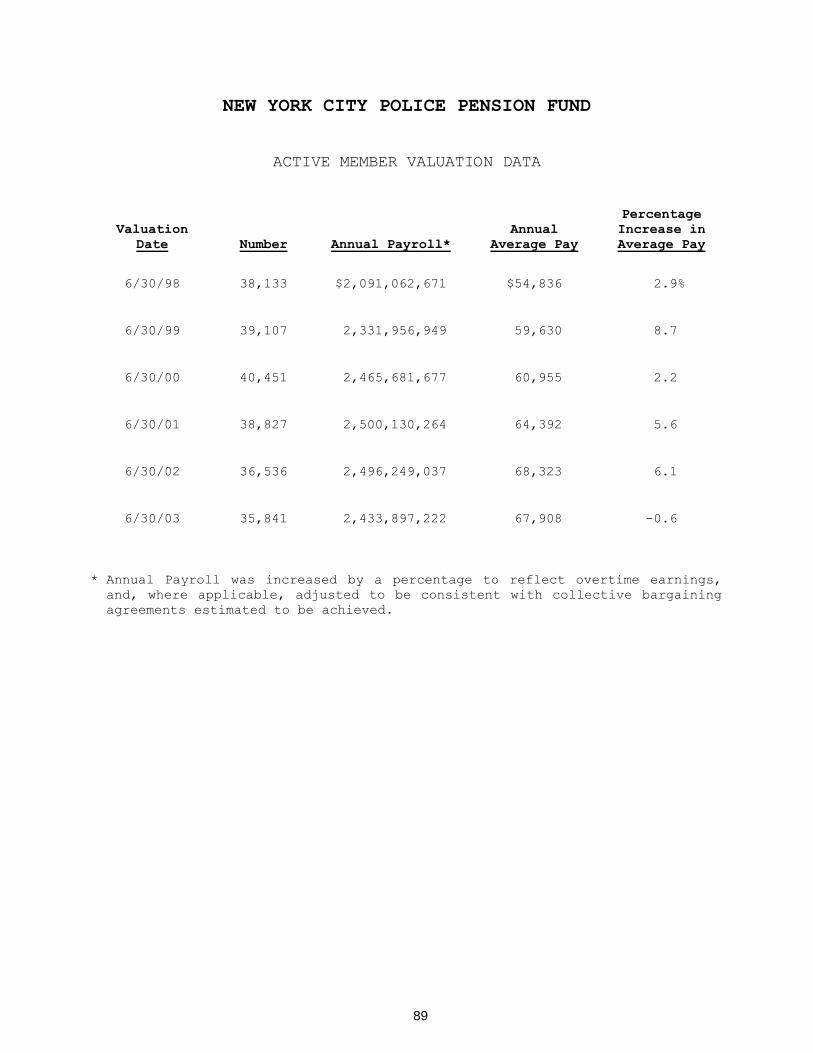
NEW YORK CITY POLICE PENSION FUND
ACTIVE MEMBER VALUATION DATA
ValuationDate Number Annual Payroll*
AnnualAverage Pay
PercentageIncrease in Average Pay
6/30/98 38,133 $2,091,062,671 $54,836 2.9%
6/30/99 39,107 2,331,956,949 59,630 8.7
6/30/00 40,451 2,465,681,677 60,955 2.2
6/30/01 38,827 2,500,130,264 64,392 5.6
6/30/02 36,536 2,496,249,037 68,323 6.1
6/30/03 35,841 2,433,897,222 67,908 -0.6
* Annual Payroll was increased by a percentage to reflect overtime earnings, and, where applicable, adjusted to be consistent with collective bargaining agreements estimated to be achieved.
89

NEW YORK CITY POLICE PENSION FUND
RETIRANTS AND BENEFICIARIES ADDED TO AND REMOVED FROM ROLLS
Added to Rolls
Removed from Rolls
Rolls end of Year
Year
Ended
Number
Annual
Allowances
Number
Annual
Allowances
Number
Annual
Allowances
% Increase
In Annual
Allowances
Average
Annual
Allowances
6/30/98
736
$ 38,976,977
969
$13,305,136
35,047
$ 810,425,042
2.6%
$23,124
6/30/99
682
60,850,228
990
14,695,539
34,739
856,579,731
5.7
24,658
6/30/00
832
41,398,525
935
15,698,156
34,636
882,280,100
3.0
25,473
6/30/01
1,582
169,140,021
973
16,481,363
35,245
1,034,938,758
17.3
29,364
6/30/02
2,916
108,830,413
898
19,684,195
37,263
1,124,084,976
8.6
30,166
6/30/03
1,942
86,819,507
945
21,085,545
38,260
1,189,818,938
5.8
31,098
90
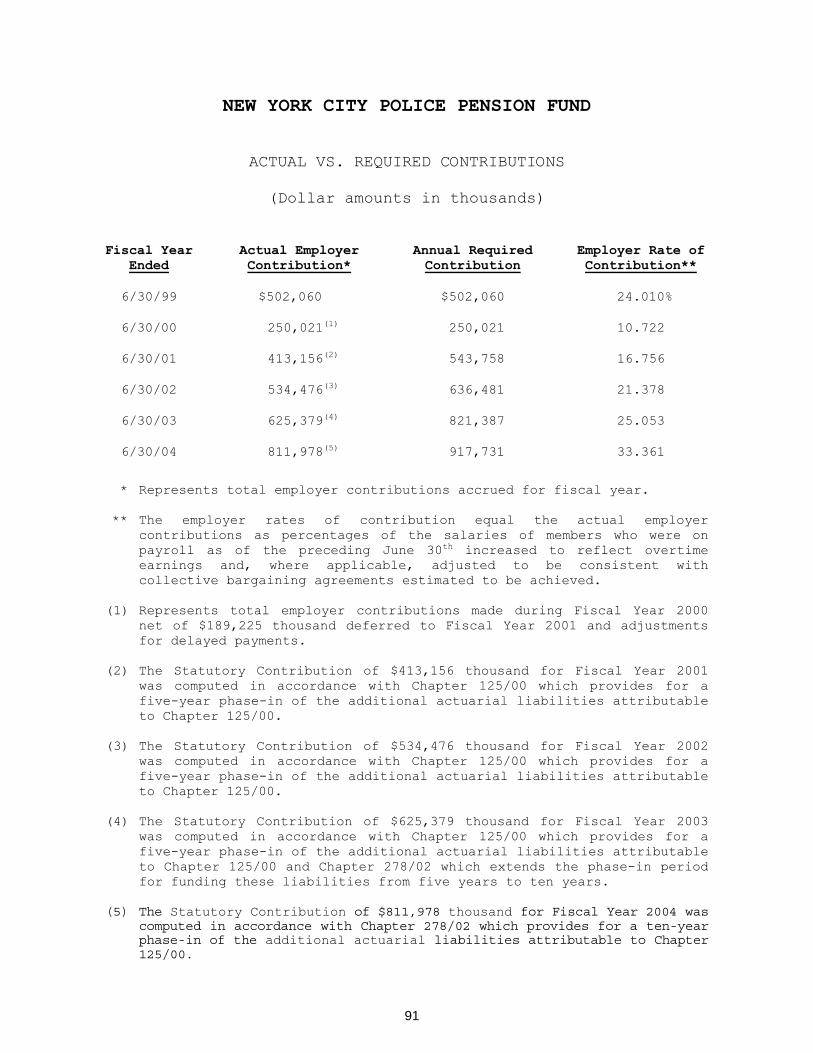
NEW YORK CITY POLICE PENSION FUND
ACTUAL VS. REQUIRED CONTRIBUTIONS
(Dollar amounts in thousands)
Fiscal Year Ended
Actual Employer Contribution*
Annual Required Contribution
Employer Rate of Contribution**
6/30/99 $502,060 $502,060 24.010%
6/30/00 250,021(1) 250,021 10.722
6/30/01 413,156(2) 543,758 16.756
6/30/02 534,476(3) 636,481 21.378
6/30/03 625,379(4) 821,387 25.053
6/30/04 811,978(5) 917,731 33.361
* Represents total employer contributions accrued for fiscal year.
** The employer rates of contribution equal the actual employer contributions as percentages of the salaries of members who were on payroll as of the preceding June 30th increased to reflect overtime earnings and, where applicable, adjusted to be consistent with collective bargaining agreements estimated to be achieved.
(1) Represents total employer contributions made during Fiscal Year 2000 net of $189,225 thousand deferred to Fiscal Year 2001 and adjustments for delayed payments.
(2) The Statutory Contribution of $413,156 thousand for Fiscal Year 2001 was computed in accordance with Chapter 125/00 which provides for a five-year phase-in of the additional actuarial liabilities attributable to Chapter 125/00.
(3) The Statutory Contribution of $534,476 thousand for Fiscal Year 2002 was computed in accordance with Chapter 125/00 which provides for a five-year phase-in of the additional actuarial liabilities attributable to Chapter 125/00.
(4) The Statutory Contribution of $625,379 thousand for Fiscal Year 2003 was computed in accordance with Chapter 125/00 which provides for a five-year phase-in of the additional actuarial liabilities attributable to Chapter 125/00 and Chapter 278/02 which extends the phase-in period for funding these liabilities from five years to ten years.
(5) The Statutory Contribution of $811,978 thousand for Fiscal Year 2004 was computed in accordance with Chapter 278/02 which provides for a ten-year phase-in of the additional actuarial liabilities attributable to Chapter 125/00.
91
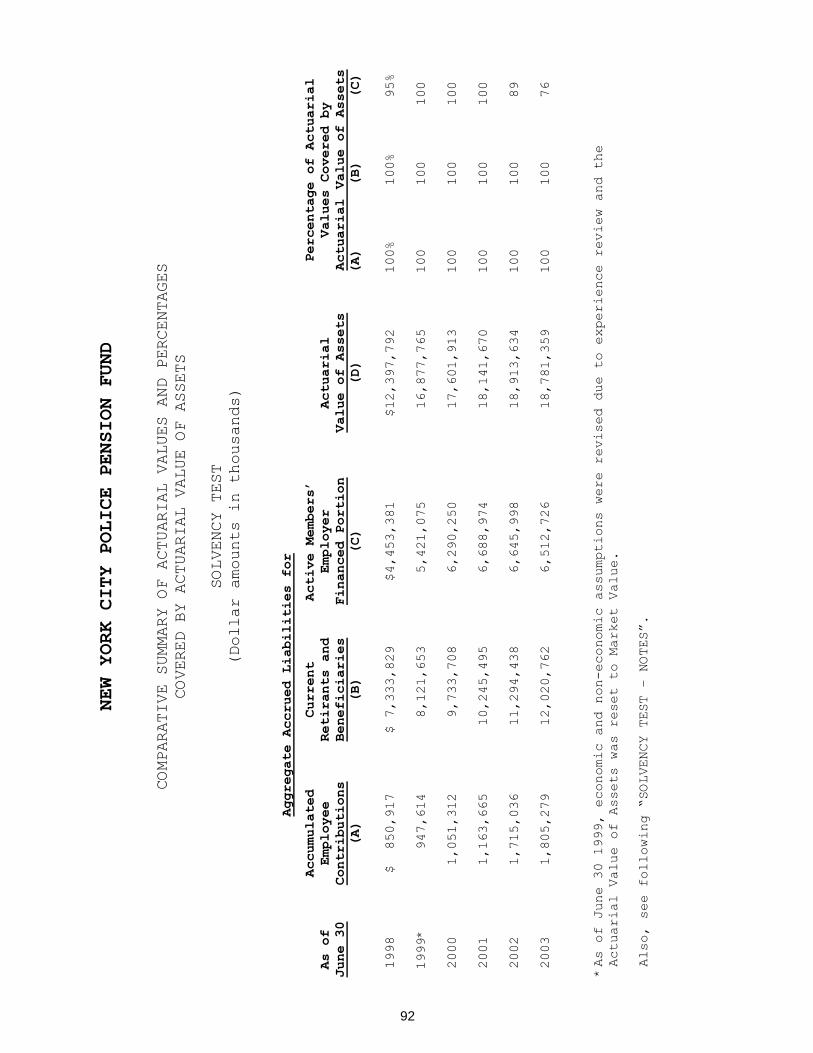
NEW YORK CITY POLICE PENSION FUND
COMPARATIVE SUMMARY OF ACTUARIAL VALUES AND PERCENTAGES
COVERED BY ACTUARIAL VALUE OF ASSETS
SOLVENCY TEST
(Dollar amounts in thousands)
Aggregate Accrued Liabilities for
As of
June 30
Accumulated
Employee
Contributions
(A)
Current
Retirants and
Beneficiaries
(B)
Active Members’
Employer
Financed Portion
(C)
Actuarial
Value of Assets
(D)
Percentage of Actuarial
Values Covered by
Actuarial
Value of Assets
(A) (B) (C)
1998
$ 850,917
$ 7,333,829
$4,453,381
$12,397,792
100% 100% 95%
1999*
947,614
8,121,653
5,421,075
16,877,765
100 100 100
2000
1,051,312
9,733,708
6,290,250
17,601,913
100 100 100
2001
1,163,665
10,245,495
6,688,974
18,141,670
100 100 100
2002
1,715,036
11,294,438
6,645,998
18,913,634
100 100 89
2003
1,805,279
12,020,762
6,512,726
18,781,359
100 100 76
*As of June 30 1999, economic and non-economic assumptions were revised due to experience review and the
Actuarial Value of Assets was reset to Market Value.
Also, see following “SOLVENCY TEST – NOTES”.
92

NEW YORK CITY POLICE PENSION FUND
COMPARATIVE SUMMARY OF ACTUARIAL VALUES AND PERCENTAGES COVERED BY ACTUARIAL VALUE OF ASSETS
SOLVENCY TEST - NOTES
The ultimate test of financial soundness in a retirement system is its ability to pay all of its promised benefits when due. The retirement system’s progress in accumulating assets to pay all promised benefits can be measured by comparing the Valuation Assets of the retirement system with the Aggregate Accrued Liabilities for:
(A) Accumulated Member Contributions; (B) Current Retirants and Beneficiaries; and (C) Active Members’ Employer Financed Portion.
The Aggregate Accrued Liabilities are the Actuarial Present Value of credited projected benefits produced by the credited projected benefit attribution approach prorated on service. The Aggregate Accrued Liabilities were calculated in accordance with previously issued Governmental Accounting Standards Board Statement No. 25.
This comparative summary allocates assets as if they were priority groups, somewhat similar to (but not identical with) the priority categories of Section 4044 of the Employee Retirement Income Security Act of 1974 (“ERISA”).
The values in the table are dependent upon census data, benefit levels (which have changed on occasion over the past years), and the actuarial assumptions and methods employed at each valuation date. These underlying bases can be found within the Comprehensive Annual Financial Report for each respective year.
To fully evaluate trends in financial soundness, changes in assumptions need to be evaluated. The economic assumptions used in the actuarial calculations are as follows:
ValuationDate
June 30
Assumed Annual Rate of Return On Investments
Merit and Promotion Increases Plus an
Assumed General Wage Increase Per Year of
1998 8.75% 4.0% 1999 8.00 3.0 2000 8.00 3.0 2001 8.00 3.0 2002 8.00 3.0 2003 8.00 3.0
93
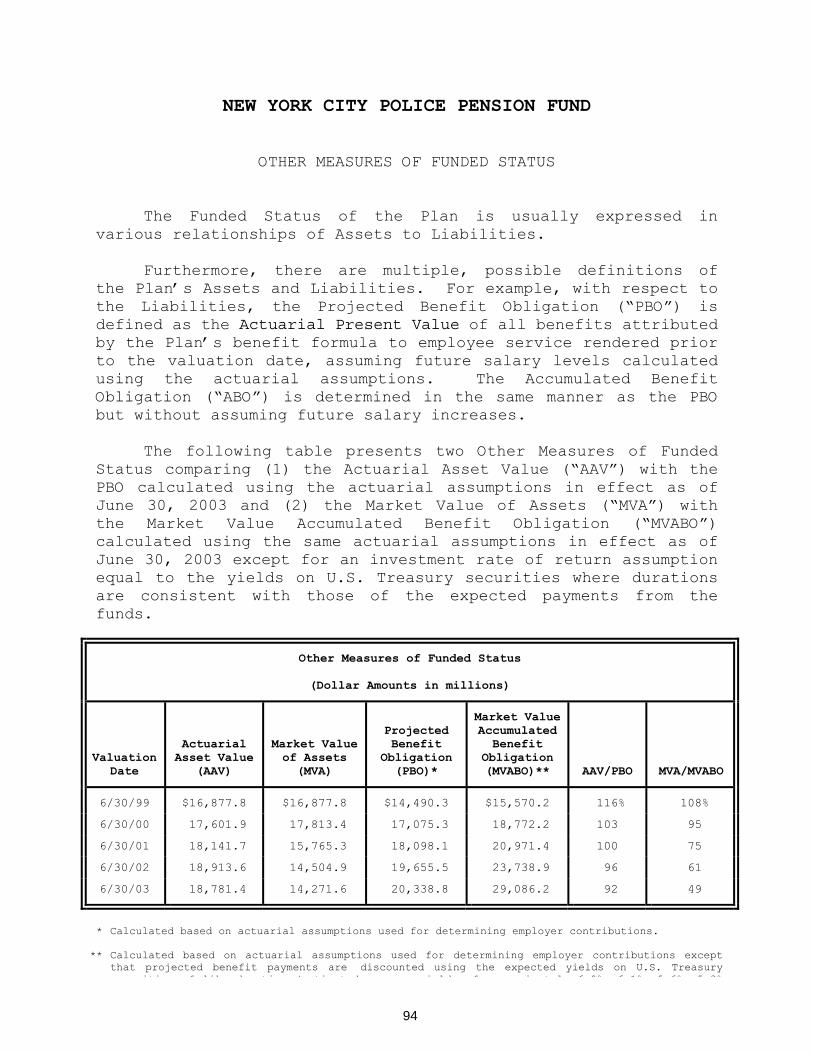
NEW YORK CITY POLICE PENSION FUND
OTHER MEASURES OF FUNDED STATUS
The Funded Status of the Plan is usually expressed in various relationships of Assets to Liabilities.
Furthermore, there are multiple, possible definitions of the Plan’s Assets and Liabilities. For example, with respect to the Liabilities, the Projected Benefit Obligation (“PBO”) is defined as the Actuarial Present Value of all benefits attributed by the Plan’s benefit formula to employee service rendered prior to the valuation date, assuming future salary levels calculated using the actuarial assumptions. The Accumulated Benefit Obligation (“ABO”) is determined in the same manner as the PBO but without assuming future salary increases.
The following table presents two Other Measures of Funded Status comparing (1) the Actuarial Asset Value (“AAV”) with the PBO calculated using the actuarial assumptions in effect as of June 30, 2003 and (2) the Market Value of Assets (“MVA”) with the Market Value Accumulated Benefit Obligation (“MVABO”) calculated using the same actuarial assumptions in effect as of June 30, 2003 except for an investment rate of return assumption equal to the yields on U.S. Treasury securities where durations are consistent with those of the expected payments from the funds.
Other Measures of Funded Status
(Dollar Amounts in millions)
ValuationDate
ActuarialAsset Value
(AAV)
Market Value of Assets
(MVA)
ProjectedBenefit
Obligation(PBO)*
Market ValueAccumulatedBenefit
Obligation(MVABO)** AAV/PBO MVA/MVABO
6/30/99 $16,877.8 $16,877.8 $14,490.3 $15,570.2 116% 108%
6/30/00 17,601.9 17,813.4 17,075.3 18,772.2 103 95
6/30/01 18,141.7 15,765.3 18,098.1 20,971.4 100 75
6/30/02 18,913.6 14,504.9 19,655.5 23,738.9 96 61
6/30/03 18,781.4 14,271.6 20,338.8 29,086.2 92 49
* Calculated based on actuarial assumptions used for determining employer contributions.
** Calculated based on actuarial assumptions used for determining employer contributions except that projected benefit payments are discounted using the expected yields on U.S. Treasury securities of like duration (estimated average yields of approximately 6.0%, 6.1%, 5.6%, 5.3% and 4.2% for June 30, 1999, 2000, 2001, 2002 and 2003, respectively).
94

NEW YORK CITY POLICE PENSION FUND
OTHER MEASURES OF FUNDED STATUS (Cont’d)
These Other Measures of Funded Status provide different relationships between the Assets and Liabilities of the Plan and are designed solely to offer additional insight into the Funded Status of the Plan that the Actuary believes may prove interesting to some readers.
In addition, it should be noted that any measures of Funded Status should generally be examined with more consideration of their trends over time than their values at any given point in time.
Note, the ratios of AAV to PBO present a comparable but a somewhat different representation of the information shown in the Solvency Test.
The ratios of MVA to MVABO provide a measure of Funded Status that is (1) independent of the asset allocation of the Plan, (2) exclusive of any advance recognition of expected asset risk premia (e.g., equity risk premium) and (3) absent any smoothing of asset values.
95
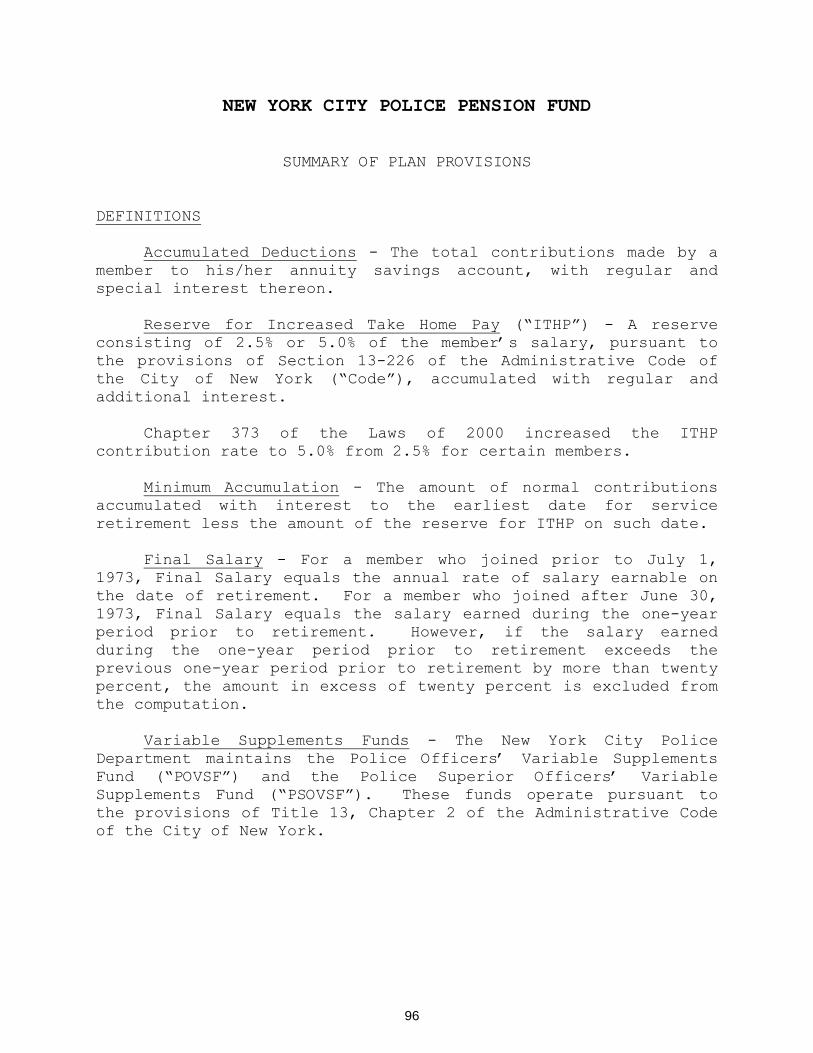
NEW YORK CITY POLICE PENSION FUND
SUMMARY OF PLAN PROVISIONS
DEFINITIONS
Accumulated Deductions - The total contributions made by a member to his/her annuity savings account, with regular and special interest thereon.
Reserve for Increased Take Home Pay (“ITHP”) - A reserve consisting of 2.5% or 5.0% of the member’s salary, pursuant to the provisions of Section 13-226 of the Administrative Code of the City of New York (“Code”), accumulated with regular and additional interest.
Chapter 373 of the Laws of 2000 increased the ITHP contribution rate to 5.0% from 2.5% for certain members.
Minimum Accumulation - The amount of normal contributions accumulated with interest to the earliest date for service retirement less the amount of the reserve for ITHP on such date.
Final Salary - For a member who joined prior to July 1, 1973, Final Salary equals the annual rate of salary earnable on the date of retirement. For a member who joined after June 30, 1973, Final Salary equals the salary earned during the one-year period prior to retirement. However, if the salary earned during the one-year period prior to retirement exceeds the previous one-year period prior to retirement by more than twenty percent, the amount in excess of twenty percent is excluded from the computation.
Variable Supplements Funds - The New York City Police Department maintains the Police Officers’ Variable Supplements Fund (“POVSF”) and the Police Superior Officers’ Variable Supplements Fund (“PSOVSF”). These funds operate pursuant to the provisions of Title 13, Chapter 2 of the Administrative Code of the City of New York.
96

NEW YORK CITY POLICE PENSION FUND
SUMMARY OF PLAN PROVISIONS (Cont’d)
MEMBER CONTRIBUTIONS
Member contributions are made on the basis of a normal rate of contribution that is assigned by the Plan at the time of membership. The normal rate, which is dependent upon the member’s age and the Plan at the time of membership, as well as the tables in effect for such purpose, is determined so as to provide an annuity of approximately one-quarter of the service retirement allowance at the earliest date for service retirement. Members may voluntarily increase their rates of contribution by 50% for the purpose of purchasing an additional annuity.
Contributions from members are recorded when the employer makes payroll deductions from Plan members. Members are permitted to borrow up to 90% of their own contributions including accumulated interest. These loans are accounted for as reductions in such member’s contribution accounts.
BENEFITS
Briefly stated, the benefit provisions and the contribution provisions, of which account was taken in the valuation, are as follows:
I. SERVICE RETIREMENT
The service retirement allowance consists of two parts, a pension payable from City contributions and an annuity from member’s contributions.
According to his election when he joined the Pension Fund, a member may retire from service after having completed 20 years of police service, or after having completed 25 years of police service, or at the attainment of age 55 regardless of years of service.
97

NEW YORK CITY POLICE PENSION FUND
SUMMARY OF PLAN PROVISIONS (Cont’d)
Upon retirement after having become eligible for service retirement the member receives an annual allowance which is the sum of (a) 50% of Final Salary, reduced by an annuity which is the actuarial equivalent of the minimum accumulation, (b) an annuity which is the actuarial equivalent of the Accumulated Deductions and (c) for all years of service other than the minimum required service:
(i) for a member who joined prior to July 1, 1973, 1/60 of average salary for the period of service after the completion of his minimum required service for each year of such service; for a member who joined after June 30, 1973, 1/60 of average salary for the period of service after the completion of his minimum required service but for not more than the last ten years of such service, and
(ii) an annual pension for ITHP which is the actuarial equivalent of the reserve for ITHP less the reserve for ITHP at the minimum service date with interest to the date of retirement.
II. ORDINARY DISABILITY RETIREMENT
An annual ordinary disability retirement allowance is paid upon the disablement of a member from causes other than accident in the actual performance of duty.
For a member who elected the 20 year plan, the annual ordinary disability retirement allowance is equal to 1/40 (1/50 for members who elected the 25 year plan; 1/60 for members who elected to retire at the attainment of age 55) of Final Salary multiplied by the number of years of service, but not less than 1/2 of his Final Salary if he completed 10 or more years of City service, or 1/3 of his Final Salary if less than 10 years of City service.
98

NEW YORK CITY POLICE PENSION FUND
SUMMARY OF PLAN PROVISIONS (Cont’d)
III. ACCIDENT DISABILITY RETIREMENT
Upon the occurrence of disability caused by an accident in the actual performance of duty, a member is granted a retirement allowance. The allowance consists of a pension equal to three-fourths of his Final Salary and, if he is eligible for service retirement, an additional increment of 1/60 of average salary from date of eligibility for service retirement to date of retirement for each year of service after the completion of the required minimum for a member who joined before July 1, 1973, and for each of the years of service not exceeding 10 years after the completion of the required minimum for a member who joined after June 30, 1973. An additional pension is paid which is the actuarial equivalent of the reserve for ITHP, as well as an annuity which is the amount which can be purchased with the member’s Accumulated Deductions.
IV. ORDINARY DEATH BENEFIT
Upon the death of a member in active service from causes other than accident in the actual performance of duty, a benefit is paid to his estate or to such person as he shall have nominated.
With respect to a member who joined before July 1, 1973, the benefit is equal to the compensation earnable by the member in the six months immediately preceding his death and, if the total number of years of allowable service exceeds ten, then the benefit is equal to the compensation earnable by him during the twelve months immediately preceding death. In addition, the member’s accumulated deductions, the reserve for ITHP, and the City’s obligation on account of military service, if any, are paid to his estate or to his designated beneficiary.
A member who joins after June 30, 1973 is covered for a death benefit upon completion of 90 days of service. The amount of the death benefit is equal to three times member’s salary raised to the next higher multiple of $1,000. In addition, the member’s accumulated deductions are payable.
99
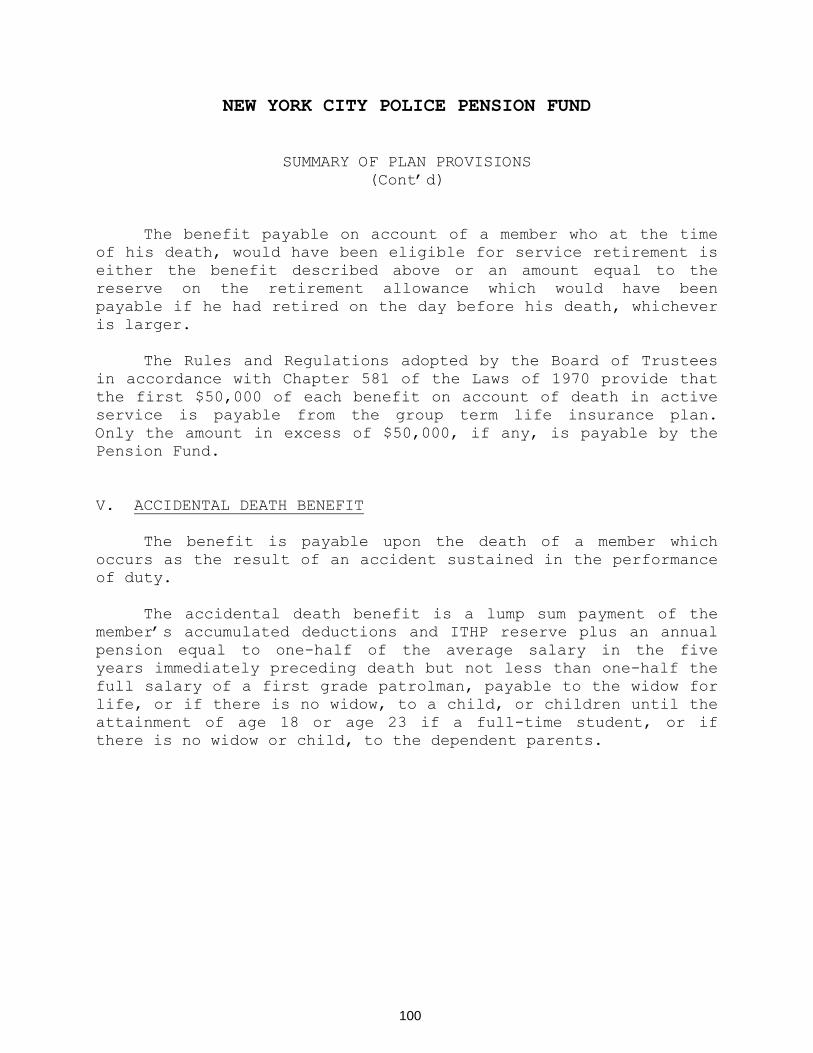
NEW YORK CITY POLICE PENSION FUND
SUMMARY OF PLAN PROVISIONS (Cont’d)
The benefit payable on account of a member who at the time of his death, would have been eligible for service retirement is either the benefit described above or an amount equal to the reserve on the retirement allowance which would have been payable if he had retired on the day before his death, whichever is larger.
The Rules and Regulations adopted by the Board of Trustees in accordance with Chapter 581 of the Laws of 1970 provide that the first $50,000 of each benefit on account of death in active service is payable from the group term life insurance plan. Only the amount in excess of $50,000, if any, is payable by the Pension Fund.
V. ACCIDENTAL DEATH BENEFIT
The benefit is payable upon the death of a member which occurs as the result of an accident sustained in the performance of duty.
The accidental death benefit is a lump sum payment of the member’s accumulated deductions and ITHP reserve plus an annual pension equal to one-half of the average salary in the five years immediately preceding death but not less than one-half the full salary of a first grade patrolman, payable to the widow for life, or if there is no widow, to a child, or children until the attainment of age 18 or age 23 if a full-time student, or if there is no widow or child, to the dependent parents.
100

NEW YORK CITY POLICE PENSION FUND
SUMMARY OF PLAN PROVISIONS (Cont’d)
VI. TERMINATION OF EMPLOYMENT
A member who either resigns or is dismissed receives a benefit equal to his Accumulated Deductions. At resignation with at least 5 years of service, the member may elect, in lieu of a return of his Accumulated Deductions, to receive a service retirement allowance reduced in proportion to his years of service. The allowance is deferred to the earliest date on which the member would have been eligible for service retirement had the member not resigned. Should a member with less than 10 years of service who elected to receive a vested retirement allowance die during the period of deferment, the benefit is the Accumulated Deductions. For a member who at resignation with at least 10 years of service, who elected to receive a deferred retirement allowance and dies before the attainment of his service retirement date, the benefit is one-half of the ordinary death benefit.
VII. DEPENDENT BENEFIT
Upon the death of a member during active service or after retirement, a pension of $600 per annum is payable to the widow until remarriage, to a child, or to the dependent parents provided that upon becoming a member, he had elected to make the additional contributions required for this benefit.
VIII. AUTOMATIC COST-OF-LIVING ADJUSTMENTS (“COLA”)
COLA benefits are payable to members who are either (1) at least age 62 and have been retired for at least 5 years or (2) at least age 55 and have been retired for at least 10 years. Additionally, COLA benefits are payable to members who retired for disability after being retired for 5 or more years and to beneficiaries receiving accidental death benefits who have been receiving them for at least 5 years.
101
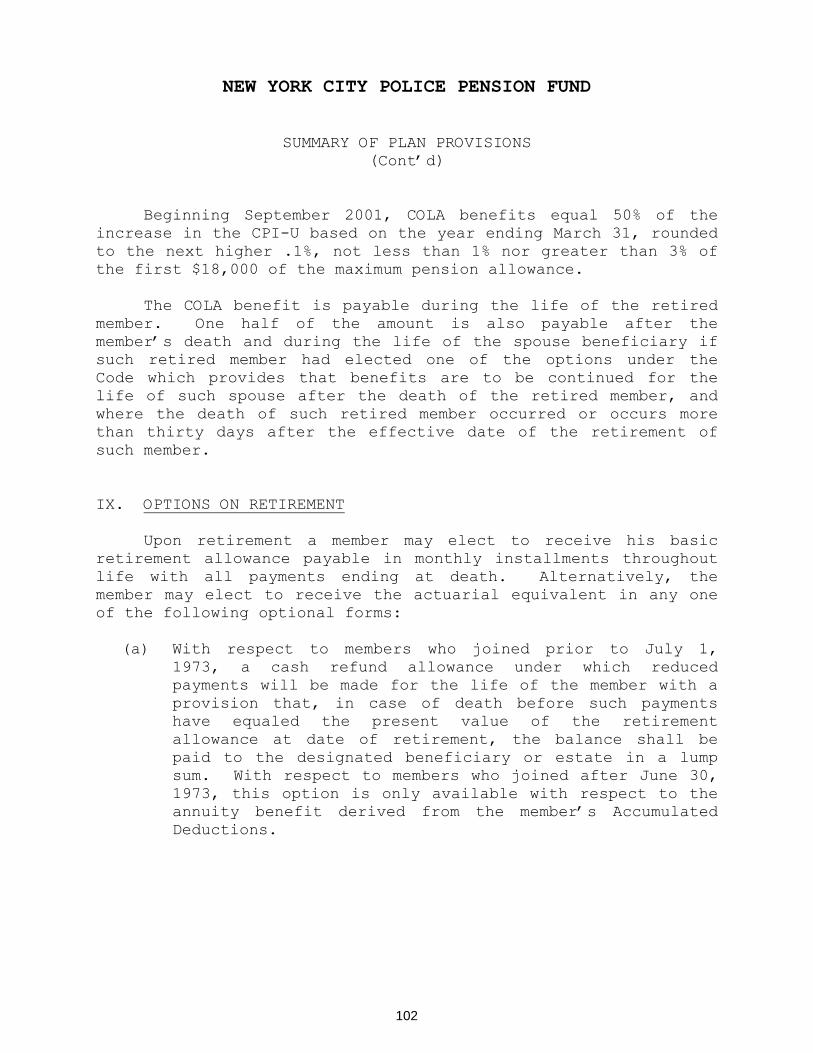
NEW YORK CITY POLICE PENSION FUND
SUMMARY OF PLAN PROVISIONS (Cont’d)
Beginning September 2001, COLA benefits equal 50% of the increase in the CPI-U based on the year ending March 31, rounded to the next higher .1%, not less than 1% nor greater than 3% of the first $18,000 of the maximum pension allowance.
The COLA benefit is payable during the life of the retired member. One half of the amount is also payable after the member’s death and during the life of the spouse beneficiary if such retired member had elected one of the options under the Code which provides that benefits are to be continued for the life of such spouse after the death of the retired member, and where the death of such retired member occurred or occurs more than thirty days after the effective date of the retirement of such member.
IX. OPTIONS ON RETIREMENT
Upon retirement a member may elect to receive his basic retirement allowance payable in monthly installments throughout life with all payments ending at death. Alternatively, the member may elect to receive the actuarial equivalent in any one of the following optional forms:
(a) With respect to members who joined prior to July 1, 1973, a cash refund allowance under which reduced payments will be made for the life of the member with a provision that, in case of death before such payments have equaled the present value of the retirement allowance at date of retirement, the balance shall be paid to the designated beneficiary or estate in a lump sum. With respect to members who joined after June 30, 1973, this option is only available with respect to the annuity benefit derived from the member’s Accumulated Deductions.
102
NEW YORK CITY POLICE PENSION FUND
SUMMARY OF PLAN PROVISIONS (Cont’d)
(b) With respect to members who join or joined after June 30, 1973, a five-year or ten-year certain and life thereafter allowance under which reduced payments will be made for the life of the member with a provision that, in case of death within the guarantee period, the benefit that would have been payable had the member survived shall continue to the designated beneficiary or estate for the balance of the guarantee period.
(c) A joint and survivor allowance under which reduced payments will be made for the life of the member with a provision that at the death of the member the same payments or one-half of such payments shall be continued for the life of such other person as the member shall have designated.
(d) Such other form of benefit which is the actuarial equivalent of the basic benefit as may be certified by the Actuary and approved by the Board of Trustees. By resolution, the Board of Trustees has approved an option under which reduced payments will be made for the life of the member with a provision that upon his death, a sum specified by the member at the time of retirement shall be paid to his designated beneficiary or estate.
3203R-POLICECAFR:PCA/aw
103

NEW YORK CITY POLICE PENSION FUND
COMPREHENSIVE ANNUAL FINANCIAL REPORT
A PENSION TRUST FUND OF THE CITY OF NEW YORK
STATISTICAL SECTION
PART V
FISCAL YEAR ENDED
June 30, 2004


NEW YORK CITY POLICE PENSION FUND
AVERAGE ANNUAL BENEFIT PAYMENT AMOUNTS
Service
Retirement Benefits
Ordinary (Non-Duty)
Disability Benefits
Accidental (Duty)
Disability Benefits
Date
Number
Average
Annual
Allowance
Number
Average
Annual
Allowance
Number
Average
Annual
Allowance
6/30/98
18,793
$21,446
4,141
$23,110
9,322
$31,835
6/30/99
18,622
22,971
4,109
24,159
9,403
33,365
6/30/00
18,689
23,821
4,056
24,249
9,478
34,069
6/30/01
19,423
27,489
4,021
28,155
9,611
38,308
6/30/02
21,394
28,346
3,986
28,466
9,837
39,019
6/30/03
22,416
29,324
3,943
28,571
10,021
39,852
3203R-POLICECAFR:PCA/aw
105

NEW YORK CITY
POLICE PENSION FUND
SCHEDULE OF BENEFIT EXPENSES BY TYPE
(In Thousands)
June 30, 2004
BENEFIT PAYMENTS
Fiscal Service & Ordinary Payments for LineYear Disability Death in Death After of Duty Total6/30 Retirement Service Retirement Deaths
1995 $675,120 $6,203 $2,070 $4,828 $688,2211996 729,956 9,503 3,528 459 743,4461997 777,973 8,313 992 3,650 790,9281998 827,670 5,901 1,319 3,913 838,8031999 871,621 2,491 7,867 8,609 890,5882000 883,069 3,537 4,137 5,586 896,3292001 1,017,966 1,831 7,001 4,365 1,031,1632002 1,101,569 5,143 1,574 8,449 1,116,7352003 1,303,153 4,374 4,265 7,360 1,319,1522004 $1,386,332 $5,317 $5,771 $7,968 $1,405,388
106

NEW YORK CITY
POLICE PENSION FUND
SCHEDULE OF RETIRED MEMBERS BY TYPE OF BENEFIT
June 30, 2004
SERVICE RETIREMENT
MALE FEMALE
NUMBER AVERAGE NUMBER AVERAGEOF ANNUAL OF ANNUAL
AGE RETIRANTS ALLOWANCE RETIRANTS ALLOWANCE
UNDER 30 0 $0 0 $030 to 34 0 0 0 035 to 39 2 31,740 0 040 to 44 1,331 32,067 225 28,00645 to 49 1,956 32,170 363 28,85550 to 54 2,047 34,397 177 30,40355 to 59 3,252 34,504 84 34,43660 to 64 4,134 31,103 72 31,79465 to 69 2,547 27,100 42 31,28170 to 74 2,028 24,667 29 24,16175 to 79 1,865 23,239 29 19,31680 to 84 1,379 21,178 24 21,60085 to 89 644 21,953 10 17,33690 & up 173 $23,452 3 $21,421
107

NEW YORK CITY
POLICE PENSION FUND
SCHEDULE OF RETIRED MEMBERS BY TYPE OF BENEFIT
June 30, 2004
ORDINARY DISABILITY (NON-DUTY) RETIREMENT
MALE FEMALE
NUMBER AVERAGE NUMBER AVERAGEOF ANNUAL OF ANNUAL
AGE RETIRANTS ALLOWANCE RETIRANTS ALLOWANCE
UNDER 30 1 $9,720 1 $13,08030 to 34 36 17,602 17 17,76435 to 39 91 21,315 61 19,15140 to 44 165 21,493 77 20,66845 to 49 114 21,993 50 22,43050 to 54 167 19,188 28 21,24955 to 59 458 19,268 14 18,16460 to 64 592 23,093 12 18,37165 to 69 372 31,666 16 18,37770 to 74 531 38,318 8 26,71375 to 79 633 36,203 8 31,17080 to 84 344 35,475 13 22,97985 to 89 113 35,924 5 40,64490 & up 16 $30,482 0 $0
108

NEW YORK CITY
POLICE PENSION FUND
SCHEDULE OF RETIRED MEMBERS BY TYPE OF BENEFIT
June 30, 2004
ACCIDENT DISABILITY RETIREMENT
MALE FEMALE
NUMBER AVERAGE NUMBER AVERAGEOF ANNUAL OF ANNUAL
AGE RETIRANTS ALLOWANCE RETIRANTS ALLOWANCE
UNDER 30 3 $34,869 0 $030 to 34 160 39,102 26 36,03535 to 39 530 41,553 109 39,73140 to 44 1,081 42,798 171 40,06145 to 49 785 43,769 105 40,40250 to 54 894 39,957 47 36,08855 to 59 1,774 38,200 44 35,19860 to 64 1,807 38,749 25 37,75865 to 69 851 40,418 11 38,19970 to 74 645 40,868 3 28,89675 to 79 563 38,612 8 39,00580 to 84 269 34,575 0 085 to 89 90 33,547 2 27,76890 & up 18 $33,469 0 $0
109

NEW YORK CITY
POLICE PENSION FUND
SERVICE OR DISABILITYSURVIVORS OF DECEASED PENSIONERS UNDER SELECTED OPTIONS
June 30, 2004
MALE FEMALE
NUMBER AVERAGE NUMBER AVERAGEOF ANNUAL OF ANNUAL
AGE BENEFICIARIES ALLOWANCE BENEFICIARIES ALLOWANCE
UNDER 30 2 $17,473 7 $18,68130 to 34 0 0 2 19,35035 to 39 0 0 11 19,42440 to 44 0 0 15 25,35745 to 49 1 27,360 11 21,14150 to 54 1 21,299 13 25,04855 to 59 1 19,095 29 21,92860 to 64 1 19,546 36 22,67065 to 69 0 0 45 18,88270 to 74 0 0 88 16,14275 to 79 0 0 124 12,18880 to 84 0 0 194 8,19085 to 89 1 14,384 357 5,46890 & up 18 $34,678 607 $3,966
110

NEW YORK CITY
POLICE PENSION FUND
SCHEDULE OF RETIRED MEMBERS BY TYPE OF BENEFIT
June 30, 2004
BENEFICIARIES OF PENSIONERS KILLED INACTUAL PERFORMANCE OF DUTY
MALE FEMALE
NUMBER AVERAGE NUMBER AVERAGEOF ANNUAL OF ANNUAL
AGE BENEFICIARIES ALLOWANCE BENEFICIARIES ALLOWANCE
UNDER 30 0 $0 10 $28,46630 to 34 0 0 6 28,24135 to 39 0 0 9 30,77540 to 44 0 0 21 29,85645 to 49 0 0 19 30,69250 to 54 0 0 33 23,64055 to 59 0 0 48 22,56660 to 64 2 29,151 50 20,46265 to 69 1 29,112 28 19,82970 to 74 2 23,806 40 19,21275 to 79 1 26,774 21 18,84480 to 84 1 26,043 17 20,78585 to 89 0 0 6 21,44990 & up 0 $0 1 $5,132
111

NEW YORK CITY
POLICE PENSION FUND
SCHEDULE OF RETIRED MEMBERS BY TYPE OF BENEFIT
June 30, 2004
ALL PENSIONERS AND BENEFICIARIES
MALE FEMALE
NUMBER AVERAGE NUMBER AVERAGEOF ANNUAL OF ANNUAL
AGE RETIRANTS ALLOWANCE RETIRANTS ALLOWANCE
UNDER 30 6 $24,879 18 $23,80630 to 34 196 35,153 51 28,37435 to 39 623 38,566 190 31,52440 to 44 2,577 35,891 509 30,94445 to 49 2,856 34,950 548 30,39050 to 54 3,109 35,175 298 29,45755 to 59 5,485 34,424 219 29,29160 to 64 6,536 32,489 195 27,14365 to 69 3,771 30,557 142 24,17570 to 74 3,206 30,187 168 18,98875 to 79 3,062 28,747 190 15,94080 to 84 1,993 25,456 248 11,12685 to 89 848 25,036 380 6,61390 & up 225 $25,651 611 $4,053
112

NEW YORK CITY
POLICE PENSION FUND
June 30, 2004
EXPENSE BY TYPE
(In Thousands)
EmployerContributions as
Fiscal Year a Percentage ofEnded Benefit Administrative Annual Covered6/30 Payments (1) Expense Refund Total Payroll
1996 $743,118 _ $328 $743,446 30.11997 790,230 _ 698 790,928 27.61998 837,802 _ 1,001 838,803 26.11999 889,961 _ 627 890,588 23.32000 895,853 _ 476 896,329 * 10.72001 1,030,239 _ 924 1,031,163 16.82002 1,116,411 _ 324 1,116,735 21.42003 1,306,299 11,395 1,458 1,319,152 25.12004 $1,393,470 $11,612 ** $306 $1,405,388 33.3
* Number does not include Balance Liability write-off of $454,023** This amount represents expenses incurred and paid by the Fund for its overhead expenses. The schedule of Administrative expenses also includes certain expenses incurred by other City agencies but paid by the City on behalf of the Fund.
113
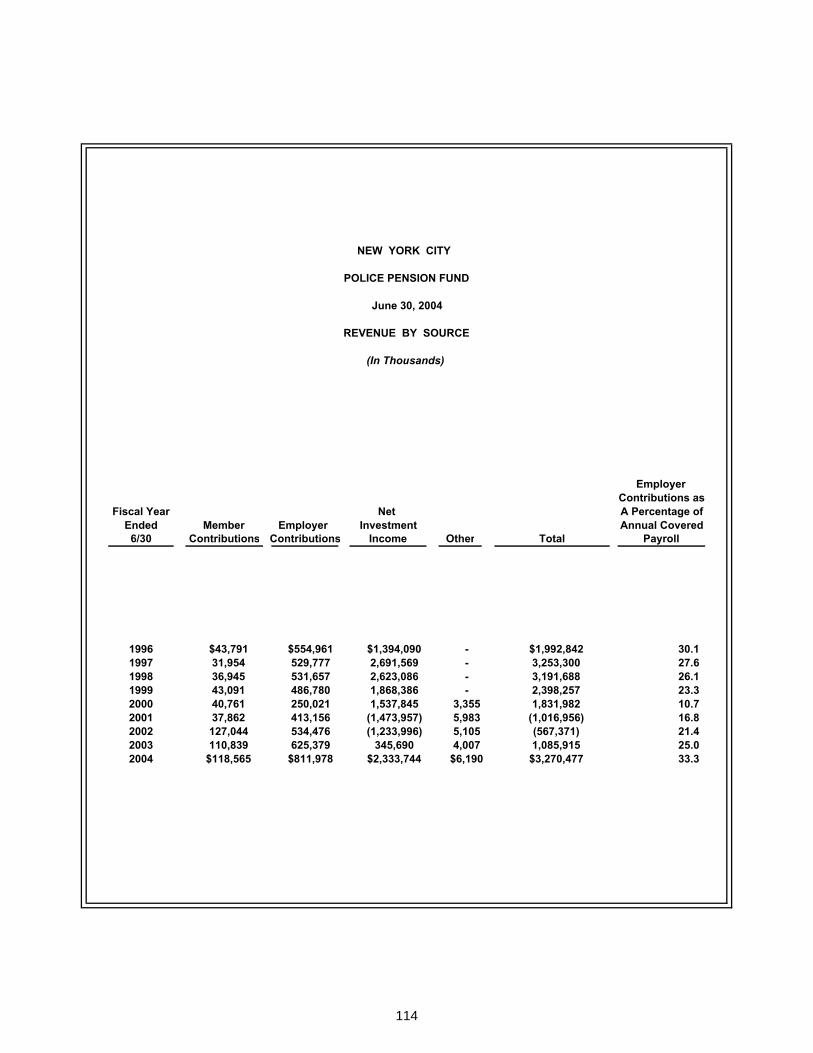
NEW YORK CITY
POLICE PENSION FUND
June 30, 2004
REVENUE BY SOURCE
(In Thousands)
EmployerContributions as
Fiscal Year Net A Percentage ofEnded Member Employer Investment Annual Covered
6/30 Contributions Contributions Income Other Total Payroll
1996 $43,791 $554,961 $1,394,090 - $1,992,842 30.1 1997 31,954 529,777 2,691,569 - 3,253,300 27.6 1998 36,945 531,657 2,623,086 - 3,191,688 26.1 1999 43,091 486,780 1,868,386 - 2,398,257 23.3 2000 40,761 250,021 1,537,845 3,355 1,831,982 10.7 2001 37,862 413,156 (1,473,957) 5,983 (1,016,956) 16.8 2002 127,044 534,476 (1,233,996) 5,105 (567,371) 21.4 2003 110,839 625,379 345,690 4,007 1,085,915 25.0 2004 $118,565 $811,978 $2,333,744 $6,190 $3,270,477 33.3
114
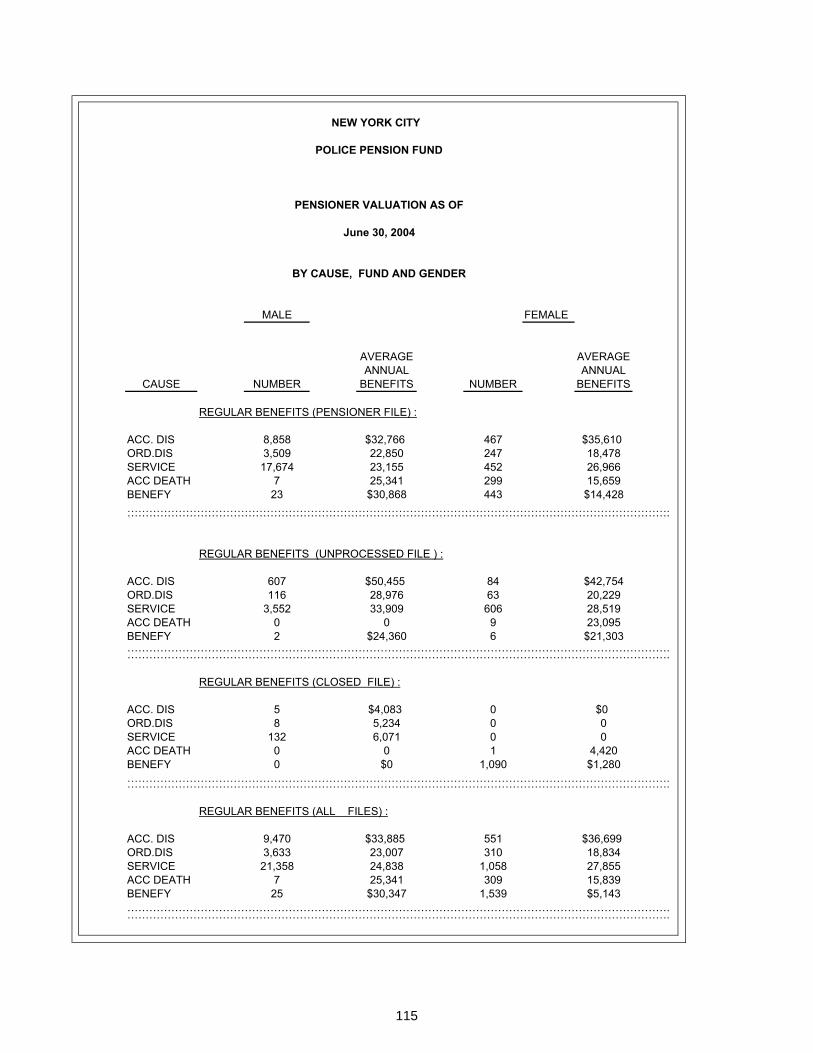
NEW YORK CITY
POLICE PENSION FUND
PENSIONER VALUATION AS OF
June 30, 2004
BY CAUSE, FUND AND GENDER
MALE FEMALE
AVERAGE AVERAGEANNUAL ANNUAL
CAUSE NUMBER BENEFITS NUMBER BENEFITS
REGULAR BENEFITS (PENSIONER FILE) :
ACC. DIS 8,858 $32,766 467 $35,610ORD.DIS 3,509 22,850 247 18,478SERVICE 17,674 23,155 452 26,966ACC DEATH 7 25,341 299 15,659BENEFY 23 $30,868 443 $14,428………………………………………………………………………………………………………………………………….………………………………………………………………………………………………………………………………….
REGULAR BENEFITS (UNPROCESSED FILE ) :
ACC. DIS 607 $50,455 84 $42,754ORD.DIS 116 28,976 63 20,229SERVICE 3,552 33,909 606 28,519ACC DEATH 0 0 9 23,095BENEFY 2 $24,360 6 $21,303………………………………………………………………………………………………………………………………….………………………………………………………………………………………………………………………………….
REGULAR BENEFITS (CLOSED FILE) :
ACC. DIS 5 $4,083 0 $0ORD.DIS 8 5,234 0 0SERVICE 132 6,071 0 0ACC DEATH 0 0 1 4,420BENEFY 0 $0 1,090 $1,280………………………………………………………………………………………………………………………………….………………………………………………………………………………………………………………………………….
REGULAR BENEFITS (ALL FILES) :
ACC. DIS 9,470 $33,885 551 $36,699ORD.DIS 3,633 23,007 310 18,834SERVICE 21,358 24,838 1,058 27,855ACC DEATH 7 25,341 309 15,839BENEFY 25 $30,347 1,539 $5,143………………………………………………………………………………………………………………………………….………………………………………………………………………………………………………………………………….
115

NEW YORK CITY
POLICE PENSION FUND
PENSIONER VALUATION AS OF
June 30, 2004
BY CAUSE, FUND AND GENDER
MALE FEMALE
AVERAGE AVERAGEANNUAL ANNUAL
CAUSE NUMBER BENEFITS NUMBER BENEFITS
SUPPLEMENTATION BENEFITS (PENSIONER FILE ) :
ACC. DIS 8,270 $6,885 394 $3,051ORD.DIS 3,370 6,656 192 3,575SERVICE 13,501 6,955 191 6,276ACC DEATH 4 2,615 262 7,930BENEFY 1 $2,151 382 $4,993……………………………………………………………………………………………………………………………………………………………………………………………………………………………………………………………………………………………………
SUPPLEMENTATION BENEFITS (UNPROCESSED FILE) :
ACC. DIS 1 $702 0 $0ORD.DIS 0 0 0 0SERVICE 0 0 0 0ACC DEATH 0 0 5 12,297BENEFY 0 $0 0 $0………………………………………………………………………………………………………………………………………………….………………………………………………………………………………………………………………………………………………….
SUPPLEMENTATION BENEFITS (CLOSED FILE) :
ACC. DIS 5 $21,029 0 $0ORD.DIS 8 14,379 0 0SERVICE 132 17,248 0 0ACC DEATH 0 0 1 712BENEFY 0 $0 1,090 $2,460………………………………………………………………………………………………………………………………………………….
SUPPLEMENTATION BENEFITS (ALL FILES ):
ACC. DIS 8,276 $6,893 394 $3,051ORD.DIS 3,378 6,675 192 3,575SERVICE 13,633 7,054 191 6,276ACC DEATH 4 2,615 268 7,984BENEFY 1 $2,151 1,472 $3,117………………………………………………………………………………………………………………………………………………….
116
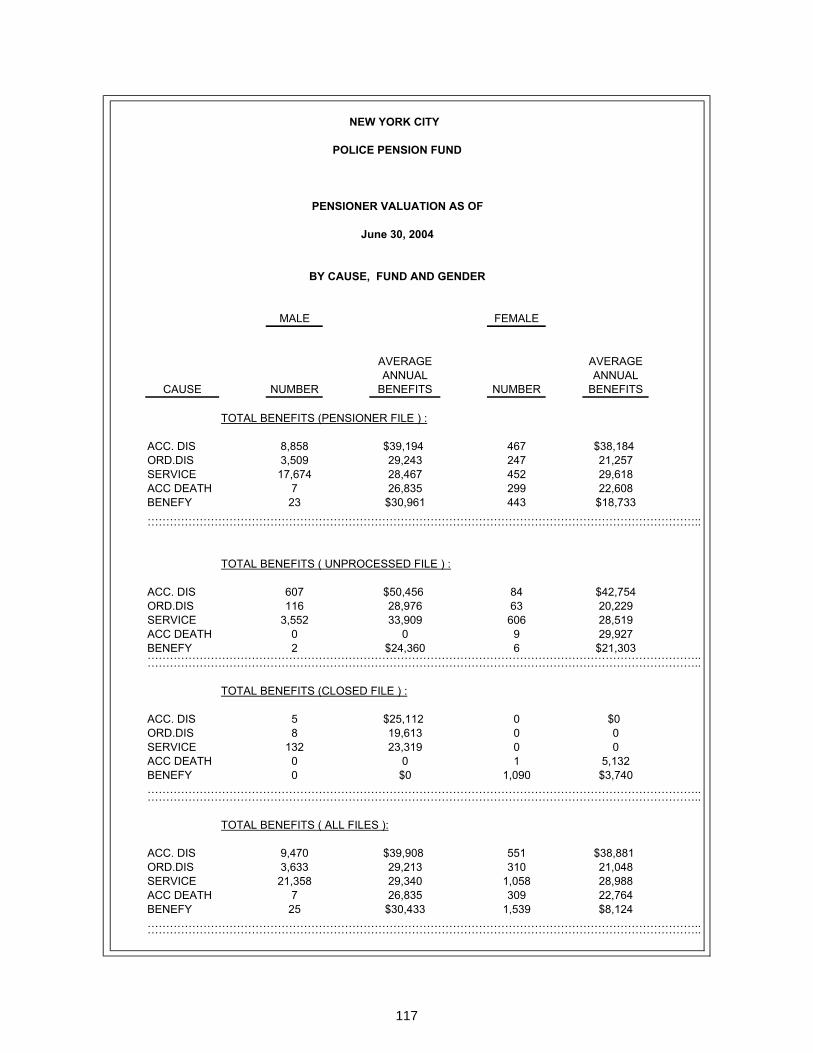
NEW YORK CITY
POLICE PENSION FUND
PENSIONER VALUATION AS OF
June 30, 2004
BY CAUSE, FUND AND GENDER
MALE FEMALE
AVERAGE AVERAGEANNUAL ANNUAL
CAUSE NUMBER BENEFITS NUMBER BENEFITS
TOTAL BENEFITS (PENSIONER FILE ) :
ACC. DIS 8,858 $39,194 467 $38,184ORD.DIS 3,509 29,243 247 21,257SERVICE 17,674 28,467 452 29,618ACC DEATH 7 26,835 299 22,608BENEFY 23 $30,961 443 $18,733…………………………………………………………………………………………………………………………………..…………………………………………………………………………………………………………………………………..
TOTAL BENEFITS ( UNPROCESSED FILE ) :
ACC. DIS 607 $50,456 84 $42,754ORD.DIS 116 28,976 63 20,229SERVICE 3,552 33,909 606 28,519ACC DEATH 0 0 9 29,927BENEFY 2 $24,360 6 $21,303…………………………………………………………………………………………………………………………………..…………………………………………………………………………………………………………………………………..
TOTAL BENEFITS (CLOSED FILE ) :
ACC. DIS 5 $25,112 0 $0ORD.DIS 8 19,613 0 0SERVICE 132 23,319 0 0ACC DEATH 0 0 1 5,132BENEFY 0 $0 1,090 $3,740…………………………………………………………………………………………………………………………………..…………………………………………………………………………………………………………………………………..
TOTAL BENEFITS ( ALL FILES ):
ACC. DIS 9,470 $39,908 551 $38,881ORD.DIS 3,633 29,213 310 21,048SERVICE 21,358 29,340 1,058 28,988ACC DEATH 7 26,835 309 22,764BENEFY 25 $30,433 1,539 $8,124…………………………………………………………………………………………………………………………………..…………………………………………………………………………………………………………………………………..
117

NEW YORK CITY
POLICE PENSION FUND
ACTIVE VALUATION AS OF
June 30, 2004
TIER: ALL GENDER: F
………………………………………………………………………………………………………………………………………………………………………………………………………AGE UNDER 5 5-9 10-14 15-19 20-24 25-29 30-34 35-39 40 & UP UNKNOWN ALL YEARS………………………………………………………………………………………………………………………………………………………………………………………………………
NUMBERS:UNDER 20 0 0 0 0 0 0 0 0 0 0 020 to 24 721 0 0 0 0 0 0 0 0 0 72125 to 29 2,693 1,027 0 0 0 0 0 0 0 0 3,72030 to 34 1,434 3,332 2,577 5 0 0 0 0 0 0 7,34835 to 39 571 1,782 3,864 2,844 5 0 0 0 0 0 9,06640 to 44 72 499 1,104 3,956 624 1 0 0 0 0 6,25645 to 49 16 47 81 1,413 644 9 1 0 0 0 2,21150 to 54 8 1 3 100 156 42 71 14 0 0 39555 to 59 1 1 0 0 4 17 63 56 0 0 14260 to 64 0 0 2 1 0 0 13 49 10 0 7565 to 69 0 1 0 1 0 0 0 0 0 0 270 & UP 0 0 2 0 2 0 0 0 1 0 5UNKNOWN 0 0 0 0 0 0 0 0 0 0 0
………………………………………………………………………………………………………………………………………………………………………………………………………TOTAL 5,516 6,690 7,633 8,320 1,435 69 148 119 11 0 29,941================================================================================================================================
SALARIES IN (THOUSANDS) :
UNDER 20 $0 $0 $0 $0 $0 $0 $0 $0 $0 $0 $020 to 24 30,550 0 0 0 0 0 0 0 0 0 30,55025 to 29 121,923 62,075 0 0 0 0 0 0 0 0 183,99830 to 34 65,252 218,702 188,345 393 0 0 0 0 0 0 472,69435 to 39 26,271 117,957 280,783 224,997 374 0 0 0 0 0 650,38340 to 44 3,527 33,114 78,513 308,482 56,693 95 0 0 0 0 480,42645 to 49 938 3,223 5,878 107,244 59,356 911 75 0 0 0 177,63050 to 54 495 105 298 7,395 13,727 4,265 7,864 1,571 0 0 35,72355 to 59 84 97 0 0 344 1,607 6,643 6,217 0 0 14,99460 to 64 0 0 196 70 0 0 1,271 5,128 1,079 0 7,74665 to 69 0 97 0 99 0 0 0 0 0 0 19670 & UP 0 0 197 0 200 0 0 0 107 0 506UNKNOWN $0 $0 0 0 0 0 0 0 0 0 0
………………………………………………………………………………………………………………………………………………………………………………………………………TOTAL $249,042 $435,375 $554,213 $648,684 $130,697 $6,878 $15,855 $12,918 $1,187 $0 $2,054,852================================================================================================================================
AVERAGE SALARIES :
UNDER 20 $0 $0 $0 $0 $0 $0 $0 $0 $0 $0 $020 to 24 42,372 0 0 0 0 0 0 0 0 0 42,37225 to 29 45,274 60,444 0 0 0 0 0 0 0 0 49,46230 to 34 45,504 65,637 73,087 78,710 0 0 0 0 0 0 64,33035 to 39 46,009 66,194 72,666 79,113 74,881 0 0 0 0 0 71,73940 to 44 48,989 66,362 71,117 77,978 90,855 95,548 0 0 0 0 76,79545 to 49 58,663 68,595 72,578 75,899 92,169 101,230 75,925 0 0 0 80,33950 to 54 61,895 105,643 99,354 73,959 87,999 101,550 110,762 112,278 0 0 90,44055 to 59 84,591 97,273 0 0 86,066 94,532 105,460 111,033 0 0 105,59960 to 64 0 0 98,299 70,682 0 0 97,807 104,662 107,930 0 103,28765 to 69 0 97,273 0 99,357 0 0 0 0 0 0 98,31570 & UP 0 0 98,820 0 100,400 0 0 0 107,897 0 101,267UNKNOWN 0 0 0 0 0 0 0 0 0 0 0
………………………………………………………………………………………………………………………………………………………………………………………………………TOTAL $45,149 $65,078 $72,608 $77,967 $91,078 $99,692 $107,132 $108,556 $107,927 $0 $68,630================================================================================================================================INCL MISSING AGE AND SERVICE OFFICE OF THE ACTUARY 09/17/03
118
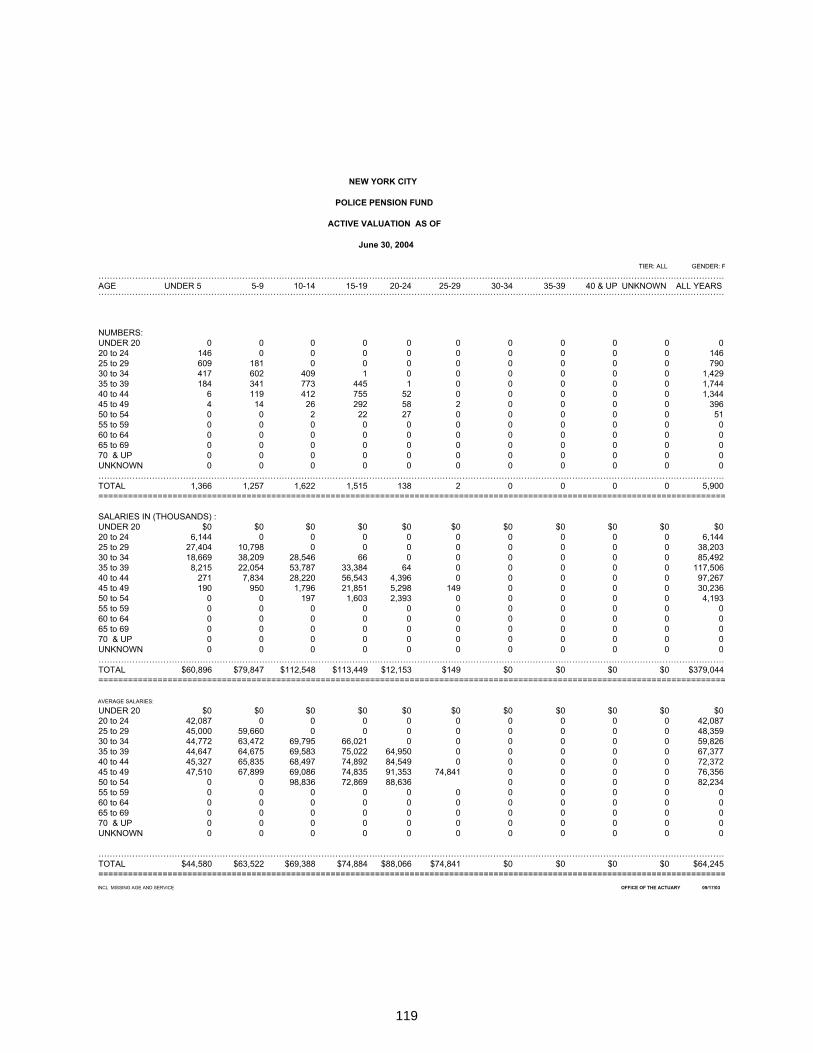
NEW YORK CITY
POLICE PENSION FUND
ACTIVE VALUATION AS OF
June 30, 2004
TIER: ALL GENDER: F……………………………………………………………………………………………………………………………………………………………………………………………………AGE UNDER 5 5-9 10-14 15-19 20-24 25-29 30-34 35-39 40 & UP UNKNOWN ALL YEARS……………………………………………………………………………………………………………………………………………………………………………………………………
NUMBERS:UNDER 20 0 0 0 0 0 0 0 0 0 0 020 to 24 146 0 0 0 0 0 0 0 0 0 14625 to 29 609 181 0 0 0 0 0 0 0 0 79030 to 34 417 602 409 1 0 0 0 0 0 0 1,42935 to 39 184 341 773 445 1 0 0 0 0 0 1,74440 to 44 6 119 412 755 52 0 0 0 0 0 1,34445 to 49 4 14 26 292 58 2 0 0 0 0 39650 to 54 0 0 2 22 27 0 0 0 0 0 5155 to 59 0 0 0 0 0 0 0 0 0 0 060 to 64 0 0 0 0 0 0 0 0 0 0 065 to 69 0 0 0 0 0 0 0 0 0 0 070 & UP 0 0 0 0 0 0 0 0 0 0 0UNKNOWN 0 0 0 0 0 0 0 0 0 0 0……………………………………………………………………………………………………………………………………………………………………………………………………TOTAL 1,366 1,257 1,622 1,515 138 2 0 0 0 0 5,900===============================================================================================================================
SALARIES IN (THOUSANDS) :UNDER 20 $0 $0 $0 $0 $0 $0 $0 $0 $0 $0 $020 to 24 6,144 0 0 0 0 0 0 0 0 0 6,14425 to 29 27,404 10,798 0 0 0 0 0 0 0 0 38,20330 to 34 18,669 38,209 28,546 66 0 0 0 0 0 0 85,49235 to 39 8,215 22,054 53,787 33,384 64 0 0 0 0 0 117,50640 to 44 271 7,834 28,220 56,543 4,396 0 0 0 0 0 97,26745 to 49 190 950 1,796 21,851 5,298 149 0 0 0 0 30,23650 to 54 0 0 197 1,603 2,393 0 0 0 0 0 4,19355 to 59 0 0 0 0 0 0 0 0 0 0 060 to 64 0 0 0 0 0 0 0 0 0 0 065 to 69 0 0 0 0 0 0 0 0 0 0 070 & UP 0 0 0 0 0 0 0 0 0 0 0UNKNOWN 0 0 0 0 0 0 0 0 0 0 0……………………………………………………………………………………………………………………………………………………………………………………………………TOTAL $60,896 $79,847 $112,548 $113,449 $12,153 $149 $0 $0 $0 $0 $379,044===============================================================================================================================
AVERAGE SALARIES:
UNDER 20 $0 $0 $0 $0 $0 $0 $0 $0 $0 $0 $020 to 24 42,087 0 0 0 0 0 0 0 0 0 42,08725 to 29 45,000 59,660 0 0 0 0 0 0 0 0 48,35930 to 34 44,772 63,472 69,795 66,021 0 0 0 0 0 0 59,82635 to 39 44,647 64,675 69,583 75,022 64,950 0 0 0 0 0 67,37740 to 44 45,327 65,835 68,497 74,892 84,549 0 0 0 0 0 72,37245 to 49 47,510 67,899 69,086 74,835 91,353 74,841 0 0 0 0 76,35650 to 54 0 0 98,836 72,869 88,636 0 0 0 0 82,23455 to 59 0 0 0 0 0 0 0 0 0 0 060 to 64 0 0 0 0 0 0 0 0 0 0 065 to 69 0 0 0 0 0 0 0 0 0 0 070 & UP 0 0 0 0 0 0 0 0 0 0 0UNKNOWN 0 0 0 0 0 0 0 0 0 0 0
……………………………………………………………………………………………………………………………………………………………………………………………………TOTAL $44,580 $63,522 $69,388 $74,884 $88,066 $74,841 $0 $0 $0 $0 $64,245===============================================================================================================================INCL MISSING AGE AND SERVICE OFFICE OF THE ACTUARY 09/17/03
119
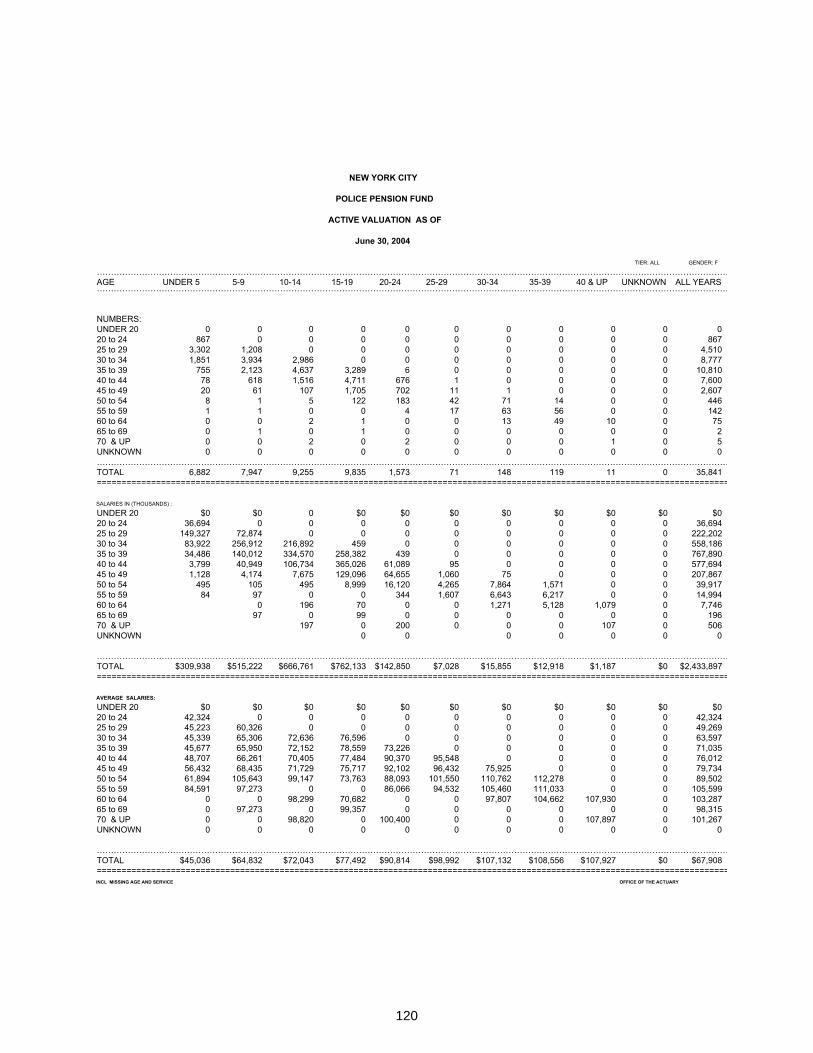
NEW YORK CITY
POLICE PENSION FUND
ACTIVE VALUATION AS OF
June 30, 2004
TIER: ALL GENDER: F
………………………………………………………………………………………………………………………………………………………………………………………………………AGE UNDER 5 5-9 10-14 15-19 20-24 25-29 30-34 35-39 40 & UP UNKNOWN ALL YEARS………………………………………………………………………………………………………………………………………………………………………………………………………
NUMBERS:UNDER 20 0 0 0 0 0 0 0 0 0 0 020 to 24 867 0 0 0 0 0 0 0 0 0 86725 to 29 3,302 1,208 0 0 0 0 0 0 0 0 4,51030 to 34 1,851 3,934 2,986 0 0 0 0 0 0 0 8,77735 to 39 755 2,123 4,637 3,289 6 0 0 0 0 0 10,81040 to 44 78 618 1,516 4,711 676 1 0 0 0 0 7,60045 to 49 20 61 107 1,705 702 11 1 0 0 0 2,60750 to 54 8 1 5 122 183 42 71 14 0 0 44655 to 59 1 1 0 0 4 17 63 56 0 0 14260 to 64 0 0 2 1 0 0 13 49 10 0 7565 to 69 0 1 0 1 0 0 0 0 0 0 270 & UP 0 0 2 0 2 0 0 0 1 0 5UNKNOWN 0 0 0 0 0 0 0 0 0 0 0………………………………………………………………………………………………………………………………………………………………………………………………………TOTAL 6,882 7,947 9,255 9,835 1,573 71 148 119 11 0 35,841================================================================================================================================
SALARIES IN (THOUSANDS) :
UNDER 20 $0 $0 0 $0 $0 $0 $0 $0 $0 $0 $020 to 24 36,694 0 0 0 0 0 0 0 0 0 36,69425 to 29 149,327 72,874 0 0 0 0 0 0 0 0 222,20230 to 34 83,922 256,912 216,892 459 0 0 0 0 0 0 558,18635 to 39 34,486 140,012 334,570 258,382 439 0 0 0 0 0 767,89040 to 44 3,799 40,949 106,734 365,026 61,089 95 0 0 0 0 577,69445 to 49 1,128 4,174 7,675 129,096 64,655 1,060 75 0 0 0 207,86750 to 54 495 105 495 8,999 16,120 4,265 7,864 1,571 0 0 39,91755 to 59 84 97 0 0 344 1,607 6,643 6,217 0 0 14,99460 to 64 0 196 70 0 0 1,271 5,128 1,079 0 7,74665 to 69 97 0 99 0 0 0 0 0 0 19670 & UP 197 0 200 0 0 0 107 0 506UNKNOWN 0 0 0 0 0 0 0
………………………………………………………………………………………………………………………………………………………………………………………………………TOTAL $309,938 $515,222 $666,761 $762,133 $142,850 $7,028 $15,855 $12,918 $1,187 $0 $2,433,897================================================================================================================================
AVERAGE SALARIES:
UNDER 20 $0 $0 $0 $0 $0 $0 $0 $0 $0 $0 $020 to 24 42,324 0 0 0 0 0 0 0 0 0 42,32425 to 29 45,223 60,326 0 0 0 0 0 0 0 0 49,26930 to 34 45,339 65,306 72,636 76,596 0 0 0 0 0 0 63,59735 to 39 45,677 65,950 72,152 78,559 73,226 0 0 0 0 0 71,03540 to 44 48,707 66,261 70,405 77,484 90,370 95,548 0 0 0 0 76,01245 to 49 56,432 68,435 71,729 75,717 92,102 96,432 75,925 0 0 0 79,73450 to 54 61,894 105,643 99,147 73,763 88,093 101,550 110,762 112,278 0 0 89,50255 to 59 84,591 97,273 0 0 86,066 94,532 105,460 111,033 0 0 105,59960 to 64 0 0 98,299 70,682 0 0 97,807 104,662 107,930 0 103,28765 to 69 0 97,273 0 99,357 0 0 0 0 0 0 98,31570 & UP 0 0 98,820 0 100,400 0 0 0 107,897 0 101,267UNKNOWN 0 0 0 0 0 0 0 0 0 0 0
………………………………………………………………………………………………………………………………………………………………………………………………………TOTAL $45,036 $64,832 $72,043 $77,492 $90,814 $98,992 $107,132 $108,556 $107,927 $0 $67,908================================================================================================================================INCL MISSING AGE AND SERVICE OFFICE OF THE ACTUARY
120