total fund overview - comptroller.nyc.gov · total fund overview. new york city. fire department...
TRANSCRIPT

New York City Fire Department Pension Fund, Subchapter TwoPerformance Overview as of March 31, 2012
Total Fund Overview
New York CityFire Department Pension Fund, Subchapter TwoPerformance Overview as of March 31, 2012
New York City Fire Department Pension Fund, Subchapter TwoPerformance Overview as of March 31, 2012
Table of Contents:
New York CityFire Department Pension Fund, Subchapter Two
Equity Analysis
Fixed Income Analysis
Appendix
2
New York City Fire Department Pension Fund, Subchapter TwoPerformance Overview as of March 31, 2012
Consultant’s Commentary
Through March 31, 2012
3
Equity MarketsDuring the first quarter equity markets posted positive results as “risk” assets continued to be in favor with both institutional andretail investors. The quarter started out with a strong January-February rally, as investors shook off concerns about the Europeandebt crisis and continued turmoil in the middle-east. However, the non-US equity and bond markets began pulling back in Marchas mixed economic data from China and rising interest rates started to negatively impact asset prices.
In the early part of the quarter investors continued to responded favorably to improving economic data. As indicators increasinglypointed towards improvements in the unemployment picture, further recovery of the US housing market and moderate US GDPgrowth, the primary beneficiaries were those market segments deemed as riskier and investors pulled away from the safe havenof US Treasuries. Emerging markets out-paced developed markets. The more cyclically sensitive sectors (energy, industrials,materials) outperformed their defensive counterparts (utilities, telecommunications, consumer staples). Across the board, growthoutperformed value.
Fixed Income MarketsFixed Income markets delivered mixed results, as higher-risk segments of the market out-performed the more interest-ratesensitive segments during the quarter. US Treasury rates spiked at the end of March and into April, driving negative results formost bond categories in the last month of the quarter. For the full quarter, US high yield and local currency emerging marketsdebt were among the best performing sectors. US high grade credit led investment grade sectors, with the financial sector drivingreturns. Riskier segments of bond markets seemed to shrug off persistent concerns over the still unsettled problems brewing inthe Eurozone, providing fuel for the rally.
During the quarter, the BC Aggregate Index returned 0.3%, reflecting negative performance in governments and agencysecurities. Long-term US Treasuries and TIPS continue to be the best performing fixed income segments for the year, with bothreturning well over 20%. Overall, the profile of the Treasury yield curve ended the quarter much flatter vs. one-year ago,particularly on the longer end, as yields declined over most of 2011.
New York City Fire Department Pension Fund, Subchapter TwoPerformance Overview as of March 31, 2012
Consultant’s Commentary
Through March 31, 2012
4
Despite posting a negative return in March, the JP Morgan GBI-EM Global Diversified Index (unhedged), which tracks theperformance of local currency emerging sovereign debt, was up 8.3% in the first quarter. The underlying bond markets inemerging countries performed well across most regions; however, emerging currencies were weak against a stronger dollarthrough most of the quarter.
Commodity MarketsDespite a negative return in March, the Dow Jones UBS Commodity Index (DJ-UBS) posted a positive first quarter return of0.9%. During the first quarter the divergence of returns between the Goldman Sachs Commodity Index (GSCI) and the DJ-UBScontinued, with the returning 5.9% for the quarter to outperform the DJ-UBS by 5%. The GSCI has continued to benefit from itshigher weight to energy, as that part of the commodities market experienced gains.
Private MarketsUS private equity markets continued to perform well into the first quarter. As previously reported, the broad private equitymarkets saw $123 billion of new commitments during 2011. This amount is nearly 22% higher than in 2010, with the increasepredominantly coming from new buyout funds being seeded, positioning long-term private capital for eventual economic recovery.However, the 2011 US private equity commitments were still no more than one-third of the amount of annual capital that wascommitted to new funds during the peak years of 2006–2008. Despite the ongoing dislocation in the European Union, Europeanprivate equity markets saw an even larger increase in the amounts committed to new funds in 2011 at $53 billion, with a blend ofbuyout and distressed funds being raised to take advantage of the dislocation and potential asset sales in the banking sector.
Core real estate continued its strong performance run, with the NCREIF Property Index posting a +2.6 return and the ODCEIndex returning +2.8%. While non-core distressed properties continued to deliver mixed results, property fundamentals in the UScontinued to improve moderately, with occupancies and new rental rates generally stable-to-increasing relative to 2011, but newdevelopment remaining challenged. In the core market, capitalization rates and property values have been approaching peakvalues, and average income yields remain attractive relative to high grade fixed income markets. Spreads between core real
New York City Fire Department Pension Fund, Subchapter TwoPerformance Overview as of March 31, 2012
Consultant’s Commentary
Through March 31, 2012
estate income yields and the five-year US Treasury (currently close to 500 bps) are still near all-time highs. Moderate capitalflows, both equity and debt, continue into the core market. Open-end core real estate funds still have multiple-quarter entrancequeues.
Non-core real estate valuations continue to lag. In this segment properties remain priced 25%–40% below peak values as manyowners struggle to recapitalize. Fundraising remains difficult, with volumes still well below peak levels, and limited debt capitalavailable from traditional sources to help restructure over-levered balance sheets. We believe that the distress in the non-coremarket will continue through the remainder of 2012, presenting an opportunity for investors who are able to take on illiquidity. Weview two broad strategies to be attractive: recapitalization (loan-to-loan) and control (loan-to-own). The recapitalization strategyprovides gap financing to restructure properties, with generally a value add type risk/return profile. The control strategyrepresents an opportunistic risk/return profile that requires expertise in foreclosure, bankruptcy, restructuring, and repositioning.
Asset Allocation: As of March 31, 2012 the Fund’s commitment to equity (including domestic, international, emerging, andopportunistic) was 58.8%, which was ahead of the Fund’s long-term policy target of 48.5% and ahead of the equity allocation ofthe median Public Fund in the ICC Universe (53.7%). In fixed income, the Fund’s 29.6% allocation was behind the new long-termtarget of 35.5% (core bonds, high yield, convertibles, global fixed income, TIPS and Opportunistic Fixed). The Fund’s equitycommitment was ahead of the median Public Fund in the ICC universe (53.7%).
Performance: For the quarter, the Fund returned +8.1% and ranked in the 1st quartile of the BNY Mellon Public Master Trustuniverse and 2nd quartile of the ICC’s Public Funds universe. Active managers detracted 0.4% of return from aggregateperformance during the quarter, and allocation decisions added 0.5% to Total Fund return. For the year, the Fund returned+4.0%, ranking close to median in the BNY Mellon Public Master Trust universe and in the 3rd quartile of the ICC Public Fundsuniverse. Active managers detracted 134 basis points over the trailing year, and deviations from policy detracted 48 basis pointsto overall returns.
5
New York City Fire Department Pension Fund, Subchapter TwoPerformance Overview as of March 31, 2012
Consultant’s Commentary
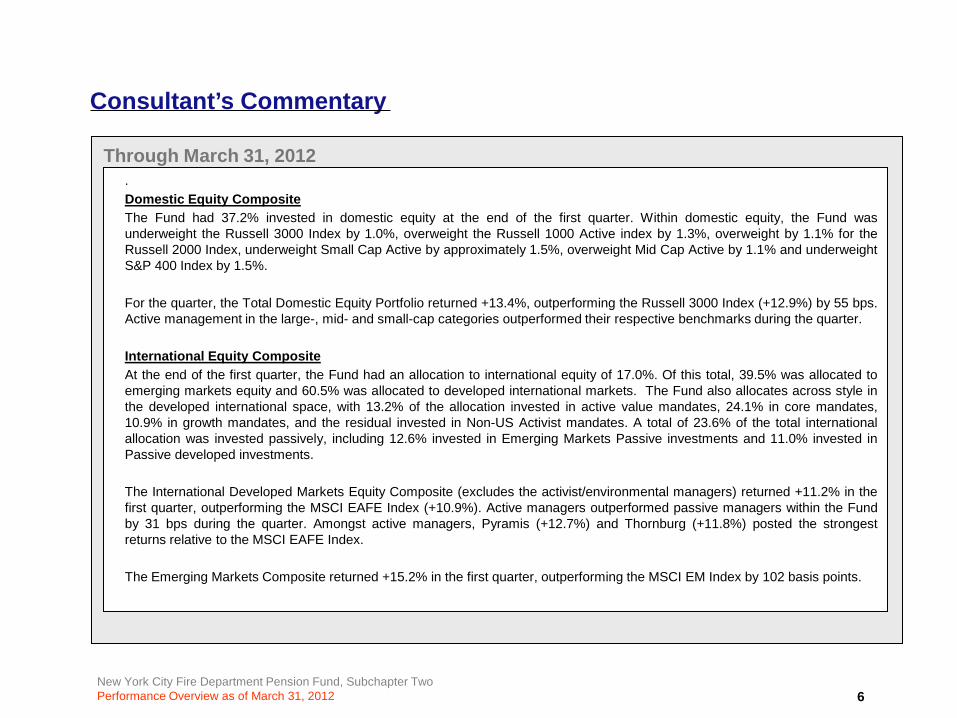
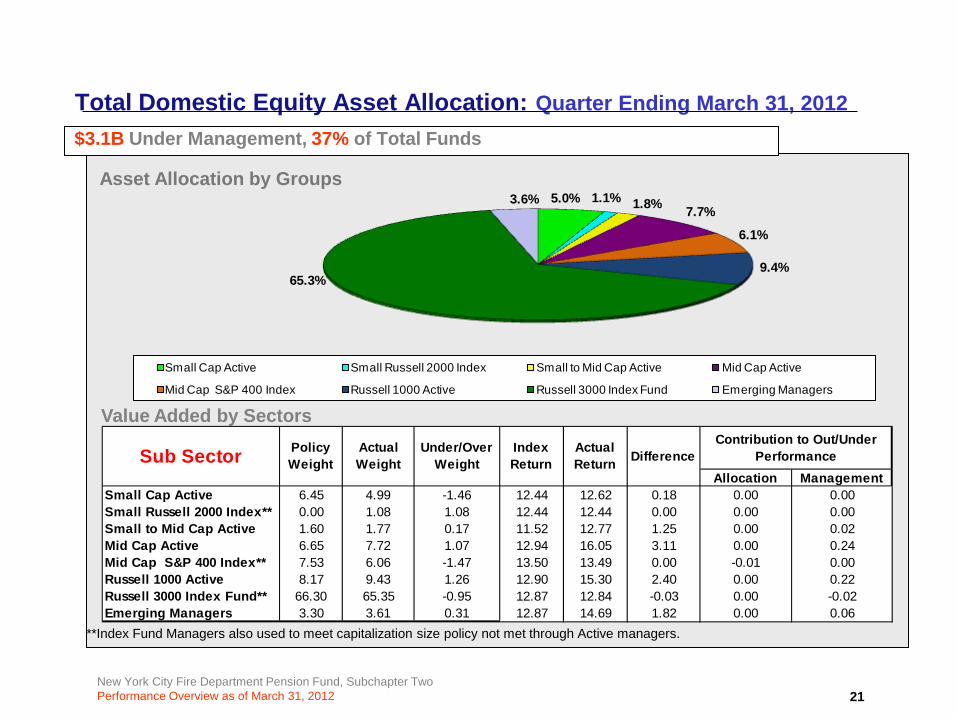
Through March 31, 2012.Domestic Equity CompositeThe Fund had 37.2% invested in domestic equity at the end of the first quarter. Within domestic equity, the Fund wasunderweight the Russell 3000 Index by 1.0%, overweight the Russell 1000 Active index by 1.3%, overweight by 1.1% for theRussell 2000 Index, underweight Small Cap Active by approximately 1.5%, overweight Mid Cap Active by 1.1% and underweightS&P 400 Index by 1.5%.
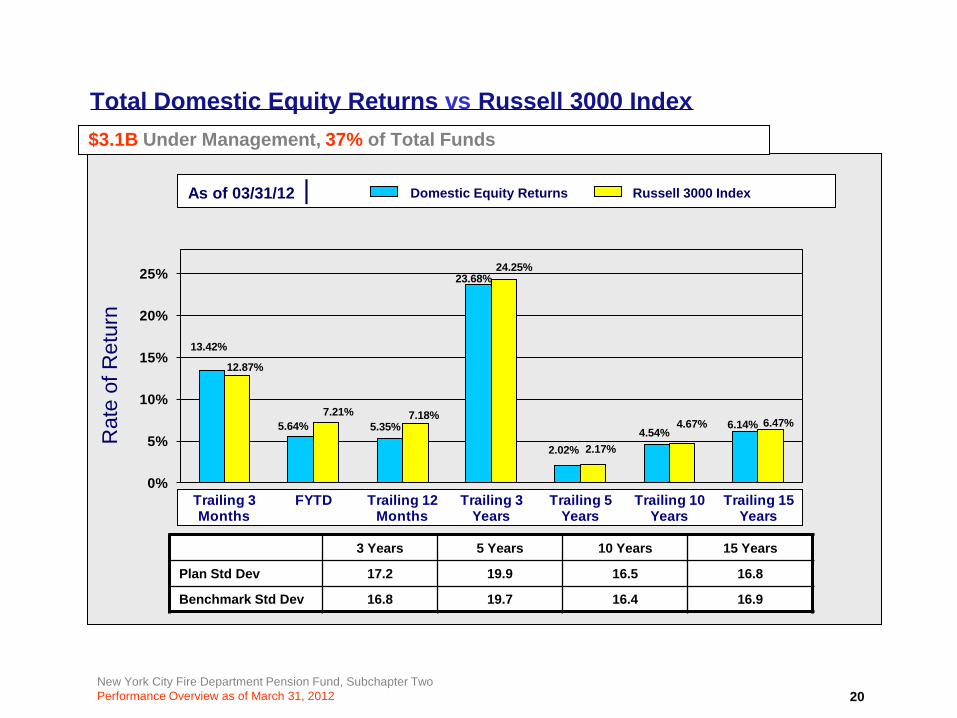
For the quarter, the Total Domestic Equity Portfolio returned +13.4%, outperforming the Russell 3000 Index (+12.9%) by 55 bps.Active management in the large-, mid- and small-cap categories outperformed their respective benchmarks during the quarter.
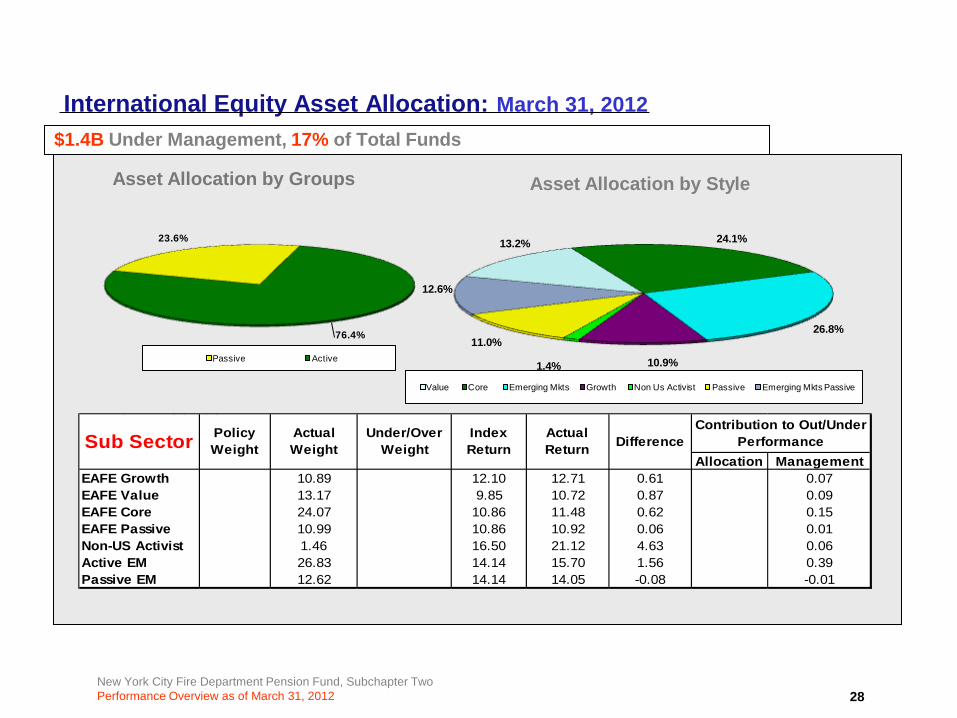
International Equity CompositeAt the end of the first quarter, the Fund had an allocation to international equity of 17.0%. Of this total, 39.5% was allocated toemerging markets equity and 60.5% was allocated to developed international markets. The Fund also allocates across style inthe developed international space, with 13.2% of the allocation invested in active value mandates, 24.1% in core mandates,10.9% in growth mandates, and the residual invested in Non-US Activist mandates. A total of 23.6% of the total internationalallocation was invested passively, including 12.6% invested in Emerging Markets Passive investments and 11.0% invested inPassive developed investments.
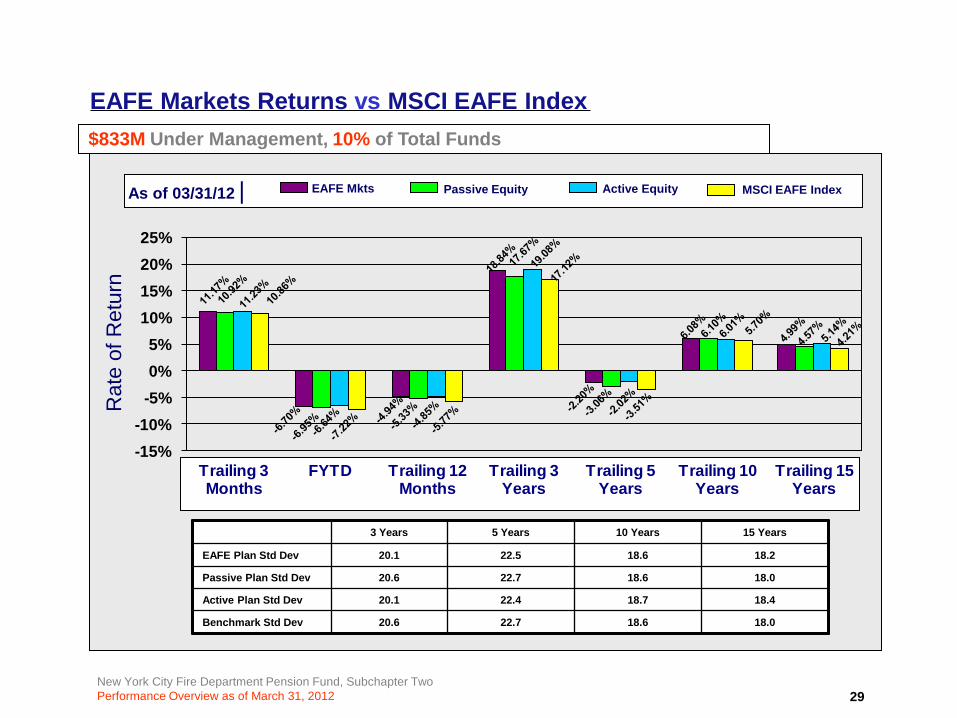
The International Developed Markets Equity Composite (excludes the activist/environmental managers) returned +11.2% in thefirst quarter, outperforming the MSCI EAFE Index (+10.9%). Active managers outperformed passive managers within the Fundby 31 bps during the quarter. Amongst active managers, Pyramis (+12.7%) and Thornburg (+11.8%) posted the strongestreturns relative to the MSCI EAFE Index.
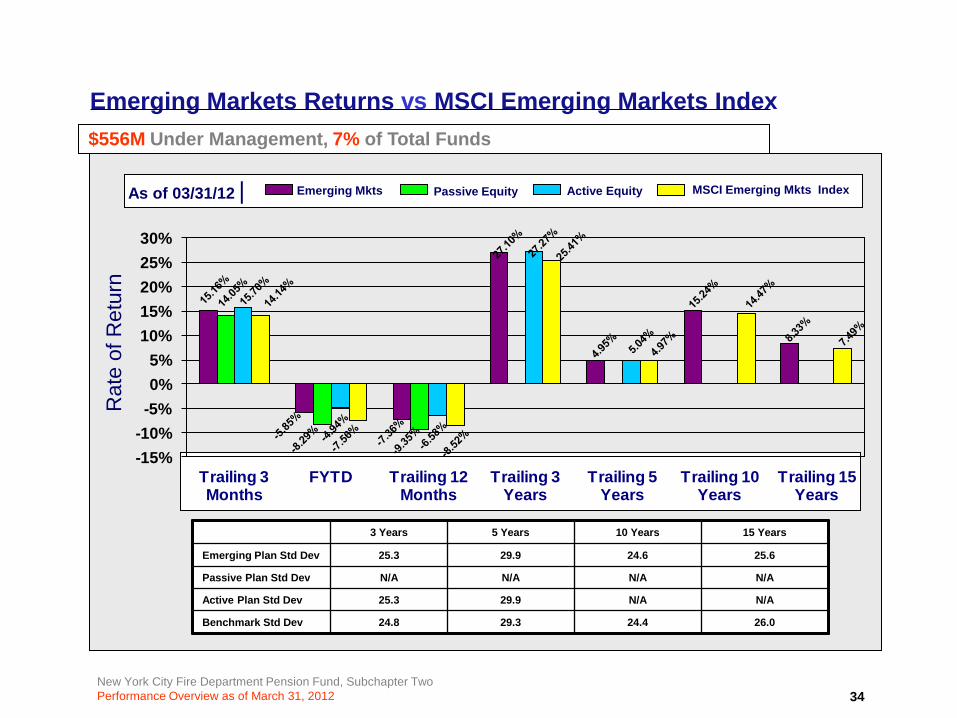
The Emerging Markets Composite returned +15.2% in the first quarter, outperforming the MSCI EM Index by 102 basis points.
6
New York City Fire Department Pension Fund, Subchapter TwoPerformance Overview as of March 31, 2012
Consultant’s Commentary
Through March 31, 2012
7
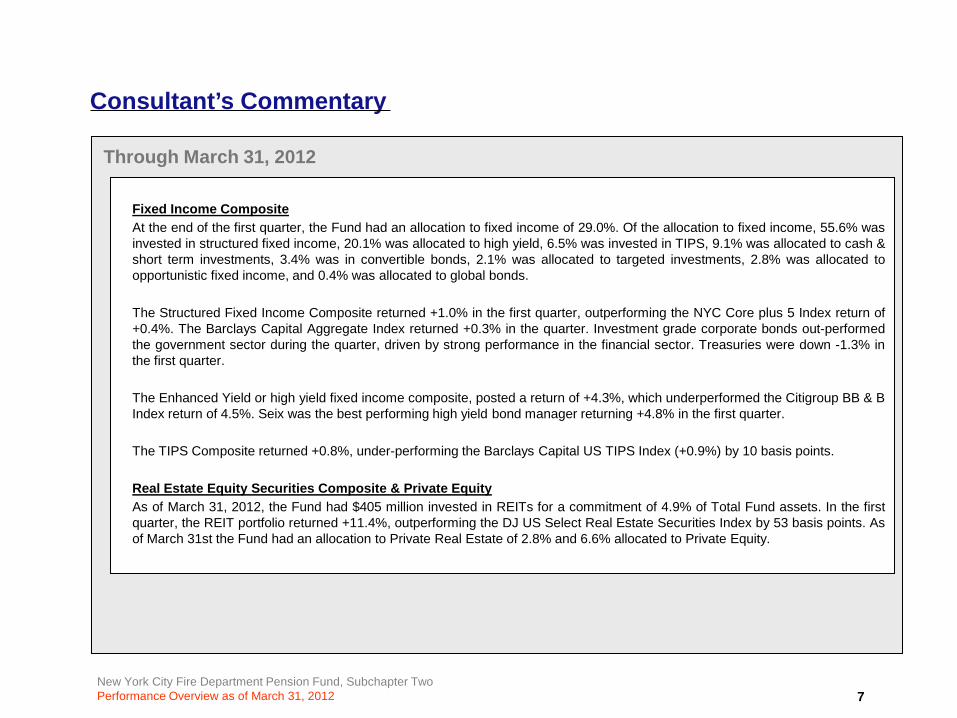
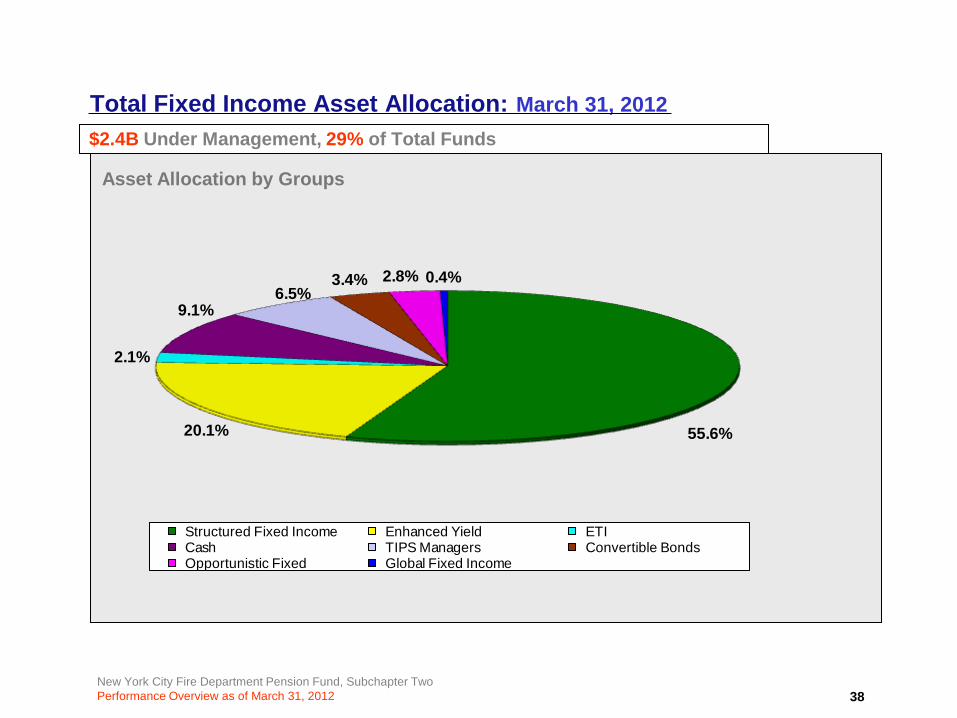
Fixed Income CompositeAt the end of the first quarter, the Fund had an allocation to fixed income of 29.0%. Of the allocation to fixed income, 55.6% wasinvested in structured fixed income, 20.1% was allocated to high yield, 6.5% was invested in TIPS, 9.1% was allocated to cash &short term investments, 3.4% was in convertible bonds, 2.1% was allocated to targeted investments, 2.8% was allocated toopportunistic fixed income, and 0.4% was allocated to global bonds.
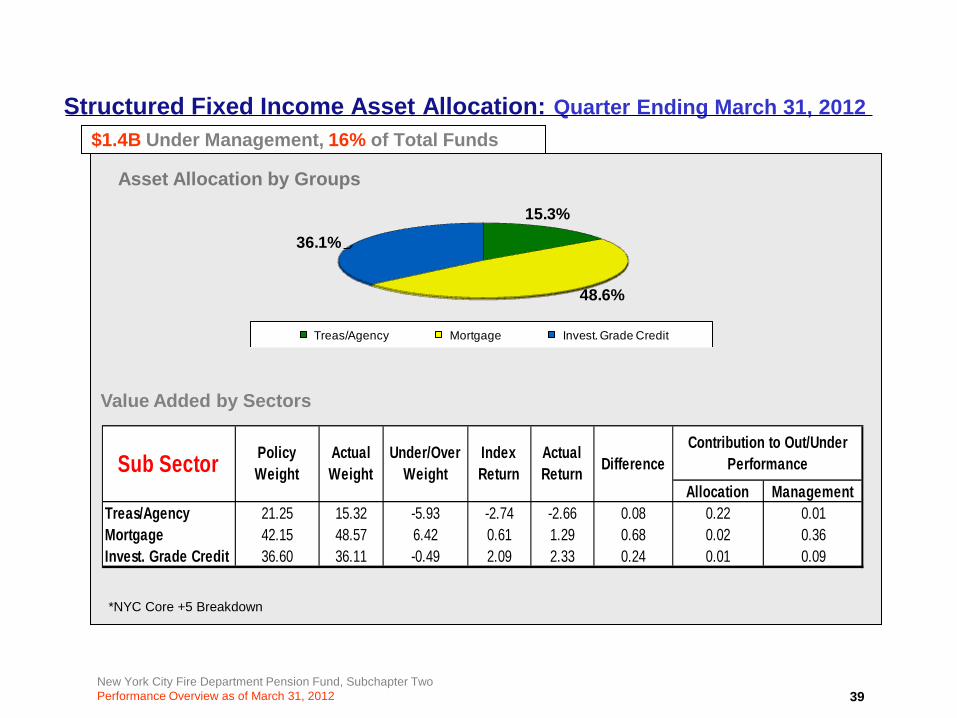
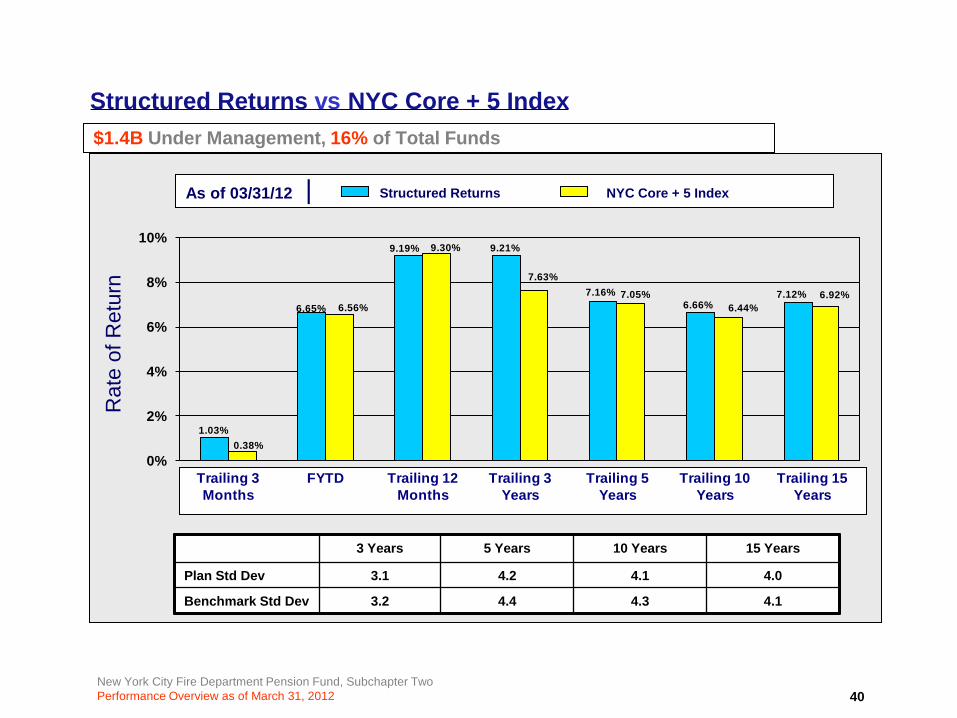
The Structured Fixed Income Composite returned +1.0% in the first quarter, outperforming the NYC Core plus 5 Index return of+0.4%. The Barclays Capital Aggregate Index returned +0.3% in the quarter. Investment grade corporate bonds out-performedthe government sector during the quarter, driven by strong performance in the financial sector. Treasuries were down -1.3% inthe first quarter.
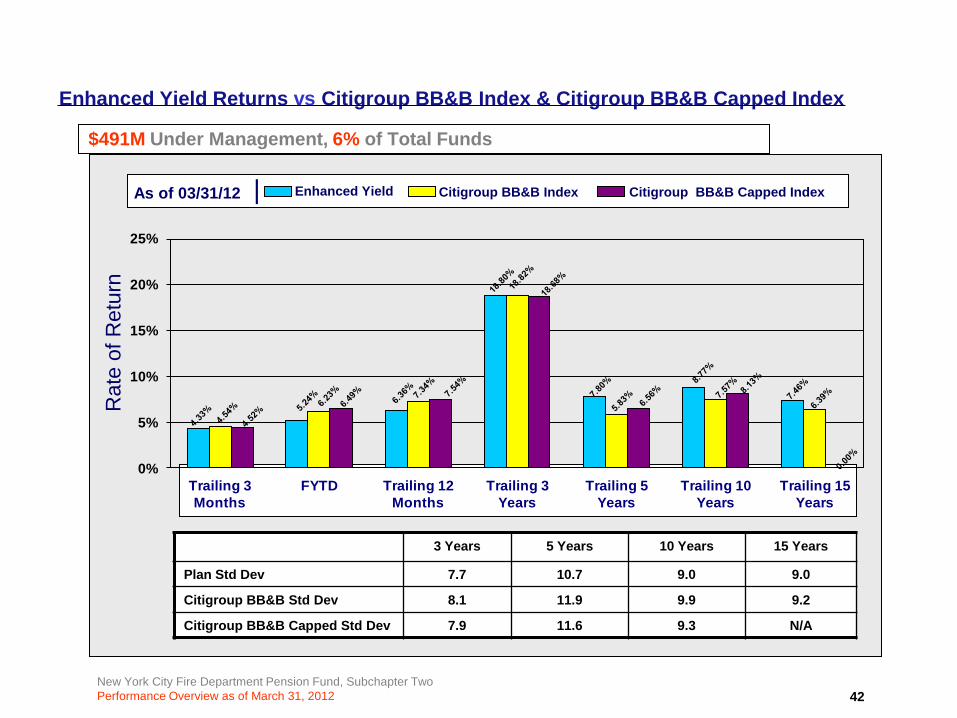
The Enhanced Yield or high yield fixed income composite, posted a return of +4.3%, which underperformed the Citigroup BB & BIndex return of 4.5%. Seix was the best performing high yield bond manager returning +4.8% in the first quarter.
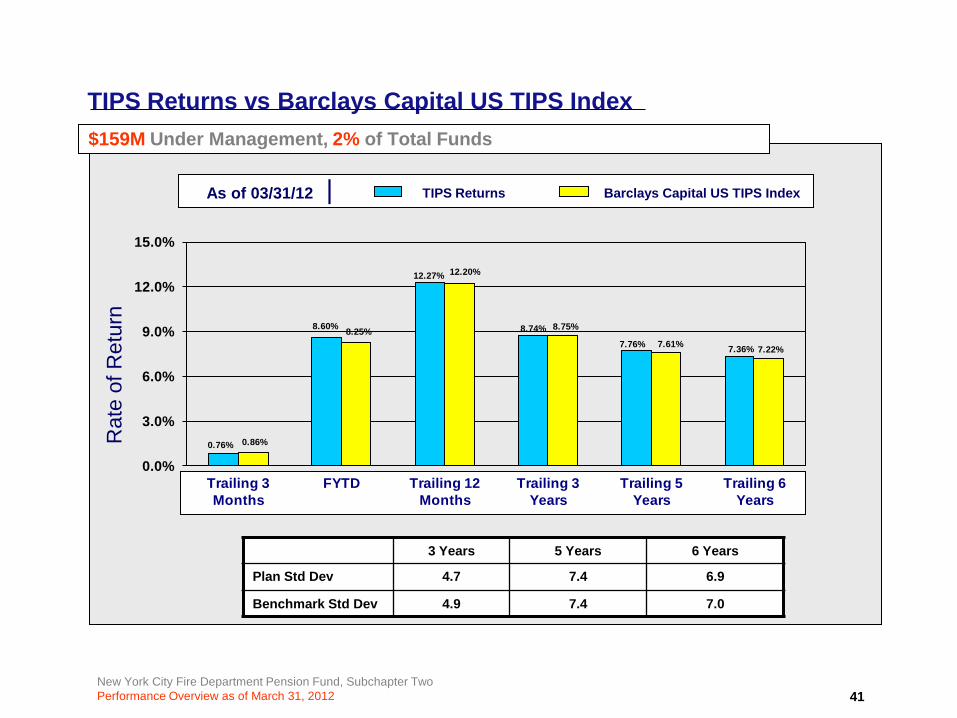
The TIPS Composite returned +0.8%, under-performing the Barclays Capital US TIPS Index (+0.9%) by 10 basis points.
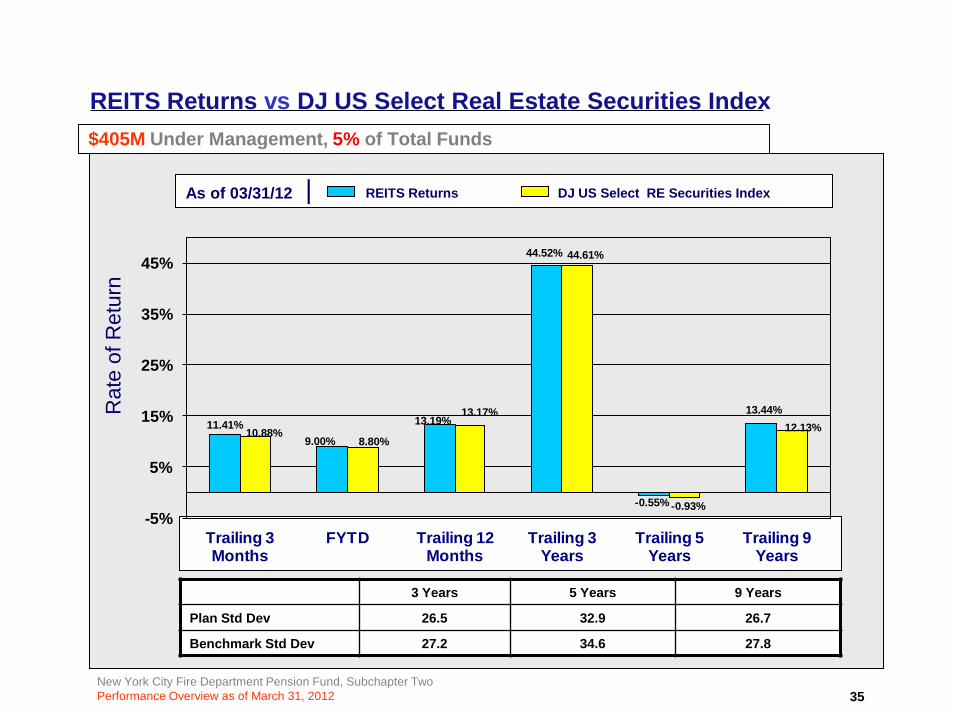
Real Estate Equity Securities Composite & Private EquityAs of March 31, 2012, the Fund had $405 million invested in REITs for a commitment of 4.9% of Total Fund assets. In the firstquarter, the REIT portfolio returned +11.4%, outperforming the DJ US Select Real Estate Securities Index by 53 basis points. Asof March 31st the Fund had an allocation to Private Real Estate of 2.8% and 6.6% allocated to Private Equity.
New York City Fire Department Pension Fund, Subchapter TwoPerformance Overview as of March 31, 2012
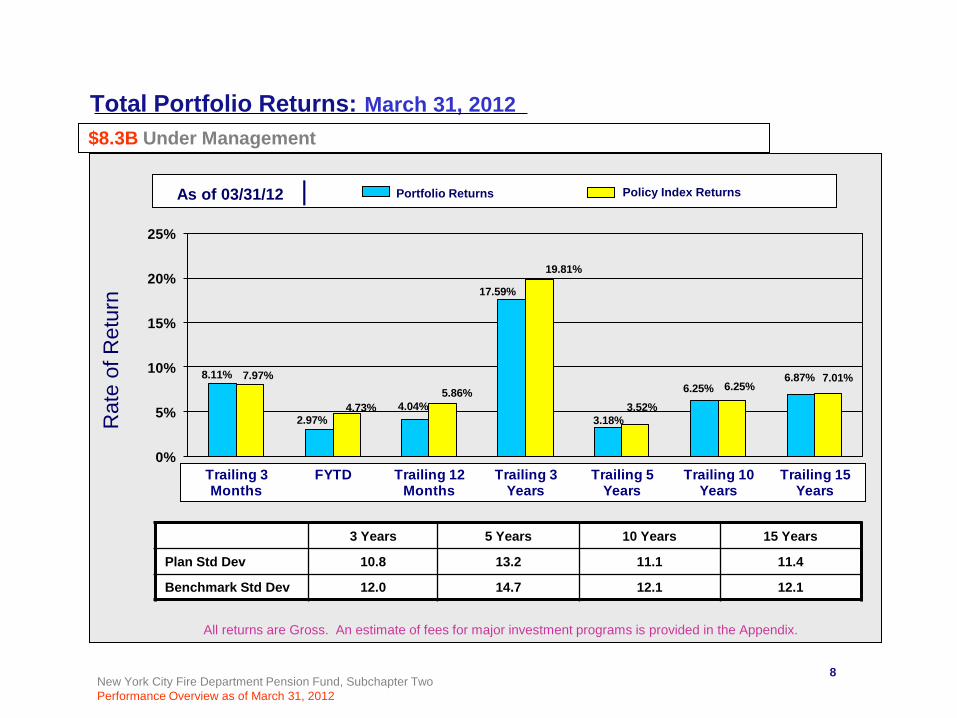
$8.3B Under Management
Total Portfolio Returns: March 31, 2012
8.11%
2.97%4.04%
17.59%
3.18%
6.25%6.87%7.97%
4.73%5.86%
19.81%
3.52%
6.25%7.01%
0%
5%
10%
15%
20%
25%
Trailing 3 Months
FYTD Trailing 12 Months
Trailing 3 Years
Trailing 5 Years
Trailing 10 Years
Trailing 15 Years
Rat
e of
Ret
urn
As of 03/31/12 |
3 Years 5 Years 10 Years 15 Years
Plan Std Dev 10.8 13.2 11.1 11.4
Benchmark Std Dev 12.0 14.7 12.1 12.1
All returns are Gross. An estimate of fees for major investment programs is provided in the Appendix.
8
Portfolio Returns Policy Index Returns
New York City Fire Department Pension Fund, Subchapter TwoPerformance Overview as of March 31, 2012
-2.7% -2.7%
2.7%
0.00%
1.9% 1.6%
-2.2% -2.5% -1.1%
0.4% 0.0%
-0.7%
0.0%
2.9%
-8.00%-6.00%-4.00%-2.00%0.00%2.00%4.00%6.00%8.00%
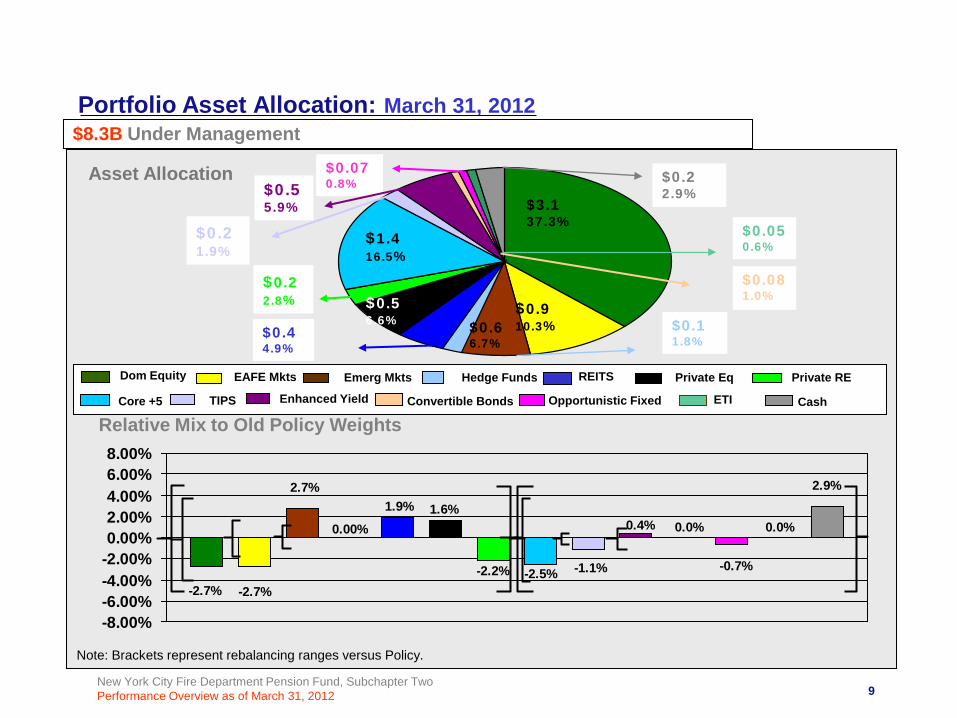
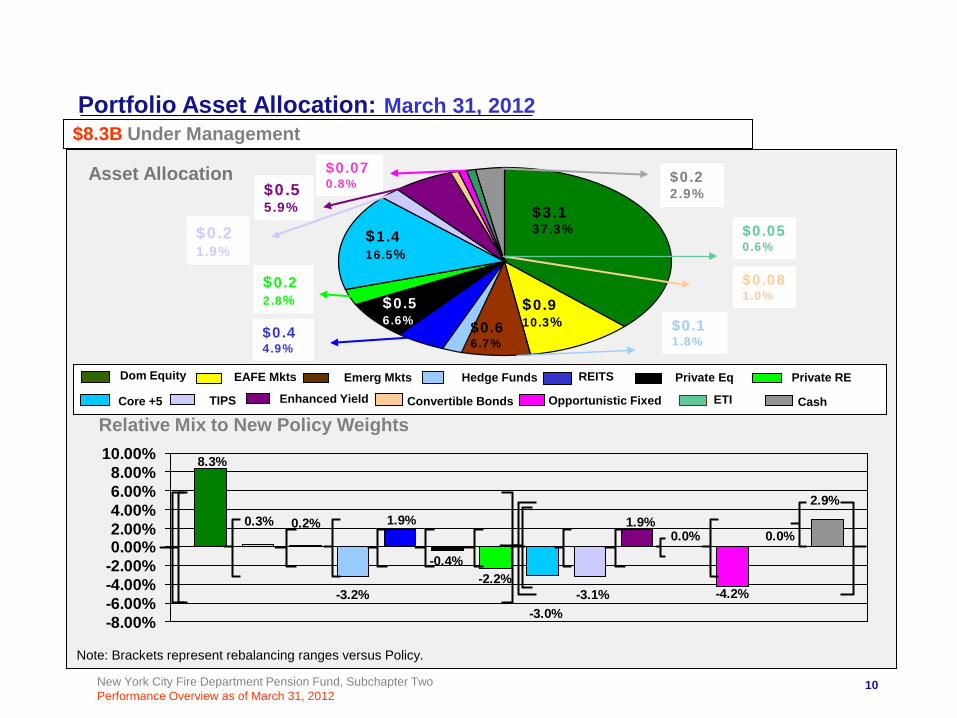
$8.3B Under ManagementPortfolio Asset Allocation: March 31, 2012
Asset Allocation
Relative Mix to Old Policy Weights
$3.1 37.3%
$1.416.5%
$0.910.3%$0.6
6.7%
$0.56.6%
$0.4 4.9%
Note: Brackets represent rebalancing ranges versus Policy.
$0.22.8%
Dom Equity Emerg MktsEAFE Mkts
Core +5 Enhanced Yield
Private Eq Private RE
TIPS
$0.21.9%
$0.08 1.0%
REITS
Convertible Bonds Opportunistic Fixed
$0.070.8%
ETI Cash
$0.55.9%
$0.05 0.6%
$0.2 2.9%
$0.1 1.8%
Hedge Funds
9
New York City Fire Department Pension Fund, Subchapter TwoPerformance Overview as of March 31, 2012
8.3%
0.3% 0.2%
-3.2%
1.9%
-0.4%-2.2%
-3.0%-3.1%
1.9%0.0%
-4.2%
0.0%
2.9%
-8.00%-6.00%-4.00%-2.00%0.00%2.00%4.00%6.00%8.00%
10.00%
$8.3B Under ManagementPortfolio Asset Allocation: March 31, 2012
Asset Allocation
Relative Mix to New Policy Weights
$3.1 37.3%$1.4
16.5%
$0.910.3%$0.6
6.7%
$0.56.6%
$0.4 4.9%
Note: Brackets represent rebalancing ranges versus Policy.
$0.22.8%
Dom Equity Emerg MktsEAFE Mkts
Core +5 Enhanced Yield
Private Eq Private RE
TIPS
$0.21.9%
$0.081.0%
REITS
Convertible Bonds Opportunistic Fixed
$0.070.8%
ETI Cash
$0.55.9%
$0.05 0.6%
$0.2 2.9%
$0.1 1.8%
Hedge Funds
10
New York City Fire Department Pension Fund, Subchapter TwoPerformance Overview as of March 31, 2012
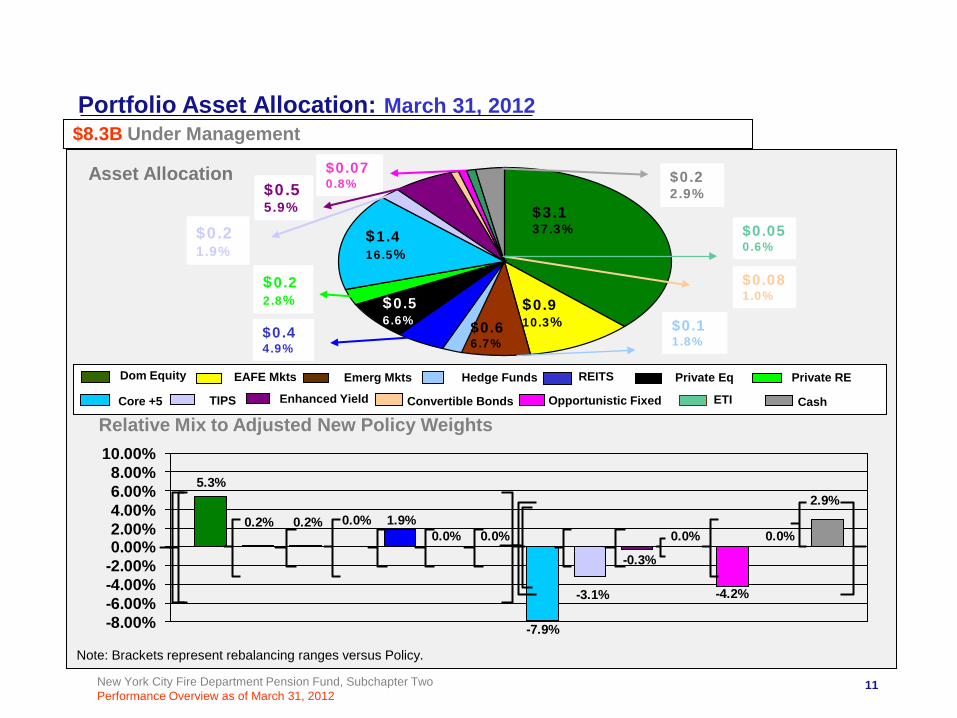
5.3%
0.2% 0.2% 0.0% 1.9%0.0% 0.0%
-7.9%
-3.1%
-0.3%
0.0%
-4.2%
0.0%
2.9%
-8.00%-6.00%-4.00%-2.00%0.00%2.00%4.00%6.00%8.00%
10.00%
$8.3B Under ManagementPortfolio Asset Allocation: March 31, 2012
Asset Allocation
Relative Mix to Adjusted New Policy Weights
$3.1 37.3%$1.4
16.5%
$0.910.3%$0.6
6.7%
$0.56.6%
$0.4 4.9%
Note: Brackets represent rebalancing ranges versus Policy.
$0.22.8%
Dom Equity Emerg MktsEAFE Mkts
Core +5 Enhanced Yield
Private Eq Private RE
TIPS
$0.21.9%
$0.081.0%
REITS
Convertible Bonds Opportunistic Fixed
$0.070.8%
ETI Cash
$0.55.9%
$0.05 0.6%
$0.2 2.9%
$0.1 1.8%
Hedge Funds
11
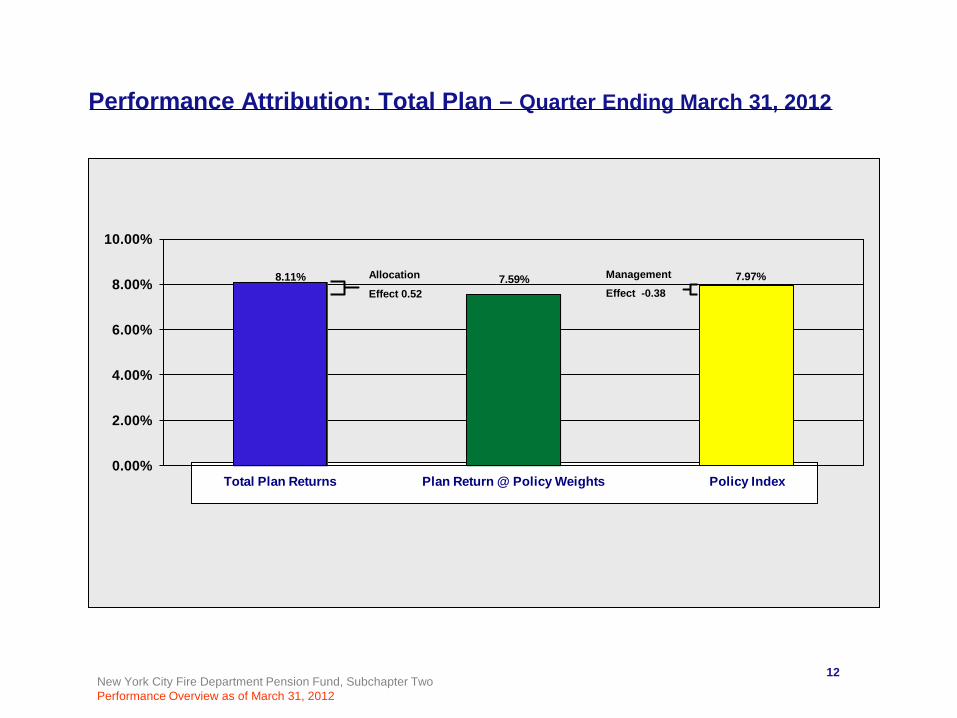
Performance Attribution: Total Plan – Quarter Ending March 31, 2012
12
8.11% 7.59% 7.97%
0.00%
2.00%
4.00%
6.00%
8.00%
10.00%
Total Plan Returns Plan Return @ Policy Weights Policy Index
Allocation
Effect 0.52
Management
Effect -0.38
New York City Fire Department Pension Fund, Subchapter TwoPerformance Overview as of March 31, 2012
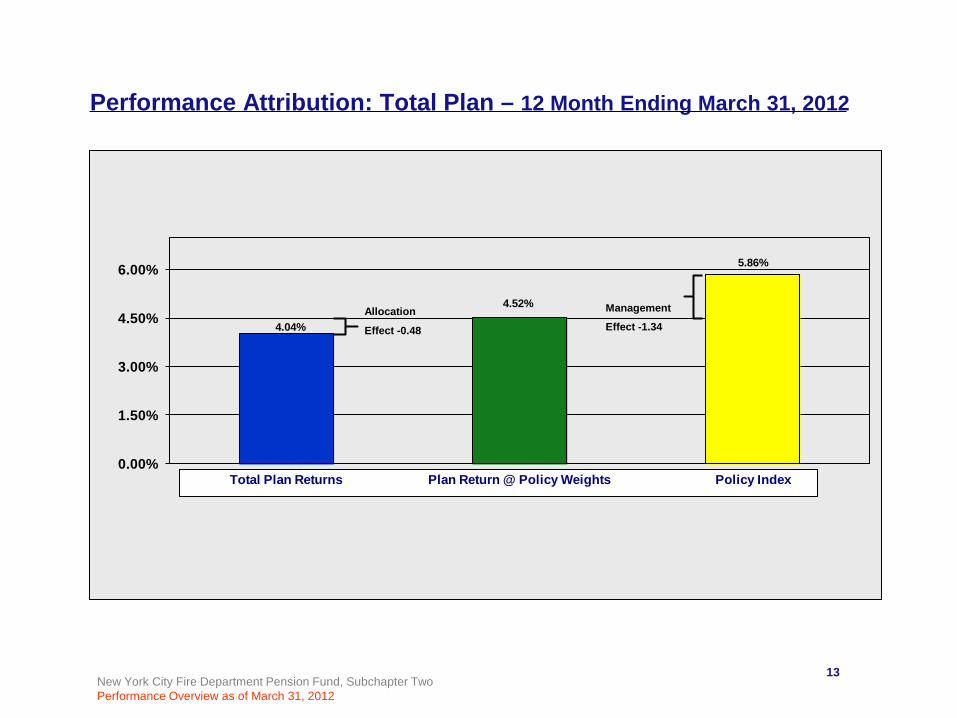
Performance Attribution: Total Plan – 12 Month Ending March 31, 2012
13
4.04%
4.52%
5.86%
0.00%
1.50%
3.00%
4.50%
6.00%
Total Plan Returns Plan Return @ Policy Weights Policy Index
Allocation
Effect -0.48
Management
Effect -1.34
New York City Fire Department Pension Fund, Subchapter TwoPerformance Overview as of March 31, 2012
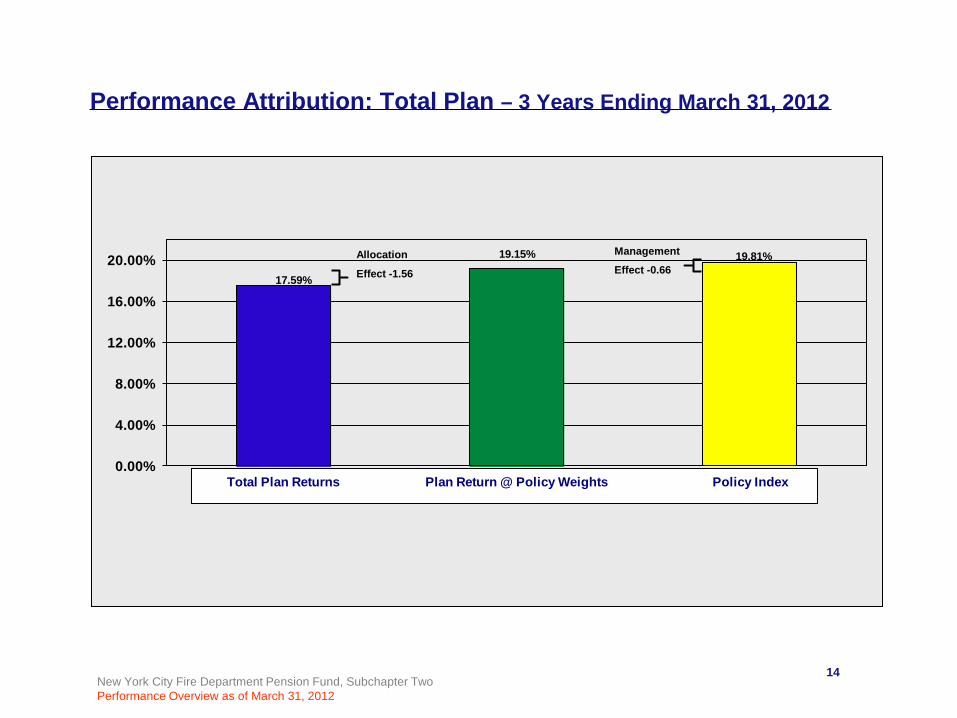
Performance Attribution: Total Plan – 3 Years Ending March 31, 2012
14
17.59%
19.15% 19.81%
0.00%
4.00%
8.00%
12.00%
16.00%
20.00%
Total Plan Returns Plan Return @ Policy Weights Policy Index
Allocation
Effect -1.56
Management
Effect -0.66
New York City Fire Department Pension Fund, Subchapter TwoPerformance Overview as of March 31, 2012
New York City Fire Department Pension Fund, Subchapter TwoPerformance Overview as of March 31, 2012
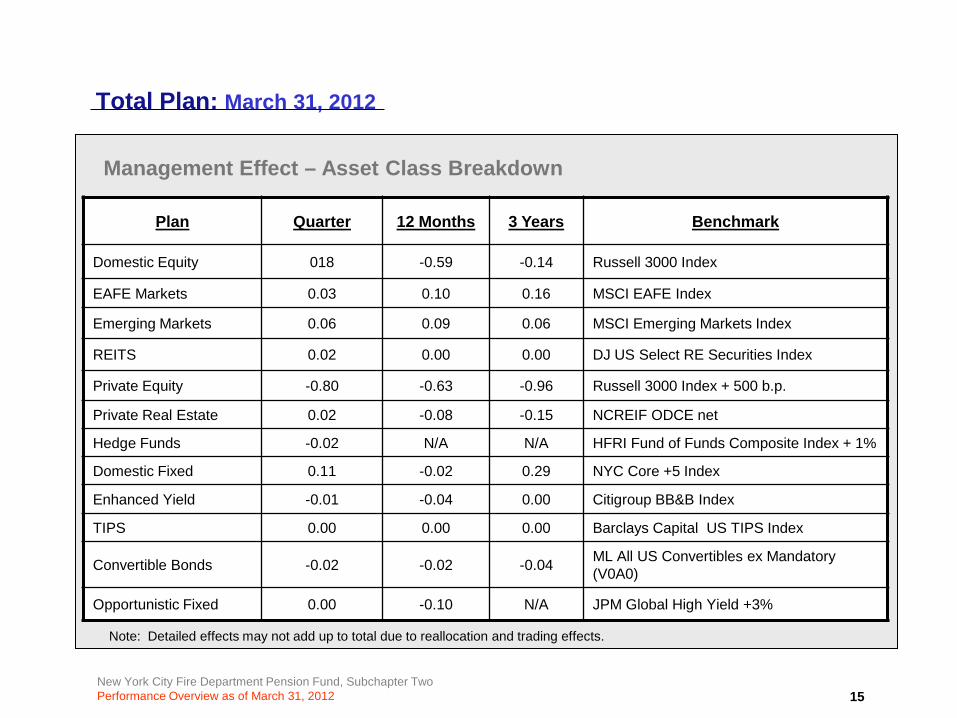
Total Plan: March 31, 2012
Management Effect – Asset Class Breakdown
Plan Quarter 12 Months 3 Years Benchmark
Domestic Equity 018 -0.59 -0.14 Russell 3000 Index
EAFE Markets 0.03 0.10 0.16 MSCI EAFE Index
Emerging Markets 0.06 0.09 0.06 MSCI Emerging Markets Index
REITS 0.02 0.00 0.00 DJ US Select RE Securities Index
Private Equity -0.80 -0.63 -0.96 Russell 3000 Index + 500 b.p.
Private Real Estate 0.02 -0.08 -0.15 NCREIF ODCE net
Hedge Funds -0.02 N/A N/A HFRI Fund of Funds Composite Index + 1%
Domestic Fixed 0.11 -0.02 0.29 NYC Core +5 Index
Enhanced Yield -0.01 -0.04 0.00 Citigroup BB&B Index
TIPS 0.00 0.00 0.00 Barclays Capital US TIPS Index
Convertible Bonds -0.02 -0.02 -0.04 ML All US Convertibles ex Mandatory (V0A0)
Opportunistic Fixed 0.00 -0.10 N/A JPM Global High Yield +3%
Note: Detailed effects may not add up to total due to reallocation and trading effects.
15
16New York City Fire Department Pension Fund, Subchapter TwoPerformance Overview as of March 31, 2012
17New York City Fire Department Pension Fund, Subchapter TwoPerformance Overview as of March 31, 2012
New York City Fire Department Pension Fund, Subchapter TwoPerformance Overview as of March 31, 2012
New York City
Equity Analysis
Fire Department Pension Fund, Subchapter Two
18
New York City Fire Department Pension Fund, Subchapter TwoPerformance Overview as of March 31, 2012
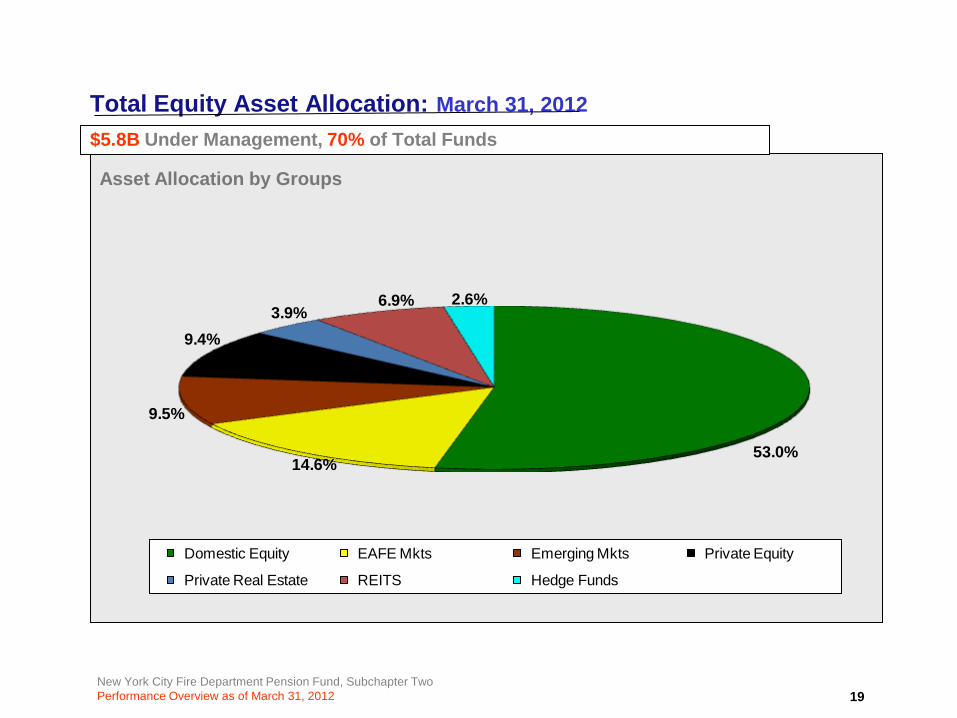
53.0%14.6%
9.5%
9.4%3.9%
6.9% 2.6%
Domestic Equity EAFE Mkts Emerging Mkts Private Equity
Private Real Estate REITS Hedge Funds
$5.8B Under Management, 70% of Total Funds
Total Equity Asset Allocation: March 31, 2012
Asset Allocation by Groups
19
New York City Fire Department Pension Fund, Subchapter TwoPerformance Overview as of March 31, 2012
$3.1B Under Management, 37% of Total Funds
Total Domestic Equity Returns vs Russell 3000 Index
Domestic Equity Returns Russell 3000 Index
Rat
e of
Ret
urn
13.42%
5.64% 5.35%
23.68%
2.02%4.54%
6.14%
12.87%
7.21% 7.18%
24.25%
2.17%
4.67% 6.47%
0%
5%
10%
15%
20%
25%
Trailing 3 Months
FYTD Trailing 12 Months
Trailing 3 Years
Trailing 5 Years
Trailing 10 Years
Trailing 15 Years
20
3 Years 5 Years 10 Years 15 Years
Plan Std Dev 17.2 19.9 16.5 16.8
Benchmark Std Dev 16.8 19.7 16.4 16.9
As of 03/31/12 |
New York City Fire Department Pension Fund, Subchapter TwoPerformance Overview as of March 31, 2012
Total Domestic Equity Asset Allocation: Quarter Ending March 31, 2012$3.1B Under Management, 37% of Total Funds
Asset Allocation by Groups
Value Added by Sectors
21
**Index Fund Managers also used to meet capitalization size policy not met through Active managers.
5.0% 1.1% 1.8% 7.7%
6.1%
9.4%65.3%
3.6%
Small Cap Active Small Russell 2000 Index Small to Mid Cap Active Mid Cap Active
Mid Cap S&P 400 Index Russell 1000 Active Russell 3000 Index Fund Emerging Managers
Allocation ManagementSmall Cap Active 6.45 4.99 -1.46 12.44 12.62 0.18 0.00 0.00Small Russell 2000 Index** 0.00 1.08 1.08 12.44 12.44 0.00 0.00 0.00Small to Mid Cap Active 1.60 1.77 0.17 11.52 12.77 1.25 0.00 0.02Mid Cap Active 6.65 7.72 1.07 12.94 16.05 3.11 0.00 0.24Mid Cap S&P 400 Index** 7.53 6.06 -1.47 13.50 13.49 0.00 -0.01 0.00Russell 1000 Active 8.17 9.43 1.26 12.90 15.30 2.40 0.00 0.22Russell 3000 Index Fund** 66.30 65.35 -0.95 12.87 12.84 -0.03 0.00 -0.02Emerging Managers 3.30 3.61 0.31 12.87 14.69 1.82 0.00 0.06
DifferenceContribution to Out/Under
Performance Sub Sector Policy Weight
Actual Weight
Under/Over Weight
Index Return
Actual Return
New York City Fire Department Pension Fund, Subchapter TwoPerformance Overview as of March 31, 2012
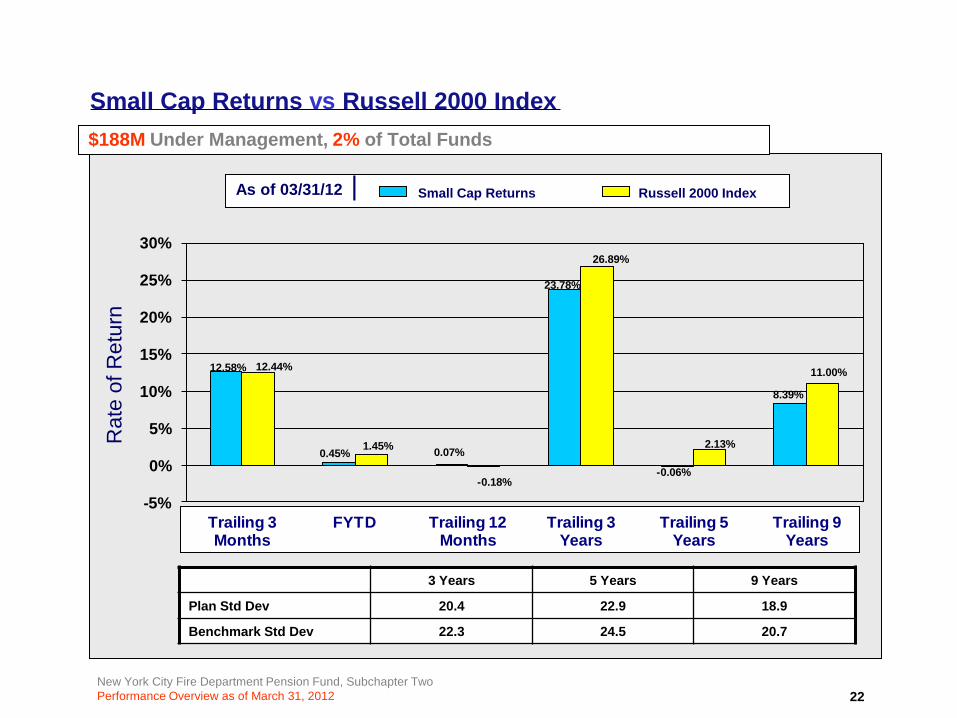
$188M Under Management, 2% of Total Funds
Small Cap Returns vs Russell 2000 Index
Small Cap Returns Russell 2000 Index
Rat
e of
Ret
urn
12.58%
0.45% 0.07%
23.78%
-0.06%
8.39%
12.44%
1.45%
-0.18%
26.89%
2.13%
11.00%
-5%
0%
5%
10%
15%
20%
25%
30%
Trailing 3 Months
FYTD Trailing 12 Months
Trailing 3 Years
Trailing 5 Years
Trailing 9 Years
22
3 Years 5 Years 9 Years
Plan Std Dev 20.4 22.9 18.9
Benchmark Std Dev 22.3 24.5 20.7
As of 03/31/12 |
New York City Fire Department Pension Fund, Subchapter TwoPerformance Overview as of March 31, 2012
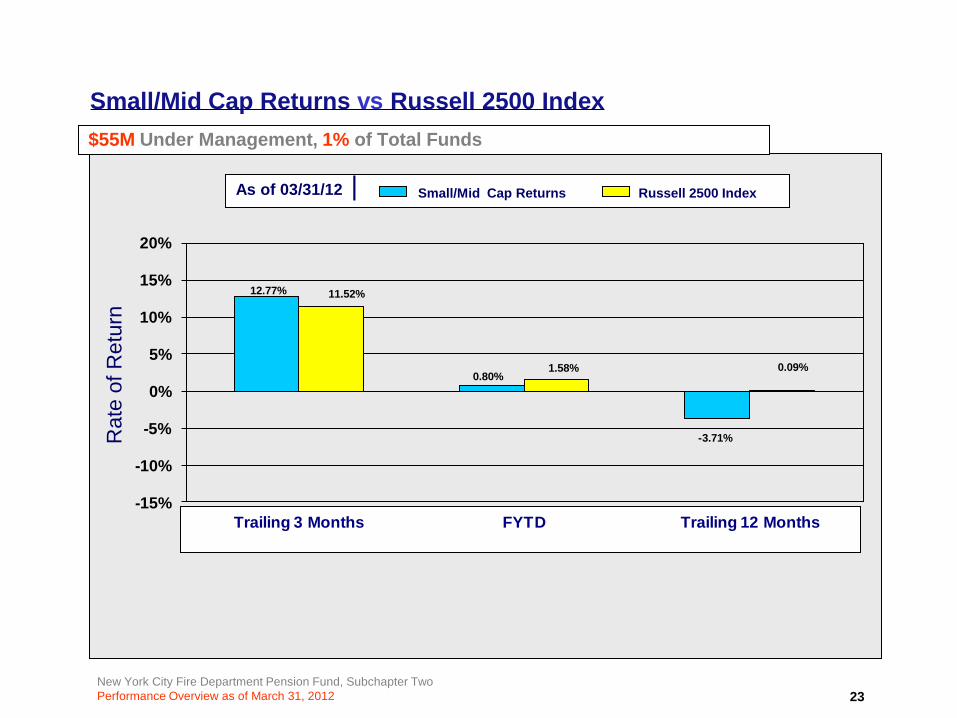
$55M Under Management, 1% of Total Funds
Small/Mid Cap Returns vs Russell 2500 Index
Small/Mid Cap Returns Russell 2500 Index
Rat
e of
Ret
urn
12.77%
0.80%
-3.71%
11.52%
1.58% 0.09%
-15%
-10%
-5%
0%
5%
10%
15%
20%
Trailing 3 Months FYTD Trailing 12 Months
23
As of 03/31/12 |
New York City Fire Department Pension Fund, Subchapter TwoPerformance Overview as of March 31, 2012
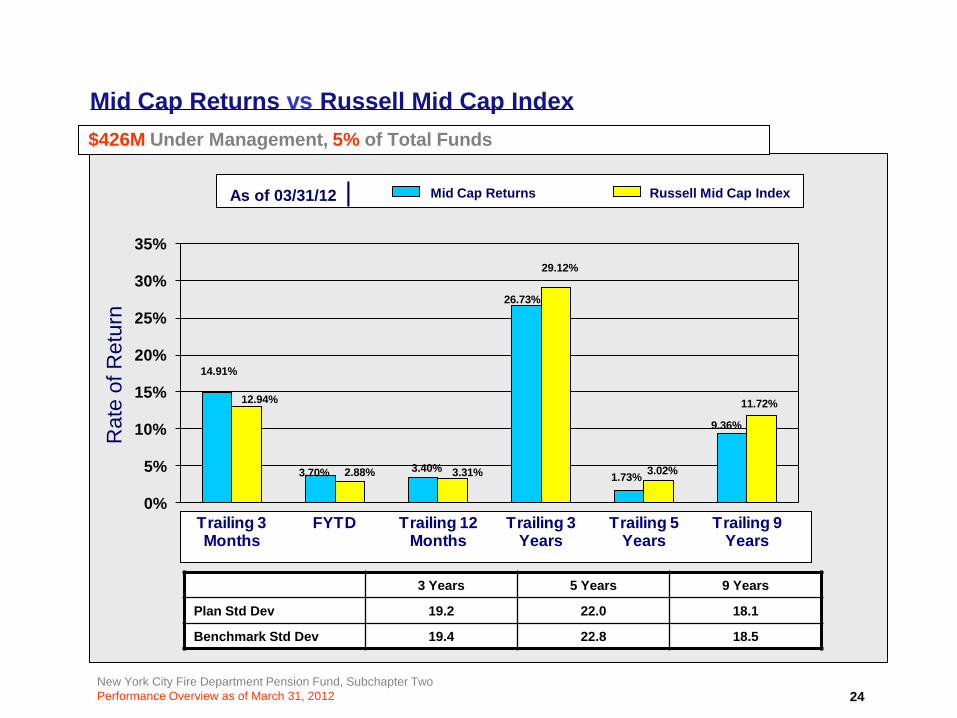
$426M Under Management, 5% of Total Funds
Mid Cap Returns vs Russell Mid Cap Index
Mid Cap Returns Russell Mid Cap Index
Rat
e of
Ret
urn
14.91%
3.70% 3.40%
26.73%
1.73%
9.36%
12.94%
2.88% 3.31%
29.12%
3.02%
11.72%
0%
5%
10%
15%
20%
25%
30%
35%
Trailing 3 Months
FYTD Trailing 12 Months
Trailing 3 Years
Trailing 5 Years
Trailing 9 Years
24
3 Years 5 Years 9 Years
Plan Std Dev 19.2 22.0 18.1
Benchmark Std Dev 19.4 22.8 18.5
As of 03/31/12 |
New York City Fire Department Pension Fund, Subchapter TwoPerformance Overview as of March 31, 2012
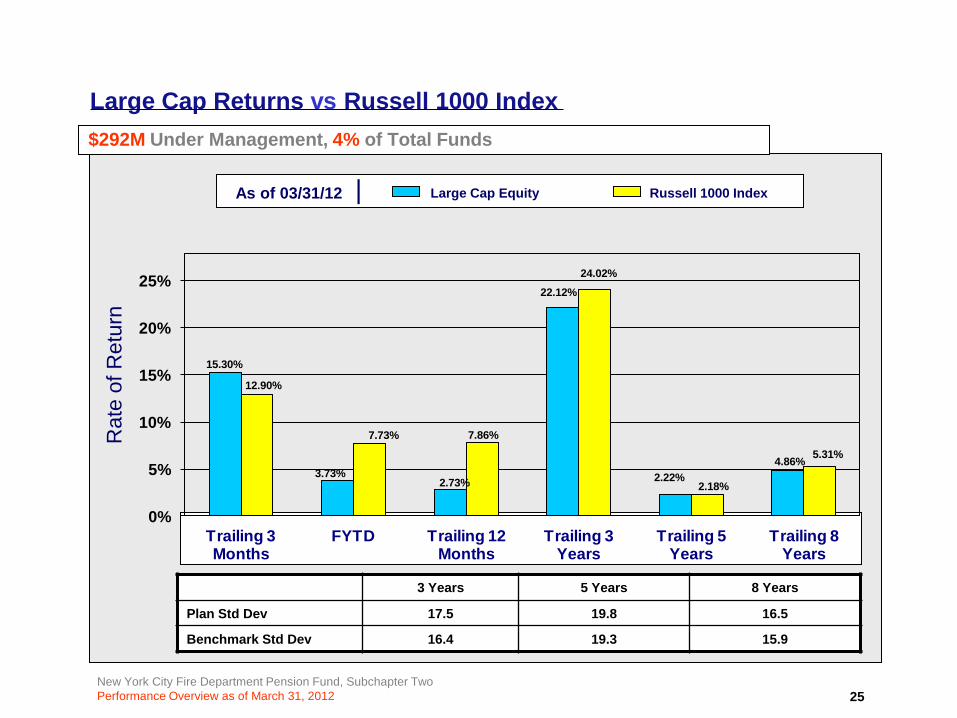
$292M Under Management, 4% of Total Funds
Large Cap Returns vs Russell 1000 Index
Large Cap Equity Russell 1000 Index
Rat
e of
Ret
urn
As of 03/31/12 |
15.30%
3.73%2.73%
22.12%
2.22%4.86%
12.90%
7.73% 7.86%
24.02%
2.18%
5.31%
0%
5%
10%
15%
20%
25%
Trailing 3 Months
FYTD Trailing 12 Months
Trailing 3 Years
Trailing 5 Years
Trailing 8 Years
25
3 Years 5 Years 8 Years
Plan Std Dev 17.5 19.8 16.5
Benchmark Std Dev 16.4 19.3 15.9
New York City Fire Department Pension Fund, Subchapter TwoPerformance Overview as of March 31, 2012
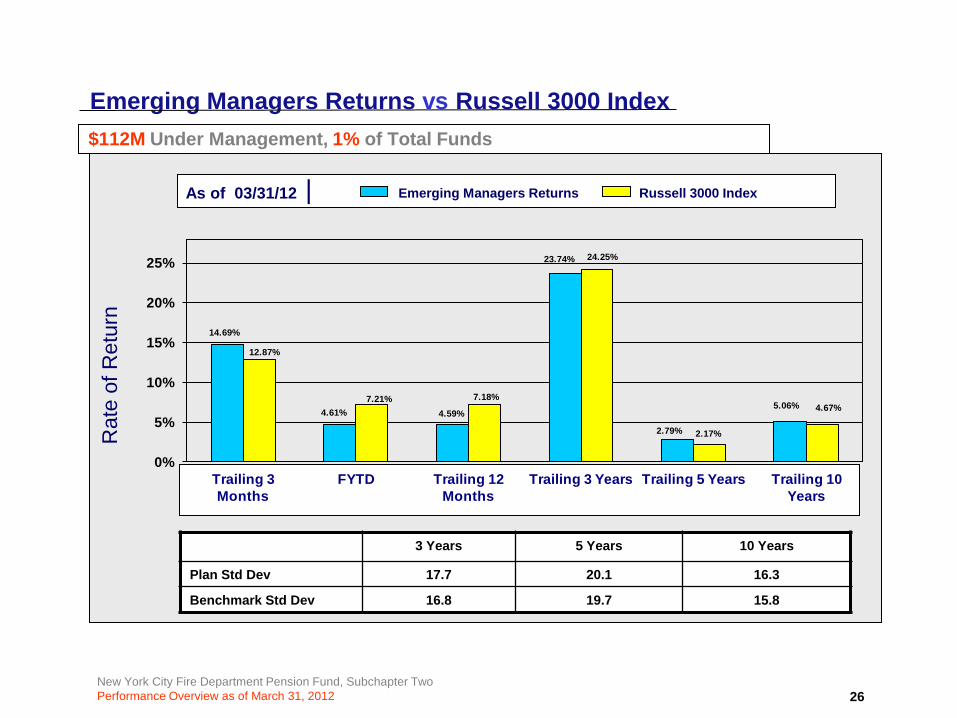
$112M Under Management, 1% of Total Funds
Emerging Managers Returns vs Russell 3000 Index
Emerging Managers Returns Russell 3000 Index
Rat
e of
Ret
urn
14.69%
4.61% 4.59%
23.74%
2.79%
5.06%
12.87%
7.21% 7.18%
24.25%
2.17%
4.67%
0%
5%
10%
15%
20%
25%
Trailing 3 Months
FYTD Trailing 12 Months
Trailing 3 Years Trailing 5 Years Trailing 10 Years
3 Years 5 Years 10 Years
Plan Std Dev 17.7 20.1 16.3
Benchmark Std Dev 16.8 19.7 15.8
26
As of 03/31/12 |
New York City Fire Department Pension Fund, Subchapter TwoPerformance Overview as of March 31, 2012
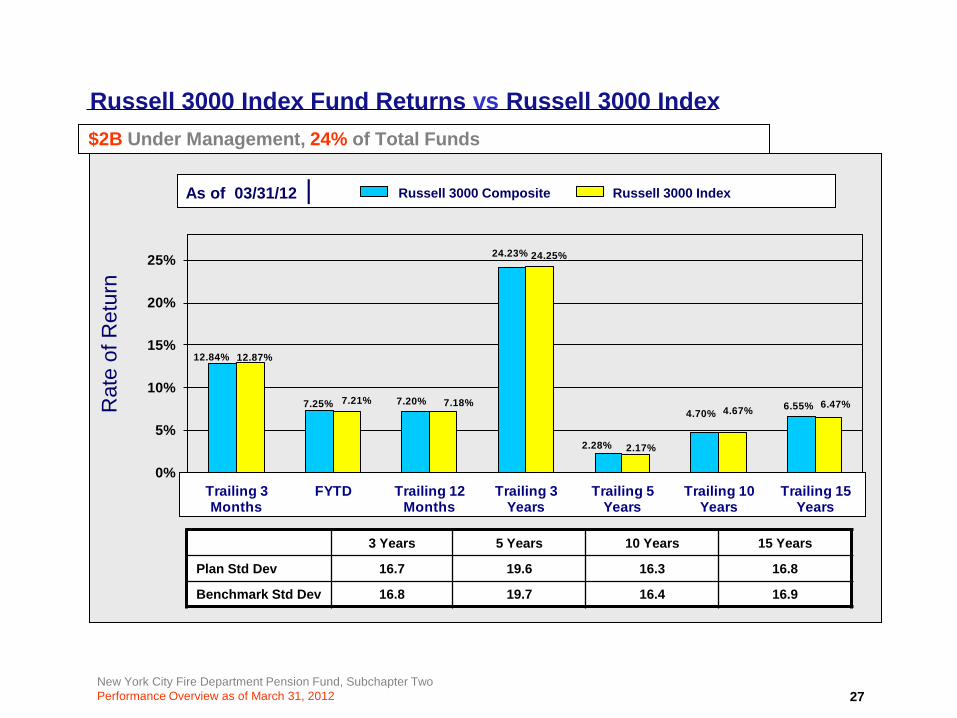
$2B Under Management, 24% of Total Funds
Russell 3000 Index Fund Returns vs Russell 3000 Index
Russell 3000 Composite Russell 3000 Index
Rat
e of
Ret
urn
As of 03/31/12 |
12.84%
7.25% 7.20%
24.23%
2.28%
4.70%6.55%
12.87%
7.21% 7.18%
24.25%
2.17%
4.67% 6.47%
0%
5%
10%
15%
20%
25%
Trailing 3 Months
FYTD Trailing 12 Months
Trailing 3 Years
Trailing 5 Years
Trailing 10 Years
Trailing 15 Years
3 Years 5 Years 10 Years 15 Years
Plan Std Dev 16.7 19.6 16.3 16.8
Benchmark Std Dev 16.8 19.7 16.4 16.9
27
New York City Fire Department Pension Fund, Subchapter TwoPerformance Overview as of March 31, 2012
13.2% 24.1%
26.8%
10.9%1.4%
11.0%
12.6%
Value Core Emerging Mkts Growth Non Us Activist Passive Emerging Mkts Passive
$1.4B Under Management, 17% of Total Funds
International Equity Asset Allocation: March 31, 2012
Asset Allocation by Style
28
Asset Allocation by Groups
23.6%
76.4%
Passive Active
Value Added by Sectors
Allocation ManagementEAFE Growth 10.89 12.10 12.71 0.61 0.07EAFE Value 13.17 9.85 10.72 0.87 0.09EAFE Core 24.07 10.86 11.48 0.62 0.15EAFE Passive 10.99 10.86 10.92 0.06 0.01Non-US Activist 1.46 16.50 21.12 4.63 0.06Active EM 26.83 14.14 15.70 1.56 0.39Passive EM 12.62 14.14 14.05 -0.08 -0.01
DifferenceContribution to Out/Under
Performance Sub Sector Policy Weight
Actual Weight
Under/Over Weight
Index Return
Actual Return
New York City Fire Department Pension Fund, Subchapter TwoPerformance Overview as of March 31, 2012 29
$833M Under Management, 10% of Total Funds
EAFE Markets Returns vs MSCI EAFE Index
MSCI EAFE Index
Rat
e of
Ret
urn
As of 03/31/12 | EAFE Mkts Passive Equity Active Equity
-15%-10%
-5%0%5%
10%15%20%25%
Trailing 3 Months
FYTD Trailing 12 Months
Trailing 3 Years
Trailing 5 Years
Trailing 10 Years
Trailing 15 Years
3 Years 5 Years 10 Years 15 Years
EAFE Plan Std Dev 20.1 22.5 18.6 18.2
Passive Plan Std Dev 20.6 22.7 18.6 18.0
Active Plan Std Dev 20.1 22.4 18.7 18.4
Benchmark Std Dev 20.6 22.7 18.6 18.0
New York City Fire Department Pension Fund, Subchapter TwoPerformance Overview as of March 31, 2012
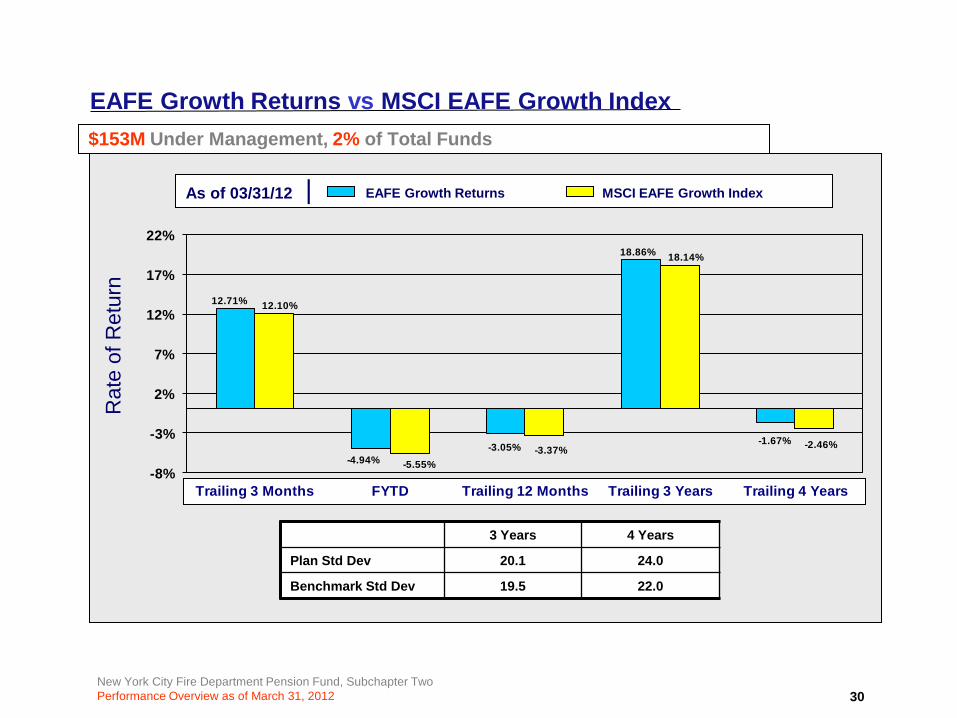
$153M Under Management, 2% of Total Funds
EAFE Growth Returns vs MSCI EAFE Growth Index
EAFE Growth Returns MSCI EAFE Growth Index
Rat
e of
Ret
urn
As of 03/31/12 |
12.71%
-4.94%-3.05%
18.86%
-1.67%
12.10%
-5.55%-3.37%
18.14%
-2.46%
-8%
-3%
2%
7%
12%
17%
22%
Trailing 3 Months FYTD Trailing 12 Months Trailing 3 Years Trailing 4 Years
30
3 Years 4 Years
Plan Std Dev 20.1 24.0
Benchmark Std Dev 19.5 22.0
New York City Fire Department Pension Fund, Subchapter TwoPerformance Overview as of March 31, 2012
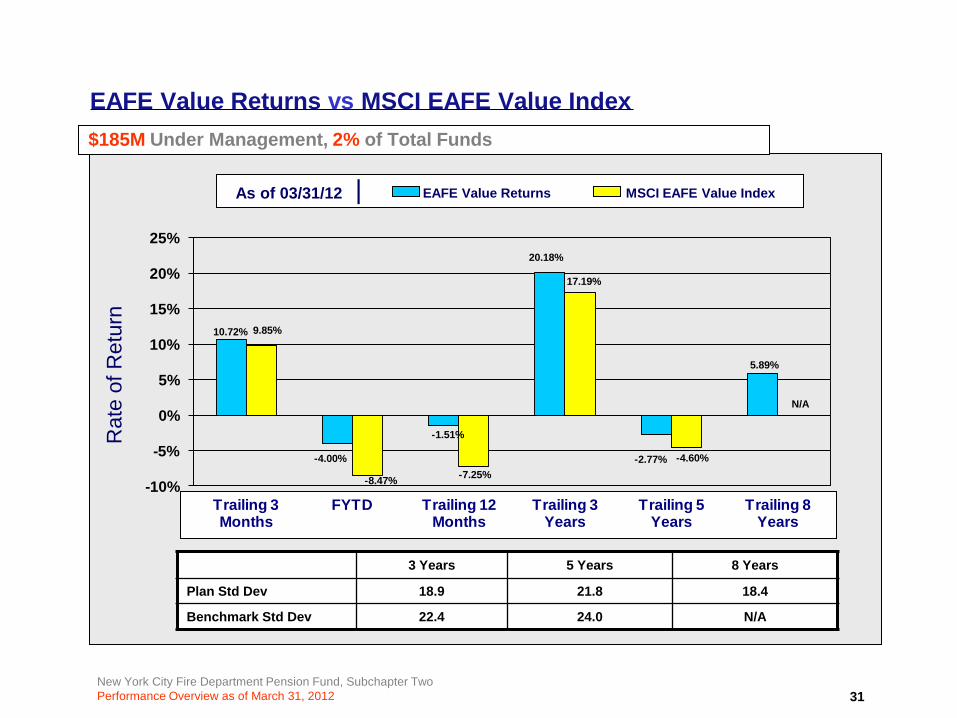
$185M Under Management, 2% of Total Funds
EAFE Value Returns vs MSCI EAFE Value IndexR
ate
of R
etur
n
As of 03/31/12 |
10.72%
-4.00%
-1.51%
20.18%
-2.77%
5.89%
9.85%
-8.47% -7.25%
17.19%
-4.60%
N/A
-10%
-5%
0%
5%
10%
15%
20%
25%
Trailing 3 Months
FYTD Trailing 12 Months
Trailing 3 Years
Trailing 5 Years
Trailing 8 Years
31
3 Years 5 Years 8 Years
Plan Std Dev 18.9 21.8 18.4
Benchmark Std Dev 22.4 24.0 N/A
EAFE Value Returns MSCI EAFE Value Index
New York City Fire Department Pension Fund, Subchapter TwoPerformance Overview as of March 31, 2012
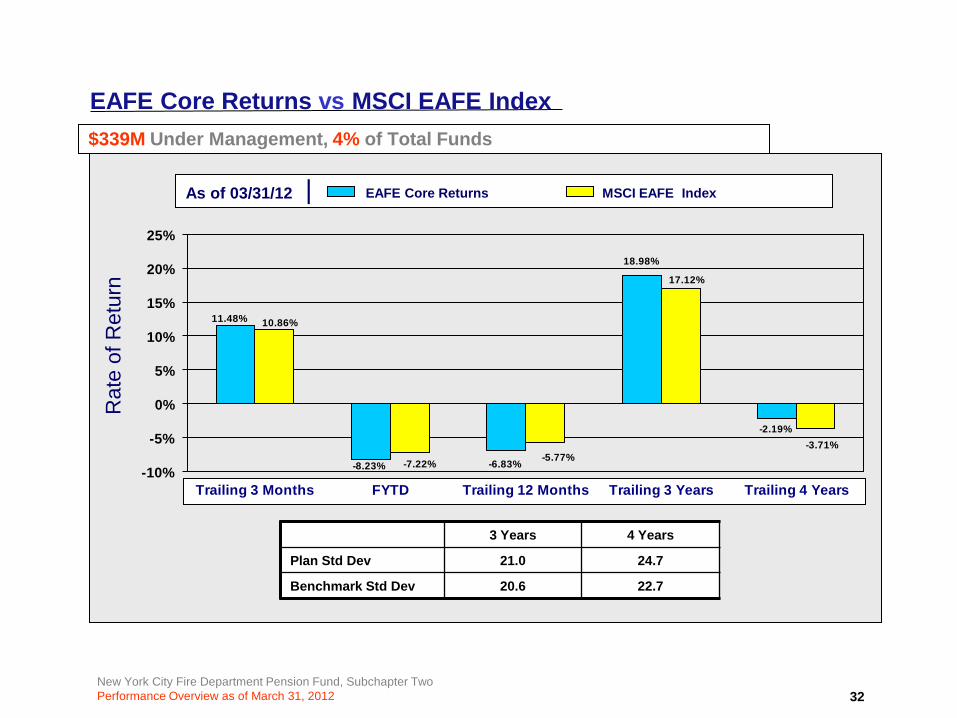
$339M Under Management, 4% of Total Funds
EAFE Core Returns vs MSCI EAFE Index
EAFE Core Returns MSCI EAFE Index
Rat
e of
Ret
urn
As of 03/31/12 |
11.48%
-8.23% -6.83%
18.98%
-2.19%
10.86%
-7.22% -5.77%
17.12%
-3.71%
-10%
-5%
0%
5%
10%
15%
20%
25%
Trailing 3 Months FYTD Trailing 12 Months Trailing 3 Years Trailing 4 Years
32
3 Years 4 Years
Plan Std Dev 21.0 24.7
Benchmark Std Dev 20.6 22.7
New York City Fire Department Pension Fund, Subchapter TwoPerformance Overview as of March 31, 2012
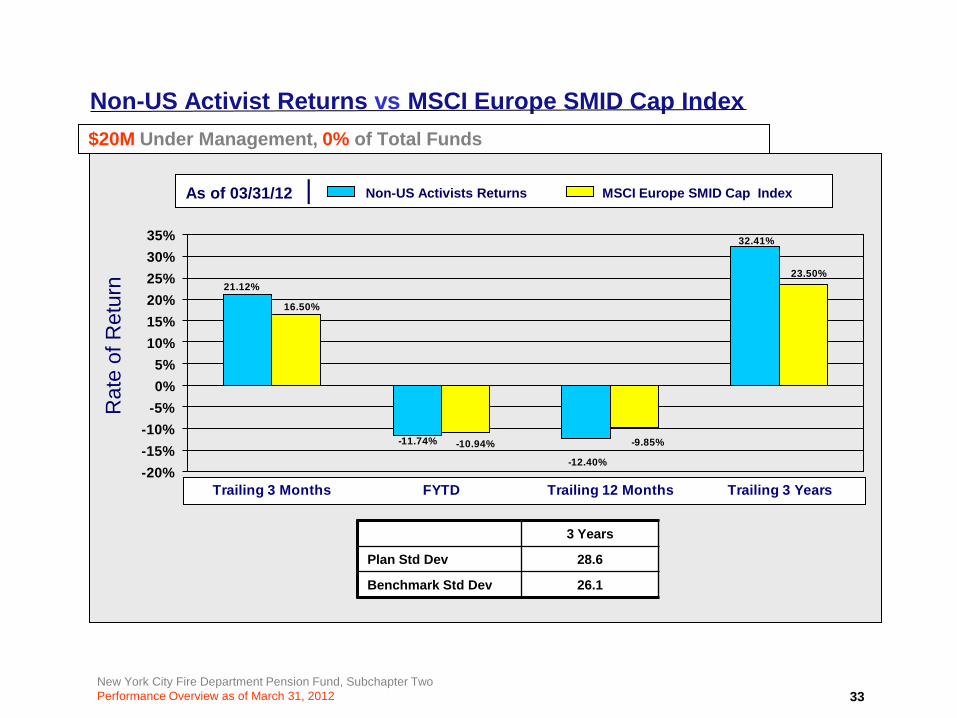
$20M Under Management, 0% of Total Funds
Non-US Activist Returns vs MSCI Europe SMID Cap Index
Non-US Activists Returns MSCI Europe SMID Cap Index
Rat
e of
Ret
urn
As of 03/31/12 |
21.12%
-11.74%
-12.40%
32.41%
16.50%
-10.94% -9.85%
23.50%
-20%-15%-10%
-5%0%5%
10%15%20%25%30%35%
Trailing 3 Months FYTD Trailing 12 Months Trailing 3 Years
33
3 Years
Plan Std Dev 28.6
Benchmark Std Dev 26.1
New York City Fire Department Pension Fund, Subchapter TwoPerformance Overview as of March 31, 2012 34
$556M Under Management, 7% of Total Funds
Emerging Markets Returns vs MSCI Emerging Markets Index
MSCI Emerging Mkts Index
Rat
e of
Ret
urn
As of 03/31/12 | Emerging Mkts Passive Equity Active Equity
-15%-10%-5%0%5%
10%15%20%25%30%
Trailing 3 Months
FYTD Trailing 12 Months
Trailing 3 Years
Trailing 5 Years
Trailing 10 Years
Trailing 15 Years
3 Years 5 Years 10 Years 15 Years
Emerging Plan Std Dev 25.3 29.9 24.6 25.6
Passive Plan Std Dev N/A N/A N/A N/A
Active Plan Std Dev 25.3 29.9 N/A N/A
Benchmark Std Dev 24.8 29.3 24.4 26.0
New York City Fire Department Pension Fund, Subchapter TwoPerformance Overview as of March 31, 2012
$405M Under Management, 5% of Total Funds
REITS Returns vs DJ US Select Real Estate Securities Index
REITS Returns DJ US Select RE Securities Index
Rat
e of
Ret
urn
As of 03/31/12 |
11.41%9.00%
13.19%
44.52%
-0.55%
13.44%
10.88%8.80%
13.17%
44.61%
-0.93%
12.13%
-5%
5%
15%
25%
35%
45%
Trailing 3 Months
FYTD Trailing 12 Months
Trailing 3 Years
Trailing 5 Years
Trailing 9 Years
35
3 Years 5 Years 9 Years
Plan Std Dev 26.5 32.9 26.7
Benchmark Std Dev 27.2 34.6 27.8
New York City Fire Department Pension Fund, Subchapter TwoPerformance Overview as of March 31, 2012
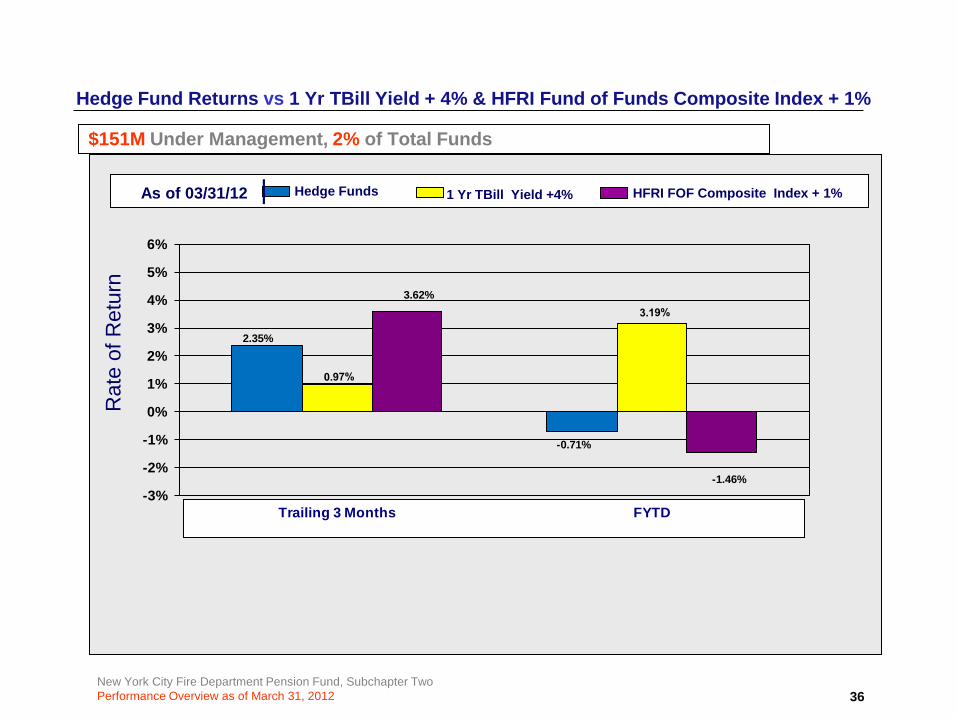
$151M Under Management, 2% of Total Funds
Hedge Fund Returns vs 1 Yr TBill Yield + 4% & HFRI Fund of Funds Composite Index + 1%
Hedge Funds
Rat
e of
Ret
urn
As of 03/31/12 |
2.35%
-0.71%
3.62%
-1.46%-3%
-2%
-1%
0%
1%
2%
3%
4%
5%
6%
Trailing 3 Months FYTD
36
1 Yr TBill Yield +4% HFRI FOF Composite Index + 1%
New York City Fire Department Pension Fund, Subchapter TwoPerformance Overview as of March 31, 2012
New York City
Fixed Income Analysis
Fire Department Pension Fund, Subchapter Two
37
New York City Fire Department Pension Fund, Subchapter TwoPerformance Overview as of March 31, 2012
55.6%20.1%
2.1%
9.1%6.5%
3.4% 2.8% 0.4%
Structured Fixed Income Enhanced Yield ETICash TIPS Managers Convertible BondsOpportunistic Fixed Global Fixed Income
$2.4B Under Management, 29% of Total Funds
Total Fixed Income Asset Allocation: March 31, 2012
Asset Allocation by Groups
38
New York City Fire Department Pension Fund, Subchapter TwoPerformance Overview as of March 31, 2012
15.3%
48.6%
36.1%
Treas/Agency Mortgage Invest. Grade Credit
Structured Fixed Income Asset Allocation: Quarter Ending March 31, 2012$1.4B Under Management, 16% of Total Funds
Asset Allocation by Groups
Value Added by Sectors
*NYC Core +5 Breakdown
39
Allocation ManagementTreas/Agency 21.25 15.32 -5.93 -2.74 -2.66 0.08 0.22 0.01Mortgage 42.15 48.57 6.42 0.61 1.29 0.68 0.02 0.36Invest. Grade Credit 36.60 36.11 -0.49 2.09 2.33 0.24 0.01 0.09
Index Return
Actual Return Difference
Contribution to Out/Under Performance Sub Sector Policy
WeightActual Weight
Under/Over Weight
New York City Fire Department Pension Fund, Subchapter TwoPerformance Overview as of March 31, 2012
$1.4B Under Management, 16% of Total Funds
Structured Returns vs NYC Core + 5 Index
Structured Returns NYC Core + 5 Index
Rat
e of
Ret
urn
As of 03/31/12 |
1.03%
6.65%
9.19% 9.21%
7.16%6.66%
7.12%
0.38%
6.56%
9.30%
7.63%
7.05%6.44%
6.92%
0%
2%
4%
6%
8%
10%
Trailing 3 Months
FYTD Trailing 12 Months
Trailing 3 Years
Trailing 5 Years
Trailing 10 Years
Trailing 15 Years
3 Years 5 Years 10 Years 15 Years
Plan Std Dev 3.1 4.2 4.1 4.0
Benchmark Std Dev 3.2 4.4 4.3 4.1
40
New York City Fire Department Pension Fund, Subchapter TwoPerformance Overview as of March 31, 2012
$159M Under Management, 2% of Total Funds
TIPS Returns vs Barclays Capital US TIPS Index
TIPS Returns Barclays Capital US TIPS Index
Rat
e of
Ret
urn
As of 03/31/12 |
0.76%
8.60%
12.27%
8.74%
7.76% 7.36%
0.86%
8.25%
12.20%
8.75%
7.61% 7.22%
0.0%
3.0%
6.0%
9.0%
12.0%
15.0%
Trailing 3 Months
FYTD Trailing 12 Months
Trailing 3 Years
Trailing 5 Years
Trailing 6 Years
41
3 Years 5 Years 6 Years
Plan Std Dev 4.7 7.4 6.9
Benchmark Std Dev 4.9 7.4 7.0
New York City Fire Department Pension Fund, Subchapter TwoPerformance Overview as of March 31, 2012
$491M Under Management, 6% of Total Funds
Enhanced Yield Returns vs Citigroup BB&B Index & Citigroup BB&B Capped Index
Enhanced Yield Citigroup BB&B Capped Index
Rat
e of
Ret
urn
As of 03/31/12 |
0%
5%
10%
15%
20%
25%
Trailing 3 Months
FYTD Trailing 12 Months
Trailing 3 Years
Trailing 5 Years
Trailing 10 Years
Trailing 15 Years
42
3 Years 5 Years 10 Years 15 Years
Plan Std Dev 7.7 10.7 9.0 9.0
Citigroup BB&B Std Dev 8.1 11.9 9.9 9.2
Citigroup BB&B Capped Std Dev 7.9 11.6 9.3 N/A
Citigroup BB&B Index
New York City Fire Department Pension Fund, Subchapter TwoPerformance Overview as of March 31, 2012
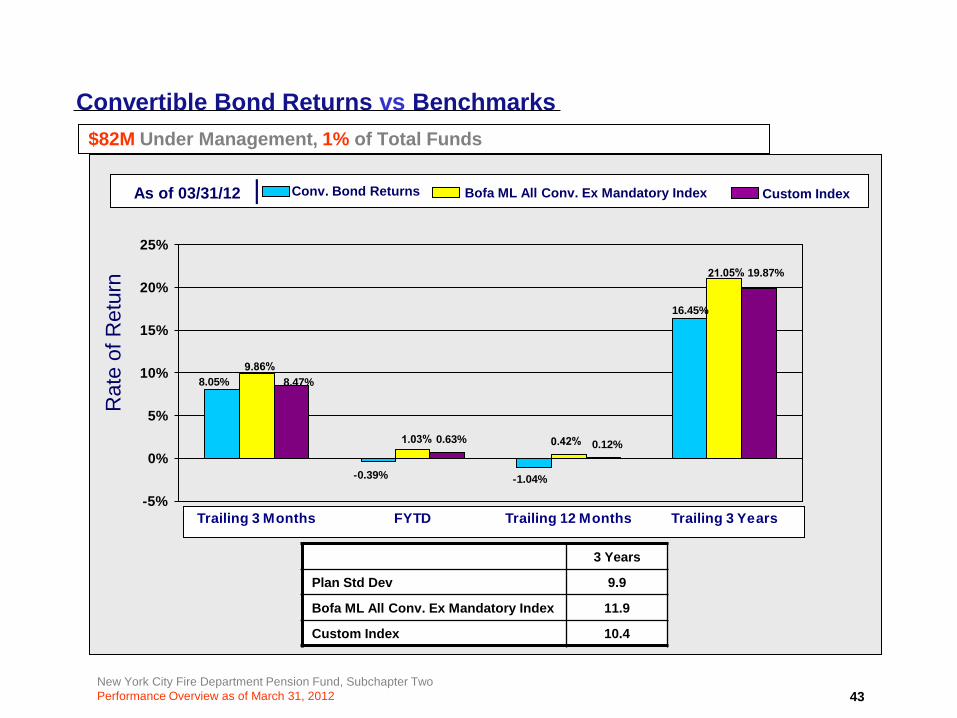
$82M Under Management, 1% of Total Funds
Convertible Bond Returns vs Benchmarks
Conv. Bond Returns Bofa ML All Conv. Ex Mandatory Index
Rat
e of
Ret
urn
As of 03/31/12 |
8.05%
-0.39% -1.04%
16.45%
8.47%
0.63% 0.12%
19.87%
-5%
0%
5%
10%
15%
20%
25%
Trailing 3 Months FYTD Trailing 12 Months Trailing 3 Years
43
3 Years
Plan Std Dev 9.9
Bofa ML All Conv. Ex Mandatory Index 11.9
Custom Index 10.4
Custom Index
New York City Fire Department Pension Fund, Subchapter TwoPerformance Overview as of March 31, 2012
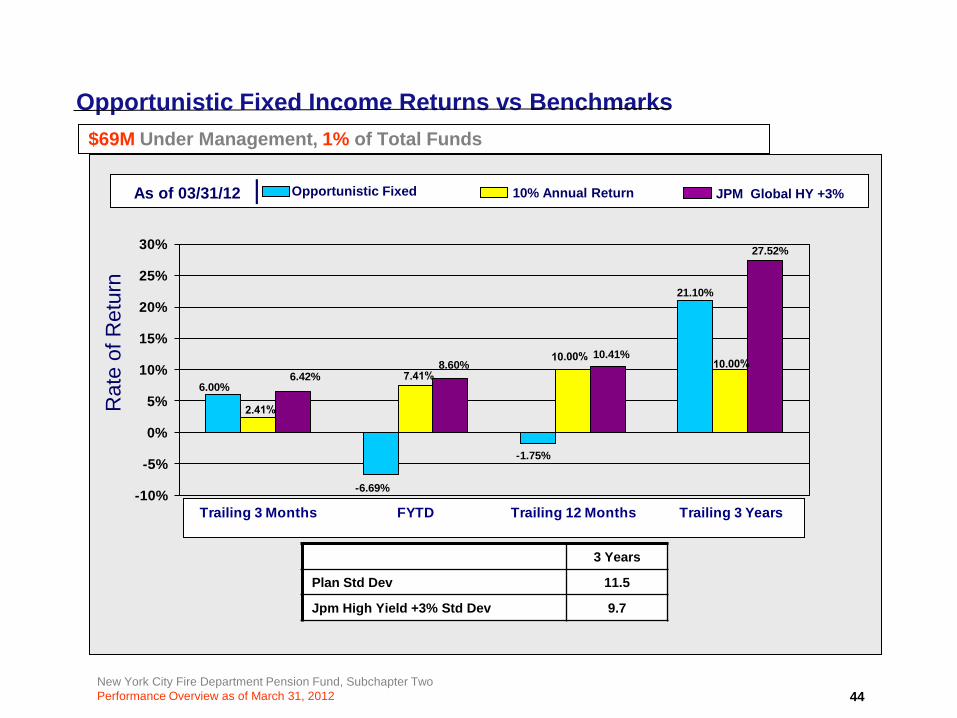
$69M Under Management, 1% of Total Funds
Opportunistic Fixed Income Returns vs Benchmarks
Opportunistic Fixed 10% Annual Return
Rat
e of
Ret
urn
As of 03/31/12 |
6.00%
-6.69%
-1.75%
21.10%
6.42%8.60%
10.41%
27.52%
-10%
-5%
0%
5%
10%
15%
20%
25%
30%
Trailing 3 Months FYTD Trailing 12 Months Trailing 3 Years
44
3 Years
Plan Std Dev 11.5
Jpm High Yield +3% Std Dev 9.7
JPM Global HY +3%
New York City Fire Department Pension Fund, Subchapter TwoPerformance Overview as of March 31, 2012
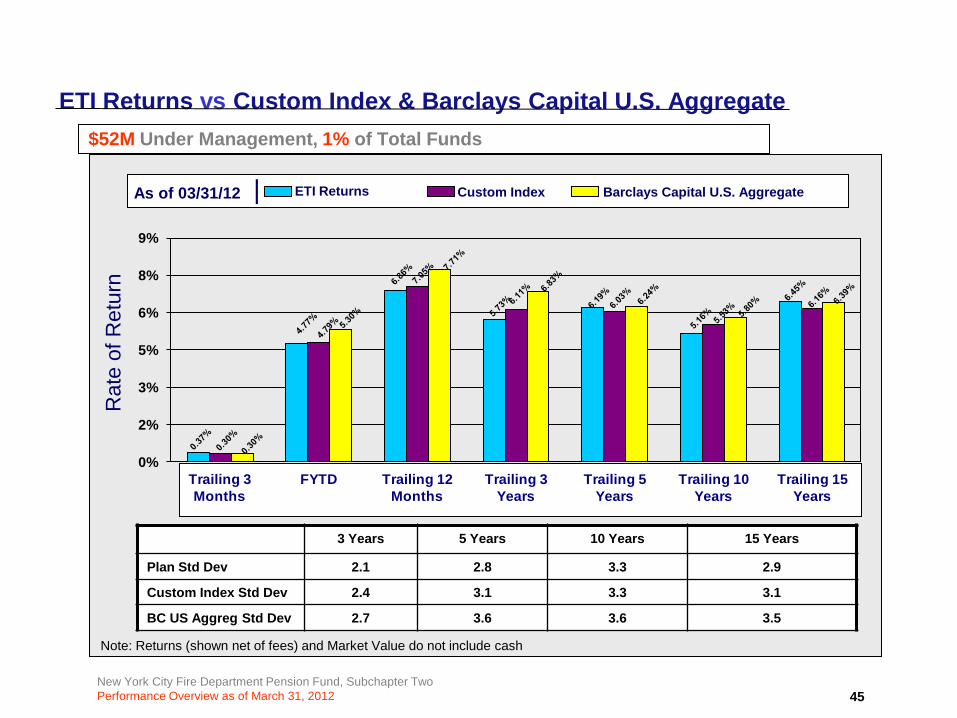
$52M Under Management, 1% of Total Funds
ETI Returns vs Custom Index & Barclays Capital U.S. Aggregate
ETI Returns Barclays Capital U.S. Aggregate
Rat
e of
Ret
urn
As of 03/31/12 |
0%
2%
3%
5%
6%
8%
9%
Trailing 3 Months
FYTD Trailing 12 Months
Trailing 3 Years
Trailing 5 Years
Trailing 10 Years
Trailing 15 Years
Note: Returns (shown net of fees) and Market Value do not include cash
45
3 Years 5 Years 10 Years 15 Years
Plan Std Dev 2.1 2.8 3.3 2.9
Custom Index Std Dev 2.4 3.1 3.3 3.1
BC US Aggreg Std Dev 2.7 3.6 3.6 3.5
Custom Index
New York City Fire Department Pension Fund, Subchapter TwoPerformance Overview as of March 31, 2012
New York City
Appendix
Fire Department Pension Fund, Subchapter Two
46
New York City Fire Department Pension Fund, Subchapter TwoPerformance Overview as of March 31, 2012 47
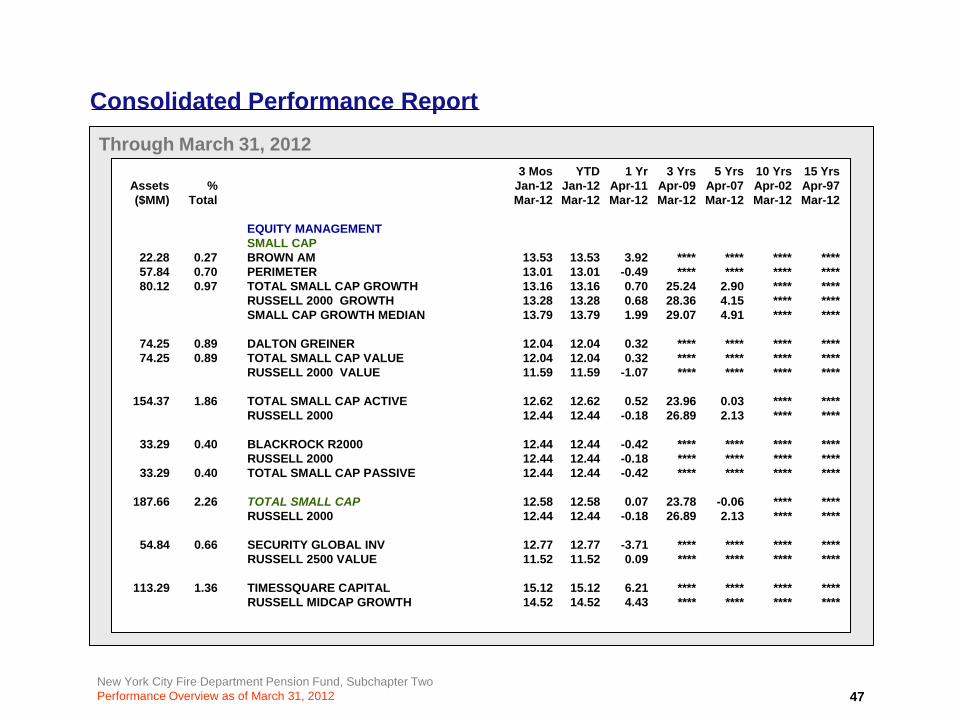
Consolidated Performance ReportThrough March 31, 2012
3 Mos YTD 1 Yr 3 Yrs 5 Yrs 10 Yrs 15 YrsAssets % Jan-12 Jan-12 Apr-11 Apr-09 Apr-07 Apr-02 Apr-97($MM) Total Mar-12 Mar-12 Mar-12 Mar-12 Mar-12 Mar-12 Mar-12
EQUITY MANAGEMENTSMALL CAP
22.28 0.27 BROWN AM 13.53 13.53 3.92 **** **** **** ****57.84 0.70 PERIMETER 13.01 13.01 -0.49 **** **** **** ****80.12 0.97 TOTAL SMALL CAP GROWTH 13.16 13.16 0.70 25.24 2.90 **** ****
RUSSELL 2000 GROWTH 13.28 13.28 0.68 28.36 4.15 **** ****SMALL CAP GROWTH MEDIAN 13.79 13.79 1.99 29.07 4.91 **** ****
74.25 0.89 DALTON GREINER 12.04 12.04 0.32 **** **** **** ****74.25 0.89 TOTAL SMALL CAP VALUE 12.04 12.04 0.32 **** **** **** ****
RUSSELL 2000 VALUE 11.59 11.59 -1.07 **** **** **** ****
154.37 1.86 TOTAL SMALL CAP ACTIVE 12.62 12.62 0.52 23.96 0.03 **** ****RUSSELL 2000 12.44 12.44 -0.18 26.89 2.13 **** ****
33.29 0.40 BLACKROCK R2000 12.44 12.44 -0.42 **** **** **** ****RUSSELL 2000 12.44 12.44 -0.18 **** **** **** ****
33.29 0.40 TOTAL SMALL CAP PASSIVE 12.44 12.44 -0.42 **** **** **** ****
187.66 2.26 TOTAL SMALL CAP 12.58 12.58 0.07 23.78 -0.06 **** ****RUSSELL 2000 12.44 12.44 -0.18 26.89 2.13 **** ****
54.84 0.66 SECURITY GLOBAL INV 12.77 12.77 -3.71 **** **** **** ****RUSSELL 2500 VALUE 11.52 11.52 0.09 **** **** **** ****
113.29 1.36 TIMESSQUARE CAPITAL 15.12 15.12 6.21 **** **** **** ****RUSSELL MIDCAP GROWTH 14.52 14.52 4.43 **** **** **** ****
New York City Fire Department Pension Fund, Subchapter TwoPerformance Overview as of March 31, 2012 48
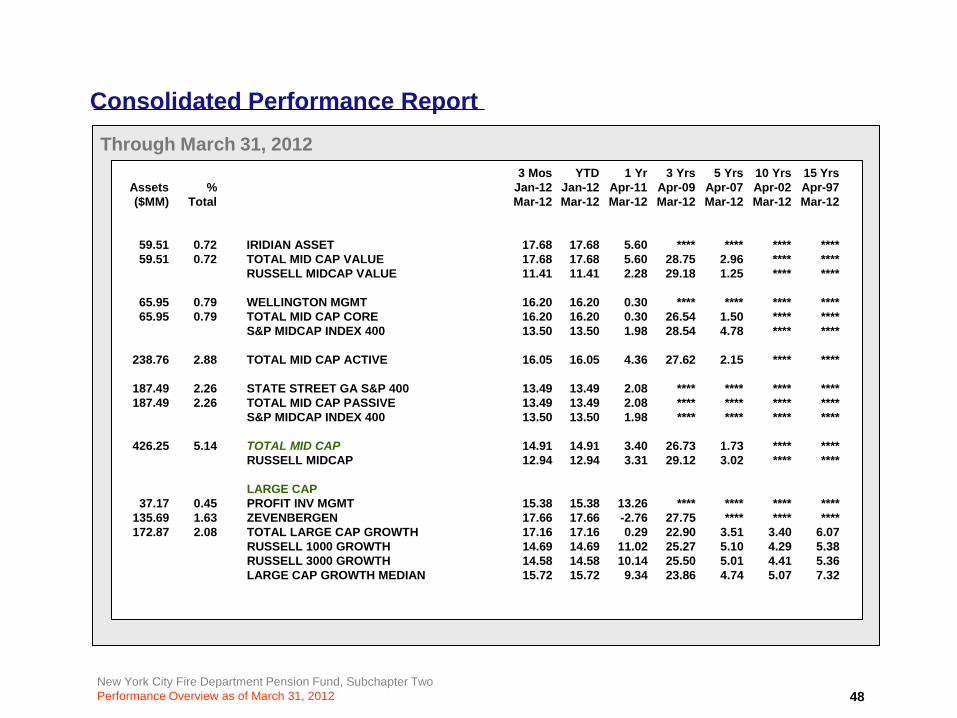
Consolidated Performance ReportThrough March 31, 2012
3 Mos YTD 1 Yr 3 Yrs 5 Yrs 10 Yrs 15 YrsAssets % Jan-12 Jan-12 Apr-11 Apr-09 Apr-07 Apr-02 Apr-97($MM) Total Mar-12 Mar-12 Mar-12 Mar-12 Mar-12 Mar-12 Mar-12
59.51 0.72 IRIDIAN ASSET 17.68 17.68 5.60 **** **** **** ****59.51 0.72 TOTAL MID CAP VALUE 17.68 17.68 5.60 28.75 2.96 **** ****
RUSSELL MIDCAP VALUE 11.41 11.41 2.28 29.18 1.25 **** ****
65.95 0.79 WELLINGTON MGMT 16.20 16.20 0.30 **** **** **** ****65.95 0.79 TOTAL MID CAP CORE 16.20 16.20 0.30 26.54 1.50 **** ****
S&P MIDCAP INDEX 400 13.50 13.50 1.98 28.54 4.78 **** ****
238.76 2.88 TOTAL MID CAP ACTIVE 16.05 16.05 4.36 27.62 2.15 **** ****
187.49 2.26 STATE STREET GA S&P 400 13.49 13.49 2.08 **** **** **** ****187.49 2.26 TOTAL MID CAP PASSIVE 13.49 13.49 2.08 **** **** **** ****
S&P MIDCAP INDEX 400 13.50 13.50 1.98 **** **** **** ****
426.25 5.14 TOTAL MID CAP 14.91 14.91 3.40 26.73 1.73 **** ****RUSSELL MIDCAP 12.94 12.94 3.31 29.12 3.02 **** ****
LARGE CAP37.17 0.45 PROFIT INV MGMT 15.38 15.38 13.26 **** **** **** ****
135.69 1.63 ZEVENBERGEN 17.66 17.66 -2.76 27.75 **** **** ****172.87 2.08 TOTAL LARGE CAP GROWTH 17.16 17.16 0.29 22.90 3.51 3.40 6.07
RUSSELL 1000 GROWTH 14.69 14.69 11.02 25.27 5.10 4.29 5.38RUSSELL 3000 GROWTH 14.58 14.58 10.14 25.50 5.01 4.41 5.36LARGE CAP GROWTH MEDIAN 15.72 15.72 9.34 23.86 4.74 5.07 7.32
New York City Fire Department Pension Fund, Subchapter TwoPerformance Overview as of March 31, 2012 49
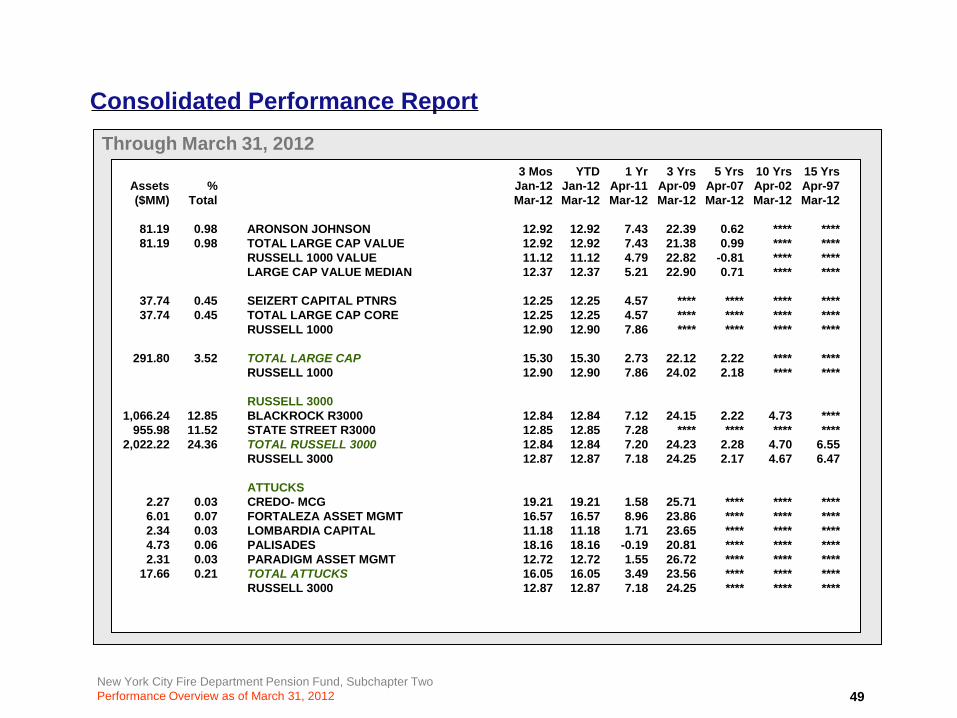
Consolidated Performance ReportThrough March 31, 2012
3 Mos YTD 1 Yr 3 Yrs 5 Yrs 10 Yrs 15 YrsAssets % Jan-12 Jan-12 Apr-11 Apr-09 Apr-07 Apr-02 Apr-97($MM) Total Mar-12 Mar-12 Mar-12 Mar-12 Mar-12 Mar-12 Mar-12
81.19 0.98 ARONSON JOHNSON 12.92 12.92 7.43 22.39 0.62 **** ****81.19 0.98 TOTAL LARGE CAP VALUE 12.92 12.92 7.43 21.38 0.99 **** ****
RUSSELL 1000 VALUE 11.12 11.12 4.79 22.82 -0.81 **** ****LARGE CAP VALUE MEDIAN 12.37 12.37 5.21 22.90 0.71 **** ****
37.74 0.45 SEIZERT CAPITAL PTNRS 12.25 12.25 4.57 **** **** **** ****37.74 0.45 TOTAL LARGE CAP CORE 12.25 12.25 4.57 **** **** **** ****
RUSSELL 1000 12.90 12.90 7.86 **** **** **** ****
291.80 3.52 TOTAL LARGE CAP 15.30 15.30 2.73 22.12 2.22 **** ****RUSSELL 1000 12.90 12.90 7.86 24.02 2.18 **** ****
RUSSELL 30001,066.24 12.85 BLACKROCK R3000 12.84 12.84 7.12 24.15 2.22 4.73 ****
955.98 11.52 STATE STREET R3000 12.85 12.85 7.28 **** **** **** ****2,022.22 24.36 TOTAL RUSSELL 3000 12.84 12.84 7.20 24.23 2.28 4.70 6.55
RUSSELL 3000 12.87 12.87 7.18 24.25 2.17 4.67 6.47
ATTUCKS2.27 0.03 CREDO- MCG 19.21 19.21 1.58 25.71 **** **** ****6.01 0.07 FORTALEZA ASSET MGMT 16.57 16.57 8.96 23.86 **** **** ****2.34 0.03 LOMBARDIA CAPITAL 11.18 11.18 1.71 23.65 **** **** ****4.73 0.06 PALISADES 18.16 18.16 -0.19 20.81 **** **** ****2.31 0.03 PARADIGM ASSET MGMT 12.72 12.72 1.55 26.72 **** **** ****
17.66 0.21 TOTAL ATTUCKS 16.05 16.05 3.49 23.56 **** **** ****RUSSELL 3000 12.87 12.87 7.18 24.25 **** **** ****
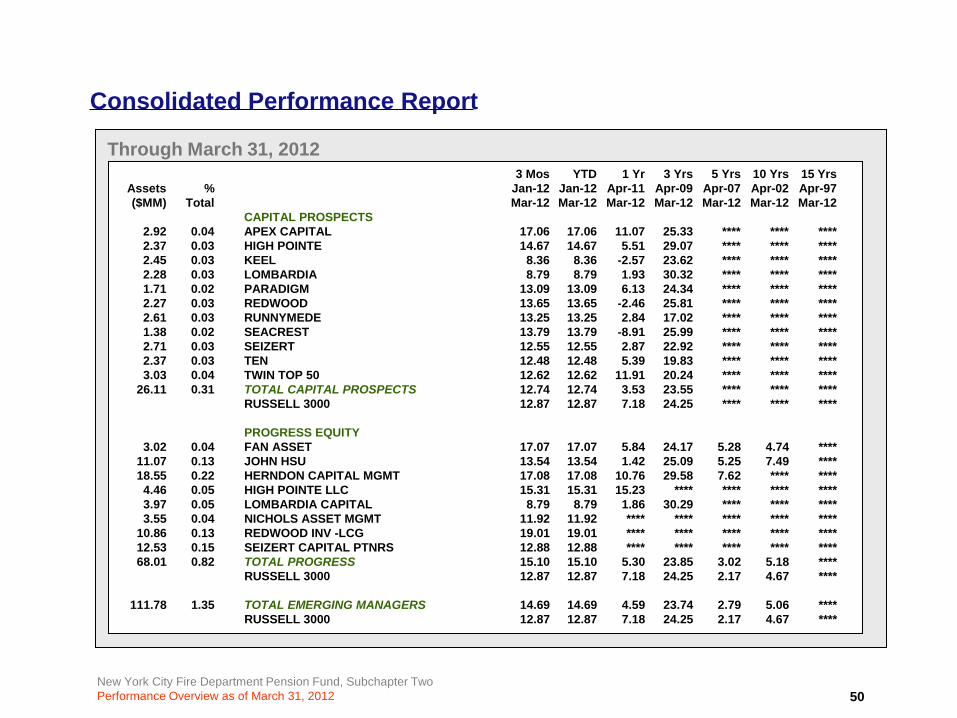
New York City Fire Department Pension Fund, Subchapter TwoPerformance Overview as of March 31, 2012 50
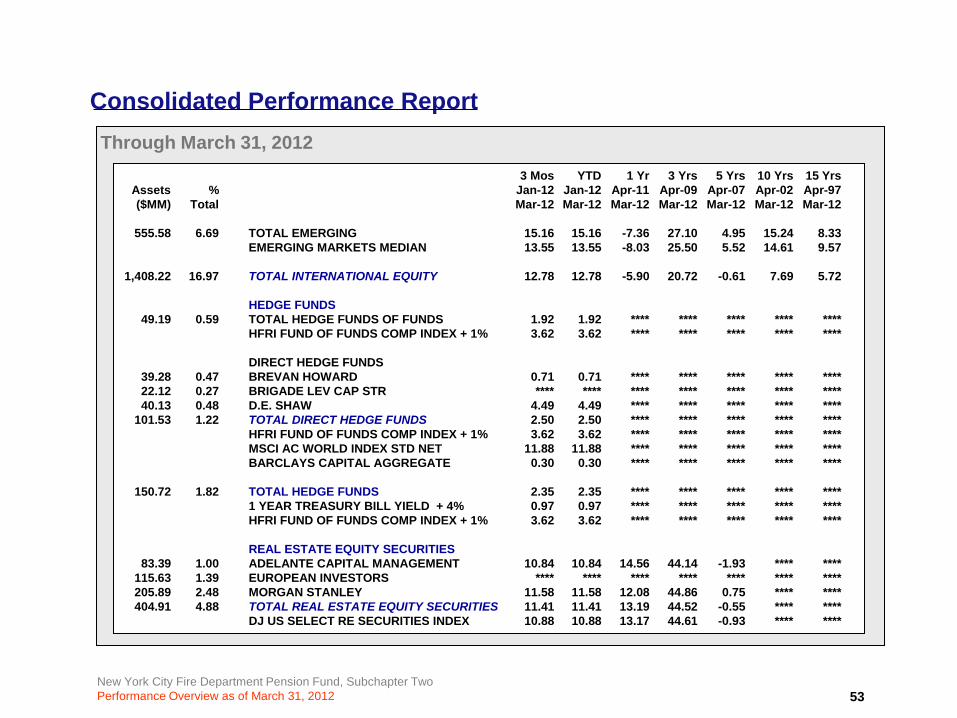
Consolidated Performance Report
Through March 31, 20123 Mos YTD 1 Yr 3 Yrs 5 Yrs 10 Yrs 15 Yrs
Assets % Jan-12 Jan-12 Apr-11 Apr-09 Apr-07 Apr-02 Apr-97($MM) Total Mar-12 Mar-12 Mar-12 Mar-12 Mar-12 Mar-12 Mar-12
CAPITAL PROSPECTS2.92 0.04 APEX CAPITAL 17.06 17.06 11.07 25.33 **** **** ****2.37 0.03 HIGH POINTE 14.67 14.67 5.51 29.07 **** **** ****2.45 0.03 KEEL 8.36 8.36 -2.57 23.62 **** **** ****2.28 0.03 LOMBARDIA 8.79 8.79 1.93 30.32 **** **** ****1.71 0.02 PARADIGM 13.09 13.09 6.13 24.34 **** **** ****2.27 0.03 REDWOOD 13.65 13.65 -2.46 25.81 **** **** ****2.61 0.03 RUNNYMEDE 13.25 13.25 2.84 17.02 **** **** ****1.38 0.02 SEACREST 13.79 13.79 -8.91 25.99 **** **** ****2.71 0.03 SEIZERT 12.55 12.55 2.87 22.92 **** **** ****2.37 0.03 TEN 12.48 12.48 5.39 19.83 **** **** ****3.03 0.04 TWIN TOP 50 12.62 12.62 11.91 20.24 **** **** ****
26.11 0.31 TOTAL CAPITAL PROSPECTS 12.74 12.74 3.53 23.55 **** **** ****RUSSELL 3000 12.87 12.87 7.18 24.25 **** **** ****
PROGRESS EQUITY3.02 0.04 FAN ASSET 17.07 17.07 5.84 24.17 5.28 4.74 ****
11.07 0.13 JOHN HSU 13.54 13.54 1.42 25.09 5.25 7.49 ****18.55 0.22 HERNDON CAPITAL MGMT 17.08 17.08 10.76 29.58 7.62 **** ****4.46 0.05 HIGH POINTE LLC 15.31 15.31 15.23 **** **** **** ****3.97 0.05 LOMBARDIA CAPITAL 8.79 8.79 1.86 30.29 **** **** ****3.55 0.04 NICHOLS ASSET MGMT 11.92 11.92 **** **** **** **** ****
10.86 0.13 REDWOOD INV -LCG 19.01 19.01 **** **** **** **** ****12.53 0.15 SEIZERT CAPITAL PTNRS 12.88 12.88 **** **** **** **** ****68.01 0.82 TOTAL PROGRESS 15.10 15.10 5.30 23.85 3.02 5.18 ****
RUSSELL 3000 12.87 12.87 7.18 24.25 2.17 4.67 ****
111.78 1.35 TOTAL EMERGING MANAGERS 14.69 14.69 4.59 23.74 2.79 5.06 ****RUSSELL 3000 12.87 12.87 7.18 24.25 2.17 4.67 ****
New York City Fire Department Pension Fund, Subchapter TwoPerformance Overview as of March 31, 2012 51
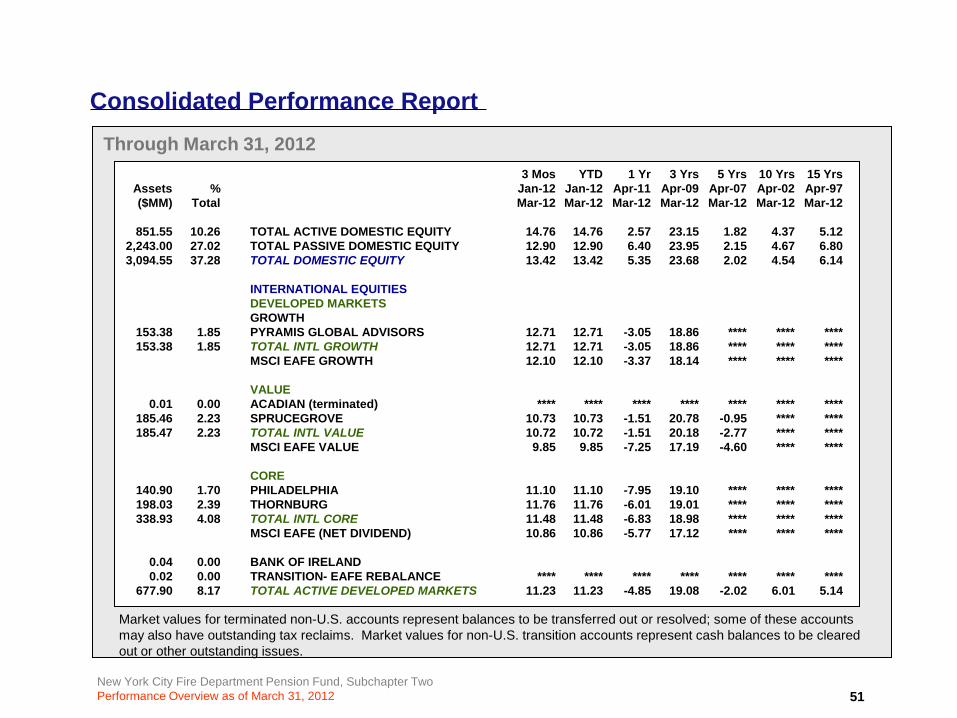
Consolidated Performance ReportThrough March 31, 2012
3 Mos YTD 1 Yr 3 Yrs 5 Yrs 10 Yrs 15 YrsAssets % Jan-12 Jan-12 Apr-11 Apr-09 Apr-07 Apr-02 Apr-97($MM) Total Mar-12 Mar-12 Mar-12 Mar-12 Mar-12 Mar-12 Mar-12
851.55 10.26 TOTAL ACTIVE DOMESTIC EQUITY 14.76 14.76 2.57 23.15 1.82 4.37 5.122,243.00 27.02 TOTAL PASSIVE DOMESTIC EQUITY 12.90 12.90 6.40 23.95 2.15 4.67 6.803,094.55 37.28 TOTAL DOMESTIC EQUITY 13.42 13.42 5.35 23.68 2.02 4.54 6.14
INTERNATIONAL EQUITIESDEVELOPED MARKETSGROWTH
153.38 1.85 PYRAMIS GLOBAL ADVISORS 12.71 12.71 -3.05 18.86 **** **** ****153.38 1.85 TOTAL INTL GROWTH 12.71 12.71 -3.05 18.86 **** **** ****
MSCI EAFE GROWTH 12.10 12.10 -3.37 18.14 **** **** ****
VALUE0.01 0.00 ACADIAN (terminated) **** **** **** **** **** **** ****
185.46 2.23 SPRUCEGROVE 10.73 10.73 -1.51 20.78 -0.95 **** ****185.47 2.23 TOTAL INTL VALUE 10.72 10.72 -1.51 20.18 -2.77 **** ****
MSCI EAFE VALUE 9.85 9.85 -7.25 17.19 -4.60 **** ****
CORE140.90 1.70 PHILADELPHIA 11.10 11.10 -7.95 19.10 **** **** ****198.03 2.39 THORNBURG 11.76 11.76 -6.01 19.01 **** **** ****338.93 4.08 TOTAL INTL CORE 11.48 11.48 -6.83 18.98 **** **** ****
MSCI EAFE (NET DIVIDEND) 10.86 10.86 -5.77 17.12 **** **** ****
0.04 0.00 BANK OF IRELAND0.02 0.00 TRANSITION- EAFE REBALANCE **** **** **** **** **** **** ****
677.90 8.17 TOTAL ACTIVE DEVELOPED MARKETS 11.23 11.23 -4.85 19.08 -2.02 6.01 5.14
Market values for terminated non-U.S. accounts represent balances to be transferred out or resolved; some of these accounts may also have outstanding tax reclaims. Market values for non-U.S. transition accounts represent cash balances to be cleared out or other outstanding issues.
New York City Fire Department Pension Fund, Subchapter TwoPerformance Overview as of March 31, 2012 52
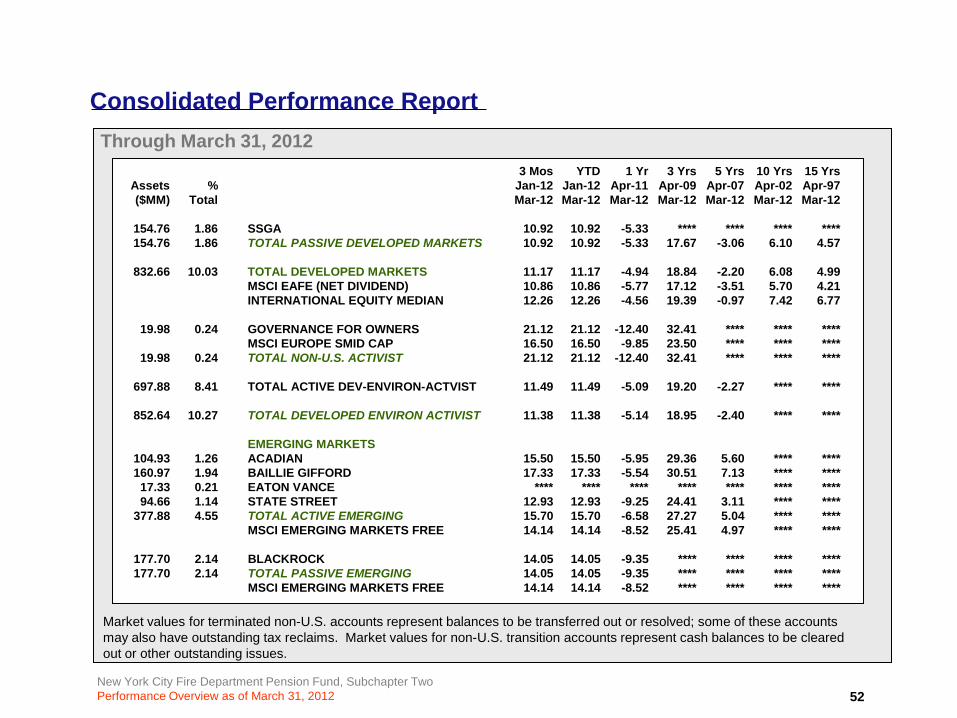
Consolidated Performance ReportThrough March 31, 2012
3 Mos YTD 1 Yr 3 Yrs 5 Yrs 10 Yrs 15 YrsAssets % Jan-12 Jan-12 Apr-11 Apr-09 Apr-07 Apr-02 Apr-97($MM) Total Mar-12 Mar-12 Mar-12 Mar-12 Mar-12 Mar-12 Mar-12
154.76 1.86 SSGA 10.92 10.92 -5.33 **** **** **** ****154.76 1.86 TOTAL PASSIVE DEVELOPED MARKETS 10.92 10.92 -5.33 17.67 -3.06 6.10 4.57
832.66 10.03 TOTAL DEVELOPED MARKETS 11.17 11.17 -4.94 18.84 -2.20 6.08 4.99MSCI EAFE (NET DIVIDEND) 10.86 10.86 -5.77 17.12 -3.51 5.70 4.21INTERNATIONAL EQUITY MEDIAN 12.26 12.26 -4.56 19.39 -0.97 7.42 6.77
19.98 0.24 GOVERNANCE FOR OWNERS 21.12 21.12 -12.40 32.41 **** **** ****MSCI EUROPE SMID CAP 16.50 16.50 -9.85 23.50 **** **** ****
19.98 0.24 TOTAL NON-U.S. ACTIVIST 21.12 21.12 -12.40 32.41 **** **** ****
697.88 8.41 TOTAL ACTIVE DEV-ENVIRON-ACTVIST 11.49 11.49 -5.09 19.20 -2.27 **** ****
852.64 10.27 TOTAL DEVELOPED ENVIRON ACTIVIST 11.38 11.38 -5.14 18.95 -2.40 **** ****
EMERGING MARKETS104.93 1.26 ACADIAN 15.50 15.50 -5.95 29.36 5.60 **** ****160.97 1.94 BAILLIE GIFFORD 17.33 17.33 -5.54 30.51 7.13 **** ****
17.33 0.21 EATON VANCE **** **** **** **** **** **** ****94.66 1.14 STATE STREET 12.93 12.93 -9.25 24.41 3.11 **** ****
377.88 4.55 TOTAL ACTIVE EMERGING 15.70 15.70 -6.58 27.27 5.04 **** ****MSCI EMERGING MARKETS FREE 14.14 14.14 -8.52 25.41 4.97 **** ****
177.70 2.14 BLACKROCK 14.05 14.05 -9.35 **** **** **** ****177.70 2.14 TOTAL PASSIVE EMERGING 14.05 14.05 -9.35 **** **** **** ****
MSCI EMERGING MARKETS FREE 14.14 14.14 -8.52 **** **** **** ****
Market values for terminated non-U.S. accounts represent balances to be transferred out or resolved; some of these accounts may also have outstanding tax reclaims. Market values for non-U.S. transition accounts represent cash balances to be cleared out or other outstanding issues.
New York City Fire Department Pension Fund, Subchapter TwoPerformance Overview as of March 31, 2012 53
Consolidated Performance ReportThrough March 31, 2012
3 Mos YTD 1 Yr 3 Yrs 5 Yrs 10 Yrs 15 YrsAssets % Jan-12 Jan-12 Apr-11 Apr-09 Apr-07 Apr-02 Apr-97($MM) Total Mar-12 Mar-12 Mar-12 Mar-12 Mar-12 Mar-12 Mar-12
555.58 6.69 TOTAL EMERGING 15.16 15.16 -7.36 27.10 4.95 15.24 8.33EMERGING MARKETS MEDIAN 13.55 13.55 -8.03 25.50 5.52 14.61 9.57
1,408.22 16.97 TOTAL INTERNATIONAL EQUITY 12.78 12.78 -5.90 20.72 -0.61 7.69 5.72
HEDGE FUNDS49.19 0.59 TOTAL HEDGE FUNDS OF FUNDS 1.92 1.92 **** **** **** **** ****
HFRI FUND OF FUNDS COMP INDEX + 1% 3.62 3.62 **** **** **** **** ****
DIRECT HEDGE FUNDS39.28 0.47 BREVAN HOWARD 0.71 0.71 **** **** **** **** ****22.12 0.27 BRIGADE LEV CAP STR **** **** **** **** **** **** ****40.13 0.48 D.E. SHAW 4.49 4.49 **** **** **** **** ****
101.53 1.22 TOTAL DIRECT HEDGE FUNDS 2.50 2.50 **** **** **** **** ****HFRI FUND OF FUNDS COMP INDEX + 1% 3.62 3.62 **** **** **** **** ****MSCI AC WORLD INDEX STD NET 11.88 11.88 **** **** **** **** ****BARCLAYS CAPITAL AGGREGATE 0.30 0.30 **** **** **** **** ****
150.72 1.82 TOTAL HEDGE FUNDS 2.35 2.35 **** **** **** **** ****1 YEAR TREASURY BILL YIELD + 4% 0.97 0.97 **** **** **** **** ****HFRI FUND OF FUNDS COMP INDEX + 1% 3.62 3.62 **** **** **** **** ****
REAL ESTATE EQUITY SECURITIES83.39 1.00 ADELANTE CAPITAL MANAGEMENT 10.84 10.84 14.56 44.14 -1.93 **** ****
115.63 1.39 EUROPEAN INVESTORS **** **** **** **** **** **** ****205.89 2.48 MORGAN STANLEY 11.58 11.58 12.08 44.86 0.75 **** ****404.91 4.88 TOTAL REAL ESTATE EQUITY SECURITIES 11.41 11.41 13.19 44.52 -0.55 **** ****
DJ US SELECT RE SECURITIES INDEX 10.88 10.88 13.17 44.61 -0.93 **** ****
New York City Fire Department Pension Fund, Subchapter TwoPerformance Overview as of March 31, 2012 54
Consolidated Performance Report
Through March 31, 20123 Mos YTD 1 Yr 3 Yrs 5 Yrs 10 Yrs 15 Yrs
Assets % Jan-12 Jan-12 Apr-11 Apr-09 Apr-07 Apr-02 Apr-97($MM) Total Mar-12 Mar-12 Mar-12 Mar-12 Mar-12 Mar-12 Mar-12
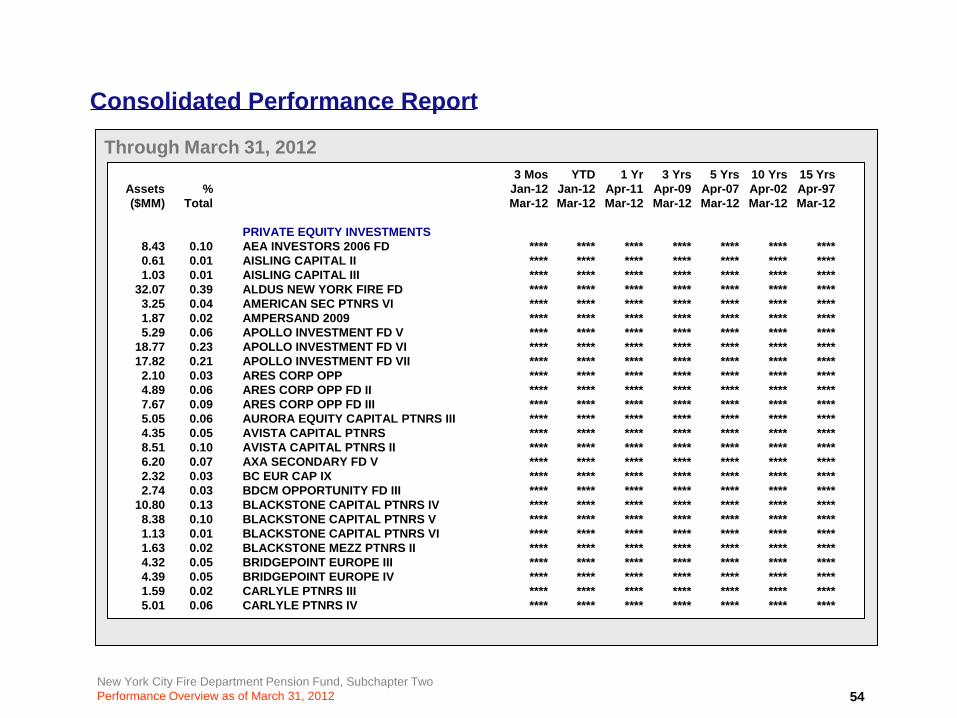
PRIVATE EQUITY INVESTMENTS8.43 0.10 AEA INVESTORS 2006 FD **** **** **** **** **** **** ****0.61 0.01 AISLING CAPITAL II **** **** **** **** **** **** ****1.03 0.01 AISLING CAPITAL III **** **** **** **** **** **** ****
32.07 0.39 ALDUS NEW YORK FIRE FD **** **** **** **** **** **** ****3.25 0.04 AMERICAN SEC PTNRS VI **** **** **** **** **** **** ****1.87 0.02 AMPERSAND 2009 **** **** **** **** **** **** ****5.29 0.06 APOLLO INVESTMENT FD V **** **** **** **** **** **** ****
18.77 0.23 APOLLO INVESTMENT FD VI **** **** **** **** **** **** ****17.82 0.21 APOLLO INVESTMENT FD VII **** **** **** **** **** **** ****2.10 0.03 ARES CORP OPP **** **** **** **** **** **** ****4.89 0.06 ARES CORP OPP FD II **** **** **** **** **** **** ****7.67 0.09 ARES CORP OPP FD III **** **** **** **** **** **** ****5.05 0.06 AURORA EQUITY CAPITAL PTNRS III **** **** **** **** **** **** ****4.35 0.05 AVISTA CAPITAL PTNRS **** **** **** **** **** **** ****8.51 0.10 AVISTA CAPITAL PTNRS II **** **** **** **** **** **** ****6.20 0.07 AXA SECONDARY FD V **** **** **** **** **** **** ****2.32 0.03 BC EUR CAP IX **** **** **** **** **** **** ****2.74 0.03 BDCM OPPORTUNITY FD III **** **** **** **** **** **** ****
10.80 0.13 BLACKSTONE CAPITAL PTNRS IV **** **** **** **** **** **** ****8.38 0.10 BLACKSTONE CAPITAL PTNRS V **** **** **** **** **** **** ****1.13 0.01 BLACKSTONE CAPITAL PTNRS VI **** **** **** **** **** **** ****1.63 0.02 BLACKSTONE MEZZ PTNRS II **** **** **** **** **** **** ****4.32 0.05 BRIDGEPOINT EUROPE III **** **** **** **** **** **** ****4.39 0.05 BRIDGEPOINT EUROPE IV **** **** **** **** **** **** ****1.59 0.02 CARLYLE PTNRS III **** **** **** **** **** **** ****5.01 0.06 CARLYLE PTNRS IV **** **** **** **** **** **** ****
New York City Fire Department Pension Fund, Subchapter TwoPerformance Overview as of March 31, 2012 55
Consolidated Performance Report
Through March 31, 20123 Mos YTD 1 Yr 3 Yrs 5 Yrs 10 Yrs 15 Yrs
Assets % Jan-12 Jan-12 Apr-11 Apr-09 Apr-07 Apr-02 Apr-97($MM) Total Mar-12 Mar-12 Mar-12 Mar-12 Mar-12 Mar-12 Mar-12
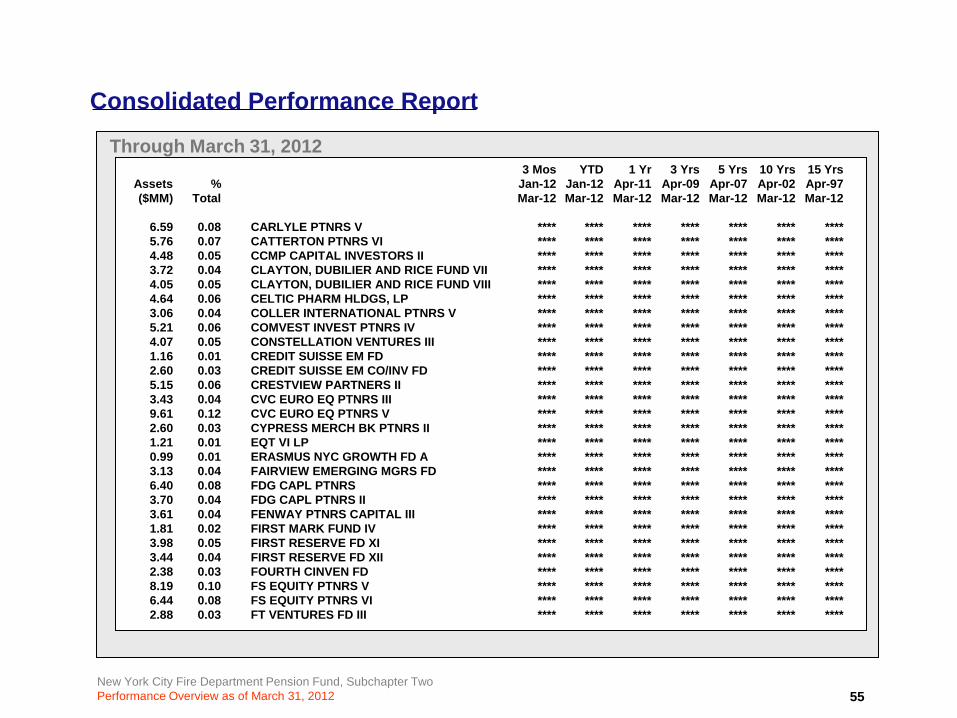
6.59 0.08 CARLYLE PTNRS V **** **** **** **** **** **** ****5.76 0.07 CATTERTON PTNRS VI **** **** **** **** **** **** ****4.48 0.05 CCMP CAPITAL INVESTORS II **** **** **** **** **** **** ****3.72 0.04 CLAYTON, DUBILIER AND RICE FUND VII **** **** **** **** **** **** ****4.05 0.05 CLAYTON, DUBILIER AND RICE FUND VIII **** **** **** **** **** **** ****4.64 0.06 CELTIC PHARM HLDGS, LP **** **** **** **** **** **** ****3.06 0.04 COLLER INTERNATIONAL PTNRS V **** **** **** **** **** **** ****5.21 0.06 COMVEST INVEST PTNRS IV **** **** **** **** **** **** ****4.07 0.05 CONSTELLATION VENTURES III **** **** **** **** **** **** ****1.16 0.01 CREDIT SUISSE EM FD **** **** **** **** **** **** ****2.60 0.03 CREDIT SUISSE EM CO/INV FD **** **** **** **** **** **** ****5.15 0.06 CRESTVIEW PARTNERS II **** **** **** **** **** **** ****3.43 0.04 CVC EURO EQ PTNRS III **** **** **** **** **** **** ****9.61 0.12 CVC EURO EQ PTNRS V **** **** **** **** **** **** ****2.60 0.03 CYPRESS MERCH BK PTNRS II **** **** **** **** **** **** ****1.21 0.01 EQT VI LP **** **** **** **** **** **** ****0.99 0.01 ERASMUS NYC GROWTH FD A **** **** **** **** **** **** ****3.13 0.04 FAIRVIEW EMERGING MGRS FD **** **** **** **** **** **** ****6.40 0.08 FDG CAPL PTNRS **** **** **** **** **** **** ****3.70 0.04 FDG CAPL PTNRS II **** **** **** **** **** **** ****3.61 0.04 FENWAY PTNRS CAPITAL III **** **** **** **** **** **** ****1.81 0.02 FIRST MARK FUND IV **** **** **** **** **** **** ****3.98 0.05 FIRST RESERVE FD XI **** **** **** **** **** **** ****3.44 0.04 FIRST RESERVE FD XII **** **** **** **** **** **** ****2.38 0.03 FOURTH CINVEN FD **** **** **** **** **** **** ****8.19 0.10 FS EQUITY PTNRS V **** **** **** **** **** **** ****6.44 0.08 FS EQUITY PTNRS VI **** **** **** **** **** **** ****2.88 0.03 FT VENTURES FD III **** **** **** **** **** **** ****
New York City Fire Department Pension Fund, Subchapter TwoPerformance Overview as of March 31, 2012 56
Consolidated Performance Report
Through March 31, 20123 Mos YTD 1 Yr 3 Yrs 5 Yrs 10 Yrs 15 Yrs
Assets % Jan-12 Jan-12 Apr-11 Apr-09 Apr-07 Apr-02 Apr-97($MM) Total Mar-12 Mar-12 Mar-12 Mar-12 Mar-12 Mar-12 Mar-12
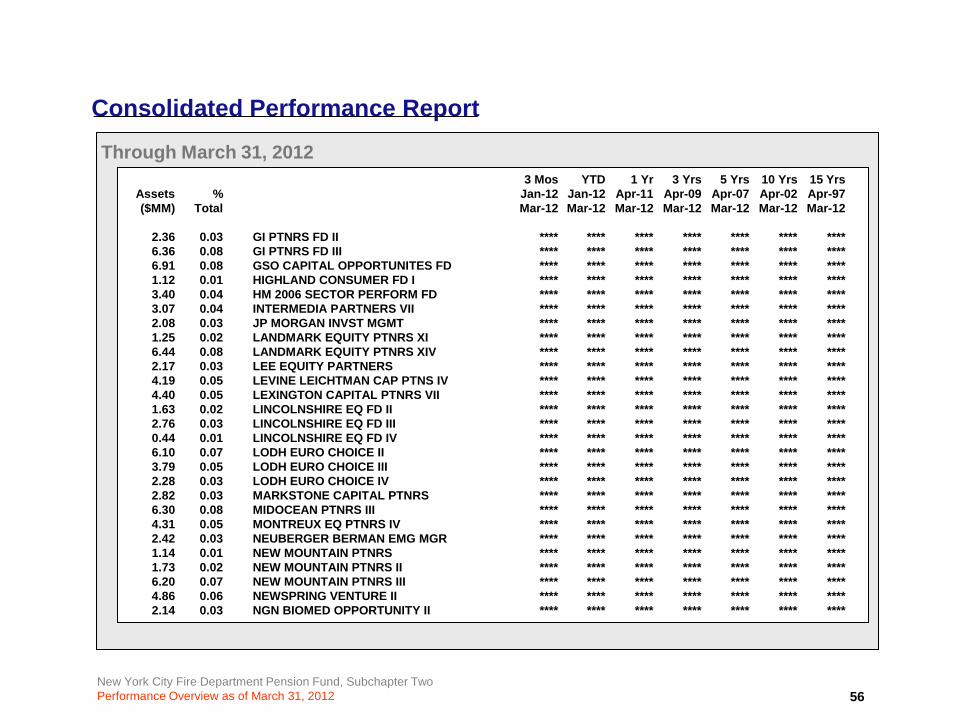
2.36 0.03 GI PTNRS FD II **** **** **** **** **** **** ****6.36 0.08 GI PTNRS FD III **** **** **** **** **** **** ****6.91 0.08 GSO CAPITAL OPPORTUNITES FD **** **** **** **** **** **** ****1.12 0.01 HIGHLAND CONSUMER FD I **** **** **** **** **** **** ****3.40 0.04 HM 2006 SECTOR PERFORM FD **** **** **** **** **** **** ****3.07 0.04 INTERMEDIA PARTNERS VII **** **** **** **** **** **** ****2.08 0.03 JP MORGAN INVST MGMT **** **** **** **** **** **** ****1.25 0.02 LANDMARK EQUITY PTNRS XI **** **** **** **** **** **** ****6.44 0.08 LANDMARK EQUITY PTNRS XIV **** **** **** **** **** **** ****2.17 0.03 LEE EQUITY PARTNERS **** **** **** **** **** **** ****4.19 0.05 LEVINE LEICHTMAN CAP PTNS IV **** **** **** **** **** **** ****4.40 0.05 LEXINGTON CAPITAL PTNRS VII **** **** **** **** **** **** ****1.63 0.02 LINCOLNSHIRE EQ FD II **** **** **** **** **** **** ****2.76 0.03 LINCOLNSHIRE EQ FD III **** **** **** **** **** **** ****0.44 0.01 LINCOLNSHIRE EQ FD IV **** **** **** **** **** **** ****6.10 0.07 LODH EURO CHOICE II **** **** **** **** **** **** ****3.79 0.05 LODH EURO CHOICE III **** **** **** **** **** **** ****2.28 0.03 LODH EURO CHOICE IV **** **** **** **** **** **** ****2.82 0.03 MARKSTONE CAPITAL PTNRS **** **** **** **** **** **** ****6.30 0.08 MIDOCEAN PTNRS III **** **** **** **** **** **** ****4.31 0.05 MONTREUX EQ PTNRS IV **** **** **** **** **** **** ****2.42 0.03 NEUBERGER BERMAN EMG MGR **** **** **** **** **** **** ****1.14 0.01 NEW MOUNTAIN PTNRS **** **** **** **** **** **** ****1.73 0.02 NEW MOUNTAIN PTNRS II **** **** **** **** **** **** ****6.20 0.07 NEW MOUNTAIN PTNRS III **** **** **** **** **** **** ****4.86 0.06 NEWSPRING VENTURE II **** **** **** **** **** **** ****2.14 0.03 NGN BIOMED OPPORTUNITY II **** **** **** **** **** **** ****
New York City Fire Department Pension Fund, Subchapter TwoPerformance Overview as of March 31, 2012 57
Consolidated Performance Report
Through March 31, 20123 Mos YTD 1 Yr 3 Yrs 5 Yrs 10 Yrs 15 Yrs
Assets % Jan-12 Jan-12 Apr-11 Apr-09 Apr-07 Apr-02 Apr-97($MM) Total Mar-12 Mar-12 Mar-12 Mar-12 Mar-12 Mar-12 Mar-12
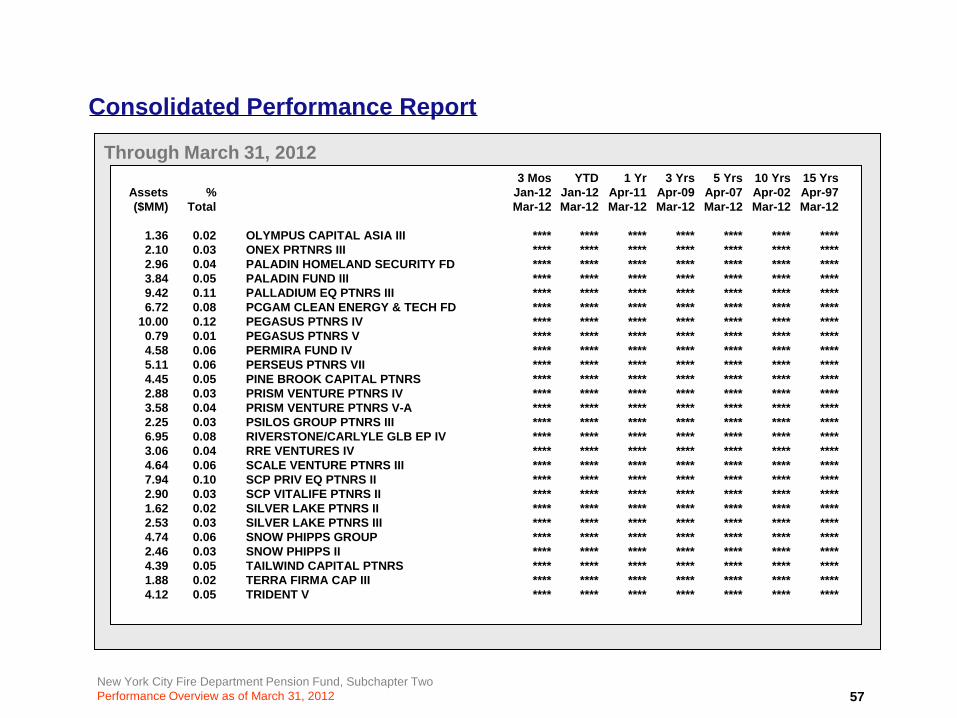
1.36 0.02 OLYMPUS CAPITAL ASIA III **** **** **** **** **** **** ****2.10 0.03 ONEX PRTNRS III **** **** **** **** **** **** ****2.96 0.04 PALADIN HOMELAND SECURITY FD **** **** **** **** **** **** ****3.84 0.05 PALADIN FUND III **** **** **** **** **** **** ****9.42 0.11 PALLADIUM EQ PTNRS III **** **** **** **** **** **** ****6.72 0.08 PCGAM CLEAN ENERGY & TECH FD **** **** **** **** **** **** ****
10.00 0.12 PEGASUS PTNRS IV **** **** **** **** **** **** ****0.79 0.01 PEGASUS PTNRS V **** **** **** **** **** **** ****4.58 0.06 PERMIRA FUND IV **** **** **** **** **** **** ****5.11 0.06 PERSEUS PTNRS VII **** **** **** **** **** **** ****4.45 0.05 PINE BROOK CAPITAL PTNRS **** **** **** **** **** **** ****2.88 0.03 PRISM VENTURE PTNRS IV **** **** **** **** **** **** ****3.58 0.04 PRISM VENTURE PTNRS V-A **** **** **** **** **** **** ****2.25 0.03 PSILOS GROUP PTNRS III **** **** **** **** **** **** ****6.95 0.08 RIVERSTONE/CARLYLE GLB EP IV **** **** **** **** **** **** ****3.06 0.04 RRE VENTURES IV **** **** **** **** **** **** ****4.64 0.06 SCALE VENTURE PTNRS III **** **** **** **** **** **** ****7.94 0.10 SCP PRIV EQ PTNRS II **** **** **** **** **** **** ****2.90 0.03 SCP VITALIFE PTNRS II **** **** **** **** **** **** ****1.62 0.02 SILVER LAKE PTNRS II **** **** **** **** **** **** ****2.53 0.03 SILVER LAKE PTNRS III **** **** **** **** **** **** ****4.74 0.06 SNOW PHIPPS GROUP **** **** **** **** **** **** ****2.46 0.03 SNOW PHIPPS II **** **** **** **** **** **** ****4.39 0.05 TAILWIND CAPITAL PTNRS **** **** **** **** **** **** ****1.88 0.02 TERRA FIRMA CAP III **** **** **** **** **** **** ****4.12 0.05 TRIDENT V **** **** **** **** **** **** ****
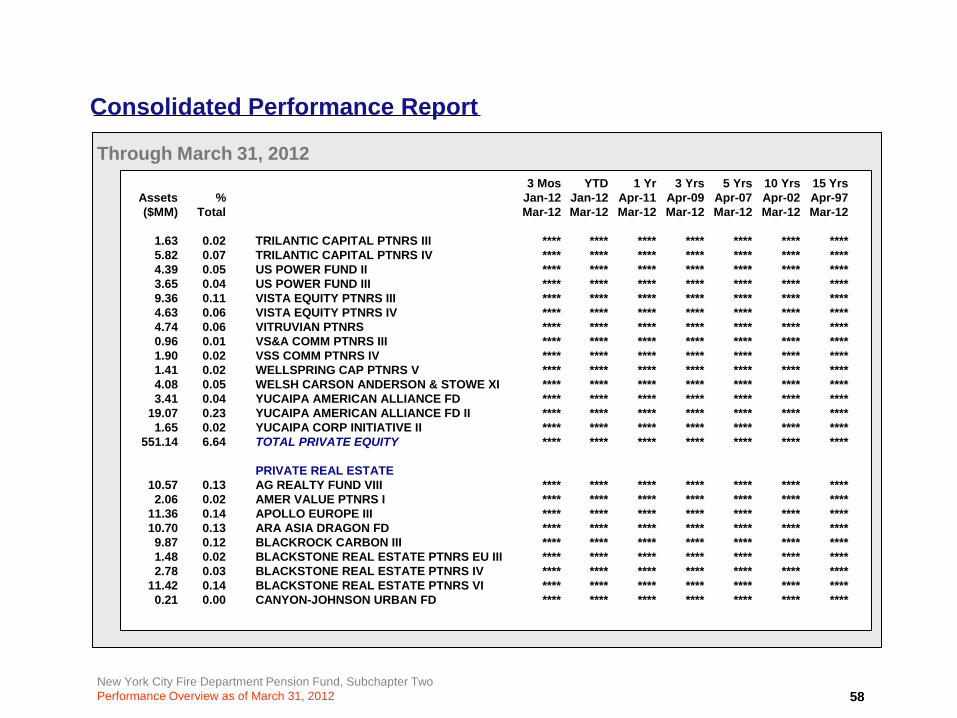
New York City Fire Department Pension Fund, Subchapter TwoPerformance Overview as of March 31, 2012 58
Consolidated Performance Report
Through March 31, 20123 Mos YTD 1 Yr 3 Yrs 5 Yrs 10 Yrs 15 Yrs
Assets % Jan-12 Jan-12 Apr-11 Apr-09 Apr-07 Apr-02 Apr-97($MM) Total Mar-12 Mar-12 Mar-12 Mar-12 Mar-12 Mar-12 Mar-12
1.63 0.02 TRILANTIC CAPITAL PTNRS III **** **** **** **** **** **** ****5.82 0.07 TRILANTIC CAPITAL PTNRS IV **** **** **** **** **** **** ****4.39 0.05 US POWER FUND II **** **** **** **** **** **** ****3.65 0.04 US POWER FUND III **** **** **** **** **** **** ****9.36 0.11 VISTA EQUITY PTNRS III **** **** **** **** **** **** ****4.63 0.06 VISTA EQUITY PTNRS IV **** **** **** **** **** **** ****4.74 0.06 VITRUVIAN PTNRS **** **** **** **** **** **** ****0.96 0.01 VS&A COMM PTNRS III **** **** **** **** **** **** ****1.90 0.02 VSS COMM PTNRS IV **** **** **** **** **** **** ****1.41 0.02 WELLSPRING CAP PTNRS V **** **** **** **** **** **** ****4.08 0.05 WELSH CARSON ANDERSON & STOWE XI **** **** **** **** **** **** ****3.41 0.04 YUCAIPA AMERICAN ALLIANCE FD **** **** **** **** **** **** ****
19.07 0.23 YUCAIPA AMERICAN ALLIANCE FD II **** **** **** **** **** **** ****1.65 0.02 YUCAIPA CORP INITIATIVE II **** **** **** **** **** **** ****
551.14 6.64 TOTAL PRIVATE EQUITY **** **** **** **** **** **** ****
PRIVATE REAL ESTATE10.57 0.13 AG REALTY FUND VIII **** **** **** **** **** **** ****2.06 0.02 AMER VALUE PTNRS I **** **** **** **** **** **** ****
11.36 0.14 APOLLO EUROPE III **** **** **** **** **** **** ****10.70 0.13 ARA ASIA DRAGON FD **** **** **** **** **** **** ****9.87 0.12 BLACKROCK CARBON III **** **** **** **** **** **** ****1.48 0.02 BLACKSTONE REAL ESTATE PTNRS EU III **** **** **** **** **** **** ****2.78 0.03 BLACKSTONE REAL ESTATE PTNRS IV **** **** **** **** **** **** ****
11.42 0.14 BLACKSTONE REAL ESTATE PTNRS VI **** **** **** **** **** **** ****0.21 0.00 CANYON-JOHNSON URBAN FD **** **** **** **** **** **** ****
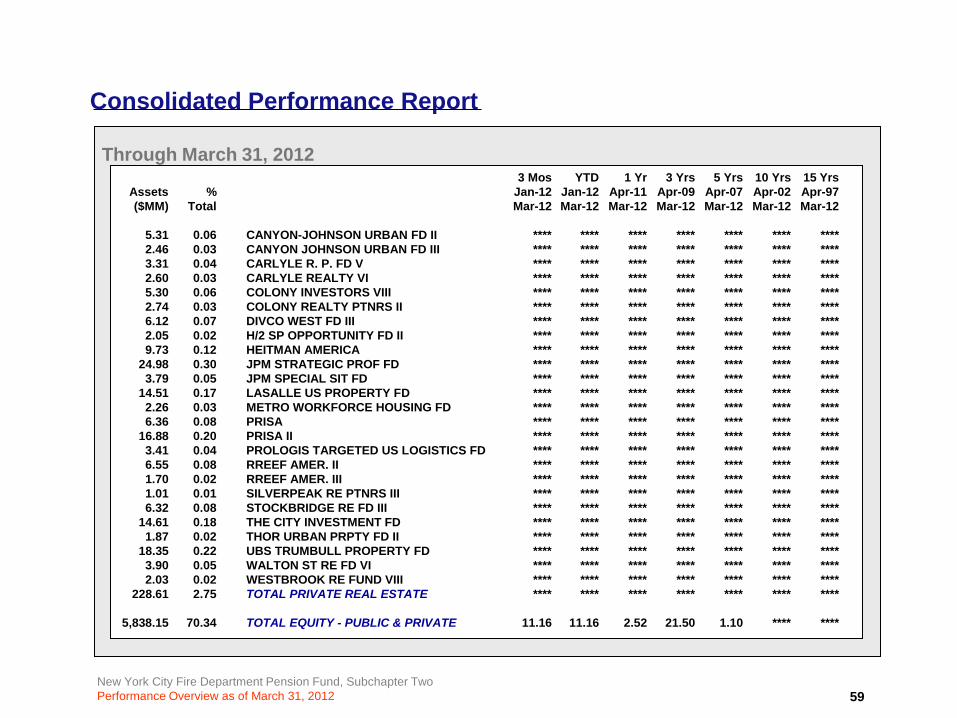
New York City Fire Department Pension Fund, Subchapter TwoPerformance Overview as of March 31, 2012 59
Consolidated Performance Report
Through March 31, 20123 Mos YTD 1 Yr 3 Yrs 5 Yrs 10 Yrs 15 Yrs
Assets % Jan-12 Jan-12 Apr-11 Apr-09 Apr-07 Apr-02 Apr-97($MM) Total Mar-12 Mar-12 Mar-12 Mar-12 Mar-12 Mar-12 Mar-12
5.31 0.06 CANYON-JOHNSON URBAN FD II **** **** **** **** **** **** ****2.46 0.03 CANYON JOHNSON URBAN FD III **** **** **** **** **** **** ****3.31 0.04 CARLYLE R. P. FD V **** **** **** **** **** **** ****2.60 0.03 CARLYLE REALTY VI **** **** **** **** **** **** ****5.30 0.06 COLONY INVESTORS VIII **** **** **** **** **** **** ****2.74 0.03 COLONY REALTY PTNRS II **** **** **** **** **** **** ****6.12 0.07 DIVCO WEST FD III **** **** **** **** **** **** ****2.05 0.02 H/2 SP OPPORTUNITY FD II **** **** **** **** **** **** ****9.73 0.12 HEITMAN AMERICA **** **** **** **** **** **** ****
24.98 0.30 JPM STRATEGIC PROF FD **** **** **** **** **** **** ****3.79 0.05 JPM SPECIAL SIT FD **** **** **** **** **** **** ****
14.51 0.17 LASALLE US PROPERTY FD **** **** **** **** **** **** ****2.26 0.03 METRO WORKFORCE HOUSING FD **** **** **** **** **** **** ****6.36 0.08 PRISA **** **** **** **** **** **** ****
16.88 0.20 PRISA II **** **** **** **** **** **** ****3.41 0.04 PROLOGIS TARGETED US LOGISTICS FD **** **** **** **** **** **** ****6.55 0.08 RREEF AMER. II **** **** **** **** **** **** ****1.70 0.02 RREEF AMER. III **** **** **** **** **** **** ****1.01 0.01 SILVERPEAK RE PTNRS III **** **** **** **** **** **** ****6.32 0.08 STOCKBRIDGE RE FD III **** **** **** **** **** **** ****
14.61 0.18 THE CITY INVESTMENT FD **** **** **** **** **** **** ****1.87 0.02 THOR URBAN PRPTY FD II **** **** **** **** **** **** ****
18.35 0.22 UBS TRUMBULL PROPERTY FD **** **** **** **** **** **** ****3.90 0.05 WALTON ST RE FD VI **** **** **** **** **** **** ****2.03 0.02 WESTBROOK RE FUND VIII **** **** **** **** **** **** ****
228.61 2.75 TOTAL PRIVATE REAL ESTATE **** **** **** **** **** **** ****
5,838.15 70.34 TOTAL EQUITY - PUBLIC & PRIVATE 11.16 11.16 2.52 21.50 1.10 **** ****
New York City Fire Department Pension Fund, Subchapter TwoPerformance Overview as of March 31, 2012 60
Consolidated Performance Report
Through March 31, 20123 Mos YTD 1 Yr 3 Yrs 5 Yrs 10 Yrs 15 Yrs
Assets % Jan-12 Jan-12 Apr-11 Apr-09 Apr-07 Apr-02 Apr-97($MM) Total Mar-12 Mar-12 Mar-12 Mar-12 Mar-12 Mar-12 Mar-12
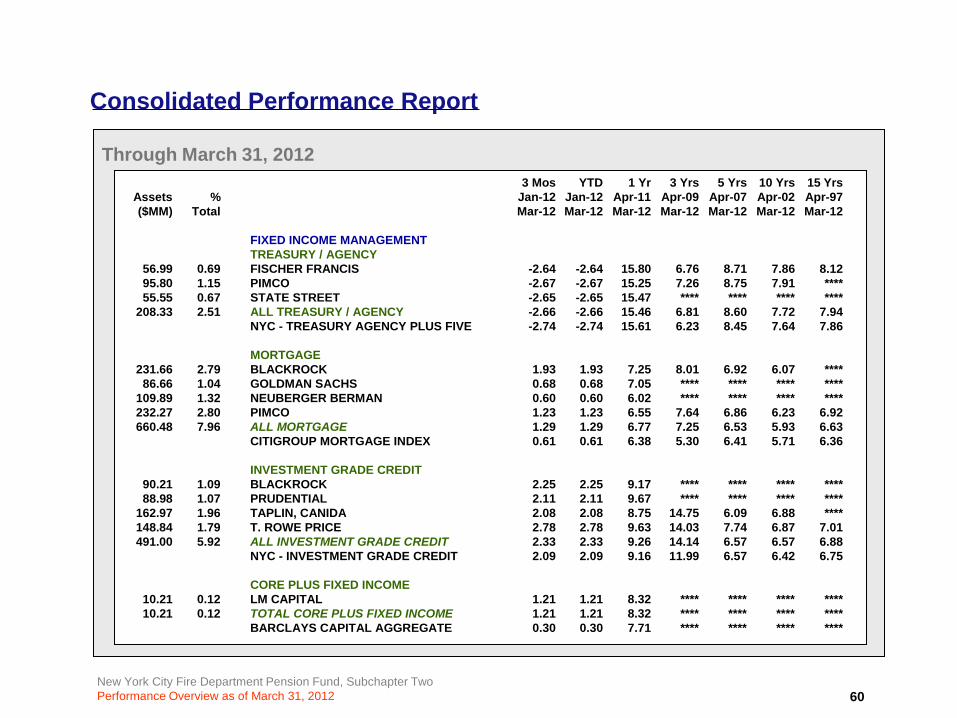
FIXED INCOME MANAGEMENTTREASURY / AGENCY
56.99 0.69 FISCHER FRANCIS -2.64 -2.64 15.80 6.76 8.71 7.86 8.1295.80 1.15 PIMCO -2.67 -2.67 15.25 7.26 8.75 7.91 ****55.55 0.67 STATE STREET -2.65 -2.65 15.47 **** **** **** ****
208.33 2.51 ALL TREASURY / AGENCY -2.66 -2.66 15.46 6.81 8.60 7.72 7.94NYC - TREASURY AGENCY PLUS FIVE -2.74 -2.74 15.61 6.23 8.45 7.64 7.86
MORTGAGE231.66 2.79 BLACKROCK 1.93 1.93 7.25 8.01 6.92 6.07 ****
86.66 1.04 GOLDMAN SACHS 0.68 0.68 7.05 **** **** **** ****109.89 1.32 NEUBERGER BERMAN 0.60 0.60 6.02 **** **** **** ****232.27 2.80 PIMCO 1.23 1.23 6.55 7.64 6.86 6.23 6.92660.48 7.96 ALL MORTGAGE 1.29 1.29 6.77 7.25 6.53 5.93 6.63
CITIGROUP MORTGAGE INDEX 0.61 0.61 6.38 5.30 6.41 5.71 6.36
INVESTMENT GRADE CREDIT90.21 1.09 BLACKROCK 2.25 2.25 9.17 **** **** **** ****88.98 1.07 PRUDENTIAL 2.11 2.11 9.67 **** **** **** ****
162.97 1.96 TAPLIN, CANIDA 2.08 2.08 8.75 14.75 6.09 6.88 ****148.84 1.79 T. ROWE PRICE 2.78 2.78 9.63 14.03 7.74 6.87 7.01491.00 5.92 ALL INVESTMENT GRADE CREDIT 2.33 2.33 9.26 14.14 6.57 6.57 6.88
NYC - INVESTMENT GRADE CREDIT 2.09 2.09 9.16 11.99 6.57 6.42 6.75
CORE PLUS FIXED INCOME10.21 0.12 LM CAPITAL 1.21 1.21 8.32 **** **** **** ****10.21 0.12 TOTAL CORE PLUS FIXED INCOME 1.21 1.21 8.32 **** **** **** ****
BARCLAYS CAPITAL AGGREGATE 0.30 0.30 7.71 **** **** **** ****
New York City Fire Department Pension Fund, Subchapter TwoPerformance Overview as of March 31, 2012 61
Consolidated Performance Report
Through March 31, 20123 Mos YTD 1 Yr 3 Yrs 5 Yrs 10 Yrs 15 Yrs
Assets % Jan-12 Jan-12 Apr-11 Apr-09 Apr-07 Apr-02 Apr-97($MM) Total Mar-12 Mar-12 Mar-12 Mar-12 Mar-12 Mar-12 Mar-12
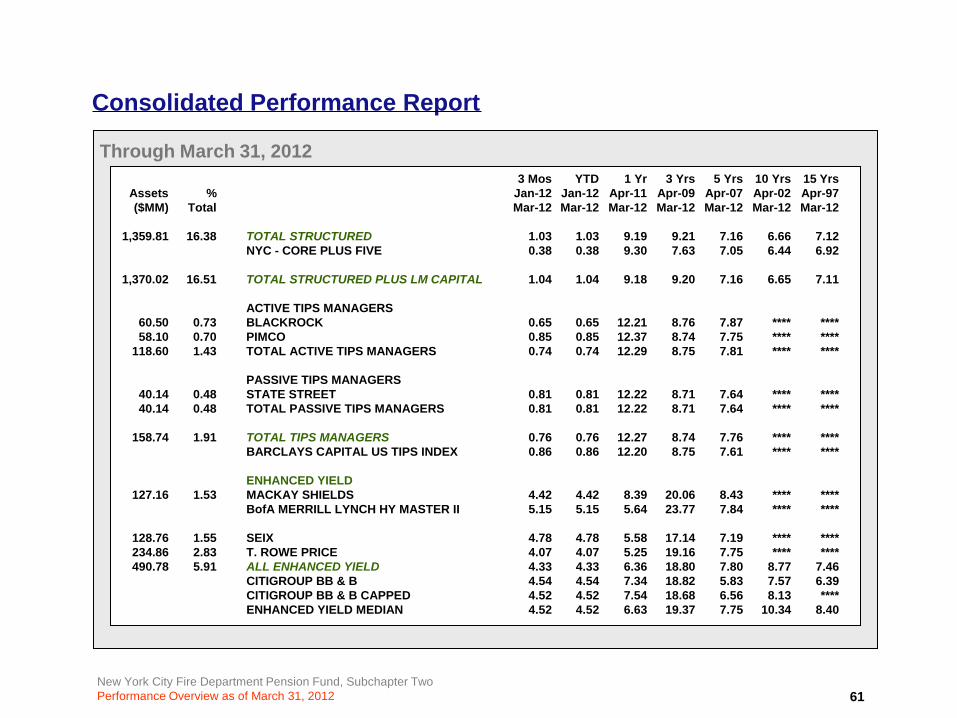
1,359.81 16.38 TOTAL STRUCTURED 1.03 1.03 9.19 9.21 7.16 6.66 7.12NYC - CORE PLUS FIVE 0.38 0.38 9.30 7.63 7.05 6.44 6.92
1,370.02 16.51 TOTAL STRUCTURED PLUS LM CAPITAL 1.04 1.04 9.18 9.20 7.16 6.65 7.11
ACTIVE TIPS MANAGERS60.50 0.73 BLACKROCK 0.65 0.65 12.21 8.76 7.87 **** ****58.10 0.70 PIMCO 0.85 0.85 12.37 8.74 7.75 **** ****
118.60 1.43 TOTAL ACTIVE TIPS MANAGERS 0.74 0.74 12.29 8.75 7.81 **** ****
PASSIVE TIPS MANAGERS40.14 0.48 STATE STREET 0.81 0.81 12.22 8.71 7.64 **** ****40.14 0.48 TOTAL PASSIVE TIPS MANAGERS 0.81 0.81 12.22 8.71 7.64 **** ****
158.74 1.91 TOTAL TIPS MANAGERS 0.76 0.76 12.27 8.74 7.76 **** ****BARCLAYS CAPITAL US TIPS INDEX 0.86 0.86 12.20 8.75 7.61 **** ****
ENHANCED YIELD127.16 1.53 MACKAY SHIELDS 4.42 4.42 8.39 20.06 8.43 **** ****
BofA MERRILL LYNCH HY MASTER II 5.15 5.15 5.64 23.77 7.84 **** ****
128.76 1.55 SEIX 4.78 4.78 5.58 17.14 7.19 **** ****234.86 2.83 T. ROWE PRICE 4.07 4.07 5.25 19.16 7.75 **** ****490.78 5.91 ALL ENHANCED YIELD 4.33 4.33 6.36 18.80 7.80 8.77 7.46
CITIGROUP BB & B 4.54 4.54 7.34 18.82 5.83 7.57 6.39CITIGROUP BB & B CAPPED 4.52 4.52 7.54 18.68 6.56 8.13 ****ENHANCED YIELD MEDIAN 4.52 4.52 6.63 19.37 7.75 10.34 8.40
New York City Fire Department Pension Fund, Subchapter TwoPerformance Overview as of March 31, 2012 62
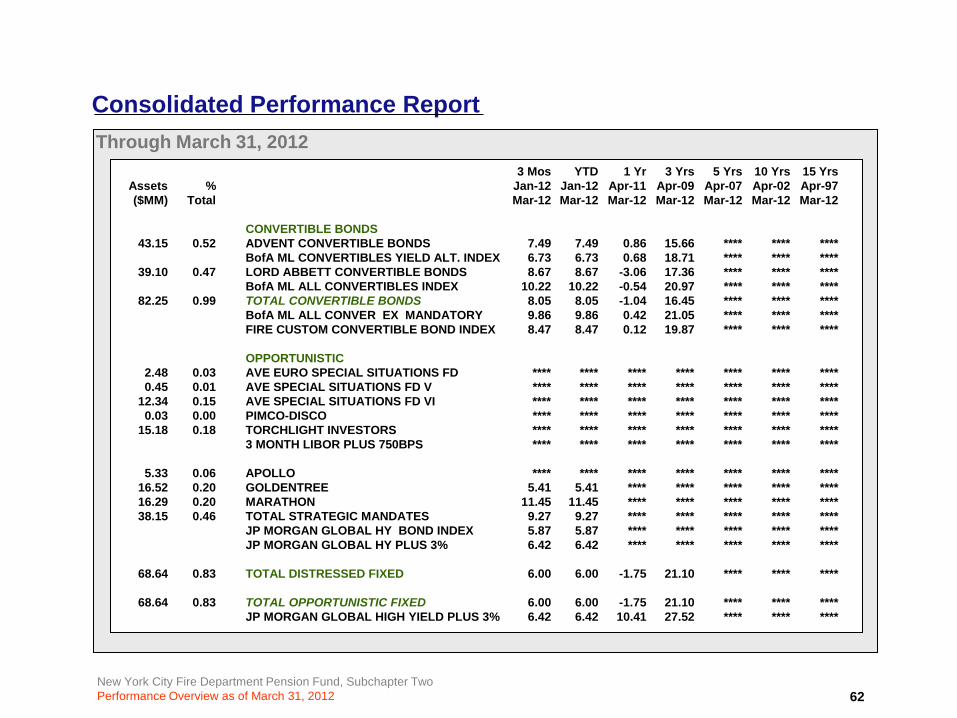
Consolidated Performance ReportThrough March 31, 2012
3 Mos YTD 1 Yr 3 Yrs 5 Yrs 10 Yrs 15 YrsAssets % Jan-12 Jan-12 Apr-11 Apr-09 Apr-07 Apr-02 Apr-97($MM) Total Mar-12 Mar-12 Mar-12 Mar-12 Mar-12 Mar-12 Mar-12
CONVERTIBLE BONDS43.15 0.52 ADVENT CONVERTIBLE BONDS 7.49 7.49 0.86 15.66 **** **** ****
BofA ML CONVERTIBLES YIELD ALT. INDEX 6.73 6.73 0.68 18.71 **** **** ****39.10 0.47 LORD ABBETT CONVERTIBLE BONDS 8.67 8.67 -3.06 17.36 **** **** ****
BofA ML ALL CONVERTIBLES INDEX 10.22 10.22 -0.54 20.97 **** **** ****82.25 0.99 TOTAL CONVERTIBLE BONDS 8.05 8.05 -1.04 16.45 **** **** ****
BofA ML ALL CONVER EX MANDATORY 9.86 9.86 0.42 21.05 **** **** ****FIRE CUSTOM CONVERTIBLE BOND INDEX 8.47 8.47 0.12 19.87 **** **** ****
OPPORTUNISTIC2.48 0.03 AVE EURO SPECIAL SITUATIONS FD **** **** **** **** **** **** ****0.45 0.01 AVE SPECIAL SITUATIONS FD V **** **** **** **** **** **** ****
12.34 0.15 AVE SPECIAL SITUATIONS FD VI **** **** **** **** **** **** ****0.03 0.00 PIMCO-DISCO **** **** **** **** **** **** ****
15.18 0.18 TORCHLIGHT INVESTORS **** **** **** **** **** **** ****3 MONTH LIBOR PLUS 750BPS **** **** **** **** **** **** ****
5.33 0.06 APOLLO **** **** **** **** **** **** ****16.52 0.20 GOLDENTREE 5.41 5.41 **** **** **** **** ****16.29 0.20 MARATHON 11.45 11.45 **** **** **** **** ****38.15 0.46 TOTAL STRATEGIC MANDATES 9.27 9.27 **** **** **** **** ****
JP MORGAN GLOBAL HY BOND INDEX 5.87 5.87 **** **** **** **** ****JP MORGAN GLOBAL HY PLUS 3% 6.42 6.42 **** **** **** **** ****
68.64 0.83 TOTAL DISTRESSED FIXED 6.00 6.00 -1.75 21.10 **** **** ****
68.64 0.83 TOTAL OPPORTUNISTIC FIXED 6.00 6.00 -1.75 21.10 **** **** ****JP MORGAN GLOBAL HIGH YIELD PLUS 3% 6.42 6.42 10.41 27.52 **** **** ****
New York City Fire Department Pension Fund, Subchapter TwoPerformance Overview as of March 31, 2012 63
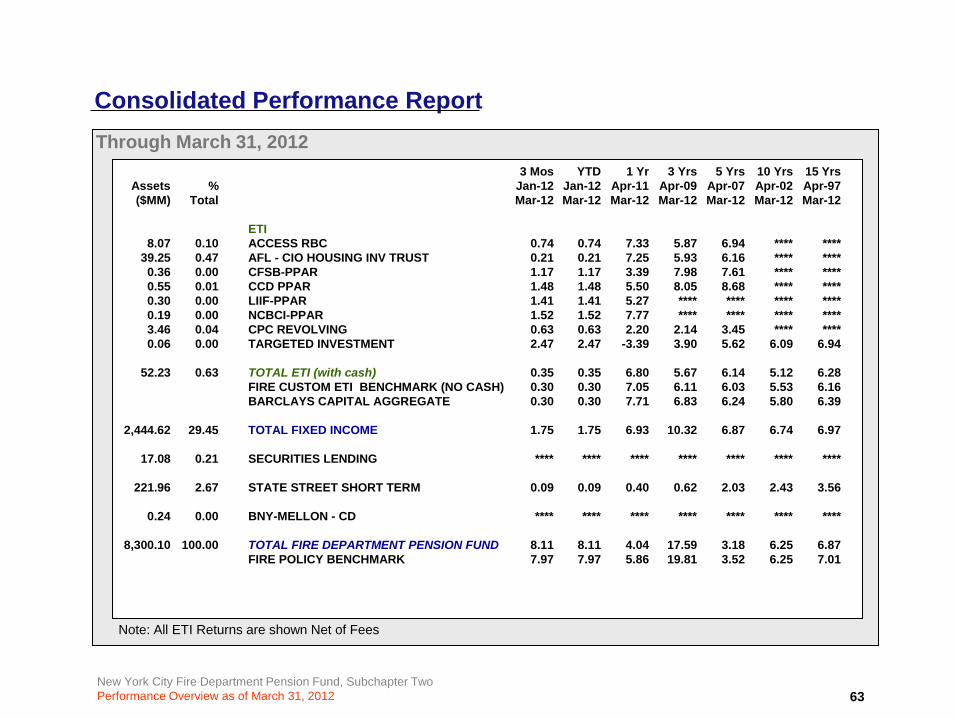
Consolidated Performance ReportThrough March 31, 2012
3 Mos YTD 1 Yr 3 Yrs 5 Yrs 10 Yrs 15 YrsAssets % Jan-12 Jan-12 Apr-11 Apr-09 Apr-07 Apr-02 Apr-97($MM) Total Mar-12 Mar-12 Mar-12 Mar-12 Mar-12 Mar-12 Mar-12
ETI8.07 0.10 ACCESS RBC 0.74 0.74 7.33 5.87 6.94 **** ****
39.25 0.47 AFL - CIO HOUSING INV TRUST 0.21 0.21 7.25 5.93 6.16 **** ****0.36 0.00 CFSB-PPAR 1.17 1.17 3.39 7.98 7.61 **** ****0.55 0.01 CCD PPAR 1.48 1.48 5.50 8.05 8.68 **** ****0.30 0.00 LIIF-PPAR 1.41 1.41 5.27 **** **** **** ****0.19 0.00 NCBCI-PPAR 1.52 1.52 7.77 **** **** **** ****3.46 0.04 CPC REVOLVING 0.63 0.63 2.20 2.14 3.45 **** ****0.06 0.00 TARGETED INVESTMENT 2.47 2.47 -3.39 3.90 5.62 6.09 6.94
52.23 0.63 TOTAL ETI (with cash) 0.35 0.35 6.80 5.67 6.14 5.12 6.28FIRE CUSTOM ETI BENCHMARK (NO CASH) 0.30 0.30 7.05 6.11 6.03 5.53 6.16BARCLAYS CAPITAL AGGREGATE 0.30 0.30 7.71 6.83 6.24 5.80 6.39
2,444.62 29.45 TOTAL FIXED INCOME 1.75 1.75 6.93 10.32 6.87 6.74 6.97
17.08 0.21 SECURITIES LENDING **** **** **** **** **** **** ****
221.96 2.67 STATE STREET SHORT TERM 0.09 0.09 0.40 0.62 2.03 2.43 3.56
0.24 0.00 BNY-MELLON - CD **** **** **** **** **** **** ****
8,300.10 100.00 TOTAL FIRE DEPARTMENT PENSION FUND 8.11 8.11 4.04 17.59 3.18 6.25 6.87FIRE POLICY BENCHMARK 7.97 7.97 5.86 19.81 3.52 6.25 7.01
Note: All ETI Returns are shown Net of Fees
New York City Fire Department Pension Fund, Subchapter TwoPerformance Overview as of March 31, 2012
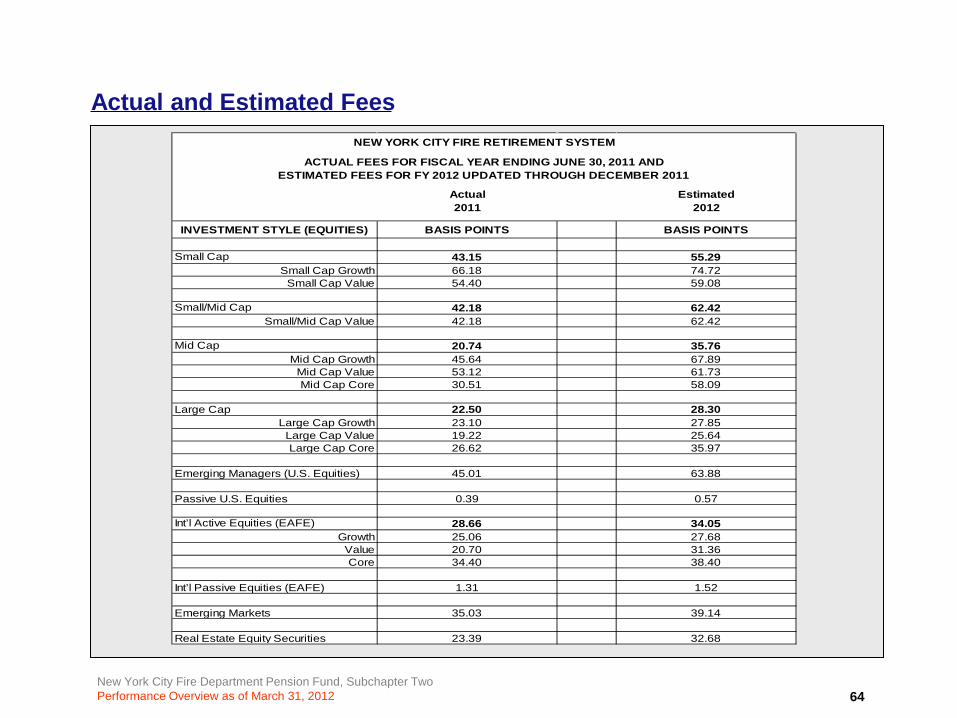
Actual and Estimated Fees
64
Actual Estimated2011 2012
INVESTMENT STYLE (EQUITIES) BASIS POINTS BASIS POINTS
Small Cap 43.15 55.29Small Cap Growth 66.18 74.72
Small Cap Value 54.40 59.08
Small/Mid Cap 42.18 62.42Small/Mid Cap Value 42.18 62.42
Mid Cap 20.74 35.76Mid Cap Growth 45.64 67.89
Mid Cap Value 53.12 61.73Mid Cap Core 30.51 58.09
Large Cap 22.50 28.30Large Cap Growth 23.10 27.85
Large Cap Value 19.22 25.64Large Cap Core 26.62 35.97
Emerging Managers (U.S. Equities) 45.01 63.88
Passive U.S. Equities 0.39 0.57
Int’l Active Equities (EAFE) 28.66 34.05Growth 25.06 27.68
Value 20.70 31.36Core 34.40 38.40
Int’l Passive Equities (EAFE) 1.31 1.52
Emerging Markets 35.03 39.14
Real Estate Equity Securities 23.39 32.68
ESTIMATED FEES FOR FY 2012 UPDATED THROUGH DECEMBER 2011
NEW YORK CITY FIRE RETIREMENT SYSTEM
ACTUAL FEES FOR FISCAL YEAR ENDING JUNE 30, 2011 AND
New York City Fire Department Pension Fund, Subchapter TwoPerformance Overview as of March 31, 2012 65
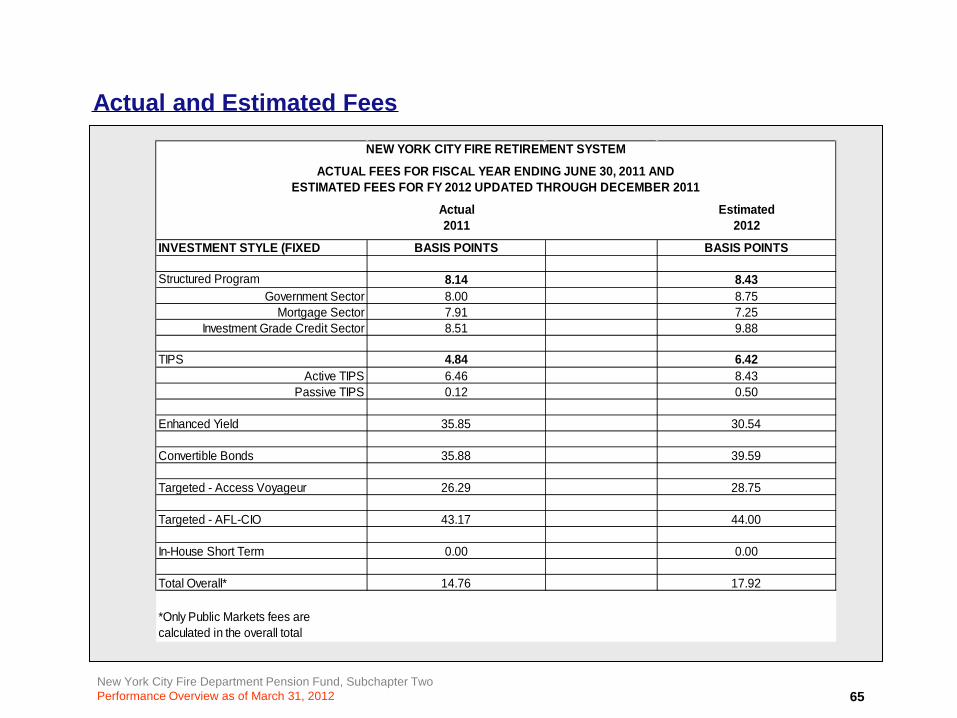
Actual and Estimated Fees
Actual Estimated2011 2012
INVESTMENT STYLE (FIXED BASIS POINTS BASIS POINTS
Structured Program 8.14 8.43Government Sector 8.00 8.75 Mortgage Sector 7.91 7.25
Investment Grade Credit Sector 8.51 9.88
TIPS 4.84 6.42Active TIPS 6.46 8.43
Passive TIPS 0.12 0.50
Enhanced Yield 35.85 30.54
Convertible Bonds 35.88 39.59
Targeted - Access Voyageur 26.29 28.75
Targeted - AFL-CIO 43.17 44.00
In-House Short Term 0.00 0.00
Total Overall* 14.76 17.92
*Only Public Markets fees are calculated in the overall total
ESTIMATED FEES FOR FY 2012 UPDATED THROUGH DECEMBER 2011
NEW YORK CITY FIRE RETIREMENT SYSTEM
ACTUAL FEES FOR FISCAL YEAR ENDING JUNE 30, 2011 AND
New York City Fire Department Pension Fund, Subchapter TwoPerformance Overview as of March 31, 2012
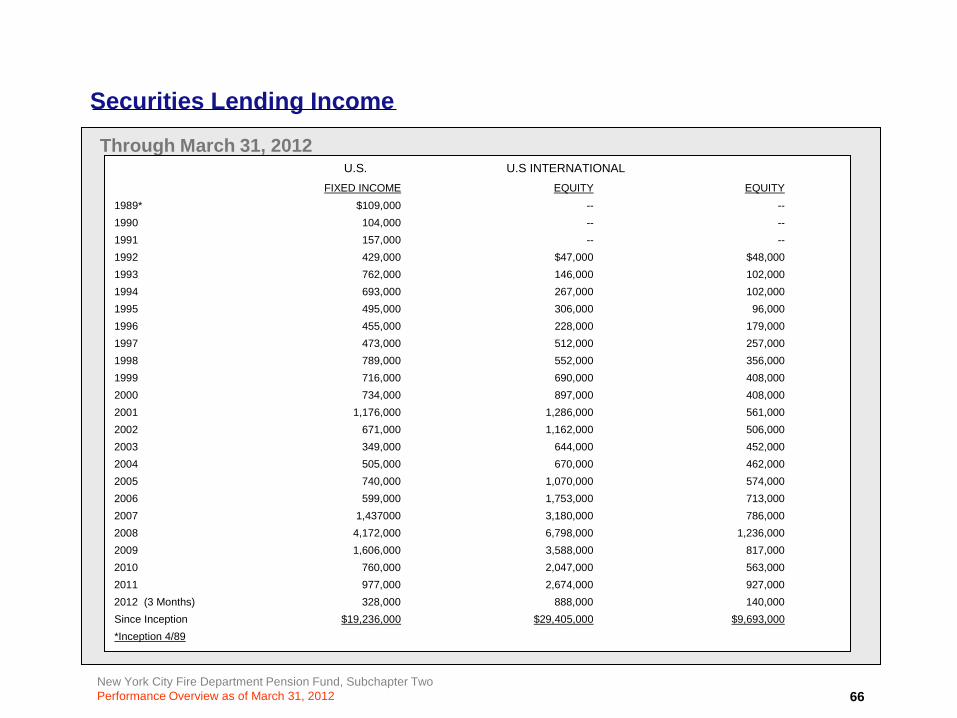
Securities Lending Income
Through March 31, 2012U.S. U.S INTERNATIONAL
FIXED INCOME EQUITY EQUITY1989* $109,000 -- --1990 104,000 -- --1991 157,000 -- --1992 429,000 $47,000 $48,0001993 762,000 146,000 102,0001994 693,000 267,000 102,0001995 495,000 306,000 96,0001996 455,000 228,000 179,0001997 473,000 512,000 257,0001998 789,000 552,000 356,0001999 716,000 690,000 408,0002000 734,000 897,000 408,0002001 1,176,000 1,286,000 561,0002002 671,000 1,162,000 506,0002003 349,000 644,000 452,0002004 505,000 670,000 462,0002005 740,000 1,070,000 574,0002006 599,000 1,753,000 713,0002007 1,437000 3,180,000 786,0002008 4,172,000 6,798,000 1,236,0002009 1,606,000 3,588,000 817,0002010 760,000 2,047,000 563,0002011 977,000 2,674,000 927,0002012 (3 Months) 328,000 888,000 140,000Since Inception $19,236,000 $29,405,000 $9,693,000*Inception 4/89
66
New York City Fire Department Pension Fund, Subchapter TwoPerformance Overview as of March 31, 2012
Footnotes
Through March 31, 2012
67
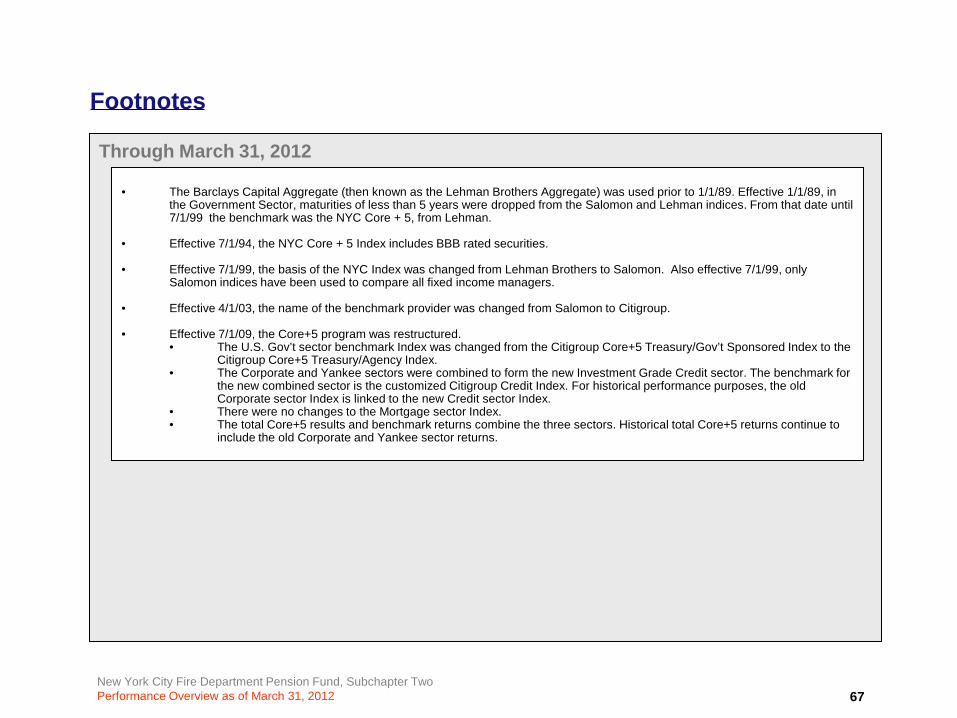
• The Barclays Capital Aggregate (then known as the Lehman Brothers Aggregate) was used prior to 1/1/89. Effective 1/1/89, in the Government Sector, maturities of less than 5 years were dropped from the Salomon and Lehman indices. From that date until7/1/99 the benchmark was the NYC Core + 5, from Lehman.
• Effective 7/1/94, the NYC Core + 5 Index includes BBB rated securities.
• Effective 7/1/99, the basis of the NYC Index was changed from Lehman Brothers to Salomon. Also effective 7/1/99, only Salomon indices have been used to compare all fixed income managers.
• Effective 4/1/03, the name of the benchmark provider was changed from Salomon to Citigroup.
• Effective 7/1/09, the Core+5 program was restructured. • The U.S. Gov’t sector benchmark Index was changed from the Citigroup Core+5 Treasury/Gov’t Sponsored Index to the
Citigroup Core+5 Treasury/Agency Index. • The Corporate and Yankee sectors were combined to form the new Investment Grade Credit sector. The benchmark for
the new combined sector is the customized Citigroup Credit Index. For historical performance purposes, the old Corporate sector Index is linked to the new Credit sector Index.
• There were no changes to the Mortgage sector Index. • The total Core+5 results and benchmark returns combine the three sectors. Historical total Core+5 returns continue to
include the old Corporate and Yankee sector returns.
New York City Fire Department Pension Fund, Subchapter TwoPerformance Overview as of March 31, 2012
Glossary of TermsThrough March 31, 2012
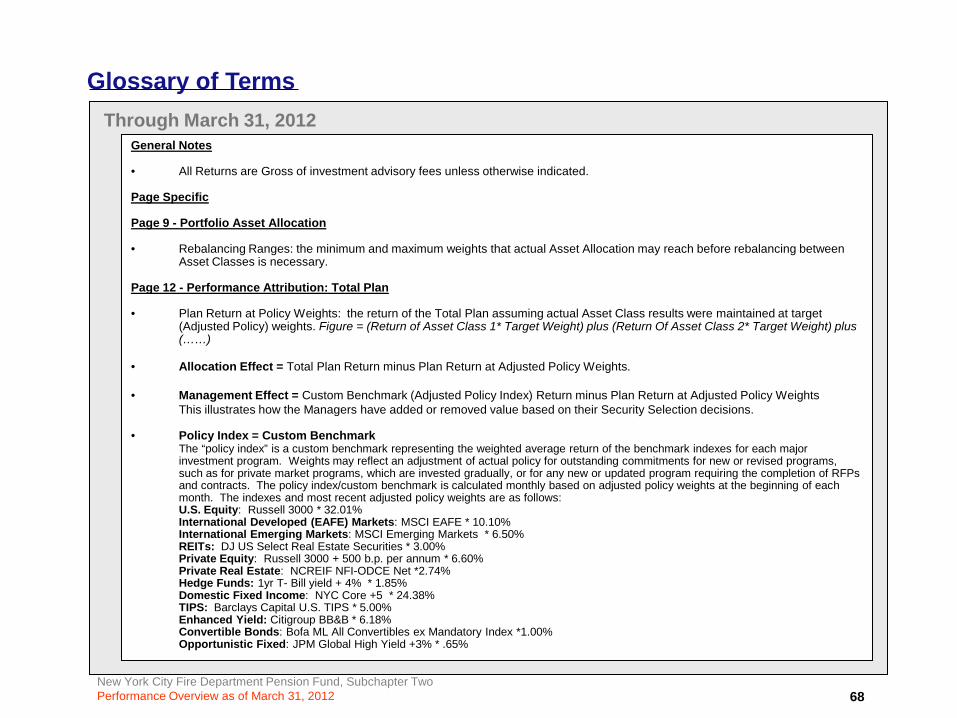
General Notes
• All Returns are Gross of investment advisory fees unless otherwise indicated.
Page Specific
Page 9 - Portfolio Asset Allocation
• Rebalancing Ranges: the minimum and maximum weights that actual Asset Allocation may reach before rebalancing between Asset Classes is necessary.
Page 12 - Performance Attribution: Total Plan
• Plan Return at Policy Weights: the return of the Total Plan assuming actual Asset Class results were maintained at target (Adjusted Policy) weights. Figure = (Return of Asset Class 1* Target Weight) plus (Return Of Asset Class 2* Target Weight) plus (……)
• Allocation Effect = Total Plan Return minus Plan Return at Adjusted Policy Weights.
• Management Effect = Custom Benchmark (Adjusted Policy Index) Return minus Plan Return at Adjusted Policy WeightsThis illustrates how the Managers have added or removed value based on their Security Selection decisions.
• Policy Index = Custom BenchmarkThe “policy index” is a custom benchmark representing the weighted average return of the benchmark indexes for each major investment program. Weights may reflect an adjustment of actual policy for outstanding commitments for new or revised programs,such as for private market programs, which are invested gradually, or for any new or updated program requiring the completion of RFPs and contracts. The policy index/custom benchmark is calculated monthly based on adjusted policy weights at the beginning of each month. The indexes and most recent adjusted policy weights are as follows:U.S. Equity: Russell 3000 * 32.01%International Developed (EAFE) Markets: MSCI EAFE * 10.10%International Emerging Markets: MSCI Emerging Markets * 6.50%REITs: DJ US Select Real Estate Securities * 3.00%Private Equity: Russell 3000 + 500 b.p. per annum * 6.60%Private Real Estate: NCREIF NFI-ODCE Net *2.74% Hedge Funds: 1yr T- Bill yield + 4% * 1.85%Domestic Fixed Income: NYC Core +5 * 24.38%TIPS: Barclays Capital U.S. TIPS * 5.00%Enhanced Yield: Citigroup BB&B * 6.18%Convertible Bonds: Bofa ML All Convertibles ex Mandatory Index *1.00%Opportunistic Fixed: JPM Global High Yield +3% * .65%
68
New York City Fire Department Pension Fund, Subchapter TwoPerformance Overview as of March 31, 2012
Glossary of Terms
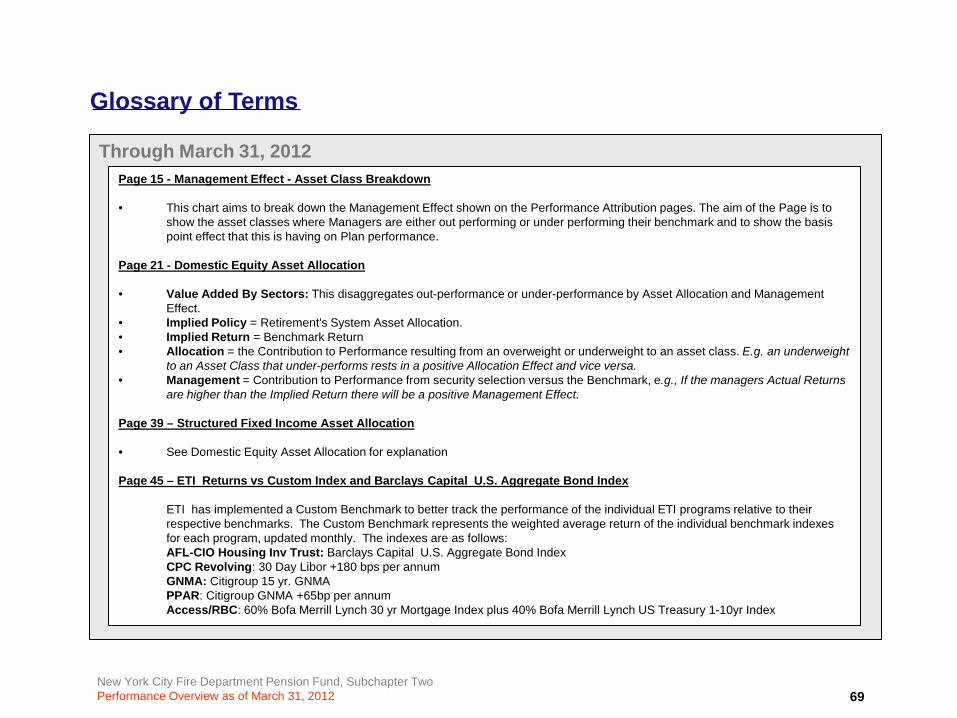
Through March 31, 2012Page 15 - Management Effect - Asset Class Breakdown
• This chart aims to break down the Management Effect shown on the Performance Attribution pages. The aim of the Page is to show the asset classes where Managers are either out performing or under performing their benchmark and to show the basis point effect that this is having on Plan performance.
Page 21 - Domestic Equity Asset Allocation
• Value Added By Sectors: This disaggregates out-performance or under-performance by Asset Allocation and Management Effect.
• Implied Policy = Retirement's System Asset Allocation.• Implied Return = Benchmark Return• Allocation = the Contribution to Performance resulting from an overweight or underweight to an asset class. E.g. an underweight
to an Asset Class that under-performs rests in a positive Allocation Effect and vice versa.• Management = Contribution to Performance from security selection versus the Benchmark, e.g., If the managers Actual Returns
are higher than the Implied Return there will be a positive Management Effect.
Page 39 – Structured Fixed Income Asset Allocation
• See Domestic Equity Asset Allocation for explanation
Page 45 – ETI Returns vs Custom Index and Barclays Capital U.S. Aggregate Bond Index
ETI has implemented a Custom Benchmark to better track the performance of the individual ETI programs relative to their respective benchmarks. The Custom Benchmark represents the weighted average return of the individual benchmark indexes for each program, updated monthly. The indexes are as follows:AFL-CIO Housing Inv Trust: Barclays Capital U.S. Aggregate Bond Index CPC Revolving: 30 Day Libor +180 bps per annumGNMA: Citigroup 15 yr. GNMAPPAR: Citigroup GNMA +65bp per annumAccess/RBC: 60% Bofa Merrill Lynch 30 yr Mortgage Index plus 40% Bofa Merrill Lynch US Treasury 1-10yr Index
69