new york city fire department pension fund, subchapter … · fund returned 10.60% , which ranked...
TRANSCRIPT

New York CityFire Department Pension Fund, Subchapter TwoPerformance Overview as of September 30, 2014
Total Fund Overview
New York City Fire Department Pension Fund, Subchapter Two 1Performance Overview as of September 30, 2014

New York CityFire Department Pension Fund, Subchapter Two
Equity Analysis
Fixed Income Analysis
Appendix
Table of Contents:
New York City Fire Department Pension Fund, Subchapter Two 2Performance Overview as of September 30, 2014

Equity Markets
US equity markets appeared fairly calm on the surface with the S&P 500 Index up 1.1% for the three months ending September 30. There were hints of turbulence earlier in the third quarter when the S&P 500 fell by over 2% in August. Riskier small-cap equities significantly underperformed large-cap equities amid growing concerns around economic growth in Europe and China. To this end, the Russell 2000 index fell 7.4%. The energy sector was the worst performer as oil prices dropped amid rising global supplies. In terms of style, growth bested value in both large and small stocks.
Beyond the US, equities in developed and emerging markets underperformed due to, in part, currency weakness as the MSCI EAFE and the MSCI EM lost 5.9% and 3.5%, respectively. The losses came on the back of intensifying tensions in the Middle East and the Ebola virus outbreak in West Africa. Also, weak economic data in Europe pushed the ECB to continue easing its monetary policy. Europe was the worst performing developed market region, returning -7.0% in the third quarter. Meanwhile, subdued economic data in Japan resulted in a weaker yen, which bolstered exports and limited losses to 2.3% for the quarter.
In local currency terms, emerging markets were up 0.6%, but currency depreciation led to a loss of 3.5% in dollar terms. Emerging countries in Europe were the largest detractors with Greece (-20%), Hungary (-12.8%) and Russia (-15.4%) suffering significant downdrafts in the third quarter. Gains in India (2.3%), Indonesia(3.4%) and China (1.4%) helped Asia grab the title of best performing region within the emerging economies.
Fixed Income Markets
Risk aversion permeated fixed income markets in the third quarter amid growing concerns around geopolitical events and global economic growth. As a result, demand for long-dated US Treasuries increased, while the fear of interest rate hikes triggered a selloff in shorter-dated maturities. To this end, the Treasury yield curve flattened with the spread between two- and 10-year rates falling 16 basis points to 1.92%. The yield on the 10-year Treasury dropped four basis points during the quarter, finishing at 2.49%. Treasury Inflation-Protected Securities, or TIPS, significantly underperformed nominal Treasuries amid lower inflation expectations due to a stronger US dollar, lower energy prices, and underwhelming growth prospects in Europe. The Barclays US TIPS Index posted a loss of 2.0% for the three months ended September 30.
After a long stretch of credit spread narrowing, spreads on investment grade credit widened 12 basis points to 112 basis points during the third quarter. Heavy new issuance and event risk weighed on the investment grade corporate sector, where performance was ultimately flat. The Long Duration Credit Index gained 0.2%. Agency mortgage-backed securities returned 0.2% in the third quarter, underperforming like-duration Treasuries.
Consultant's Commentary
Through September 30, 2014
New York City Fire Department Pension Fund, Subchapter Two 3Performance Overview as of September 30, 2014

Buffeted by outflows, the high yield market lost 1.9% in the third quarter. Spreads on high yield bonds increased to 463 basis points, nearly 100 basis points wider than the lows seen in June. Unlike previous periods where lower-quality debt outperformed, BB-rated bonds were the best performers in the third quarter. BB-ratedbonds returned -1.3% during the quarter, as B-rated and CCC-rated bonds returned -1.9% and -2.7%, respectively. Leveraged loans also turned in a lackluster performance in the third quarter; while loans experienced outflows over the period, the sector was supported by demand from the collateralized loan obligation market (CLOs). The CS Leveraged Loan Index lost 0.3%, its first negative quarterly return since 2011.
Emerging market debt also slowed in the third quarter following a strong first half of the year. Headwinds to the asset class included geopolitical risk, growth concerns, and the prospect of the Fed raising interest rates. Local currency debt (as measured by the JP Morgan GBI-EM GD Unhedged Index) fared worse than external currency debt (as measured by the JP Morgan EMBI+ Index), with the two indices losing 5.7% and 2.1%, respectively.
Commodity Markets
Commodities received a beating in the third quarter with the Bloomberg Commodity Index losing 11.8%. Corn and wheat prices were the biggest losers, returning -25.8% and -22.0%, respectively. These losses were fueled by decreased global demand and large increases in supply as growing conditions improve. Depressed corn andwheat prices resulted in losses of 18.0% for the agriculture sector, making it the worst sub-sector in the benchmark. Tighter cattle supply amid steady demand for beef triggered a 5.4% increase in cattle prices, enabling the livestock sector to outperform other commodities with a -2.2% return. The precious metals and energy sectors sold off by nearly 12% during the quarter after a negative supply outlook for crude oil from OPEC.
Private Markets
Distributions dominated the third quarter for US private equity investors. Distributions totaled nearly $160 billion for the first nine months of 2014, according to PitchBook, and are on pace to exceed 2013. Holders of mature buyout and growth equity funds were the primary beneficiaries, in addition to newer secondary-fund investors. US venture capital also reported modest distributions for the third quarter, but Asia stole the spotlight with Alibaba, a Chinese e-commerce company, which completed a $25 billion initial public offering and set a record for the largest IPO. While the Alibaba IPO took center stage, the majority of exits of venture-backed investments continue to come from trade sales or other merger and acquisition activity.
Even as distributions from mature investments have increased, the pace of cash getting invested by funds is onthe decline. Private equity deal flow in the US fell for the third consecutive quarter with average enterprise
Consultant's Commentary
Through September 30, 2014
New York City Fire Department Pension Fund, Subchapter Two 4Performance Overview as of September 30, 2014

valuations near 10x EBITDA, higher than in 2006-2008. While debt is readily available to support transactions, many general partners are exercising discipline by refusing to pay high prices for new investments. Add-ons have been the most frequent type of deals made in 2014, underscoring the emphasis on buying down acquisition multiples through synergistic post-merger acquisition activities. Investors continue to commit large amounts to private equity funds. This year is on track to be the fifth consecutive year of increased commitments with new private equity obligations totaling $264.9 billion for the first nine months of 2014. At this current pace, we expect new fund raising to cross $350 billion this year. With US equity markets at record levels for most of 2014 and US debt readily available with few covenants, the relative value of European and Asian private equity may be looking more attractive. Approximately 40% of commitments in 2014 have been to non-US private equity firms. That said, risks remain, for instance, the “Occupy Central” movement in Hong Kong is laying bare the challenges of political reforms in China. In Europe, the fourth quarter results of the ECB’s asset quality review should provide clarity around the anticipated timing of asset sales needed to meet tighter reserve requirements. Turnaround specialists can provide attractive options in light of the recessionary impact on businesses. Limited partners looking to maintain or increase exposure to private equity are still allocating to new commitments, feeding competition for access to top-tier managers. With increasing interest in private equity across all strategies and regions, investors should be prepared to make quick decisions as many top-tier fund managers are able to meet their capital fund-raise targets within a few months of marketing. We favor managers with demonstrated price discipline, strong value orientation and sound operational capabilities to enhance portfolio company performance. Moving to real estate, NEPC remains neutral on US core real estate, US REITs and debt strategies, and we are positive on non-core real estate strategies such as value-add and opportunistic real estate. For US core real estate (and US real estate broadly), strong fundamentals continue to dominate along with attractive income spreads relative to interest rates. Our main concerns for US core real estate are plentiful capital driving up pricing, the market’s expectation for higher interest rates, and some new construction in certain locations. Regarding US REITs, they have traded down relative to net asset values and are now trading at 4.5% below NAV (the long-term average is 2.4% above NAV). Funds from operations, or FFO, multiples have also come down slightly with REITs now trading at 15.1x FFO multiples. This is down from the 16.0x (or greater) FFO multiples recently seen, but still well above their average of 12.5x since 2000. For debt strategies, yields have generally remained low and competition from more traditional lending sources (such as banks) has increased, putting pressure on private debt/mezzanine strategies. For non-core real estate—value-add and opportunistic—we still view Europe as the best place for a marginal dollar of real estate investment; however, the opportunity, which is based on asset mispricing and not future expected growth, is limited. For non-core real estate in the US, we continue to favor niche-focused managers and those with a proven ability to invest conservatively and avoid overheated markets.
Consultant's Commentary
Through September 30, 2014
New York City Fire Department Pension Fund, Subchapter Two 5Performance Overview as of September 30, 2014

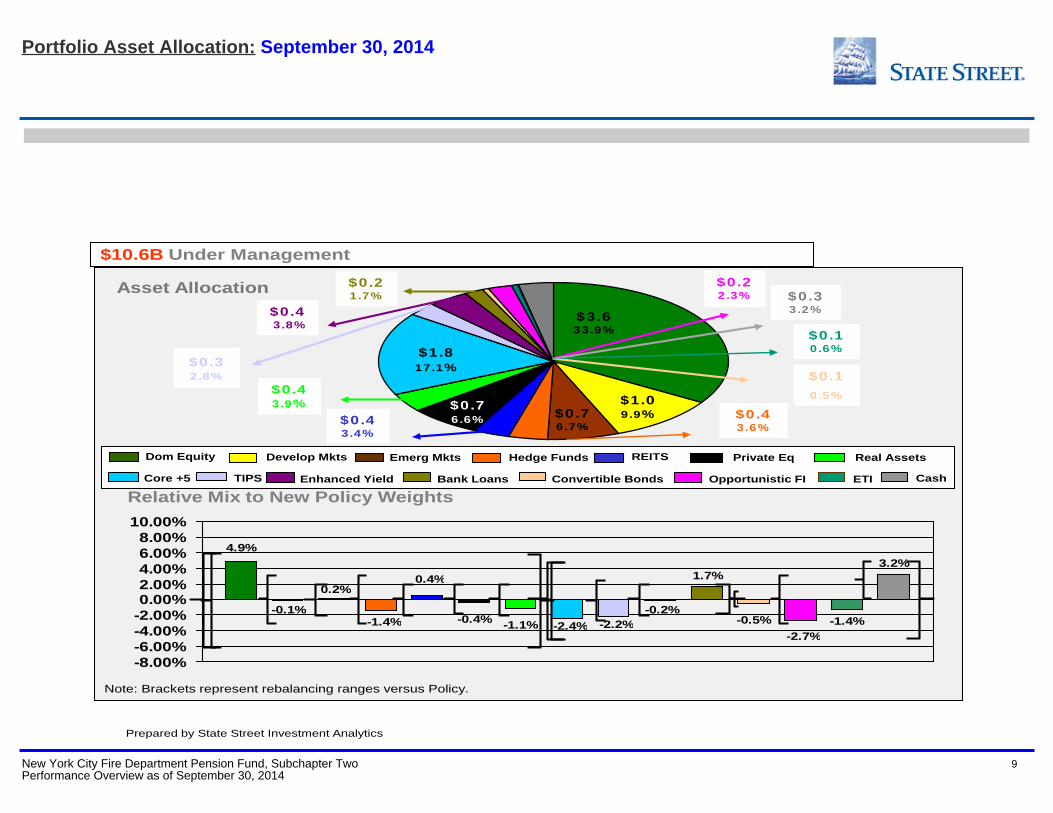
For real assets, we remain positive on energy; neutral on agriculture, metals and mining, and infrastructure; and negative on timber. In the near-term, we expect the energy sector to be challenged as global oil prices continue to drop. Saudi Arabia and OPEC—long-time swing producers that have historically reduced supply during periods such as these—have indicated a willingness to allow lower oil prices to persist for some time in efforts to cement market share and reduce marginal supply. Natural gas prices were relatively stable in the third quarter as rig counts remain low and increasing supply has largely been a result of new drilling for oil and natural gas liquids. Similarly, agricultural commodities saw large drops as both corn and soybeans harvests are expected to be in-line with record volumes in 2013. We remain believers in the long-term demand drivers for agriculture. Mining commodity prices are still low as concerns around growth in China and lackluster industrial demand dampen prices. This can be advantageous to private long-term investors since capital markets remain closed to many small producers. We continue to look for infrastructure opportunities on a selective basis and we retain a bearish outlook on timber, especially for domestic strategies. Performance: For the quarter, the Fund returned -0.90%, which ranked in the 47th percentile of the Public Master Trust Universe, underperforming the policy index return of -0.46%. Deviations from the policy detracted 44 basis points from aggregate performance during the quarter. For the year ended September 30, 2014, the Fund returned 10.60%, which ranked in the 50th percentile in the Public Mast Trust Universe, with deviations from the policy detracting 40 basis points over the trailing year. Over the trailing 3-year and 5-year periods, the Fund returned 13.49% and 10.65%, respectively. Domestic Equity Composite The Fund had 33.9% invested in domestic equity at the end of the third quarter. Within domestic equity, the Fund was overweight Small Cap Active Managers by 0.32%, underweight Russell 2000 Index Funds by 1.90%, overweight Small to Mid Cap Active Managers by 0.48%, overweight Mid Cap Active Managers by 3.44%, underweight Mid Cap S&P 400 Index Managers by 4.17%, underweight Russell 1000 Active Managers by 5.01%, overweight Russell 1000 Index Funds by 7.37%, underweight Russell 3000 Index Fund managers by 0.43% and underweight to Manager of Managers by 0.10%. For the quarter, the Total Domestic Equity Portfolio returned -0.90%, underperforming the Russell 3000 Index return of 0.01% by 91 bps. International Equity Composite At the end of the third quarter, the Fund had an allocation to international equity of 16.6%. Of this total, 40.4% was allocated to emerging markets equity and 59.6% was allocated to developed international markets. The Fund also allocates across style in the developed international space, with 20.2% of the allocation invested in
Consultant's Commentary
Through September 30, 2014
New York City Fire Department Pension Fund, Subchapter Two 6Performance Overview as of September 30, 2014

active value mandates, 4.8% in developed large cap passive, 18.8% in growth mandates. A total of 16.7% ofthe total international allocation was invested passively, including 10.5% invested in Emerging Markets Passive investments and 6.2% invested in Passive developed investments; remainder includes the actively managed strategies.
The International Developed Markets Equity Composite returned -5.47% in the third quarter, outperforming the MSCI EAFE Index which returned -5.88%. Passive managers underperformed active managers within the Fund.
The Emerging Markets Composite returned -3.08% in the third quarter, outperforming the MSCI EM Index whichreturned -3.50%.
Fixed Income Composite At the end of the third quarter, the Fund had an allocation to fixed income of 31.9%. Of the allocation to fixed income, 52.5% was invested in structured fixed income, 11.9% was allocated to high yield, 8.8% was invested in TIPS, 9.7% was allocated to cash and short term investments, 5.2% allocated to bank loans, 1.5% was in convertible bonds, 2.0% was allocated to economically targeted investments (ETI), 7.2% was allocated to opportunistic fixed income, 0.8% to Progress Fixed and 0.3% allocated to core plus.
The Structured Fixed Income Composite returned 0.25% in the third quarter, outperforming the NYC Core plus 5 Index return of 0.22% by 3 bps. The Barclays Capital Aggregate Index returned 0.17% in the quarter.
The Enhanced Yield or high yield fixed income composite, posted a return of -1.89%, which underperformed the Citigroup BB&B Capped Index return of -1.56%.
The TIPS Composite returned -2.0%, which outperformed the Barclays Global Inflation Linked: US TIPS Index return of -2.04% for the quarter.
Real Estate Equity Securities Composite & Private Equity As of September 30, 2014 the Fund had $362 million invested in REITs for a commitment of 3.4% of Total Fund assets. In the third quarter the REIT portfolio returned -2.74%, outperforming the DJ US Select Real Estate Securities Index return of -2.99%. As of September 30th, the Fund had an allocation to Private Real Estate of 3.87% and 6.61% allocated to Private Equity.
Hedge Funds The allocation to hedge funds as of September 30, 2014 was $378.2 million, 3.6% of the total fund. The third quarter return for the hedge fund portfolio was 0.83%, outperforming the HFRI FOF Composite Index return of 0.55%, and underperforming the 1 Yr TBill yield + 4% return of 1.07%.
Consultant's Commentary
Through September 30, 2014
New York City Fire Department Pension Fund, Subchapter Two 7Performance Overview as of September 30, 2014

Total Fire Fire Policy Benchmark Fire Policy Weighted Passive Index
Trailing 3 Months FYTD Trailing 12 Months Trailing 3 Years Trailing 5 Years Trailing 10 Years Trailing 15 Years-3.00
-1.50
0.00
1.50
3.00
4.50
6.00
7.50
9.00
10.50
12.00
13.50
15.00
16.50
Rat
e of
Ret
urn
-0.90-0.46
-1.42-0.90
-0.46-1.42
10.60 11.00
8.71
13.49 13.77
11.4110.65
11.18
8.327.51
8.00
6.705.98 6.18
Plan 3 Years Benchmark 3 Years Plan 5 Years Benchmark 5 Years Plan 10 Years Benchmark 10 YearsStandard Deviation
TOTAL FIRE 7.1 6.9 10.7 9.4 10.3 11.5
Market Value (Billions)
TOTAL FIRE $10.6
Total Portfolio Returns: September 30, 2014
New York City Fire Department Pension Fund, Subchapter Two 8Performance Overview as of September 30, 2014
Prepared by State Street Investment Analytics
4.9%
-0.1%
0.2%
-1.4%
0.4%
-0.4% -1.1% -2.4% -2.2%-0.2%
1.7%
-0.5%-2.7%
-1.4%
3.2%
-8.00%-6.00%-4.00%-2.00%0.00%2.00%4.00%6.00%8.00%
10.00%
$10.6B Under Management
Asset Allocation
Relative Mix to New Policy Weights
Note: Brackets represent rebalancing ranges versus Policy.
Emerg Mkts Develop Mkts
Core +5 Enhanced Yield
Private Eq Real Assets
TIPS
REITS
Convertible Bonds Opportunistic FI ETI Cash
Hedge Funds
Bank Loans
Dom Equity
$1.8 17.1%
$1.0 9.9% $0.7
6.7%
$0.76.6% $0.4
3.4%
$0.4 3.9%
$0.32.8% $0.1
0.5%
$0.4 3.8%
$0.1 0.6%
$0.2 2.3%
$0.4 3.6%
$0.3 3.2%
$0.2 1.7%
$3.6 33.9%
Portfolio Asset Allocation: September 30, 2014
New York City Fire Department Pension Fund, Subchapter Two 9Performance Overview as of September 30, 2014

Prepared by State Street Investment Analytics
3.1%
-0.3%
0.2% 0.0%0.4%
0.0% 0.0%
-5.2%
-2.2%
0.1% 0.0%-0.5%
0.0% 0.0%
3.2%
-8.00%-6.00%-4.00%-2.00%0.00%2.00%4.00%6.00%8.00%
10.00%
$10.6B Under Management
Asset Allocation
Relative Mix to Adjusted New Policy Weights
Note: Brackets represent rebalancing ranges versus Policy.
Dom Equity
Core +5 Enhanced Yield TIPS Convertible Bonds Opportunistic FI ETI Cash Bank Loans
Emerg Mkts Develop Mkts Private Eq Real Assets REITS Hedge Funds
$1.8 17.1%
$1.0 9.9%$0.7
6.7%
$0.76.6%$0.4
3.4%
$0.43.9%
$0.32.8% $0.1
0.5%
$0.4 3.8%
$0.10.6%
$0.22.3%
$0.43.6%
$0.33.2%
$0.2 1.7%
$3.633.9%
Portfolio Asset Allocation: September 30, 2014
New York City Fire Department Pension Fund, Subchapter Two 10Performance Overview as of September 30, 2014

-0.90
-0.46 -0.44
-0.05
-0.39
-1.00
-0.50
0.00
Total Plan Return Policy Index Return Excess Return Allocation Effect Selection Effect
Performance Attribution: Total Plan - Quarter Ending: September 30, 2014
New York City Fire Department Pension Fund, Subchapter Two 11Performance Overview as of September 30, 2014

10.60 11.00
-0.40
0.51
-0.91
-2.00
0.00
2.00
4.00
6.00
8.00
10.00
12.00
Total Plan Return Policy Index Return Excess Return Allocation Effect Selection Effect
Performance Attribution: Total Plan - 12 Month Ending: September 30, 2014
New York City Fire Department Pension Fund, Subchapter Two 12Performance Overview as of September 30, 2014

13.49 13.77
-0.28
0.43
-0.71
-2.00
0.00
2.00
4.00
6.00
8.00
10.00
12.00
14.00
16.00
Total Plan Return Policy Index Return Excess Return Allocation Effect Selection Effect
Performance Attribution: Total Plan - 3 Years Ending: September 30, 2014
New York City Fire Department Pension Fund, Subchapter Two 13Performance Overview as of September 30, 2014

Quarter 12 Months 3 Years Benchmark TOTAL FIRE -0.05 0.51 0.43 Fire Policy Benchmark
TOTAL DOMESTIC EQUITY -0.02 0.31 0.31 RUSSELL 3000 TOTAL DEVELOPED EQUITY 0.00 -0.01 -0.06 MSCI EAFE NET TOTAL EMERGING MARKETS -0.03 -0.04 -0.07 MSCI EMERGING MARKETSTOTAL PRIVATE EQUITY 0.01 0.02 0.01 NYC R3000 +3% LaggedTOTAL PRIVATE REAL ESTATE 0.00 0.00 0.00 NCREIF NFI-ODCE NET + 1%TOTAL INFRASTRUCTURE 0.00 0.00 0.00 CPI + 4%TOTAL HEDGE FUNDS 0.00 0.00 0.01 1 Year Treasury Bill Yield + 4%TOTAL REAL ESTATE SECURITIES -0.01 0.00 0.04 DJ U.S. Select REIT TOTAL STRUCTURED -0.04 0.29 0.47 NYC - CORE PLUS FIVETOTAL ENHANCED YIELD 0.00 -0.01 -0.01 CITIGROUP BB & BTOTAL BANK LOANS 0.00 0.00 0.01 CSFB LEVERAGED LOAN INDEXTOTAL TIPS MANAGERS 0.03 0.18 0.26 BARCLAYS U.S TIPS INDEXTOTAL CONVERTIBLE BONDS 0.01 -0.02 -0.01 BofAML ALL CONVERTIBLE - Ex MandatoryTOTAL OPPORTUNISTIC FIXED 0.00 0.00 0.00 10% Annual ReturnTOTAL CASH 0.00 -0.16 -0.50
Quarter 12 Months 3 Years Benchmark TOTAL FIRE -0.39 -0.91 -0.71 Fire Policy Benchmark
TOTAL DOMESTIC EQUITY -0.31 -0.52 0.08 RUSSELL 3000 TOTAL DEVELOPED EQUITY 0.04 -0.10 -0.03 MSCI EAFE NET TOTAL EMERGING MARKETS 0.03 0.21 0.10 MSCI EMERGING MARKETSTOTAL PRIVATE EQUITY -0.22 -0.81 -0.41 NYC R3000 +3% LaggedTOTAL PRIVATE REAL ESTATE 0.05 0.05 0.02 NCREIF NFI-ODCE NET + 1%TOTAL INFRASTRUCTURE 0.00 0.00 0.00 CPI + 4%TOTAL HEDGE FUNDS -0.01 0.08 0.03 1 Year Treasury Bill Yield + 4%TOTAL REAL ESTATE SECURITIES 0.01 -0.03 0.02 DJ U.S. Select REIT TOTAL STRUCTURED 0.00 0.14 0.17 NYC - CORE PLUS FIVETOTAL ENHANCED YIELD -0.01 0.01 -0.01 CITIGROUP BB & BTOTAL BANK LOANS 0.01 0.01 0.01 CSFB LEVERAGED LOAN INDEXTOTAL TIPS MANAGERS 0.00 0.00 0.00 BARCLAYS U.S TIPS INDEXTOTAL CONVERTIBLE BONDS -0.01 -0.04 -0.03 BofAML ALL CONVERTIBLE - Ex MandatoryTOTAL OPPORTUNISTIC FIXED 0.02 0.07 0.02 10% Annual ReturnTOTAL CASH 0.00 0.00 0.01
Allocation Effect - Asset Class Breakdown
Selection Effect - Asset Class Breakdown
Total Plan: September 30, 2014
New York City Fire Department Pension Fund, Subchapter Two 14Performance Overview as of September 30, 2014
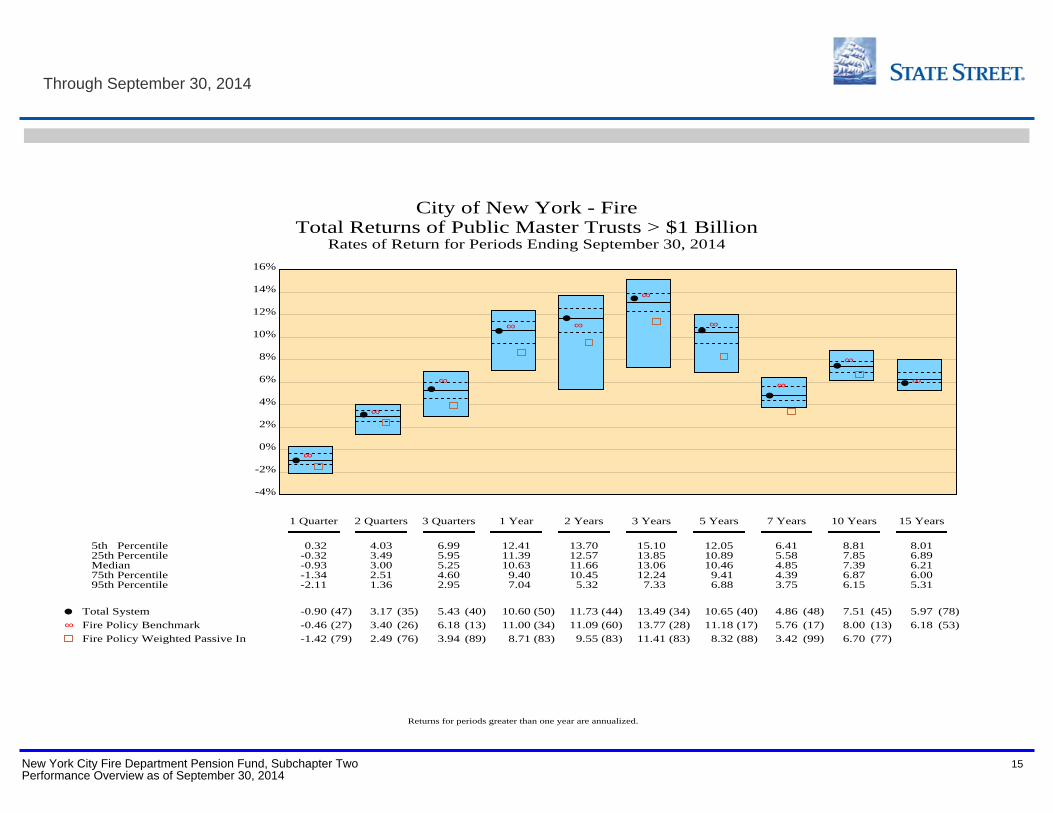
City of New York - FireTotal Returns of Public Master Trusts > $1 Billion
Rates of Return for Periods Ending September 30, 2014
-4%
-2%
0%
2%
4%
6%
8%
10%
12%
14%
16%
∞
∞
∞
∞ ∞
∞
∞
∞
∞
∞
∞(47)
(27)
(79)
(35)
(26)
(76)
(40)
(13)
(89)
(50)
(34)
(83)
(44)
(60)
(83)
(34)
(28)
(83)
(40)
(17)
(88)
(48)
(17)
(99)
(45)
(13)
(77)
(78)
(53)
5th Percentile 25th Percentile Median 75th Percentile 95th Percentile
1 Quarter
2 Quarters
3 Quarters
1 Year
2 Years
3 Years
5 Years
7 Years
10 Years
15 Years
0.32-0.32-0.93-1.34-2.11
4.033.493.002.511.36
6.995.955.254.602.95
12.4111.3910.639.407.04
13.7012.5711.6610.455.32
15.1013.8513.0612.247.33
12.0510.8910.469.416.88
6.415.584.854.393.75
8.817.857.396.876.15
8.016.896.216.005.31
Total System
Fire Policy Benchmark
Fire Policy Weighted Passive In
-0.90
-0.46
-1.42
3.17
3.40
2.49
5.43
6.18
3.94
10.60
11.00
8.71
11.73
11.09
9.55
13.49
13.77
11.41
10.65
11.18
8.32
4.86
5.76
3.42
7.51
8.00
6.70
5.97
6.18
Returns for periods greater than one year are annualized.
Through September 30, 2014
New York City Fire Department Pension Fund, Subchapter Two 15Performance Overview as of September 30, 2014

City of New York - FireTotal Returns of Public Master Trusts > $1 Billion
Recent Periods
-4%
-2%
0%
2%
4%
6%
8%
10%
12%
14%
16%
18%
20%
22%
∞
∞∞
∞ ∞
∞ ∞
∞
∞
∞
∞(47)
(27)
(79)
(34)
(58)
(50)
(48)
(14)
(96)
(64)
(69)
(67)
(35)
(79)
(30)
(50)
(34)
(83)
(41)
(72)
(82)
(33)
(5)
(60)
(62)
(27)
(95)
(28)
(23)
(83)
5th Percentile25th PercentileMedian75th Percentile95th Percentile
Sep 14 Jun 14
Quarter Ending
Mar 14 Dec 13 Sep 13 Sep 14 Sep 13
Year Ending
Sep 12 Sep 11 Sep 10
0.32-0.32-0.93-1.34-2.11
4.814.193.983.632.97
3.222.502.151.861.46
6.035.605.144.332.12
6.035.324.874.272.42
12.4111.3910.639.407.04
15.2913.9312.5111.032.55
19.9317.6216.0714.3211.19
5.783.902.211.10
-0.67
13.3211.7310.739.557.88
Total System
Fire Policy Benchmark
Fire Policy Weighted Passive In
-0.90
-0.46
-1.42
4.11
3.88
3.96
2.19
2.69
1.41
4.91
4.53
4.59
5.21
4.16
5.26
10.60
11.00
8.71
12.87
11.18
10.39
17.10
19.35
15.23
1.70
3.22
-0.87
11.59
11.74
8.79
Returns for periods greater than one year are annualized.
Through September 30, 2014
New York City Fire Department Pension Fund, Subchapter Two 16Performance Overview as of September 30, 2014

New York CityFire Department Pension Fund, Subchapter Two
Equity Analysis
New York City Fire Department Pension Fund, Subchapter Two 17Performance Overview as of September 30, 2014

TOTAL DOMESTIC EQUITYTOTAL DEVELOPED MARKETSTOTAL EMERGING EQUITYTOTAL HEDGE FUNDSTOTAL REITS TOTAL PRIVATE EQUITYTOTAL PRIVATE REAL ESTATETOTAL INFRASTRUCTURE
0.1%
5.7%
9.7%
5.0%
5.2%
9.8%
14.5%
49.9%
TOTAL DOMESTIC EQUITYTOTAL DEVELOPED MARKETSTOTAL EMERGING EQUITYTOTAL HEDGE FUNDSTOTAL REITS TOTAL PRIVATE EQUITYTOTAL PRIVATE REAL ESTATETOTAL INFRASTRUCTURE
0.1%
5.7%
9.7%
5.0%
5.2%
9.8%
14.5%
49.9%
Market Value (Billions) % of Plan
TOTAL EQUITY $7.2 68.0
Total Equity Asset Allocation: September 30, 2014
New York City Fire Department Pension Fund, Subchapter Two 18Performance Overview as of September 30, 2014

TOTAL SMALL CAP ACTIVETOTAL SMALL CAP PASSIVETOTAL SMID ACTIVETOTAL MID CAP ACTIVETOTAL MID CAP PASSIVETOTAL RUSSELL 1000 ACTIVETOTAL RUSSELL 1000 PASSIVETOTAL RUSSELL 3000 PASSIVETOTAL EMERGING MANAGERS
4.3%
30.4%
4.2%
1.0%
2.1%
10.1%
3.4%
3.2%
41.3%
TOTAL SMALL CAP ACTIVETOTAL SMALL CAP PASSIVETOTAL SMID ACTIVETOTAL MID CAP ACTIVETOTAL MID CAP PASSIVETOTAL RUSSELL 1000 ACTIVETOTAL RUSSELL 1000 PASSIVETOTAL RUSSELL 3000 PASSIVETOTAL EMERGING MANAGERS
4.3%
30.4%
4.2%
1.0%
2.1%
10.1%
3.4%
3.2%
41.3%
Market Value (Billions)
TOTAL DOMESTIC EQUITY $3.6
Total Domestic Equity Asset Allocations: September 30, 2014
New York City Fire Department Pension Fund, Subchapter Two 19Performance Overview as of September 30, 2014

Total Domestic Equity RUSSELL 3000 (DAILY)
Trailing 3 Months FYTD Trailing 12 Months Trailing 3 Years Trailing 5 Years Trailing 10 Years Trailing 15 Years-5.00
-2.50
0.00
2.50
5.00
7.50
10.00
12.50
15.00
17.50
20.00
22.50
25.00
27.50
Rat
e of
Ret
urn
-0.90
0.01
-0.90
0.01
16.0817.76
23.37 23.08
15.69 15.78
8.31 8.44
5.42 5.51
Plan 3 Years Benchmark 3 Years Plan 5 Years Benchmark 5 Years Plan 10 Years Benchmark 10 YearsStandard Deviation
TOTAL DOMESTICEQUITY
11.6 11.0 14.3 13.8 15.6 15.3
Market Value (Billions) % of Plan
TOTAL DOMESTIC EQUITY $3.6 33.9
Total Domestic Equity Returns vs Russell 3000 Index: September 30, 2014
New York City Fire Department Pension Fund, Subchapter Two 20Performance Overview as of September 30, 2014

Total Small Cap RUSSELL 2000 (DAILY)
Trailing 3 Months FYTD Trailing 12 Months Trailing 3 Years Trailing 5 Years Trailing 10 Years Trailing 15 Years-12.00
-9.00
-6.00
-3.00
0.00
3.00
6.00
9.00
12.00
15.00
18.00
21.00
24.00
27.00
Rat
e of
Ret
urn
-8.04 -7.36 -8.04 -7.36
3.95 3.93
20.1221.26
13.1814.29
6.208.19
Market Value (Millions) % of Plan
TOTAL SMALL CAP $189.2 1.8
Plan 3 Years Benchmark 3 Years Plan 5 Years Benchmark 5 Years Portfolio 5 Years Benchmark 10 YearsStandard Deviation
TOTAL SMALL CAP 14.3 15.2 17.5 18.4 18.3 19.8
Small Cap Returns vs Russell 2000 Index: September 30, 2014
New York City Fire Department Pension Fund, Subchapter Two 21Performance Overview as of September 30, 2014

Total Mid Cap RUSSELL MIDCAP (DAILY)
Trailing 3 Months FYTD Trailing 12 Months Trailing 3 Years Trailing 5 Years Trailing 10 Years Trailing 15 Years-6.00
-3.00
0.00
3.00
6.00
9.00
12.00
15.00
18.00
21.00
24.00
27.00
30.00
Rat
e of
Ret
urn
-2.71-1.66
-2.71-1.66
15.61 15.83
24.9023.79
16.97 17.19
8.6610.34
Market Value (Millions) % of Plan
TOTAL MID CAP $483.7 4.6
Plan 3 Years Benchmark 3 Years Plan 5 Years Benchmark 5 Years Portfolio 10 Years Benchmark 10 YearsStandard Deviation
TOTAL MID CAP 13.2 12.3 15.8 15.3 17.5 17.7
Mid Cap Returns vs Russell MidCap Index: September 30, 2014
New York City Fire Department Pension Fund, Subchapter Two 22Performance Overview as of September 30, 2014

TOTAL RUSSELL 1000 RUSSELL 1000 (DAILY)
Trailing 3 Months FYTD Trailing 12 Months Trailing 3 Years Trailing 5 Years Trailing 10 Years Trailing 15 Years0.00
3.00
6.00
9.00
12.00
15.00
18.00
21.00
24.00
27.00
30.00
Rat
e of
Ret
urn
0.75 0.65 0.75 0.65
18.2119.01
26.86
23.23
17.2115.90
8.95 8.46
TOTAL RUSSELL 1000 RUSSELL 1000 (DAILY)
Trailing 3 Months FYTD Trailing 12 Months Trailing 3 Years Trailing 5 Years Trailing 10 Years Trailing 15 Years0.00
3.00
6.00
9.00
12.00
15.00
18.00
21.00
24.00
27.00
30.00
Rat
e of
Ret
urn
0.75 0.65 0.75 0.65
18.2119.01
26.86
23.23
17.2115.90
8.95 8.46
Plan 3 Years Benchmark 3 Years Plan 5 Years Benchmark 5 Years Portfolio 10 Years Benchmark 10 YearsStandard Deviation
TOTAL RUSSELL 1000 13.1 10.8 15.3 13.5 15.9 15.0
Market Value (Billions) % of Plan
TOTAL RUSSELL 1000 $1.6 15.1
Russell 1000 Returns vs Russell 1000 Index: September 30, 2014
New York City Fire Department Pension Fund, Subchapter Two 23Performance Overview as of September 30, 2014

TOTAL RUSSELL 3000 RUSSELL 3000 (DAILY)
Trailing 3 Months FYTD Trailing 12 Months Trailing 3 Years Trailing 5 Years Trailing 10 Years Trailing 15 Years-5.00
-2.50
0.00
2.50
5.00
7.50
10.00
12.50
15.00
17.50
20.00
22.50
25.00
27.50
Rat
e of
Ret
urn
-0.050.01
-0.050.01
17.60 17.76
23.06 23.08
15.79 15.78
8.49 8.44
5.61 5.51
Plan 3 Years Benchmark 3 Years Plan 5 Years Benchmark 5 Years Plan 10 Years Benchmark 10 YearsStandard Deviation
TOTAL RUSSELL 3000 11.0 11.0 13.8 13.8 15.2 15.3
Market Value (Billions) % of Plan
TOTAL RUSSELL 3000 $1.1 10.3
Russell 3000 Fund Returns vs Russell 3000 Index: September 30, 2014
New York City Fire Department Pension Fund, Subchapter Two 24Performance Overview as of September 30, 2014

TOTAL EMERGING MANAGERS RUSSELL 2000 (DAILY)
Trailing 3 Months FYTD Trailing 12 Months Trailing 3 Years Trailing 5 Years Trailing 10 Years Trailing 15 Years-9.00
-7.50
-6.00
-4.50
-3.00
-1.50
0.00
1.50
3.00
4.50
6.00
7.50
Rat
e of
Ret
urn
-5.96
-7.36
-5.96
-7.36
5.98
3.93
TOTAL EMERGING MANAGERS RUSSELL 2000 (DAILY)
Trailing 3 Months FYTD Trailing 12 Months Trailing 3 Years Trailing 5 Years Trailing 10 Years Trailing 15 Years-9.00
-7.50
-6.00
-4.50
-3.00
-1.50
0.00
1.50
3.00
4.50
6.00
7.50
Rat
e of
Ret
urn
-5.96
-7.36
-5.96
-7.36
5.98
3.93
Market Value (Millions) % of Plan
TOTAL EMERGING MANAGERS $156.3 1.5
Plan 3 Years Benchmark 3 Years Plan 5 Years Benchmark 5 Years Plan 10 Years Benchmark 10 YearsStandard Deviation
TOTAL EMERGINGMANAGERS
Emerging Managers Returns vs Russell 2000 Index: September 30, 2014
New York City Fire Department Pension Fund, Subchapter Two 25Performance Overview as of September 30, 2014

TOTAL ACTIVE INTERNATIONAL EQUITY
TOTAL PASSIVE INTERNATIONAL EQUITY
16.8%
83.2%
TOTAL ACTIVE INTERNATIONAL EQUITY
TOTAL PASSIVE INTERNATIONAL EQUITY
16.8%
83.2%
Asset Class Weight
Quarterly Returns - Fund and Benchmarks
Fund Benchmark Excess
TOTAL DEVELOPED GROWTH 18.76 (5.28) (5.55) 0.26
TOTAL DEVELOPED VALUE 20.21 (4.69) (6.20) 1.51
TOTAL DEVELOPED SMALL CAP ACTIVE 7.71 (8.17) (7.20) (0.97)
TOTAL DEVELOPED SMALL CAP PASSIVE 1.43 (7.92) (7.82) (0.10)
TOTAL DEVELOPED LARGE CAP PASSIVE 4.82 (5.84) (5.88) 0.04
TOTAL ACTIVE EMERGING MARKETS 29.93 (2.92) (3.50) 0.58
TOTAL PASSIVE EMERGING MARKETS 10.51 (3.60) (3.50) (0.11)
REBAL-TRANSITION 6.54
TOTAL INTERNATIONAL EQUITY 100.00 (4.53) (5.27) 0.73
Market Value (Billions) % of Plan
TOTAL INTERNATIONAL EQUITY $1.8 16.6
TOTAL DEVELOPED GROWTH
TOTAL DEVELOPED VALUE
TOTAL DEVELOPED SMALL CAP ACTIVE
TOTAL DEVELOPED SMALL CAP PASSIVE
TOTAL DEVELOPED LARGE CAP PASSIVE
TOTAL ACTIVE EMERGING MARKETS
TOTAL PASSIVE EMERGING MARKETS
REBAL-TRANSITION
6.5%
10.5%
30.0%
4.8%
18.8%
20.2%
7.7%
1.4%
TOTAL DEVELOPED GROWTH
TOTAL DEVELOPED VALUE
TOTAL DEVELOPED SMALL CAP ACTIVE
TOTAL DEVELOPED SMALL CAP PASSIVE
TOTAL DEVELOPED LARGE CAP PASSIVE
TOTAL ACTIVE EMERGING MARKETS
TOTAL PASSIVE EMERGING MARKETS
REBAL-TRANSITION
6.5%
10.5%
30.0%
4.8%
18.8%
20.2%
7.7%
1.4%
International Equity Asset Allocation: September 30, 2014
New York City Fire Department Pension Fund, Subchapter Two 26Performance Overview as of September 30, 2014

TOTAL INTERNATIONAL EQUITY MSCI AC WORLD ex US (NET)
Trailing 3 Months FYTD Trailing 12 Months Trailing 3 Years Trailing 5 Years Trailing 10 Years Trailing 15 Years-8.00
-6.00
-4.00
-2.00
0.00
2.00
4.00
6.00
8.00
10.00
12.00
14.00
Rat
e of
Ret
urn
-4.53-5.27
-4.53-5.27
5.00 4.77
11.55 11.79
6.22 6.03
7.51 7.06
5.08
Plan 3 Years Benchmark 3 Years Plan 5 Years Benchmark 5 Years Plan 10 Years Benchmark 10 YearsStandard Deviation
TOTAL INTERNATIONALEQUITY
14.8 14.4 16.8 16.5 19.3 18.9
Market Value (Billions) % of Plan
TOTAL INTERNATIONAL EQUITY $1.8 16.6
Total International Returns vs MSCI AC World ex US Net Index: September 30, 2014
New York City Fire Department Pension Fund, Subchapter Two 27Performance Overview as of September 30, 2014

TOTAL DEVELOPED ACTIVE MSCI EAFE
Trailing 3 Months FYTD Trailing 12 Months Trailing 3 Years Trailing 5 Years Trailing 10 Years Trailing 15 Years-8.00
-6.00
-4.00
-2.00
0.00
2.00
4.00
6.00
8.00
10.00
12.00
14.00
16.00
Rat
e of
Ret
urn
-5.37 -5.88 -5.37 -5.88
3.184.25
13.37 13.65
7.426.56 6.92
6.32
4.513.87
Plan 3 Years Benchmark 3 Years Plan 5 Years Benchmark 5 Years Plan 10 Years Benchmark 10 YearsStandard Deviation
TOTAL DEVELOPEDACTIVE
14.0 14.3 16.2 16.6 18.0 18.3
Market Value (Millions) % of Plan
TOTAL DEVELOPED ACTIVE $934.7 8.8
Developed Active Returns vs MSCI EAFE Index: September 30, 2014
New York City Fire Department Pension Fund, Subchapter Two 28Performance Overview as of September 30, 2014

TOTAL DEVELOPED PASSIVE MSCI EAFE
Trailing 3 Months FYTD Trailing 12 Months Trailing 3 Years Trailing 5 Years Trailing 10 Years Trailing 15 Years-10.00
-8.00
-6.00
-4.00
-2.00
0.00
2.00
4.00
6.00
8.00
10.00
12.00
14.00
16.00
Rat
e of
Ret
urn
-6.32 -5.88 -6.32 -5.88
3.634.25
13.63 13.65
6.75 6.56 6.59 6.32
4.16 3.87
Plan 3 Years Benchmark 3 Years Plan 5 Years Benchmark 5 Years Plan 10 Years Benchmark 10 YearsStandard Deviation
TOTAL DEVELOPEDPASSIVE
14.3 14.3 16.6 16.6 18.3 18.3
Market Value (Millions) % of Plan
TOTAL DEVELOPED PASSIVE $109.6 1.0
Developed Passive Returns vs MSCI EAFE Index: September 30, 2014
New York City Fire Department Pension Fund, Subchapter Two 29Performance Overview as of September 30, 2014

TOTAL DEVELOPED GROWTH MSCI EAFE GROWTH
Trailing 3 Months FYTD Trailing 12 Months Trailing 3 Years Trailing 5 Years Trailing 10 Years Trailing 15 Years-8.00
-6.00
-4.00
-2.00
0.00
2.00
4.00
6.00
8.00
10.00
12.00
14.00
16.00
18.00
Rat
e of
Ret
urn
-5.28 -5.55 -5.28 -5.55
1.34
2.85
14.4113.33
7.75 7.56
Plan 3 Years Benchmark 3 Years Plan 5 Years Benchmark 5 Years Plan 10 Years Benchmark 10 YearsStandard Deviation
TOTAL DEVELOPEDGROWTH
14.7 13.6 16.7 16.1
Market Value (Millions) % of Plan
TOTAL DEVELOPED GROWTH $329.1 3.1
Developed Growth Returns vs MSCI EAFE Growth Index: September 30, 2014
New York City Fire Department Pension Fund, Subchapter Two 30Performance Overview as of September 30, 2014

TOTAL DEVELOPED VALUE MSCI EAFE VALUE NET (DAILY)
Trailing 3 Months FYTD Trailing 12 Months Trailing 3 Years Trailing 5 Years Trailing 10 Years Trailing 15 Years-10.00
-7.50
-5.00
-2.50
0.00
2.50
5.00
7.50
10.00
12.50
15.00
17.50
Rat
e of
Ret
urn
-4.69-6.20
-4.69-6.20
5.63 5.65
14.6813.91
9.04
5.526.97
5.92
Plan 3 Years Benchmark 3 Years Plan 5 Years Benchmark 5 Years Plan 10 Years Benchmark 10 YearsStandard Deviation
TOTAL DEVELOPEDVALUE
12.8 15.2 15.2 17.6 17.4 19.4
Market Value (Millions) % of Plan
TOTAL DEVELOPED VALUE $354.5 3.3
Developed Value Returns vs MSCI EAFE Value Net Index: September 30, 2014
New York City Fire Department Pension Fund, Subchapter Two 31Performance Overview as of September 30, 2014

TOTAL DEVELOPED SMALL CAP ACTIVE S&P EPAC Small Cap Index
Trailing 3 Months FYTD Trailing 12 Months Trailing 3 Years Trailing 5 Years Trailing 10 Years trailing 15 Years-10.50
-9.00
-7.50
-6.00
-4.50
-3.00
-1.50
0.00
1.50
3.00
4.50
6.00
7.50
Rat
e of
Ret
urn
-8.17-7.20
-8.17-7.20
5.194.62
TOTAL DEVELOPED SMALL CAP ACTIVE S&P EPAC Small Cap Index
Trailing 3 Months FYTD Trailing 12 Months Trailing 3 Years Trailing 5 Years Trailing 10 Years trailing 15 Years-10.50
-9.00
-7.50
-6.00
-4.50
-3.00
-1.50
0.00
1.50
3.00
4.50
6.00
7.50
Rat
e of
Ret
urn
-8.17-7.20
-8.17-7.20
5.194.62
Market Value (Millions) % of Plan
TOTAL DEVELOPED SMALL CAP ACTIVE $135.3 1.3
Plan 3 Years Benchmark 3 Years Plan 5 Years Benchmark 5 Years Plan 10 Years Benchmark 10 YearsStandard Deviation
TOTAL DEVELOPEDSMALL CAP ACTIVE
Developed Small Cap Active Returns vs S&P EPAC Small Cap Index: September 30, 2014
New York City Fire Department Pension Fund, Subchapter Two 32Performance Overview as of September 30, 2014

TOTAL EAFE SMALL CAP PASSIVE MSCI EAFE SMALL CAP NET (DAILY)
Trailing 3 Months FYTD Trailing 12 Months Trailing 3 Years Trailing 5 Years Trailing 10 Years Trailing 15 Years-8.00
-7.95
-7.90
-7.85
-7.80
-7.75
Rat
e of
Ret
urn
-7.92
-7.82
-7.92
-7.82
TOTAL EAFE SMALL CAP PASSIVE MSCI EAFE SMALL CAP NET (DAILY)
Trailing 3 Months FYTD Trailing 12 Months Trailing 3 Years Trailing 5 Years Trailing 10 Years Trailing 15 Years-8.00
-7.95
-7.90
-7.85
-7.80
-7.75
Rat
e of
Ret
urn
-7.92
-7.82
-7.92
-7.82
Plan 3 Years Benchmark 3 Years Plan 5 Years Benchmark 5 Years Portfolio 10 Years Benchmark 10 YearsStandard Deviation
TOTAL DEVELOPEDSMALL CAP PASSIVE
Market Value (Millions) % of Plan
TOTAL DEVELOPED SMALL CAP PASSIVE $25.1 0.2
Developed Small Cap Passive Returns vs MSCI EAFE Small Cap Net Index: September 30, 2014
New York City Fire Department Pension Fund, Subchapter Two 33Performance Overview as of September 30, 2014

TOTAL DEVELOPED LARGE CAP PASSIVE MSCI EAFE
Trailing 3 Months FYTD Trailing 12 Months Trailing 3 Years Trailing 5 Years Trailing 10 Years Trailing 15 Years-8.00
-6.00
-4.00
-2.00
0.00
2.00
4.00
6.00
8.00
10.00
12.00
14.00
16.00
Rat
e of
Ret
urn
-5.84 -5.88 -5.84 -5.88
4.58 4.25
13.98 13.65
TOTAL DEVELOPED LARGE CAP PASSIVE MSCI EAFE
Trailing 3 Months FYTD Trailing 12 Months Trailing 3 Years Trailing 5 Years Trailing 10 Years Trailing 15 Years-8.00
-6.00
-4.00
-2.00
0.00
2.00
4.00
6.00
8.00
10.00
12.00
14.00
16.00
Rat
e of
Ret
urn
-5.84 -5.88 -5.84 -5.88
4.58 4.25
13.98 13.65
Plan 3 Years Benchmark 3 Years Plan 5 Years Benchmark 5 Years Portfolio 10 Years Benchmark 10 YearsStandard Deviation
TOTAL DEVELOPEDLARGE CAP PASSIVE
14.2 14.3
Market Value (Millions) % of Plan
TOTAL DEVELOPED LARGE CAP PASSIVE $84.5 0.8
Developed Large Cap Passive Returns vs MSCI EAFE Index: September 30, 2014
New York City Fire Department Pension Fund, Subchapter Two 34Performance Overview as of September 30, 2014

TOTAL EMERGING MARKETS MSCI EMERGING MARKETS
Trailing 3 Months FYTD Trailing 12 Months Trailing 3 Years Trailing 5 Years Trailing 10 Years Trailing 15 Years-6.00
-4.50
-3.00
-1.50
0.00
1.50
3.00
4.50
6.00
7.50
9.00
10.50
12.00
13.50
Rat
e of
Ret
urn
-3.08 -3.50 -3.08 -3.50
7.73
4.30
9.03
7.19
5.384.42
11.6210.68
10.15
Market Value (Millions) % of Plan
TOTAL EMERGING MARKETS $709.3 6.7
Plan 3 Years Benchmark 3 Years Plan 5 Years Benchmark 5 Years Plan 10 Years Benchmark 10 YearsStandard Deviation
TOTAL EMERGINGMARKETS
17.2 17.2 18.8 18.5 24.0 23.8
Emerging Markets Returns vs MSCI Emerging Markets Index: September 30, 2014
New York City Fire Department Pension Fund, Subchapter Two 35Performance Overview as of September 30, 2014
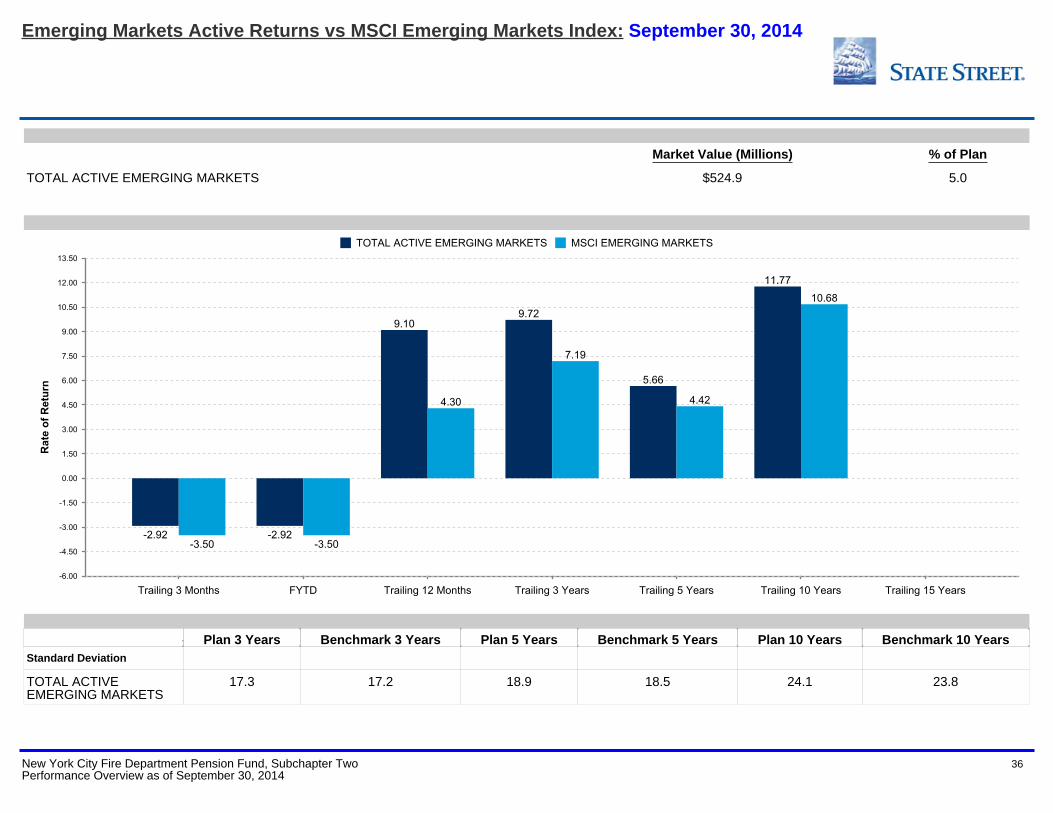
TOTAL ACTIVE EMERGING MARKETS MSCI EMERGING MARKETS
Trailing 3 Months FYTD Trailing 12 Months Trailing 3 Years Trailing 5 Years Trailing 10 Years Trailing 15 Years-6.00
-4.50
-3.00
-1.50
0.00
1.50
3.00
4.50
6.00
7.50
9.00
10.50
12.00
13.50
Rat
e of
Ret
urn
-2.92-3.50
-2.92-3.50
9.10
4.30
9.72
7.19
5.66
4.42
11.77
10.68
Market Value (Millions) % of Plan
TOTAL ACTIVE EMERGING MARKETS $524.9 5.0
Plan 3 Years Benchmark 3 Years Plan 5 Years Benchmark 5 Years Plan 10 Years Benchmark 10 YearsStandard Deviation
TOTAL ACTIVEEMERGING MARKETS
17.3 17.2 18.9 18.5 24.1 23.8
Emerging Markets Active Returns vs MSCI Emerging Markets Index: September 30, 2014
New York City Fire Department Pension Fund, Subchapter Two 36Performance Overview as of September 30, 2014

TOTAL PASSIVE EMERGING MARKETS MSCI EMERGING MARKETS
Trailing 3 Months FYTD Trailing 12 Months Trailing 3 Years Trailing 5 Years Trailing 10 Years Trailing 15 Years-6.00
-4.50
-3.00
-1.50
0.00
1.50
3.00
4.50
6.00
7.50
9.00
Rat
e of
Ret
urn
-3.60 -3.50 -3.60 -3.50
4.23 4.30
7.15 7.19
TOTAL PASSIVE EMERGING MARKETS MSCI EMERGING MARKETS
Trailing 3 Months FYTD Trailing 12 Months Trailing 3 Years Trailing 5 Years Trailing 10 Years Trailing 15 Years-6.00
-4.50
-3.00
-1.50
0.00
1.50
3.00
4.50
6.00
7.50
9.00
Rat
e of
Ret
urn
-3.60 -3.50 -3.60 -3.50
4.23 4.30
7.15 7.19
Market Value (Millions) % of Plan
TOTAL PASSIVE EMERGING MARKETS $184.3 1.7
Plan 3 Years Benchmark 3 Years Plan 5 Years Benchmark 5 Years Plan 10 Years Benchmark 10 YearsStandard Deviation
TOTAL PASSIVEEMERGING MARKETS
17.1 17.2
Emerging Markets Passive Returns vs MSCI Emerging Markets Index: September 30, 2014
New York City Fire Department Pension Fund, Subchapter Two 37Performance Overview as of September 30, 2014

TOTAL REITS DJ US SELECT REAL ESTATE SECURITIES INDEX
Trailing 3 Months FYTD Trailing 12 Months Trailing 3 Years Trailing 5 Years Traililng 10 Years Trailing 15 Years-6.00
-4.00
-2.00
0.00
2.00
4.00
6.00
8.00
10.00
12.00
14.00
16.00
18.00
20.00
Rat
e of
Ret
urn
-2.74 -2.99 -2.74 -2.99
12.6213.37
17.0016.17 16.56
15.69
9.278.13
Plan 3 Years Benchmark 3 Years Plan 5 Years Benchmark 5 Years Plan 10 Years Benchmark 10 YearsStandard Deviation
TOTAL REITS 14.3 15.1 16.6 17.1 25.2 26.4
Market Value (Millions) % of Plan
TOTAL REITS $362.0 3.4
REITS Returns vs DJ US Select Real Estate Securities Index: September 30, 2014
New York City Fire Department Pension Fund, Subchapter Two 38Performance Overview as of September 30, 2014

TOTAL HEDGE FUNDS HFRI Fund of Funds Composite Index + 1% 1 Year Treasury Bill Yield + 4%
Trailing 3 Months FYTD Trailing 12 Months Trailing 3 Years Trailing 5 Years Trailing 10 Years Trailing 15 Years0.00
1.00
2.00
3.00
4.00
5.00
6.00
7.00
8.00
9.00
Rat
e of
Ret
urn
0.830.55
1.070.83
0.55
1.07
6.847.24
4.26
4.80
6.23
4.28
Plan 3 Years Benchmark 3 Years Plan 5 Years Benchmark 5 Years Plan 10 Years Benchmark 10 YearsStandard Deviation
TOTAL HEDGE FUNDS 3.8 3.3
Market Value (Millions) % of Plan
TOTAL HEDGE FUNDS $378.2 3.6
Hedge Fund Returns vs Benchmarks: September 30, 2014
New York City Fire Department Pension Fund, Subchapter Two 39Performance Overview as of September 30, 2014

New York CityFire Department Pension Fund, Subchapter Two
Fixed Income Analysis
New York City Fire Department Pension Fund, Subchapter Two 40Performance Overview as of September 30, 2014

TOTAL STRUCTUREDTOTAL CORE PLUS FIX INCTOTAL PROGRESS FIXEDTOTAL TIPS MANAGERSTOTAL ENHANCED YIELDTOTAL BANK LOANSTOTAL CONVERTIBLE BONDSTOTAL OPPORTUNISTIC FIXEDTOTAL ETI (W/O CASH)TOTAL CASH
9.7%
2.0%
7.2%
1.5%
5.2%
11.9%
8.8%
0.8%
0.3%
52.5%
TOTAL STRUCTUREDTOTAL CORE PLUS FIX INCTOTAL PROGRESS FIXEDTOTAL TIPS MANAGERSTOTAL ENHANCED YIELDTOTAL BANK LOANSTOTAL CONVERTIBLE BONDSTOTAL OPPORTUNISTIC FIXEDTOTAL ETI (W/O CASH)TOTAL CASH
9.7%
2.0%
7.2%
1.5%
5.2%
11.9%
8.8%
0.8%
0.3%
52.5%
Market Value (Billions) % of Plan
TOTAL FIXED INCOME $3.4 31.9
Total Fixed Income Asset Allocation: September 30, 2014
New York City Fire Department Pension Fund, Subchapter Two 41Performance Overview as of September 30, 2014

TOTAL TREASURY/AGENCYTOATAL MORTGAGETOTAL INV GRADE CREDIT
49.2%
12.5%
38.2%
TOTAL TREASURY/AGENCYTOATAL MORTGAGETOTAL INV GRADE CREDIT
49.2%
12.5%
38.2%
Market Value (Billions) % of Plan
TOTAL STRUCTURED $1.8 16.7
Structured Fixed Income Asset Allocation: September 30, 2014
New York City Fire Department Pension Fund, Subchapter Two 42Performance Overview as of September 30, 2014

TOTAL STRUCTURED NYC - Core Plus Five
Trailing 3 Months FYTD Trailing 12 Months Trailing 3 Years Trailing 5 Years Trailing 10 Years Trailing 15 Years0.00
1.00
2.00
3.00
4.00
5.00
6.00
7.00
8.00
Rat
e of
Ret
urn
0.25 0.22 0.25 0.22
6.05
5.12
3.99
3.02
5.70
4.82
5.575.25
6.456.13
TOTAL STRUCTURED NYC - Core Plus Five
Trailing 3 Months FYTD Trailing 12 Months Trailing 3 Years Trailing 5 Years Trailing 10 Years Trailing 15 Years0.00
1.00
2.00
3.00
4.00
5.00
6.00
7.00
8.00
Rat
e of
Ret
urn
0.25 0.22 0.25 0.22
6.05
5.12
3.99
3.02
5.70
4.82
5.575.25
6.456.13
Plan 3 Years Benchmark 3 Years Plan 5 Years Benchmark 5 Years Plan 10 Years Benchmark 10 YearsStandard Deviation
TOTAL STRUCTURED 3.3 3.4 3.3 3.5 3.8 4.0
Market Value (Billions) % of Plan
TOTAL STRUCTURED $1.8 16.7
Structured Returns vs NYC Core + 5 Index: September 30, 2014
New York City Fire Department Pension Fund, Subchapter Two 43Performance Overview as of September 30, 2014

TOTAL CORE PLUS FIXED INCOME Barclays Aggregate (Daily)
Trailing 3 Months FYTD Trailing 12 Months Trailing 3 Years Trailing 5 Years Trailing 10 Years Trailing 15 Years-2.00
-1.00
0.00
1.00
2.00
3.00
4.00
5.00
6.00
7.00
Rat
e of
Ret
urn
-0.17
0.17
-0.17
0.17
4.13 3.963.61
2.43
5.12
4.12
TOTAL CORE PLUS FIXED INCOME Barclays Aggregate (Daily)
Trailing 3 Months FYTD Trailing 12 Months Trailing 3 Years Trailing 5 Years Trailing 10 Years Trailing 15 Years-2.00
-1.00
0.00
1.00
2.00
3.00
4.00
5.00
6.00
7.00
Rat
e of
Ret
urn
-0.17
0.17
-0.17
0.17
4.13 3.963.61
2.43
5.12
4.12
Plan 3 Years Benchmark 3 Years Plan 5 Years Benchmark 5 Years Plan 10 Years Benchmark 10 YearsStandard Deviation
TOTAL CORE PLUSFIXED INCOME
3.6 2.7 3.1 2.8
Market Value (Millions) % of Plan
TOTAL CORE PLUS FIXED INCOME $11.0 0.1
Core Plus Fixed Income Returns vs Barclays Aggregate Index: September 30, 2014
New York City Fire Department Pension Fund, Subchapter Two 44Performance Overview as of September 30, 2014

TOTAL PROGRESS FIXED Barclays Aggregate (Daily)
Trailing 3 Months FYTD Trailing 12 Months Trailing 3 Years Trailing 5 Years Trailing 10 Years Trailing 15 Years0.00
0.50
1.00
1.50
2.00
2.50
3.00
3.50
4.00
4.50
5.00
5.50
Rat
e of
Ret
urn
0.10 0.17 0.10 0.17
4.98
3.96
TOTAL PROGRESS FIXED Barclays Aggregate (Daily)
Trailing 3 Months FYTD Trailing 12 Months Trailing 3 Years Trailing 5 Years Trailing 10 Years Trailing 15 Years0.00
0.50
1.00
1.50
2.00
2.50
3.00
3.50
4.00
4.50
5.00
5.50
Rat
e of
Ret
urn
0.10 0.17 0.10 0.17
4.98
3.96
Plan 3 Years Benchmark 3 Years Plan 5 Years Benchmark 5 Years Plan 10 Years Benchmark 10 YearsStandard Deviation
TOTAL PROGRESSFIXED
Market Value (Millions) % of Plan
TOTAL PROGRESS FIXED $27.7 0.3
Progress Fixed Income Returns vs Barclays Aggregate Index: September 30, 2014
New York City Fire Department Pension Fund, Subchapter Two 45Performance Overview as of September 30, 2014

TOTAL TIPS MANAGERS Barclays Global Inflation Linked: US TIPS (Daily)
Trailing 3 Months FYTD Trailing 12 Months Trailing 3 Years Trailing 5 Years Trailing 10 Years Trailing 15 Years-4.00
-3.00
-2.00
-1.00
0.00
1.00
2.00
3.00
4.00
5.00
6.00
Rat
e of
Ret
urn
-2.00 -2.04 -2.00 -2.04
1.72 1.59 1.48 1.34
4.62 4.48
Plan 3 Years Benchmark 3 Years Plan 5 Years Benchmark 5 Years Plan 10 Years Benchmark 10 YearsStandard Deviation
TOTAL TIPS MANAGERS 5.2 5.3 5.2 5.3
Market Value (Millions) % of Plan
TOTAL TIPS MANAGERS $299.2 2.8
TIPS Returns vs Barclays Global Inflation Linked US TIPS Index: September 30, 2014
New York City Fire Department Pension Fund, Subchapter Two 46Performance Overview as of September 30, 2014

TOTAL ENHANCED YIELD CITIGROUP BB & B CITIGROUP BB & B CAPPED
Trailing 3 Months FYTD Trailing 12 Months Trailing 3 Years Trailing 5 Years Trailing 10 Years Trailing 15 Years-4.50
-3.00
-1.50
0.00
1.50
3.00
4.50
6.00
7.50
9.00
10.50
12.00
Rat
e of
Ret
urn
-1.89 -1.60 -1.56 -1.89 -1.60 -1.56
7.40 7.12 7.14
10.03 10.12 10.01 9.80 9.75 9.62
7.80
6.83 7.05 7.416.63
Plan 3 Years Benchmark 3 Years Plan 5 Years Benchmark 5 Years Plan 10 Years Benchmark 10 YearsStandard Deviation
TOTAL ENHANCEDYIELD
10.0 5.2 5.6 5.6 8.1 8.9
Market Value (Millions) % of Plan
TOTAL ENHANCED YIELD $403.0 3.8
Enhanced Yield Returns vs Benchmarks: September 30, 2014
New York City Fire Department Pension Fund, Subchapter Two 47Performance Overview as of September 30, 2014

TOTAL BANK LOANS CSFB LEVERAGED LOAN INDEX
Trailing 3 Months FYTD Trailing 12 Months Trailing 3 Years Trailing 5 Years Trailing 10 Years Trailing 15 Years-2.00
-1.00
0.00
1.00
2.00
3.00
4.00
5.00
6.00
7.00
Rat
e of
Ret
urn
0.07
-0.33
0.07
-0.33
5.09
4.30
TOTAL BANK LOANS CSFB LEVERAGED LOAN INDEX
Trailing 3 Months FYTD Trailing 12 Months Trailing 3 Years Trailing 5 Years Trailing 10 Years Trailing 15 Years-2.00
-1.00
0.00
1.00
2.00
3.00
4.00
5.00
6.00
7.00
Rat
e of
Ret
urn
0.07
-0.33
0.07
-0.33
5.09
4.30
Plan 3 Years Benchmark 3 Years Plan 5 Years Benchmark 5 Years Plan 10 Years Benchmark 10 YearsStandard Deviation
TOTAL BANK LOANS
Market Value (Millions) % of Plan
TOTAL BANK LOANS $176.0 1.7
Bank Loan Returns vs CSFB Leveraged Loan Index: September 30, 2014
New York City Fire Department Pension Fund, Subchapter Two 48Performance Overview as of September 30, 2014

TOTAL CONVERTIBLE BONDS Fire Custom Convertible Bond Index BofAML ALL CONVERTIBLE EX M AI (DAILY)
Trailing 3 Months FYTD Trailing 12 Months Trailing 3 Years Trailing 5 Years Trailing 10 Years Trailing 15 Years-6.00
-4.00
-2.00
0.00
2.00
4.00
6.00
8.00
10.00
12.00
14.00
16.00
18.00
20.00
Rat
e of
Ret
urn
-2.60-1.52 -1.61
-2.60-1.52 -1.61
6.87 6.84
14.47
11.28
9.39
17.18
9.178.42
12.90
Plan 3 Years Benchmark 3 Years Plan 5 Years Benchmark 5 Years Plan 10 Years Benchmark 10 YearsStandard Deviation
TOTAL CONVERTIBLEBONDS
11.3 4.9 8.0 5.5
Market Value (Millions) % of Plan
TOTAL CONVERTIBLE BONDS $52.1 0.5
Convertible Bond Returns vs Benchmarks: September 30, 2014
New York City Fire Department Pension Fund, Subchapter Two 49Performance Overview as of September 30, 2014

TOTAL OPPORTUNISTIC FIXED 10% Annual Return JP Morgan Global High Yield Plus 3%
Trailing 3 Months FYTD Trailing 12 Months Trailing 3 Years Trailing 5 Years Trailing 10 Years Trailing 15 Years-4.00
-2.00
0.00
2.00
4.00
6.00
8.00
10.00
12.00
14.00
16.00
18.00
Rat
e of
Ret
urn
3.382.41
-1.14
3.382.41
-1.14
13.60
10.0010.98 11.28
10.00
14.45
15.90
10.00
13.96
Plan 3 Years Benchmark 3 Years Plan 5 Years Benchmark 5 Years Plan 10 Years Benchmark 10 YearsStandard Deviation
TOTAL OPPORTUNISTICFIXED
11.3 0.0 8.0 0.0
Market Value (Millions) % of Plan
TOTAL OPPORTUNISTIC FIXED $244.7 2.3
Opportunistic Fixed Income Returns vs Benchmarks: September 30, 2014
New York City Fire Department Pension Fund, Subchapter Two 50Performance Overview as of September 30, 2014

TOTAL ETI (W/O CASH) Fire Custom Benchmark (No Cash)
Trailing 3 Months FYTD Trailing 12 Months Trailing 3Years Trailing 5 Years Trailing 10 Years Trailing 15 Years0.00
1.00
2.00
3.00
4.00
5.00
6.00
7.00
Rat
e of
Ret
urn
0.27 0.18 0.27 0.18
4.92
3.73
2.90
2.31
4.093.85
4.764.49
5.655.37
TOTAL ETI (W/O CASH) Fire Custom Benchmark (No Cash)
Trailing 3 Months FYTD Trailing 12 Months Trailing 3Years Trailing 5 Years Trailing 10 Years Trailing 15 Years0.00
1.00
2.00
3.00
4.00
5.00
6.00
7.00
Rat
e of
Ret
urn
0.27 0.18 0.27 0.18
4.92
3.73
2.90
2.31
4.093.85
4.764.49
5.655.37
Plan 3 Years Benchmark 3 Years Plan 5 Years Benchmark 5 Years Plan 10 Years Benchmark 10 YearsStandard Deviation
TOTAL ETI (W/O CASH) 2.4 2.4 2.4 2.6 2.8 2.9
Market Value (Millions) % of Plan
TOTAL ETI (W/O CASH) $67.3 0.6
ETI Returns vs Custom Index: September 30, 2014
New York City Fire Department Pension Fund, Subchapter Two 51Performance Overview as of September 30, 2014

New York CityFire Department Pension Fund, Subchapter Two
Appendix
New York City Fire Department Pension Fund, Subchapter Two 52Performance Overview as of September 30, 2014

Assets ($MM) % of Total 3 Month YTD 1 Year 3 Year 5 Year 10 Year 15 Year
EQUITY MANAGEMENT
SMALL CAPBrown AM - SCG 34.1 0.32 (3.65) (4.61) 3.58 25.04 19.62
TOTAL SMALL CAP GROWTH 34.1 0.32 (3.65) (4.61) 3.58 23.06 15.78 9.57
RUSSELL 2000 GROWTH (6.13) (4.05) 3.79 21.91 15.51 9.03 5.69
Ceredex SCV 70.5 0.66 (10.03) (6.28) 2.62
Dalton Greiner (Value) - Small Cap 47.1 0.44 (8.80) (2.35) 6.41 21.94
TOTAL SMALL CAP VALUE 117.6 1.11 (9.54) (4.74) 4.11 20.64
RUSSELL 2000 VALUE (8.58) (4.74) 4.13 20.61 13.02 7.25 9.68
TOTAL ACTIVE SMALL CAP 151.7 1.43 (8.28) (4.71) 3.99 20.43 13.52 6.36
RUSSELL 2000 (7.36) (4.41) 3.93 21.26 14.29 8.19 7.93
Blackrock R2000 Growth 23.5 0.22 (6.12) (4.03) 4.11
TOTAL SMALL CAP GROWTH PASSIVE 23.5 0.22 (6.12) (4.03) 4.11
RUSSELL 2000 GROWTH (6.13) (4.05) 3.79 21.91 15.51 9.03 5.69
Blackrock R2000 Value 14.1 0.13 (8.56) (4.98) 3.92
TOTAL SMALL CAP VALUE PASSIVE 14.1 0.13 (8.56) (4.98) 3.92
RUSSELL 2000 VALUE (8.58) (4.74) 4.13 20.61 13.02 7.25 9.68
TOTAL SMALL CAP PASSIVE 37.6 0.35 (7.05) (3.96) 4.60
TOTAL SMALL CAP 189.2 1.79 (8.04) (4.58) 3.95 20.12 13.18 6.20
RUSSELL 2000 (7.36) (4.41) 3.93 21.26 14.29 8.19 7.93
Consolidated Performance Report
Through September 30, 2014
New York City Fire Department Pension Fund, Subchapter Two 53Performance Overview as of September 30, 2014

Assets ($MM) % of Total 3 Month YTD 1 Year 3 Year 5 Year 10 Year 15 Year
SMALL/MID CAPSecurity Global Investors SMID 74.7 0.71 (7.35) (0.93) 6.09 20.13
RUSSELL 2500 VALUE (6.40) 0.96 9.88 22.82 15.16 8.65 10.42
MID CAPTimes Square Capital MCG 162.9 1.54 (1.83) 2.31 14.39 23.88
RUSSELL MIDCAP GROWTH (0.73) 5.73 14.43 22.74 17.12 10.24 6.94
Iridian Asset Mgmt. MCV 100.2 0.95 (1.44) 9.70 23.93 31.86
TOTAL MID CAP VALUE 100.2 0.95 (1.44) 9.70 23.93 31.86 21.72 11.22
RUSSELL MIDCAP VALUE (2.65) 8.20 17.46 24.72 17.24 10.17 10.60
Wellington Mgmt. MCC 99.8 0.94 (4.40) 6.19 16.15 25.78
TOTAL MID CAP CORE 99.8 0.94 (4.40) 6.19 16.15 25.78 17.10 8.89
S&P 400 MIDCAP INDEX (3.98) 3.22 11.82 22.43 16.37 10.29 10.36
TOTAL MID CAP ACTIVE 362.9 3.42 (2.44) 5.33 17.37 26.43 18.09 9.18
RUSSELL MIDCAP (1.66) 6.87 15.83 23.79 17.19 10.34 9.64
State St GA S&P 400 120.8 1.14 (3.43) 3.79 12.48 22.62
S&P 400 MIDCAP INDEX (3.98) 3.22 11.82 22.43 16.37 10.29 10.36
TOTAL MID CAP 483.7 4.56 (2.71) 4.87 15.61 24.90 16.97 8.66
RUSSELL MIDCAP (1.66) 6.87 15.83 23.79 17.19 10.34 9.64
Consolidated Performance Report
Through September 30, 2014
New York City Fire Department Pension Fund, Subchapter Two 54Performance Overview as of September 30, 2014

Assets ($MM) % of Total 3 Month YTD 1 Year 3 Year 5 Year 10 Year 15 Year
RUSSELL 1000Profit Inv Mgmt - LCG 56.0 0.53 3.38 10.65 21.36 25.50 16.18
TOTAL RUSSELL 1000 GROWTH 56.0 0.53 3.38 8.28 15.44 26.29 17.26 8.69
RUSSELL 1000 GROWTH 1.49 7.89 19.15 22.45 16.50 8.94 3.42
RUSSELL 3000 GROWTH 0.88 6.91 17.87 22.41 16.43 8.95 3.59
Seizert Capital Ptnrs - LCC 57.7 0.54 2.20 10.83 22.19 23.95 16.86
TOTAL RUSSELL 1000 CORE 57.7 0.54 2.20 10.83 22.19 23.95 16.86
RUSSELL 1000 0.65 7.97 19.01 23.23 15.90 8.46 5.33
TOTAL RUSSELL 1000 ACTIVE 113.7 1.07 2.78 8.30 16.12 26.79 17.17 8.94
RUSSELL 1000 0.65 7.97 19.01 23.23 15.90 8.46 5.33
Blackrock R1000 Growth 708.7 6.69 1.49 7.83 19.20
RUSSELL 1000 GROWTH 1.49 7.89 19.15 22.45 16.50 8.94 3.42
Blackrock R1000 Value 776.7 7.33 (0.20) 8.04 18.79
RUSSELL 1000 VALUE (0.19) 8.07 18.89 23.93 15.26 7.84 6.65
TOTAL RUSSELL 1000 PASSIVE 1,485.4 14.02 0.60 7.89 18.94
TOTAL RUSSELL 1000 1,599.1 15.09 0.75 7.74 18.21 26.86 17.21 8.95
RUSSELL 1000 0.65 7.97 19.01 23.23 15.90 8.46 5.33
RUSSELL 3000State Street Global Advisors R3000 1,091.9 10.31 (0.05) 6.82 17.60 23.04
TOTAL RUSSELL 3000 PASSIVE 1,091.9 10.31 (0.05) 6.83 17.60 23.06 15.79 8.49 5.61
RUSSELL 3000 0.01 6.95 17.76 23.08 15.78 8.44 5.51
Consolidated Performance Report
Through September 30, 2014
New York City Fire Department Pension Fund, Subchapter Two 55Performance Overview as of September 30, 2014

Assets ($MM) % of Total 3 Month YTD 1 Year 3 Year 5 Year 10 Year 15 Year
ATTUCKS MANAGERSApex Capital Mgmt - SCG 5.0 0.05 (3.55) 0.44 10.89
Bird Rock Asset Mgmt - SCV 2.2 0.02 (6.91) (1.95) 6.04
EAM Investors - MCG 5.1 0.05 (5.65) (4.92) 0.48
Opus Capital Mgmt - SCV 5.8 0.05 (7.76) (2.82) 3.59
Paradigm Asset Mgt - SCC 6.0 0.06 (7.57) (6.31) 0.76
TOTAL ATTUCKS MANAGERS 24.1 0.23 (6.33) (3.43) 3.84
RUSSELL 2000 (7.36) (4.41) 3.93 21.26 14.29 8.19 7.93
CAPITAL PROSPECTS MANAGERSAH Lisanti Capital Growth - SCG 3.6 0.03 (4.40) (6.77) (0.06)
Bernzott Capital Advisors - SCV 3.7 0.04 (2.90) (0.79) 10.71
Channing Cap Mgmt - SCV 4.0 0.04 (7.04) (2.35) 6.18
CWC Advisors - SCC 3.4 0.03 (3.40) 1.83 7.47
High Pointe R-2000 1.4 0.01 (8.83) (6.04) 0.62
Huber Cap Mgmt - SCV 3.7 0.04 (10.77) (8.23) 1.30
Lombardia R-2000 Value 3.1 0.03 (8.61) (5.13) 3.16
Profit Inv Mgmt - SCC 3.5 0.03 (6.43) (2.64) 7.70
Quotient Investors - SCC 3.8 0.04 (6.70) 3.13 13.11
Stephens Inv Mgmt - SCG 3.4 0.03 (4.54) (6.81) (1.29)
Summit Creek Advisors - SCG 3.4 0.03 (4.80) (5.43) 1.67
TOTAL CAPITAL PROSPECTS MANAGERS 37.0 0.35 (6.14) (3.51) 4.73
RUSSELL 2000 (7.36) (4.41) 3.93 21.26 14.29 8.19 7.93
PROGRESS MANAGERSApex Cap Mgmt - SMDG 18.4 0.17 (0.38) 6.56 17.48
Cardinal Cap Mgmt - SCV 10.3 0.10 (8.20) (0.26) 7.68
Huber Cap Mgmt - SCV 15.4 0.15 (10.48) (7.96) 1.38
Lombardia Cap Ptnrs LLC Small Value 5.6 0.05 (6.84) (0.50) 8.30
Consolidated Performance Report
Through September 30, 2014
New York City Fire Department Pension Fund, Subchapter Two 56Performance Overview as of September 30, 2014

Assets ($MM) % of Total 3 Month YTD 1 Year 3 Year 5 Year 10 Year 15 YearMonarch Partners Asset Mgmt - SCV 12.8 0.12 (6.44) (3.14) 4.15
Nichols Asset Mgmt - SCG 13.7 0.13 (5.60) (7.29) 3.44
OMT Cap Mgmt - SMDG 9.8 0.09 (3.17) (6.09) 1.92
Phocas Financial - SCV 9.1 0.09 (6.41) 0.50 12.13
TOTAL PROGRESS MANAGERS 95.1 0.90 (5.79) (2.40) 7.03
RUSSELL 2000 (7.36) (4.41) 3.93 21.26 14.29 8.19 7.93
EMERGING MANAGER PROGRAM 156.3 1.47 (5.96) (2.82) 5.98
RUSSELL 2000 (7.36) (4.41) 3.93 21.26 14.29 8.19 7.93
RUSSELL 3000 0.01 6.95 17.76 23.08 15.78 8.44 5.51
TOTAL ACTIVE DOMESTIC EQUITY 859.2 8.11 (3.97) 1.60 10.90 23.67 15.54 8.10 4.52
TOTAL PASSIVE DOMESTIC EQUITY 2,735.7 25.82 0.01 7.07 17.76 23.17 15.66 8.43 5.86
TOTAL DOMESTIC EQUITY 3,594.9 33.93 (0.90) 5.75 16.08 23.37 15.69 8.31 5.42
RUSSELL 3000 0.01 6.95 17.76 23.08 15.78 8.44 5.51
INTERNATIONAL EQUITY
DEVELOPED MARKETS
GROWTHBaillie Gifford 193.7 1.83 (6.20) (5.59) 1.45
Walter Scott 135.4 1.28 (3.91) (1.15) 0.89
TOTAL DEVELOPED GROWTH 329.1 3.11 (5.28) (3.92) 1.34 14.41 7.75
MSCI EAFE GROWTH (5.55) (2.19) 2.85 13.33 7.56 6.65 2.84
VALUECauseway 150.4 1.42 (3.31) (0.52) 6.25
Sprucegrove 204.1 1.93 (5.71) 0.31 5.04 13.03 8.42 7.50
Consolidated Performance Report
Through September 30, 2014
New York City Fire Department Pension Fund, Subchapter Two 57Performance Overview as of September 30, 2014

Assets ($MM) % of Total 3 Month YTD 1 Year 3 Year 5 Year 10 Year 15 YearTOTAL DEVELOPED VALUE 354.5 3.35 (4.69) 0.11 5.63 14.68 9.04 6.97
MSCI EAFE VALUE NET (6.20) (0.57) 5.65 13.91 5.52 5.92 4.76
SMALL CAPAcadian 70.8 0.67 (8.35) (0.16) 8.35
Pyramis 64.5 0.61 (7.98) (4.28) 1.92
TOTAL DEVELOPED SMALL CAP ACTIVE 135.3 1.28 (8.17) (2.17) 5.19
S&P EPAC SmallCap Index (7.20) (1.23) 4.62 15.27 9.12 8.80 7.45
REBAL-Transition 114.7 1.08
TOTAL ACTIVE DEVELOPED EQUITY 934.7 8.82 (5.37) (2.36) 3.18 13.37 7.42 6.92 4.51
MSCI EAFE Free NET (5.88) (1.38) 4.25 13.65 6.56 6.32 3.87
SSGA MSCI EAFE Small Cap Index 25.1 0.24 (7.92)
TOTAL DEVELOPED SMALL CAP PASSIVE 25.1 0.24 (7.92)
MSCI EAFE SMALLCAP NET (7.82) (2.74) 3.00 14.49 8.91 8.02 7.36
SSGA 84.5 0.80 (5.84) (1.06) 4.58 13.98
TOTAL DEVELOPED LARGE CAP PASSIVE 84.5 0.80 (5.84) (1.06) 4.58 13.98
MSCI EAFE (5.88) (1.38) 4.25 13.65 6.56 6.32 3.87
TOTAL PASSIVE DEVELOPED 109.6 1.03 (6.32) (1.96) 3.63 13.63 6.75 6.59 4.16
MSCI EAFE (5.88) (1.38) 4.25 13.65 6.56 6.32 3.87
TOTAL DEVELOPED EQUITY 1,044.4 9.86 (5.47) (2.32) 3.23 13.32 7.25 6.84 4.39
MSCI EAFE (5.88) (1.38) 4.25 13.65 6.56 6.32 3.87
Consolidated Performance Report
Through September 30, 2014
New York City Fire Department Pension Fund, Subchapter Two 58Performance Overview as of September 30, 2014

Assets ($MM) % of Total 3 Month YTD 1 Year 3 Year 5 Year 10 Year 15 YearTOTAL DEVELOPED ENVIRONMENTAL ACTIVIST EX PASSIVE 934.8 8.82 (5.37) (2.37) 3.22 13.49 7.45 6.79
TOTAL DEVELPOED ENVIRONMENTAL ACTIVIST 1,044.4 9.86 (5.47) (2.33) 3.26 13.44 7.30 6.74
MSCI EAFE (5.88) (1.38) 4.25 13.65 6.56 6.32 3.87
EMERGING MARKETSAcadian 116.7 1.10 (1.62) 6.94 8.28 10.27 7.55
Ballie Gifford 177.3 1.67 (3.00) 5.96 13.86 11.22 6.00
DFA 111.0 1.05 (4.27) 2.86 3.80
Eaton Vance EM 120.0 1.13 (2.41) 4.29 7.43
TOTAL ACTIVE EMERGING MARKETS 524.9 4.95 (2.92) 5.13 9.10 9.72 5.66 11.77
MSCI EMERGING MARKETS (3.50) 2.43 4.30 7.19 4.42 10.68
CONY GT FIRE Blackrock-MSCI EM MK 184.3 1.74 (3.60) 2.16 4.23 7.15
TOTAL PASSIVE EMERGING MARKETS 184.3 1.74 (3.60) 2.16 4.23 7.15
MSCI EMERGING MARKETS (3.50) 2.43 4.30 7.19 4.42 10.68
TOTAL EMERGING MARKETS 709.3 6.69 (3.08) 4.32 7.73 9.03 5.38 11.62 10.15
MSCI EMERGING MARKETS (3.50) 2.43 4.30 7.19 4.42 10.68
TOTAL ACTIVE INTERNATIONAL EQUITY 1,459.8 13.78 (4.53) 0.13
TOTAL PASSIVE INTERNATIONAL EQUITY 293.9 2.77 (3.22) 1.76
TOTAL INTERNATIONAL EQUITY 1,753.7 16.55 (4.53) 0.22 5.00 11.55 6.22 7.51 5.08
MSCI AC WORLD ex US (5.27) 0.00 4.77 11.79 6.03 7.06
REITSAdelante (Lend Lease Rosen) (REIT) 129.8 1.23 (1.94) 16.22 16.37 17.67 17.07 8.54
European 0.2 0.00
FTSE EPRA/NAREIT Devel (4.43) 7.23 6.71 15.63 11.26 7.83
Consolidated Performance Report
Through September 30, 2014
New York City Fire Department Pension Fund, Subchapter Two 59Performance Overview as of September 30, 2014

Assets ($MM) % of Total 3 Month YTD 1 Year 3 Year 5 Year 10 Year 15 YearCony GTM EM Transition-Closed 51.1 0.48
MS REIT 180.9 1.71 (2.43) 14.89 15.00 17.06 16.53 10.17
TOTAL REITS 362.0 3.42 (2.74) 12.28 12.62 17.00 16.56 9.27
DJ US SELECT REAL ESTATE (2.99) 14.60 13.37 16.17 15.69 8.13 11.55
HEDGE FUNDS
DIRECT HEDGE FUNDSBLUE TREND FD 21.4 0.20 (0.13) 6.02 6.94
BREVAN HOWARD LP 20.7 0.20 5.05 0.48 1.55
BREVAN HOWARD OPP 21.2 0.20 5.40 1.60 3.40
BRIGADE LEV CAP STR FD 25.2 0.24 (1.96) 3.19 5.59
CARLSON DOUBLE BLK DIA FD 30.1 0.28 1.43 6.31 11.57
CASPIAN SELECT CF 22.8 0.22 (0.51) 4.38 7.56
CCP QUANT FD 16.4 0.15 6.16 4.07 (6.94)
D.E. SHAW COMPOSITE FD 59.1 0.56 3.57 13.28 16.69
FIR TREE VAL FD 29.0 0.27 (1.89) (1.64) 3.20
LUXOR CAPITAL 27.1 0.26 (1.54)
PERRY CAPITAL LP 23.0 0.22 (4.48) (1.76) 4.39
PHARO MACRO FD 19.2 0.18 0.16 9.43 20.27
STANDARD GENERAL 6.1 0.06 (0.44)
TOTAL DIRECT HEDGE FUNDS 321.5 3.03 0.88 4.42 7.16
HFRI Fund of Funds Composite Index + 1% 0.55 3.18 7.24 6.23 4.44 4.46 5.61
PERMAL ASSET MANAGEMENT 56.7 0.54 0.59 2.42 4.68 4.35
TOTAL PERMAL HEDGE FUNDS OF FUNDS 56.7 0.54 0.59 2.42 4.68 4.33
HFRI Fund of Funds Composite Index + 1% 0.55 3.18 7.24 6.23 4.44 4.46 5.61
Consolidated Performance Report
Through September 30, 2014
New York City Fire Department Pension Fund, Subchapter Two 60Performance Overview as of September 30, 2014

Assets ($MM) % of Total 3 Month YTD 1 Year 3 Year 5 Year 10 Year 15 YearTOTAL HEDGE FUNDS 378.2 3.57 0.83 4.10 6.84 4.80
HFRI Fund of Funds Composite Index + 1% 0.55 3.18 7.24 6.23 4.44 4.46 5.61
1 Year Treasury Bill Yield + 4% 1.07 3.20 4.26 4.28 4.46 6.03 6.71
PRIVATE EQUITY INVESTMENTSACON Equity Partners III LP 0.5 0.01
Aisling Capital II, LP 0.7 0.01
Aisling Capital III, L.P. 2.4 0.02
Altaris Health Partners III, L.P. 0.1 0.00
American Securities Partners VI, L.P. 15.2 0.14
Ampersand 2011 L.P. 5.7 0.05
Apollo Investment Fund V, L.P. 1.2 0.01
Apollo Investment Fund VI, L.P. 12.8 0.12
Apollo Investment Fund VII, L.P. 15.8 0.15
Apollo Investment Fund VIII 3.0 0.03
Ardian Secondary VI 7.0 0.07
Ares Corp. Opportunities Fund I, L.P. 0.8 0.01
Ares Corp. Opportunities Fund II, L.P. 1.4 0.01
Ares Corp. Opportunities Fund III, L.P. 8.9 0.08
Ares Corp. Opportunities Fund IV, L.P. 7.8 0.07
Aurora Equity Partners III, L.P. 0.4 0.00
Avista Capital Partners II, L.P 12.7 0.12
Avista Capital Partners, L.P. 3.7 0.04
AXA Secondary Fund V B L.P. 30.2 0.28
BC European Capital IX 13.0 0.12
BDCM Opportunity Fund III, L.P. 7.5 0.07
Blackstone Capital Partners IV, L.P. 6.8 0.06
Blackstone Capital Partners V, L.P. 8.1 0.08
Blackstone Capital Partners VI, L.P. 6.2 0.06
Consolidated Performance Report
Through September 30, 2014
New York City Fire Department Pension Fund, Subchapter Two 61Performance Overview as of September 30, 2014

Assets ($MM) % of Total 3 Month YTD 1 Year 3 Year 5 Year 10 Year 15 YearBlackstone Mezzanine Partners II L.P. 0.3 0.00
Bridgepoint Europe III 3.1 0.03
Bridgepoint Europe IV 5.2 0.05
Capital Partners PE Income Fund II, L.P. 0.2 0.00
Carlyle Partners IV, L.P. 1.5 0.01
Carlyle Partners V, L.P. 8.2 0.08
Carlyle Partners VI, L.P. 5.9 0.06
Catterton Partners VI, L.P. 3.8 0.04
CCMP Capital Investors II, L.P. 3.7 0.04
Celtic Pharmaceutical Holdings, L.P. 1.5 0.01
Coller International Partners V, L.P. 2.4 0.02
ComVest Investment Partners IV, L.P. 14.6 0.14
Constellation Venture Capital III, L.P. 2.8 0.03
Crestview Partners II, L.P. 7.2 0.07
CS Emerging Manager Co-Inv, L.P. 0.3 0.00
CS Emerging Manager Fund, L.P. 5.8 0.05
CVC Capital Partners VI 2.8 0.03
CVC European Equity Partners III, L.P. 0.4 0.00
CVC European Equity Partners V, L.P. 9.6 0.09
Cypress Merchant Banking Ptnrs II, L.P. 3.0 0.03
EQT VI, L.P. 12.0 0.11
Erasmus New York City Growth Fund IA 0.4 0.00
Erasmus New York City Growth Fund, L.P. 30.3 0.29
Euro Choice II (Delaware) L.P. 2.8 0.03
Euro Choice III L.P. 3.5 0.03
Euro Choice IV L.P. 4.6 0.04
FdG Capital Partners II LP 0.7 0.01
FdG Capital Partners, L.P. 5.7 0.05
Fenway Partners Capital Fund III, L.P. 2.7 0.03
Consolidated Performance Report
Through September 30, 2014
New York City Fire Department Pension Fund, Subchapter Two 62Performance Overview as of September 30, 2014

Assets ($MM) % of Total 3 Month YTD 1 Year 3 Year 5 Year 10 Year 15 YearFire Medal Fund 0.2 0.00
First Reserve Fund XI, L.P. 3.0 0.03
First Reserve Fund XII, L.P. 4.1 0.04
FirstMark IV, L.P. 4.7 0.04
The Fourth Cinven Fund 2.2 0.02
FS Equity Partners V, L.P. 3.4 0.03
FS Equity Partners VI, L.P. 12.1 0.11
FTV IV, LP 0.9 0.01
FTVentures III, L.P. 2.9 0.03
GI Partners Fund II 1.0 0.01
GI Partners Fund III 4.6 0.04
Green Equity Investors VI 11.6 0.11
Grey Mountain Partners Fund III, LP 0.1 0.00
GSO Capital Opportunities Fund, L.P. 2.7 0.03
Highland Consumer Fund I 1.5 0.01
ICV Partners III, L.P. 0.7 0.01
Incline Equity Partners III, L.P. 0.3 0.00
Intermedia Partners VII, L.P. 3.9 0.04
JP Morgan Fleming (Tranche A), L.P. 2.1 0.02
Landmark Equity Partners XI, L.P. 0.7 0.01
Landmark Equity Partners XIV, L.P. 9.3 0.09
Landmark Equity Partners XV 7.2 0.07
Lee Equity Partners, L.P. 5.6 0.05
Levine Leichtman Capital Partners IV LP 3.9 0.04
Lexington Capital Partners VII, L.P. 6.8 0.06
LEXINGTON CAP VIII 0.6 0.01
Lincolnshire Equity Fund II, L.P. 0.5 0.00
Lincolnshire Equity Fund III, L.P. 3.0 0.03
Lincolnshire Equity Fund IV, L.P. 1.7 0.02
Consolidated Performance Report
Through September 30, 2014
New York City Fire Department Pension Fund, Subchapter Two 63Performance Overview as of September 30, 2014
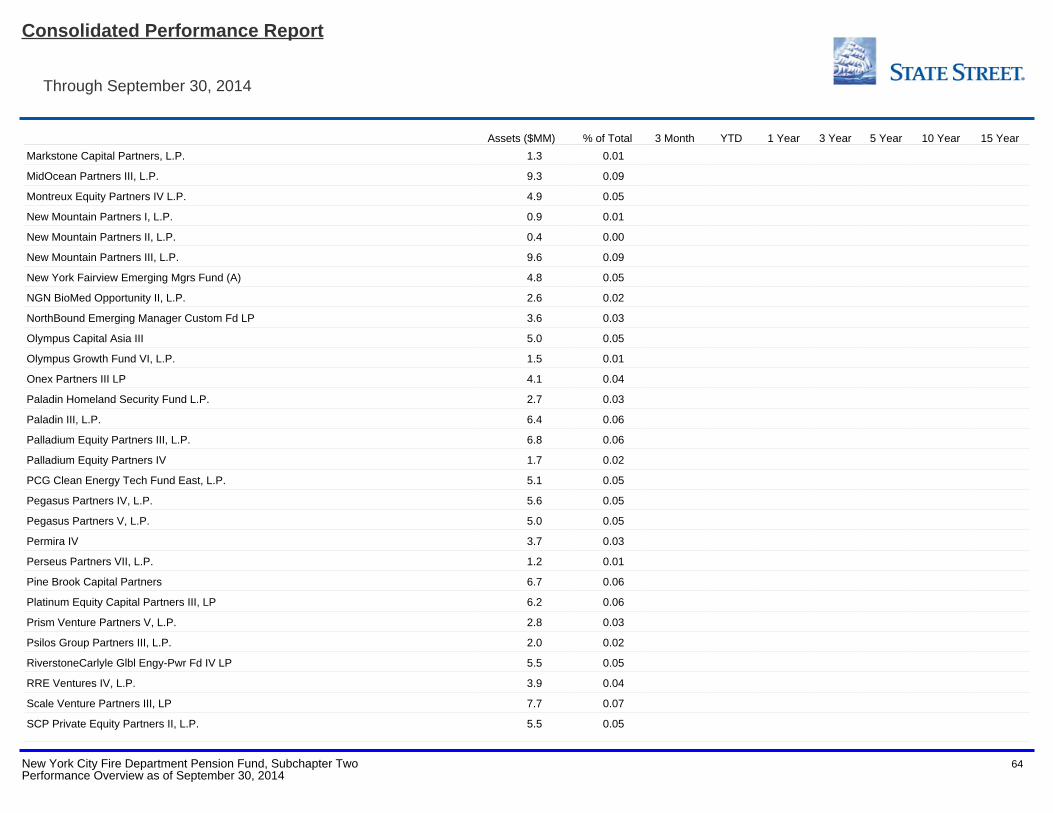
Assets ($MM) % of Total 3 Month YTD 1 Year 3 Year 5 Year 10 Year 15 YearMarkstone Capital Partners, L.P. 1.3 0.01
MidOcean Partners III, L.P. 9.3 0.09
Montreux Equity Partners IV L.P. 4.9 0.05
New Mountain Partners I, L.P. 0.9 0.01
New Mountain Partners II, L.P. 0.4 0.00
New Mountain Partners III, L.P. 9.6 0.09
New York Fairview Emerging Mgrs Fund (A) 4.8 0.05
NGN BioMed Opportunity II, L.P. 2.6 0.02
NorthBound Emerging Manager Custom Fd LP 3.6 0.03
Olympus Capital Asia III 5.0 0.05
Olympus Growth Fund VI, L.P. 1.5 0.01
Onex Partners III LP 4.1 0.04
Paladin Homeland Security Fund L.P. 2.7 0.03
Paladin III, L.P. 6.4 0.06
Palladium Equity Partners III, L.P. 6.8 0.06
Palladium Equity Partners IV 1.7 0.02
PCG Clean Energy Tech Fund East, L.P. 5.1 0.05
Pegasus Partners IV, L.P. 5.6 0.05
Pegasus Partners V, L.P. 5.0 0.05
Permira IV 3.7 0.03
Perseus Partners VII, L.P. 1.2 0.01
Pine Brook Capital Partners 6.7 0.06
Platinum Equity Capital Partners III, LP 6.2 0.06
Prism Venture Partners V, L.P. 2.8 0.03
Psilos Group Partners III, L.P. 2.0 0.02
RiverstoneCarlyle Glbl Engy-Pwr Fd IV LP 5.5 0.05
RRE Ventures IV, L.P. 3.9 0.04
Scale Venture Partners III, LP 7.7 0.07
SCP Private Equity Partners II, L.P. 5.5 0.05
Consolidated Performance Report
Through September 30, 2014
New York City Fire Department Pension Fund, Subchapter Two 64Performance Overview as of September 30, 2014

Assets ($MM) % of Total 3 Month YTD 1 Year 3 Year 5 Year 10 Year 15 YearSCP Vitalife Partners II, L.P. 4.1 0.04
Snow Phipps Group, L.P. 3.3 0.03
Snow Phipps II, L.P. 4.7 0.04
Summit Partners Growth Equity VIII-A 16.9 0.16
Terra Firma Capital Partners III, L.P. 3.0 0.03
Trident V, L.P. 14.5 0.14
Trilantic Capital Partners III, L.P. 0.2 0.00
Trilantic Capital Partners IV L.P. 6.0 0.06
Trilantic Capital Partners V L.P. 2.7 0.03
United States Power Fund III, L.P. 3.8 0.04
US Power Fund II 4.3 0.04
Vista Equity Partners Fund III, L.P. 4.5 0.04
Vista Equity Partners Fund IV, L.P. 27.6 0.26
VISTA EQUITY V 1.0 0.01
Vista Foundation Fund II, L.P. 0.8 0.01
VS&A Communications Partners III, L.P. 0.3 0.00
VSS Communications Partners IV, L.P. 1.3 0.01
Warburg Pincus Private Equity XI, LP 18.9 0.18
Wellspring Capital Partners V, L.P. 2.4 0.02
Welsh, Carson, Anderson & Stowe XI, L.P. 6.9 0.06
Yucaipa American Alliance Fund I, L.P. 4.1 0.04
Yucaipa American Alliance Fund II, LP 21.5 0.20
Yucaipa Corporate Initiatives Fund II LP 2.9 0.03
TOTAL PRIVATE EQUITY 700.3 6.61
REAL ASSETS
PRIVATE REAL ESTATEAG Realty Fund VII (Global) 6.1 0.06
Consolidated Performance Report
Through September 30, 2014
New York City Fire Department Pension Fund, Subchapter Two 65Performance Overview as of September 30, 2014

Assets ($MM) % of Total 3 Month YTD 1 Year 3 Year 5 Year 10 Year 15 YearAmer Value Ptnrs I LP 2.3 0.02
Ares European RE Fund III 9.7 0.09
ARA Asia Dragon Fd (Global) 4.7 0.04
Blackrock Carbon III 1.1 0.01
Blackstone Europe IV 7.8 0.07
Blackstone REP EUR III 5.1 0.05
Blackstone REP IV 2.9 0.03
Blackstone REP VI 12.6 0.12
Blackstone REP VII 28.1 0.27
Brookfield Strat RE Partners 9.0 0.09
Canyon-Jonhson Urban Fund II 3.1 0.03
Canyon-Jonhson Urban Fund III 3.0 0.03
Carlyle Realty V 1.7 0.02
Carlyle Realty VI 13.6 0.13
City Investment Fund cl 14.5 0.14
Colony Investors VIII 6.9 0.07
Colony Realty Partners II 2.0 0.02
DIVCO WEST FD III 30.2 0.28
DIVCO WEST FD IV 10.0 0.09
EMMES Sep Acct 1.9 0.02
H/2 Special Opportunities Fund II 10.4 0.10
Heitman America RE Trust 13.1 0.12
HUDSON SEP AC 0.9 0.01
JPMC Strategic Property Fund 34.2 0.32
JPMC Special Situations Fund 5.1 0.05
KTR Industrial Fd III 3.9 0.04
LaSalle US Property Fund 30.8 0.29
LONE STAR RE FD III 6.1 0.06
METLIFE CORE PROPERTY 2.9 0.03
Consolidated Performance Report
Through September 30, 2014
New York City Fire Department Pension Fund, Subchapter Two 66Performance Overview as of September 30, 2014
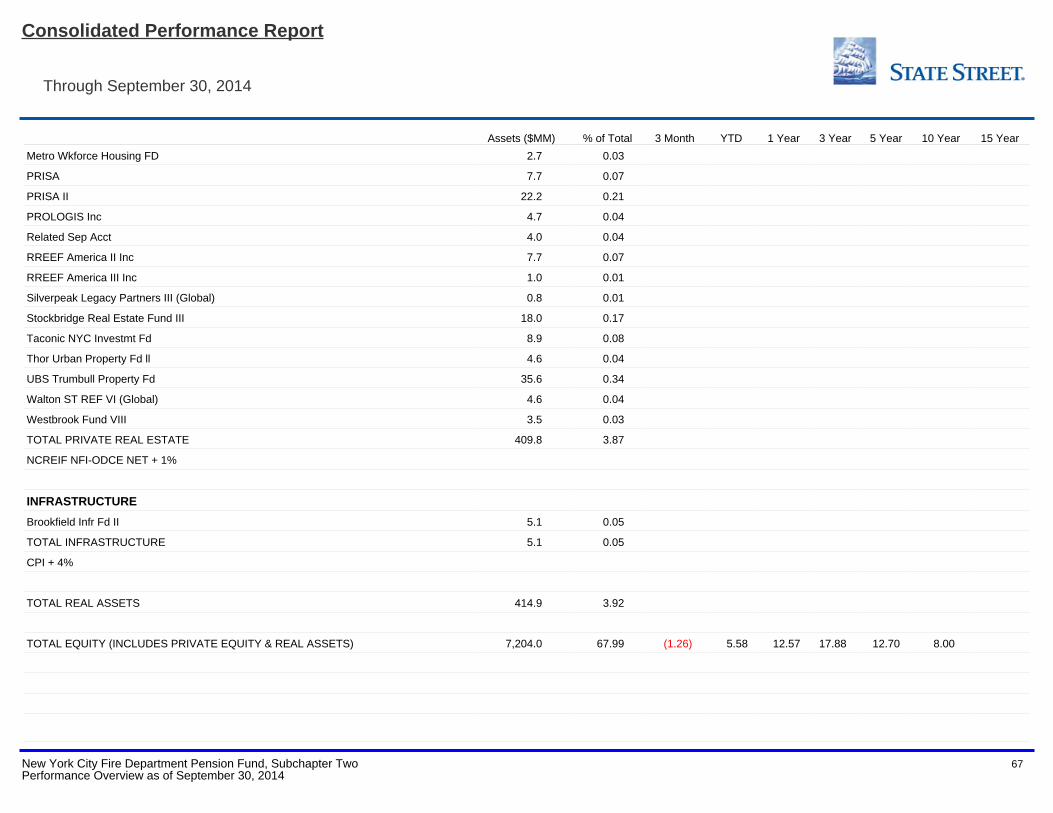
Assets ($MM) % of Total 3 Month YTD 1 Year 3 Year 5 Year 10 Year 15 YearMetro Wkforce Housing FD 2.7 0.03
PRISA 7.7 0.07
PRISA II 22.2 0.21
PROLOGIS Inc 4.7 0.04
Related Sep Acct 4.0 0.04
RREEF America II Inc 7.7 0.07
RREEF America III Inc 1.0 0.01
Silverpeak Legacy Partners III (Global) 0.8 0.01
Stockbridge Real Estate Fund III 18.0 0.17
Taconic NYC Investmt Fd 8.9 0.08
Thor Urban Property Fd ll 4.6 0.04
UBS Trumbull Property Fd 35.6 0.34
Walton ST REF VI (Global) 4.6 0.04
Westbrook Fund VIII 3.5 0.03
TOTAL PRIVATE REAL ESTATE 409.8 3.87
NCREIF NFI-ODCE NET + 1%
INFRASTRUCTUREBrookfield Infr Fd II 5.1 0.05
TOTAL INFRASTRUCTURE 5.1 0.05
CPI + 4%
TOTAL REAL ASSETS 414.9 3.92
TOTAL EQUITY (INCLUDES PRIVATE EQUITY & REAL ASSETS) 7,204.0 67.99 (1.26) 5.58 12.57 17.88 12.70 8.00
Consolidated Performance Report
Through September 30, 2014
New York City Fire Department Pension Fund, Subchapter Two 67Performance Overview as of September 30, 2014
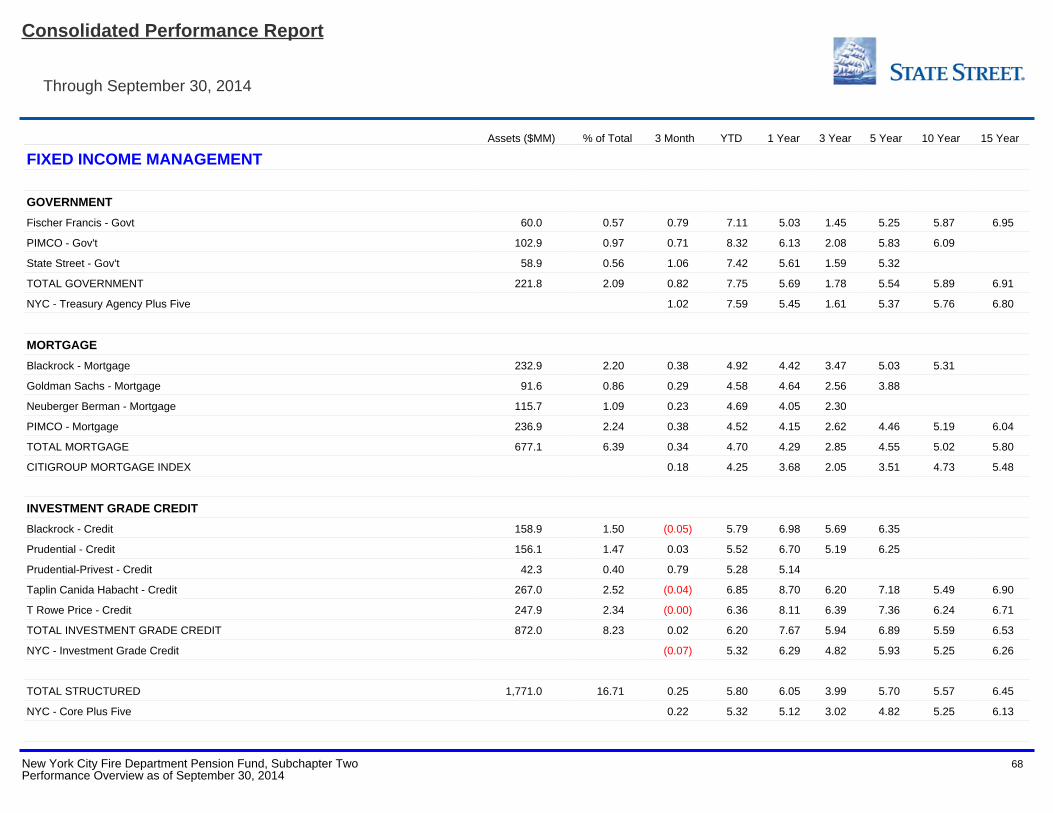
Assets ($MM) % of Total 3 Month YTD 1 Year 3 Year 5 Year 10 Year 15 Year
FIXED INCOME MANAGEMENT
GOVERNMENTFischer Francis - Govt 60.0 0.57 0.79 7.11 5.03 1.45 5.25 5.87 6.95
PIMCO - Gov't 102.9 0.97 0.71 8.32 6.13 2.08 5.83 6.09
State Street - Gov't 58.9 0.56 1.06 7.42 5.61 1.59 5.32
TOTAL GOVERNMENT 221.8 2.09 0.82 7.75 5.69 1.78 5.54 5.89 6.91
NYC - Treasury Agency Plus Five 1.02 7.59 5.45 1.61 5.37 5.76 6.80
MORTGAGEBlackrock - Mortgage 232.9 2.20 0.38 4.92 4.42 3.47 5.03 5.31
Goldman Sachs - Mortgage 91.6 0.86 0.29 4.58 4.64 2.56 3.88
Neuberger Berman - Mortgage 115.7 1.09 0.23 4.69 4.05 2.30
PIMCO - Mortgage 236.9 2.24 0.38 4.52 4.15 2.62 4.46 5.19 6.04
TOTAL MORTGAGE 677.1 6.39 0.34 4.70 4.29 2.85 4.55 5.02 5.80
CITIGROUP MORTGAGE INDEX 0.18 4.25 3.68 2.05 3.51 4.73 5.48
INVESTMENT GRADE CREDITBlackrock - Credit 158.9 1.50 (0.05) 5.79 6.98 5.69 6.35
Prudential - Credit 156.1 1.47 0.03 5.52 6.70 5.19 6.25
Prudential-Privest - Credit 42.3 0.40 0.79 5.28 5.14
Taplin Canida Habacht - Credit 267.0 2.52 (0.04) 6.85 8.70 6.20 7.18 5.49 6.90
T Rowe Price - Credit 247.9 2.34 (0.00) 6.36 8.11 6.39 7.36 6.24 6.71
TOTAL INVESTMENT GRADE CREDIT 872.0 8.23 0.02 6.20 7.67 5.94 6.89 5.59 6.53
NYC - Investment Grade Credit (0.07) 5.32 6.29 4.82 5.93 5.25 6.26
TOTAL STRUCTURED 1,771.0 16.71 0.25 5.80 6.05 3.99 5.70 5.57 6.45
NYC - Core Plus Five 0.22 5.32 5.12 3.02 4.82 5.25 6.13
Consolidated Performance Report
Through September 30, 2014
New York City Fire Department Pension Fund, Subchapter Two 68Performance Overview as of September 30, 2014

Assets ($MM) % of Total 3 Month YTD 1 Year 3 Year 5 Year 10 Year 15 Year
CORE PLUS FIXED INCOMELM Capital 11.0 0.10 (0.17) 3.95 4.13 3.61 5.12
TOTAL CORE PLUS FIX INC 11.0 0.10 (0.17) 3.95 4.13 3.61 5.12
Barclays Aggregate 0.17 4.10 3.96 2.43 4.12 4.62 5.57
TOTAL STRUCTURED PLUS LM CAPITAL 1,782.0 16.82 0.24 5.78 6.03 3.99 5.69 5.57 6.45
NYC - Core Plus Five 0.22 5.32 5.12 3.02 4.82 5.25 6.13
PROGRESS MANAGERSGIA 5.7 0.05 (0.24) 4.77 5.95
Hillswick 2.7 0.03 0.62 5.05 4.27
NEW CENTURY 7.0 0.07 0.65 5.51 5.80
PUGH CAP 5.5 0.05 0.01 4.46 4.69
Ramirez Asset 6.8 0.06
TOTAL PROGRESS FIXED 27.7 0.26 0.10 4.77 4.98
Barclays Aggregate 0.17 4.10 3.96 2.43 4.12 4.62 5.57
TIPS MANAGERS
ACTIVE TIPS MANAGERSBlackrock TIPS 112.9 1.07 (1.86) 3.84 1.90 1.35 4.61
PIMCO TIPS 111.7 1.05 (2.11) 3.60 1.50 1.71 4.67
TOTAL ACTIVE TIPS MANAGERS 224.7 2.12 (1.98) 3.72 1.70 1.53 4.64
PASSIVE TIPS MANAGERSState Street TIPS Passive 74.6 0.70 (2.06) 3.70 1.76 1.34 4.55
TOTAL PASSIVE TIPS MANAGERS 74.6 0.70 (2.06) 3.70 1.76 1.34 4.55
Consolidated Performance Report
Through September 30, 2014
New York City Fire Department Pension Fund, Subchapter Two 69Performance Overview as of September 30, 2014

Assets ($MM) % of Total 3 Month YTD 1 Year 3 Year 5 Year 10 Year 15 YearTOTAL TIPS MANAGERS 299.2 2.82 (2.00) 3.71 1.72 1.48 4.62
Barclays US TIPS Index (2.04) 3.67 1.59 1.34 4.48 4.64 6.49
ENHANCED YIELDLoomis Sayles 111.6 1.05 (1.69) 5.03 9.16
BofAML HIGH YIELD MASTER II (1.92) 3.61 7.23 10.95 10.40 8.20 7.47
Penn Capital Mgt 112.7 1.06 (2.14) 2.60 6.38
T ROWE EH 178.7 (1.86) 3.42 6.87 10.17 9.67 7.89
TOTAL ENHANCED YIELD 403.0 3.80 (1.89) 3.63 7.40 10.03 9.80 7.80 7.41
CITIGROUP BB & B (1.60) 3.62 7.12 10.12 9.75 6.83 6.63
CITIGROUP BB & B CAPPED (1.56) 3.64 7.14 10.01 9.62 7.05
BANK LOANSBabson BL 87.8 0.83 (0.03) 2.49 4.88
Guggenheim BL 88.3 0.83 0.17 2.70 5.30
TOTAL BANK LOANS 176.0 1.66 0.07 2.60 5.09
CSFB LEVERAGED LOAN INDEX (0.33) 2.43 4.30 6.92 6.67 4.90
CONVERTIBLE BONDSAdvent Conv Bonds 52.1 0.49 (2.60) 3.51 6.87 11.04 9.05
BofA ML U.S. Convertible (1.52) 4.36 6.84 9.39 8.42 5.29 5.07
TOTAL CONVERTIBLE BONDS 52.1 0.49 (2.60) 3.51 6.87 11.28 9.17
Fire Custom Convertible Bond Index (1.52) 4.36 6.84 9.39 8.42
BofAML ALL CONVERTIBLE Ex MANDATORY (1.61) 7.94 14.47 17.18 12.90 7.86 7.16
OPPORTUNISTIC FIXEDAvenue Europe Special Sit. Fund L.P. 0.2 0.00
Consolidated Performance Report
Through September 30, 2014
New York City Fire Department Pension Fund, Subchapter Two 70Performance Overview as of September 30, 2014

Assets ($MM) % of Total 3 Month YTD 1 Year 3 Year 5 Year 10 Year 15 YearAvenue Special Situations Fund VI L.P. 14.3 0.14
Fortress Ctr St Ptnrs 17.8 0.17
Oaktree Opp Fd IX 24.0 0.23
Torchlight Debt Oppy Fund III LLC 2.7 0.03
TOTAL FUND STRATEGIES 59.2 0.56
10% Annual Return
JP Morgan Global High Yield + 3%
Angelo Gordon Ct St Ptnrs 28.1 0.27 1.59 9.52 14.47
Apollo Centre Street Partnership, L.P 30.9 0.29 2.43 10.23 14.56
Contrarian Partnership, L.P 8.0 0.08 0.14 7.05 10.24
Golden Tree OD 36.6 0.35 0.47 6.49 9.05
MARATHON-OD-FI 50.8 0.48 2.95 9.60 13.97
Oak Hill Ctr St Ptnrs 31.1 0.29 2.43 6.99 11.57
TOTAL STRATEGIC MANDATES 185.6 1.75 1.96 8.44 12.54
10% Annual Return 2.41 7.41 10.00 10.00 10.00 10.00 10.00
JP Morgan Global High Yield + 3% (1.14) 6.12 10.98 14.45 13.96
TOTAL OPPORTUNISTIC FIXED 244.7 2.31 3.38 9.81 13.60 11.28 15.90
10% Annual Return 2.41 7.41 10.00 10.00 10.00 10.00 10.00
JP Morgan Global High Yield + 3% (1.14) 6.12 10.98 14.45 13.96
ETIBOA-PPAR ETI (FNMA) 0.2 0.00 1.59 11.53
CCD-PPAR (GNMA) 1.0 0.01 1.33 11.30 12.49 10.95 10.08
CCD-PPAR ETI (FNMA) 0.5 0.01 1.55 11.02
CFSB-PPAR (GNMA) 0.4 0.00 1.43 11.11 11.72 8.24 8.34
CPC-PPAR (FNMA) 0.9 0.01 (0.08) 11.04 20.63
JPMC-PPAR (FNMA) 0.4 0.00 1.58 10.69 13.81
Consolidated Performance Report
Through September 30, 2014
New York City Fire Department Pension Fund, Subchapter Two 71Performance Overview as of September 30, 2014

Assets ($MM) % of Total 3 Month YTD 1 Year 3 Year 5 Year 10 Year 15 YearLIIF-PPAR (GNMA) 0.5 0.00 0.62 7.55 8.54 7.68 6.70
LIIF-PPAR ETI (FNMA) 0.5 0.00 8.05 36.38
NCBCI-PPAR (GNMA) 0.3 0.00 1.58 11.72 15.69 11.98 9.46
NCB-CI PPAR ETI (FNMA) 0.0 0.00 1.28 10.83
TOTAL FIRE PPAR 4.8 0.05 1.58 11.71 14.37 10.50 9.08
GNMA Plus 65bps 0.30 4.79 4.39 2.49 4.47 5.44 6.16
FNMA Plus 85bps 0.37 4.86 4.42 2.97 4.33 5.61 6.38
Access RBC 19.9 0.19 0.39 4.84 3.91 2.75 3.89
Access RBC Benchmark 0.13 3.46 2.89 1.69 3.22
CPC CONST FACILITY 1.0 0.01
CPC CONST BENCHMARK
AFL-CIO Hsg Inv Trust 41.6 0.39 0.11 4.31 4.41 2.53 4.00 4.62
Barclays Aggregate 0.17 4.10 3.96 2.43 4.12 4.62 5.57
TOTAL ETI (W/O CASH) 67.3 0.64 0.27 4.82 4.92 2.90 4.09 4.76 5.65
Fire Custom Benchmark 0.18 3.95 3.73 2.31 3.85 4.49 5.37
FIRE SHORT TERM 328.6 3.10 0.02 0.09 0.13 0.26 0.37 2.11 2.64
TOTAL FIXED INCOME (DOMESTIC & GLOBAL) 3,380.7 31.91 (0.09) 5.14 6.07 5.01 6.28 5.80 6.46
C/D - Fail Float Earnings 0.7 0.01
Security Lending 10.5 0.10
TOTAL FIRE 10,595.9 100.00 (0.90) 5.43 10.60 13.49 10.65 7.51 5.98
Fire Policy Benchmark (0.46) 6.18 11.00 13.77 11.18 8.00 6.18
Consolidated Performance Report
Through September 30, 2014
New York City Fire Department Pension Fund, Subchapter Two 72Performance Overview as of September 30, 2014

INVESTMENT STYLE (EQUITIES) MARKET VALUE 06-30-2013 ($MM)
BASIS POINTS
MARKET VALUE 09-30-2013 ($MM)
BASIS POINTS
US Equities 3,488 12.20 3,628 14.60
Small Cap Active 131 57.83 147 67.39Small Cap Growth 28 89.13 33 100.00
Small Cap Value 103 49.44 114 57.85Small Cap core - - - -
Small Cap Fundamental Index - - - -
Small/Mid Cap Active 66 51.85 71 58.52Small/Mid Cap Growth - - - -
Small/Mid Cap Value 66 51.85 71 58.52
Mid Cap Active 289 51.04 311 58.36Mid Cap Growth 135 56.45 143 64.01
Mid Cap Value 75 47.55 81 57.30Mid Cap core 79 45.12 86 50.00
Large Cap Active 324 20.90 283 27.71Large Cap Growth 197 22.64 236 26.10
Large Cap Value 82 10.98 - -Large Cap Core 45 31.51 47 35.69
Large Cap Fundamental Index - - - -
Active Emerging Managers (U.S. Equities) 133 66.67 147 78.11
Total US Active Equities 943 43.91 959 53.75
Total US Passive Equities 2,545 0.45 2,669 0.53
Opportunistic US Equity Strategies - - - -
International Equities 1,608 24.05 1,553 33.66
Active EAFE Equities 1,006 19.88 859 33.41Growth 421 11.12 301 28.01
Value 282 17.54 313 26.98Core 246 40.64 116 45.91
Small Cap 57 6.72 129 50.40
Opportunistic-Non US Equity Strategies 21 56.69 - -
Active Emerging Markets 339 47.62 437 50.93
Total Int'l Active Equities 1,367 27.34 1,296 39.32
Total Int’l Passive Equities 242 5.42 258 5.21
REITS Passive Index 325 39.88 322 39.75
NEW YORK CITY FIRE RETIREMENT SYSTEMSACTUAL FEES FOR FISCAL YEAR ENDING JUNE 30, 2013 AND
ESTIMATED FEES FOR FY 2014 UPDATED THROUGH SEPTEMBER 2013
Actual2013
Estimates2014
Actual and Estimated Fees
New York City Fire Department Pension Fund, Subchapter Two 73Performance Overview as of September 30, 2014

INVESTMENT STYLE (FIXED INCOME) MARKET VALUE 06-30-2013 ($MM)
BASIS POINTS
MARKET VALUE 09-30-2013 ($MM)
BASIS POINTS
Fixed Income 2,718 18.75 2,716 18.54 Structured Program 1,573 8.82 1,584 8.38
Government Sector 211 8.60 210 8.75 Mortgage Sector 644 9.81 650 7.19
Investment Grade Credit Sector 717 8.72 724 9.35
Global Fixed Income 10 22.64 11 16.15
Progress Fixed Emerging Managers 26 35.28 26 37.50
TIPS 232 7.14 234 6.32 Active TIPS 175 9.35 176 8.25
Passive TIPS 58 0.48 58 0.50
Opportunistic Fixed Income 167 65.06 186 90.85
Enhanced Yield 291 50.42 227 34.05
Bank Loans 136 29.17 138 38.32
Convertible Bonds 82 35.01 49 51.50
ETI - Access - RBC 8 27.49 11 26.79
ETI - AFL-CIO HIT 40 42.67 40 44.00
Other ETI Programs 4 - 4 -
In-House Short Term 148 0.00 206 0.00
Total Public Markets 8,139 17.90 8,218 20.49
INVESTMENT STYLE (PRIVATE)
Hedge Funds 239 173.58 249 206.24
Private Equity Investments * 522 171.82 566 198.02
Real Assets 333 114.24 361 111.47 Private Real Estate 333 114.24 360 106.92
Infrastructure** - - 1 91.97
Total Private Markets 1,093 154.68 1,176 173.21
Total Overall 9,233 34.10 9,394 39.61
* Private Equity Investments exclude GP CARRY** Included investment held for less than a full year; Basis Points shown represent average for the period.
Actual2013
Estimates2014
NEW YORK CITY FIRE RETIREMENT SYSTEMSACTUAL FEES FOR FISCAL YEAR ENDING JUNE 30, 2013 AND
ESTIMATED FEES FOR FY 2014 UPDATED THROUGH SEPTEMBER 2013
Actual and Estimated Fees
New York City Fire Department Pension Fund, Subchapter Two 74Performance Overview as of September 30, 2014

NYC FIRE DEPARTMENT PENSION FUND SECURITIES LENDING INCOME September 30, 2014 U.S. U.S. INTERNATIONAL FIXED INCOME EQUITY EQUITY 1989* $109,000 -- -- 1990 104,000 -- -- 1991 157,000 -- -- 1992 429,000 $47,000 $48,000 1993 762,000 146,000 102,000 1994 693,000 267,000 102,000 1995 495,000 306,000 96,000 1996 455,000 228,000 179,000 1997 473,000 512,000 257,000 1998 789,000 552,000 356,000 1999 716,000 690,000 408,000 2000 734,000 897,000 408,000 2001 1,176,000 1,286,000 561,000 2002 671,000 1,162,000 506,000 2003 349,000 644,000 452,000 2004 505,000 670,000 462,000 2005 740,000 1,070,000 574,000 2006 599,000 1,753,000 713,000 2007 1,437,000 3,180,000 786,000 2008 4,172,000 6,798,000 1,236,000 2009 1,606,000 3,588,000 817,000 2010 760,000 2,047,000 563,000 2011 977,000 2,674,000 927,000 2012 1,229,000 3,324,000 832,000 2013 893,000 3,467,000 704,000 2014 (9 Months) 597,000 1,511,000 1,173,000 Since Inception $21,627,000 $36,819,000 $12,262,000 *Inception 4/89
Securities Lending Income
New York City Fire Department Pension Fund, Subchapter Two 75Performance Overview as of September 30, 2014

• The Barclays Capital Aggregate (then known as the Lehman Brothers Aggregate) was used prior to 1/1/89. Effective 1/1/89, in the Government Sector, maturities of less than 5 years were dropped from the Salomon and Lehman indices. From that date until 7/1/99 the benchmark was the NYC Core + 5, from Lehman.
• Effective 7/1/94, the NYC Core + 5 Index includes BBB rated securities.
• Effective 7/1/99, the basis of the NYC Index was changed from Lehman Brothers to Salomon. Also effective 7/1/99, only Salomon indices have been used to compare all fixed income managers.
• Effective 4/1/03, the name of the benchmark provider was changed from Salomon to Citigroup.
• Effective 7/1/09, the Core+5 program was restructured.
• The U.S. Gov’t sector benchmark Index was changed from the Citigroup Core+5 Treasury/Gov’t Sponsored Index to the Citigroup Core+5 Treasury/Agency Index.
• The Corporate and Yankee sectors were combined to form the new Investment Grade Credit sector. The benchmark for the new combined sector is the customized Citigroup Credit Index. For historical performance purposes, the old Corporate sector Index is linked to the new Credit sector Index.
• There were no changes to the Mortgage sector Index.
• The total Core+5 results and benchmark returns combine the three sectors. Historical total Core+5 returns continue to include the old Corporate and Yankee sector returns.
Footnotes
Through September 30, 2014
New York City Fire Department Pension Fund, Subchapter Two 76Performance Overview as of September 30, 2014

General Notes • All Returns are Gross of investment advisory fees unless otherwise indicated.
Page Specific Pages 9 & 10 - Portfolio Asset Allocation
• Rebalancing Ranges: the minimum and maximum weights that actual Asset Allocation may reach before rebalancing between Asset Classes is necessary.
Pages 11 - 13 - Performance Attribution: Total Plan
• Plan Return at Policy Weights: the return of the Total Plan assuming actual Asset Class results were maintained at target (Adjusted Policy) weights. Figure = (Return of Asset Class 1* Target Weight) plus (Return Of Asset Class 2* Target Weight) plus (……)
• Allocation Effect = Total Plan Return minus Plan Return At Adjusted Policy Weights. Allocation is the Contribution to Performance resulting from an overweight or underweight to an asset class. E.g. an underweight to an Asset Class that under-performs results in a positive Allocation Effect and vice versa.
• Selection Effect = Equal to the Custom Benchmark (Adjusted Policy Index) Return minus Plan Return at Adjusted Policy Weights. This illustrates how the Managers have added or removed value based on their Security Selection decisions, e.g., If the manager’s Actual Returns are higher than the Implied Return there will be a positive Selection Effect.
• Policy Index = Custom Benchmark
The “policy index” is a custom benchmark representing the weighted average return of the weighted benchmark indexes for each major investment program. Weights may reflect an adjustment of actual policy for outstanding commitments for new or revised programs, such as for private market programs, which are invested gradually, or for any new or updated program requiring the completion of RFPs and contracts. The policy index/custom benchmark is calculated monthly based on adjusted policy weights at the beginning of each month.
The indexes and most recent policy weights are as follows:
U.S. Equity: Russell 3000 * 30.81%
International Developed (EAFE) Markets: MSCI EAFE * 10.15%
Glossary of Terms
Through September 30, 2014
New York City Fire Department Pension Fund, Subchapter Two 77Performance Overview as of September 30, 201412/03/2014 01:45:51 PM

Emerging Markets: MSCI Emerging Markets * 6.50%
REITs: Dow Jones Real Estate Securities * 3.00%
Private Equity: Russell 3000 + 300 b.p. per annum * 6.41%
Private Real Estate: NFI - ODCE Net+100BPS * 3.77%
Infrastructure: CPI + 4% * 0.04%
Hedge Funds: 1yr T- Bill yield + 4% * 3.46%
Domestic Fixed Income: NYC Core +5 * 22.24%
TIPS: Lehman U.S. TIPS * 5.00%
Enhanced Yield: Citigroup BB&B * 3.76%
Bank Loans: Credit Suisse Leveraged Loan * 1.62%
Convertible Bonds: BofAML All Convertibles Ex Mandatory * 1.00%
Opportunistic Fixed: 10% Annualized Return * 2.25%
Page 14 – Allocation and Selection Effects - Asset Class Breakdown • This chart aims to break down the Allocation and Selection Effects shown on the Performance Attribution pages. The aim of the Page is
to show the asset classes where Managers are either out performing or under performing their benchmark and to show the basis point effect that this is having on Plan performance.
Page 51 – ETI Returns vs Custom Index
• Targeted has implemented a Custom Benchmark to better track the performance of the individual Targeted programs relative to their respective benchmarks. The Custom Benchmark represents the weighted average return of the individual benchmark indexes for each program, updated monthly. The indexes are as follows:
• AFL-CIO Housing Inv Trust: Barclays Capital U.S. Aggregate Bond Index • CPC Const Benchmark: 30 Day Libor + 275 bps per annum • GNMA: Citigroup 15 yr. GNMA
Glossary of Terms
Through September 30, 2014
New York City Fire Department Pension Fund, Subchapter Two 78Performance Overview as of September 30, 201412/03/2014 01:45:51 PM

• PPAR: Citigroup GNMA + 65 bps per annum • Access/RBC: 60% Merrill Lynch 30 yr Mortgage Index and 40% Merrill Lynch US Treasury 1-10 yr Index
Glossary of Terms
Through September 30, 2014
New York City Fire Department Pension Fund, Subchapter Two 79Performance Overview as of September 30, 201412/03/2014 01:45:51 PM