new york city coastal storm hazard analysis
TRANSCRIPT
7/31/2019 New York City Coastal Storm Hazard Analysis
http://slidepdf.com/reader/full/new-york-city-coastal-storm-hazard-analysis 1/16
New York City Natural Hazard Mitigation Plan March 2009
Section III: Natural Hazard Risk Assessment Page 80 of 179
7) Coastal Storms: Multi-Hazard Analysis for New York City
a) Hazard Profile
i) Hazard Description
Coastal storms, including nor'easters, tropical storms, and hurricanes, can and do affectNew York City. New York’s densely populated and highly developed coastline makesthe City among the most vulnerable to hurricane-related damage.
Tropical Storms and Hurricanes
A hurricane is a type of tropical cyclone, which is a generic term for a low-pressuresystem that generally forms in the tropics. Thunderstorms and, in the NorthernHemisphere, a counterclockwise circulation of winds near the earth’s surface accompanythe cyclone. Tropical cyclones are classified as follows:
• A tropical depression is an organized system of clouds and thunderstorms, with a
defined surface circulation, and maximum sustained winds of 38 miles per hour orless.
• A tropical storm is an organized system of strong thunderstorms, with a definedsurface circulation, and maximum sustained winds of 39 to 73 miles per hour.
• A hurricane is an intense tropical weather system of strong thunderstorms, with awell-defined surface circulation, and maximum sustained winds of 74 miles perhour or higher.
Atlantic hurricanes form off the coast of Africa or in the southern Atlantic Ocean,Caribbean Sea, or Gulf of Mexico. Hurricanes require warm tropical oceans, moisture,and light winds above them to form. A hurricane can produce violent winds, tornadoes
(primarily on the leading and trailing edges of the hurricane), powerful waves and stormsurge, and torrential rains and floods.
Atlantic hurricane season lasts from June to November, averaging 11 tropical storms eachyear, six of which turn into hurricanes. New York City is at highest risk between Augustand October because water temperatures in the Northern Atlantic are most likely to reacha temperature warm enough to develop and sustain a hurricane. According to the NationalHurricane Center, the Atlantic hurricane season is currently in a period of heightenedactivity that started around 1995 and could last at least another decade.
Heavy rain, coastal flooding, and powerful winds are commonly associated with
hurricanes. Storm surge is often the greatest hurricane-related hazard.
1
Storm surge iswater that is pushed toward the shore by the force of the winds swirling around the storm.This advancing surge combines with the normal tides to create the hurricane storm tide,which can increase the mean water level 15 feet or more. In addition, wind driven wavesare superimposed on the storm tide. This rise in water level can cause severe inundationin coastal areas, particularly when the storm tide coincides with the normal high tides.
1 Storm surge is measured as the difference between tide levels and observed storm water levels.
7/31/2019 New York City Coastal Storm Hazard Analysis
http://slidepdf.com/reader/full/new-york-city-coastal-storm-hazard-analysis 2/16
New York City Natural Hazard Mitigation Plan March 2009
Section III: Natural Hazard Risk Assessment Page 81 of 179
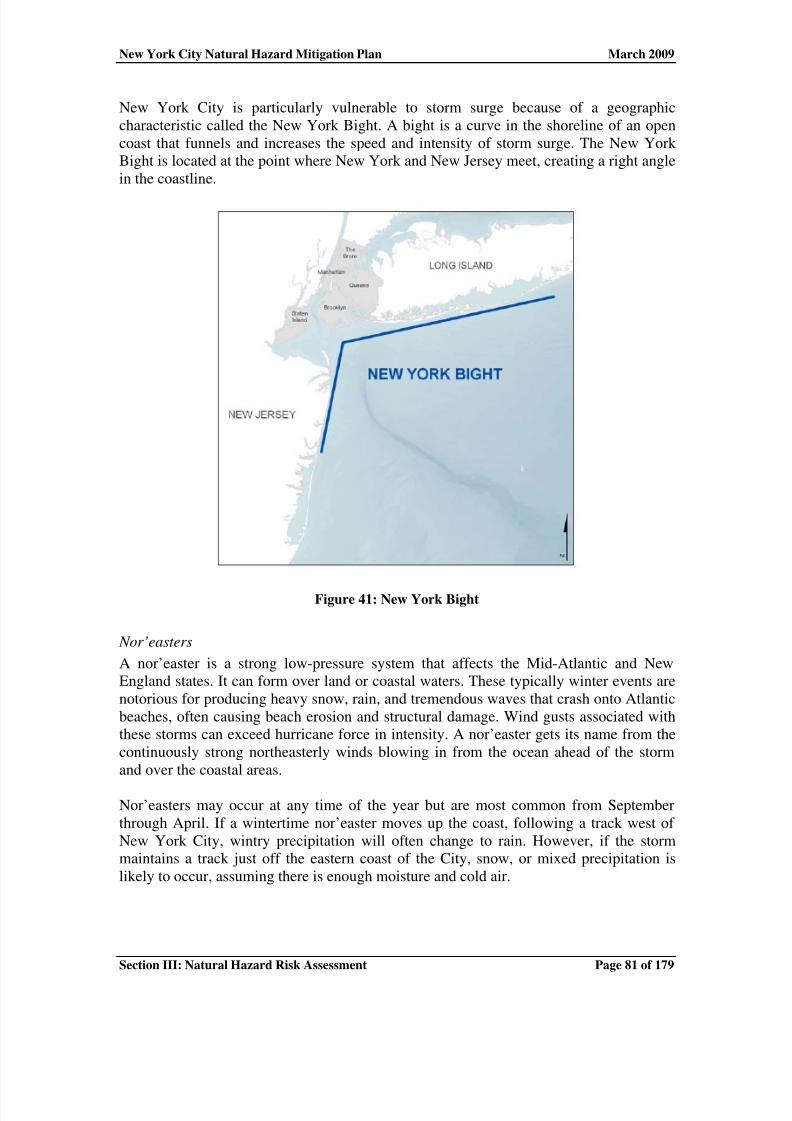
New York City is particularly vulnerable to storm surge because of a geographiccharacteristic called the New York Bight. A bight is a curve in the shoreline of an opencoast that funnels and increases the speed and intensity of storm surge. The New York Bight is located at the point where New York and New Jersey meet, creating a right anglein the coastline.
Figure 41: New York Bight
Nor’easters
A nor’easter is a strong low-pressure system that affects the Mid-Atlantic and NewEngland states. It can form over land or coastal waters. These typically winter events arenotorious for producing heavy snow, rain, and tremendous waves that crash onto Atlanticbeaches, often causing beach erosion and structural damage. Wind gusts associated withthese storms can exceed hurricane force in intensity. A nor’easter gets its name from thecontinuously strong northeasterly winds blowing in from the ocean ahead of the stormand over the coastal areas.
Nor’easters may occur at any time of the year but are most common from Septemberthrough April. If a wintertime nor’easter moves up the coast, following a track west of New York City, wintry precipitation will often change to rain. However, if the stormmaintains a track just off the eastern coast of the City, snow, or mixed precipitation islikely to occur, assuming there is enough moisture and cold air.
7/31/2019 New York City Coastal Storm Hazard Analysis
http://slidepdf.com/reader/full/new-york-city-coastal-storm-hazard-analysis 3/16
New York City Natural Hazard Mitigation Plan March 2009
Section III: Natural Hazard Risk Assessment Page 82 of 179
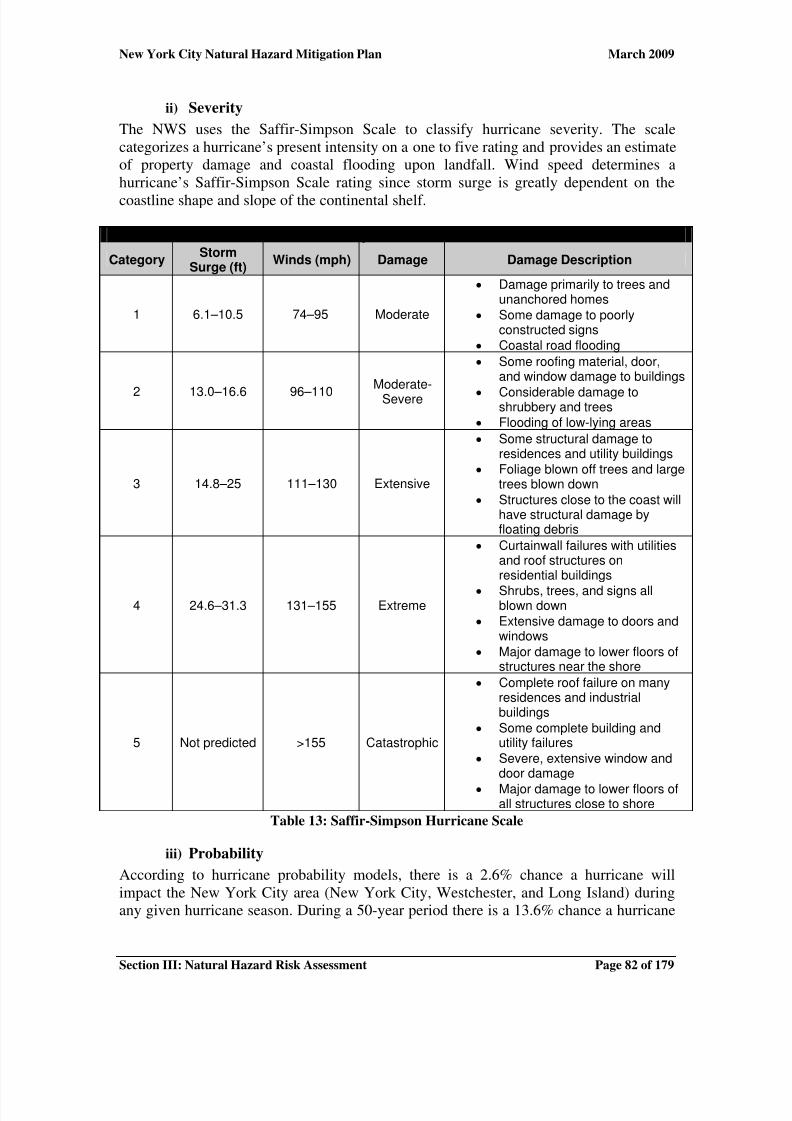
ii) Severity
The NWS uses the Saffir-Simpson Scale to classify hurricane severity. The scalecategorizes a hurricane’s present intensity on a one to five rating and provides an estimateof property damage and coastal flooding upon landfall. Wind speed determines ahurricane’s Saffir-Simpson Scale rating since storm surge is greatly dependent on the
coastline shape and slope of the continental shelf.
Saffir-Simpson Hurricane Scale
CategoryStorm
Surge (ft)Winds (mph) Damage Damage Description
1 6.1–10.5 74–95 Moderate
• Damage primarily to trees andunanchored homes
• Some damage to poorlyconstructed signs
• Coastal road flooding
2 13.0–16.6 96–110Moderate-
Severe
• Some roofing material, door,and window damage to buildings
• Considerable damage toshrubbery and trees
• Flooding of low-lying areas
3 14.8–25 111–130 Extensive
• Some structural damage toresidences and utility buildings
• Foliage blown off trees and largetrees blown down
• Structures close to the coast willhave structural damage byfloating debris
4 24.6–31.3 131–155 Extreme
• Curtainwall failures with utilitiesand roof structures onresidential buildings
• Shrubs, trees, and signs allblown down
• Extensive damage to doors andwindows
• Major damage to lower floors ofstructures near the shore
5 Not predicted >155 Catastrophic
• Complete roof failure on manyresidences and industrialbuildings
• Some complete building andutility failures
• Severe, extensive window anddoor damage
• Major damage to lower floors ofall structures close to shore
Table 13: Saffir-Simpson Hurricane Scale
iii) Probability
According to hurricane probability models, there is a 2.6% chance a hurricane willimpact the New York City area (New York City, Westchester, and Long Island) duringany given hurricane season. During a 50-year period there is a 13.6% chance a hurricane
7/31/2019 New York City Coastal Storm Hazard Analysis
http://slidepdf.com/reader/full/new-york-city-coastal-storm-hazard-analysis 4/16
New York City Natural Hazard Mitigation Plan March 2009
Section III: Natural Hazard Risk Assessment Page 83 of 179
will impact the New York City area and a 3.3% chance an intense hurricane (Category 3or higher) will affect the City.
iv) Location
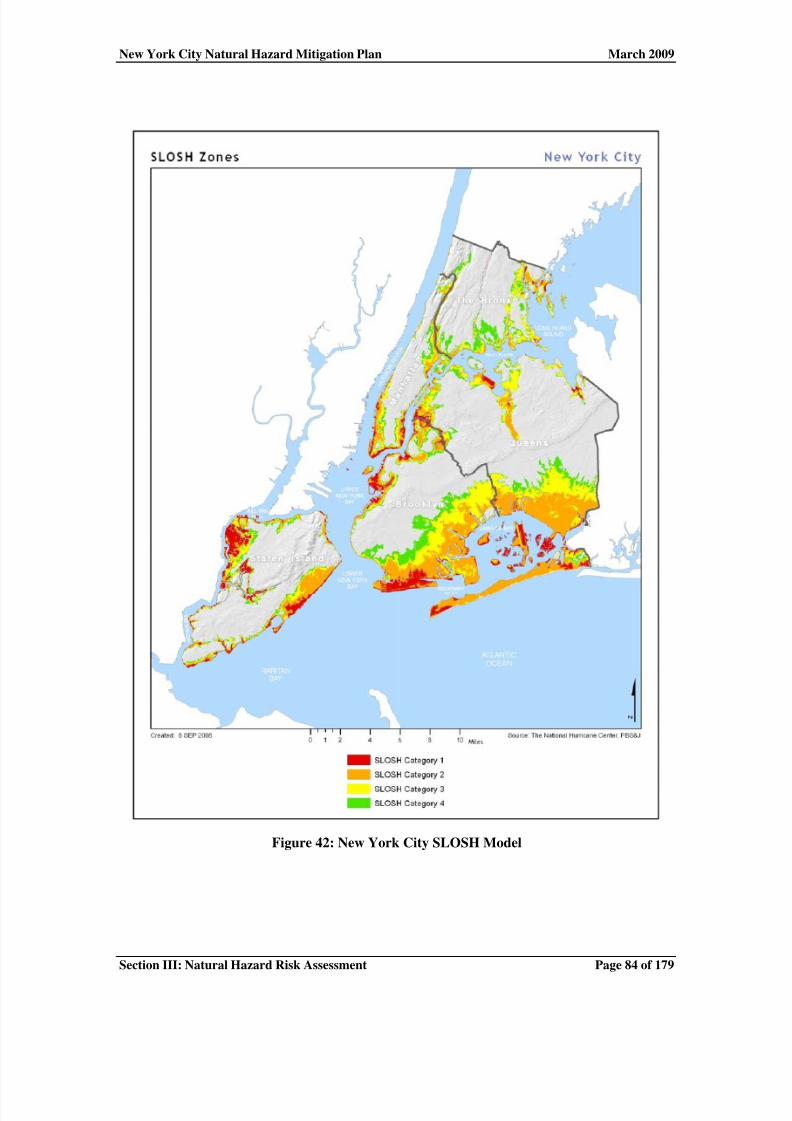
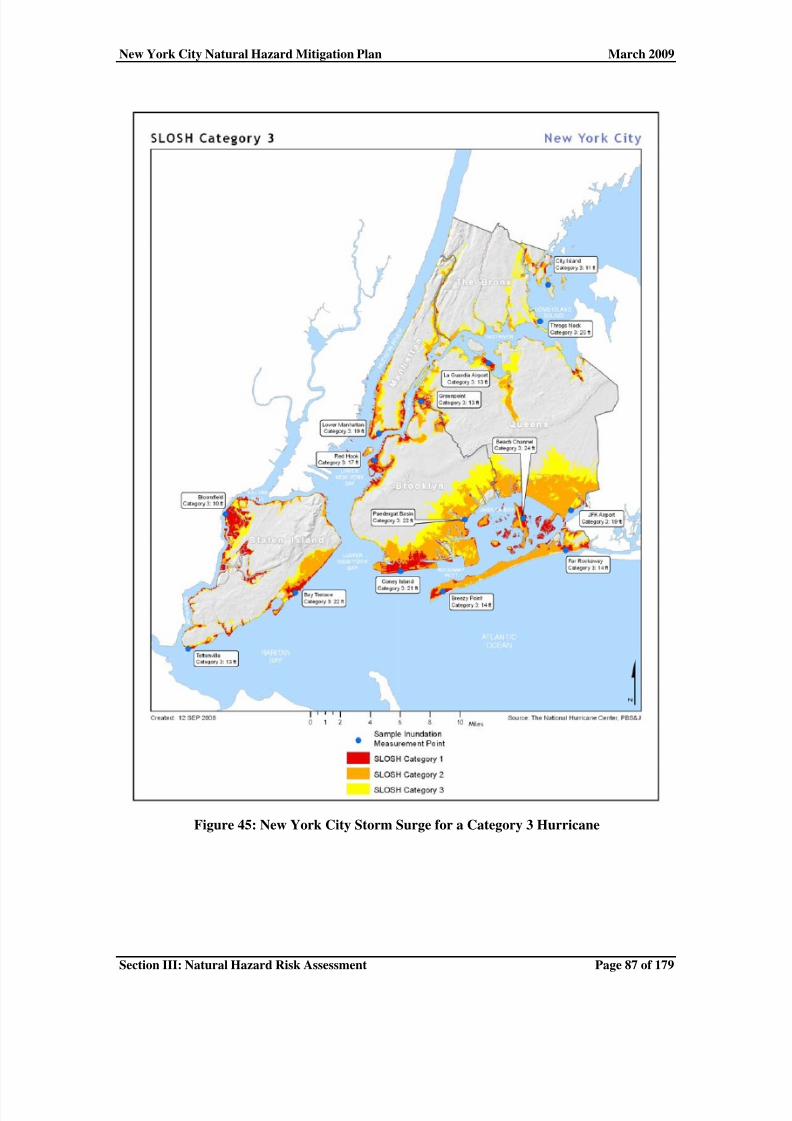
OEM uses a computer model called SLOSH (Sea, Lake, and Overland Surges from
Hurricanes) to predict the effects of storm surge and help guide the City’s planningefforts for coastal storms. The SLOSH model calculates surge based on storms moving indifferent directions and with varying strengths. The SLOSH model analyzes stormsmoving northeast, northwest (the direction that will have the greatest impact), andvarying in strength from Category 1 to Category 4.
The SLOSH calculations are based on the storm surge above the mean tide and thestrongest potential winds for each category storm. The error is +/- three feet.Additionally, the SLOSH model calculates inundation levels for each location as if thehurricane hit that particular location head-on. The culmination of these factors results in a“worst-case” scenario for storm surge in the SLOSH model.
The SLOSH2 map in Figure 42 shows the areas of the City that would experienceinundation from storm surge based on hurricane category. The following four mapsdisplay the estimated storm surge levels for different neighborhoods throughout NewYork City. These maps provide a visual representation of New York City’s physicalvulnerability. A Category 2 storm would completely inundate the Rockaway Peninsulaand a Category 3 storm could put Coney Island under 21 feet of water. With more than 21square miles of land within a Category 4 surge zone, a significant hurricane would affectmillions of New Yorkers and compromise the City’s aging infrastructure.
2 The SLOSH map represents locations that may experience flooding from hurricane storm surge. Incontrast, the floodplain map represents locations that experience natural coastal flooding, which may beunrelated to hurricanes, and are within the FEMA-defined 100-year floodplain. Hurricane storm surgeareas overlap many areas that are designated as the 100-year floodplain, but the hurricane storm surge areasare considerably larger and represent a different hazard.
7/31/2019 New York City Coastal Storm Hazard Analysis
http://slidepdf.com/reader/full/new-york-city-coastal-storm-hazard-analysis 5/16
New York City Natural Hazard Mitigation Plan March 2009
Section III: Natural Hazard Risk Assessment Page 84 of 179
Figure 42: New York City SLOSH Model

7/31/2019 New York City Coastal Storm Hazard Analysis
http://slidepdf.com/reader/full/new-york-city-coastal-storm-hazard-analysis 6/16
New York City Natural Hazard Mitigation Plan March 2009
Section III: Natural Hazard Risk Assessment Page 85 of 179
Figure 43: New York City Storm Surge for a Category 1 Hurricane

7/31/2019 New York City Coastal Storm Hazard Analysis
http://slidepdf.com/reader/full/new-york-city-coastal-storm-hazard-analysis 7/16
New York City Natural Hazard Mitigation Plan March 2009
Figure 44: New York City Storm Surge for a Category 2 Hurricane
Section III: Natural Hazard Risk Assessment Page 86 of 179
7/31/2019 New York City Coastal Storm Hazard Analysis
http://slidepdf.com/reader/full/new-york-city-coastal-storm-hazard-analysis 8/16
New York City Natural Hazard Mitigation Plan March 2009
Figure 45: New York City Storm Surge for a Category 3 Hurricane
Section III: Natural Hazard Risk Assessment Page 87 of 179

7/31/2019 New York City Coastal Storm Hazard Analysis
http://slidepdf.com/reader/full/new-york-city-coastal-storm-hazard-analysis 9/16
New York City Natural Hazard Mitigation Plan March 2009
Figure 46: New York City Storm Surge for a Category 4 Hurricane
Section III: Natural Hazard Risk Assessment Page 88 of 179
7/31/2019 New York City Coastal Storm Hazard Analysis
http://slidepdf.com/reader/full/new-york-city-coastal-storm-hazard-analysis 10/16
New York City Natural Hazard Mitigation Plan March 2009
Section III: Natural Hazard Risk Assessment Page 89 of 179
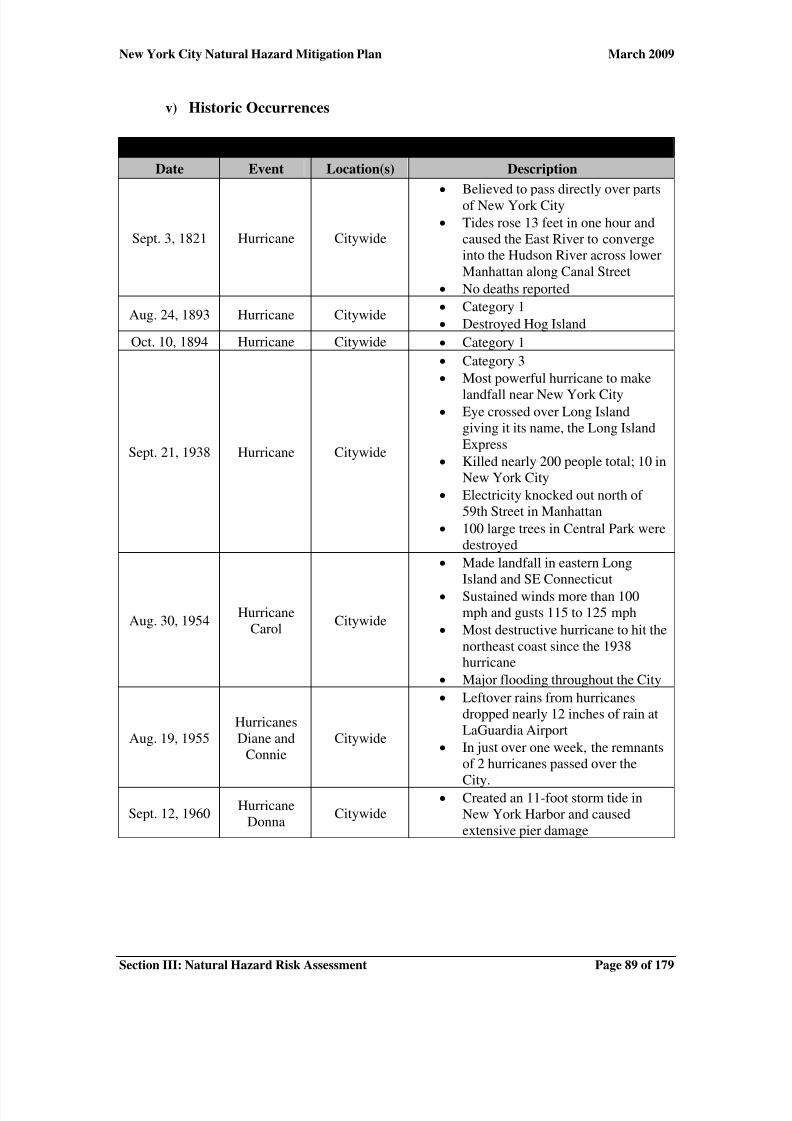
v) Historic Occurrences
Historic Occurrences of Coastal Storms in New York City
Date Event Location(s) Description
Sept. 3, 1821 Hurricane Citywide
•
Believed to pass directly over partsof New York City
• Tides rose 13 feet in one hour andcaused the East River to convergeinto the Hudson River across lowerManhattan along Canal Street
• No deaths reported
Aug. 24, 1893 Hurricane Citywide• Category 1
• Destroyed Hog Island
Oct. 10, 1894 Hurricane Citywide • Category 1
Sept. 21, 1938 Hurricane Citywide
• Category 3
• Most powerful hurricane to make
landfall near New York City• Eye crossed over Long Island
giving it its name, the Long IslandExpress
• Killed nearly 200 people total; 10 inNew York City
• Electricity knocked out north of 59th Street in Manhattan
• 100 large trees in Central Park weredestroyed
Aug. 30, 1954Hurricane
CarolCitywide
• Made landfall in eastern LongIsland and SE Connecticut
• Sustained winds more than 100mph and gusts 115 to 125 mph
• Most destructive hurricane to hit thenortheast coast since the 1938hurricane
• Major flooding throughout the City
Aug. 19, 1955HurricanesDiane and
ConnieCitywide
• Leftover rains from hurricanesdropped nearly 12 inches of rain atLaGuardia Airport
• In just over one week, the remnantsof 2 hurricanes passed over the
City.
Sept. 12, 1960Hurricane
DonnaCitywide
• Created an 11-foot storm tide inNew York Harbor and causedextensive pier damage

7/31/2019 New York City Coastal Storm Hazard Analysis
http://slidepdf.com/reader/full/new-york-city-coastal-storm-hazard-analysis 11/16
New York City Natural Hazard Mitigation Plan March 2009
Section III: Natural Hazard Risk Assessment Page 90 of 179
Historic Occurrences of Coastal Storms in New York City
Date Event Location(s) Description
June 22, 1972 TropicalStorm Agnes Citywide
• Agnes fused with another stormsystem in the northeastern U.S.,flooding areas from North Carolina
to New York State• Caused 122 deaths
• More than $6 billion in damage(when adjusted for inflation)
Sept. 27, 1985Hurricane
GloriaCitywide
• Category 3
• Made landfall on Long Island at 80mph
• Produced a modest storm surge of 4-7 feet above normal across theAtlantic
• Could have produced a muchstronger and intense storm surge if it happened during high tide
• Caused the largest single power lossin U.S. history at the time
• Total damage estimated at $900million in 1986
Dec. 21, 1992 Nor'easter Citywide
• Flooding and coastal erosion, debris
• Damage to residential andcommercial structures, utility lines,roads and other infrastructure
June 17, 1995Hurricane
Felix
Citywide
• Hurricane Felix lingered off theEast Coast for nearly a week,
menacing the northeastern U.S.before it finally drifted out to sea
June 18, 1996Tropical
Storm BerthaCitywide
• Weakening storm brought heavyrain to the City
Jan. 3, 1999 Nor'easter Citywide• 2.42 inches of rain
• 50-vehicle accident in Queens
Sept. 16, 1999Tropical
Storm FloydCitywide
• Flooded subway tunnels across theCity causing service disruptions
• Dropped 10-15 inches of rain in a24-hour period
• Public schools closed for the day
Sept. 18, 2003Tropical
Storm Isabel
Brooklyn,Bronx,Queens,
Staten Island
•
One fatality in the NY area – a mandrowned while bodysurfing off Long Beach, Long Island
• A fallen tree branch in the Bronxseriously injured a man
• 640 trees and 801 tree limbs weredowned across the City
• Total damage exceeded $1 billionalong the East Coast

7/31/2019 New York City Coastal Storm Hazard Analysis
http://slidepdf.com/reader/full/new-york-city-coastal-storm-hazard-analysis 12/16
New York City Natural Hazard Mitigation Plan March 2009
Section III: Natural Hazard Risk Assessment Page 91 of 179
Historic Occurrences of Coastal Storms in New York City
Date Event Location(s) Description
Apr. 15, 2007 Nor'easter Citywide
• More than 7.5 inches of rain inCentral Park
• More than 500 flights cancelled
• Disrupted power to 18,500customers in three states
Table 14: Historic Occurrences of Coastal Storms in New York City
Figure 47: History of Coastal and Tropical Storms Tracks
b) Vulnerability Assessment
i) Impact to New York City
A Category 1 hurricane can cause storm surge of up to 10 feet and 95 mile per hourwinds causing moderate damage to the City’s foliage and unstable buildings along the
coast. A Category 4 hurricane would devastate New York City with surge levelssurpassing 30 feet in some areas, causing large-scale utility disruptions and damage tobuildings and infrastructure. Due to the geography and climate characteristics of NewYork City, scientists do not predict a Category 5 hurricane would reach as far north asNew York City and although possible, a Category 4 hurricane is unlikely.
The New York City Coastal Storm Plan (CSP) uses the SLOSH zones to define the areasthat may be required to evacuate, called evacuation zones, based on different categories
7/31/2019 New York City Coastal Storm Hazard Analysis
http://slidepdf.com/reader/full/new-york-city-coastal-storm-hazard-analysis 13/16
New York City Natural Hazard Mitigation Plan March 2009
Section III: Natural Hazard Risk Assessment Page 92 of 179
of storms. Zone A would evacuate prior to a Category 1 hurricane, Zone B prior to aCategory 2 hurricane, and Zone C prior to a Category 3 or 4 hurricane.
Depending on the severity of the hurricane, OEM estimates that between 272,000 andthree million New Yorkers may have to evacuate. Most evacuees will stay with friends or
family within or outside of the City. Some evacuees will go to City-provided shelterslocated outside the SLOSH zones. Table 15 is an estimate of total evacuees in New York City based on the evacuation zones. These numbers derive from population data,behavioral assumptions, tourist occupancy, and vehicle accessibility. “Other evacuees”refers to the shadow population that will evacuate even though they do not live in theevacuation zone.
CSP Evacuees by Zone
Order Scope Evacuees
Zone A (Category 1) 272,331
Zone B (Category 2) 677,940
Zone C (Categories 3 and 4) 1,380,388
Subtotal Zone Evacuees 2,330,659
Other Evacuees* 714,162
Total Potential Evacuees 3,044,821
*Other evacuees are people who will evacuate from non-flood zonesTable 15: CSP Evacuees
Density is a major concern for New York City in the context of a hurricane. More thaneight million people live within 305 square miles across the five boroughs. New York
City’s three islands and the main land create 578 miles of coastline. Close to two millionpeople in 743,000 households live within a SLOSH zone and as much as 38% of theCity’s land may experience inundation by storm surge in a coastal storm.
ii) Structural Vulnerability
The Planning Team used HAZUS-MH to estimate potential losses from hurricanes inNew York City based on a probabilistic model, in which the probability is expressed as apercent chance that a hurricane of a specific magnitude will occur in any given year. Forexample, a hurricane with a 50-year return period, or occurrence rate, has a 2% chance of occurring in any one year.
Probabilistic Modeling
Return Period(Years)
Chance ofOccurrence in Any
Given Year (%)
10 10
20 5
50 2
7/31/2019 New York City Coastal Storm Hazard Analysis
http://slidepdf.com/reader/full/new-york-city-coastal-storm-hazard-analysis 14/16
New York City Natural Hazard Mitigation Plan March 2009
Section III: Natural Hazard Risk Assessment Page 93 of 179
Probabilistic Modeling
Return Period(Years)
Chance ofOccurrence in Any
Given Year (%)
100 1200 0.5
250 0.4
500 0.2
1,000 0.1
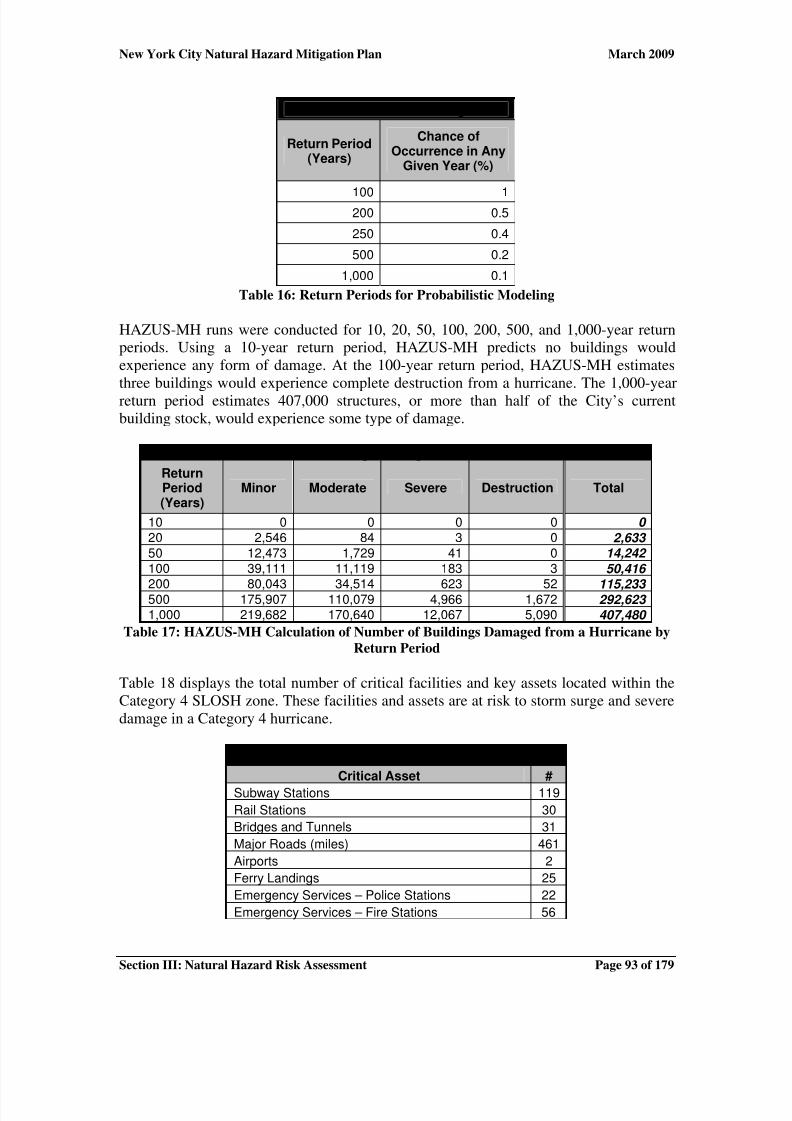
Table 16: Return Periods for Probabilistic Modeling
HAZUS-MH runs were conducted for 10, 20, 50, 100, 200, 500, and 1,000-year returnperiods. Using a 10-year return period, HAZUS-MH predicts no buildings wouldexperience any form of damage. At the 100-year return period, HAZUS-MH estimatesthree buildings would experience complete destruction from a hurricane. The 1,000-yearreturn period estimates 407,000 structures, or more than half of the City’s currentbuilding stock, would experience some type of damage.
Number of Buildings Damaged from a Hurricane
ReturnPeriod(Years)
Minor Moderate Severe Destruction Total
10 0 0 0 0 0
20 2,546 84 3 0 2,633
50 12,473 1,729 41 0 14,242
100 39,111 11,119 183 3 50,416
200 80,043 34,514 623 52 115,233 500 175,907 110,079 4,966 1,672 292,623
1,000 219,682 170,640 12,067 5,090 407,480
Table 17: HAZUS-MH Calculation of Number of Buildings Damaged from a Hurricane by
Return Period
Table 18 displays the total number of critical facilities and key assets located within theCategory 4 SLOSH zone. These facilities and assets are at risk to storm surge and severedamage in a Category 4 hurricane.
Critical Assets Located within SLOSH Zones
Critical Asset #
Subway Stations 119
Rail Stations 30
Bridges and Tunnels 31
Major Roads (miles) 461
Airports 2
Ferry Landings 25
Emergency Services – Police Stations 22
Emergency Services – Fire Stations 56
7/31/2019 New York City Coastal Storm Hazard Analysis
http://slidepdf.com/reader/full/new-york-city-coastal-storm-hazard-analysis 15/16
New York City Natural Hazard Mitigation Plan March 2009
Section III: Natural Hazard Risk Assessment Page 94 of 179
Critical Assets Located within SLOSH Zones
Critical Asset #
Emergency Services – EMS Stations 10
Educational – Colleges 19
Educational – Public Schools 343
Educational – Private Schools 215Healthcare – Hospitals 23
Healthcare – Nursing Homes 57
Cultural Facilities 11
Infrastructure – Power Plants 17
Infrastructure – Wastewater Treatment Plants 13
Table 18: Critical Assets within SLOSH Zones
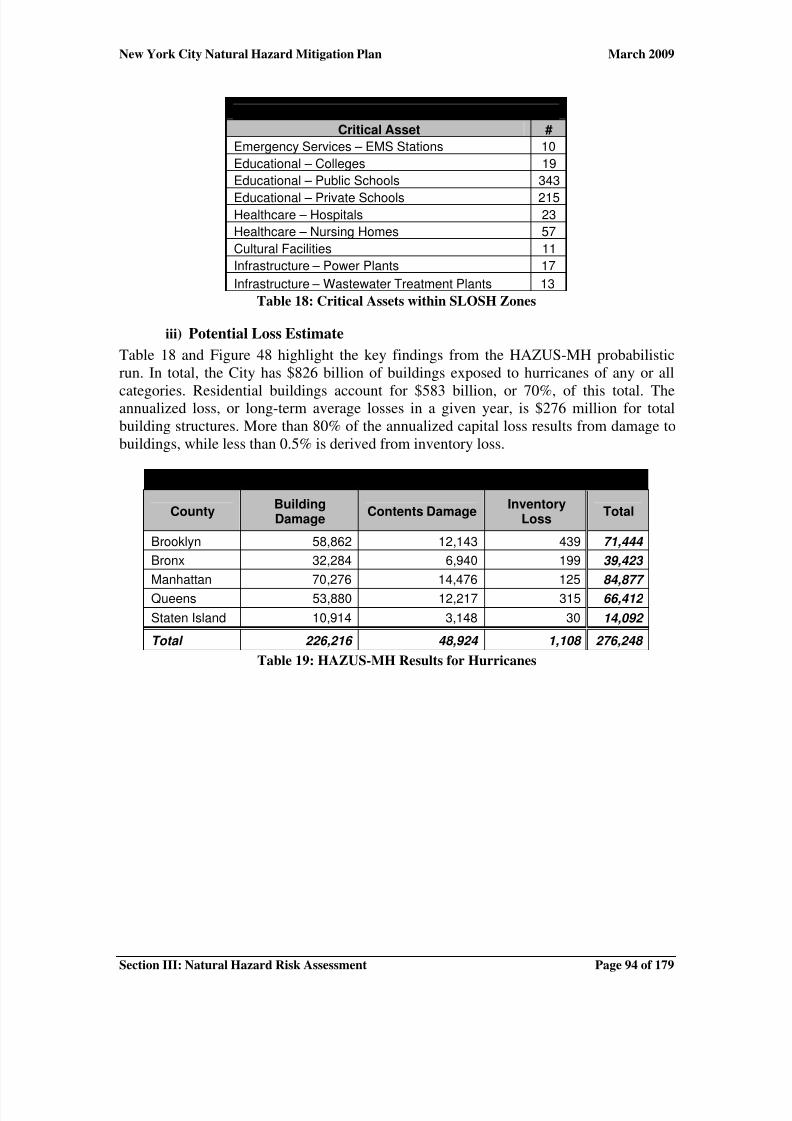
iii) Potential Loss Estimate
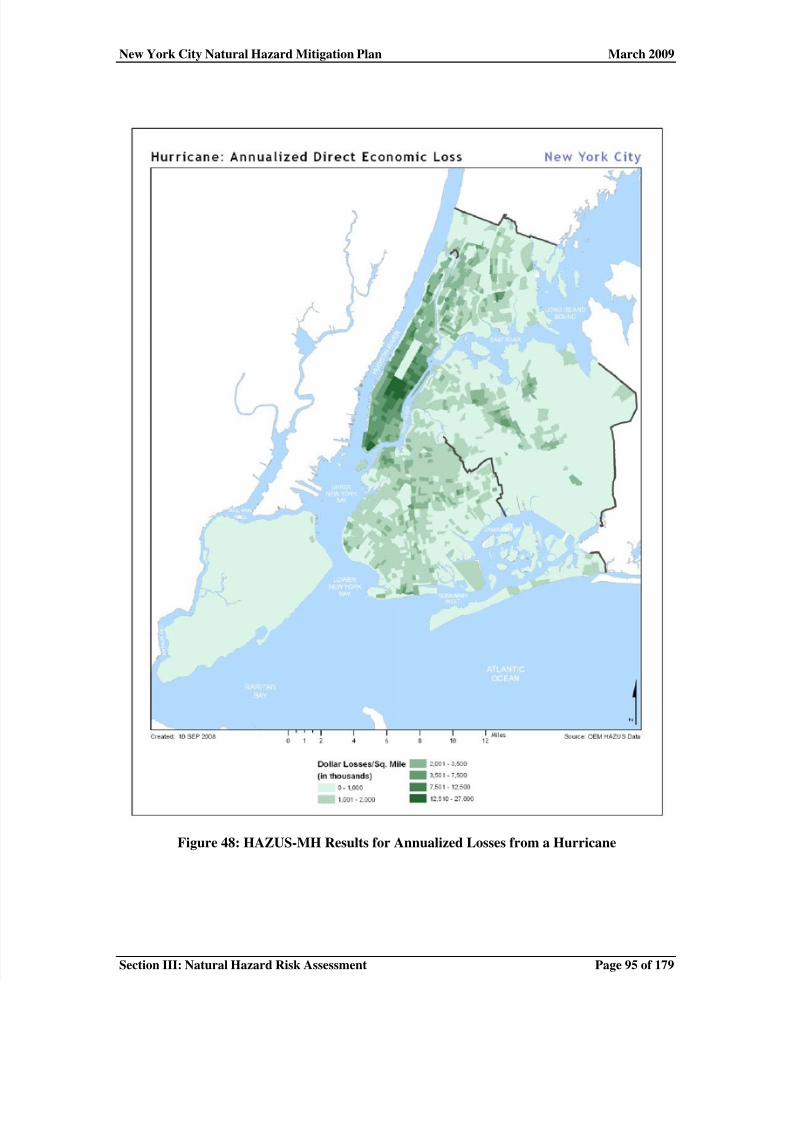
Table 18 and Figure 48 highlight the key findings from the HAZUS-MH probabilisticrun. In total, the City has $826 billion of buildings exposed to hurricanes of any or all
categories. Residential buildings account for $583 billion, or 70%, of this total. Theannualized loss, or long-term average losses in a given year, is $276 million for totalbuilding structures. More than 80% of the annualized capital loss results from damage tobuildings, while less than 0.5% is derived from inventory loss.
Annualized Capital Stock Loss for Hurricanes ($1,000s)
CountyBuildingDamage
Contents DamageInventory
LossTotal
Brooklyn 58,862 12,143 439 71,444
Bronx 32,284 6,940 199 39,423
Manhattan 70,276 14,476 125 84,877
Queens 53,880 12,217 315 66,412
Staten Island 10,914 3,148 30 14,092
Total 226,216 48,924 1,108 276,248
Table 19: HAZUS-MH Results for Hurricanes
7/31/2019 New York City Coastal Storm Hazard Analysis
http://slidepdf.com/reader/full/new-york-city-coastal-storm-hazard-analysis 16/16
New York City Natural Hazard Mitigation Plan March 2009
Section III: Natural Hazard Risk Assessment Page 95 of 179
Figure 48: HAZUS-MH Results for Annualized Losses from a Hurricane