new tools for data-driven portfolio course-correction ...new tools for data-driven portfolio...
TRANSCRIPT

New Tools for Data-Driven Portfolio Course-Correction Strategies
Lee Wood, Ryan Del Balso, Keith Downes, Toben Galvin, Frank Stern; Navigant Nicholas DeDominicis, Marina Geneles; PECO
ABSTRACT
Meeting energy efficiency portfolio spending and savings targets in some regulatory
environments can be like landing a jet on an aircraft carrier in a raging storm. Utility portfolio managers navigate by professional judgement, drawing on spotty data from tracking systems while attempting to balance the amount of low acquisition cost measures with higher cost, deeper more comprehensive and valuable customer centric energy solutions. This paper describes the development of a data-driven, interactive tool for use by portfolio managers to identify and plan timely, actionable portfolio course-correction and driving toward the deepest, most comprehensive solutions and land on target within the available budget.
The project team identified the range of likely course-correction scenarios that our utility’s portfolio may need to be controlled for (e.g., increase energy savings without increasing overall spending). The team then developed a replicable method for using portfolio tracking data to prioritize the most useful measures for controlling the portfolio under each scenario. For each measure, actionable recommendations were developed for using the range of “levers” (e.g., rebates, marketing) available to program staff for controlling participation, along with corresponding estimates of potential savings/spending impacts and timelines to guide planning efforts. The final results were incorporated into an interactive tool that condenses a wealth of data into visually-appealing graphics the size of a postcard. These graphics intuitively draw the user’s attention to the key measures to use for course-corrections, and include customized information about lever recommendations and impact estimates. This paper will describe the tool development and provide some examples of its intended use in planning portfolio course-corrections to achieve savings targets within spending constraints. Background
Pennsylvania Act 129 of 2008 (the Act or Act 129) required electric distribution
companies (EDCs) in Pennsylvania with over 100,000 customers to reduce total electric consumption (among other requirements) through adoption of energy efficiency and conservation (EE&C) programs (Pennsylvania Act 129 of 2008). Act 129 is currently in its second phase (Act 129 Phase II) which is a three year phase extending from June 1, 2013 through May 31, 2016 (Pennsylvania PUC 2012). The primary mechanism for ensuring EDC compliance with this law is through penalties of at least one million and up to twenty million dollars imposed for non-compliance. The Act also set a maximum budget for implementation of the EE&C programs of two percent of the EDC’s revenue as of December 31, 2006. Together, these requirements place a large challenge on the Pennsylvania EDCs to manage achieving the energy saving targets while offering the most comprehensive energy efficiency solution staying within the spending cap.
4-1©2016 ACEEE Summer Study on Energy Efficiency in Buildings
PECO (an Exelon Company) is one of the affected EDCs. To meet this challenge, PECO established portfolio management objectives to design and deliver a well-rounded, comprehensive energy efficiency portfolio. One of PECO’s Act 129 Phase II goals is to actively manage the portfolio “…to achieve 105% of the statutory electric savings goal, with the most comprehensive portfolio reasonably achievable within the electric spending cap.” (PECO 2012, 5)
After several years of implementation, PECO was looking for a way to actively manage its EE&C portfolio with better intelligence. With a portfolio of over 900 unique measures (including different efficiency or capacity tiers, over 400 measures when not considering these) it was difficult to know which measures to adjust, and in which ways, to manage the portfolio to meet their objectives if it deviated from the EE&C Plan. Portfolio managers used common adjustment strategies through a trial and error process, such as increasing or decreasing participation in the largest measures without having the full picture of the expected outcomes of such actions. This sometimes resulted in overcompensating for the needed corrections.
For example, during Act 129 Phase I PECO was on track to greatly overachieve its targets due to the overwhelming reliance on the lowest hanging fruit. Without detailed knowledge of the expected impacts from the multitude of adjustments that could be used to actively manage the portfolio it was unclear how to specifically adjust the portfolio to offer more valuable and deeper energy solutions for participating customers that in a risk adjusted controlled manner. PECO ended up overshooting the targets and offering less valuable solutions from a customer perspective.
Achieving their portfolio objectives which was to meet the savings targets while offering the most valuable measures and programs that customers have a great deal of difficulty implementing without aggressive utility programs proved difficult within the regulatory constraints using the management strategies available to them at the time and relied on trial and error in many cases. There was little intelligence on what the overall impacts from this trial-and-error-process would be. These existing management tools mainly provided very course adjustment capabilities when what they sometimes needed were fine adjustment controls.
Going into Act 129 Phase II PECO did not have the confidence in its ability to actively control the portfolio to the extent needed and they sought Navigant’s assistance to develop a new tool to better manage the portfolio. PECO wanted to develop methods to more actively and intelligently manage its EE&C portfolio performance for both energy savings and spending depending on several potential scenarios it may face (discussed below). Project Objectives
Navigant was hired to develop a new portfolio management tool to give PECO the
intelligence they needed to actively manage their EE&C portfolio to the planned energy savings and spending goals and adjust the portfolio in real time to continually drive toward the deepest most valuable and most comprehensive projects possible The objective of the project was to assist PECO in understanding how to actively manage its EE portfolio when facing a variety of different portfolio course-correction scenarios. For any given scenario, PECO portfolio managers needed a more scientific method for selecting which measures and programs to adjust participation in, and what “levers” (e.g., rebate changes, marketing tactics, measure eligibility adjustments) to use to adjust the participation for the selected measures or programs.
4-2 ©2016 ACEEE Summer Study on Energy Efficiency in Buildings

Additionally, PECO requested the results of this analysis be presented in a user-friendly format to ensure that the information is easily accessible to PECO portfolio managers.
PECO tasked Navigant with analyzing six potential course-correction scenarios and developing actionable recommendations for responding to each. Included in PECO’s portfolio management goals is to provide as comprehensive a portfolio as possible with deep, long-term savings without going over budget (PECO 2012, 2-3 Section 1.2). The scenarios reflect this goal. For example, if PECO is on track to hit its savings goals, but is underspending, this presents an opportunity to back off on the low-cost, low-hanging fruit measures such as CFLs, and move some of the available money into deeper, more comprehensive measures such as shell and HVAC upgrades. As such, the scenarios considered are shown in Table 1.
4-3©2016 ACEEE Summer Study on Energy Efficiency in Buildings

Table 1. Budget and savings scenarios considered
Scenario Number Scenario
Savings Acquisition Rate
Budget Spending Rate Implementation Notes
1
Increase savings without increasing spending: budget on track, but savings projected to fall short of goals at current measure participation mix
Increase Maintain
Shift participation towards less comprehensive, lower-cost measures to meet savings goal. Requires corresponding equal decrease in spending on more comprehensive, higher-cost measures to ensure spending does not exceed budget.
2
Decrease savings without decreasing spending: budget on track, but savings projected to exceed goals at current measure participation mix allowing room to provide more comprehensive measures
Decrease Maintain
Opportunity to shift participation towards more comprehensive, higher-cost measures. Requires corresponding equal decrease in spending on less comprehensive, lower-cost measures to ensure spending does not exceed budget.
3
Increase spending without increasing savings: savings on track but budget surplus projected allowing room to provide more comprehensive measures
Maintain Increase
Encourage increased participation on higher-cost, more comprehensive measures using available budget surplus. Requires corresponding equal decrease in savings on lower-cost, less comprehensive measures to ensure savings don't exceed goals.
4
Decrease spending without decreasing savings: savings on track but budget shortfall projected to meet goals at current measure participation mix
Maintain Decrease
Encourage increased participation on lower-cost, less comprehensive measures to reduce spending rate. Requires corresponding equal decrease in savings on higher-cost, more comprehensive measures to ensure savings don't exceed goals.
5
Increase pace: budget surplus and savings shortfall projected to not meet goals at current measure participation mix
Increase Increase
Encourage increased participation in a balanced rate of spending across all measures to roughly maintain acquisition cost, but to increase pace of savings and spending to meet goals without exceeding budget.
6
Decrease pace: budget shortfall and savings surplus projected to exceed goals at current measure participation mix
Decrease Decrease
Decrease participation in a balanced rate of spending across all measures to roughly maintain acquisition cost, but to reduce pace of savings and spending to meet goals without exceeding budget.
Source: Navigant Consulting, Inc. Each scenario reflects PECO’s objective to achieve their savings goal within the specified
budget while providing as comprehensive a portfolio as possible. For example, if PECO is nearing its portfolio spending cap while underachieving on energy savings (relative to goal), strategies associated with scenario #1 would be employed to increase savings without significantly increasing spending. While there is no penalty for not spending the full budget available, the Pennsylvania PUC, PECO’s stakeholders, and PECO have all clearly stated that they have interest in achieving deeper savings with longer life, more comprehensive measures such as HVAC and shell measures. Therefore, PECO views significant underspending of budget
4-4 ©2016 ACEEE Summer Study on Energy Efficiency in Buildings

while meeting savings goals as an opportunity to move funds towards deeper, longer lasting, more comprehensive measures that tend to be more costly to implement.
For any given scenario the portfolio may need to be adjusted a little or a lot to get back on track with PECO’s portfolio management objectives. This meant the solutions could not be a one size fits all, but would need to provide PECO management with multiple options that they could mix and match to meet whatever scenario they faced. PECO not only wanted to know which measures to adjust and in which programs, but how to adjust them and what the potential impact of any adjustment would be.
Navigant’s goal was to provide PECO portfolio managers a simple tool to allow them to make more informed course corrections throughout a program year. The final deliverable was intended to be an interactive tool that allows PECO’s portfolio managers to quickly identify the most useful measures to use for each course correction scenario. The tool incorporates actionable recommendations for using the suite of levers available for controlling participation for each measure, along with corresponding estimates of potential savings/spending impacts and timelines to guide planning efforts. As actionable recommendations take a period of time to realize their adjustments, usually 2-4 months, the tool is intended to be used at periodic portfolio reviews such as quarterly performance updates. Over correction should be avoided, and major adjustments are not recommended more than once every quarter. Methodology
The following section outlines the methodology used to identify the most appropriate strategies for controlling the portfolio in various scenarios. The project was completed in phases. The first phase involved narrowing down which measures could be used as “control points” and identifying the most useful control points for each course-correction scenario. The second phase involved developing actionable recommendations for using each control point’s “levers” to control participation, and developing an interactive tool to display the results.
Identifying Key Control Points
PECO’s portfolio contains more than 400 measures, making it difficult to identify which measures would be most useful for portfolio course-corrections. The project team began by developing a short list of the most useful measures (or categories of measures) for controlling the portfolio. These twenty “key control points” are those measures whose participation is most scalable, with significant potential impact on portfolio savings and/or costs.
To identify the key control points, the project team developed a rating system using tracking data and professional judgement to score each control point based on various parameters in order to assess each measure’s potential usefulness in managing the portfolio. These parameters included:
• Acquisition cost, defined as the utility cost per annual kWh of savings • Correlation of participation change with marketing or incentive changes • Speed of how quickly the market responds to a control point change • Market saturation
4-5©2016 ACEEE Summer Study on Energy Efficiency in Buildings

Acquisition cost is a calculated value set by the incentive and non-incentive costs of delivering the control point measures divided by the design calculated savings for the measures. Correlation of participation change with marketing or incentive changes is a professional judgement estimation. Speed of how quickly the market responds to control point changes also involves professional judgement but is easy to rate to the precision required by the tool. Measures such as screw-in lighting respond vastly quicker than making a change to a non-residential new construction program. Market saturation is informed by the 2015 PECO potential study1 conducted for PECO’s service territory and experience gained conducting baseline and potential studies in other jurisdictions, and also professional judgement.
Figure 1 illustrates the parameters that were considered for each of the portfolio control scenarios. The color designates whether a parameter is manageable for increasing (green) or decreasing (red) participation. The 1st or 2nd designation indicates what is of primary (1st) or secondary (2nd) importance. For example, in Scenario 1 (increasing savings without increasing spending) we are primarily looking to increase participation in measures with high correlation to incentive or marketing changes, quick market responsiveness, low market saturation and low acquisition costs. Secondarily we are seeking measures with low correlation to incentive changes and high acquisition costs to reduce participation so the overall budget does not increase. Combined we have the net effect of increasing savings without increasing spending.
Figure 1 Parameters for identifying key control points for each course-correction scenario
The project team formulated algorithms to combine the effects of the desired parameters
for each of the six scenarios. The algorithms provide a numerical score for each control point, normalized to a 1-10 rating scale, indicating the control point’s estimated usefulness in managing participation to accomplish each control scenario’s objective. Only control points that had strong
1 The PECO Demand-Side Resource Potential Study Report, May, 2015 is a proprietary report prepared by Navigant for PECO’s internal use, and is therefore not included in the reference list
Scenario
Measures with high correlation
to incentive changes
Measures with low correlation to incentive changes
Measures with high correlation
to marketing/outrea
ch changes
Measures with quick
responsiveness to changes in
incentives/marketing
Measures with low market saturation
High $/kWh measures
Low $/kWh measures
Increase Savings (without increasing spending)
1st 2nd 1st 1st 1st 2nd 1st
Decrease Savings (without decreasing spending)
1st 2nd 1st 1st 2nd 1st
Increase Spending (without increasing savings)
2nd 1st 2nd 2nd 1st 2nd
Decrease Spending (without decreasing savings)
2nd 1st 2nd 2nd 2nd 1st 2nd
Increase Pace 1st 1st 1st 1st1st (Neutral
$/kWh Measures)
Decrease Pace 1st 1st 1st1st (Neutral
$/kWh Measures)
4-6 ©2016 ACEEE Summer Study on Energy Efficiency in Buildings

scores in each of the desired criteria would receive a score near 10. Note that what is considered a desirable criteria changes depending on the scenario that needs correcting. For instance if one needs to increase savings without affecting spending measures with low acquisition costs need to be adjusted to higher levels of participation while measures with high acquisition costs need to diminish their participation, but both groups of control points need to respond quickly to market changes. Measures of near neutral acquisition cost are avoided in this case. For further examples see the Application of Portfolio Management section later in this document. These ratings were used to select the list of key control points by removing those measure with low usefulness ratings. The final list contained roughly 20 key control points, which represented more than 50% of the portfolio’s annual energy savings. Levers for Control
To ensure that this analysis was tangible and useful for PECO portfolio and project managers, the project team developed a list of realistic, actionable recommendations for using each control point’s “levers” to manage participation. For instance, incentives were identified as one of the primary levers for most control points. So the project team brainstormed all the ways that incentives could be altered to manage participation, from temporary promotional bonuses to strategically discontinuing them for certain stock keeping units (SKUs). Additionally, the project team estimated potential MWh savings impacts for each action and the anticipated time-frame for those impacts with the help of measure adoption curves from the PECO Potential Study. These impact estimates allow for the coordination of multiple actions to plan large portfolio course-corrections. These lever recommendations and impact estimates were refined through interviews with utility program managers, implementation contractors and program evaluators. Figure 2 below presents an example of the recommendations, impacts and time-frame for one key control point.
Figure 2. Control point lever recommendations
4-7©2016 ACEEE Summer Study on Energy Efficiency in Buildings

Interactive Heat Map Tool
The final result of Navigant’s analysis was a cumbersome series of spreadsheet tables requiring complex manual operation to extract information. To make the data more user-friendly, the project team created dashboards of “heat maps” to visually represent the data in an interactive format, as seen in Figure 3. There is a separate “dashboard” for each scenario, with heat maps displaying the control points in each sector. Alongside the heat maps is a “Control Point Lever Impact” menu in the upper right of the dashboard listing the “lever recommendations” for each control point in the list. The lever recommendation boxes are listed in order of the magnitude of their impact and are shaded green or red to indicate whether they increase or decrease participation. When the user selects one of the boxes, a separate display pops up detailing the lever recommendation and associated impacts (middle right of Figure 3).
Each box in the heat map represents one of the available control points. The size of each box indicates the magnitude of the control point’s planned energy savings per PECO’s filed EE&C plan. The shade of the box indicates the control point’s usefulness in controlling for the given scenario. The darker the color, the stronger the response the control point is expected to have for a given scenario. The green boxes indicate control points that should seek increased participation to achieve the scenario objectives. The red boxes indicate control points that should seek decreased participation to compensate for the increased participation in green control points. This increase and decrease of different control points is to achieve the balanced portfolio management needed for a given scenario. Not all scenarios require this type of balance. For example, the scenario to increase both savings acquisition rates and spending don’t require both increases and decreases across different control points.
Figure 3. Example of a heat map dashboard
4-8 ©2016 ACEEE Summer Study on Energy Efficiency in Buildings

Application in Portfolio Management
To provide a more concrete demonstration of the Heat Map Tool, below are a few implementation challenge scenarios and written illustrations of their solutions. Example 1: Scenario 5 – Pace of Savings Acquisition is Too Slow
A common energy efficiency/demand response program dilemma is when a portfolio is delivering savings at the desired acquisition cost, but the savings will fall short of target if the pace of savings continues on its trajectory. The objective is to increase the pace of energy savings without disrupting the balance of spending and savings.
In this example, PECO needs to increase both savings and spending by 20% in approximately one year while not making major changes to the design balance. More specifically the scenario implies:
• 64,481 MWh of additional 1st year savings • $18,200,000 additional spending • Pace evenly increased in both Residential and C&I sectors • Incentives need to stay within the filed regulatory plan incentive ranges • PECO wishes to modify as few control points as possible Figure 4 shows the “Increase Pace” scenario dashboard. The darker green the control
point, the more useful it is likely to be for increasing the pace. The darker green indicates the control point has an acquisition cost near the portfolio average acquisition cost, the measure is not saturated in the market place, and design changes will make significant participation changes in a short amount of time. PECO may select the dark green control points of:
• Screw-in CFL bulbs for the Low-income Energy Efficiency Program (LEEP) • Appliance Recycling Program • C&I Custom Lighting • C&I Custom HVAC
4-9©2016 ACEEE Summer Study on Energy Efficiency in Buildings

Figure 4. Increase Pace scenario dashboard
To determine which lever control strategies to employ, PECO staff can then select the control point in the “Control Point Lever Impact” menu to the right of the heat map (Figure 5 below), which displays each of the control points’ “lever recommendations.” Portfolio managers can employ several recommendations from each control point for a stronger adjustment, fewer for a more mild adjustment. Figure 5 shows the lever recommendations for increasing the pace of CFL lamps in the LEEP Program.
4-10 ©2016 ACEEE Summer Study on Energy Efficiency in Buildings

Figure 5. CFL Lever Recommendations
By repeating this process with all the selected control points portfolio managers will be left with the following recommendations:
• Adjustment to LEEP Screw-in CFL lamps (Additional 15-25,000 MWh) through increasing participation by 50,000 CFL’s – Increase eligibility to 50% of the Federal Poverty Level – Decrease monthly usage requirement by 100-200 kWh – Move to using Energy Use Intensity criteria for screening – Increase frequency of attendance at community/outreach events
• Appliance Recycling (Additional 10-15,000 MWh) – Increase incentive to top of plan range, $50 – Use adverting including bill inserts to notify customers – Increase number of crews and their work schedule
• Custom Lighting and Custom HVAC (17,500–22,500 MWh) – Increase incentive to top end of the planned range
o $0.08/kWh saved in C&I lighting, $0.10 for GNI o $0.10/kWh saved in C&I HVAC, $0.12 for GNI
– Task Account Managers to promote and identify opportunities for these control points to their customers; including walk-throughs of large facilities
The combined effect of these control point adjustments is an additional 20% increase in annual savings and spending that is projected to be realized in 12-16 months. Additionally each
4-11©2016 ACEEE Summer Study on Energy Efficiency in Buildings

control point keeps savings and spending in balance while also meeting other PECO objectives such as deeper savings for the low-income sector. Example 2: Scenario 3 – Increase spending rate without increasing savings acquisition rate
In this scenario, PECO is on track to meet or exceed its savings target but is falling short of its spending target indicating that more comprehensive projects can be pursued because money is available to increase participation in more comprehensive measures. Portfolio managers want to increase residential spending by $3M in the next 3-6 months to meet the annual spending target without increasing the overall rate of savings acquisition.
The objective is to identify the control points that will provide additional spending and comprehensiveness with as few adjustments as possible. In this scenario, the most useful action would be to increase participation in measures with a higher acquisition cost ($/kWh) which is a simple proxy for more comprehensive measures, while actively decreasing participation from low acquisition cost measures (a proxy for low cost, less comprehensive measures). The red cells indicate those lower cost control points for which participation should be decreased and green cells indicate the higher cost control points to increase participation.
PECO staff may proceed by selecting a large, dark green control point from the residential heat map in the “Increase Spending without Increasing Savings” scenario dashboard, shown in Figure 6. In this case they will select the following control points:
• Air Source Heat Pump control point • Central A/C control point • LED reflector lamp control point
Figure 6. Heat map for increasing rate of residential spending without increasing rate of savings acquisition
To determine which lever control strategies to employ, select the control point in the
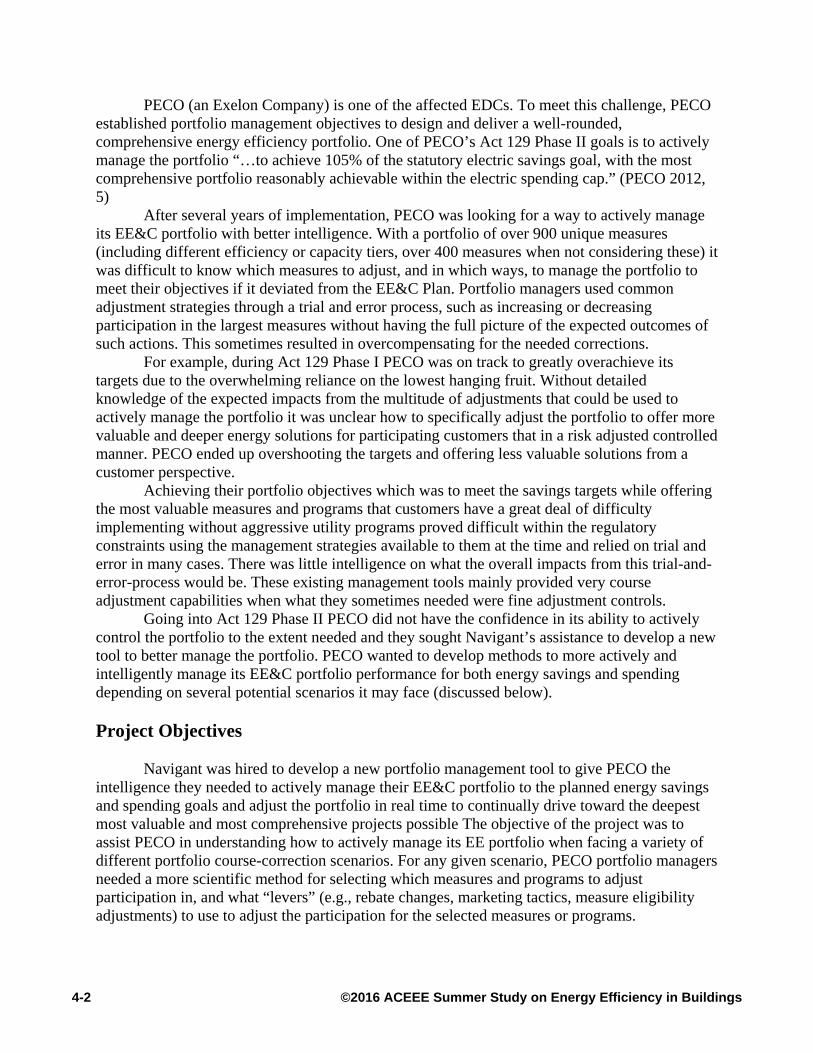
“Control Point Lever Impact” menu to the right of the heat map (Figure 7 below), which displays each of the measure’s “lever recommendations.” By offering a temporary incentive bonus of
4-12 ©2016 ACEEE Summer Study on Energy Efficiency in Buildings
$100/unit PECO can increase spending (and thus participation in comprehensive measures) by roughly $1.5M in the next four months, though savings will also increase by roughly 1,000 MWh which needs to be adjusted for elsewhere to prevent an overall increase in both spending and savings acquisition rates.
A similar incentive bonus for Central Air Conditioners will increase spending by another $2M in the next four months, with another 1,000 MWh increase in savings. Finally, an increase in incentive amounts offered for Specialty LED bulbs to the maximum allowed will lead to an additional increase in spending of $2M, reaching PECO’s goal of spending an additional $3.5M over the next 3-6 months.
Figure 7. Lever recommendations for increasing rate if spending
These spending increases will, however, increase savings by roughly 5,000 MWh, which
would exceed the annual savings target. The portfolio manager must also select a large red control point with low acquisition costs for which to decrease participation to compensate and balance out the overall savings and spending acquisition rates.
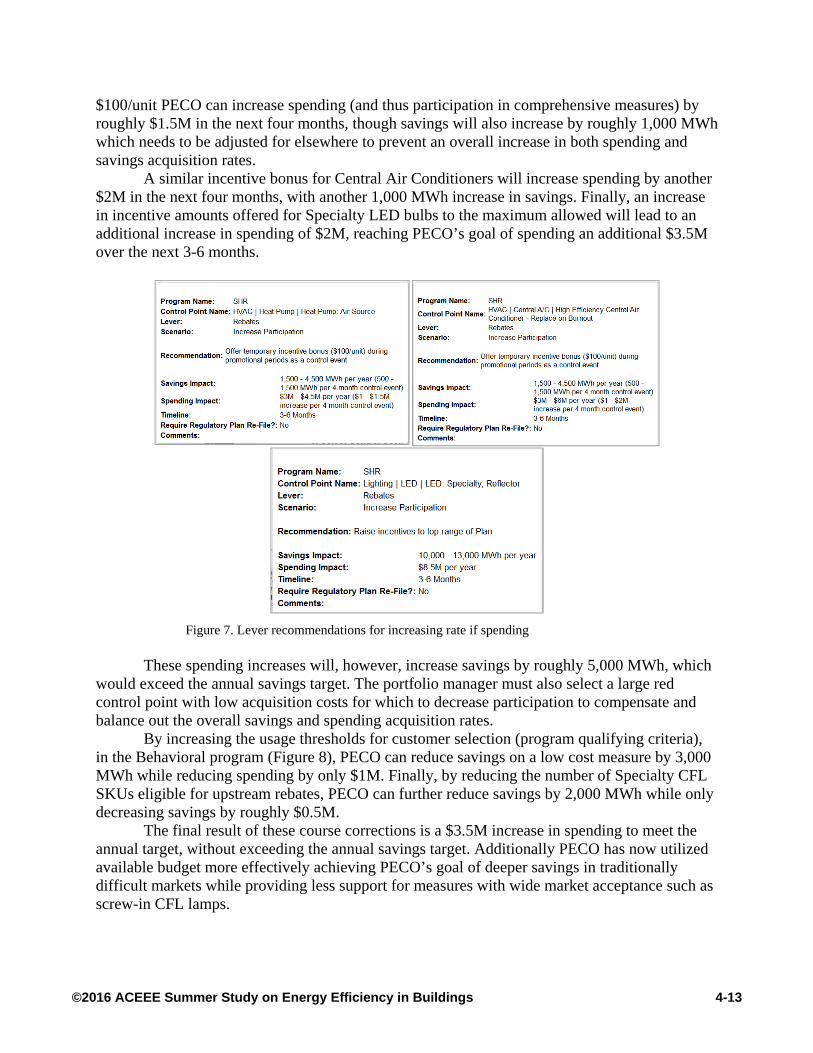
By increasing the usage thresholds for customer selection (program qualifying criteria), in the Behavioral program (Figure 8), PECO can reduce savings on a low cost measure by 3,000 MWh while reducing spending by only $1M. Finally, by reducing the number of Specialty CFL SKUs eligible for upstream rebates, PECO can further reduce savings by 2,000 MWh while only decreasing savings by roughly $0.5M.
The final result of these course corrections is a $3.5M increase in spending to meet the annual target, without exceeding the annual savings target. Additionally PECO has now utilized available budget more effectively achieving PECO’s goal of deeper savings in traditionally difficult markets while providing less support for measures with wide market acceptance such as screw-in CFL lamps.
4-13©2016 ACEEE Summer Study on Energy Efficiency in Buildings
Figure 8. Lever recommendations for balancing rate of energy savings acquisition
Conclusions
The portfolio management tool Navigant provided to PECO is a customized, interactive tool designed to provide PECO’s staff with more intelligence in making mid-course portfolio correction decisions. While the tool organizes portfolio management and control opportunities into a user-friendly graphical format, design rebalancing is still a manual process. Effective use of the tool requires familiarity with the tool and deep knowledge of the portfolio design, as well as professional judgment from program and portfolio managers. This tool is a significant step towards incorporating better data and smarter processes into portfolio management. It provides PECO portfolio managers the ability to make more informed decisions and gives them insight into not only how they can increase/decrease savings or spending rates, but more importantly how to balance changes across the portfolio to meet overall objectives.
To remain relevant this portfolio management tool must be regularly updated with current data. The next step for this project will be to input quarterly performance data to automate some monitoring processes and identify early warning signs, to allow sufficient time to plan effective course-corrections strategies.
References Pennsylvania Act 129 of 2008. The Act created an EE&C Program, codified in the Pennsylvania
Public Utility Code at Sections 2806.1 and 2806.2, 66 Pa. C.S. §§ 2806.1 and 2806.2. PA PUC (Pennsylvania Public Utility Commission). 2012. Energy Efficiency and Conservation
Program Implementation Order. Referred to as PA Act 129 Phase II Implementation Order. Docket No. M-2012-2289411 and M-2008-2069887. August 2, 2012.
PECO. 2012. PECO Program Years 2013-2015 Act 129 – Phase II Energy Efficiency and
Conservation Plan. Filed with the Pennsylvania Public Utility Commission November 1, 2012. Revised March 20, 2014.
4-14 ©2016 ACEEE Summer Study on Energy Efficiency in Buildings