new template as on 09 may 2013 - nexi · supplied to acid scrubber. about 10-40% ammonium sulphate...
TRANSCRIPT
Project Design and Description
118
Boiler fuel;
Pilot fuel of flare stacks; and
Gas engine generator.
375. Chemicals: Caustic Soda (NaOH) and Sulphuric Acid (H2SO4) would be supplied to
the plant by tank lorry or other measures.
376. Noise Limits: Design guide and noise limits of different machineries are as follows:
Design guide:For each rotating equipment (used for normal operation)
Facilities and Zones Limit Level, dB(A)
For Process Compressor/ Turbine/Steam Turbine Generator 95 at one (1) m from source
For rotating machines other than Process Compressor,
Turbine, and Steam Turbine Generator 90 at one (1) m from source
For reformer (used for normal operation)
Facilities Limit Level, dB(A)
For Reformer 85 at one (1) m from source
For Plant Area (used for normal operation)
Facilities Limit Level, dB(A)
At plant boundary 75 at day time
70 at night time
5.6.4 Atmospheric Emissions
377. Air effluent emission control in principle shall be in accordance with, International
Finance Corporation (IFC), EHS Guidelines and The Environment Conservation Rules, 1997.
Substances in gaseous emission are listed below in Table 5.7:
Table 5.7: Comparison of Project air emissions with standards
Parameter Unit Emission Source
Effluent Limitation
as Design
Basis5
Bangladesh
Regulation6
EHS
Guidelines,
IFC 20077
Ammonia8 mg/Nm3 Granulation process unit
Vent Stack (Dry basis) 150 - 50
5Notes: At normal operation excluding ab-normal operating condition such as start-up,
Shut down or low load operation. 6As per "The Environment Conservation Rules, 1997, Schedule-12, (E) Boiler of Industrial Unit"
As per The Environment Conservation Rules, 1997, Schedule-12, (A) Fertilizer Plant" 7As per 'IFC EHS Guidelines, Air Emission Levels for Nitrogenous Fertilizers Manufacturing Plants"
8 Regarding ammonia emission from the Granulation stack, MHI has completed same size of urea fertilizer plant
in recent years as the following figures: (a) In Oman: 160mg/Nm3; (b) In Tatarstan: 160mg/Nm3; and In
Turkmenistan: 160mg/Nm3. In case that 50mg/Nm3 which is IFC standard is applied, an additional acid scrubbing
facility needs to be installed. An additional sulfuric acid line with its storage tank also needs to be installed and
supplied to acid scrubber. About 10-40% ammonium sulphate solution will be produced in the process as by-
product. Since ammonium sulphate solution cannot be treated in waste water treatment system, it shall be asked
3rd party company for treatment who can treat ammonium sulphate solution with the proper way such as
incinerator. In addition, high corrosion issues for equipment, piping and instruments should be occurred in case of
leakage troubles of ammonium sulphate solution. So, this acid scrubbing facility is not common facility in the world
at this moment. Please also note that IFC standard is not mandatory figure but desirable target. The recent fertilizer
Project Design and Description
119
NO2 mg/Nm3
Primary Reformer
Furnace (Dry basis) 300 (3 vol % 02) - 300
Auxiliary Boiler (Dry
basis) 150 (3 vol % 02) 150 300
Particulate
Substance mg/Nm3
Auxiliary Boiler (Dry
basis) 100 100 50
Particulate
Substance
(Urea Dust)
mg/Nm3
(Wet
bas is)
Granulator Vent Stack 50 150 50
Source: MHI (EPC Contractor)
5.7 Construction
378. Site Preparation: The major site preparation works are: (i) Filling of the existing lagoon
and the pond either by dredged earth from the Shitalakhya River or by carried earth from other
area;(ii) Removing and dumping of debris that will be generated due to dismantling of the
existing structures in proper place; and(iii) Piling of the area where required. In addition to
these, site preparation will also include a proper planning of drainage system to avoid any kind
of water logging.
5.7.1 Construction Labor Camp
379. Ghorasal is an industrial area located in Ghorasal Municipality. Many workers, skilled
or unskilled, from different parts of Bangladesh come to Ghorasal for work. They live in rented
houses on monthly basis locally available and work in the industries. Because of this, renting
out houses/rooms has become a lucrative additional source of monthly income of the local
people. During site visit and discussion with the local BCIC authority, it is learnt that the EPC
contractor will arrange accommodation facilities for about one-third of all workers (native and
expatriate) numbering about 1,700 with utility services (e.g. water, electricity and sanitation
facilities) inside the project boundary. In case of emergency, EPC Contractor can rent houses
around the project site.
5.8 Human Resources Required During Construction and Operation
380. The estimated number of workers required during (i) Demolition; (ii) Site Preparation;
(iii) Construction and (iv) Commissioning phases are as follows:
Demolition Phase: During demolition phase, EPC contractor is expected to have
manpower of around 400 at peak time, including unskilled, skilled, supervisors,
engineers, management staffs, etc. Among the manpower, expatriate employees
will be around 60.
Site Preparation Phase: During site preparation, EPC contractor is expected to
have manpower of around 600 at peak, including unskilled, skilled, supervisors,
engineers, management staffs, etc. Among the manpower, expatriate employees
will be around 100.
Construction Phase: During construction, EPC contractor is expected to have
manpower of around 4,000 at peak, including unskilled, skilled, supervisors,
plants which MHI has completed in Turkmenistan, Tatarstan, Oman, Malaysia and Algeria do not have this acid
scrubbing facility due to above reason. And Turkmenistan and Tatarstan projects were financed by JBIC/NEXI
same as well this GPUFP project.
Project Design and Description
120
designers, engineers, management staffs, etc. Among the manpower, expatriate
employees will be around 1,500 and MHI employees will be around 30.
Commissioning Phase: During commissioning, EPC Contractor will employ 2,700
persons as expected peak number. Among the manpower, expatriate employees
will be around 600, MHI employees will be around 100 and the rest will be local.
5.9 Emission Monitoring System
381. The flue gas emission will be collected at different points (e.g., stack) in every hour by
maintaining standard sampling procedure. The collected sample will be analysed in the
chemical analytical laboratory for knowing the emission status of NOx, PM10 and NH3 in
particular and compare with the Bangladesh Standard as well as the IFC Standard. Analyzed
result will be distributed to all of the plant managers for taking necessary action if exceedance
is found.
5.10 Environmental Quality Monitoring System
382. The Proponent is suggested to install two temporary portable ambient air quality
monitoring stations (to monitor NOx, PM10 and NH3) are recommended in the Project impact
area. The locations of the stations will be based on the dispersion modeling output of maximum
ground level concentrations in downwind directions. Noise level will be monitored at the
sensitive locations in order to comply with the ECR Compliance Standard. Continuous
Monitoring System for water quality monitoring should be installed at the discharge point of
WWTS/ETP. The monitoring parameters would be as per Schedule 12 of ECR, 1997 and
applicable IFC, 2007 Guidelines for the fertilizer factories.
121
6. Description of Baseline Environment
6.1 Introduction
383. The baseline condition has been defined considering the environmental perspective
where the environmental sector has been differentiated into three types and these are:
Physical Environment, Biological Environment and Social Environment. The Physical
environment consists with meteorological, hydrological, topological, geological components
and processes, hazards, land use and land cover pattern, water resources and land
resources. The Biological environment includes agricultural resources, livestock resources,
fisheries resources and ecosystems with aquatic and terrestrial flora and fauna. The social
environment includes gender, cultural activities, economic status, livelihoodsetc. of the
people residing in the study area. The study area has been delineated as 10 km radius area
from the center of the proposed Project site. Both primary and secondary data were used to
delineate the baseline condition.
6.2 Physical Environment
6.2.1 Land Resources
Agro-ecological Zones (AEZs)
384. The study area has fallen into two agro-ecological zones (AEZs), namely: i) Old
Brahmaputra Floodplain (AEZ-9) and Madhupur Tract (AEZ-28) (FAO/UNDP 1988 and
BARC; 2012). The study area belongs to 61% Old Brahmaputra Floodplain (AEZ-9) and 39%
Madhupur Tract (AEZ-28). The distribution of AEZs in the study area is shown in Figure 6.1.
Land Use and Land Cover
385. Thestudy area of the proposed Project is considered 10 km radius from the project
site. The project area is about 45 hectare (ha) having old buildings and a large open space
with vegetation cover ranges from herbs to big trees. Possession of such vegetation leading
the Project site as ecologically dominant area. The land use of the total study area is 31,457
ha of which agriculture land is14,134 ha. The remaining areas are covered by Rural
settlements including homestead, Water bodies including Rivers, Khals, Beels, Ponds, Fresh
Water Aquaculture; Orchards and forest and Others (Brickfield, Dump sites/Extraction sites,
Built-up-Non-Linear). Detailed land use of the study area is presented in Figure 6.2and land
cover areas of such land uses are presented inclusters in Table 6.1.
Table 6.1: Present land cover areas of the study area by land use cluster
Land Use Cluster Land Cover
Area (ha) Percent (%) of
Gross Area
Agriculture Land 14,134 45
Rural Settlements 12,958 41
Water Bodies (Rivers, Khals, Beels/Haors, Ponds, Fresh Water Aquaculture) 2,257 7
Orchards and Forest 276 1
Others (Brickfield, Dump sites/ Extraction sites, Build-Up-Non-Linear) 1,545 5
Road 286 1
Total/Gross 31,457 100
Source: Image analysis done by CEGIS, 2018

Description of Baseline Environment
122
Figure 6.1: AEZ of the study area

Description of Baseline Environment
123
Figure 6.2: Land use mapof the study area
Description of Baseline Environment
124
Soil Texture
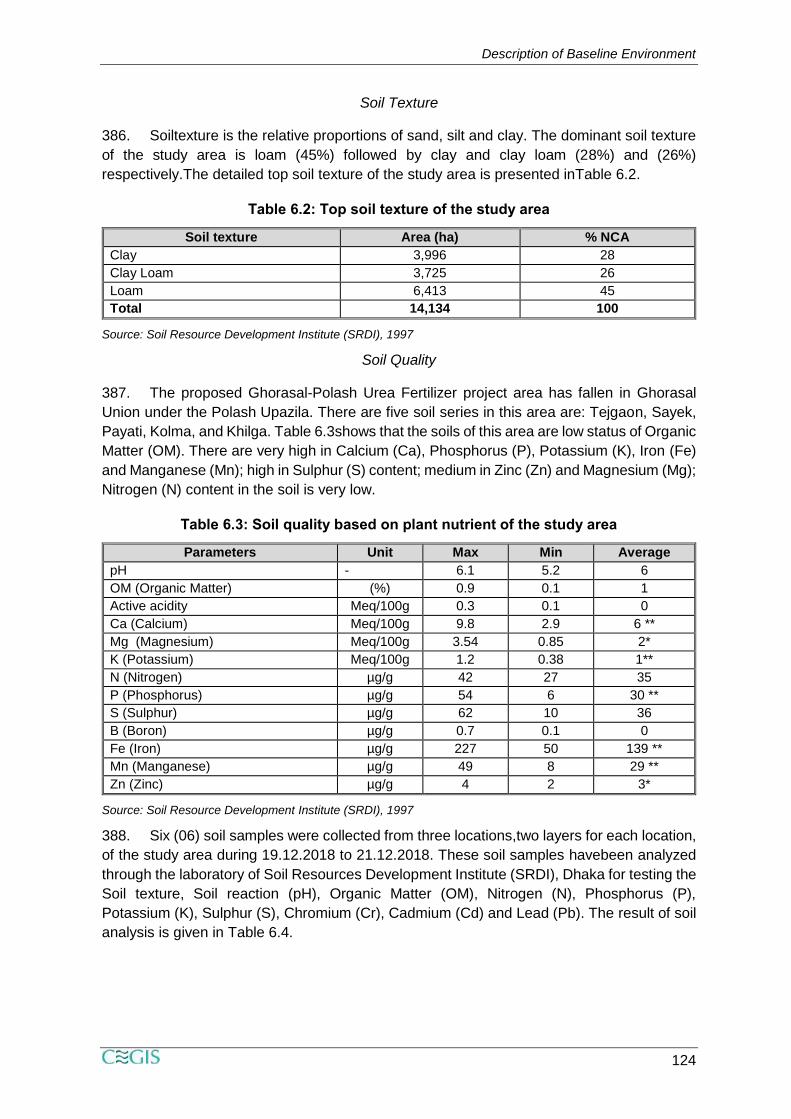
386. Soiltexture is the relative proportions of sand, silt and clay. The dominant soil texture
of the study area is loam (45%) followed by clay and clay loam (28%) and (26%)
respectively.The detailed top soil texture of the study area is presented inTable 6.2.
Table 6.2: Top soil texture of the study area
Soil texture Area (ha) % NCA
Clay 3,996 28
Clay Loam 3,725 26
Loam 6,413 45
Total 14,134 100
Source: Soil Resource Development Institute (SRDI), 1997
Soil Quality
387. The proposed Ghorasal-Polash Urea Fertilizer project area has fallen in Ghorasal
Union under the Polash Upazila. There are five soil series in this area are: Tejgaon, Sayek,
Payati, Kolma, and Khilga. Table 6.3shows that the soils of this area are low status of Organic
Matter (OM). There are very high in Calcium (Ca), Phosphorus (P), Potassium (K), Iron (Fe)
and Manganese (Mn); high in Sulphur (S) content; medium in Zinc (Zn) and Magnesium (Mg);
Nitrogen (N) content in the soil is very low.
Table 6.3: Soil quality based on plant nutrient of the study area
Parameters Unit Max Min Average
pH - 6.1 5.2 6
OM (Organic Matter) (%) 0.9 0.1 1
Active acidity Meq/100g 0.3 0.1 0
Ca (Calcium) Meq/100g 9.8 2.9 6 **
Mg (Magnesium) Meq/100g 3.54 0.85 2*
K (Potassium) Meq/100g 1.2 0.38 1**
N (Nitrogen) µg/g 42 27 35
P (Phosphorus) µg/g 54 6 30 **
S (Sulphur) µg/g 62 10 36
B (Boron) µg/g 0.7 0.1 0
Fe (Iron) µg/g 227 50 139 **
Mn (Manganese) µg/g 49 8 29 **
Zn (Zinc) µg/g 4 2 3*
Source: Soil Resource Development Institute (SRDI), 1997
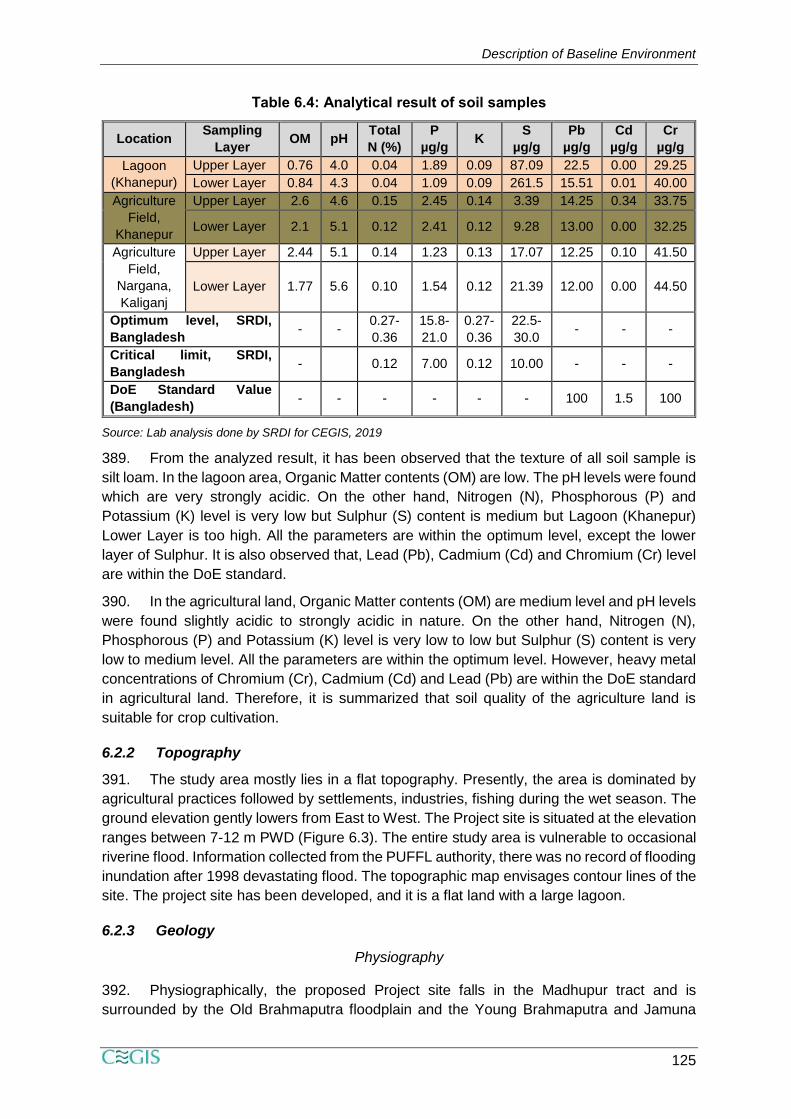
388. Six (06) soil samples were collected from three locations,two layers for each location,
of the study area during 19.12.2018 to 21.12.2018. These soil samples havebeen analyzed
through the laboratory of Soil Resources Development Institute (SRDI), Dhaka for testing the
Soil texture, Soil reaction (pH), Organic Matter (OM), Nitrogen (N), Phosphorus (P),
Potassium (K), Sulphur (S), Chromium (Cr), Cadmium (Cd) and Lead (Pb). The result of soil
analysis is given in Table 6.4.
Description of Baseline Environment
125
Table 6.4: Analytical result of soil samples
Location Sampling
Layer OM pH
Total
N (%)
P
µg/g K
S
µg/g
Pb
µg/g
Cd
µg/g
Cr
µg/g
Lagoon
(Khanepur)
Upper Layer 0.76 4.0 0.04 1.89 0.09 87.09 22.5 0.00 29.25
Lower Layer 0.84 4.3 0.04 1.09 0.09 261.5 15.51 0.01 40.00
Agriculture
Field,
Khanepur
Upper Layer 2.6 4.6 0.15 2.45 0.14 3.39 14.25 0.34 33.75
Lower Layer 2.1 5.1 0.12 2.41 0.12 9.28 13.00 0.00 32.25
Agriculture
Field,
Nargana,
Kaliganj
Upper Layer 2.44 5.1 0.14 1.23 0.13 17.07 12.25 0.10 41.50
Lower Layer 1.77 5.6 0.10 1.54 0.12 21.39 12.00 0.00 44.50
Optimum level, SRDI,
Bangladesh - -
0.27-
0.36
15.8-
21.0
0.27-
0.36
22.5-
30.0 - - -
Critical limit, SRDI,
Bangladesh - 0.12 7.00 0.12 10.00 - - -
DoE Standard Value
(Bangladesh) - - - - - - 100 1.5 100
Source: Lab analysis done by SRDI for CEGIS, 2019
389. From the analyzed result, it has been observed that the texture of all soil sample is
silt loam. In the lagoon area, Organic Matter contents (OM) are low. The pH levels were found
which are very strongly acidic. On the other hand, Nitrogen (N), Phosphorous (P) and
Potassium (K) level is very low but Sulphur (S) content is medium but Lagoon (Khanepur)
Lower Layer is too high. All the parameters are within the optimum level, except the lower
layer of Sulphur. It is also observed that, Lead (Pb), Cadmium (Cd) and Chromium (Cr) level
are within the DoE standard.
390. In the agricultural land, Organic Matter contents (OM) are medium level and pH levels
were found slightly acidic to strongly acidic in nature. On the other hand, Nitrogen (N),
Phosphorous (P) and Potassium (K) level is very low to low but Sulphur (S) content is very
low to medium level. All the parameters are within the optimum level. However, heavy metal
concentrations of Chromium (Cr), Cadmium (Cd) and Lead (Pb) are within the DoE standard
in agricultural land. Therefore, it is summarized that soil quality of the agriculture land is
suitable for crop cultivation.
6.2.2 Topography
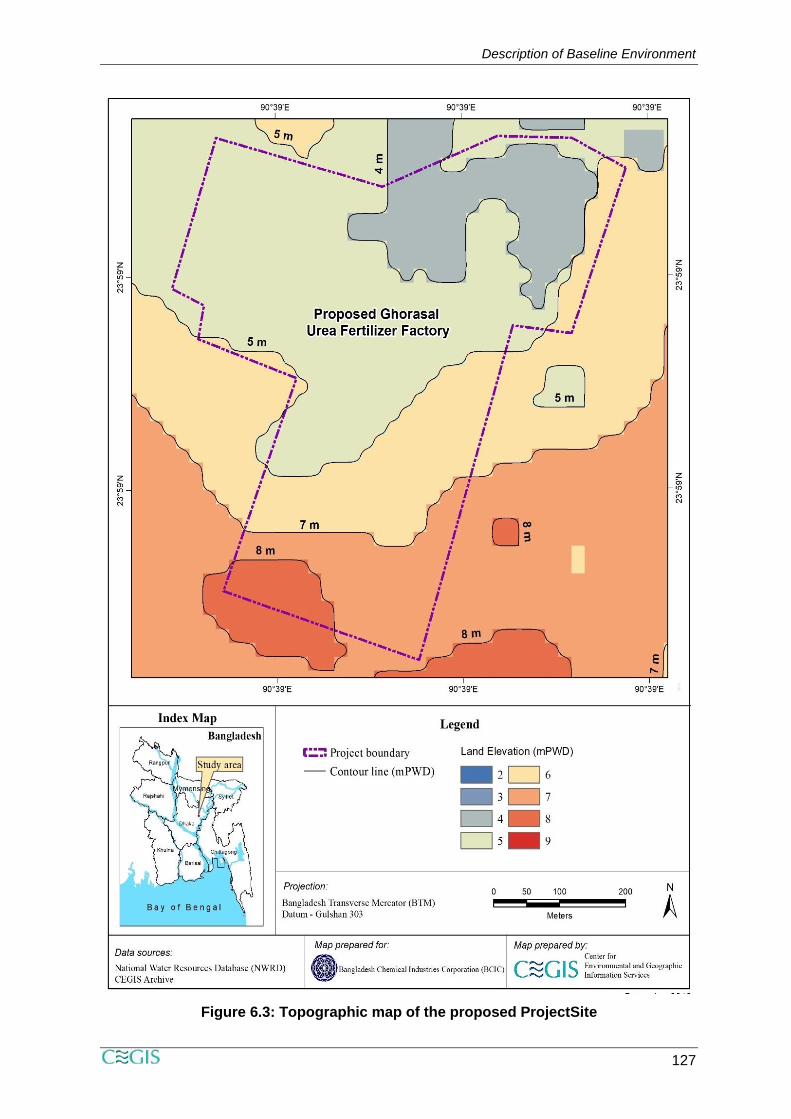
391. The study area mostly lies in a flat topography. Presently, the area is dominated by
agricultural practices followed by settlements, industries, fishing during the wet season. The
ground elevation gently lowers from East to West. The Project site is situated at the elevation
ranges between 7-12 m PWD (Figure 6.3). The entire study area is vulnerable to occasional
riverine flood. Information collected from the PUFFL authority, there was no record of flooding
inundation after 1998 devastating flood. The topographic map envisages contour lines of the
site. The project site has been developed, and it is a flat land with a large lagoon.
6.2.3 Geology
Physiography
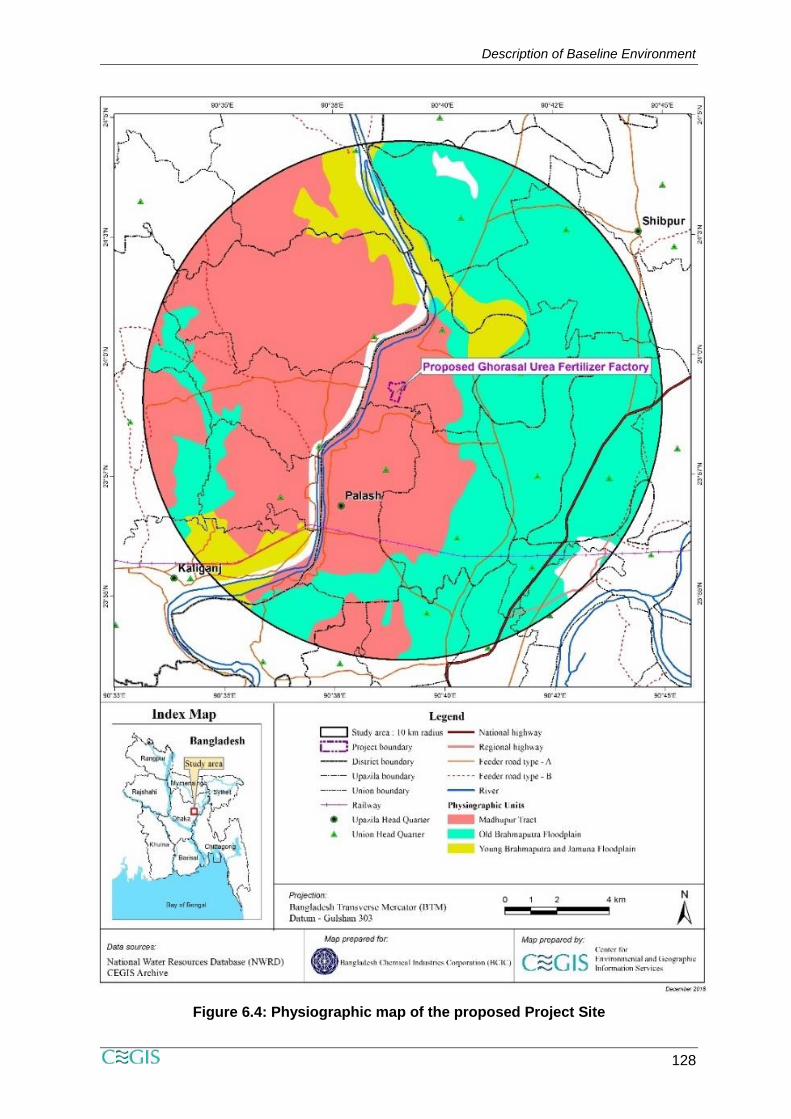
392. Physiographically, the proposed Project site falls in the Madhupur tract and is
surrounded by the Old Brahmaputra floodplain and the Young Brahmaputra and Jamuna

Description of Baseline Environment
126
floodplain (Figure 6.4). The area is located in the central part of the Bengal basin– an
extensive alluvial plain of the quaternary sediments laid down by the Ganges-Brahmaputra-
Meghna river system.
393. The surface of the area is covered by paludal deposit. The thickness of this section
ranges from seven (07) to nine (09) meters. It is composed of Holocene river alluvium,
meander, inter-stream, swamp deposit, marsh clay and peat. Immediate below this section
underlies 16,000 m thick sequence of quaternary sediments. Lithology shows that the area
comprises of alternation of sand/silt and clay sequences.
Description of Baseline Environment
127
Figure 6.3: Topographic map of the proposed ProjectSite
Description of Baseline Environment
128
Figure 6.4: Physiographic map of the proposed Project Site
Description of Baseline Environment
129
Surface Geology
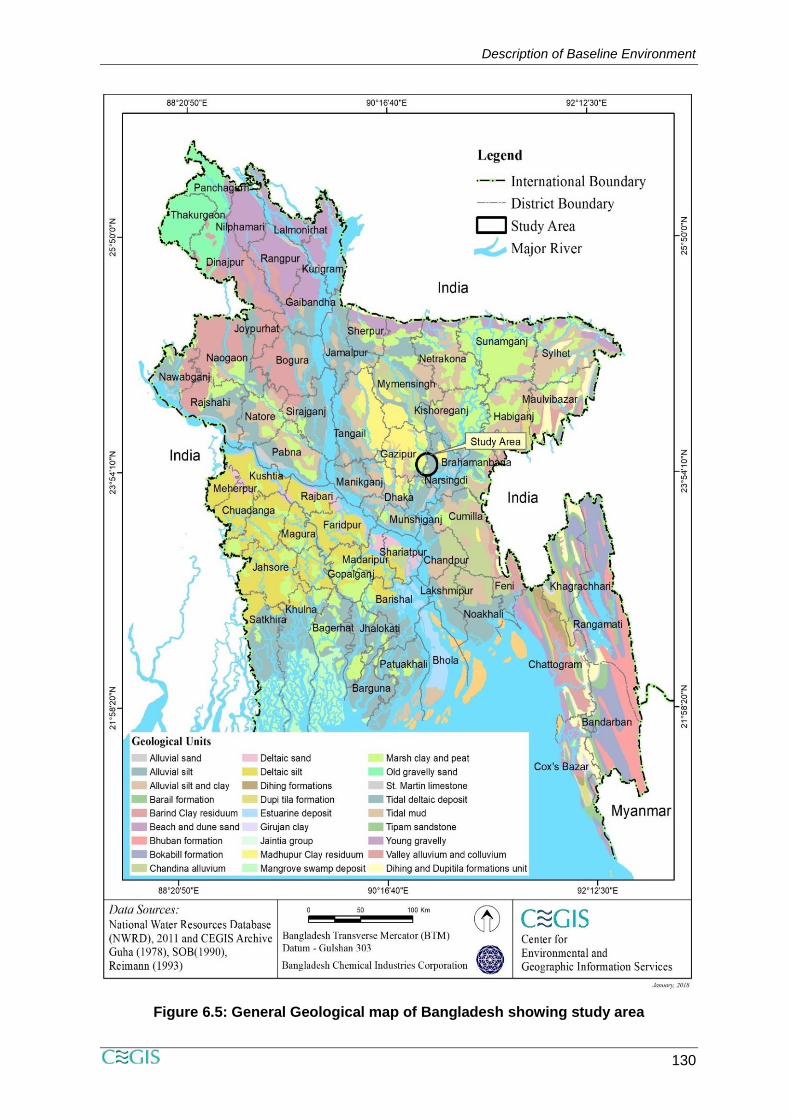
394. The proposed Project site is situated on the Madhupur Tract (Figure 6.5). The surface
is mostly covered with brown mottled clay,but sometimes covered with recent alluvium. The
thickness of the Madhupur clay is seven to nine (07-09) meters thick. Below this layer, there
is about 10,000 meters thick Tertiary sediment.
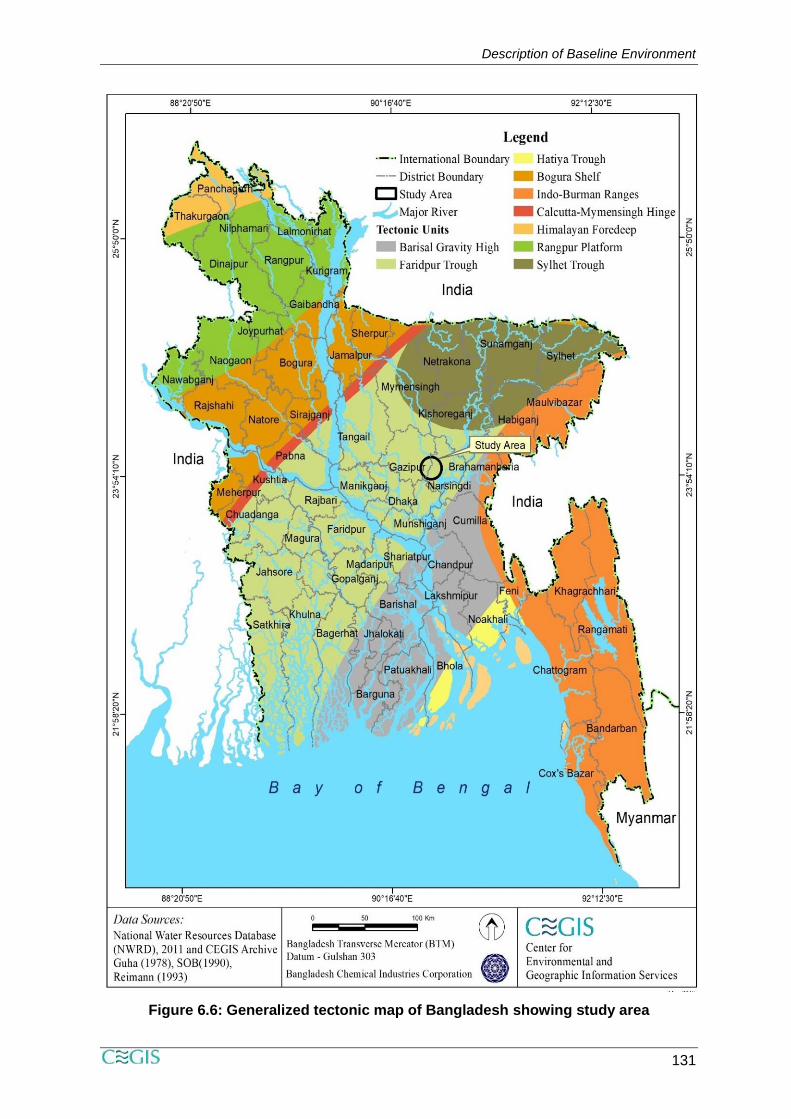
395. As per tectonic classification, the project area falls under Madhupur Tripura threshold
of eastern platform flank of the Bengal basin. Tectonically this area is inactive and no
apparent major structure like fault or fold exists in the region that might be geologically
significant (Figure 6.6).
Description of Baseline Environment
130
Figure 6.5: General Geological map of Bangladesh showing study area
Description of Baseline Environment
131
Figure 6.6: Generalized tectonic map of Bangladesh showing study area
Description of Baseline Environment
132
6.2.4 Seismicity
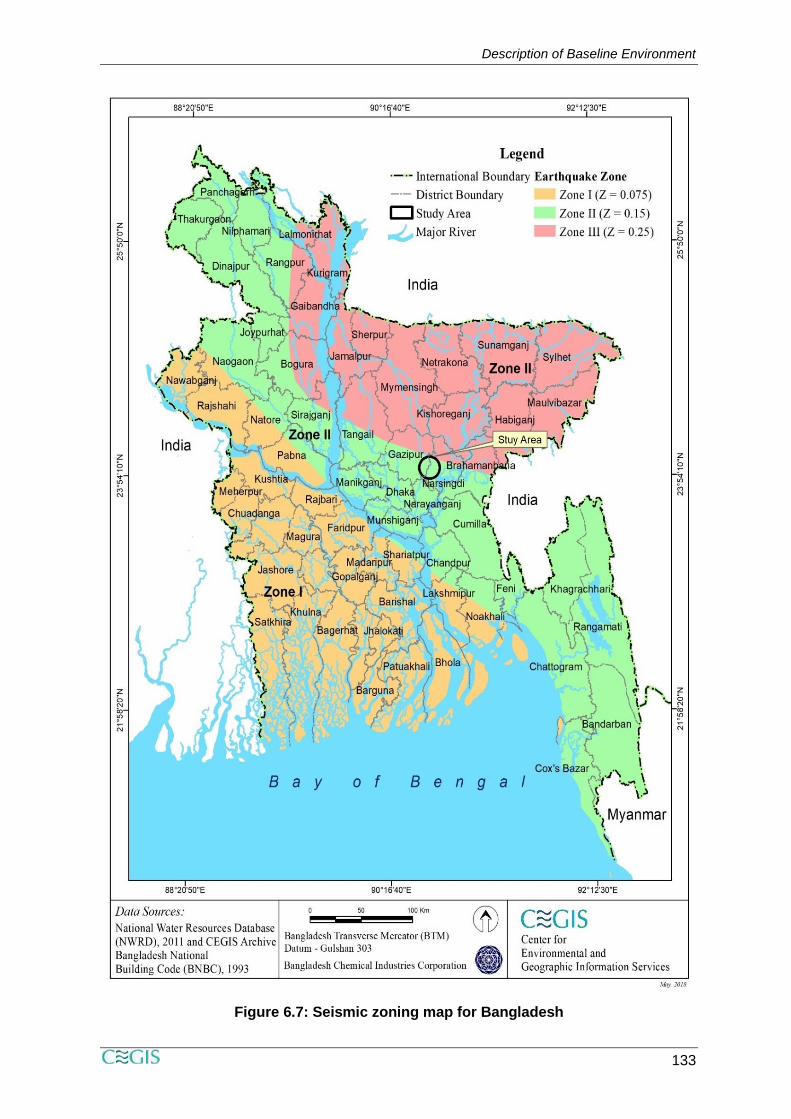
396. Seismically Bangladesh is been divided into three zones. The country is divided into
three seismic zones with zone coefficient Z equal to 0.075 (Zone 1), 0.15 (Zone 2), and 0.25
(Zone 3) g (acceleration due to gravity) (BNBC Map 1993).
397. The proposed GUFFP falls under zone-2 (Figure 6.7). This zone has the mediocre
vulnerability for earthquake in Bangladesh with a risk of possible earthquake of magnitude 6
(on Richter scale).
Description of Baseline Environment
133
Figure 6.7: Seismic zoning map for Bangladesh
Description of Baseline Environment
134
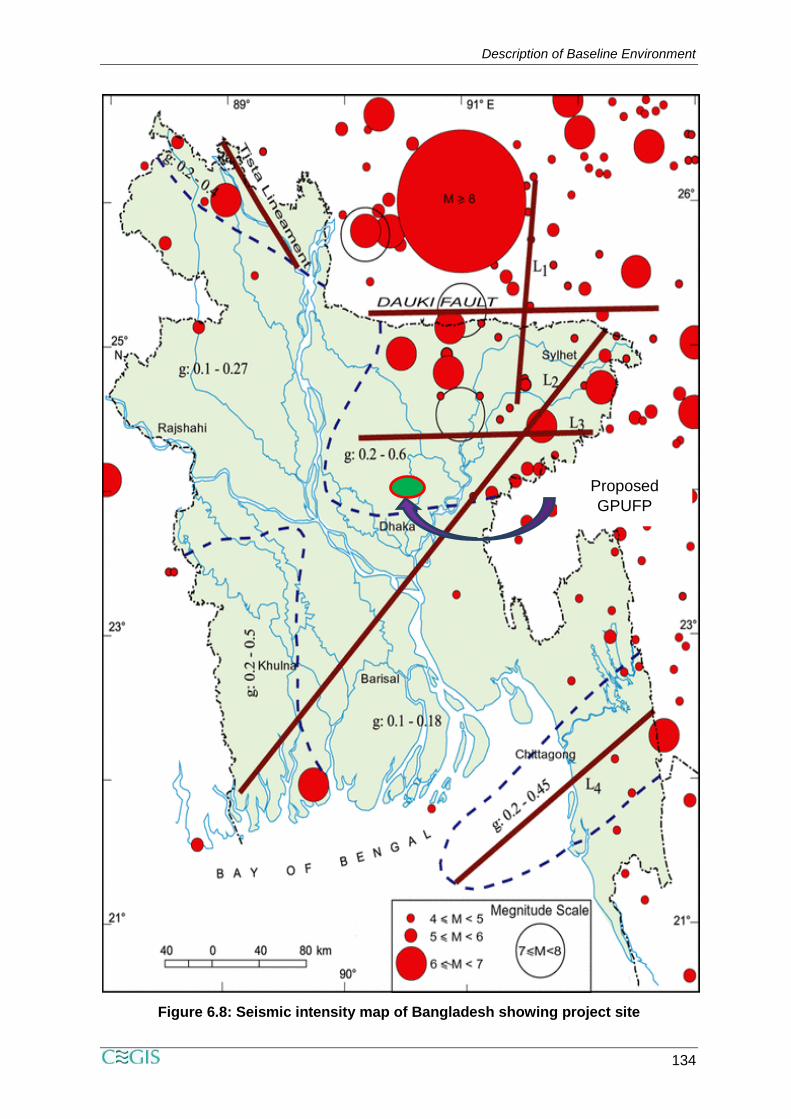
Figure 6.8: Seismic intensity map of Bangladesh showing project site
Proposed
GPUFP
Description of Baseline Environment
135
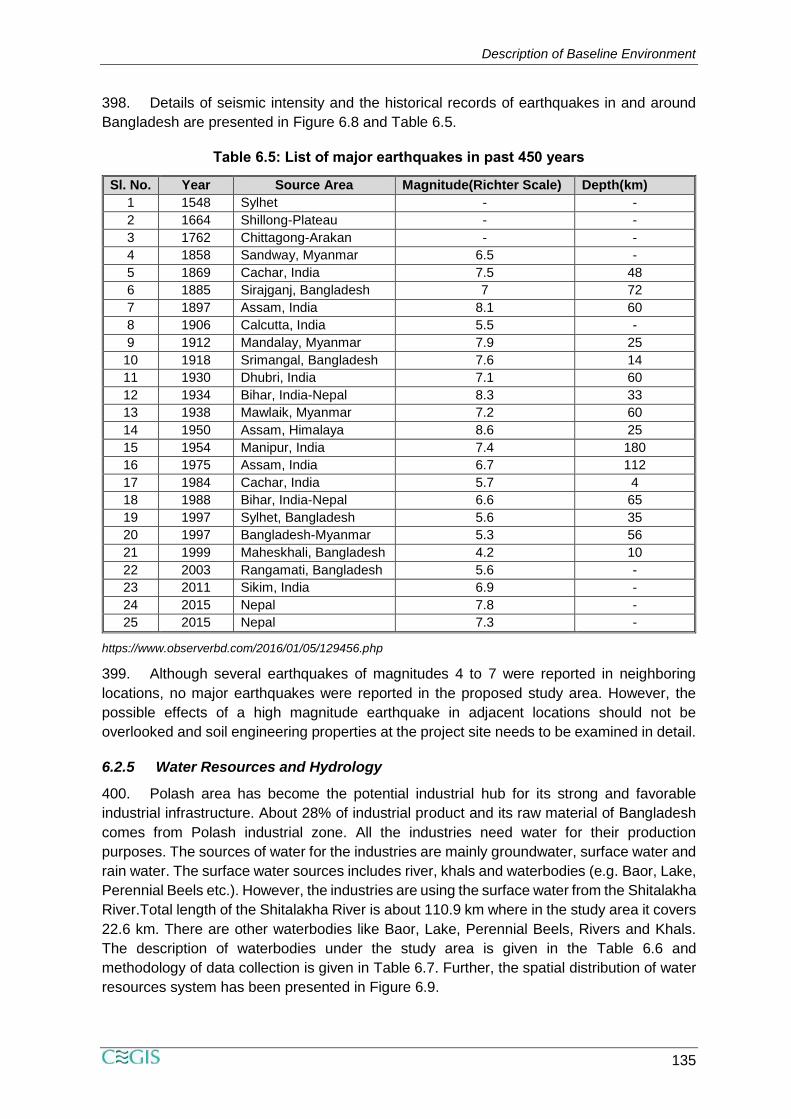
398. Details of seismic intensity and the historical records of earthquakes in and around
Bangladesh are presented in Figure 6.8 and Table 6.5.
Table 6.5: List of major earthquakes in past 450 years
Sl. No. Year Source Area Magnitude(Richter Scale) Depth(km)
1 1548 Sylhet - -
2 1664 Shillong-Plateau - -
3 1762 Chittagong-Arakan - -
4 1858 Sandway, Myanmar 6.5 -
5 1869 Cachar, India 7.5 48
6 1885 Sirajganj, Bangladesh 7 72
7 1897 Assam, India 8.1 60
8 1906 Calcutta, India 5.5 -
9 1912 Mandalay, Myanmar 7.9 25
10 1918 Srimangal, Bangladesh 7.6 14
11 1930 Dhubri, India 7.1 60
12 1934 Bihar, India-Nepal 8.3 33
13 1938 Mawlaik, Myanmar 7.2 60
14 1950 Assam, Himalaya 8.6 25
15 1954 Manipur, India 7.4 180
16 1975 Assam, India 6.7 112
17 1984 Cachar, India 5.7 4
18 1988 Bihar, India-Nepal 6.6 65
19 1997 Sylhet, Bangladesh 5.6 35
20 1997 Bangladesh-Myanmar 5.3 56
21 1999 Maheskhali, Bangladesh 4.2 10
22 2003 Rangamati, Bangladesh 5.6 -
23 2011 Sikim, India 6.9 -
24 2015 Nepal 7.8 -
25 2015 Nepal 7.3 -
https://www.observerbd.com/2016/01/05/129456.php
399. Although several earthquakes of magnitudes 4 to 7 were reported in neighboring
locations, no major earthquakes were reported in the proposed study area. However, the
possible effects of a high magnitude earthquake in adjacent locations should not be
overlooked and soil engineering properties at the project site needs to be examined in detail.
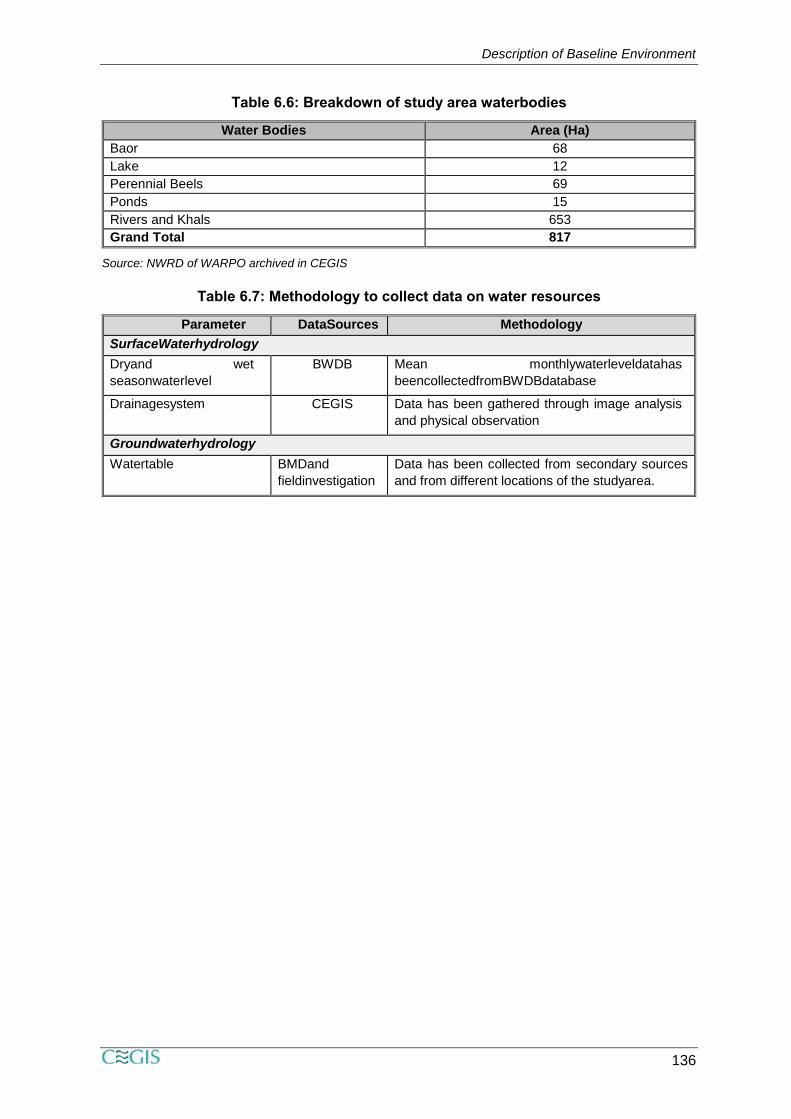
6.2.5 Water Resources and Hydrology
400. Polash area has become the potential industrial hub for its strong and favorable
industrial infrastructure. About 28% of industrial product and its raw material of Bangladesh
comes from Polash industrial zone. All the industries need water for their production
purposes. The sources of water for the industries are mainly groundwater, surface water and
rain water. The surface water sources includes river, khals and waterbodies (e.g. Baor, Lake,
Perennial Beels etc.). However, the industries are using the surface water from the Shitalakha
River.Total length of the Shitalakha River is about 110.9 km where in the study area it covers
22.6 km. There are other waterbodies like Baor, Lake, Perennial Beels, Rivers and Khals.
The description of waterbodies under the study area is given in the Table 6.6 and
methodology of data collection is given in Table 6.7. Further, the spatial distribution of water
resources system has been presented in Figure 6.9.
Description of Baseline Environment
136
Table 6.6: Breakdown of study area waterbodies
Water Bodies Area (Ha)
Baor 68
Lake 12
Perennial Beels 69
Ponds 15
Rivers and Khals 653
Grand Total 817
Source: NWRD of WARPO archived in CEGIS
Table 6.7: Methodology to collect data on water resources
Parameter DataSources Methodology
SurfaceWaterhydrology
Dryand wet
seasonwaterlevel
BWDB Mean monthlywaterleveldatahas
beencollectedfromBWDBdatabase
Drainagesystem CEGIS Data has been gathered through image analysis
and physical observation
Groundwaterhydrology
Watertable BMDand
fieldinvestigation
Data has been collected from secondary sources
and from different locations of the studyarea.
Description of Baseline Environment
137
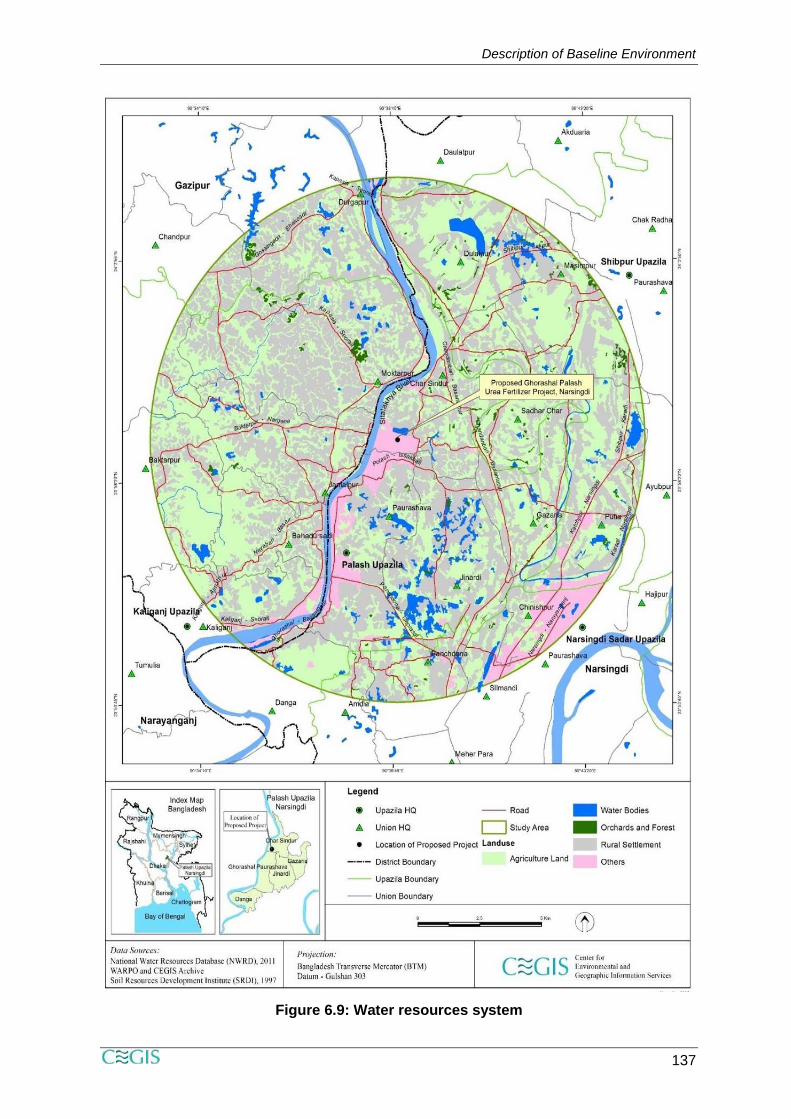
Figure 6.9: Water resources system
Description of Baseline Environment
138
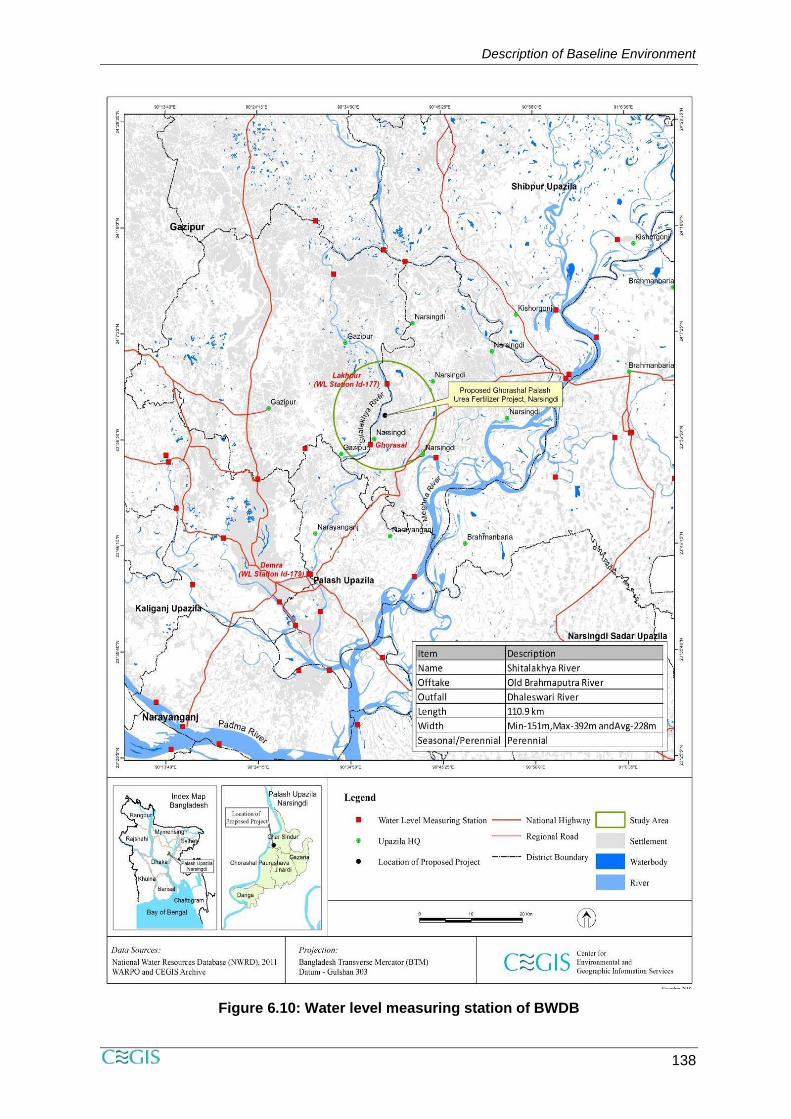
Figure 6.10: Water level measuring station of BWDB
Description of Baseline Environment
139
Surface Water Resources
401. The Shitalakhya River flows in close proximity of the proposed site of the project, is a
distributary of the Old Brahmaputra River (Figure 6.9). It receives fresh water flow from the
Old Brahmaputra and the Lower Banar River. The off-take of the Shitalakhya River is Old
Brahmaputra River at Monohordi Upazila under Narsingdi district and drains into the
Dhaleswari River in Narayanganj district. Due to the desertion of the original link to the Old
Brahmaputra River, the Shitalakhya River receives most of its freshwater flow presently
through the Lower Banar River as shown in Figure 6.9. The relatively inert geo-morphological
characteristics of the Shitalakhya River ensures fairly suitable water depths for navigation,
throughout the year.
Surface Water System
402. The Shitalakhyais a tidal river and the maximum average variation of water level is 20
cm between high tide and low tide. The river is perennial in nature and BWDB data reveal
that the average lowest discharge is during dry season (January) with a flow of 83 m3/s and
the average lowest water level during low tide is 0.94 mPWD close to the study area (Time
series data analysis: 1981-2017). The average highest flow is observed during the rainy
season (Jul- Sept) and varies from 1,181 m3/s to 1,066 m3/s and the average maximum water
level during the high tide is 6.62 mPWD. There is no other significant surface water system
found around the project area except the Shitalakhya River.
403. The river inundates nearby agricultural lands during monsoon and remains navigable
round the year. The tendency of the river erosion is very low. Based on water availability and
navigation facilities, a large number of industries were established along its banks both up
and downstream. Bangladesh Inland Water Transport Authority (BIWTA) declared this river
as a class III route of Bangladesh asthe relatively inert geo-morphological characteristics of
the Shitalakhya River guarantee fairly suitable water depths for navigation, throughout the
year.
Water Balance during Base Condition (1981-2017)
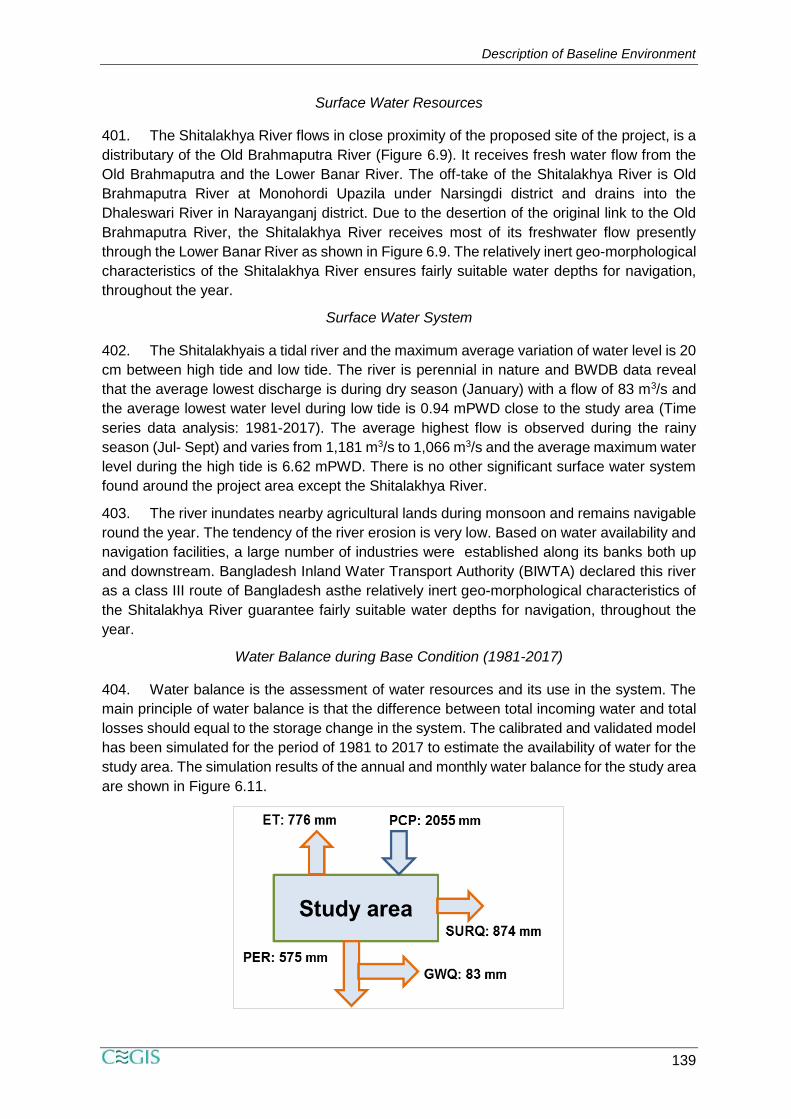
404. Water balance is the assessment of water resources and its use in the system. The
main principle of water balance is that the difference between total incoming water and total
losses should equal to the storage change in the system. The calibrated and validated model
has been simulated for the period of 1981 to 2017 to estimate the availability of water for the
study area. The simulation results of the annual and monthly water balance for the study area
are shown in Figure 6.11.
Description of Baseline Environment
140
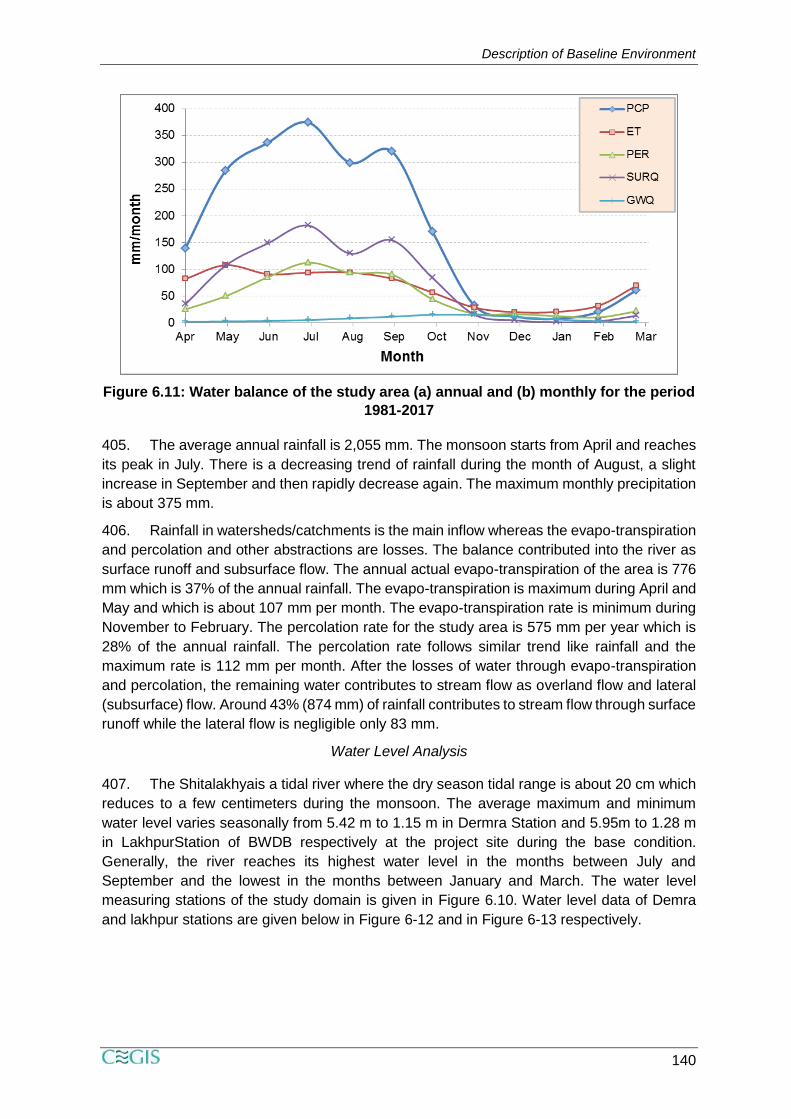
Figure 6.11: Water balance of the study area (a) annual and (b) monthly for the period
1981-2017
405. The average annual rainfall is 2,055 mm. The monsoon starts from April and reaches
its peak in July. There is a decreasing trend of rainfall during the month of August, a slight
increase in September and then rapidly decrease again. The maximum monthly precipitation
is about 375 mm.
406. Rainfall in watersheds/catchments is the main inflow whereas the evapo-transpiration
and percolation and other abstractions are losses. The balance contributed into the river as
surface runoff and subsurface flow. The annual actual evapo-transpiration of the area is 776
mm which is 37% of the annual rainfall. The evapo-transpiration is maximum during April and
May and which is about 107 mm per month. The evapo-transpiration rate is minimum during
November to February. The percolation rate for the study area is 575 mm per year which is
28% of the annual rainfall. The percolation rate follows similar trend like rainfall and the
maximum rate is 112 mm per month. After the losses of water through evapo-transpiration
and percolation, the remaining water contributes to stream flow as overland flow and lateral
(subsurface) flow. Around 43% (874 mm) of rainfall contributes to stream flow through surface
runoff while the lateral flow is negligible only 83 mm.
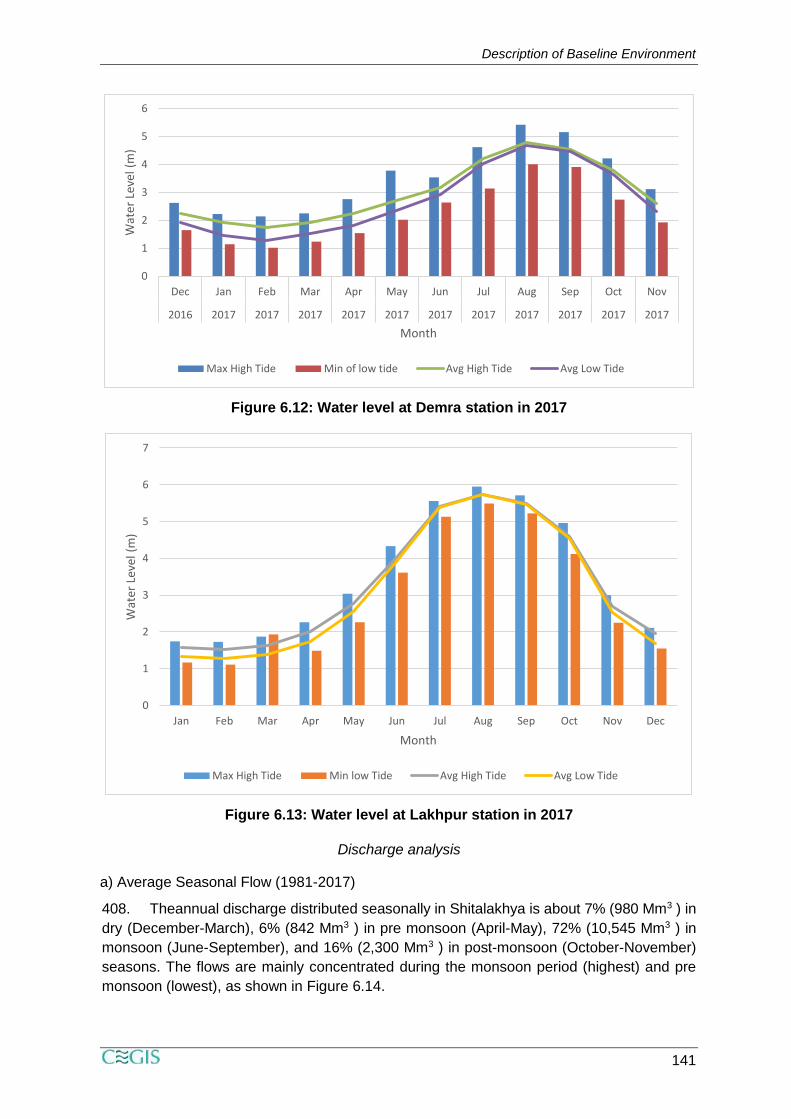
Water Level Analysis
407. The Shitalakhyais a tidal river where the dry season tidal range is about 20 cm which
reduces to a few centimeters during the monsoon. The average maximum and minimum
water level varies seasonally from 5.42 m to 1.15 m in Dermra Station and 5.95m to 1.28 m
in LakhpurStation of BWDB respectively at the project site during the base condition.
Generally, the river reaches its highest water level in the months between July and
September and the lowest in the months between January and March. The water level
measuring stations of the study domain is given in Figure 6.10. Water level data of Demra
and lakhpur stations are given below in Figure 6-12 and in Figure 6-13 respectively.
Description of Baseline Environment
141
Figure 6.12: Water level at Demra station in 2017
Figure 6.13: Water level at Lakhpur station in 2017
Discharge analysis
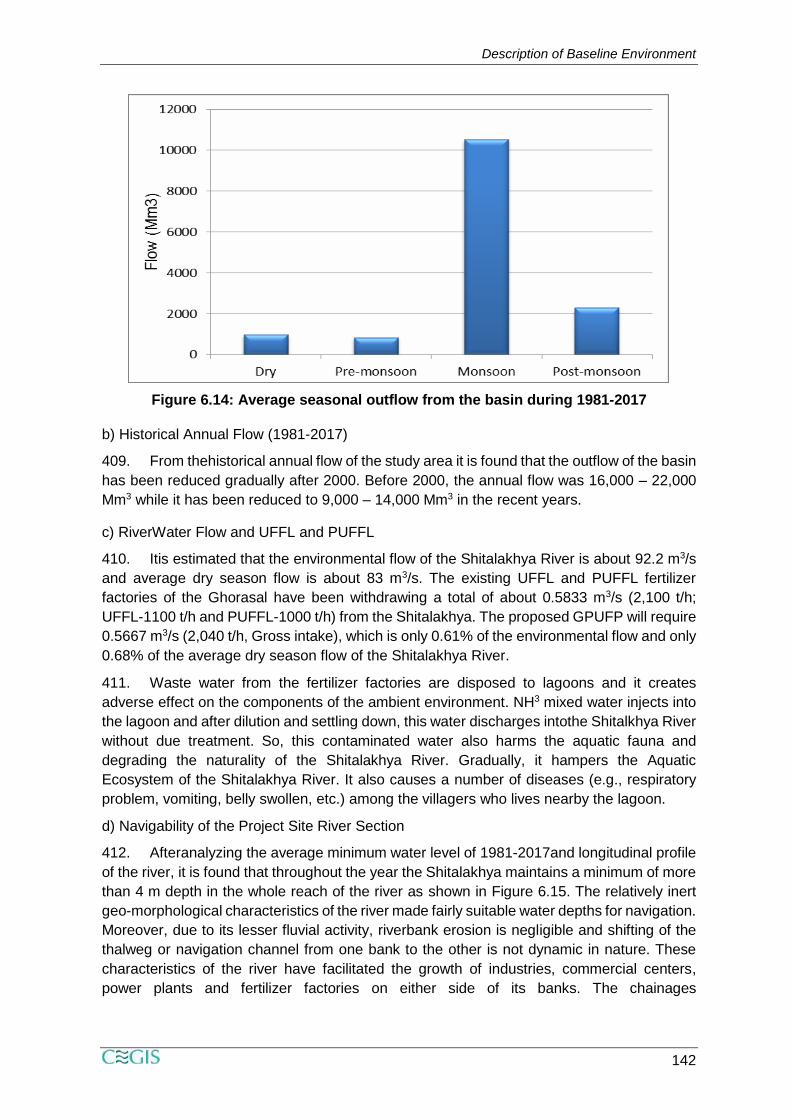
a) Average Seasonal Flow (1981-2017)
408. Theannual discharge distributed seasonally in Shitalakhya is about 7% (980 Mm3 ) in
dry (December-March), 6% (842 Mm3 ) in pre monsoon (April-May), 72% (10,545 Mm3 ) in
monsoon (June-September), and 16% (2,300 Mm3 ) in post-monsoon (October-November)
seasons. The flows are mainly concentrated during the monsoon period (highest) and pre
monsoon (lowest), as shown in Figure 6.14.
0
1
2
3
4
5
6
Dec Jan Feb Mar Apr May Jun Jul Aug Sep Oct Nov
2016 2017 2017 2017 2017 2017 2017 2017 2017 2017 2017 2017
Wat
er L
evel
(m
)
Month
Max High Tide Min of low tide Avg High Tide Avg Low Tide
0
1
2
3
4
5
6
7
Jan Feb Mar Apr May Jun Jul Aug Sep Oct Nov Dec
Wat
er L
evel
(m
)
Month
Max High Tide Min low Tide Avg High Tide Avg Low Tide
Description of Baseline Environment
142
Figure 6.14: Average seasonal outflow from the basin during 1981-2017
b) Historical Annual Flow (1981-2017)
409. From thehistorical annual flow of the study area it is found that the outflow of the basin
has been reduced gradually after 2000. Before 2000, the annual flow was 16,000 – 22,000
Mm3 while it has been reduced to 9,000 – 14,000 Mm3 in the recent years.
c) RiverWater Flow and UFFL and PUFFL
410. Itis estimated that the environmental flow of the Shitalakhya River is about 92.2 m3/s
and average dry season flow is about 83 m3/s. The existing UFFL and PUFFL fertilizer
factories of the Ghorasal have been withdrawing a total of about 0.5833 m3/s (2,100 t/h;
UFFL-1100 t/h and PUFFL-1000 t/h) from the Shitalakhya. The proposed GPUFP will require
0.5667 m3/s (2,040 t/h, Gross intake), which is only 0.61% of the environmental flow and only
0.68% of the average dry season flow of the Shitalakhya River.
411. Waste water from the fertilizer factories are disposed to lagoons and it creates
adverse effect on the components of the ambient environment. NH3 mixed water injects into
the lagoon and after dilution and settling down, this water discharges intothe Shitalkhya River
without due treatment. So, this contaminated water also harms the aquatic fauna and
degrading the naturality of the Shitalakhya River. Gradually, it hampers the Aquatic
Ecosystem of the Shitalakhya River. It also causes a number of diseases (e.g., respiratory
problem, vomiting, belly swollen, etc.) among the villagers who lives nearby the lagoon.
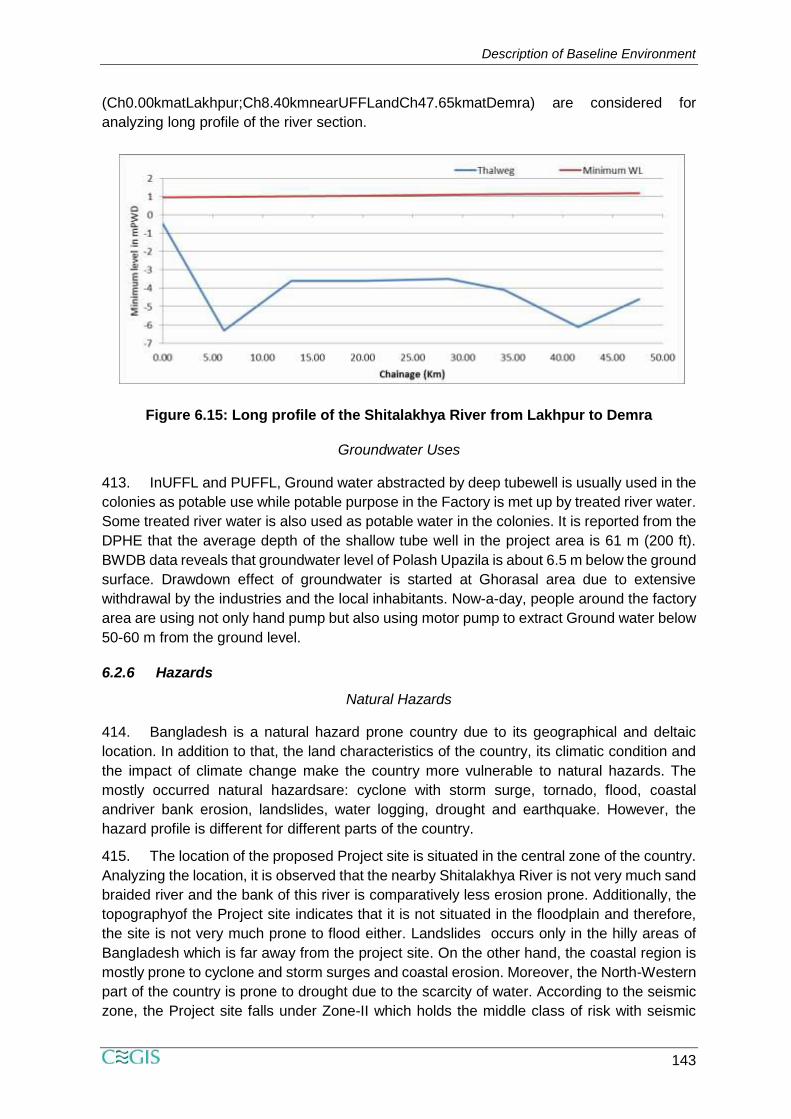
d) Navigability of the Project Site River Section
412. Afteranalyzing the average minimum water level of 1981-2017and longitudinal profile
of the river, it is found that throughout the year the Shitalakhya maintains a minimum of more
than 4 m depth in the whole reach of the river as shown in Figure 6.15. The relatively inert
geo-morphological characteristics of the river made fairly suitable water depths for navigation.
Moreover, due to its lesser fluvial activity, riverbank erosion is negligible and shifting of the
thalweg or navigation channel from one bank to the other is not dynamic in nature. These
characteristics of the river have facilitated the growth of industries, commercial centers,
power plants and fertilizer factories on either side of its banks. The chainages
Description of Baseline Environment
143
(Ch0.00kmatLakhpur;Ch8.40kmnearUFFLandCh47.65kmatDemra) are considered for
analyzing long profile of the river section.
Figure 6.15: Long profile of the Shitalakhya River from Lakhpur to Demra
Groundwater Uses
413. InUFFL and PUFFL, Ground water abstracted by deep tubewell is usually used in the
colonies as potable use while potable purpose in the Factory is met up by treated river water.
Some treated river water is also used as potable water in the colonies. It is reported from the
DPHE that the average depth of the shallow tube well in the project area is 61 m (200 ft).
BWDB data reveals that groundwater level of Polash Upazila is about 6.5 m below the ground
surface. Drawdown effect of groundwater is started at Ghorasal area due to extensive
withdrawal by the industries and the local inhabitants. Now-a-day, people around the factory
area are using not only hand pump but also using motor pump to extract Ground water below
50-60 m from the ground level.
6.2.6 Hazards
Natural Hazards
414. Bangladesh is a natural hazard prone country due to its geographical and deltaic
location. In addition to that, the land characteristics of the country, its climatic condition and
the impact of climate change make the country more vulnerable to natural hazards. The
mostly occurred natural hazardsare: cyclone with storm surge, tornado, flood, coastal
andriver bank erosion, landslides, water logging, drought and earthquake. However, the
hazard profile is different for different parts of the country.
415. The location of the proposed Project site is situated in the central zone of the country.
Analyzing the location, it is observed that the nearby Shitalakhya River is not very much sand
braided river and the bank of this river is comparatively less erosion prone. Additionally, the
topographyof the Project site indicates that it is not situated in the floodplain and therefore,
the site is not very much prone to flood either. Landslides occurs only in the hilly areas of
Bangladesh which is far away from the project site. On the other hand, the coastal region is
mostly prone to cyclone and storm surges and coastal erosion. Moreover, the North-Western
part of the country is prone to drought due to the scarcity of water. According to the seismic
zone, the Project site falls under Zone-II which holds the middle class of risk with seismic
Description of Baseline Environment
144
coefficient of 0.15 among the three zones. Although the Project site is at the middle class of
risk zone, earthquake hazard is more of a regional concern than that of the local, as
Bangladesh is surrounded by regions of high seismicity. It should be mentioned, that the
tectonic activities of thesurrounding regionsbeyond the border are the main causes of
frequent earthquake in Bangladesh.
Chemical Hazards (Health Concern)
416. There are two Urea fertilizer factories located in the Project Site. Hazardous situations
can occur due to hoses coming loose or bursting when the chemicals/materials are being
transferred from one tank to another. Personal exposures to ammonia and acute respiratory
effects were reported in workers at the factory. Urea plant workers had higher mean exposure
to ammonia and prevalence of acute respiratory symptoms than did workers in the ammonia
plant. The symptoms with highest prevalence in the urea plant were chest tightness and
cough. Forced vital capacity (FVC) and Forced Expiratory Volume (FEV1) decreased
significantly across the work shift among urea plant workers. The higher level of exposure to
ammonia in the urea plant was associated with an increased prevalence of respiratory
symptoms and an acute decline in lung function.
417. On the other hand, there are two gas-based captive Power Plants (8 MW each) for
the daily electricity use of the existing fertilizer factories. As the Power Plants are natural gas
based, hence, formation of SO2 is insignificant and pollution of air is negligible.
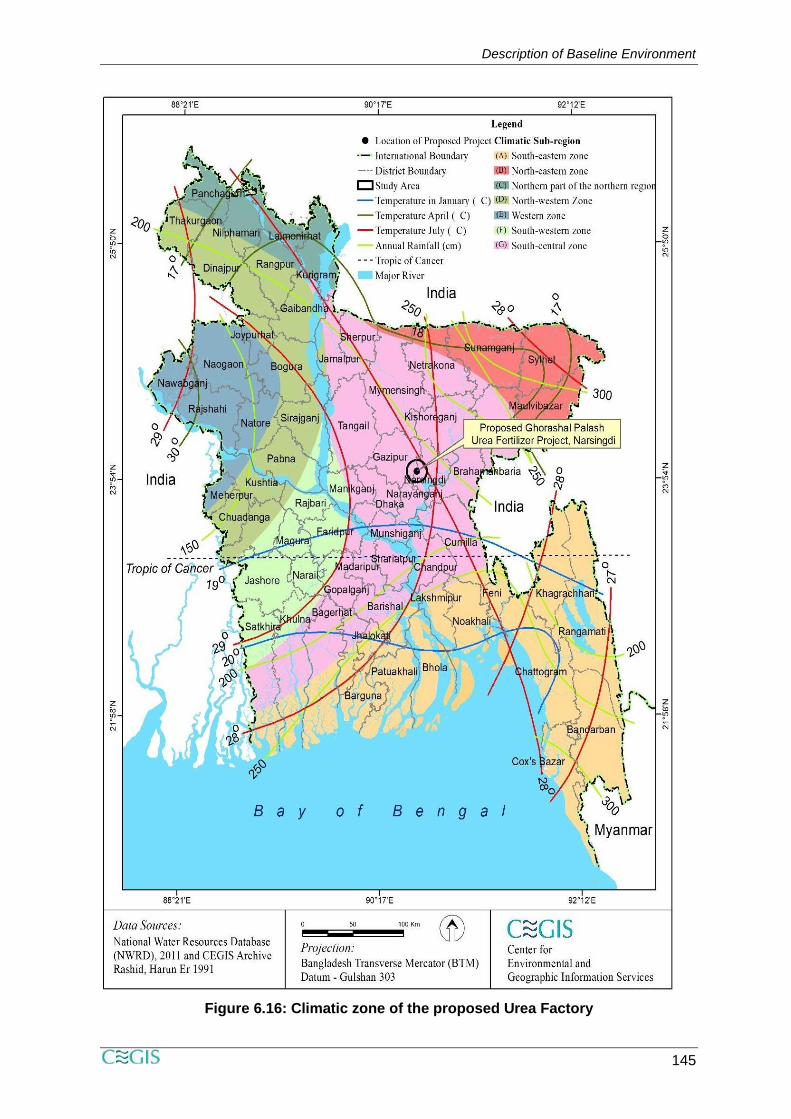
6.2.7 Climate and Meteorology
418. The project Site is located in Dhaka Division. According to Köppen Climate
classification, it falls under ‘Aw’ category which is characterized by tropical wet and dry
climate. Here, it experiences hot and humid summer and dry winter. According to climate
characteristics, Bangladesh is divided into 7 different climate sub-regions. The study area of
the project falls under “G”, which is the south-central climate zone of the country (Figure 6-
16).
Description of Baseline Environment
145
Figure 6.16: Climatic zone of the proposed Urea Factory
Description of Baseline Environment
146
419. The summary of the analysis of the climatic and meteorological parameters are
discussed in the following sections:
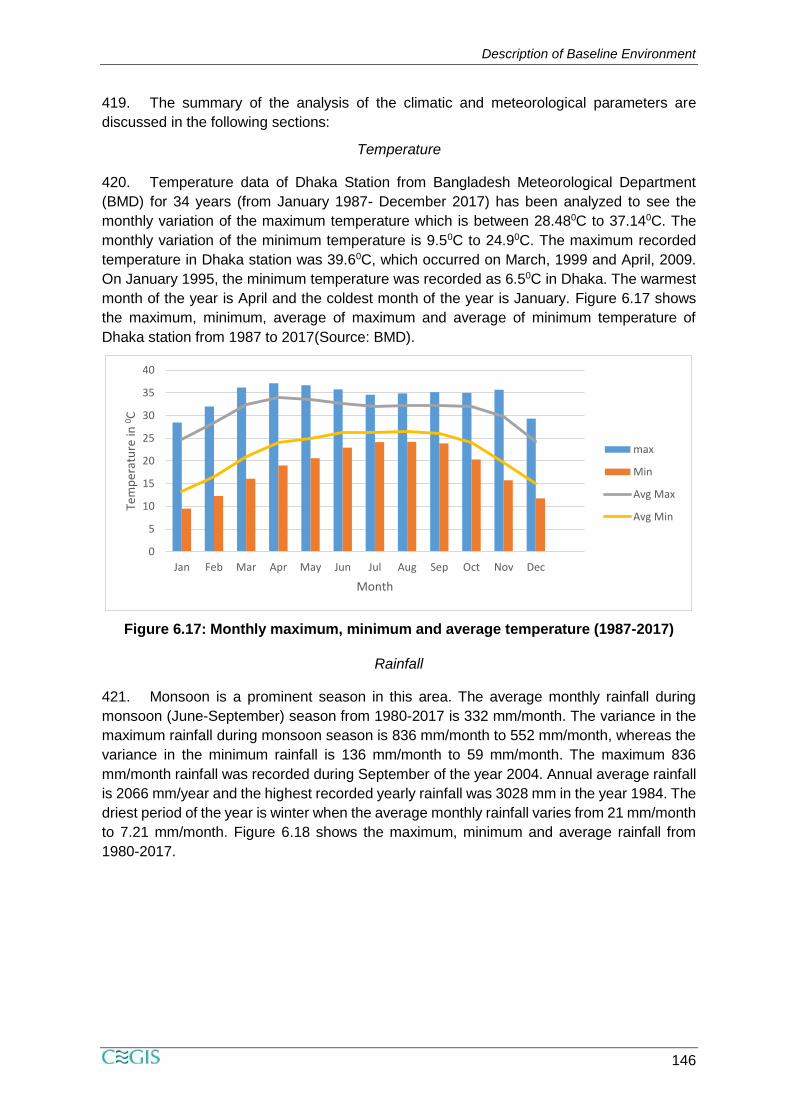
Temperature
420. Temperature data of Dhaka Station from Bangladesh Meteorological Department
(BMD) for 34 years (from January 1987- December 2017) has been analyzed to see the
monthly variation of the maximum temperature which is between 28.480C to 37.140C. The
monthly variation of the minimum temperature is 9.50C to 24.90C. The maximum recorded
temperature in Dhaka station was 39.60C, which occurred on March, 1999 and April, 2009.
On January 1995, the minimum temperature was recorded as 6.50C in Dhaka. The warmest
month of the year is April and the coldest month of the year is January. Figure 6.17 shows
the maximum, minimum, average of maximum and average of minimum temperature of
Dhaka station from 1987 to 2017(Source: BMD).
Figure 6.17: Monthly maximum, minimum and average temperature (1987-2017)
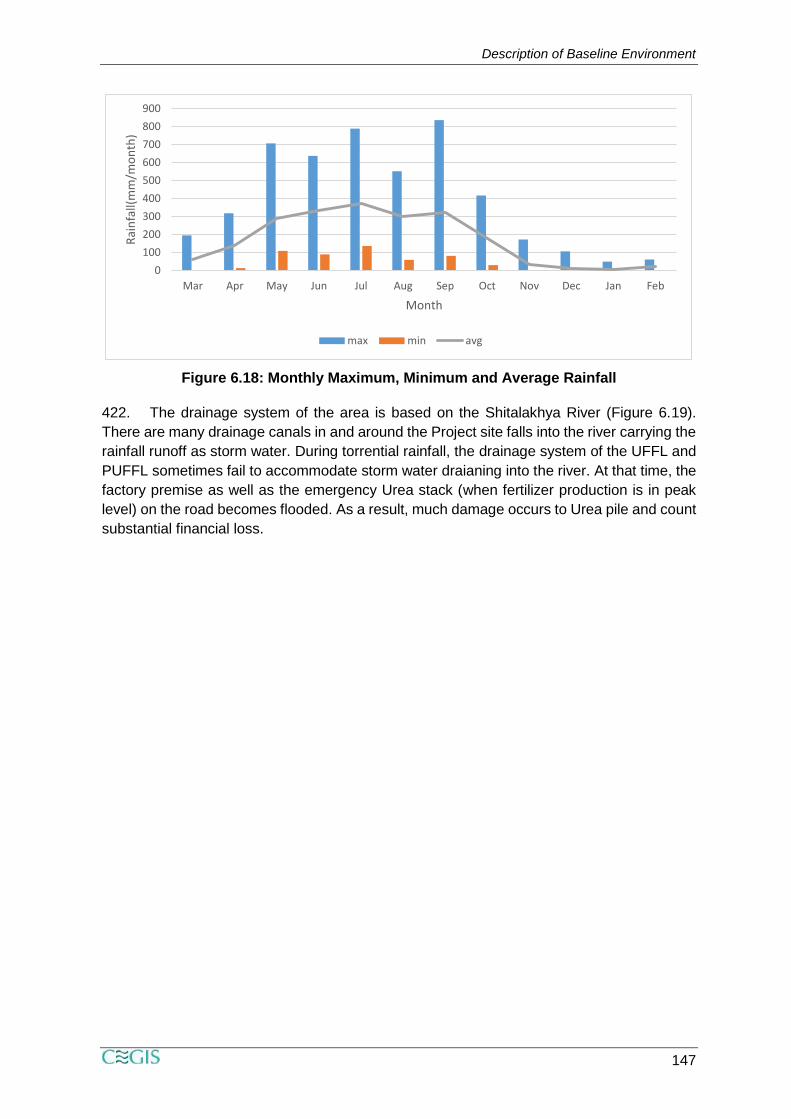
Rainfall
421. Monsoon is a prominent season in this area. The average monthly rainfall during
monsoon (June-September) season from 1980-2017 is 332 mm/month. The variance in the
maximum rainfall during monsoon season is 836 mm/month to 552 mm/month, whereas the
variance in the minimum rainfall is 136 mm/month to 59 mm/month. The maximum 836
mm/month rainfall was recorded during September of the year 2004. Annual average rainfall
is 2066 mm/year and the highest recorded yearly rainfall was 3028 mm in the year 1984. The
driest period of the year is winter when the average monthly rainfall varies from 21 mm/month
to 7.21 mm/month. Figure 6.18 shows the maximum, minimum and average rainfall from
1980-2017.
0
5
10
15
20
25
30
35
40
Jan Feb Mar Apr May Jun Jul Aug Sep Oct Nov Dec
Tem
per
atu
re in
0 C
Month
max
Min
Avg Max
Avg Min
Description of Baseline Environment
147
Figure 6.18: Monthly Maximum, Minimum and Average Rainfall
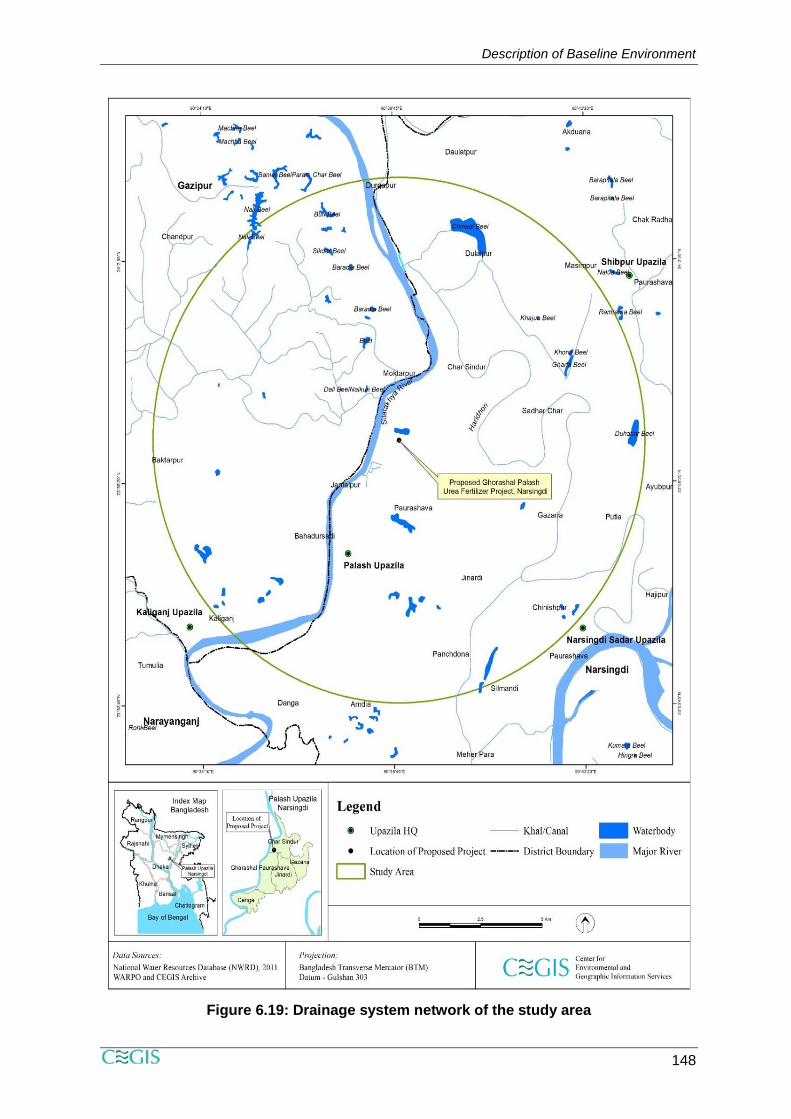
422. The drainage system of the area is based on the Shitalakhya River (Figure 6.19).
There are many drainage canals in and around the Project site falls into the river carrying the
rainfall runoff as storm water. During torrential rainfall, the drainage system of the UFFL and
PUFFL sometimes fail to accommodate storm water draianing into the river. At that time, the
factory premise as well as the emergency Urea stack (when fertilizer production is in peak
level) on the road becomes flooded. As a result, much damage occurs to Urea pile and count
substantial financial loss.
0
100
200
300
400
500
600
700
800
900
Mar Apr May Jun Jul Aug Sep Oct Nov Dec Jan Feb
Rai
nfa
ll(m
m/m
on
th)
Month
max min avg
Description of Baseline Environment
148
Figure 6.19: Drainage system network of the study area

Description of Baseline Environment
149
Humidity
423. The average relative humidity remains higher during the monsoon season. The
variance in the average relative humidity throughout the year is 82.61% to 61.29%, whereas
during monsoon the variance is 83.77% to 82.40%. Figure 6.20 shows the maximum,
minimum and average relative humidity of Dhaka station from January 1988 to January 2018.
Figure 6.20: Maximum, MinimumandAverageRelativeHumidity (1988-2018)
Wind Speed and Direction
424. The direction of wind varies depending on the seasons. Therefore, whole year has
been categorized into four clusters of months and these are: Cluster-1 which is called winter:
December-February, Cluster- 2 which is called Pre-Monsoon: March to May, Cluster- 3 which
is called Monsoon: June to September, and Cluster- 4 which is called Post Monsoon: October
to November. Wind speed data and direction have been collected from the Dhaka BMD
station at a height of 10 m from the ground level. During the months of clusters 1 and 4 wind
direction is predominantly from northwest to southeast direction, inclined towards East and
for clusters 2 and 3 it is predominantly from Suth and southeast to North and northwest. In
cluster 1 calm wind prevails for 34.66% of total period, similarly it is 10.0% for cluster 2,
11.42% for cluster 3, and 53.56% for cluster 4, respectively. Figure 6.21 (a, b, c and d)
presents the wind speed and direction graphically round the year.
0
20
40
60
80
100
120
Mar Apr May Jun Jul Aug Sep Oct Nov Dec Jan Feb
Ave
rage
Rel
ativ
e H
um
idit
y (%
)
Month
max
Min
Avg

Description of Baseline Environment
150
Winter (December to February)
Pre-monsoon (March to May)
Cluster-1 Cluster-2
Monsoon (June – September)
Post- Monsoon (October – November)
Cluster-3 Cluster-4
Figure 6.21: Wind rose at Dhaka station
425. The Figure 6.22 shows wind speed and direction round the year for 2018 based on
data collected at Dhaka Station and calm wind prevails for 24.8 % time of the year.

Description of Baseline Environment
151
Figure 6.22: Annual wind rose for 2018
6.2.8 Ambient Air Quality
426. The ambient air quality of the airshed of the proposed Project area has been
monitored primarily. A systematically designed air quality surveillance monitoring program
was formed on account of impact assessment on air environment due to proposed project
activities. The basic consideration for designing the air quality sampling locations were
representativeness of the airshed, sensitivity of the locations, duration of monitoring and
monitoring of all relevant and important pollution parameters (ECR 1997 and subsequent
amendments).
427. The parameters selected for presenting the ambient air quality are Suspended
Particulate Matter (SPM), Particulate Matter (PM10 & PM2.5), Sulphur Dioxide (SO2), Oxides
of Nitrogen (NOx), Carbon Monoxide (CO), Ozone (O3), Ammonia (NH3), Hydrogen Sulphide
(H2S) and Volatile Organic Carbon (VOC). The design of the network of ambient air quality
monitoring stations in the study area was done based on the following criteria:
Meteorological conditions basically the wind direction
Topography on the study area
Representation of the regional background levels
Sensitivity of the areas
Influence of the existing sources
Major human settlements in the study area
428. The surrounding area of the proposed Project site is semi-urban in nature and
consists of major industrial set up along with existing power plants. Considering all these
factors, the existing and potential future emission sources of air quality of the project site
Description of Baseline Environment
152
airshed monitoring is immensely necessary. Due to the unavailability of monitoring station at
nearby the proposed Project Site, the closest CAMS No. 4 (Gazipur Station) of DoE recorded
data were studied to get a general overview about the air quality in the proposed project
airshed. The measured station data along with the national standards for the major air quality
parameters are given in Table 6.8 below. Data results indicate that concentration of NO2
(ppb), PM2.5 (in µg/m3) and PM10 (in µg/m3) significantly exceeded the National Ambient Air
Quality Standard during the winter months. However, the concentration of air particulate
matters remain below the maximum allowable limit in the rainy season because of the flushing
with rain water. It should be noted that the average rainfall during the monsoon varies
between 129 mm and 388mm. The rest of the parameters were found within the permissible
limit, and less likely to pose any significant health hazard to the local residents.
Table 6.8: Ambient air quality in January and July, 2018 at CAMS-4
Parameter Unit NAAQS Summary
CAMS-4 (Gazipur)
Lat.: 23.99N, Long.: 90.42E
January 2018 July 2018
SO2- 24 hr ppb 140
Average 1.42 15.9
Max 4.80 35.7
Min 0.26 3.87
NO2- 24 hr ppb 53
Average 45.1 1.65
Max 76.6 3.89
Min 16.8 0.66
CO- 1 hr ppm 35
Average DNA DNA
Max DNA DNA
Min DNA DNA
CO- 8 hr ppm 9
Average DNA 1.41
Max DNA 2.69
Min DNA 0.38
O3- 1 hr ppb 120
Average DNA 3.50
Max DNA 8.81
Min DNA 1.14
O3- 8 hr ppb 80
Average DNA DNA
Max DNA DNA
Min DNA DNA
PM2.5- 24hr µg/m3 65
Average 208 28
Max 271 74.5
Min 123 7.76
PM10- 24hr µg/m3 150
Average 300 52.8
Max 423 117
Min 203 21
Source:DoE, 2018; Note: CAMS- Continuous Air Monitoring Station; NAAQS- National Ambient Air Quality
Standard; ppb- Parts per Billion; ppm- Parts per Million; DNA*- Data Not Available due to malfunction of the
analyzer/sensor (Source: CASE project-Monthly Air Quality Monitoring Report, January and July 2018.
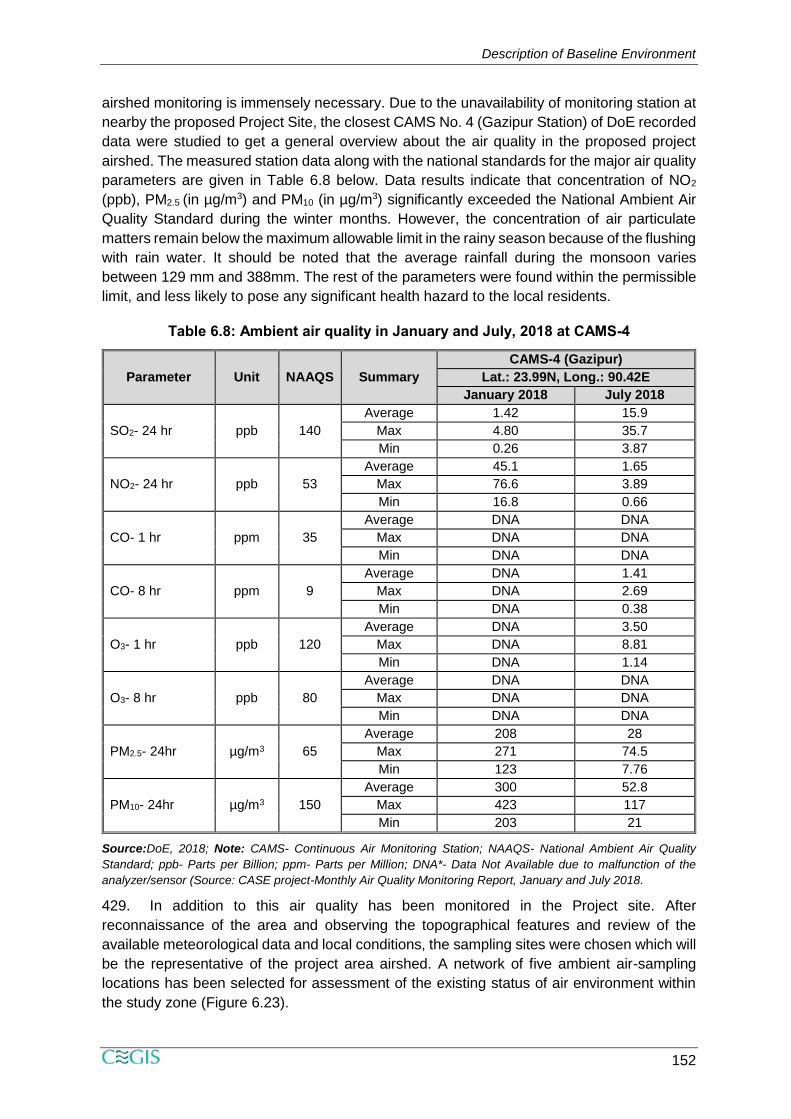
429. In addition to this air quality has been monitored in the Project site. After
reconnaissance of the area and observing the topographical features and review of the
available meteorological data and local conditions, the sampling sites were chosen which will
be the representative of the project area airshed. A network of five ambient air-sampling
locations has been selected for assessment of the existing status of air environment within
the study zone (Figure 6.23).
Description of Baseline Environment
153
Figure 6.23: Ambient air sampling locations
430. Monitoring stations were installed at least 15 m distance from local sources. The
height of sampling points was kept between 4-6 m (free from obstructions). Ambient air quality
was monitored inside the Project site for continuous 24 hours for each of the location. During
sampling period, the weather was sunny and the wind direction was from North-West to
South-East. Table 6.9 shows the monitoring result of the ambient air quality at the sampling
locations. Maximum ambient air quality monitoring results were found within the standard
limit of ECR, 1997 as well as of IFC, 2007 standard except SPM and PM2.5. Exceedances of
SPM were observed in four locations out of five locations and PM2.5 were observed in two
locations situated peripherally. In case of NOx, the IFC standard stands for annual and 1-hr
where the monitoring data recorded for 24hrs. However, the ambient NOx data will be within
the standard limit of IFC annual standard.
Table 6.9: Ambient air quality in the project airshed
Sam
plin
g
Po
int Concentration of Different Parameters in Ambient Air (µg/m3)
SPM SO2 NOx CO O3 NH3* H2S* PM 10 PM2.5 T VOC
AQ-1 257 7.4 35.2 0.38 24.6 34.8 <10 126.4 58.2 41.46
AQ-2 245.2 8.5 42.4 0.87 38.7 108.2 <10 119.4 53.5 <4.2
AQ-3 189.2 7 38.7 0.75 26.8 36.5 <10 96.7 48.6 157.1
AQ-4 293.4 9.2 48.6 0.98 37.7 733 <10 140.8 76.7 227.92
AQ-5 293.8 8.3 40.3 1.15 30.5 173.5 <10 145.2 74.8 59.37
ECR,
2005
200 365 100 10000 157 3480 280 150 65 -
8-Hr 24-Hr Annual 8-Hr 8-Hr Max Max 24 Hr 24 Hr -
IFC,
2007
- 20 40 - 100 - - 150 (IT-
1)
75 (IT-
1)
24 Hr Annual 8-Hr - - 24-Hr
Source: Field measurement done by CEGIS, 2019;Notes: *Schedule – 8(Standards for Odor) of ECR 1997
has been used; This monitoring was conducted by - Respirable Dust Sampler (Model-Envirotech India APM-
460BL) and Fine Particulate Sampler (Model-Envirotech APM-550).
Description of Baseline Environment
154
431. The monitoring results are a good representative of the status of the proposed Project
airshed. Presently, the area is semi-urban in nature and consists of major industrial set up
along with existing UFFL and PUFFL, Power Plants and brick kilns etc. Existing road dust
from the paved and unpaved road, vehicular movement, emission from the fertilizer and
power plant industries, pollen, emission from the lagoons and windblown dust from
agricultural lands and exposed earth, domestic cooking are the potential sources of air
pollution at present.
6.2.9 Odor
432. Odor can be defined as the “perception of smell” or in scientific terms as “a sensation
resulting from the reception of stimulus by the olfactory sensory system” (CPCB 2008).
Whether pleasant or unpleasant, Odor is induced by inhaling air-borne volatile organics or
inorganic component. Odor emission often consists of a complex mixture of many odorous
compounds but for fertilizer factories ammonia (NH3) is the main chemical components that
produce strong pungent smell for the human.
433. In ECR 1997, the major chemical constituent of odor are identified and fixed their limit
at Schedule-8 which has been shown in Table 6.10 especially for NH3.
Table 6.10: Standard for Odor of ECR, 1997: SCHEDULE- 8
Parameter Chemical
Formula
Standard Limit
(in ppm)
Ammonia NH3 1 – 5
434. Odor is one of the major environmental and social problem encountered by the local
inhabitants living adjacent to the existing Fertilizer Factories. Particularly, those communities
who live around the Lagoon are experiencing serious nuisance by the odor of NH3.
435. Because of the significant environmental hazards of NH3, National Pollutant
Inventory, (DEH, 2004) and AP-42 (USEPA, 1998) has estimated typical release of NH3 into
the water from Urea Manufacturing process. Around 0.0199 kg/hr/source of NH3 release from
fugitive sources from a Urea Fertilizer factory (NPI, 2004: Table-9). It is mixed with the water
and release to the lagoon. Volatile gas NH3 is lighter than air and tends to rise, because of
this fact it generally does not settle in low-lying areas. According to Aneja. V.P. et.al. in 2001,
average emission flux of NH3 from a lagoon is 40.7-120.3 µg/m2-min of fertilizer factories.
During the field measurement the quantity of NH3 and H2S and Total VOC has been
presented in Table 6.11.
Table 6.11: Quantity of odors component at different sampling locations
Sampling Point NH3 (µg/m3) H2S*(µg/m3) Total VOC(µg/m3)
AQ-1 34.8 <10 41.46
AQ-2 108.2 <10 <4.2
AQ-3 36.5 <10 157.1
AQ-4 733 <10 227.92
AQ-5 173.5 <10 59.37
ECR, 1997
(Schedule -8, Rule-12)
3480 280 -
Max Max -
Source: Field measurement done by CEGIS, 2019
Description of Baseline Environment
155
436. The people who lives near the lagoon suffer a lot due to unpleasant odor which
generates from contaminated water and ammonia gas. Ammonia is a colourless and highly
irritating gas with a sharp suffocating odor. It dissolves easily in water to form ammonium
hydroxide solution which can cause irritation and burns. Gradually, it hampers the entire
Aquatic Ecosystem of the Shitalakhya River. It also causes a lot of diseases among the
villagers who live nearby the lagoon. The diseases are bronchitis, allergy, eye irritation, skin
diseases, belly swollen, even lung cancer, etc.
6.2.10 Acoustic Environment
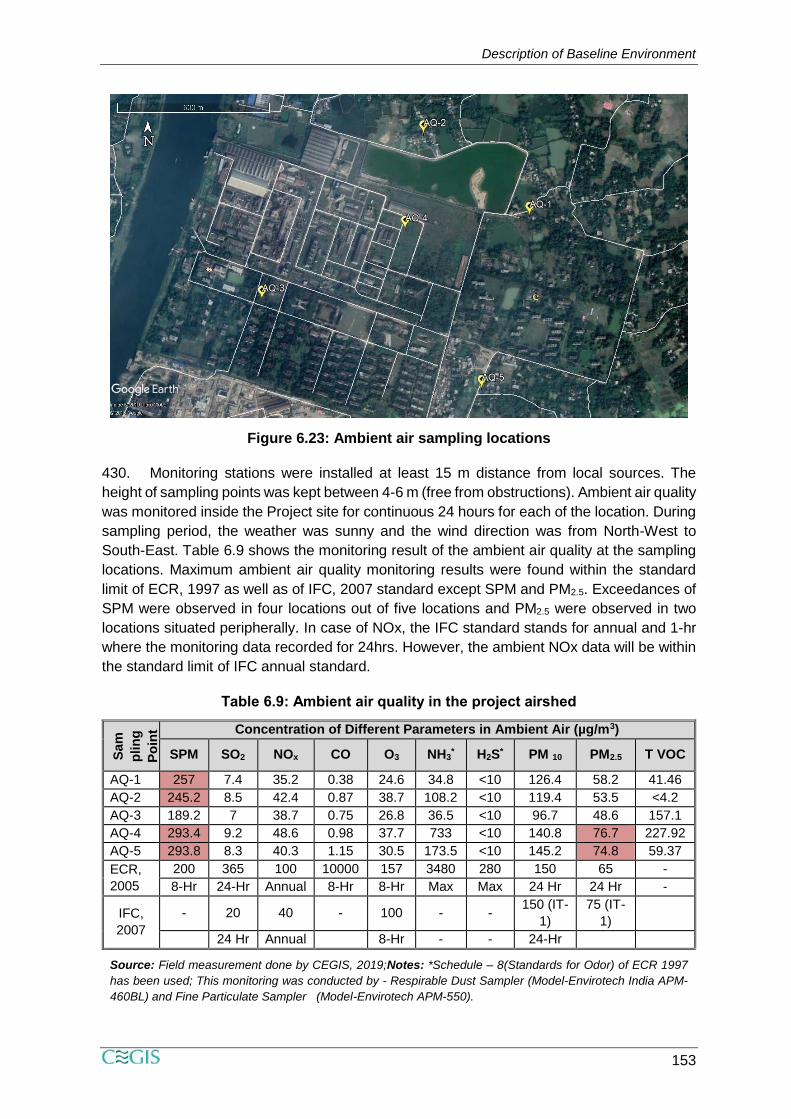
437. Excessive noise generation from industrial activities, vehicle movements, chattering,
chirping of birds etc., might have noticeable negative impacts on surrounding environment.
Continuous high noise or impulse noise may cause health hazards to both the people living
in the area and the workers.
Figure 6.24: Sampling points of noise levels around the project site
438. Among the fourteen samples collected, thirteen of those were recorded within one
kmradius around the proposed project area (Figure6.24). Only one sampling point was
located at 1.75km distance from the center of the proposed GUFF. Noise levels varied
between 48.1 dBA to 78.1 dBA during the day time and 42.7 dBA to 65.7 dBA during night
time. The noise levels at all of the sample locations showed a comparatively higher variability
in daytime (std dev. 8.31) compared to night time (std dev. 6.66), which is usual considering
the higher variations of daytime activities at different noise generation sources.
439. As per the ECR, 2006 and IFC 2007, the permissible level of noise were exceeded in
several receptors point where the noise level were recorded. Characteristics of the receptors
Description of Baseline Environment
156
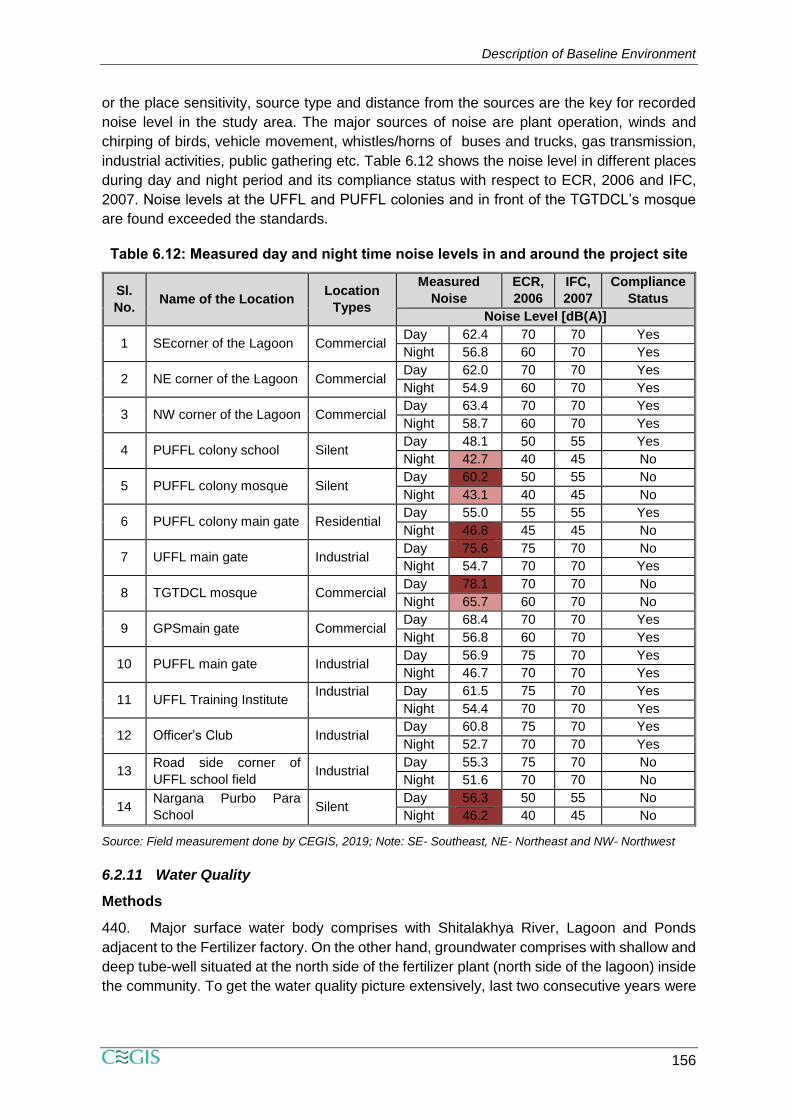
or the place sensitivity, source type and distance from the sources are the key for recorded
noise level in the study area. The major sources of noise are plant operation, winds and
chirping of birds, vehicle movement, whistles/horns of buses and trucks, gas transmission,
industrial activities, public gathering etc. Table 6.12 shows the noise level in different places
during day and night period and its compliance status with respect to ECR, 2006 and IFC,
2007. Noise levels at the UFFL and PUFFL colonies and in front of the TGTDCL’s mosque
are found exceeded the standards.
Table 6.12: Measured day and night time noise levels in and around the project site
Sl.
No. Name of the Location
Location
Types
Measured
Noise
ECR,
2006
IFC,
2007
Compliance
Status
Noise Level [dB(A)]
1 SEcorner of the Lagoon Commercial Day 62.4 70 70 Yes
Night 56.8 60 70 Yes
2 NE corner of the Lagoon Commercial Day 62.0 70 70 Yes
Night 54.9 60 70 Yes
3 NW corner of the Lagoon Commercial Day 63.4 70 70 Yes
Night 58.7 60 70 Yes
4 PUFFL colony school Silent Day 48.1 50 55 Yes
Night 42.7 40 45 No
5 PUFFL colony mosque Silent Day 60.2 50 55 No
Night 43.1 40 45 No
6 PUFFL colony main gate Residential Day 55.0 55 55 Yes
Night 46.8 45 45 No
7 UFFL main gate Industrial Day 75.6 75 70 No
Night 54.7 70 70 Yes
8 TGTDCL mosque Commercial Day 78.1 70 70 No
Night 65.7 60 70 No
9 GPSmain gate Commercial Day 68.4 70 70 Yes
Night 56.8 60 70 Yes
10 PUFFL main gate Industrial Day 56.9 75 70 Yes
Night 46.7 70 70 Yes
11 UFFL Training Institute Industrial
Day 61.5 75 70 Yes
Night 54.4 70 70 Yes
12 Officer’s Club Industrial Day 60.8 75 70 Yes
Night 52.7 70 70 Yes
13 Road side corner of
UFFL school field Industrial
Day 55.3 75 70 No
Night 51.6 70 70 No
14 Nargana Purbo Para
School Silent
Day 56.3 50 55 No
Night 46.2 40 45 No
Source: Field measurement done by CEGIS, 2019; Note: SE- Southeast, NE- Northeast and NW- Northwest
6.2.11 Water Quality
Methods
440. Major surface water body comprises with Shitalakhya River, Lagoon and Ponds
adjacent to the Fertilizer factory. On the other hand, groundwater comprises with shallow and
deep tube-well situated at the north side of the fertilizer plant (north side of the lagoon) inside
the community. To get the water quality picture extensively, last two consecutive years were
Description of Baseline Environment
157
observed following dry and wet season of the resources. In addition, discharged effluent
quality were also observed here.
441. To cover a wide range of parameters both In-situ and Ex-situ techniques were
followed. Parameters of pH, Temperature, Dissolved Oxygen (DO), Total Suspended Solids
(TDS) and Hardness were examined In-situ while Biochemical Oxygen Demand (BOD),
Chemical Oxygen Demand (COD), Ammonium ion (NH4+) Sulphate (SO4
2-), Chloride (Cl-),
Silica (SiO2) and Total Iron (Fe) were for Ex-situ test.
Historic Pollution Records of the Shitalakhya River
442. Around 15 years back, pH values were within the range in the Shitalakhya River,
which World Health Organization (WHO) has recommended for drinking water that is, 6.5 to
8.5. In 2001, 2002 and 2003 water pH was respectively average 7.2, 6.6 and 7.0 ppm. In
2015, it has been reduced to 5.6 in pre-monsoon and 6.6 in post monsoon season in an
average. Slight acidic in nature due to the discharge of chemicals and other municipal and
domestic wastes along with pesticides from agricultural fields.
443. WHO suggest that 4-5 ppm of DO is the minimum amount that will support a large,
diverse fish population. The DO level in good fishing waters generally averages about 9.0
ppm. In the Shitalakhya River DO was on an average 6.28 ppm in 2001. Moreover, average
7.0 ppm and 6.3 ppm was in correspondently 2002 and 2003 (Islam, M. J., 2008). DO is
changes in the river. This DO reduced to 1.2 ppm in pre-monsoon and 1.6 ppm in post-
monsoon season in 2015, which indicated high organic pollution of the river. However, in
2015 and 2016, DO was found around 3.5-4.2 ppm considering both dry and wet seasons
(DoE, 2016). This extreme low DO might be due to the variation of seasons and sampling
sites. In the pre-monsoon, BOD was less than 4.0 ppm in 2003, which was increased to more
than 4.5 ppm in 2015. COD was around 8.8 ppm in pre-monsoon while it reduced a bit (6.5
ppm) in post-monsoon season. TDS was found 112 ppm in pre-monsoon, which was a bit
less in post-monsoon season in 2015.
444. Phosphorous is a vital element for all the living beings, especially for plant life.
However, if the quantity of phosphorous gets much higher in the water body it speeds up
eutrophication of that river and lake. The standard limit of phosphorous for drinking water
quality is 4-20 ppm (WHO, 1998 and 2008). In the pre-monsoon season, the range of
phosphorous is 392-401 ppm and in post monsoon, it is 39-38 ppm in the Shitalakhya River
which is very high than the standard limit.
445. In case of metal pollution, in pre-monsoon season of the year 2008, arsenic (observed
0.002ppm; standard 0.05ppm), lead (observed 0.001ppm; standard 0.05ppm), manganese
(observed 0.05ppm; standard 0.ppm), copper (observed 0.0025ppm; standard 1.0ppm) and
zinc (observed 0.02ppm; standard 5.0ppm) were found within the acceptable limit of the
standards for drinking water of Bangladesh (ECR’1997). Only, cadmium was showed high
concentration (0.01ppm) than the same standard 0.005 ppm. In terms of metal pollution, the
entire river reach was not bad at all (Mokadddes et al., 2013).
Surface Water Quality
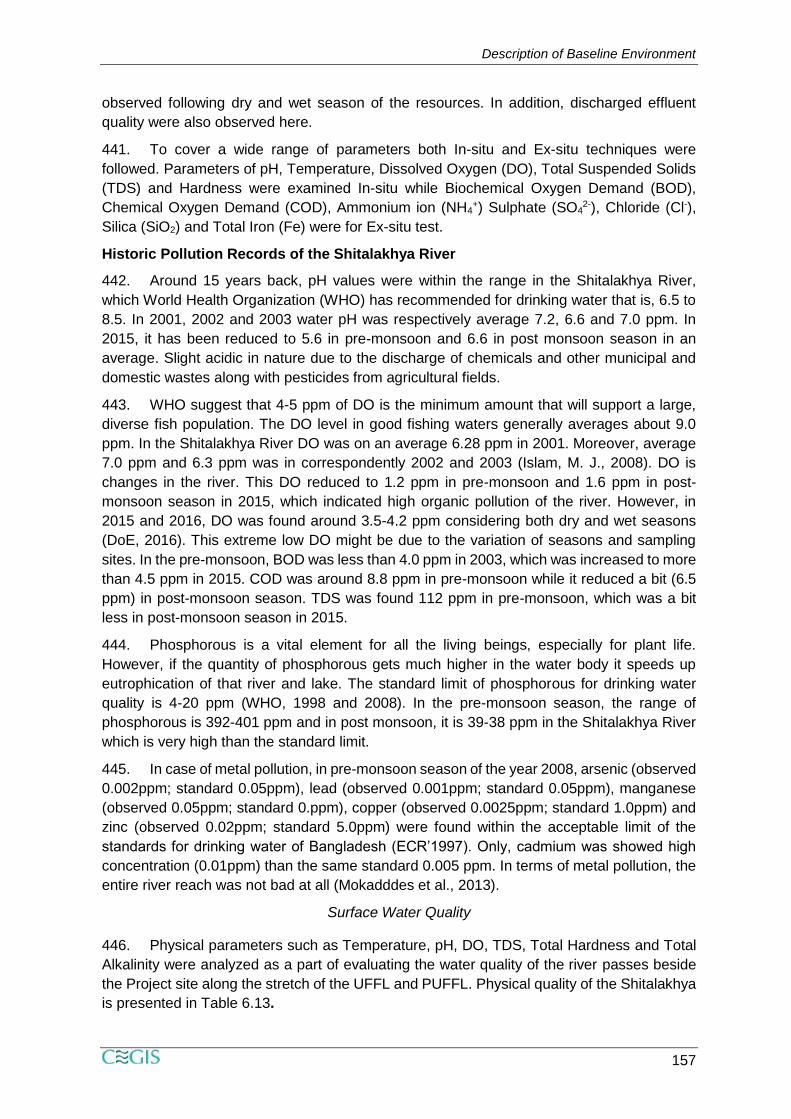
446. Physical parameters such as Temperature, pH, DO, TDS, Total Hardness and Total
Alkalinity were analyzed as a part of evaluating the water quality of the river passes beside
the Project site along the stretch of the UFFL and PUFFL. Physical quality of the Shitalakhya
is presented in Table 6.13.
Description of Baseline Environment
158
Table 6.13: Physical quality of the Shitalakhya River
Sl.
No. Parameters
Dry Season
(February)
Wet
Season
(July)
Standard
Value
Reference
2017 2018 2017 2018
1 Temperature (°C) 24.2 23.0 29.8 29.7 30.0 2
2 pH 7.4 8.1 7.2 7.0 6.5-8.5 1
3 Dissolve Oxygen (mg/l) 6.1 6.2 5.3 3.8 ≥5 1
4 Total Dissolved Solids (mg/l) 288 264 290 274 1000 1
5 Total Hardness as CaCO3 (mg/l) 175 192 44 71 200-500 1
6 Total Alkalinity as CaCO3 (mg/l) 201 202 54 60 -
Source: BCIC, 2018
447. Physical characteristics of the Shitalakhya River water is quite good except for DO.
According to the Table 6.13, it was found that water temperature varied 23-24°C in dry period,
which increased a bit in the wet season. These changes are usual and all comply with the
DoE standards (30 °C). The pH value also meets the standards as it ranges in between 7.0-
8.1 (pH standard: 6.5-8.5).
448. DO is the amount of oxygen dissolved in a waterbody such as river, lake or stream. It
is vital for underwater life as aquatic creatures need to breathe. From the Table 6.13 analyzed
on the physical parameters of the Shitalakhya River, it is known that the value of Dissolved
Oxygen was observed to be lower in the Wet Season than in the Dry Season. In 2018, the
values were 6.2 and 3.8 in Dry and Wet season respectively. In 2017, the values were 6.1
and 5.3 in Dry and Wet season respectively. In 2018, the value of DO went below the
standards (5 mg/L). Several reasons might have contributed to the reduction of DO level.
One of the main reasons may be releasing of NH3 mixed water into the river from the lagoon
of existing urea fertilizer factories along with other NH3 industries located nearby.
449. There is no mention of the standard value for Total Alkalinity in the ECR, 1997. But,
various sources state that Total Alkalinity as CaCO3 should be within 20-200 (mg/L) to
maintain the buffer state. The stabilized pH level also indicates that the buffer state is
maintained in the Shitalakhya River. Based on the result, it was found that, total alkalinity in
all the observed seasons complied with the range of 20-200 mg/L.
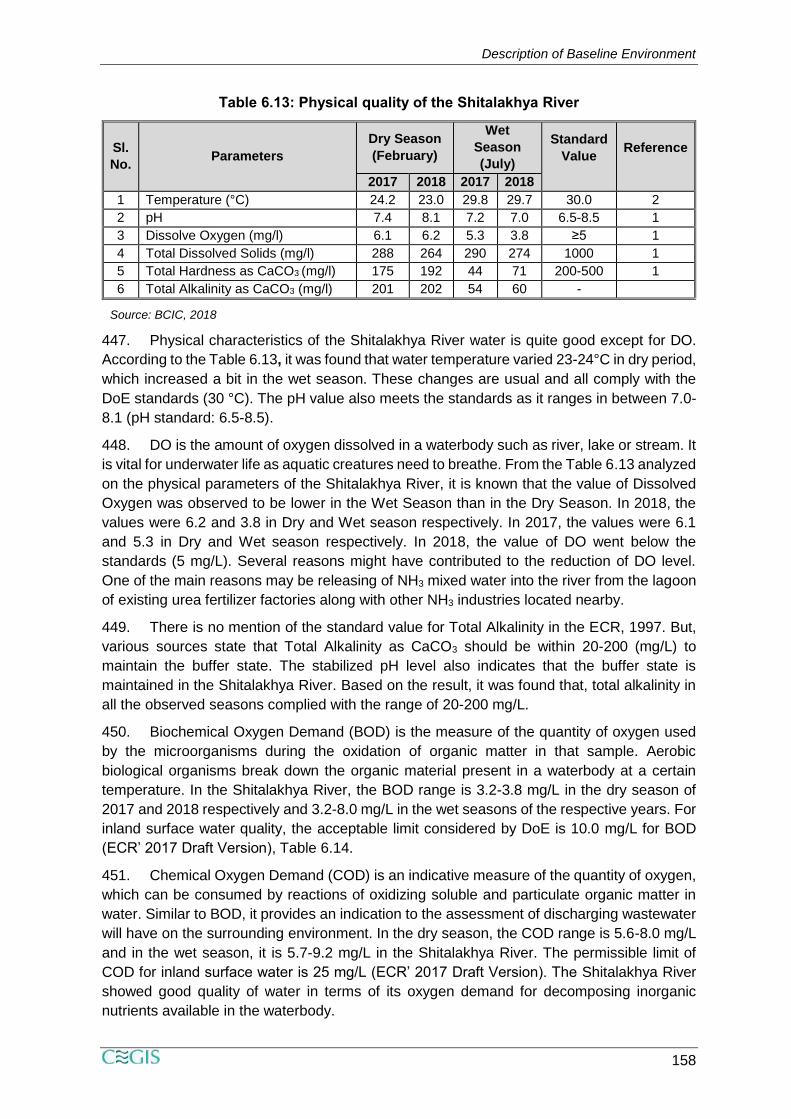
450. Biochemical Oxygen Demand (BOD) is the measure of the quantity of oxygen used
by the microorganisms during the oxidation of organic matter in that sample. Aerobic
biological organisms break down the organic material present in a waterbody at a certain
temperature. In the Shitalakhya River, the BOD range is 3.2-3.8 mg/L in the dry season of
2017 and 2018 respectively and 3.2-8.0 mg/L in the wet seasons of the respective years. For
inland surface water quality, the acceptable limit considered by DoE is 10.0 mg/L for BOD
(ECR’ 2017 Draft Version), Table 6.14.
451. Chemical Oxygen Demand (COD) is an indicative measure of the quantity of oxygen,
which can be consumed by reactions of oxidizing soluble and particulate organic matter in
water. Similar to BOD, it provides an indication to the assessment of discharging wastewater
will have on the surrounding environment. In the dry season, the COD range is 5.6-8.0 mg/L
and in the wet season, it is 5.7-9.2 mg/L in the Shitalakhya River. The permissible limit of
COD for inland surface water is 25 mg/L (ECR’ 2017 Draft Version). The Shitalakhya River
showed good quality of water in terms of its oxygen demand for decomposing inorganic
nutrients available in the waterbody.
Description of Baseline Environment
159
Table 6.14: Organic Pollution status of the Shitalakhya River
Sl.
No. Parameters
Dry Season
(February) Wet Season (July) Standard
Value Reference
2017 2018 2017 2018
1 BOD (mg/l) 3.2 3.8 8.0 3.2 ≤10 1
2 COD (mg/l) 5.6 8.0 9.2 5.7 25 1
Source: BCIC, 2018
452. Among the chemical parameters, Ammonium (NH4+), Chloride (Cl-), Sulfate (SO4
2-),
Silica (as SiO2), Total Iron was determined using methods of volumetric analysis. Data is
presented in the Table 6.15.
Table 6.15: Chemical quality of the Shitalakhya River
SL Parameters
Dry Season
(February)
Wet Season
(July)
Standards
as per
ECR, 1997
Reference
2017 2018 2017 2018
1 Ammonium NH4+ (mg/l) 10 0.3 0.35 0.09 1.5 1
2 Chloride (mg/l) 22 8 4.8 8.2 150-600 2
3 Sulfate (mg/l) 1 4 10.5 4.2 400 2
4 Silica (mg/l) 25.2 24 6 5.7 - -
5 Total Iron (mg/l) 0.01 0.05 0.5 0.09 2 2
Source: BCIC, 2018
453. Values for Chloride, Sulfate and Total Iron are well within the standards appraised by
DoE (ECR, 2017 Draft Version). Sulfates are discharged into water from mines and smelters
and from Kraft pulp and paper mills, textile mills and tanneries. The low concentration of
Sulfates indicates the water quality (in the vicinity of the project area) is not polluted by
chemical wastes of these types of industries. Values for Chloride, Sulfate and Total Iron are
well within the standards in this area.
454. Only in the dry season of 2017, the value of NH4+ (10) was beyond the limit. The
levels of NH4+, was well above the limits starting from January 2017 to April 2017. In fact,
the recorded levels of NH4+ from January to April were 5.0 mg/L, 10.0 mg/L, 5.0 mg/L and
3.8 mg/L. All of these values are well above the standards mentioned in the ECR, 1997.
Therefore, in the dry period, Shitalakhya River has an issue of high ammonia. This was
happened probably because of releasing of ammonia mixed water from the lagoon into the
river water in 2017.
455. There is no standard value for Silica in water. But there is a significant drop of value
of Silicabetween the dry and wet season. In March, April, May and June, the recorded amount
of Silica was 26.7 mg/L, 21.0 mg/L, 16.0 mg/L and 5.2 mg/L respectively. This indicates that
in the dry season there were more Silica in the River of Shitalakhya than in the wet season.
High upstream water might dilute Silica concentration vastly.
Ground Water Quality
456. Water quality was checked for ground water at several locations around the Project
site especially at the north side of the lagoon where communities reside the most. Water
samples were collected from various depths below the ground level. Here, depths of less
than 40m have been termed as ‘Shallow’ and depths of more than 40m have been termed as
‘Deep’ tube wells.
Description of Baseline Environment
160
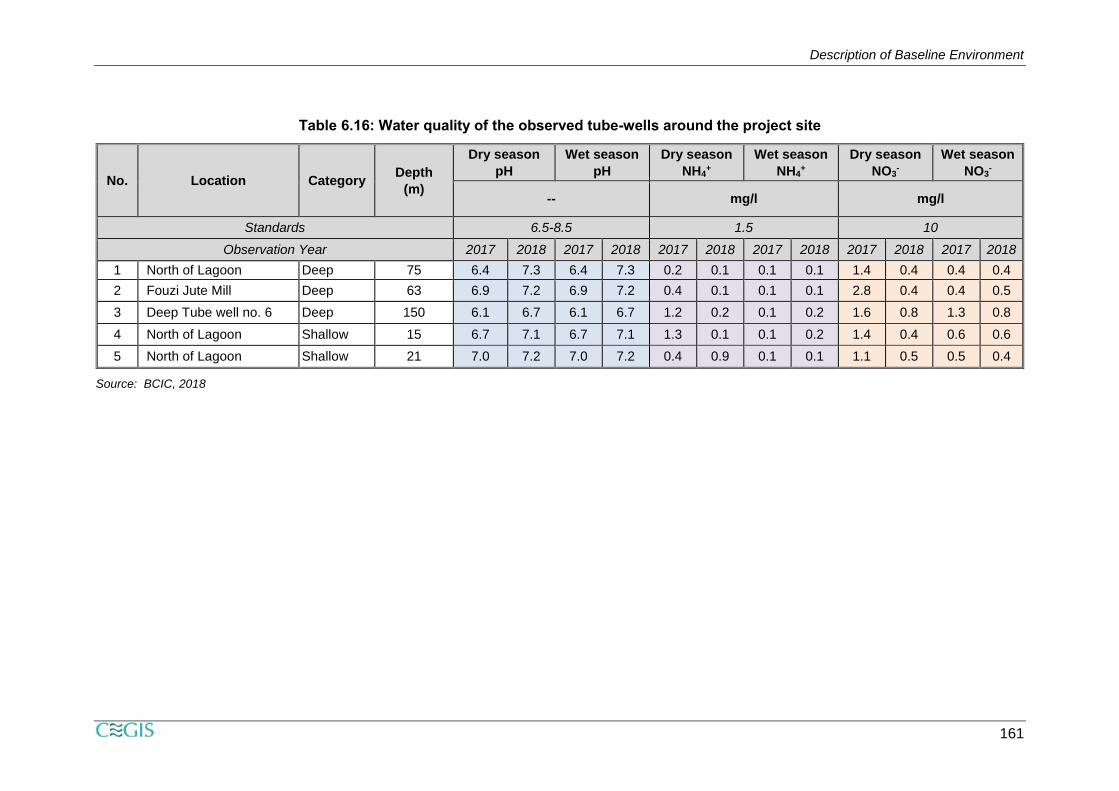
457. As far as fertilizer factory is concerned, the values of pH, NH4+ and NO3
- were analyzed
to determine the chemical characteristics of ground water available in the region of the
proposed Project Site. The detail field observation is presented in Table 6.16.
458. The values of pH, NH4+ and NO3
- at all the observed locations are within the standard
limits. This indicates that the ground water available in that area is suitable for drinking water
considering fertilizer factory after disinfection only.
Description of Baseline Environment
161
Table 6.16: Water quality of the observed tube-wells around the project site
No. Location Category Depth
(m)
Dry season
pH
Wet season
pH
Dry season
NH4+
Wet season
NH4+
Dry season
NO3-
Wet season
NO3-
-- mg/l mg/l
Standards 6.5-8.5 1.5 10
Observation Year 2017 2018 2017 2018 2017 2018 2017 2018 2017 2018 2017 2018
1 North of Lagoon Deep 75 6.4 7.3 6.4 7.3 0.2 0.1 0.1 0.1 1.4 0.4 0.4 0.4
2 Fouzi Jute Mill Deep 63 6.9 7.2 6.9 7.2 0.4 0.1 0.1 0.1 2.8 0.4 0.4 0.5
3 Deep Tube well no. 6 Deep 150 6.1 6.7 6.1 6.7 1.2 0.2 0.1 0.2 1.6 0.8 1.3 0.8
4 North of Lagoon Shallow 15 6.7 7.1 6.7 7.1 1.3 0.1 0.1 0.2 1.4 0.4 0.6 0.6
5 North of Lagoon Shallow 21 7.0 7.2 7.0 7.2 0.4 0.9 0.1 0.1 1.1 0.5 0.5 0.4
Source: BCIC, 2018
Description of Baseline Environment
162
6.2.12 Effluent Analysis Report
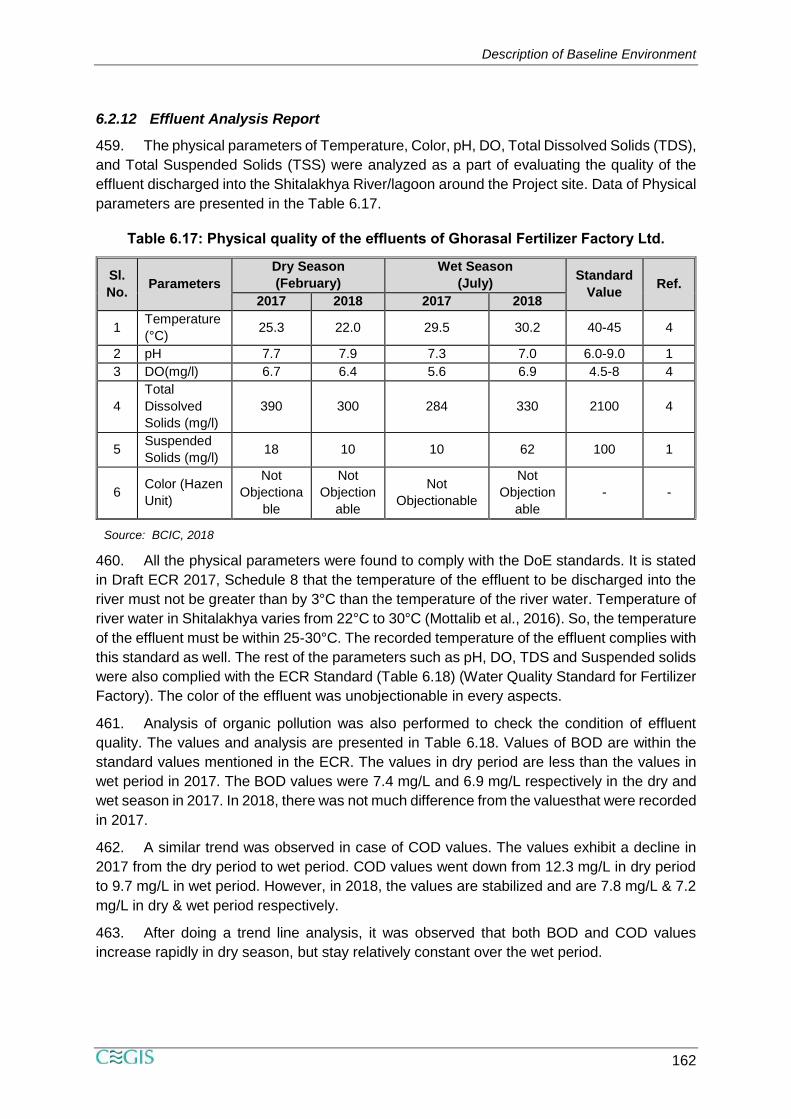
459. The physical parameters of Temperature, Color, pH, DO, Total Dissolved Solids (TDS),
and Total Suspended Solids (TSS) were analyzed as a part of evaluating the quality of the
effluent discharged into the Shitalakhya River/lagoon around the Project site. Data of Physical
parameters are presented in the Table 6.17.
Table 6.17: Physical quality of the effluents of Ghorasal Fertilizer Factory Ltd.
Sl.
No. Parameters
Dry Season
(February)
Wet Season
(July) Standard
Value Ref.
2017 2018 2017 2018
1 Temperature
(°C) 25.3 22.0 29.5 30.2 40-45 4
2 pH 7.7 7.9 7.3 7.0 6.0-9.0 1
3 DO(mg/l) 6.7 6.4 5.6 6.9 4.5-8 4
4
Total
Dissolved
Solids (mg/l)
390 300 284 330 2100 4
5 Suspended
Solids (mg/l) 18 10 10 62 100 1
6 Color (Hazen
Unit)
Not
Objectiona
ble
Not
Objection
able
Not
Objectionable
Not
Objection
able
- -
Source: BCIC, 2018
460. All the physical parameters were found to comply with the DoE standards. It is stated
in Draft ECR 2017, Schedule 8 that the temperature of the effluent to be discharged into the
river must not be greater than by 3°C than the temperature of the river water. Temperature of
river water in Shitalakhya varies from 22°C to 30°C (Mottalib et al., 2016). So, the temperature
of the effluent must be within 25-30°C. The recorded temperature of the effluent complies with
this standard as well. The rest of the parameters such as pH, DO, TDS and Suspended solids
were also complied with the ECR Standard (Table 6.18) (Water Quality Standard for Fertilizer
Factory). The color of the effluent was unobjectionable in every aspects.
461. Analysis of organic pollution was also performed to check the condition of effluent
quality. The values and analysis are presented in Table 6.18. Values of BOD are within the
standard values mentioned in the ECR. The values in dry period are less than the values in
wet period in 2017. The BOD values were 7.4 mg/L and 6.9 mg/L respectively in the dry and
wet season in 2017. In 2018, there was not much difference from the valuesthat were recorded
in 2017.
462. A similar trend was observed in case of COD values. The values exhibit a decline in
2017 from the dry period to wet period. COD values went down from 12.3 mg/L in dry period
to 9.7 mg/L in wet period. However, in 2018, the values are stabilized and are 7.8 mg/L & 7.2
mg/L in dry & wet period respectively.
463. After doing a trend line analysis, it was observed that both BOD and COD values
increase rapidly in dry season, but stay relatively constant over the wet period.
Description of Baseline Environment
163
Table 6.18: Organic pollutants in the effluent quality, Urea Fertilizer Factory Ltd,
Ghorasal, Narsingdi
Sl.No. Parameters
Dry Season
(February)
Wet Season
(July) Standard
Value Ref.
2017 2018 2017 2018
1 BOD (mg/l) 7.4 7.0 9.0 6.9 30 1
2 COD (mg/l) 12.3 7.8 9.7 7.2 200 1
Source: BCIC, 2018
464. Methods of volumetric and gravimetric analysis were performed to determine the
amount of the following chemical pollutants present in the effluent- Ammoniacal Nitrogen (NH3-
N), Chloride as NaCl, Sulphate, Phosphate, and Iron. The observed data analysis is presented
in Table 6.19.
Table 6.19: Chemical quality of the effluents of Ghorasal Fertilizer Factory Ltd.
Sl.
No. Parameters
Dry Season
(February)
Wet Season
(July)
Standard
Value
Ref.
2017 2018 2017 2018
1 NH3-N (mg/l) 22.4 7.0 4.8 0.75 40 1
2 Chloride as NaCl (mg/l) 88.7 15.4 16.4 23.0 600 1
3 Sulphate (SO42-) (mg/l) 3.4 3.3 8.9 3.5 400 3
4 Phosphate (PO43-) (mg/l) 1.2 0.5 1.2 0.8 2 3
5 Iron (mg/l) 0.03 0.18 0.35 0.07 2 4
Source: BCIC, 2018
465. It is observed from the data presented in Table 6.18that chemical parameters of
effluent water are well within the ECR standards. The amount of NH3-N shows a rapid
declination between the dry period and wet period. In 2017 February, the amount was 22.4
mg/l and in July, the value went down to 4.8 mg/l. The same trend can be observed in 2018.
The value in the dry period was 7.0 mg/l and the value in wet period went down to 0.75 mg/l.
466. Values of Phosphate also exhibits a similar trend. In both 2017 & 2018, the amount of
PO4present in the sample was 1.52 mg/l. In the wet period, the values were 0.54 mg/l and 0.62
mg/l respectively.
467. Amount of Chloride exhibited maximum values in the dry period of 2017. It was well
within the limits of ECR values.
Loading of Pollutants into the Shitalakhya River
468. Loadings of pollutants from the existing UFFL and PUFFL and proposed factory
(GPUFP) is estimated here. The constituent load at any given time can be determined if the
constituent concentration and the discharge at the time of sampling is known. The load is
computed as follows:
𝐿 =𝐶 ∗ 𝑄
(1000 ∗ 907.18)𝑡𝑜𝑛/𝑑𝑎𝑦
469. Where, L is the constituent load, in short tons per day; C is the constituent
concentration, in milligrams per liter; Q is discharge at time of sampling, in cubic feet per/day;
and the result is divided by 1000 for the conversion of mg into Kg and then by 907.18 for the
conversion of Kg into short ton (US ton). In calculating loadings, concentrations of pollutants