new priorities in asset management · ©2015 new priorities in asset management christopher w....
TRANSCRIPT

©2015
NEW PRIORITIES IN ASSET MANAGEMENT
CHRISTOPHER W. ROSCOEDIRECTOR AND RETAIL SECTOR HEAD
CLARION PARTNERS
©2015
mobile.icsc.org

©2015
INTRODUCTIONS

©2015
MARKET OUTLOOK

©2015
Key Market Trends
• Demand
– Steady growth forecast: GDP expanding at 2.5% - 3.0%
– Expanding labor markets and consumer spending
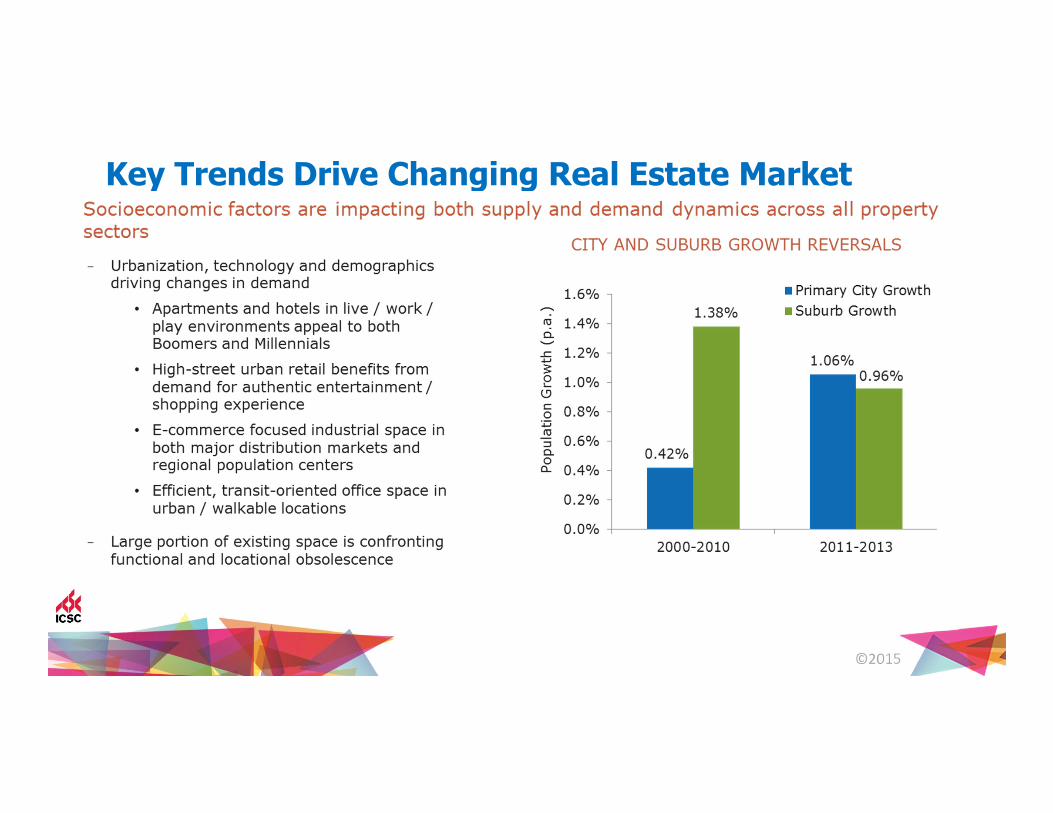
– Shifting real estate demand based on socioeconomic trends
• Supply
– New supply lagging historic levels
– Obsolescence of growing percentage of existing space
• Capital Markets
– Increased demand for core real estate driven by strong US and foreign capital flows
– Strong yields compared to core pricing, resulting in attractive risk-adjusted returns

©2015
A Backdrop of Steady Growth Sets the Stage for Increased Demand
-7
-6
-5
-4
-3
-2
-1
0
1
2
3
4
5
-7%
-6%
-5%
-4%
-3%
-2%
-1%
0%
1%
2%
3%
4%
5%
Annaul Job Growth (Millions)
Annual Real GDP Growth
Employment (right)
GDP (left)

©2015
Strong Sectors Drive Shift in Demand

©2015
New Supply Remains Well Below Historic AveragesObsolescence of existing space further increases demand for well-located, modern functional space

©2015
Rental Increases Following Occupancy Recovery
Source: CBRE-EA, Reis, Clarion Partners Investment Research, November 2014. Note: The forecasted data was provided by Clarion Partners Investment Research, dated November 2014.
Please see important information regarding forecasts and projections at the beginning of this presentation.
©2015
Key Trends Drive Changing Real Estate Market
©2015
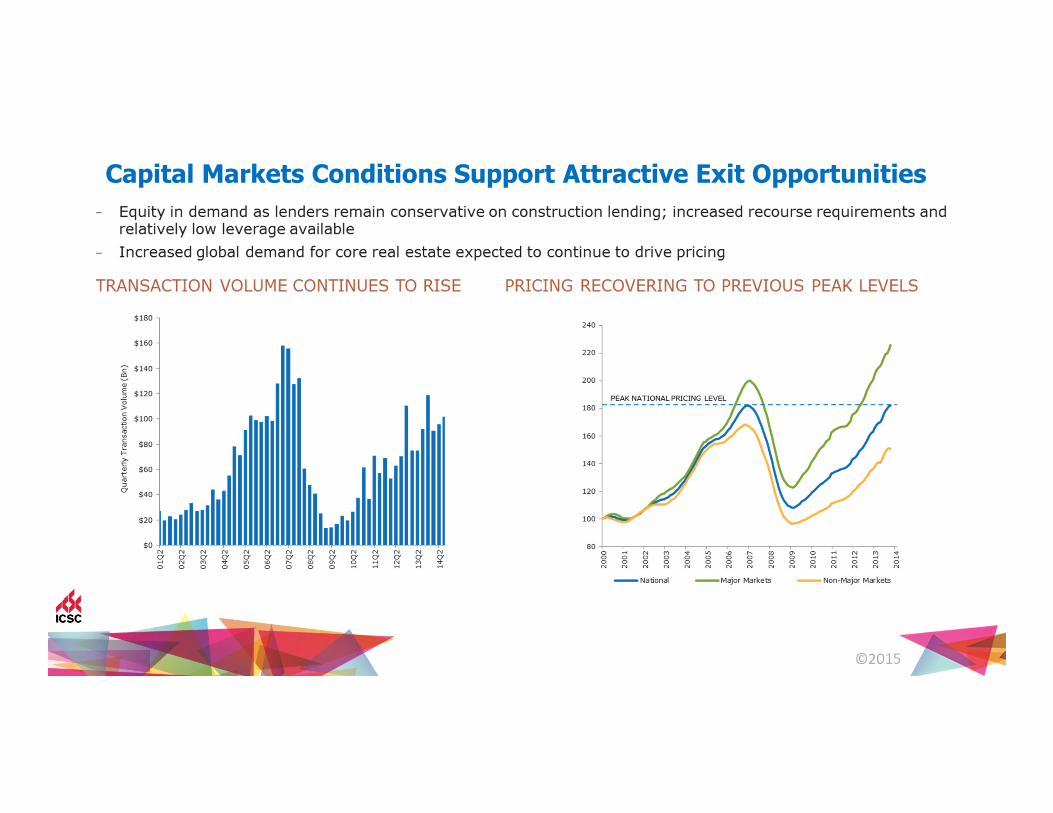
Capital Markets Conditions Support Attractive Exit Opportunities

©2015
RETAIL MARKET OUTLOOK

©2015
U.S. Retail Market Outlook

©2015
Retail: Highest Risk-Adjusted Total Return

©2015
Total Retail Sales Are Now 17% Above the Prior Peak, Driven By Strong Job Gains

©2015
While Income and Wealth Inequality Are Reflected in Bifurcation in Retail Demand, Declining Fuel Prices Benefit All Consumers

©2015
E-commerce Expanding Rapidly at 16% Year-Over-Year And Now Accounts for 8.5% of Core Retail Sales

©2015
Store Formats Shrinking While Major Retailers Are Taking Less Space And Focusing on More Profitable Stores and Locations

©2015
Retail Growth Moderating With Growing Divergence Between Top and Bottom Retailers

©2015
Retail Fundamentals Strengthening Supported by the Lowest New Supply in 25 Years

©2015
Clarion’s Focus: High-Street Retail, Market-Dominant Necessity/Value-Oriented Retail and Neighborhood and Power Centers

©2015
ECONOMIC CONCLUSIONS / SUMMARY
©2015
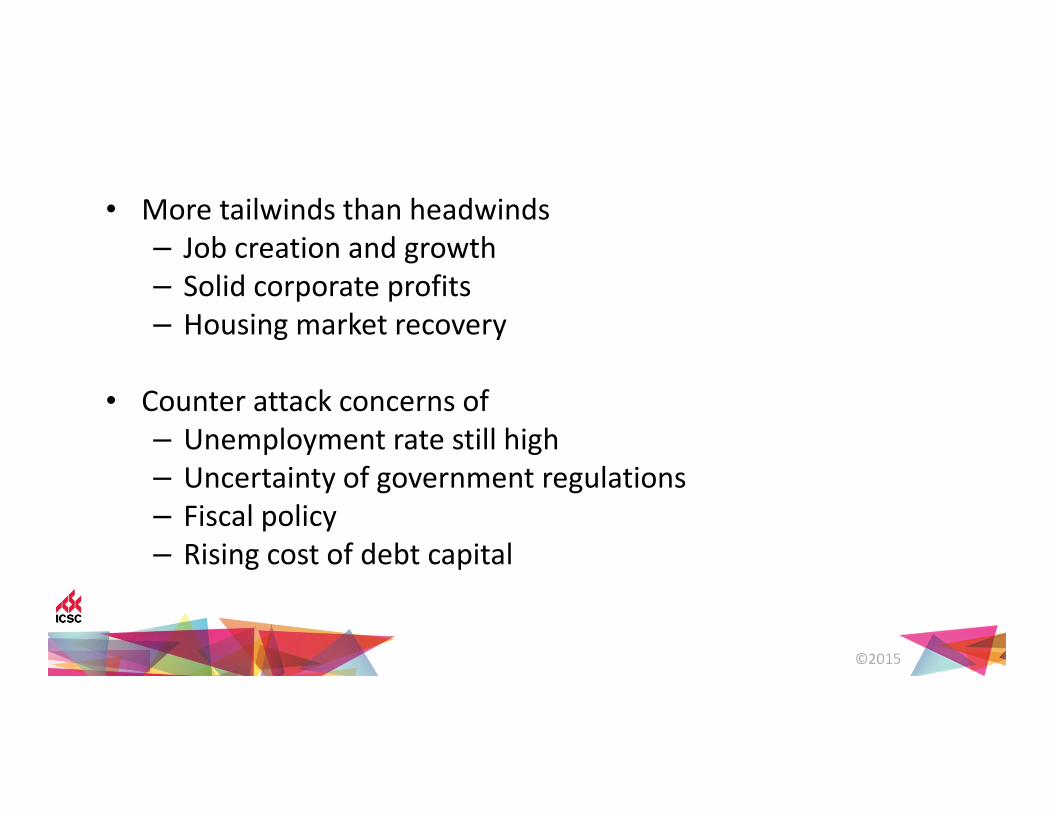
• More tailwinds than headwinds
– Job creation and growth
– Solid corporate profits
– Housing market recovery
• Counter attack concerns of
– Unemployment rate still high
– Uncertainty of government regulations
– Fiscal policy
– Rising cost of debt capital

©2015
• Back to Fundamentals – this transition from cap rate compression to fundamental performance will increase the emphasis on asset management to enhance returns.
• This marks a significant shift from a dependence on cap rate compression for appreciation growth that has become ingrained in investment strategies across all property types.
• Availability of debt and equity capital is on the rise in 2015. Sources of capital all becoming more comfortable with improving market conditions.
• As space is continued to be absorbed with very little new supply, rents will start to push making development proformas begin to make sense.

©2015
• The real estate recovery will gain momentum through 2015.
• Commercial real estate is reaching an inflection point where valuations will no longer be driven by capital markets.
• With cap rate compression beginning to wane, the focus is
more on property fundamentals.
• The search for returns through cap rate compression will become the search for returns through improving property fundamentals and/or operational improvements.

©2015
NEW PRIORITIES IN ASSET MANAGEMENT

©2015
NEW PRIORITIES IN ASSET MANAGEMENT
When we underwrite assets, we look at a lot of property
and market information. There are 3 key pieces that will
have a measurable affect on defining our asset
management strategy:
� Bundle of Rights
� Health Ratio Analysis
� Lease Expiration Schedule

©2015
BUNDLE OF RIGHTS
©2015
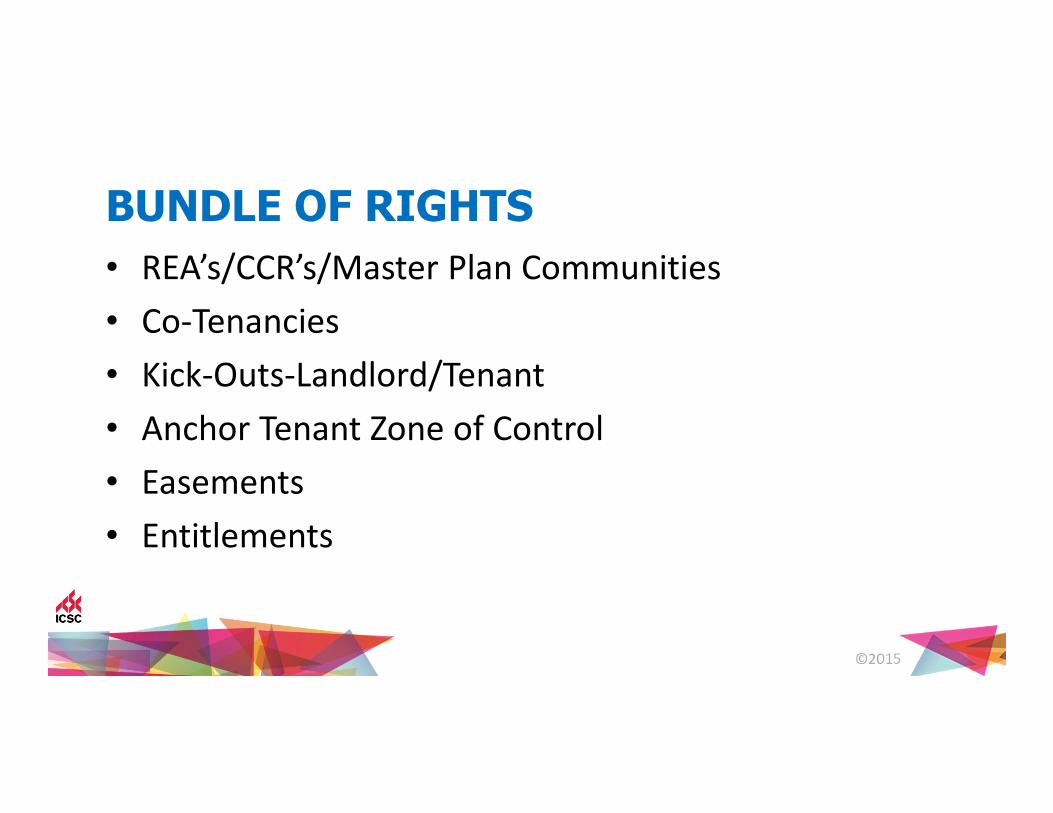
BUNDLE OF RIGHTS
• REA’s/CCR’s/Master Plan Communities
• Co-Tenancies
• Kick-Outs-Landlord/Tenant
• Anchor Tenant Zone of Control
• Easements
• Entitlements

©2015
BUNDLE OF RIGHTS (continued)
• Pads
• Zoning
• Go Dark Clauses
• Debt-Lender Approval
• ROFO’s/ROFR’s
©2015
HEALTH RATIO ANALYSIS

©2015
Lease All-In Gross Sales Health
TENANT Sq. Ft % Expiration Rent Sales PSF Ratio
1 TRADER JOHN'S 13,530 13.15% 12/31/19 36.00$ 10,000,000$ 739.10$ 4.87%
2 JERSEY MARK'S 1,609 1.56% 06/30/15 72.00$ 1,750,000$ 1,087.63$ 6.62%
3 WALGOLD'S 12,489 12.14% 10/31/16 39.00$ 4,750,000$ 380.33$ 10.25%
4 PARTY COUNTY 7,500 7.29% 12/31/15 42.00$ 1,250,000$ 166.67$ 25.20%
5 BANK OF VEGAS 4,075 3.96% 03/31/18 42.00$ 2,250,000$ 552.15$ 7.61%
6 LOCAL PIZZA GUY 1,429 1.39% 03/31/18 45.00$ 425,000$ 297.41$ 15.13%
7 SALLY'S SALON 5,490 5.33% 04/30/17 40.00$ 2,000,000$ 364.30$ 10.98%
8 CHRIS'S TACOS 1,623 1.58% 01/31/16 51.00$ 1,200,000$ 739.37$ 6.90%
9 MIKE'S MEAT PIES 1,661 1.61% 04/30/20 60.00$ 500,000$ 301.02$ 19.93%
10 BETTER BUY 35,000 34.01% 07/31/16 30.00$ 6,000,000$ 171.43$ 17.50%
11 SUBURBAN OUTFITTER 15,000 14.58% 09/30/17 35.00$ 8,000,000$ 533.33$ 6.56%
12 VICTOR'S SECRET 3,500 3.40% 03/31/16 45.00$ 1,000,000$ 285.71$ 15.75%
TOTAL 102,906 100.00% 38,125,000$ 370.48$ 8.21%
ROSCOE'S RETAIL EMPORIUM

©2015
LEASE EXPIRATION SCHEDULE

©2015
0
0.2
0.4
0.6
0.8
1
0 sf
20,000 sf
40,000 sf
60,000 sf
80,000 sf
'15 '16 '17 '18 '19 '20 '21 '22 '23 '24
Annual Area Expiration
Annual Area Expiration Cumulative % Expiration

©2015
0
0.2
0.4
0.6
0.8
1
$-
$200,000
$400,000
$600,000
$800,000
$1,000,000
$1,200,000
'15 '16 '17 '18 '19 '20 '21 '22 '23 '24
Annual Base Rent Expiration
Annual Base Rent Expiration Cumulative % Expiration
©2015

©2015
VALUE CREATION

©2015
INVESTMENT CYCLE
• Acquire Asset
• Develop strategy to maximize value over a defined “hold period”.
• Hire capable property managers and leasing agents to assist with carrying out this strategy.
• Review and adjust strategy as necessary
– Property conditions
– Market conditions
– Capital Market conditions
• Sell and hopefully meet or exceed your client’s return objectives.
©2015
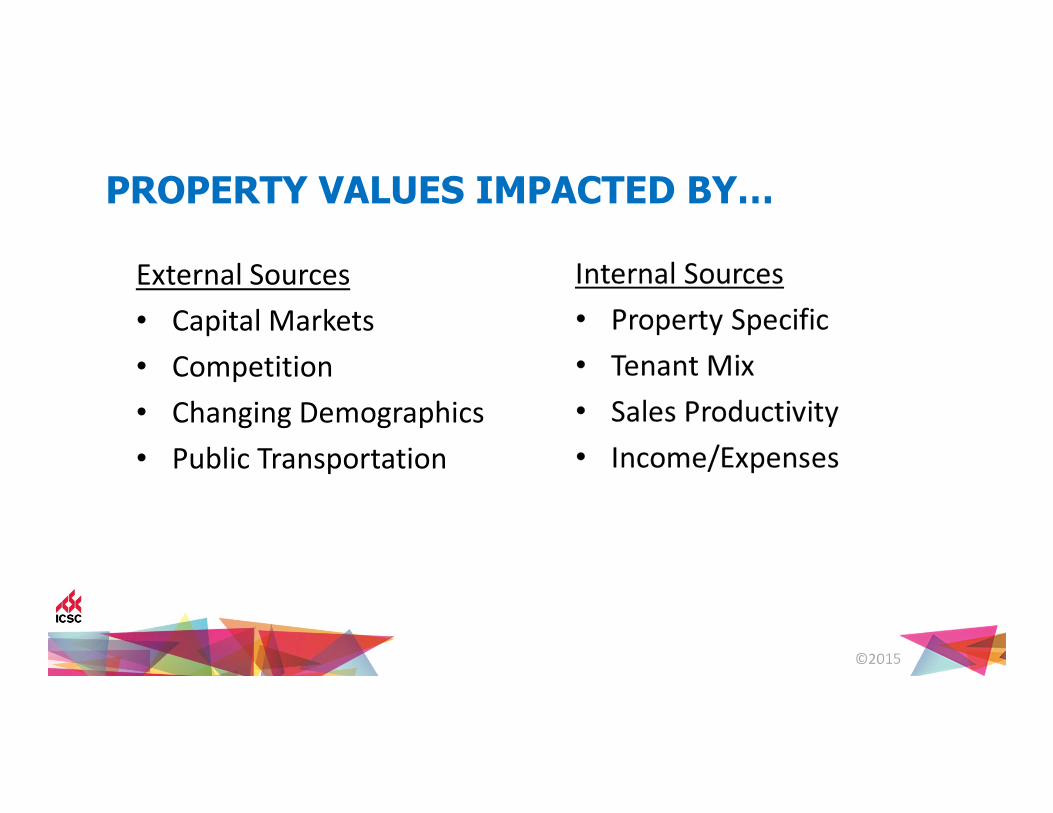
PROPERTY VALUES IMPACTED BY…
External Sources
• Capital Markets
• Competition
• Changing Demographics
• Public Transportation

©2015
VALUE CREATION DRIVERS
• Tenant Mix
• Redevelopments
• Quantifiable vs Unquantifiable Value
• Additional Value Creation Methods

©2015
IMPORTANCE OF TENANT MIX
Getting it right
� Demographics review
� Balancing act
� Local/Regional/National
� Small Shops/Sub-Anchors/Anchors
� Analyzing health ratios
©2015
IMPORTANCE OF TENANT MIX
Getting it right
� Maximizing sales
� Maximizing rents
� Maximizing value

©2015
REDEVELOPMENTS
Reasons for Redevelopement:
• Secure market position
• Meet consumer demand
• Update project

©2015
COMPONENTS OF A PRO FORMA
• Projected sales impact
• Projected market share changes
• Leasing assumptions
• Impact of new tenants/anchors
• Return on cost analysis – incremental rent versus cost
• Cap rate impact
• Discounted cash flow analysis

©2015
PAD DEVELOPMENT EXAMPLE
Assume the Following:
• Land 16,000 s.f.• Original Cost $ 3.00/s.f.• Market Value $12.00/s.f.• Tenant Restaurant• Term 10 Years• Square Footage 6,000 s.f.• Rent $20.00/s.f.• Percentage 6%• Expenses NNN• TI’s $12.00/s.f.• Leasing Commission $ 4.00/s.f.

©2015
QUANTIFIABLE VALUE-ADD

©2015
ANALYSIS “A” (MARKET RETURN)
This analysis outlines a typical developer construction proforma and is a quick check to a market driven return:
• Soft Costs (10%) $ 62,400
• Hard Costs ($60.00/s.f.) $360,000
• T.I. Contribution ($12.00/s.f.) $ 72,000
• Land (Market Value @ $12.00/s.f.) $192,000
• Construction Financing
• (Land & Building @ 10% for 10 months) $ 52,000
• Leasing commission $4.00/s.f. $ 24,000
• Total Project Costs: $762,400
• Restaurant Rent: $120,000
• Return on cost $120,000 / $762,400 = 15.74%
©2015
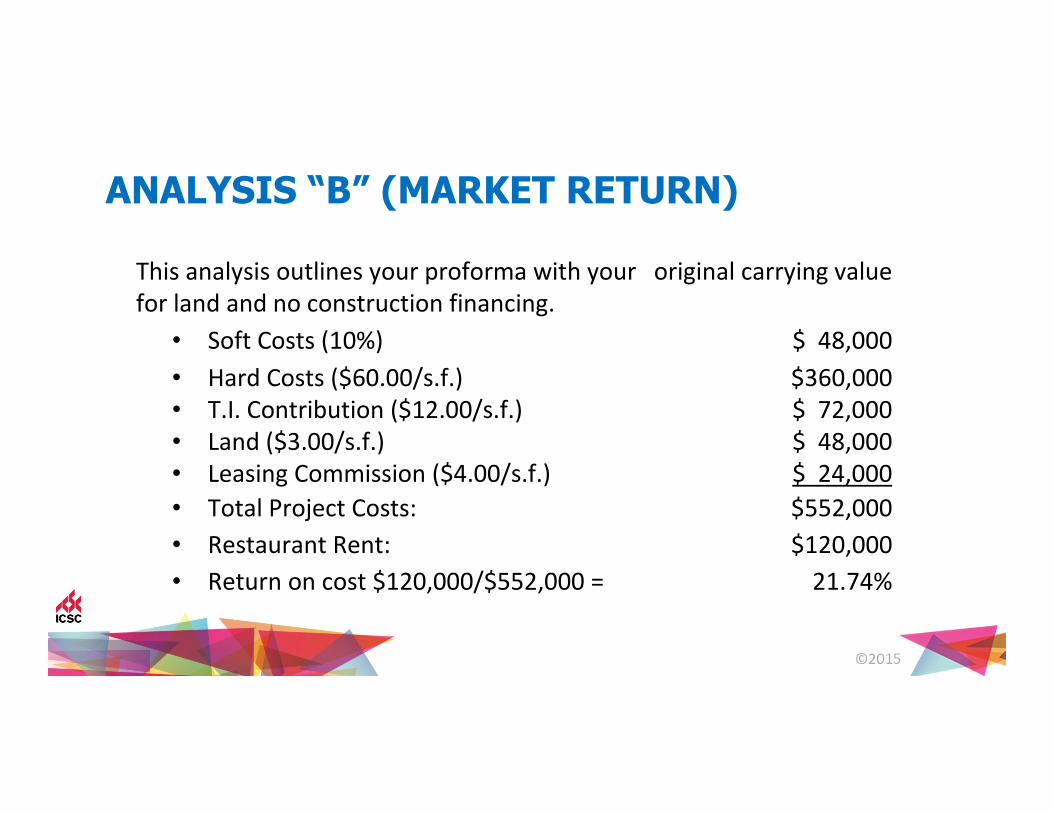
ANALYSIS “B” (MARKET RETURN)
This analysis outlines your proforma with your original carrying value
for land and no construction financing.
• Soft Costs (10%) $ 48,000
• Hard Costs ($60.00/s.f.) $360,000
• T.I. Contribution ($12.00/s.f.) $ 72,000
• Land ($3.00/s.f.) $ 48,000
• Leasing Commission ($4.00/s.f.) $ 24,000
• Total Project Costs: $552,000
• Restaurant Rent: $120,000
• Return on cost $120,000/$552,000 = 21.74%

©2015
UNQUANTIFIABLE VALUE-ADD

©2015
NON-ECONOMIC EXAMPLE
Assume the Following:
• Regional Mall: 1,350,000 square feet
• $18.15/s.f. NNN expenses (CAM, Tax, Ins)
• Annual Sales of $440.00/s.f. (Non-Anchor)
• You have a 4,500 Vacancy:
• Budgeted Rent: $45.00/s.f. NNN
• Budgeted TI: $15.00/s.f.
• Net Effective Rent: $42.60/s.f. NNN
• Proposed Rent: $55.00/s.f. gross
• Proposed TI: $45.00/s.f.
• Net Effective Rent: $31.33/s.f. NNN

©2015
ANALYSIS “A” (NET EFFECTIVE RENT)
Rent/PSF
Free Rent /
Downtime
(Months)
Adjusted
Rent/PSF
Leasing
Commission
TI Allowance &
LL Cost Rent/PSF
Free Rent /
Downtime
(Months)
Adjusted
Rent/PSF
Leasing
Commission
TI Allowance &
LL Cost
Year 1 36.85$ 4 24.57$ 77,112.00$ 202,500.00$ 45.00$ 3 33.75$ 94,162.50$ 67,500.00$
Year 2 36.85$ - 36.85$ 45.00$ - 45.00$
Year 3 36.85$ - 36.85$ 45.00$ - 45.00$
Year 4 36.85$ - 36.85$ 45.00$ - 45.00$
Year 5 36.85$ - 36.85$ 45.00$ - 45.00$
Year 6 40.54$ - 40.54$ 49.50$ - 49.50$
Year 7 40.54$ - 40.54$ 49.50$ - 49.50$
Year 8 40.54$ - 40.54$ 49.50$ - 49.50$
Year 9 40.54$ - 40.54$ 49.50$ - 49.50$
Year 10 40.54$ - 40.54$ 49.50$ - 49.50$
37.47$ 46.13$
31.25$ 42.53$
(169,062.00)$ 1,406,388.00$
(9,787.50)$ 1,913,962.50$
(159,274.50)$ (507,574.50)$
Proposed Deal Budgeted Deal
Average Rent Average Rent
Effective Rent Effective Rent
Proposed Year 1 Revenue
Budgeted Year 1 Revenue
Variance
Proposed Total Revenue
Forecasted Total Revenue
Variance

©2015
VALUE BENEFIT
• Net effective rent decreased by: $11.28
• Year 1 income decreased by: $159,275
• Total income decreased by: $507,575
Where is the value?
• Gross sales prior = $440.00/s.f.
• Gross sales 4 years after = $600.00/s.f.
Increase of $160/s.f. in gross sales in 4 years!
Over $100M additional spent at your center!

©2015
ADDITIONAL VALUE CREATION METHODS
• Land Assemblage
• Marketing/Events
• Security and Cleanliness

©2015
HOLD/SELL DISCUSSION
� Comment on short-term, medium-term, and long-term
hold strategies.
� Supplement short-term, medium-term, and long-term
hold strategies with a financial analysis (discounted cash
flow).
� Review major events with respect to the property and
market within the short-term, medium-term, and long-
term strategies.

©2015
Opportunities• Outlet centers
• A malls –capital partner with operator
• Mixed use
• Urban in-fill city center opportunities
• Suburban in-fill city center opportunities
• High street
• Dominant traditional grocery anchored neighborhood/community centers
• Redevelopment opportunities
• Newer power centers that are right sized
• Ethnic market opportunities

©2015
� Menswear
� Fast Fashion
� E-Commerce/On-Line/Internet…Electronic Sales
� Big Food
� Square Footage Formats
� Lack of Development Supply
� Traditional Grocery Stores
� “Made in the USA”
� Activewear apparel
� Outlets/Factory Stores
� Non-Traditional Uses
� Urban Retail
A few thoughts on trends going forward…

©2015
COMPLETE YOUR SHOW EXPERIENCEMORE THAN 30 SESSIONS CAPTURED LIVE DURING RECON!
• Recording Package $150 usd
• Extend Your Own Education
• Share Sessions with Colleagues
• Compatible with Mobile Devices
icsc.sclivelearningcenter.com

©2015
Course Evaluation
Please Complete Your Evaluation Now.
1. Take Out Your Smartphone or Tablet
2. Go to survey.icsc.org/2015RECON
3. Select this course: New Priorities in Asset Management