new mexico health care workforce committee › files › nmhcwf_2019report_final.pdf · new mexico...
TRANSCRIPT

2019 ANNUAL REPORT
OCTOBER 1, 2019
New Mexico Health CareWorkforceCommittee


New Mexico Health Care Workforce Committee 2019 Annual Report
October 1, 2019
This publication was developed as a white paper to report on the status of the New Mexico health care workforce during the period 1 January 2018 – 31 December 2018. Where appropriate for continuity and clarity, key language has been repeated or excerpted verbatim from prior years’ reports.1–6 For the purposes of attribution and authorship, the New Mexico Health Care Workforce Committee suggests the following citation:
Farnbach Pearson AW, Reno JR, New Mexico Health Care Workforce Committee. 2019 Annual Report. Albuquerque NM: University of New Mexico Health Sciences Center, 2019.

New Mexico Health Care Workforce Committee Report, 2019 i
From the Chair of the New Mexico Health Care Workforce Committee The New Mexico Health Care Workforce Committee is pleased to provide its annual report to the Legislature regarding its analysis of the state’s licensed health professionals and where they practice. New Mexico has become a leader nationally in the compilation and dissemination of health care workforce data, owing to the Legislature’s 2011 mandate that health professionals be surveyed during their re-licensure. Each year, staff members collate and analyze data provided by the health professional licensing boards. This informs the Committee’s recommendations for measures to recruit and retain providers in the state’s rural and underserved areas. This year, we focus on the state’s nursing workforce, including for the first time the demographics of registered nurses, in addition to certified nurse practitioners and clinical nurse specialists. We also discuss recent nursing workforce assessments by other state and national groups, and how these compare to the committee’s analysis. The report also includes our analysis of selected physicians – primary care physicians and specialists in obstetrics and gynecology, general surgery and psychiatry – and physician assistants, as well as these professions’ demographics. We provide additional data on certified nurse-midwives, licensed midwives, dentists and emergency medical technicians. As in past years, the committee offers recommendations for reducing workforce shortages. These are broad recommendations, intended to lay the groundwork for future initiatives, even if funding limitations prevent all of them from being fulfilled at this time. We wish to commend the Legislature and the state for acting on many of our prior recommendations, and we present this report with our gratitude for your dedicated efforts to meet our state’s ongoing challenges in making high-quality health care accessible for all New Mexicans. Sincerely, Richard S. Larson, MD, PhD Chair, New Mexico Health Care Workforce Committee Executive Vice Chancellor, University of New Mexico Health Sciences Center

ii New Mexico Health Care Workforce Committee Report, 2019

New Mexico Health Care Workforce Committee Report, 2019 iii
Summary of the 2019 Recommendations of the New Mexico Health Care Workforce Committee
For detailed descriptions of these recommendations, please see Section VI.
Rec. 1 Provide $6 million in recurring funding for tuition-free training for medical students at public institutions pledging to practice in New Mexico.
Rec. 2 Double funding for New Mexico’s Medical, Nursing and Allied Health Loan-for-Service Programs.
Rec. 3 Increase line-item appropriations to New Mexico’s community colleges for nursing program enhancement.
Rec. 4 Continue to fund NMNEC by making the current funding of $500,000 entirely recurring.
Rec. 5 Fund RPSP for expansion of nursing education and targeted recruitment of Native American and rural students ($199,671).
Rec. 6 Fund RPSP for the freshman direct entry early assurance pre-licensure BSN program ($428,271).
Rec. 7 Fund RPSP for the expansion of physician assistant training ($453,180).
Rec. 8 Establish a tax credit for rural primary care provider and pharmacist preceptors who work with public institutions.
Rec. 9 Increase Nurse Educator Loan-for-Service Program awards to $12,000 per participant per year.
Rec. 10 Fulfill the state’s previous commitment to expansion of a remaining nine primary and secondary care residencies in New Mexico ($1.1 million in recurring funding) and consider further residency expansion through state funding, Medicaid funds or other mechanisms.
Rec. 11 Enact legislation for New Mexico’s participation in PSYPACT, with recurring funding of $6,000 for the cost of the compact.
Rec. 12 Expand the rural health care tax credit to include pharmacists, social workers and counselors.
Rec. 13 Direct the New Mexico Taxation and Revenue Department and Department of Health to examine the effectiveness of the rural health tax credit in recruiting and retaining providers in rural areas.
Rec. 14 Enact memorial legislation creating a subcommittee under the New Mexico Health Care Workforce Committee to examine future health care workforce needs related to the state’s changing demographics and changing makeup of health care teams.
Rec. 15 Provide $250,000 in recurring funding for the analytical, data management and administrative work undertaken by the New Mexico Health Care Workforce Committee.

iv New Mexico Health Care Workforce Committee Report, 2019

New Mexico Health Care Workforce Committee Report, 2019 v
Table of Contents Page
FROM THE CHAIR OF THE NEW MEXICO HEALTH CARE WORKFORCE COMMITTEE ............. i
SUMMARY OF THE 2019 RECOMMENDATIONS OF THE NEW MEXICO HEALTH CARE WORKFORCE COMMITTEE .............................................. iii
LIST OF TABLES ....................................................................................................................................... xi
LIST OF FIGURES .................................................................................................................................... xv
SECTION
I. INTRODUCTION ........................................................................................................................... 1
A. Background ......................................................................................................................... 1
1. Overview of the 2019 Annual Report .................................................................... 1
B. Methodology ....................................................................................................................... 2
1. Practitioner Estimates ............................................................................................ 3
2. Comparison to National Practitioner Benchmarks................................................. 4
3. Understanding the Data ......................................................................................... 5
4. Limitations of the Data .......................................................................................... 7
C. Summary of New Mexico’s Health Care Workforce .......................................................... 8
1. Practitioner Maldistribution ................................................................................. 11
2. Strategies to Improve Health Care Workforce Shortages .................................... 12
II. NEW MEXICO’S NURSING WORKFORCE ............................................................................. 13
A. The Nursing Workforce .................................................................................................... 13
1. Registered Nurses ................................................................................................ 15
a. Executive Summary ................................................................................ 15
b. Methodological Notes ............................................................................. 17
c. Discussion ............................................................................................... 17
2. Certified Nurse Practitioners and Clinical Nurse Specialists ............................... 19
a. Executive Summary ................................................................................ 19
b. Methodological Notes ............................................................................. 21
c. Discussion ............................................................................................... 21

vi New Mexico Health Care Workforce Committee Report, 2019
Section Page B. Other Assessments of the State Nursing Workforce ......................................................... 23
1. Executive Summary ............................................................................................. 23
2. Job Openings for RNs in New Mexico ................................................................ 23
3. Projected Job Growth for RNs in New Mexico ................................................... 24
4. Projected Surplus of RNs in New Mexico ........................................................... 24
5. Discussion ............................................................................................................ 25
C. Discussion ......................................................................................................................... 26
III. NEW MEXICO’S WORKFORCE FOR OTHER HEALTH CARE PROFESSIONS ................. 27
A. Introduction ....................................................................................................................... 27
B. Physicians ......................................................................................................................... 29
1. Primary Care Physicians ...................................................................................... 29
a. Executive Summary ................................................................................ 29
b. Methodological Notes ............................................................................. 31
c. Adjustments to PCP Counts .................................................................... 32
d. Discussion ............................................................................................... 34
2. Obstetrics and Gynecology Physicians ................................................................ 35
a. Executive Summary ................................................................................ 35
b. Methodological Notes ............................................................................. 37
c. Discussion ............................................................................................... 37
3. General Surgeons ................................................................................................. 39
a. Executive Summary ................................................................................ 39
b. Methodological Notes ............................................................................. 41
c. Discussion ............................................................................................... 41
4. Psychiatrists ......................................................................................................... 43
a. Executive Summary ................................................................................ 43
b. Methodological Notes ............................................................................. 45
c. Discussion ............................................................................................... 45
C. Other Health Professions .................................................................................................. 47
1. Physician Assistants ............................................................................................. 47

New Mexico Health Care Workforce Committee Report, 2019 vii
Section Page a. Executive Summary ................................................................................ 47
b. Methodological Notes ............................................................................. 49
c. Discussion ............................................................................................... 49
2. Certified Nurse-Midwives ................................................................................... 51
a. Executive Summary ................................................................................ 51
b. Methodological Notes ............................................................................. 53
c. Discussion ............................................................................................... 53
3. Licensed Midwives .............................................................................................. 55
a. Executive Summary ................................................................................ 55
b. Methodological Notes ............................................................................. 57
c. Discussion ............................................................................................... 57
4. Dentists ................................................................................................................ 59
a. Executive Summary ................................................................................ 59
b. Methodological Notes ............................................................................. 61
c. Discussion ............................................................................................... 61
5. Emergency Medical Technicians ......................................................................... 63
a. Executive Summary ................................................................................ 63
b. Methodological Notes ............................................................................. 65
c. Discussion ............................................................................................... 65
D. Status of Survey Transitions ............................................................................................. 67
1. Pharmacists .......................................................................................................... 67
2. The Primary Care Workforce............................................................................... 67
E. Discussion of the Women’s Health and Birth Attendant Workforce ................................ 69
F. Demographics of Selected Health Professionals .............................................................. 73
1. Executive Summary ............................................................................................. 73
2. Gender .................................................................................................................. 74
3. Race and Ethnicity ............................................................................................... 75
4. Age ....................................................................................................................... 77
G. Discussion ......................................................................................................................... 78
viii New Mexico Health Care Workforce Committee Report, 2019
Section Page IV. NEW MEXICO’S BEHAVIORAL HEALTH WORKFORCE .................................................... 79
A. Introduction ....................................................................................................................... 79
B. Methodology ..................................................................................................................... 79
C. Analysis of New Mexico’s Behavioral Health Workforce ............................................... 81
1. Behavioral Health Care Providers ....................................................................... 81
a. Behavioral Health Care Providers by Provider Type ............................. 81
b. Independently and Non-Independently Licensed Behavioral Health Care Providers .......................................................... 83
2. Demographics of Behavioral Health Care Providers ........................................... 84
a. Gender..................................................................................................... 84
b. Race and Ethnicity .................................................................................. 84
c. Age .......................................................................................................... 86
V. UPDATE ON PREVIOUS RECOMMENDATIONS OF THE NEW MEXICO HEALTH CARE WORKFORCE COMMITTEE................................ 87
A. Introduction ....................................................................................................................... 87
B. Status of 2014 Recommendations ..................................................................................... 87
1. 2014 Education and Training Recommendations ................................................ 87
2. 2014 Financial Incentives for Addressing Shortages ........................................... 88
3. 2014 Recruitment for Retention in New Mexico Communities .......................... 88
4. 2014 New Mexico Health Care Workforce Committee....................................... 89
C. Status of 2015 Recommendations ..................................................................................... 91
1. 2015 Behavioral Health Recommendations ......................................................... 91
2. 2015 Recommendations for Other Health Professions ........................................ 92
D. Status of 2016 Recommendations ..................................................................................... 95
1. 2016 Behavioral Health Recommendations ......................................................... 95
2. 2016 Recommendations for Other Health Professions ........................................ 96
E. Status of 2017 Recommendations ..................................................................................... 99
1. 2017 Recommendations for All Health Professions ............................................ 99
2. 2017 Behavioral Health Recommendations ....................................................... 100
F. Status of 2018 Recommendations ................................................................................... 101
New Mexico Health Care Workforce Committee Report, 2019 ix
Section Page 1. 2018 Recommendations for All Health Professions .......................................... 101
2. 2018 Recommendations for Behavioral Health Professions .............................. 102
3. 2018 Recommendation for Correction and Alignment of New Mexico’s Health Professionals Surveys .................................................... 103
VI. 2019 RECOMMENDATIONS OF THE NEW MEXICO HEALTH CARE WORKFORCE COMMITTEE ....................................................................... 105
REFERENCES ......................................................................................................................................... 111
APPENDIX
A. BIBLIOGRAPHY OF PUBLICATIONS AND CONFERENCE PRESENTATIONS RESULTING FROM NEW MEXICO’S HEALTH CARE WORKFORCE DATA .................. 115
B. BENCHMARK GAP ANALYSES FOR NEW MEXICO HEALTH CARE PROFESSIONS ............................................................................................... 117
C. PRESS RELEASE ENUMERATING RN JOB OPENINGS ...................................................... 129
D. ADDITIONAL PRACTICE DETAILS FOR NEW MEXICO BEHAVIORAL HEALTH PROVIDERS ................................................................................... 131
E. SURVEY COLLECTION PROGRESS, 2010 – 2018 ................................................................ 137
F. MEMBERS OF THE NEW MEXICO HEALTH CARE WORKFORCE COMMITTEE, OCTOBER 1, 2019 .................................................................. 139

x New Mexico Health Care Workforce Committee Report, 2019

New Mexico Health Care Workforce Committee Report, 2019 xi
List of Tables Page 1.1 Number of Health Professionals with New Mexico Licenses Practicing in the State ..................... 3
1.2 Practitioner-to-Population Benchmarks Used to Assess the New Mexico Health Care Workforce ........................................................................................ 4
1.3 Important Points of Difference among Health Care Workforce Analyses ...................................... 5
1.4 Summary of Statewide Health Care Professionals Since 2013 ........................................................ 9
2.1 RN Distribution by New Mexico County Since 2012 ................................................................... 16
2.2 Counties with the Greatest Numbers of RNs Below National Benchmark.................................... 17
2.3 CNP/CNS Distribution by New Mexico County Since 2013 ........................................................ 20
2.4 Counties with the Greatest Numbers of CNPs/CNSs Below National Benchmark ....................... 21
3.1 Primary Care Physician Distribution by New Mexico County Since 2013 ................................... 30
3.2 Counties with the Greatest Numbers of PCPs Below National Benchmark .................................. 31
3.3 Adjustments to 2018 PCP Counts by New Mexico County .......................................................... 33
3.4 OB-GYN Physician Distribution by New Mexico County Since 2013 ......................................... 36
3.5 Counties with the Greatest Numbers of OB-GYNs Below National Benchmark.......................... 37
3.6 General Surgeon Distribution by New Mexico County Since 2013 .............................................. 40
3.7 Counties with the Greatest Numbers of General Surgeons Below National Benchmark .............. 41
3.8 Psychiatrist Distribution by New Mexico County Since 2013 ...................................................... 44
3.9 Counties with the Greatest Numbers of Psychiatrists Below National Benchmark ...................... 45
3.10 Physician Assistant Distribution by New Mexico County Since 2014 .......................................... 48
3.11 Counties with the Greatest Numbers of Physician Assistants Below National Benchmark .......... 49
3.12 CNM Distribution by New Mexico County Since 2016 ................................................................ 52
3.13 Counties with the Greatest Numbers of CNMs Below National Benchmark ................................ 53
3.14 LM Distribution by New Mexico County Since 2016 ................................................................... 56
3.15 Counties with the Greatest Numbers of Licensed Midwives Below National Benchmark ........... 57
3.16 Dentist Distribution by New Mexico County Since 2014 ............................................................. 60
3.17 Counties with the Greatest Numbers of Dentists Below National Benchmark.............................. 61
3.18 EMT Distribution by New Mexico County Since 2016 ................................................................ 64
3.19 Counties with the Greatest Numbers of EMTs Below National Benchmark ................................. 65
xii New Mexico Health Care Workforce Committee Report, 2019
Table Page 3.20 Women’s Health Providers and Birth Attendants by County ........................................................ 70
3.21 Gender of Surveyed New Mexico Physicians ................................................................................ 74
3.22 Gender of Surveyed New Mexico CNPs/CNSs and PAs .............................................................. 74
3.23 Race of Surveyed New Mexico Physicians, PAs and Nurses Compared to New Mexico’s Population ........................................................................................ 75
3.24 Ethnicity of Surveyed New Mexico Physicians, PAs and Nurses Compared to New Mexico’s Population ........................................................................................ 76
3.25 Age of Surveyed New Mexico Physicians ..................................................................................... 77
3.26 Age of Surveyed New Mexico PAs and Nurses ............................................................................ 77
4.1 Behavioral Health Care Providers by License Category ............................................................... 82
4.2 Gender of New Mexico Behavioral Health Care Providers Compared to New Mexico’s Population ........................................................................................ 84
4.3 Race of Surveyed New Mexico Behavioral Health Care Providers Compared to New Mexico’s Population ........................................................................................ 85
4.4 Ethnicity of Surveyed New Mexico Behavioral Health Care Providers Compared to New Mexico’s Population ........................................................................................ 85
4.5 Race and Ethnicity of Surveyed New Mexico Psychiatric CNPs/CNSs ........................................ 85
4.6 Age of Behavioral Health Care Providers ...................................................................................... 86
B.1 Benchmark Gap Analysis of New Mexico Registered Nurses .................................................... 118
B.2 Benchmark Gap Analysis of New Mexico Certified Nurse Practitioners and Clinical Nurse Specialists ..................................................................................................... 119
B.3 Benchmark Gap Analysis of New Mexico Primary Care Physicians .......................................... 120
B.4 Benchmark Gap Analysis of New Mexico Obstetricians and Gynecologists .............................. 121
B.5 Benchmark Gap Analysis of New Mexico General Surgeons ..................................................... 122
B.6 Benchmark Gap Analysis of New Mexico Psychiatrists ............................................................. 123
B.7 Benchmark Gap Analysis of New Mexico Physician Assistants ................................................. 124
B.8 Benchmark Gap Analysis of New Mexico Certified Nurse-Midwives ....................................... 125
B.9 Benchmark Gap Analysis of New Mexico Licensed Midwives .................................................. 126
B.10 Benchmark Gap Analysis of New Mexico Dentists .................................................................... 127
B.11 Benchmark Gap Analysis of New Mexico Emergency Medical Technicians ............................. 128

New Mexico Health Care Workforce Committee Report, 2019 xiii
Table Page D.1 Proportion of Behavioral Health Care Providers Surveyed by Large License Category and License Type ............................................................................. 132
D.2 Ratio of Behavioral Health Care Providers-to-Population by Large License Category and County ....................................................................................... 133
D.3 New Mexico Behavioral Health Providers .................................................................................. 134
D.4 Proportion of Independently Licensed Psychotherapy Providers ................................................ 135
E.1 Health Care Professionals’ License Renewal Surveys Obtained Since 2010 .............................. 138

xiv New Mexico Health Care Workforce Committee Report, 2019

New Mexico Health Care Workforce Committee Report, 2019 xv
List of Figures Page 1.1 Interpretation of the Benchmark Maps ............................................................................................ 6
1.2 Benchmark Status by County for all Health Care Professions at a Glance.................................... 10
1.3 Population Density of New Mexico Counties................................................................................ 11
1.4 Schematic for Increasing Health Care Workforce in New Mexico ............................................... 12
2.1 Registered Nurses Compared to Benchmark, 2018 ....................................................................... 15
2.2 CNPs and CNSs Compared to Benchmark, 2018 .......................................................................... 19
3.1 Primary Care Physicians Compared to Benchmark, 2018 ............................................................. 29
3.2 OB-GYNs Compared to Benchmark, 2018 ................................................................................... 35
3.3 General Surgeons Compared to Benchmark, 2018 ........................................................................ 39
3.4 Psychiatrists Compared to Benchmark, 2018 ................................................................................ 43
3.5 Physician Assistants Compared to Benchmark, 2018 .................................................................... 47
3.6 CNMs Compared to Benchmark, 2018 .......................................................................................... 51
3.7 LMs Compared to Benchmark, 2018 ............................................................................................. 55
3.8 Dentists Compared to Benchmark, 2018 ....................................................................................... 59
3.9 Emergency Medical Technicians Compared to Benchmark, 2018 ................................................ 63
4.1 Composition of Behavioral Health Care Workforce, 2018 ............................................................ 81
4.2 Percent of Clinicians with Independent Licensure, 2018............................................................... 83

xvi New Mexico Health Care Workforce Committee Report, 2019

New Mexico Health Care Workforce Committee Report, 2019 1
Section I
Introduction
I.A. Background The landmark passage in 2011 of the New Mexico Health Care Work Force Data Collection, Analysis and Policy Act (“the Act”) positioned the state at the national forefront in its ability to collect and analyze health workforce data, as well as to bring this evidence to bear in health workforce planning.7
Under the Act, all health professional licensing boards are required to collect a core essential data set at the time of license issue and/or renewal. The Act further established the New Mexico Health Care Workforce Committee, a broad group of stakeholders who oversee analysis of these data and develop recommendations to the Legislature to improve access to health professionals for all New Mexicans. In 2012, the Act was amended to assign data stewardship and committee leadership to the University of New Mexico Health Sciences Center, benefitting these efforts toward statewide health workforce planning through the unique resources of the state’s only academic health center.
This annual report is the committee’s seventh since 2013. In the intervening years, analysis has expanded from six to 12 professions, and now regularly includes in-depth analyses of special interest topics such as the behavioral health or women’s health workforce, workforce trends over time or, this year, the state’s nursing workforce. Beyond this annual report, the New Mexico Health Care Workforce Committee conducts research on topics of interest both within the state and nationally, disseminated through research publications and conference presentations (see Appendix A for a full bibliography of the research works produced). Since publication of the October 1, 2018 annual report, the state’s health care workforce data informed a conference presentation on part-time and full-time practice patterns among New Mexico’s physician workforce and a conference poster comparing demographic and practice patterns among rural and metropolitan obstetrics and gynecology physicians.8,9 Research products like these bring awareness nationally to New Mexico as a leader in this area, in addition to offering in-depth insights into the state’s health care workforce needs.
I.A.1 Overview of the 2019 Annual Report Each year of data collection under the Act brings new breadth and depth, as established individuals complete new license renewal surveys and new providers complete their first surveys. This year, we are pleased to include a special focus section on the state’s nursing workforce (Section II), including for the first time the demographics of registered nurses (RNs) in addition to certified nurse practitioners and clinical nurse specialists (CNPs/CNSs) (Section III.F). In addition, this report features discussion of recent nursing workforce assessments by other state and national groups, and how these compare to the committee’s analysis (Section II.B). Section III includes our analysis of selected physicians – primary care physicians (PCPs) (Section III.B.1) and specialists in obstetrics and gynecology (OB-GYNs) (Section III.B.2), general surgery (Section III.B.3), or psychiatry (Section III.B.4) – and physician assistants (PAs) (Section III.C.1), as well as these professions’ demographics (Section III.F). Section III also reports on other professions, including certified nurse-midwives (CNMs) (Section III.C.2), licensed midwives (LMs) (Section III.C.3), dentists (Section III.C.4) and emergency medical technicians (EMTs) (Section III.C.5). Our customary analysis of pharmacists, primary care advanced practice nurses and

2 New Mexico Health Care Workforce Committee Report, 2019
primary care physician assistants will return in future years; these professions are undergoing survey transitions, discussed in Section III.D, and we will resume their analysis once the majority of providers have completed the improved surveys. We are grateful to the New Mexico Regulation and Licensing Department for their prompt correction of last year’s survey issues, which has allowed us to resume our focus section on behavioral health (Section IV). As in past years, the report concludes with an overview of progress on prior years’ recommendations (Section V) and our 2019 recommendations (Section VI).
I.B. Methodology This year’s report is informed by eight full years of data collection and committee activities. As established under the Act, required surveys are completed at license renewal for all health care professionals licensed by the state, including medical, dental, nursing, behavioral and allied health professions. Each professional licensing board administers the surveys, which must include questions regarding demographics, practice status, education and training, practice activities, hours and weeks worked, acceptance of Medicare/Medicaid, near-future practice plans and the effects of changes in professional liability insurance on practice plans. Beyond this core essential data set, boards may choose to include survey items relevant to their profession.
In this report, we provide estimates of the health care workforce practicing in New Mexico during any part of calendar year 2018 in the following professions:
1. Registered Nurses (RNs): Includes all individuals licensed as RNs by the Board of Nursing, excluding those also licensed as certified nurse-midwives, certified nurse practitioners, clinical nurse specialists and/or certified registered nurse anesthetists (CRNAs).
2. Certified Nurse Practitioners (CNPs) and Clinical Nurse Specialists (CNSs): Includes CNPs and CNSs in practice areas other than behavioral health. Not included in this count are psychiatric CNPs and CNSs, CRNAs and certified nurse-midwives who are not also CNPs.
3. Primary Care Physicians (PCPs): Includes all medical doctors (MDs) and doctors of osteopathy (DOs) who specialize in family practice, family medicine, general practice, general pediatrics or general internal medicine.
4. Obstetrics and Gynecology Physicians (OB-GYNs): Includes all MDs and DOs who specialize in obstetrics and/or gynecology.
5. General Surgeons: Includes all MDs and DOs who specialize in general surgery. 6. Psychiatrists: Includes all MDs and DOs who specialize in psychiatry. 7. Physician Assistants (PAs): Includes all providers licensed as physician assistants by the Board
of Medicine or Board of Osteopathy. 8. Certified Nurse-Midwives (CNMs): Includes all individuals licensed as CNMs by the
Department of Health, whether CNM only or CNM and CNP. 9. Licensed Midwives (LMs): Includes all individuals licensed as LMs by the Department of
Health. 10. Dentists: Includes all licensed dentists. 11. Emergency Medical Technicians (EMTs): Includes all individuals licensed as EMT-Basic,
EMT-Intermediate or EMT-Paramedic.

New Mexico Health Care Workforce Committee Report, 2019 3
I.B.1. Practitioner Estimates In order to produce an accurate and complete snapshot of New Mexico’s health care workforce, the number of practitioners in each county were estimated by linking licensure data (name, date of birth, mailing address and credentials) with license renewal survey responses. By merging these two valuable data sets, we reduce the limitations inherent in either data set on its own.
Licensure data do not allow for precise estimates of practice location. Many health care providers maintain licensure in multiple states, and may choose to receive mail related to their licensure at an address other than where they practice, such as a residence or post office box. For example, of the 9,704 physicians with active New Mexico licenses during 2018, only 5,548 (57.2%) report practice addresses in New Mexico on the license renewal survey (Table 1.1).
Table 1.1. Number of Health Professionals with New Mexico Licenses Practicing in the State
In addition, licensure data alone may overestimate practitioner counts for professions that maintain multiple levels of licensure. It is common for New Mexico’s nurses, dentists and EMTs to carry several concurrent licenses, such as a CNP who is also an RN, but our analysis includes individuals only once at the highest level of licensure. The only exception is CNPs who are also CNMs; these levels of licensure are considered equal and these individuals are accordingly counted as both CNPs and CNMs.
Another potential source of overcounting is physician specialties. General internal medicine or pediatric physicians who subspecialize as cardiologists or endocrinologists do not practice as primary care physicians. Because the survey data distinguish between specialty and subspecialty, we are able to correctly allocate such individuals among the state’s specialist physicians, rather than the primary care workforce.
Because the Act requires that practitioners be surveyed at renewal, survey data is not yet available for some individuals. Physicians (MDs and DOs), for example, are not surveyed upon initial licensure. After their initial license renewal, they are required to renew their licenses and complete surveys every three years. As a result, collecting survey responses across all physicians requires a full three-year cycle; it is important to note that practice changes such as reducing hours or moving counties will not be registered
Profession Percent
Practicing in NM, 2017
Total Licensed in NM
Estimated Total Practicing in NM
Percent Practicing in NM,
2018 RNs 67.0% 28,883 17,526 60.7% CNPs/CNSs 67.5% 2,415 1,542 63.9% All MDs/DOs 57.4% 9,704 5,548 57.2%
Primary Care Physicians 64.4% 3,365 2,162 64.2% OB-GYN Physicians 66.5% 401 279 69.6% General Surgeons 60.2% 300 188 62.7% Psychiatrists 57.0% 578 317 54.8%
Physician Assistants 75.4% 1,107 805 72.7% CNMs 95.2% 213 169 79.3% Licensed Midwives 52.5% 78 40 51.3% Dentists 76.0% 1,608 1,216 75.6% EMTs 92.5% 7,358 6,501 88.4%
4 New Mexico Health Care Workforce Committee Report, 2019
until the physician next renews his or her license. At the time of this report, 82.7% of physicians licensed in New Mexico had completed a survey. The remaining portion comprises physicians who have not yet renewed their licensure, and thus have not yet had the opportunity to respond to the survey. Similar conditions prevail across all professions except EMTs and those professions licensed by the Board of Nursing, who are surveyed at initial licensure as well as license renewal.
With the exception of EMTs and the professions licensed by the Board of Nursing, who are surveyed at initial licensure as well as license renewal, county-level practitioner estimates have been adjusted to account for un-surveyed individuals. Practitioners who have completed a survey were allocated to practice locations by self-reported practice location ZIP codes; practitioners with blank, out-of-state or unrecognized ZIP codes were counted as practicing outside of New Mexico. For those practitioners who have not yet completed a survey, practice locations were estimated from license mailing address ZIP codes. For this limited subset of providers, using mailing address as a proxy for practice location is a reasonable approximation.
Additional methodology specific to individual professions is detailed under those professions in Sections II, III and IV. Appendix E shows the proportion surveyed for all licensed health professionals.
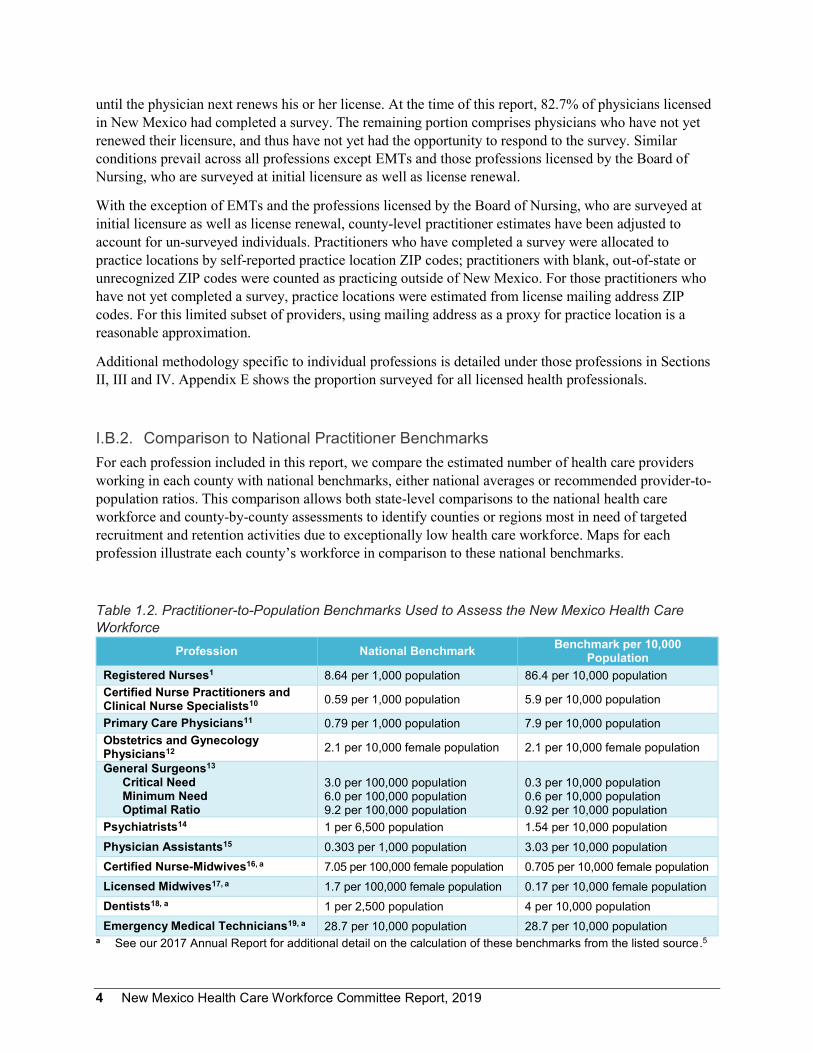
I.B.2. Comparison to National Practitioner Benchmarks For each profession included in this report, we compare the estimated number of health care providers working in each county with national benchmarks, either national averages or recommended provider-to-population ratios. This comparison allows both state-level comparisons to the national health care workforce and county-by-county assessments to identify counties or regions most in need of targeted recruitment and retention activities due to exceptionally low health care workforce. Maps for each profession illustrate each county’s workforce in comparison to these national benchmarks.
Table 1.2. Practitioner-to-Population Benchmarks Used to Assess the New Mexico Health Care Workforce
Profession National Benchmark Benchmark per 10,000 Population
Registered Nurses1 8.64 per 1,000 population 86.4 per 10,000 population Certified Nurse Practitioners and Clinical Nurse Specialists10 0.59 per 1,000 population 5.9 per 10,000 population
Primary Care Physicians11 0.79 per 1,000 population 7.9 per 10,000 population Obstetrics and Gynecology Physicians12 2.1 per 10,000 female population 2.1 per 10,000 female population
General Surgeons13 Critical Need Minimum Need Optimal Ratio
3.0 per 100,000 population 6.0 per 100,000 population 9.2 per 100,000 population
0.3 per 10,000 population 0.6 per 10,000 population 0.92 per 10,000 population
Psychiatrists14 1 per 6,500 population 1.54 per 10,000 population Physician Assistants15 0.303 per 1,000 population 3.03 per 10,000 population Certified Nurse-Midwives16, a 7.05 per 100,000 female population 0.705 per 10,000 female population Licensed Midwives17, a 1.7 per 100,000 female population 0.17 per 10,000 female population Dentists18, a 1 per 2,500 population 4 per 10,000 population Emergency Medical Technicians19, a 28.7 per 10,000 population 28.7 per 10,000 population
a See our 2017 Annual Report for additional detail on the calculation of these benchmarks from the listed source.5

New Mexico Health Care Workforce Committee Report, 2019 5
Table 1.2 summarizes the national benchmarks used to assess New Mexico’s health care workforce. County-level population estimates from the U.S. Census Bureau were used to calculate practitioner-to-population ratios for each county, and the number of providers necessary for the county to meet the benchmark.20
I.B.3. Understanding the Data There are many possible approaches to workforce analysis. The analysis undertaken by the New Mexico Health Care Workforce Committee for this annual report measures the workforce practicing in the state in comparison to national benchmarks, taking care to match the New Mexico providers we include to those included in the benchmark calculation. Other analyses might measure workforce supply (all licensed providers), workforce demand (as measured by job openings, population demographics or an ideal ratio of providers to population or hospital bed) or projected need. As a result, not all workforce studies are directly comparable. In order to make meaningful inferences regarding New Mexico’s need for providers and to understand the data in this report in relation to other workforce publications, it is necessary for the reader to gauge whether two analyses are comparable as “apples to apples,” that is, measuring the same things using the same methodology. Table 1.3 highlights common differences between the committee’s analysis and other popular methods as a framework for understanding why the values presented in this report may differ from other published reports. This is discussed in additional detail in Section II.B, which compares the committee’s analysis for RNs with other recently published reports.
Table1.3. Important Points of Difference among Health Care Workforce Analyses NM Health Care Workforce Committee Analysis Other Analyses
Data from state licensure lists and state-mandated re-licensure survey
Data from state licensure lists, national licensure lists, federal Department of Labor surveys, non-mandatory surveys or other sources
Location by practice address Location methodology varies Headcounts of practicing individuals May be headcount of practicing individuals, headcount
of licensed individuals, a calculation of full-time equivalents or other methodology
Practitioners are included or excluded based on methodology used to calculate national benchmarks
Practitioners may be included or excluded based on different standards
Measures workforce per capita compared to national benchmarks
May measure workforce supply from counts or per capita ratios, need from estimated ideal ratios based on population demographics, demand from advertised job openings, projected demand via simulation or other methodology
National benchmarks and county-level benchmark maps like those shown in Figure 1.1 provide an accurate and readily understood snapshot of the state’s health care workforce. However, it is important to remember in reviewing Sections II and III that the number of health care professionals above or below benchmark is not a direct measure of the population’s access to health care, or the adequacy of the workforce to meet the county’s health care needs. These county-level provider-to-population ratios do not take into account the distribution of health care providers, distribution of the population or the

6 New Mexico Health Care Workforce Committee Report, 2019
population’s health care needs. Important factors in access to care, including practitioner work hours, patient utilization of care, severity of illness, driving distance to the nearest provider and others, are assumed homogeneous using this method.
Maps similar to that shown in Figure 1.1 are included for each profession analyzed. This guide explains how to interpret each element of these maps.
Figure 1.1. Maps like this one are included for each profession analyzed in Sections II and III. The text boxes here highlight the key points illustrated by these benchmark maps. For maps with different coloration or format, keys to interpretation can be found in the figure captions.
The COLOR of each county corresponds to its providers above or below the national benchmark. Green counties are at or above benchmark, yellow counties are moderately below benchmark, and red counties are severely below benchmark.
The NUMBER in each county shows the number of providers above or below benchmark. In this example, Luna County would need to add two providers in order to meet the national benchmark.
Additional SYMBOLS like these may be included for additional information pertinent to the profession. Look in the legend for their definitions.
What’s the difference between counties with the number ZERO and colored GREEN or GRAY? In both cases, the number zero indicates that the number of providers is the same as the benchmark value. Those with a benchmark of zero and no providers are GRAY, while those with a benchmark of one or more that is met by the number of providers identified for the county are GREEN.
The BENCHMARK VALUE is provided in the legend of each map for easy reference.
New Mexico Health Care Workforce Committee Report, 2019 7
In summary, provider-to-population ratios have been selected as the most appropriate metric for national and county-level workforce comparisons. However, these do not measure workforce adequacy directly, and should be considered an indicator of areas that may be most in need of additional resources.
I.B.4. Limitations of the Data While New Mexico is unique in the quality and robustness of its workforce data, the practitioner surveys cannot capture certain aspects of the health professional workforce. First, as mentioned previously, some providers have not yet had the opportunity to complete a license renewal survey, either because they have not yet renewed their license or because they have not done so since their profession instituted the survey. Appendix E summarizes the survey response rate by profession, disregarding surveys older than one full licensure cycle; note that the surveys we reported as missing in the 2018 annual report have been restored through the efforts of the New Mexico Regulation and Licensing Department.
Second, several professions have recently updated their surveys for improved data collection. In 2018, the Board of Pharmacy implemented a new survey system to align the registered pharmacist survey with the Act; to date, 20.3% of the state’s licensed pharmacists have completed surveys under the new system. The new survey data will allow analysis of pharmacists by practice location rather than mailing address. Because we anticipate shifts in the distribution of the state’s pharmacists to occur in the transition between mailing address and practice location, we will resume our analysis of pharmacists once the majority have completed surveys under the new system.
Similarly, in estimating the primary care CNP/CNS and physician assistant workforce, we have previously used self-reported practice area for CNPs/CNSs and an estimate of the proportion of physician assistants providing primary care. Because a specialty item has recently been implemented on the physician assistant survey and because the practice area options nurses may select on their survey have recently changed, we will also resume our analysis of these providers’ contributions to the primary care workforce once the majority have been surveyed under the new survey items.
Third, survey data are by nature subject to uncertainty introduced by variation among respondents; the state’s health care professional licensure survey data is no exception. Providers may differ in their interpretation of a survey item, which in turn affects their responses. For example, New Mexico physicians are asked what proportion of their work hours are spent in direct patient care. While one respondent may include only time in the exam room, another may include interpretation of laboratory results, writing up notes and other patient care activities beyond that spent face-to-face with patients. In addition, providers may choose not to answer survey items to which they are uncomfortable providing data or do not know the correct response.
Finally, we emphasize that national benchmarks do not measure workforce adequacy, surplus or shortage. For the majority of the professions analyzed, no optimal provider-to-population ratio has been identified. Indeed, variation in population density, health care needs and insurance coverage make it unlikely that a single optimal provider-to-population ratio could be pinpointed for any health care profession. In addition, the benchmarks used here combine practice specialties in a manner appropriate to large-grained analysis such as the county-level measures, but may obscure finer-grained details of the population’s health care needs. For example, primary care physicians include both adult and pediatric primary care providers; a county above benchmark for primary care physicians could host many adult providers and few pediatricians relative to the county’s demographics.

8 New Mexico Health Care Workforce Committee Report, 2019
As a result, provider counts above benchmarks throughout Sections II and III should not be assumed to represent surplus, or even a sufficient number of health professionals. Patients in these areas are still likely to experience barriers to access, such as long waits for appointments and difficulty finding in-network providers or those who accept Medicaid, among other challenges. There are additional facets of health care that our analysis does not seek to measure: facility adequacy, employer demand and hiring practices and patient satisfaction with the care they receive.
Despite these limitations, New Mexico’s health care workforce data remain a signal achievement for the state, and offer a powerful tool to understand the density of health care providers statewide and inform solutions to the health care challenges facing our state.
I.C. Summary of New Mexico’s Health Care Workforce The New Mexico Health Care Workforce Committee has estimated that in 2018, there were practicing in the state 17,526 registered nurses (RNs), 1,542 certified nurse practitioners and clinical nurse specialists (CNPs/CNSs), 2,162 primary care physicians (PCPs), 279 obstetrics and gynecology physicians (OB-GYNs), 188 general surgeons, 317 psychiatrists, 805 physician assistants (PAs), 169 certified nurse-midwives (CNMs), 40 licensed midwives (LMs), 1,216 dentists, and 6,501 emergency medical technicians (EMTs). (Table 1.4).
As in prior years, our analysis shows growth in many licensed health professions. Since 2017, New Mexico has gained providers in four of the 11 professions examined: 89 CNPs/CNSs (6.1%), 13 PAs (1.6%), one dentist (0.1%), and 137 EMTs (2.2%). We observed modest decreases since 2017 in seven professions: 647 RNs (-5.5%), 198 PCPs (-8.4%), three OB-GYNs (-1.1%), six general surgeons (-3.1%), 15 psychiatrists (-4.5%), nine CNMs (-5.1%) and two LMs (-4.8%).
Figure 1.2 shows at a glance the benchmark status of each county for each profession analyzed. Many of New Mexico’s counties continue to show health professionals below benchmarks, summarized in Figure 1.2. Our analysis indicates that without redistributing the current workforce, to bring all counties to benchmarks would require an additional 3,689 RNs, 135 CNPs/CNSs, 136 PCPs, 39 OB-GYNs, 11 general surgeons, 108 psychiatrists, 115 PAs, 14 CNMs, four LMs, 46 dentists and 392 EMTs.

New Mexico Health Care Workforce Committee Report, 2019 9
Table 1.4. Summary of Statewide Health Care Professionals Since 2013 Profession
Metric 2013 2014 2015 2016 2017 2018 Net Change Since 2013a
RNs # in New Mexico 15,713a NAb NAb 17,219 18,173 17,526 1,813 Total Below Benchmarkc 4,269a 3,361 3,022 3,689 -580 Counties Below Benchmark 30a 30 29 31 1
CNP/CNS # in New Mexico 1,089 1,228 1,293 1,379 1,453 1,542 453 Total Below Benchmarkc 271 197 201 142 147 135 -136 Counties Below Benchmark 25 20 19 18 17 16 -9
PCP # in New Mexico 1,957 1,908 2,073 2,076d 2,360 2,162e 205 Total Below Benchmarkc 153 145 125 139 126 136 -17 Counties Below Benchmark 23 22 17 22 16 18 -5
OB-GYN # in New Mexico 256 236 253 273d 282 279 23 Total Below Benchmarkc 40 43 36 31 30 39 -1 Counties Below Benchmark 14 14 12 9 11 15 1
General Surgeons # in New Mexico 179 162 177 188d 194 188 9 Total Below Benchmarkc 21 18 16 14 12 11 -10 Counties Below Benchmark 12 8 8 7 7 6 -6
Psychiatrists # in New Mexico 321 289 302 332d 332 317 -4 Total Below Benchmarkc 104 109 111 106 111 108 4 Counties Below Benchmark 25 26 26 26 26 26 1
PA # in New Mexico NDf 694 717 746 792 805 111 Total Below Benchmarkc 136 136 119 113 115 -21 Counties Below Benchmark 21 22 22 20 22 1
CNM # in New Mexico ND ND ND 156 178 169 13 Total Below Benchmarkc 12 11 14 2 Counties Below Benchmark 9 9 10 1
LM # in New Mexico ND ND ND 38g 42 40 2 Total Below Benchmarkc 4 4 4 0 Counties Below Benchmark 4 4 4 0
Dentists # in New Mexico ND 1,081 1,131 1,171 1,215 1,216 135 Total Below Benchmarkc 73 67 55 46 46 -27 Counties Below Benchmark 18 20 18 17 15 -3
EMTs # in New Mexico ND ND ND 6,101 6,364 6,501 400 Total Below Benchmarkc 475 415 392 -83 Counties Below Benchmark 12 11 10 -2
a 2012, not 2013, is the initial analysis year for RNs. b NA indicates this profession was not analyzed for the years indicated. c Total below benchmark reflects the number of providers needed to bring all counties below benchmarks to
national provider-to-population values without reducing workforce in counties above benchmarks. d This is the first year for which DO specialties were analyzed, correcting prior years’ overestimation of DOs in
primary care and underestimation in OB-GYN, general surgery and psychiatry. e See Section III.B.1 for adjustments to the PCP workforce for non-practicing providers. f ND indicates survey data were not yet available. g This value has been modified from that reported in 2017 to remove apprentice midwives.

10 New Mexico Health Care Workforce Committee Report, 2019
Figure 1.2. This at-a-glance summary shows the benchmark status by county for each profession analyzed in this report. Green indicates counties at or above benchmark; yellow, counties moderately below benchmark; and red, counties severely below benchmark. Those with a benchmark of zero and no providers are gray. Blue for general surgeons indicates counties above the optimal ratio. See the maps for each profession and additional details in Sections II and III.

New Mexico Health Care Workforce Committee Report, 2019 11
I.C.1. Practitioner Maldistribution Access to health care for New Mexicans statewide is complicated by the state’s large rural and frontier areas. Thirty-four percent of New Mexico’s 2.1 million residents reside in rural or frontier counties (Figure 1.3), which tend to have lower densities of health professionals.
Figure 1.3. Each county’s color indicates its classification as frontier (light), rural (medium) or metropolitan (dark); the white boxes show the population density (persons per square mile). The pie chart shows the proportion of the state’s population residing in metropolitan, rural or frontier counties.
In Sections II and III of this report, readers will note that many counties have provider counts far below benchmarks, while others have providers equal to or exceeding benchmark values. This uneven distribution – or maldistribution – of providers across the state underscores the need to evaluate workforce distribution. Counties that meet or exceed benchmarks tend to be those with urban areas and/or close proximity to training and major health care facilities. Because we do not anticipate substantial relocation of providers from better-served to more poorly served counties, we state for each profession the

12 New Mexico Health Care Workforce Committee Report, 2019
number of providers that would allow New Mexico counties to meet national benchmarks assuming no redistribution of practitioners from counties with above-benchmark numbers to those with fewer.
In addition, New Mexico faces substantial health disparities related to income inequality and other social determinants of health. Meeting or exceeding benchmarks for providers does not indicate that all county residents have adequate access to health care and health professionals.
I.C.2. Strategies to Improve Health Care Workforce Shortages As illustrated in Figure 1.4, addressing the health care workforce needs of the state will require a multipronged approach combining increased production in-state (“growing our own”), recruitment incentives, retention measures and targeting rural and underserved areas for growth of workforce.
Increase Workforce Supply
Recruitment Incentives Loan repayment Endowment Housing accommodations Salary Start-up packaging
Production Expand training programs
Retention
Keep Providers in New Mexico Increase rural exposure during residency and other practical experiences Commitment to New Mexico during training via loan-for-service, tuition subsidies
Enhance Access to Care
Growth of Health Care Workforce in Rural and Underserved Areas Incentives targeting practitioners in these areas via tax credits and other mechanisms
Figure 1.4. Schematic representation of the multipronged approach necessary to increase health care workforce in New Mexico. As a result, our recommendations for 2019, detailed in Section VI, are broad-ranging. They encompass ways to reduce the financial barriers preventing potential trainees from undertaking health professional education; strategies to increase the slots available for training nurses, physician assistants and medical residents; mechanisms for recruitment and retention of providers in rural and underserved areas; and ways to improve our understanding of how such programs work together to increase the state’s health care workforce and access to care for New Mexicans statewide.

New Mexico Health Care Workforce Committee Report, 2019 13
Section II
New Mexico’s Nursing Workforce
II.A. The Nursing Workforce Nursing professionals are among the most numerous and most important health care providers. The close relationship between nurses and patients, together with these professionals’ scientific and practical training, place them at the forefront of initiatives to improve quality of care and contribute integrally to health care teams.21 Registered nurses (RNs), particularly those trained as bachelors of science in nursing (BSNs), are of interest due to the incentives within the federal Patient Protection and Affordable Care Act for hospitals to utilize higher-skilled RNs.22,23 Demand for RNs in the state is high, as discussed in Section II.B, whether trained with BSNs or associate’s degrees in nursing (ADNs) or measured via workforce counts, job vacancies or projected need. Advanced practice registered nurses – certified nurse practitioners, clinical nurse specialists, certified nurse-midwives and certified registered nurse anesthetists – also figure prominently in the state’s health care workforce. In particular, certified nurse practitioners (CNPs) and clinical nurse specialists (CNSs) are key contributors to the primary care workforce, while certified nurse-midwives (discussed in Section III.C.2) provide women’s health care and attend a large proportion of the state’s births.
In this section, we examine New Mexico’s RNs (Section II.A.1) and CNPs/CNSs (Section II.A.2) relative to national benchmarks. Section II.B provides an overview of recently published studies regarding the current and projected demand for RNs in New Mexico, and examines these analyses in relation to the committee’s analysis in order to clarify the ways in which multiple measures provide a richer understanding of the state’s health care needs.

14 New Mexico Health Care Workforce Committee Report, 2019

New Mexico Health Care Workforce Committee Report, 2019 15
II.A.1. Registered Nurses II.A.1.a. Executive Summary In 2018, there were an estimated 17,526 RNs practicing in New Mexico, 60.7% of the total number licensed and 647 fewer than in 2017 (Figure 2.1, Appendix B.1). Table 2.1 tracks changes in each county’s RN workforce since 2012. Despite an overall increase of 1,813 RNs in the state since 2012 and 14 counties showing a net gain, only two counties – Bernalillo and Grant – are above benchmark for these practitioners. The counties most below benchmark are Valencia (-492), Sandoval (-385), Doña Ana (-363), Lea (-278) and Santa Fe (-233) (Table 2.2). The state as a whole has 578 fewer RNs than the national benchmark, yet assuming no redistribution of the current workforce, an additional 3,689 RNs would be needed for all New Mexico counties to meet the national benchmark (8.64 per 1,000 population).
Figure 2.1. Registered nurse workforce relative to the national benchmark of 8.64 RNs per 1,000 population is shown in the white boxes. Each county’s color indicates whether it is at or above benchmark (green), below benchmark by 100 or fewer providers (yellow), or below benchmark by more than 100 providers (red).

16 New Mexico Health Care Workforce Committee Report, 2019
Table 2.1. RN Distribution by New Mexico County Since 2012 County 2012 a 2016 2017 2018 Net Change
Since 2012 Bernalillo 7,725 8,344 8,895 8,924 1,199 Catron 9 10 7 7 -2 Chaves 422 442 449 415 -7 Cibola 125 170 185 172 47 Colfax 69 65 73 66 -3 Curry 312 345 383 356 44 De Baca 6 7 8 7 1 Doña Ana 1,403 1,490 1,569 1,516 113 Eddy 390 412 437 389 -1 Grant 304 325 323 287 -17 Guadalupe 17 19 24 26 9 Harding 1 0 0 0 -1 Hidalgo 7 4 4 6 -1 Lea 344 359 368 323 -21 Lincoln 120 123 135 120 0 Los Alamos 152 150 166 141 -11 Luna 81 104 100 97 16 McKinley 428 457 474 396 -32 Mora 8 15 13 10 2 Otero 388 384 394 371 -17 Quay 34 35 28 28 -6 Rio Arriba 176 182 206 203 27 Roosevelt 70 81 85 87 17 San Juan 845 881 927 884 39 San Miguel 259 266 260 218 -41 Sandoval 379 800 884 869 490 Santa Fe 1,087 1,129 1,138 1,063 -24 Sierra 66 70 79 78 12 Socorro 82 81 91 75 -7 Taos 192 215 222 187 -5 Torrance 22 35 36 12 -10 Union 37 25 29 24 -13 Valencia 153 194 181 169 16
STATE TOTAL 15,713 17,219 18,173 17,526 1,813 a Registered nurse data were not analyzed for 2013 – 2015.

New Mexico Health Care Workforce Committee Report, 2019 17
Table 2.2. Counties with the Greatest Numbers of RNs Below National Benchmark County Practitioners Needed to Meet Benchmark
Valencia 492 Sandoval 385 Doña Ana 363 Lea 278 Santa Fe 233
II.A.1.b. Methodological Notes The breadth and depth of data available for New Mexico’s nurses is exceptional, due to the efficiency with which New Mexico’s Board of Nursing instituted their required survey following the New Mexico Health Care Work Force Data Collection, Analysis and Policy Act of 2011. Data from the survey of New Mexico’s nurses were the first to be made available to the New Mexico Health Care Workforce Committee, and remain an exemplar for professions developing or updating their surveys.
The estimated counts of RNs are based on New Mexico’s 28,883 RNs who were not also licensed at a higher level. That is, RNs who were also CNPs, CNSs, CRNAs or CNMs were excluded from the RN count. Of these 28,883 RNs, 17,526 identified a New Mexico practice location in the survey. Because nurses are surveyed at initial licensure as well as renewal, there are no un-surveyed RNs. As a result, all RNs were allocated to counties by their self-reported practice five-digit ZIP code.
II.A.1.c. Discussion Figure 2.1 shows the county-level comparison of New Mexico’s RNs to the national benchmark of 8.64 per 1,000 population. While in 2017 the RN workforce had risen slightly above benchmark for the state as a whole – despite persistent and often large counts below benchmark for individual counties – in 2018 the RN workforce is again characterized by an overall shortage for the state. The estimated 17,526 RNs practicing in New Mexico represent a statewide RN-to-population ratio of 8.36, or 578 below the national benchmark. Only two counties – Bernalillo and Grant – were above benchmark. The five counties most below benchmark – Valencia, Sandoval, Doña Ana, Lea and Santa Fe – together would require 1,752 RNs to achieve benchmark RN-to-population ratios. For the state as a whole, and assuming no redistribution of the current workforce, an additional 3,689 RNs would be needed to meet the national benchmark in all counties. This is the state’s single largest gap relative to benchmark across all professions analyzed.
Since 2012, net decreases in the RN workforce have been observed in more than half of counties (19, 57.6%). Lincoln County has the same number of RNs as in 2012, and the remaining 13 counties show net increases. The most substantial increases have been in Bernalillo, Sandoval and Doña Ana counties, even though the latter two still require large numbers of nurses to meet the benchmark value.
Given the large and persistent number of RNs needed to bring all New Mexico counties to the national benchmark, we reiterate the critical need to identify effective recruitment and retention strategies for this profession. To this end, several of our 2019 recommendations (Section VI) relate to increasing the state’s capacity to train nurses and incentives for nursing trainees to remain in the state after graduation.

18 New Mexico Health Care Workforce Committee Report, 2019
New Mexico Health Care Workforce Committee Report, 2019 19
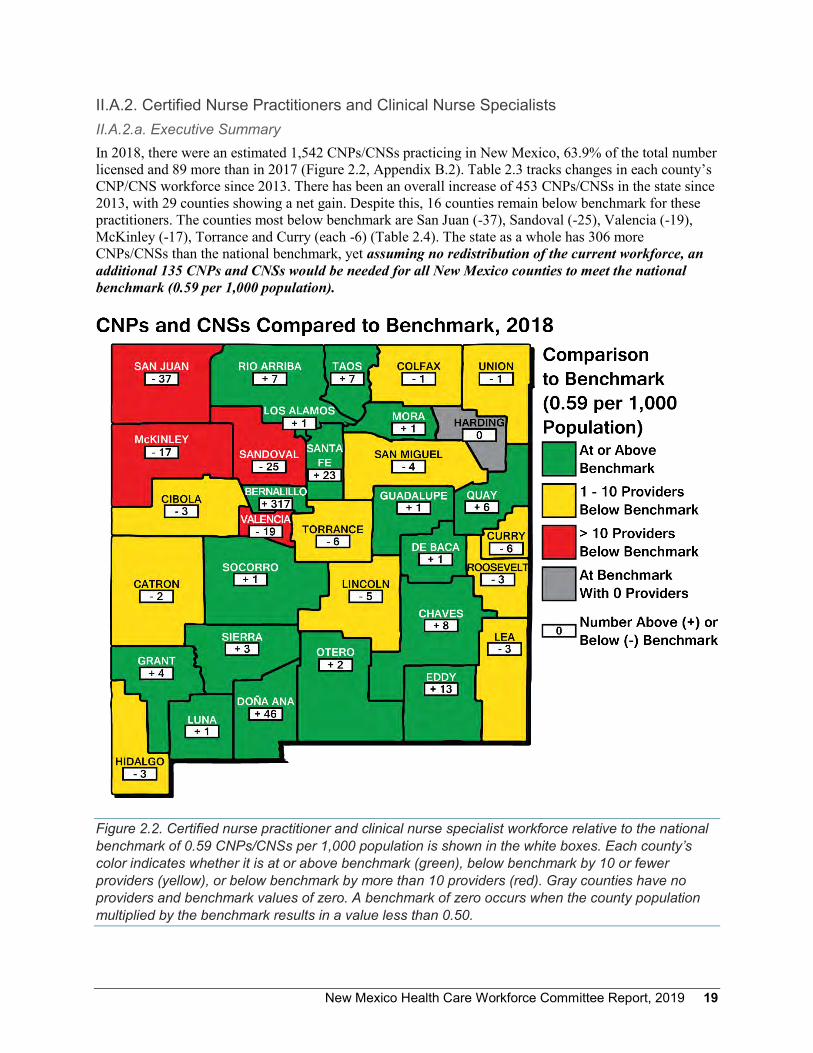
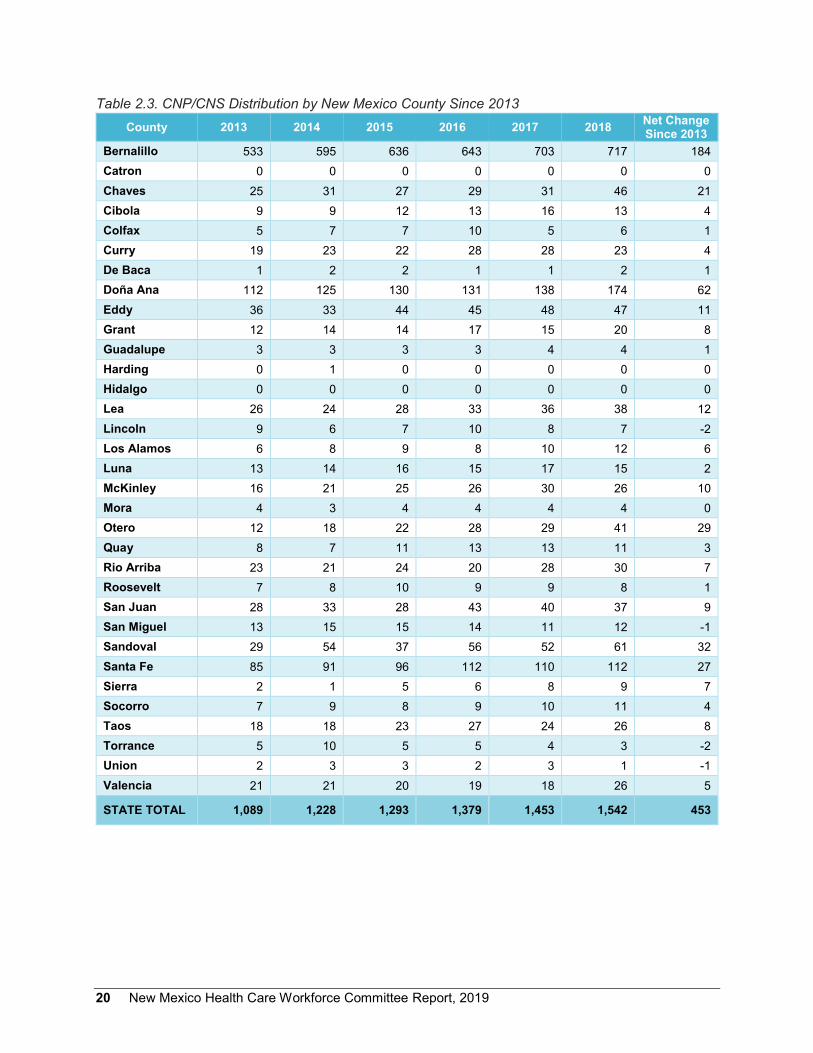
II.A.2. Certified Nurse Practitioners and Clinical Nurse Specialists II.A.2.a. Executive Summary In 2018, there were an estimated 1,542 CNPs/CNSs practicing in New Mexico, 63.9% of the total number licensed and 89 more than in 2017 (Figure 2.2, Appendix B.2). Table 2.3 tracks changes in each county’s CNP/CNS workforce since 2013. There has been an overall increase of 453 CNPs/CNSs in the state since 2013, with 29 counties showing a net gain. Despite this, 16 counties remain below benchmark for these practitioners. The counties most below benchmark are San Juan (-37), Sandoval (-25), Valencia (-19), McKinley (-17), Torrance and Curry (each -6) (Table 2.4). The state as a whole has 306 more CNPs/CNSs than the national benchmark, yet assuming no redistribution of the current workforce, an additional 135 CNPs and CNSs would be needed for all New Mexico counties to meet the national benchmark (0.59 per 1,000 population).
Figure 2.2. Certified nurse practitioner and clinical nurse specialist workforce relative to the national benchmark of 0.59 CNPs/CNSs per 1,000 population is shown in the white boxes. Each county’s color indicates whether it is at or above benchmark (green), below benchmark by 10 or fewer providers (yellow), or below benchmark by more than 10 providers (red). Gray counties have no providers and benchmark values of zero. A benchmark of zero occurs when the county population multiplied by the benchmark results in a value less than 0.50.
20 New Mexico Health Care Workforce Committee Report, 2019
Table 2.3. CNP/CNS Distribution by New Mexico County Since 2013 County 2013 2014 2015 2016 2017 2018 Net Change
Since 2013 Bernalillo 533 595 636 643 703 717 184 Catron 0 0 0 0 0 0 0 Chaves 25 31 27 29 31 46 21 Cibola 9 9 12 13 16 13 4 Colfax 5 7 7 10 5 6 1 Curry 19 23 22 28 28 23 4 De Baca 1 2 2 1 1 2 1 Doña Ana 112 125 130 131 138 174 62 Eddy 36 33 44 45 48 47 11 Grant 12 14 14 17 15 20 8 Guadalupe 3 3 3 3 4 4 1 Harding 0 1 0 0 0 0 0 Hidalgo 0 0 0 0 0 0 0 Lea 26 24 28 33 36 38 12 Lincoln 9 6 7 10 8 7 -2 Los Alamos 6 8 9 8 10 12 6 Luna 13 14 16 15 17 15 2 McKinley 16 21 25 26 30 26 10 Mora 4 3 4 4 4 4 0 Otero 12 18 22 28 29 41 29 Quay 8 7 11 13 13 11 3 Rio Arriba 23 21 24 20 28 30 7 Roosevelt 7 8 10 9 9 8 1 San Juan 28 33 28 43 40 37 9 San Miguel 13 15 15 14 11 12 -1 Sandoval 29 54 37 56 52 61 32 Santa Fe 85 91 96 112 110 112 27 Sierra 2 1 5 6 8 9 7 Socorro 7 9 8 9 10 11 4 Taos 18 18 23 27 24 26 8 Torrance 5 10 5 5 4 3 -2 Union 2 3 3 2 3 1 -1 Valencia 21 21 20 19 18 26 5
STATE TOTAL 1,089 1,228 1,293 1,379 1,453 1,542 453

New Mexico Health Care Workforce Committee Report, 2019 21
Table 2.4. Counties with the Greatest Numbers of CNPs/CNSs Below National Benchmark County Practitioners Needed to Meet Benchmark
San Juan 37 Sandoval 25 Valencia 19 McKinley 17 Curry, Torrance 6 each
II.A.2.b. Methodological Notes As discussed in Section II.A.1.b, the New Mexico Board of Nursing is to be commended on the quality of the nurses’ survey and the efficiency with which it was instituted. Certified nurse practitioners (CNPs) and clinical nurse specialists (CNSs) are advanced practice registered nurses with independent authority to diagnose and prescribe within their scope of practice. Advanced practice registered nurses include certified registered nurse anesthetists (CRNAs) and certified nurse-midwives (CNMs) in addition to CNPs and CNSs. However, it was necessary to adjust the advanced practice registered nurse count in order to evaluate this sector of the health care workforce consistent with our national benchmark.10
The national benchmark excludes CRNAs and CNMs who are not also CNPs, as well as CNPs/CNSs practicing in behavioral health. Thus, it was necessary to reduce the total of 3,302 advanced practice registered nurses with active New Mexico licensure by 503 CRNAs, 180 CNMs, and 204 CNPs/CNSs reporting a practice area of behavioral health. Our analysis in this section includes the remaining 2,415 CNPs/CNSs; the contributions of CNMs are discussed in Section III.C.2. Behavioral health advanced practice registered nurses play an important role in the state’s workforce, and their contributions are discussed within the larger context of the state’s behavioral health workforce in Section IV.
As for RNs, there are no un-surveyed CNPs/CNSs. All CNPs/CNSs were allocated to counties by their self-reported practice five-digit ZIP code. Of the 2,415 CNPs/CNSs consistent with the national benchmark criteria, 1,542 identified a New Mexico practice location in the survey.
The New Mexico Board of Nursing survey asks area of specialty. Because the possible responses have recently changed, with the exception of behavioral health (responses of psychiatric/mental health, psychiatric and mental health – adult, and psychiatric/mental health/substance abuse) – excluded from the benchmark counts as discussed above – these practice areas were not examined for 2018. We will resume analysis of those reporting primary care practice areas when a majority of CNPs/CNSs have been surveyed under the new response options. This does not affect our CNP/CNS analysis, as the national benchmark does not distinguish among advanced practice nursing specialties beyond the exclusion of behavioral health.
II.A.2.c. Discussion Figure 2.2 shows the county-level comparison of New Mexico’s CNPs/CNSs to the national benchmark of 0.59 CNPs/CNSs per 1,000 population. For the state as a whole, the estimated 1,542 CNPs/CNSs practicing in New Mexico represent a statewide CNP/CNS-to-population ratio of 0.74 per 1,000, or 306 above the national benchmark. However, 16 counties (48.5%) were below benchmark. The counties most below benchmark were Curry, McKinley, San Juan, Sandoval, Torrance and Valencia, and together would require 110 CNPs/CNSs to achieve benchmark CNP/CNS-to-population ratios. For the state as a
22 New Mexico Health Care Workforce Committee Report, 2019
whole, and assuming no redistribution of the current workforce, an additional 135 CNPs/CNSs would be needed to meet the national benchmark in all counties.
As reported in our 2018 annual report, since 2013, net decreases in the CNP/CNS workforce have been observed in only four counties: Lincoln, San Miguel, Torrance and Valencia.6 All other counties have remained stable (four counties) or increased (25 counties). The largest gains since 2013 have occurred in Bernalillo, Doña Ana, Otero, Sandoval and Santa Fe counties. These observations have held true since our 2017 annual report.5
As discussed in Section II.A.2.b, New Mexico’s CNPs/CNSs report practice areas on the licensure survey. Of 204 licensed behavioral health CNPs/CNSs, there were 118 practicing in the state; they are included in the analysis of the behavioral health workforce in Section IV.
New Mexico Health Care Workforce Committee Report, 2019 23
II.B. Other Assessments of the State Nursing Workforce
II.B.1. Executive Summary Given the large gaps below benchmark across New Mexico for registered nurses (RNs), it is both expected and welcome that other state and national organizations have also turned their attention to this issue. Several recent publications on the New Mexico RN workforce have lent new perspective on the state’s nursing shortage. In this section, we discuss four of these studies with respect to the New Mexico Health Care Workforce Committee data. They include an analysis of current RN job openings published in April 2019 by the New Mexico Department of Workforce Solutions (DWS) and a 2019 poll regarding RN job openings by the New Mexico Hospital Association (Section II.B.2), a report on projected job growth for RNs in New Mexico published by DWS in June 2018 (Section II.B.3), and a 2017 Health Resources and Services Administration (HRSA) projection of nursing supply and demand (Section II.B.4).
II.B.2. Job Openings for RNs in New Mexico In April 2019, DWS issued a press release titled, “Healthcare Occupations in New Mexico With the Most Job Openings” (shown in Appendix C). This snapshot of health care practitioner job openings advertised during March 2019 was topped by RNs: 3,841 RN openings were reported across all employment settings (such as hospitals, clinics or schools).
The New Mexico Hospital Association also conducted a member survey of nurse vacancies as of June 1, 2019 and presented preliminary results to the New Mexico Health Care Workforce Committee. This survey found that among the 41 of 46 member acute care and specialty hospitals responding, nurse vacancies in hospitals only totaled 1,225 (1,120 full time or part time vacancies for RNs and RNs in administrative roles and 105 for RN contract labor or travelers), with an additional 447 RN contract labor or traveler positions currently in use. If we assume the need in hospitals comprises the current RN vacancies as well as the positions currently held by RN contract labor, these 41 hospitals reported a need for 1,672 RNs in New Mexico hospitals. Given that five member hospitals did not respond to the survey, the total RN vacancies in New Mexico hospitals is greater than 1,672.
These are measures of demand, in contrast to the committee’s analysis of workforce per population compared to the national average. Nonetheless, these values do not contradict the committee’s findings. With respect to hospital RNs only, the U.S. Bureau of Labor Statistics reports that 60 percent of RNs work in hospital settings.24 If we estimate that 60 percent of RN job openings are also in hospitals, we would predict that 2,305 of the 3,841 job openings reported by DWS are in hospitals. This is greater than the 1,672 vacancies identified by the New Mexico Hospital Association. However, it is important to remember that the New Mexico Hospital Association total is a minimum value, as it does not include data from all member hospitals.
With respect to the DWS report of RN job openings across all employment settings, the DWS measure of 3,841 openings differs by only 152 RNs (4.1%) from the committee’s finding in Section II.A.1 that 3,689 RNs would be needed for all counties to achieve the benchmark RN-to-population ratio.

24 New Mexico Health Care Workforce Committee Report, 2019
II.B.3 Projected Job Growth for RNs in New Mexico In the New Mexico 2018 State of the Workforce report, released in June 2018, DWS projects employment growth for RNs of 2,760 between 2014 and 2024.25 The DWS analysis was conducted using U.S. Department of Labor methodology via a packaged software suite. Inputs to the projection included federal sources of employer-reported baseline and historical data from the Quarterly Census of Unemployment and Wages and Wages and Occupational Employment Statistics Survey. The resulting 10-year projection of 2,760 averages to 276 additional RN positions per year. This number, again despite being a measure (projected increase in demand) distinct from the committee’s analysis, accords well with the committee’s observation of growth in the state RN workforce since 2012: New Mexico has added an average of 259 RNs each year between 2012 and 2018.
Taken together, these observations imply that the state’s current rate of RN workforce expansion is nearly sufficient to keep pace with projected growth – but given the large statewide shortage relative to benchmark, underscored by the large number of RN job openings, a large gap is likely to persist between the state’s county-level RN-to-population ratios and the benchmark values. That is, production of new RNs and recruitment of RNs from other states will need to increase beyond the current pace in order to both accommodate the projected expansion in RN jobs and make progress in bringing RN-to-population ratios toward benchmarks.
II.B.4. Projected Surplus of RNs in New Mexico Perhaps the most surprising recent finding regarding the state’s RN workforce is HRSA’s projection of a 44.9% surplus of RNs in New Mexico by 2030.26 This finding was the result of a simulation conducted by HRSA using the Bureau of Health Workforce Simulation Model. The model’s baseline for New Mexico was 15,900 RNs in 2014. The committee did not analyze RNs for the 2014 practice year, but for 2012, we reported 15,713 RNs practicing in the state. If we assume 259 RNs were added in 2013 and 2014 – the yearly average for RN workforce increase between 2012 and 2018 – we would estimate 16,231 RNs in 2014, only 2.1% more than the HRSA baseline. Thus, the model’s starting point accords well with the committee’s data.
However, the first assumption made in HRSA’s simulation model is that supply was equal to demand in the baseline year, 2014. That is, a central premise of this projection is that New Mexico had exactly the right number of RNs for its health care needs in 2014. This assumption is not supported by the committee’s analyses, which have found county-level RN-to-population ratios to be persistently far below the national average. We have no reason to assume the state’s need for nurses is significantly less than for the nation as a whole, and as a result, we cannot assume that the number of RNs in the state at the start of HRSA’s simulation was equal to demand. On the contrary, the 2014 RNs were very likely far below the needs of the state.
Furthermore, in HRSA’s simulation the rate of increase for New Mexico RNs is quite high relative to that of other states. HRSA projects that the state’s RN workforce will increase by a factor of 1.97, growing from 15,900 in 2014 to 31,300 in 2030. This is the third-highest rate of increase in the HRSA model, below only Washington, D.C., where RNs are projected to increase by a factor of 4.9, and Wyoming, with a projected RN workforce in 2030 1.98 times that in 2014. It is unclear how HRSA arrived at these rates of increase. Certainly a 15-year doubling of the New Mexico RN workforce is not supported by our experience since 2012. Such an increase would require adding an average of 1,027 RNs each year
New Mexico Health Care Workforce Committee Report, 2019 25
between 2014 and 2030, nearly four times the average increase of only 259 RNs per year we have observed since 2012.
Thus, neither the baseline assumption of adequate RN workforce in 2014 nor the projected rate of RN workforce increase used in the HRSA simulation to arrive at a projected RN surplus of 44.9% in 2030 are supported by the committee’s analysis. The state is not likely to achieve such a large increase in the RN workforce without fourfold increases in our capacity to train new nurses and recruit them from other states.
II.B.5 Discussion The committee is glad of the increased interest at the state level in rectifying the state’s health care workforce shortages in order to achieve better health for all New Mexicans. With a problem of this magnitude, bringing many perspectives to bear in understanding the problem and potential solutions can only increase our likelihood of success. The recent findings by DWS of 3,841 job openings for RNs accord well with our analysis of the number of RNs needed to bring all counties to benchmark RN-to-population values. DWS’s recent projection of job growth for nurses suggests that additional job openings are expected to arise at a pace similar to the increase of RN workforce in the state. As the number of job openings increases, it will be necessary to increase our capacity to train and recruit new nurses to the state, as advocated in our recommendations relative to nursing. While the simulation by HRSA appears to suggest that we will have no difficulty achieving these necessary increases, the assumptions underlying HRSA’s model are not borne out by the committee’s analysis. We must continue to implement measures at the state level to ensure the state’s future RN needs can be met.
26 New Mexico Health Care Workforce Committee Report, 2019
II.C. Discussion Registered nurses remain the single largest number of health professionals needed to bring all counties in New Mexico to benchmark provider-to-population ratios. With a total gap of 3,689 RNs between existing workforce and benchmark values, it will be critical to support the training and recruitment of RNs by multiple approaches, as recommended by the committee in several of our 2019 recommendations.
Beyond the broad need for more RNs, there is need more specifically for baccalaureate-trained nurses. In 2010, the Institute of Medicine recommended an increase in the proportion of nurses with a baccalaureate degree to 80% by 2020.21 According to the American Association of Colleges of Nursing (AACN), many hospitals and other medical facilities are following the IOM guidelines and strongly encourage associate degree in nursing-prepared RNs to earn their bachelor of science in nursing (BSN) within five years of graduation.
For the past 10 years, AACN research has shown that higher education does make a difference in the quality of clinical practice. Evidence shows that nurses with a BSN give better care. The studies show that patients in the care of nurses with a BSN have better outcomes, including lower rates of mortality. Also, research shows that nurses who have a BSN or higher training are more proficient in making diagnoses and evaluating the results of interventions.27
The efforts of the New Mexico Nursing Education Consortium (NMNEC) have been integral in broadening access to BSN training for the state’s RNs. Expanding the slots available for nursing trainees at the state’s public institutions will further increase New Mexico’s ability to meet the nursing needs of the state.

New Mexico Health Care Workforce Committee Report, 2019 27
Section III
New Mexico’s Workforce for Other Health Care Professions
III.A. Introduction A broad range of health care providers are necessary to meet the spectrum of health needs for the state’s population. In this section, we examine New Mexico’s physicians in selected specialties (Sections III.B.1 through III.B.4: primary care, obstetrics and gynecology, general surgery and psychiatry), physician assistants (Section III.C.1), non-physician birth attendants (Sections III.C.2 and III.C.3: certified nurse-midwives and licensed midwives), dentists (Section III.C.4) and emergency medical technicians (Section III.C.5). In addition, we discuss the survey enhancements in progress for the state’s pharmacists and non-physician primary care providers (Section III.D), as well as the distribution of women’s health and birth attendance providers statewide (Section III.E). In Section III.F, we examine the demographics of selected professions – physicians, physician assistants, registered nurses, certified nurse practitioners and clinical nurse specialists.

28 New Mexico Health Care Workforce Committee Report, 2019

New Mexico Health Care Workforce Committee Report, 2019 29
III.B. Physicians III.B.1 Primary Care Physicians III.B.1.a. Executive Summary In 2018, there were an estimated 2,162 PCPs with New Mexico practice addresses, 64.7% of the total number licensed and 198 fewer than in 2017. This total was adjusted to remove 257 non-practicing individuals, leaving an estimated 1,905 PCPs practicing in New Mexico (Figure 3.1, Appendix B.3).* Table 3.1 tracks changes in each county’s PCP workforce since 2013. Taking into account the adjustment for non-practicing individuals, there has been an overall decrease of 52 PCPs in the state since 2013. Nine counties have shown a net gain, with eight counties above benchmark for these practitioners. The counties most below benchmark are Valencia (-40), Otero (-22), Lea (-21), Eddy and San Juan (-19 each) (Table 3.2). The state as a whole has 248 more PCPs than the national benchmark with this adjustment, yet assuming no redistribution of the current workforce, an additional 206 PCPs would be needed for all New Mexico counties to meet the national benchmark (0.79 per 1,000 population).
Figure 3.1. Primary care physician workforce relative to the national benchmark of 0.79 PCPs per 1,000 population, adjusted to remove non-practicing PCPs and retirees, is shown in the white boxes. Each county’s color indicates whether it is at or above benchmark (green), below benchmark by 10 or fewer providers (yellow), or below benchmark by more than 10 providers (red). * All PCP counts shown in Figure 3.1 and discussed subsequently are adjusted values.

30 New Mexico Health Care Workforce Committee Report, 2019
Table 3.1. Primary Care Physician Distribution by New Mexico County Since 2013 County 2013 2014 2015 2016 2017 2018 2018
Adjustment Net Change Since 2013
Bernalillo 855 807 936 946 1,123 999 -104 40 Catron 2 3 3 2 3 3 -2 -1 Chaves 73 71 75 63 75 70 -11 -14 Cibola 20 19 19 21 21 19 -1 -2 Colfax 9 9 11 7 10 9 -1 -1 Curry 36 36 39 36 42 39 -4 -1 De Baca 1 2 1 1 2 2 0 1 Doña Ana 168 162 182 185 200 192 -30 -6 Eddy 35 37 39 36 33 34 -7 -8 Grant 32 34 38 39 40 34 -8 -6 Guadalupe 3 3 3 2 2 1 0 -2 Harding 1 0 0 0 0 0 0 -1 Hidalgo 2 2 1 1 2 2 0 0 Lea 30 29 35 36 41 37 -3 4 Lincoln 13 13 14 12 14 12 -1 -2 Los Alamos 33 33 32 31 37 35 -2 0 Luna 10 10 9 8 9 6 0 -4 McKinley 50 50 62 59 62 59 -6 3 Mora 1 2 2 1 2 1 0 0 Otero 37 42 37 34 33 39 -8 -6 Quay 7 7 5 6 4 4 0 -3 Rio Arriba 27 29 28 26 27 29 -1 1 Roosevelt 14 13 14 13 9 9 0 -5 San Juan 96 93 95 86 95 92 -12 -16 San Miguel 26 24 22 19 24 25 -6 -7 Sandoval 103 104 101 111 137 122 -15 4 Santa Fe 188 183 185 203 222 199 -22 -11 Sierra 11 12 11 11 13 9 -2 -4 Socorro 12 13 16 16 15 18 -4 2 Taos 37 36 33 34 36 35 -4 -6 Torrance 1 2 2 2 3 3 -1 1 Union 0 0 1 2 1 2 0 2 Valencia 24 28 24 27 23 22 -2 -4 STATE TOTAL 1,957 1,908 2,075 2,076 2,360 2,162 -257 -52

New Mexico Health Care Workforce Committee Report, 2019 31
Table 3.2. Counties with the Greatest Numbers of PCPs Below National Benchmark County Practitioners Needed to Meet Benchmark
Valencia 40 Otero 22 Lea 21 Eddy, San Juan 19 each
III.B.1.b. Methodological Notes We estimate as PCPs MDs and DOs who specialize in family medicine, general practice, general internal medicine and general pediatrics. Neither internal medicine nor pediatrics physicians who subspecialize (e.g., cardiology, immunology) are counted among New Mexico’s PCPs.
Some organizations include obstetrics and gynecology physicians (OB-GYNs) in their primary care estimates; however, we report OB-GYNs as a separate health workforce category. We do so in order to examine features unique to this specialty, such as their need for specialized facilities and practice limited to a specific segment of the population. In so doing, our analysis also matches that of the Association of American Medical Colleges benchmark we use in assessing PCPs, which also excludes OB-GYNs from the national PCP-per-population ratio (0.79 per 1,000 population).11
Our PCP estimates include PCPs employed strictly in acute care (i.e., hospital emergency department and inpatient services), again in order to align our analysis with the Associate of American Medical Colleges methodology used to establish our PCP benchmark. Research in this area indicates that approximately 30% of general internal medicine physicians work as hospitalists and 7% of family medicine physicians work in emergency departments.28 In prior years, we have found a comparable proportion of New Mexico’s PCP workforce practicing as hospitalists.4
Our estimated PCP counts are based on 9,704 MDs and DOs with active licenses in New Mexico during 2018. These comprise 7,367 surveyed MDs, 1,588 MDs with active license but no survey (including those newly licensed in the state), 661 surveyed DOs and 88 un-surveyed DOs. For both MDs and DOs, primary care specialty (family practice, general practice, general pediatrics or general internal medicine) was determined first by self-reported specialty on the individual’s most recent survey. For un-surveyed physicians and those for whom the only survey available was 2015 (the year for which the specialty item was omitted from the survey), specialty was identified through licensure and/or board certification. A total of 3,344 MDs and DOs were identified with primary care specialties. Surveyed PCPs were allocated to counties by the five-digit ZIP code of their self-reported primary practice location; for un-surveyed individuals, the county was identified by the licensure address ZIP code.
As discussed in Section III.B.1.c, in analyzing the 2018 workforce an adjustment was made for the first time to remove non-practicing individuals from the PCP workforce. Individuals meeting the following criteria were removed in this adjustment:
1. Retired: Includes all individuals who selected retired, but maintain an active license or retired and do not maintain an active license among their responses to the current work status survey item.
2. Residents: Includes all individuals not excluded above who selected current resident of fellowship training among their responses to the current work status survey item.
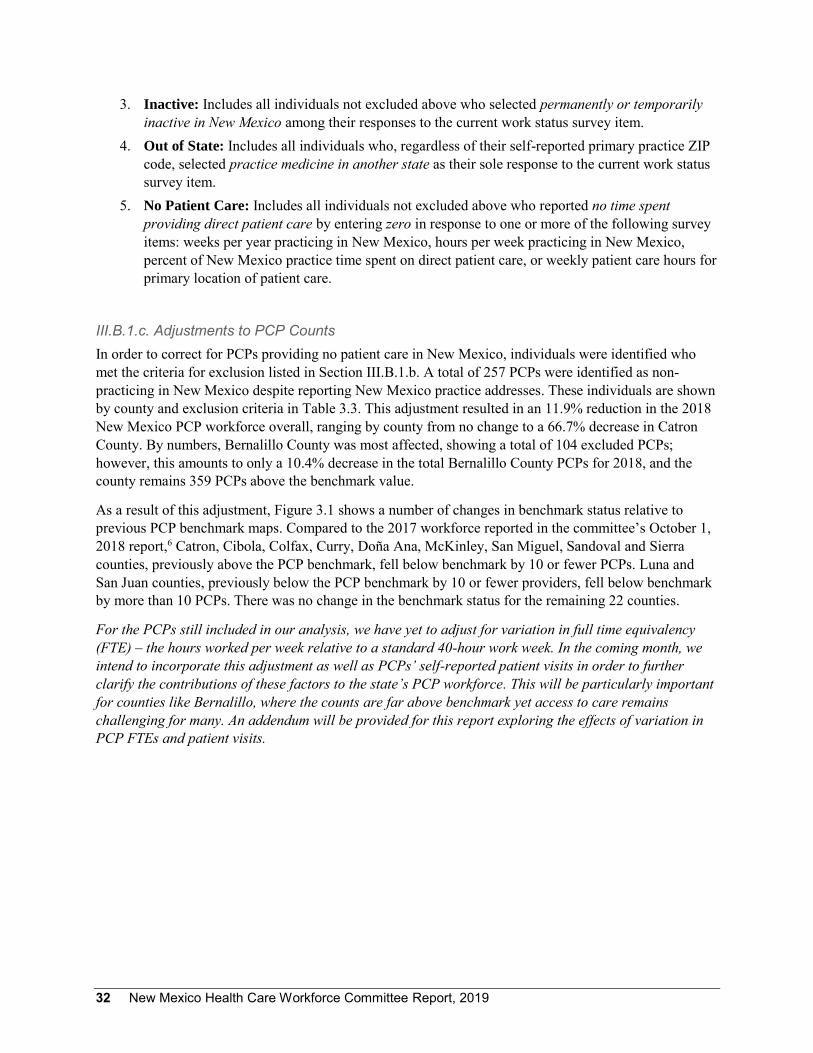
32 New Mexico Health Care Workforce Committee Report, 2019
3. Inactive: Includes all individuals not excluded above who selected permanently or temporarily inactive in New Mexico among their responses to the current work status survey item.
4. Out of State: Includes all individuals who, regardless of their self-reported primary practice ZIP code, selected practice medicine in another state as their sole response to the current work status survey item.
5. No Patient Care: Includes all individuals not excluded above who reported no time spent providing direct patient care by entering zero in response to one or more of the following survey items: weeks per year practicing in New Mexico, hours per week practicing in New Mexico, percent of New Mexico practice time spent on direct patient care, or weekly patient care hours for primary location of patient care.
III.B.1.c. Adjustments to PCP Counts In order to correct for PCPs providing no patient care in New Mexico, individuals were identified who met the criteria for exclusion listed in Section III.B.1.b. A total of 257 PCPs were identified as non-practicing in New Mexico despite reporting New Mexico practice addresses. These individuals are shown by county and exclusion criteria in Table 3.3. This adjustment resulted in an 11.9% reduction in the 2018 New Mexico PCP workforce overall, ranging by county from no change to a 66.7% decrease in Catron County. By numbers, Bernalillo County was most affected, showing a total of 104 excluded PCPs; however, this amounts to only a 10.4% decrease in the total Bernalillo County PCPs for 2018, and the county remains 359 PCPs above the benchmark value.
As a result of this adjustment, Figure 3.1 shows a number of changes in benchmark status relative to previous PCP benchmark maps. Compared to the 2017 workforce reported in the committee’s October 1, 2018 report,6 Catron, Cibola, Colfax, Curry, Doña Ana, McKinley, San Miguel, Sandoval and Sierra counties, previously above the PCP benchmark, fell below benchmark by 10 or fewer PCPs. Luna and San Juan counties, previously below the PCP benchmark by 10 or fewer providers, fell below benchmark by more than 10 PCPs. There was no change in the benchmark status for the remaining 22 counties.
For the PCPs still included in our analysis, we have yet to adjust for variation in full time equivalency (FTE) – the hours worked per week relative to a standard 40-hour work week. In the coming month, we intend to incorporate this adjustment as well as PCPs’ self-reported patient visits in order to further clarify the contributions of these factors to the state’s PCP workforce. This will be particularly important for counties like Bernalillo, where the counts are far above benchmark yet access to care remains challenging for many. An addendum will be provided for this report exploring the effects of variation in PCP FTEs and patient visits.
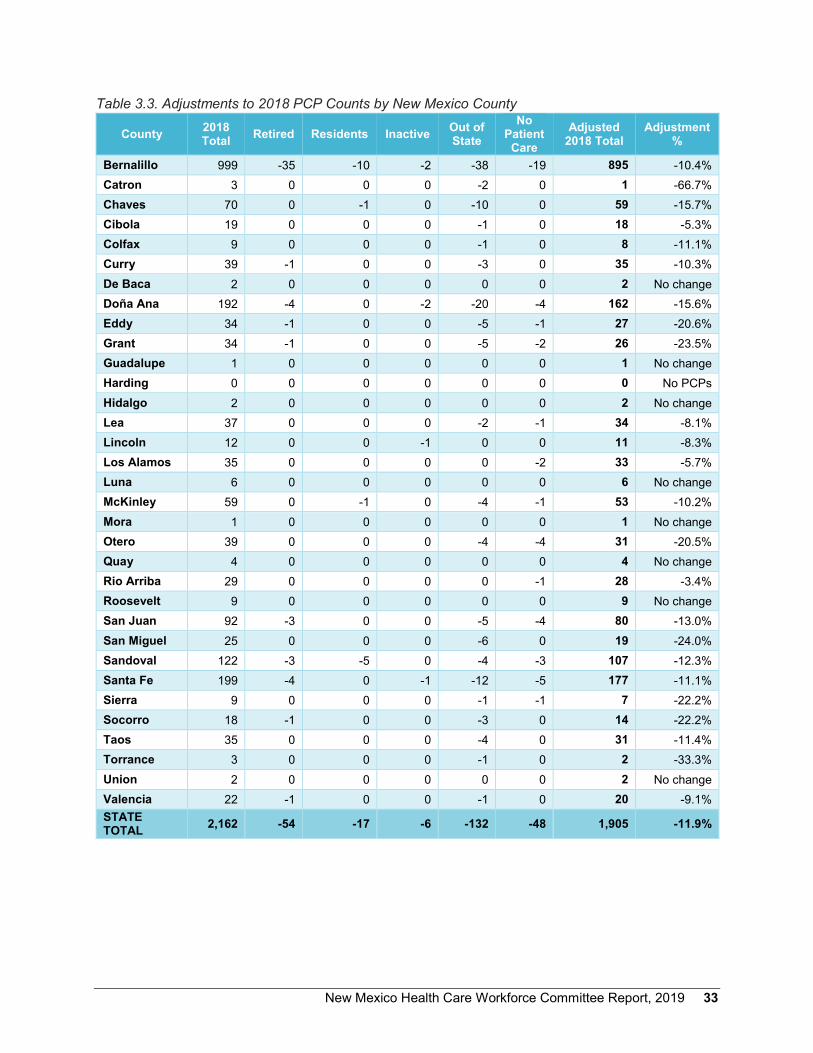
New Mexico Health Care Workforce Committee Report, 2019 33
Table 3.3. Adjustments to 2018 PCP Counts by New Mexico County
County 2018 Total Retired Residents Inactive Out of
State No
Patient Care
Adjusted 2018 Total
Adjustment %
Bernalillo 999 -35 -10 -2 -38 -19 895 -10.4% Catron 3 0 0 0 -2 0 1 -66.7% Chaves 70 0 -1 0 -10 0 59 -15.7% Cibola 19 0 0 0 -1 0 18 -5.3% Colfax 9 0 0 0 -1 0 8 -11.1% Curry 39 -1 0 0 -3 0 35 -10.3% De Baca 2 0 0 0 0 0 2 No change Doña Ana 192 -4 0 -2 -20 -4 162 -15.6% Eddy 34 -1 0 0 -5 -1 27 -20.6% Grant 34 -1 0 0 -5 -2 26 -23.5% Guadalupe 1 0 0 0 0 0 1 No change Harding 0 0 0 0 0 0 0 No PCPs Hidalgo 2 0 0 0 0 0 2 No change Lea 37 0 0 0 -2 -1 34 -8.1% Lincoln 12 0 0 -1 0 0 11 -8.3% Los Alamos 35 0 0 0 0 -2 33 -5.7% Luna 6 0 0 0 0 0 6 No change McKinley 59 0 -1 0 -4 -1 53 -10.2% Mora 1 0 0 0 0 0 1 No change Otero 39 0 0 0 -4 -4 31 -20.5% Quay 4 0 0 0 0 0 4 No change Rio Arriba 29 0 0 0 0 -1 28 -3.4% Roosevelt 9 0 0 0 0 0 9 No change San Juan 92 -3 0 0 -5 -4 80 -13.0% San Miguel 25 0 0 0 -6 0 19 -24.0% Sandoval 122 -3 -5 0 -4 -3 107 -12.3% Santa Fe 199 -4 0 -1 -12 -5 177 -11.1% Sierra 9 0 0 0 -1 -1 7 -22.2% Socorro 18 -1 0 0 -3 0 14 -22.2% Taos 35 0 0 0 -4 0 31 -11.4% Torrance 3 0 0 0 -1 0 2 -33.3% Union 2 0 0 0 0 0 2 No change Valencia 22 -1 0 0 -1 0 20 -9.1% STATE TOTAL 2,162 -54 -17 -6 -132 -48 1,905 -11.9%

34 New Mexico Health Care Workforce Committee Report, 2019
III.B.1.d. Discussion Figure 3.1 shows the county-level comparison of New Mexico’s adjusted PCP counts to the national benchmark of 0.79 PCPs per 1,000 population. For the state as a whole, the estimated 1,905 PCPs practicing in New Mexico in 2018 represent a statewide PCP-to-population ratio of 0.91 per 1,000, or 248 above the national benchmark. However, 25 counties (75.8%) were below benchmark. The five counties most below benchmark were Valencia, Otero, Lea, Eddy and San Juan, and together would require 121 PCPs to achieve benchmark PCP-to-population ratios. For the state as a whole, and assuming no redistribution of the current workforce, an additional 206 PCPs would be required to meet the national benchmark in all counties.
While these adjusted numbers represent a decrease of 455 PCPs compared to 2017 and a decrease of 52 PCPs compared to when these providers were first analyzed for 2013, this adjustment for the first time takes into account those PCPs who, despite reporting a New Mexico practice address, are unlikely to be providing care. Despite the reductions from this adjustment, nine counties have seen net increases since 2013, three have shown no change, and 21 have had decreases of one to 16 PCPs.
As highlighted in the discussion of data limitations in Section I.B.4, it is important to remember that counties shown in Figure 3.1 as having PCPs above benchmark may still experience difficulty accessing necessary care, even with these adjustments. The benchmark value is a national average rather than an ideal ratio. No benchmark is ideal.
Health care providers are not distributed evenly on a per capita basis within counties: providers may be concentrated within metropolitan areas, leaving residents outside these areas with long drive times to reach the nearest provider. Residents of counties short of providers also likely travel to better-supplied counties or out of state to receive health care services. As a result, the population served by health professionals in a given county may be larger than just that county’s residents. This is particularly likely in counties where there are large per capita numbers, such as Bernalillo, Chaves and Santa Fe, where the presence of large medical systems provides ample infrastructure for medical practice – facilitating recruitment and retention of providers – and residents of surrounding areas regularly commute to population centers to conduct business, including medical appointments. As a result, care can become concentrated, resulting in individuals traveling considerable distances for care.
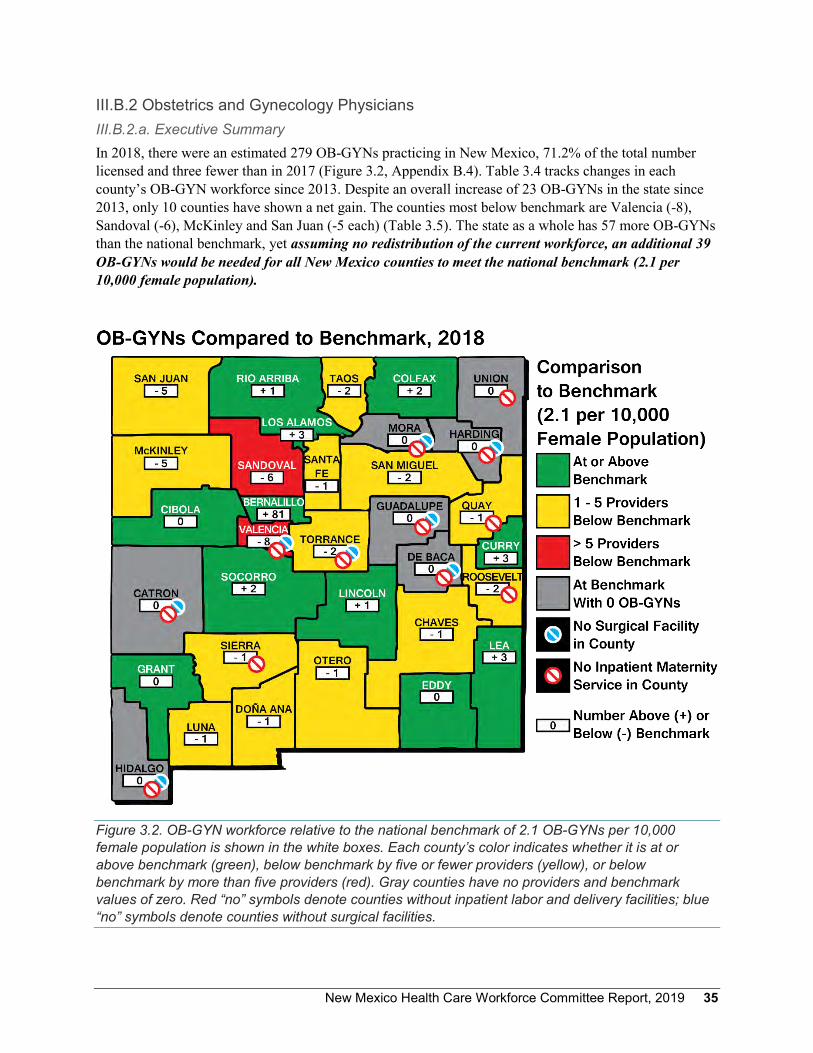
New Mexico Health Care Workforce Committee Report, 2019 35
III.B.2 Obstetrics and Gynecology Physicians III.B.2.a. Executive Summary In 2018, there were an estimated 279 OB-GYNs practicing in New Mexico, 71.2% of the total number licensed and three fewer than in 2017 (Figure 3.2, Appendix B.4). Table 3.4 tracks changes in each county’s OB-GYN workforce since 2013. Despite an overall increase of 23 OB-GYNs in the state since 2013, only 10 counties have shown a net gain. The counties most below benchmark are Valencia (-8), Sandoval (-6), McKinley and San Juan (-5 each) (Table 3.5). The state as a whole has 57 more OB-GYNs than the national benchmark, yet assuming no redistribution of the current workforce, an additional 39 OB-GYNs would be needed for all New Mexico counties to meet the national benchmark (2.1 per 10,000 female population).
Figure 3.2. OB-GYN workforce relative to the national benchmark of 2.1 OB-GYNs per 10,000 female population is shown in the white boxes. Each county’s color indicates whether it is at or above benchmark (green), below benchmark by five or fewer providers (yellow), or below benchmark by more than five providers (red). Gray counties have no providers and benchmark values of zero. Red “no” symbols denote counties without inpatient labor and delivery facilities; blue “no” symbols denote counties without surgical facilities.
36 New Mexico Health Care Workforce Committee Report, 2019
Table 3.4. OB-GYN Physician Distribution by New Mexico County Since 2013 County 2013 2014 2015 2016 2017 2018 Net Change
Since 2013 Bernalillo 133 119 133 144 151 154 21 Catron 0 0 0 0 0 0 0 Chaves 9 7 7 7 7 6 -3 Cibola 2 2 2 3 3 3 1 Colfax 2 2 2 4 4 3 1 Curry 2 2 3 5 6 8 6 De Baca 0 0 0 0 0 0 0 Doña Ana 21 20 23 26 23 22 1 Eddy 9 7 9 7 7 6 -3 Grant 3 3 3 3 3 3 0 Guadalupe 0 0 0 0 0 0 0 Harding 0 0 0 0 0 0 0 Hidalgo 0 0 0 0 1 0 0 Lea 3 3 6 7 10 10 7 Lincoln 3 2 2 2 2 3 0 Los Alamos 2 3 2 3 4 5 3 Luna 4 4 3 2 2 2 -2 McKinley 8 10 9 9 7 3 -5 Mora 0 0 0 0 0 0 0 Otero 11 10 8 8 6 6 -5 Quay 0 0 0 0 0 0 0 Rio Arriba 3 3 3 5 4 5 2 Roosevelt 1 1 1 1 0 0 -1 San Juan 9 9 7 6 7 8 -1 San Miguel 4 4 3 3 2 1 -3 Sandoval 7 7 6 7 9 10 3 Santa Fe 12 11 13 13 16 15 3 Sierra 0 0 0 0 0 0 0 Socorro 4 4 4 3 4 4 0 Taos 3 3 4 5 4 2 -1 Torrance 0 0 0 0 0 0 0 Union 0 0 0 0 0 0 0 Valencia 1 0 0 0 0 0 -1
STATE TOTAL 256 236 253 273 282 279 23

New Mexico Health Care Workforce Committee Report, 2019 37
Table 3.5. Counties with the Greatest Numbers of OB-GYNs Below National Benchmark County Practitioners Needed to Meet Benchmark
Valencia 8 Sandoval 6 McKinley, San Juan 5 each
III.B.2.b. Methodological Notes Our estimates of the New Mexico OB-GYN workforce include MDs and DOs who specialize in obstetrics and/or gynecology. As for PCPs, the estimated counts of OB-GYNs are based on 9,704 MDs and DOs with active license in New Mexico, comprising 7,367 surveyed MDs, 1,588 MDs who have an active license but no survey, 661 surveyed DOs and 88 un-surveyed DOs. For both MDs and DOs, obstetrics and/or gynecology specialty was determined first by self-reported specialty on the individual’s most recent survey. For un-surveyed physicians and those for whom the only survey available was 2015 (the year for which the specialty item was omitted from the survey), specialty was identified through licensure and/or board certification. Surveyed OB-GYNs were allocated to counties by the five-digit ZIP code of their self-reported primary practice location; for un-surveyed OB-GYNs, the county was identified by the licensure address ZIP code.
Using this methodology, we identified a total of 392 actively licensed physicians specializing in obstetrics and/or gynecology. Of these, 336 MDs and 17 DOs (86.7%) were surveyed.
III.B.2.c. Discussion Figure 3.2 shows the county-level comparison of New Mexico’s OB-GYNs to the national benchmark of 2.1 OB-GYNs per 10,000 female population. For the state as a whole, the estimated 279 OB-GYNs represent a statewide OB-GYN-to-female population ratio of 2.64, or 57 above the national benchmark. However, 15 counties (45.5%) were below benchmark, and an additional seven counties had no OB-GYNs and a benchmark value of zero. The five counties most below benchmark were McKinley, San Juan, Sandoval and Valencia, and together would require 24 OB-GYNs to achieve benchmark OB-GYN-to-female population ratios. For the state as a whole, and assuming no redistribution of the current workforce, an additional 39 OB-GYNs would be needed to meet the national benchmark in all counties.
Since 2013, 10 counties have shown net decreases in OB-GYN workforce: Chaves, Eddy, Lincoln, Luna, McKinley, Otero, Roosevelt, San Juan, San Miguel and Valencia. Thirteen counties have remained stable – 10 of these with no OB-GYNs – and 10 have increased. Bernalillo County has gained 21 OB-GYNs since 2013, and the Lea County OB-GYN workforce has grown by seven; all other increases have been changes of fewer practitioners. In total, the state has gained 23 OB-GYNs since 2013.
In San Miguel County, 2018 saw the reopening of labor and delivery facilities at Alta Vista Regional Hospital in Las Vegas. This recovery of inpatient maternity services in the northeastern quadrant of the state is a great success for women’s health care in New Mexico.

38 New Mexico Health Care Workforce Committee Report, 2019
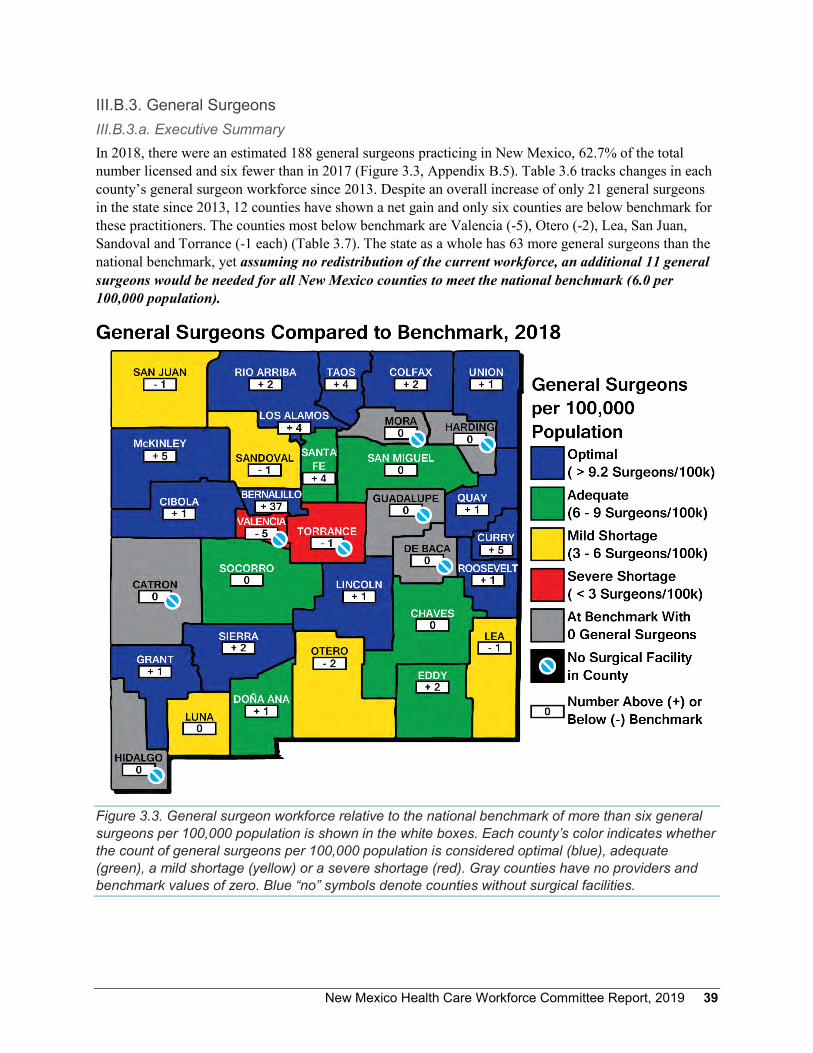
New Mexico Health Care Workforce Committee Report, 2019 39
III.B.3. General Surgeons III.B.3.a. Executive Summary In 2018, there were an estimated 188 general surgeons practicing in New Mexico, 62.7% of the total number licensed and six fewer than in 2017 (Figure 3.3, Appendix B.5). Table 3.6 tracks changes in each county’s general surgeon workforce since 2013. Despite an overall increase of only 21 general surgeons in the state since 2013, 12 counties have shown a net gain and only six counties are below benchmark for these practitioners. The counties most below benchmark are Valencia (-5), Otero (-2), Lea, San Juan, Sandoval and Torrance (-1 each) (Table 3.7). The state as a whole has 63 more general surgeons than the national benchmark, yet assuming no redistribution of the current workforce, an additional 11 general surgeons would be needed for all New Mexico counties to meet the national benchmark (6.0 per 100,000 population).
Figure 3.3. General surgeon workforce relative to the national benchmark of more than six general surgeons per 100,000 population is shown in the white boxes. Each county’s color indicates whether the count of general surgeons per 100,000 population is considered optimal (blue), adequate (green), a mild shortage (yellow) or a severe shortage (red). Gray counties have no providers and benchmark values of zero. Blue “no” symbols denote counties without surgical facilities.
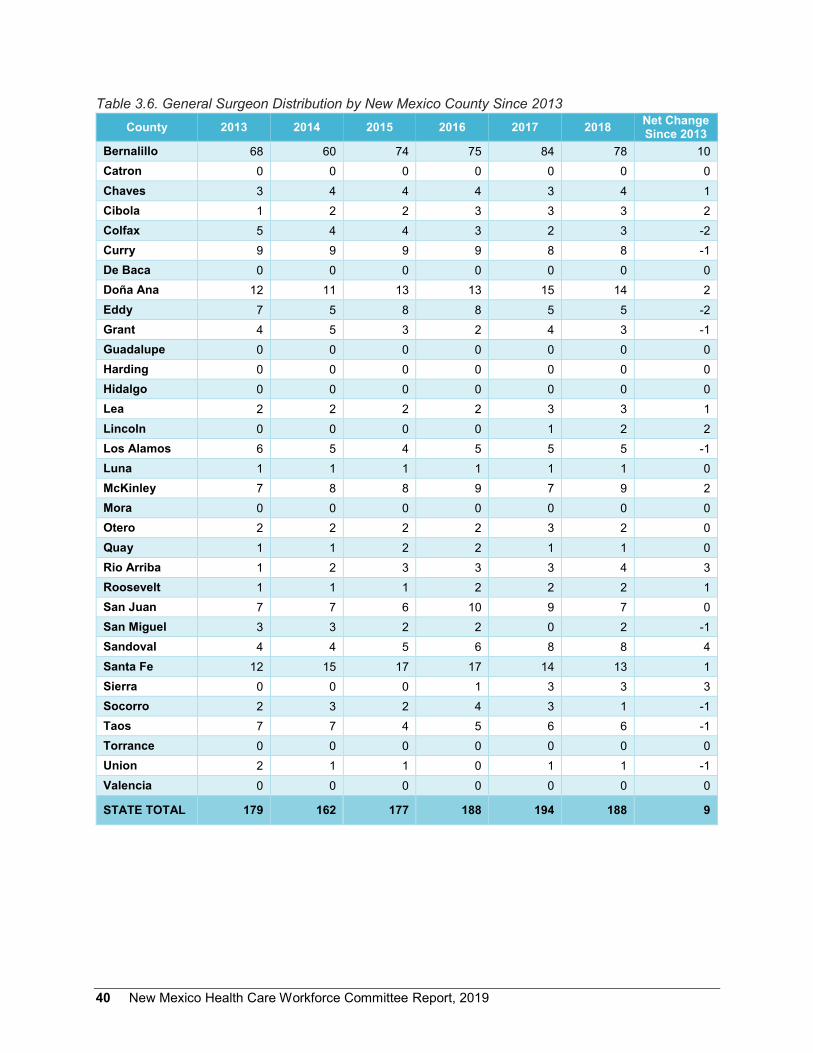
40 New Mexico Health Care Workforce Committee Report, 2019
Table 3.6. General Surgeon Distribution by New Mexico County Since 2013 County 2013 2014 2015 2016 2017 2018 Net Change
Since 2013 Bernalillo 68 60 74 75 84 78 10 Catron 0 0 0 0 0 0 0 Chaves 3 4 4 4 3 4 1 Cibola 1 2 2 3 3 3 2 Colfax 5 4 4 3 2 3 -2 Curry 9 9 9 9 8 8 -1 De Baca 0 0 0 0 0 0 0 Doña Ana 12 11 13 13 15 14 2 Eddy 7 5 8 8 5 5 -2 Grant 4 5 3 2 4 3 -1 Guadalupe 0 0 0 0 0 0 0 Harding 0 0 0 0 0 0 0 Hidalgo 0 0 0 0 0 0 0 Lea 2 2 2 2 3 3 1 Lincoln 0 0 0 0 1 2 2 Los Alamos 6 5 4 5 5 5 -1 Luna 1 1 1 1 1 1 0 McKinley 7 8 8 9 7 9 2 Mora 0 0 0 0 0 0 0 Otero 2 2 2 2 3 2 0 Quay 1 1 2 2 1 1 0 Rio Arriba 1 2 3 3 3 4 3 Roosevelt 1 1 1 2 2 2 1 San Juan 7 7 6 10 9 7 0 San Miguel 3 3 2 2 0 2 -1 Sandoval 4 4 5 6 8 8 4 Santa Fe 12 15 17 17 14 13 1 Sierra 0 0 0 1 3 3 3 Socorro 2 3 2 4 3 1 -1 Taos 7 7 4 5 6 6 -1 Torrance 0 0 0 0 0 0 0 Union 2 1 1 0 1 1 -1 Valencia 0 0 0 0 0 0 0
STATE TOTAL 179 162 177 188 194 188 9

New Mexico Health Care Workforce Committee Report, 2019 41
Table 3.7. Counties with the Greatest Numbers of General Surgeons Below National Benchmark County Practitioners Needed to Meet Benchmark
Valencia 5 Otero 2 Lea, San Juan, Sandoval, Torrance 1 each
III.B.3.b. Methodological Notes Our estimates of the New Mexico general surgeon workforce include MDs and DOs who specialize in general surgery. Thresholds for optimal, adequate, mild shortage and severe shortage are taken from Ricketts et al.13
The estimated counts of general surgeons are based on 9,704 MDs and DOs with active license in New Mexico, comprising 7,367 surveyed MDs, 1,588 MDs who have an active license but no survey, 661 surveyed DOs and 88 un-surveyed DOs. For both MDs and DOs, general surgery specialty was determined first by self-reported specialty on the individual’s most recent survey. For un-surveyed physicians and those for whom the only survey available was 2015 (the year for which the specialty item was omitted from the survey), specialty was identified through licensure and/or board certification. General surgeons were allocated to counties by the five-digit ZIP code of their self-reported primary practice location; for un-surveyed physicians, the county was identified by the licensure address ZIP code.
A total of 300 general surgeons with active New Mexico licensure were identified. Of these, 242 MDs and 18 DOs (86.7%) were surveyed.
III.B.3.c. Discussion Figure 3.3 shows the county-level comparison of New Mexico’s general surgeons to the national benchmark of six general surgeons per 100,000 population. For the state as a whole, the estimated 188 general surgeons practicing in New Mexico represent a statewide general surgeon-to-population ratio of 9.0 per 100,000, or 63 above the national benchmark. Only six counties (18.2%) were below benchmark. For the state as a whole, and assuming no redistribution of the current workforce, an additional 11 general surgeons would be needed to meet the national benchmark in all counties. However, it is important to note that two of the nine counties below benchmark do not have surgical facilities: these are Torrance and Valencia counties, which together are six general surgeons below benchmark.
Since 2013, the state has seen an increase of 21 general surgeons. Net increases in the county-level general surgeon workforce have been observed in 12 counties, an additional 12 have remained stable (eight with zero providers) and nine have experienced a net decrease in general surgeons. The largest gain – 10 general surgeons – has been in Bernalillo County. There are eight New Mexico counties without surgical facilities, and these will remain unstaffed by general surgeons.

42 New Mexico Health Care Workforce Committee Report, 2019
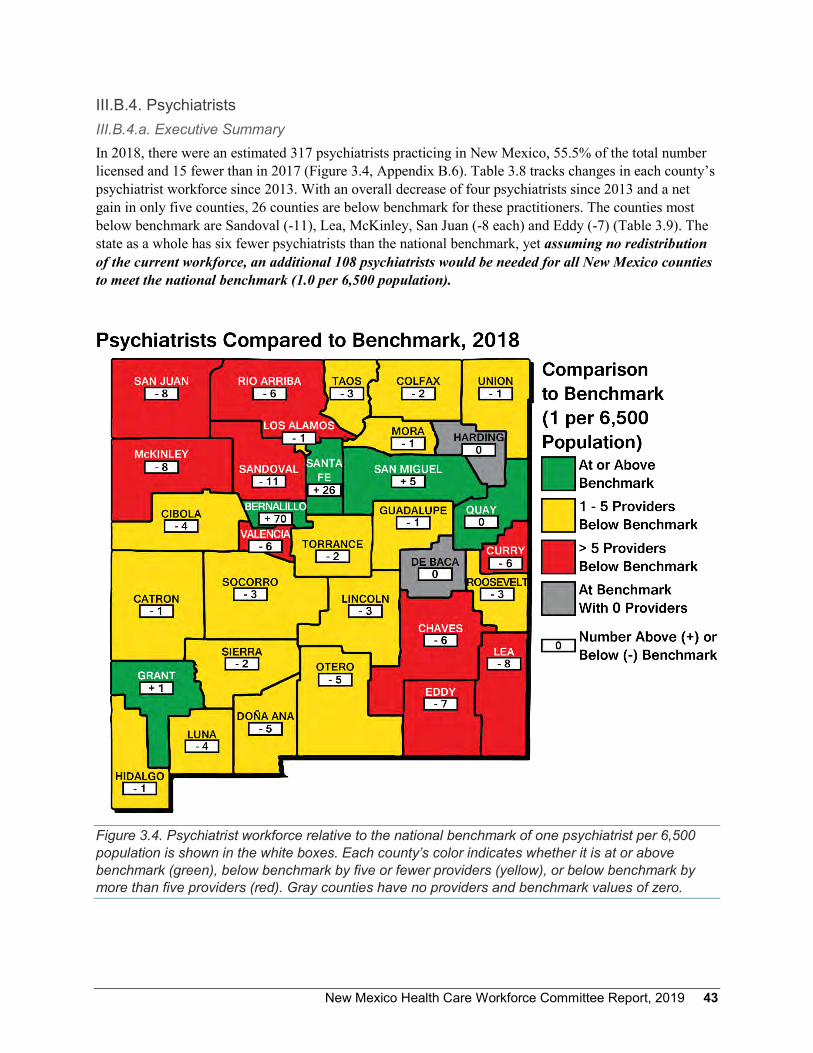
New Mexico Health Care Workforce Committee Report, 2019 43
III.B.4. Psychiatrists III.B.4.a. Executive Summary In 2018, there were an estimated 317 psychiatrists practicing in New Mexico, 55.5% of the total number licensed and 15 fewer than in 2017 (Figure 3.4, Appendix B.6). Table 3.8 tracks changes in each county’s psychiatrist workforce since 2013. With an overall decrease of four psychiatrists since 2013 and a net gain in only five counties, 26 counties are below benchmark for these practitioners. The counties most below benchmark are Sandoval (-11), Lea, McKinley, San Juan (-8 each) and Eddy (-7) (Table 3.9). The state as a whole has six fewer psychiatrists than the national benchmark, yet assuming no redistribution of the current workforce, an additional 108 psychiatrists would be needed for all New Mexico counties to meet the national benchmark (1.0 per 6,500 population).
Figure 3.4. Psychiatrist workforce relative to the national benchmark of one psychiatrist per 6,500 population is shown in the white boxes. Each county’s color indicates whether it is at or above benchmark (green), below benchmark by five or fewer providers (yellow), or below benchmark by more than five providers (red). Gray counties have no providers and benchmark values of zero.
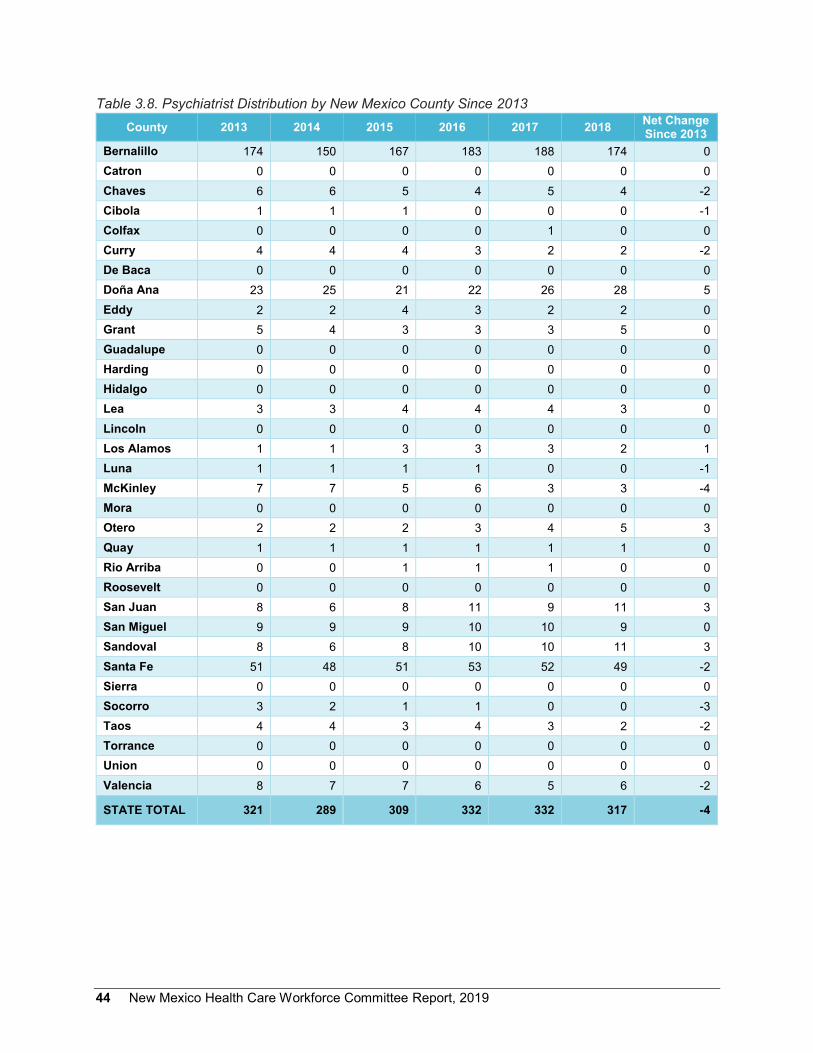
44 New Mexico Health Care Workforce Committee Report, 2019
Table 3.8. Psychiatrist Distribution by New Mexico County Since 2013 County 2013 2014 2015 2016 2017 2018 Net Change
Since 2013 Bernalillo 174 150 167 183 188 174 0 Catron 0 0 0 0 0 0 0 Chaves 6 6 5 4 5 4 -2 Cibola 1 1 1 0 0 0 -1 Colfax 0 0 0 0 1 0 0 Curry 4 4 4 3 2 2 -2 De Baca 0 0 0 0 0 0 0 Doña Ana 23 25 21 22 26 28 5 Eddy 2 2 4 3 2 2 0 Grant 5 4 3 3 3 5 0 Guadalupe 0 0 0 0 0 0 0 Harding 0 0 0 0 0 0 0 Hidalgo 0 0 0 0 0 0 0 Lea 3 3 4 4 4 3 0 Lincoln 0 0 0 0 0 0 0 Los Alamos 1 1 3 3 3 2 1 Luna 1 1 1 1 0 0 -1 McKinley 7 7 5 6 3 3 -4 Mora 0 0 0 0 0 0 0 Otero 2 2 2 3 4 5 3 Quay 1 1 1 1 1 1 0 Rio Arriba 0 0 1 1 1 0 0 Roosevelt 0 0 0 0 0 0 0 San Juan 8 6 8 11 9 11 3 San Miguel 9 9 9 10 10 9 0 Sandoval 8 6 8 10 10 11 3 Santa Fe 51 48 51 53 52 49 -2 Sierra 0 0 0 0 0 0 0 Socorro 3 2 1 1 0 0 -3 Taos 4 4 3 4 3 2 -2 Torrance 0 0 0 0 0 0 0 Union 0 0 0 0 0 0 0 Valencia 8 7 7 6 5 6 -2
STATE TOTAL 321 289 309 332 332 317 -4

New Mexico Health Care Workforce Committee Report, 2019 45
Table 3.9. Counties with the Greatest Numbers of Psychiatrists Below National Benchmark County Practitioners Needed to Meet Benchmark
Sandoval 11 Lea, McKinley, San Juan 8 each Eddy 7
III.B.4.b. Methodological Notes Our estimates of the New Mexico psychiatrist workforce include MDs and DOs who specialize in psychiatry. The estimated counts of psychiatrists are based on 9,704 MDs and DOs with active license in New Mexico, comprising 7,367 surveyed MDs, 1,588 MDs who have an active license but no survey, 661 surveyed DOs and 88 un-surveyed DOs. For both MDs and DOs, psychiatry specialty was determined first by self-reported specialty on the individual’s most recent survey. For un-surveyed physicians and those for whom the only survey available was 2015 (the year for which the specialty item was omitted from the survey), specialty was identified through licensure and/or board certification. Surveyed psychiatrists were allocated to counties by the five-digit ZIP code of their self-reported primary practice location; for un-surveyed psychiatrists, the county was identified by the licensure address ZIP code.
A total of 571 psychiatrists with active New Mexico licensure were identified. Of these, 451 MDs and 28 DOs (83.9%) were surveyed.
III.B.4.c. Discussion Figure 3.4 shows the county-level comparison of New Mexico’s psychiatrists to the national benchmark of one per 6,500 population. For the state as a whole, the estimated 317 psychiatrists practicing in New Mexico represent a statewide psychiatrist-to-population ratio of 0.98 per 6,500, or six below the national benchmark. Twenty-six counties (78.8%) were below benchmark. The five counties at or above benchmark – Bernalillo, Grant, Quay, San Miguel and Santa Fe – together account for 75 percent of the state’s psychiatrists (see psychiatrist counts reported in Table 3.8). The counties most below benchmark were Eddy, Lea, McKinley, San Juan and Sandoval, and together would require 42 psychiatrists to achieve benchmark psychiatrist-to-population ratios. For the state as a whole, and assuming no redistribution of the current workforce, an additional 108 psychiatrists would be needed to meet the national benchmark in all counties.
Since 2013, net decreases in the psychiatrist workforce have been observed in nine counties: Chaves, Cibola, Curry, Luna, McKinley, Santa Fe, Socorro, Taos and Valencia. Nineteen counties have remained stable (11 with zero psychiatrists) and five have increased. The most substantial loss since 2013 has been in McKinley County, which has seen a decrease of four psychiatrists. The most substantial gain has been five in Doña Ana County. All other counties’ changes have been of three or fewer providers.

46 New Mexico Health Care Workforce Committee Report, 2019

New Mexico Health Care Workforce Committee Report, 2019 47
III.C. Other Health Professions III.C.1. Physician Assistants III.C.1.a. Executive Summary In 2018, there were an estimated 805 PAs practicing in New Mexico, 72.7% of the total number licensed, and 13 more than in 2017 (Figure 3.5, Appendix B.7). Table 3.10 tracks changes in each county’s PAs workforce since 2014. Despite an overall increase of 111 PAs in the state since 2014 and 14 counties showing a net gain, only 11 counties are above benchmark for these practitioners. The counties most below benchmark are Doña Ana (-25), Valencia (-13), Lea (-12) and McKinley (-9) (Table 3.11). The state as a whole has 170 more PAs than the national benchmark, yet assuming no redistribution of the current workforce, an additional 115 PAs would be needed for all New Mexico counties to meet the national benchmark (0.303 per 1,000 population).
Figure 3.5. Physician assistant workforce relative to the national benchmark of 0.303 PAs per 1,000 population is shown in the white boxes. Each county’s color indicates whether it is at or above benchmark (green), below benchmark by 10 or fewer providers (yellow), or below benchmark by more than 10 providers (red). Gray counties have no providers and benchmark values of zero.
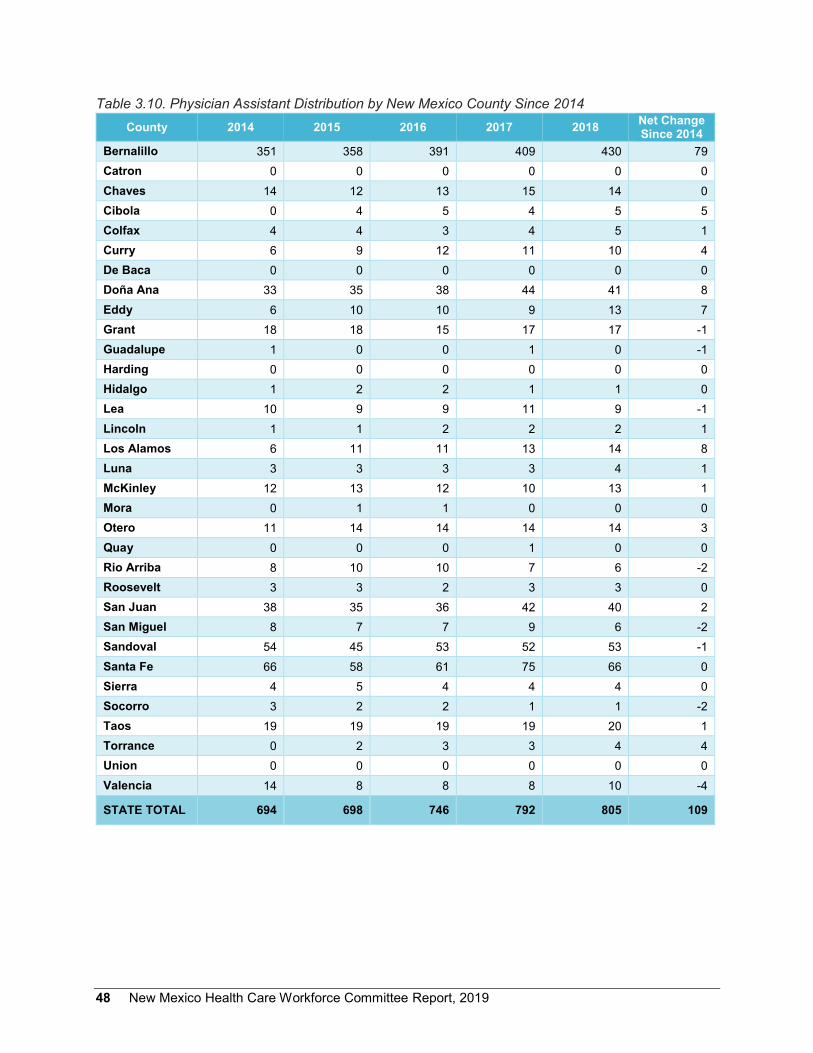
48 New Mexico Health Care Workforce Committee Report, 2019
Table 3.10. Physician Assistant Distribution by New Mexico County Since 2014 County 2014 2015 2016 2017 2018 Net Change
Since 2014 Bernalillo 351 358 391 409 430 79 Catron 0 0 0 0 0 0 Chaves 14 12 13 15 14 0 Cibola 0 4 5 4 5 5 Colfax 4 4 3 4 5 1 Curry 6 9 12 11 10 4 De Baca 0 0 0 0 0 0 Doña Ana 33 35 38 44 41 8 Eddy 6 10 10 9 13 7 Grant 18 18 15 17 17 -1 Guadalupe 1 0 0 1 0 -1 Harding 0 0 0 0 0 0 Hidalgo 1 2 2 1 1 0 Lea 10 9 9 11 9 -1 Lincoln 1 1 2 2 2 1 Los Alamos 6 11 11 13 14 8 Luna 3 3 3 3 4 1 McKinley 12 13 12 10 13 1 Mora 0 1 1 0 0 0 Otero 11 14 14 14 14 3 Quay 0 0 0 1 0 0 Rio Arriba 8 10 10 7 6 -2 Roosevelt 3 3 2 3 3 0 San Juan 38 35 36 42 40 2 San Miguel 8 7 7 9 6 -2 Sandoval 54 45 53 52 53 -1 Santa Fe 66 58 61 75 66 0 Sierra 4 5 4 4 4 0 Socorro 3 2 2 1 1 -2 Taos 19 19 19 19 20 1 Torrance 0 2 3 3 4 4 Union 0 0 0 0 0 0 Valencia 14 8 8 8 10 -4
STATE TOTAL 694 698 746 792 805 109

New Mexico Health Care Workforce Committee Report, 2019 49
Table 3.11. Counties with the Greatest Numbers of Physician Assistants Below National Benchmark County Practitioners Needed to Meet Benchmark
Doña Ana 25 Valencia 13 Lea 12 McKinley 9
III.C.1.b. Methodological Notes Estimated counts of PAs are based on 1,107 PAs with active license in New Mexico, comprising 762 surveyed PAs and 345 PAs who have an active license but no survey. County-level counts include all PAs, regardless of specialty, consistent with our national benchmark metric. As for physicians, surveyed PAs were allocated to counties by the five-digit ZIP code of their self-reported primary practice location; for un-surveyed PAs, the county was identified by the licensure address ZIP code.
III.C.1.c. Discussion Figure 3.5 shows the county-level comparison of New Mexico’s PAs to the national benchmark of 0.303 PAs per 1,000 population. For the state as a whole, the estimated 805 PAs represent a statewide PA-to- population ratio of 0.38 per 1,000, or 170 above the national benchmark. However, 22 counties (66.7%) were below benchmark. The counties most below benchmark were Doña Ana, Lea, McKinley and Valencia, and together would require 59 PAs to achieve benchmark PA-to-population ratios. For the state as a whole, and assuming no redistribution of the current workforce, an additional 115 PAs would be needed to meet the national benchmark in all counties.
Since 2014, net decreases in PA workforce have been observed in eight counties: Grant, Guadalupe, Lea, Rio Arriba, San Miguel, Sandoval, Socorro and Valencia. Eleven counties have remained stable (five with zero providers) and 14 have increased. The largest gains since 2014 have occurred in Bernalillo, Doña Ana and Los Alamos counties; all other counties show net increases of four or fewer PAs. In 2017, changes to PA practice regulations made provisions for collaborative practice, a licensure designation available to PAs who have practiced under supervision for at least three years that allows more independence of practice and billing.29 We are optimistic that this change will have a positive impact on the state’s PA workforce.
PA specialties are not reflected in the estimated counts described above, in order to match the inclusion criteria of our benchmark metric. According to the National Commission on Certification of Physician Assistants, approximately 40 percent of PAs work in primary care fields, indicating that there could be 322 PAs providing primary care in New Mexico. In 2017 the PA survey was amended to include an item asking respondents’ specialties; as a result, we anticipate being able to report more in-depth information on PAs’ specialties in the near future (see Section III.D.2).

50 New Mexico Health Care Workforce Committee Report, 2019
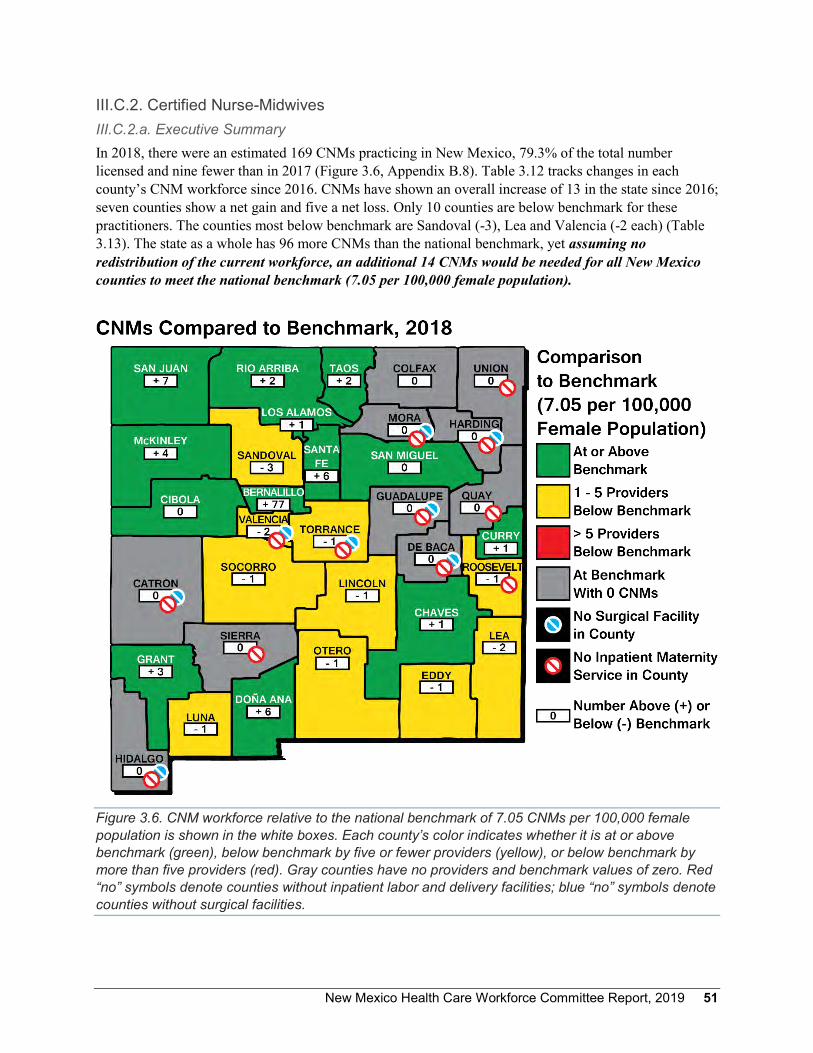
New Mexico Health Care Workforce Committee Report, 2019 51
III.C.2. Certified Nurse-Midwives III.C.2.a. Executive Summary In 2018, there were an estimated 169 CNMs practicing in New Mexico, 79.3% of the total number licensed and nine fewer than in 2017 (Figure 3.6, Appendix B.8). Table 3.12 tracks changes in each county’s CNM workforce since 2016. CNMs have shown an overall increase of 13 in the state since 2016; seven counties show a net gain and five a net loss. Only 10 counties are below benchmark for these practitioners. The counties most below benchmark are Sandoval (-3), Lea and Valencia (-2 each) (Table 3.13). The state as a whole has 96 more CNMs than the national benchmark, yet assuming no redistribution of the current workforce, an additional 14 CNMs would be needed for all New Mexico counties to meet the national benchmark (7.05 per 100,000 female population).
Figure 3.6. CNM workforce relative to the national benchmark of 7.05 CNMs per 100,000 female population is shown in the white boxes. Each county’s color indicates whether it is at or above benchmark (green), below benchmark by five or fewer providers (yellow), or below benchmark by more than five providers (red). Gray counties have no providers and benchmark values of zero. Red “no” symbols denote counties without inpatient labor and delivery facilities; blue “no” symbols denote counties without surgical facilities.

52 New Mexico Health Care Workforce Committee Report, 2019
Table 3.12. CNM Distribution by New Mexico County Since 2016 County 2016 2017 2018 Net Change
Since 2016 Bernalillo 89 104 101 12 Catron 0 0 0 0 Chaves 2 3 3 1 Cibola 1 1 1 0 Colfax 0 0 0 0 Curry 3 3 3 0 De Baca 0 0 0 0 Doña Ana 9 14 14 5 Eddy 1 1 1 0 Grant 4 4 4 0 Guadalupe 0 0 0 0 Harding 0 0 0 0 Hidalgo 0 0 0 0 Lea 0 0 0 0 Lincoln 0 0 0 0 Los Alamos 1 2 2 1 Luna 0 0 0 0 McKinley 7 7 7 0 Mora 0 0 0 0 Otero 1 1 1 0 Quay 0 0 0 0 Rio Arriba 0 2 3 3 Roosevelt 0 0 0 0 San Juan 6 9 11 5 San Miguel 3 3 1 -2 Sandoval 8 5 2 -6 Santa Fe 16 14 11 -5 Sierra 0 0 0 0 Socorro 1 0 0 -1 Taos 4 4 3 -1 Torrance 0 0 0 0 Union 0 0 0 0 Valencia 0 1 1 1
STATE TOTAL 156 178 169 13
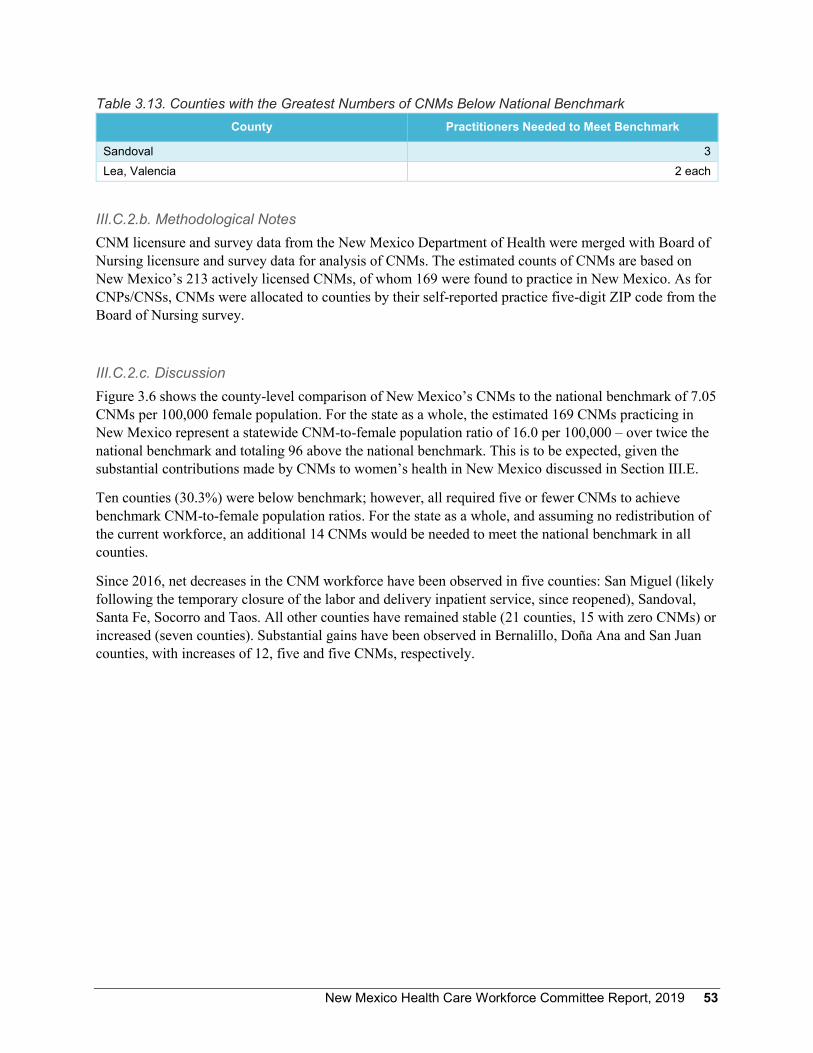
New Mexico Health Care Workforce Committee Report, 2019 53
Table 3.13. Counties with the Greatest Numbers of CNMs Below National Benchmark County Practitioners Needed to Meet Benchmark
Sandoval 3 Lea, Valencia 2 each
III.C.2.b. Methodological Notes CNM licensure and survey data from the New Mexico Department of Health were merged with Board of Nursing licensure and survey data for analysis of CNMs. The estimated counts of CNMs are based on New Mexico’s 213 actively licensed CNMs, of whom 169 were found to practice in New Mexico. As for CNPs/CNSs, CNMs were allocated to counties by their self-reported practice five-digit ZIP code from the Board of Nursing survey.
III.C.2.c. Discussion Figure 3.6 shows the county-level comparison of New Mexico’s CNMs to the national benchmark of 7.05 CNMs per 100,000 female population. For the state as a whole, the estimated 169 CNMs practicing in New Mexico represent a statewide CNM-to-female population ratio of 16.0 per 100,000 – over twice the national benchmark and totaling 96 above the national benchmark. This is to be expected, given the substantial contributions made by CNMs to women’s health in New Mexico discussed in Section III.E.
Ten counties (30.3%) were below benchmark; however, all required five or fewer CNMs to achieve benchmark CNM-to-female population ratios. For the state as a whole, and assuming no redistribution of the current workforce, an additional 14 CNMs would be needed to meet the national benchmark in all counties.
Since 2016, net decreases in the CNM workforce have been observed in five counties: San Miguel (likely following the temporary closure of the labor and delivery inpatient service, since reopened), Sandoval, Santa Fe, Socorro and Taos. All other counties have remained stable (21 counties, 15 with zero CNMs) or increased (seven counties). Substantial gains have been observed in Bernalillo, Doña Ana and San Juan counties, with increases of 12, five and five CNMs, respectively.

54 New Mexico Health Care Workforce Committee Report, 2019

New Mexico Health Care Workforce Committee Report, 2019 55
III.C.3. Licensed Midwives III.C.3.a. Executive Summary In 2018, there were an estimated 40 LMs practicing in New Mexico, 51.3% of the total number licensed and two fewer than in 2017 (Figure 3.7, Appendix B.9). Table 3.14 tracks changes in each county’s LM workforce since 2016. There has been an overall increase of two LMs in the state since 2016, and only four counties – Chaves, Lea, McKinley, and San Juan (-1 each) – are below benchmark for these practitioners (Table 3.15). The state as a whole has 24 more LMs than the national benchmark, yet assuming no redistribution of the current workforce, an additional four LMs would be needed for all New Mexico counties to meet the national benchmark (1.7 per 100,000 female population).
Figure 3.7. LM workforce relative to the national benchmark of 1.7 LMs per 100,000 female population is shown in the white boxes. Each county’s color indicates whether it is at or above benchmark (green), below benchmark by five or fewer providers (yellow), or below benchmark by more than five providers (red). Gray counties have no providers and benchmark values of zero. Red “no” symbols denote counties without inpatient labor and delivery facilities; blue “no” symbols denote counties without surgical facilities.

56 New Mexico Health Care Workforce Committee Report, 2019
Table 3.14. LM Distribution by New Mexico County Since 2016 County 2016 2017 2018 Net Change
Since 2016 Bernalillo 10 10 10 0 Catron 0 0 0 0 Chaves 0 0 0 0 Cibola 1 1 0 -1 Colfax 0 0 0 0 Curry 0 0 0 0 De Baca 0 0 0 0 Doña Ana 4 5 5 1 Eddy 0 0 0 0 Grant 1 1 1 0 Guadalupe 0 0 0 0 Harding 0 0 0 0 Hidalgo 0 0 0 0 Lea 0 0 0 0 Lincoln 0 0 0 0 Los Alamos 0 0 0 0 Luna 0 0 0 0 McKinley 0 0 0 0 Mora 0 0 0 0 Otero 1 1 1 0 Quay 0 0 0 0 Rio Arriba 2 3 3 1 Roosevelt 0 0 0 0 San Juan 0 0 0 0 San Miguel 1 3 3 2 Sandoval 3 3 4 1 Santa Fe 7 7 8 1 Sierra 1 1 1 0 Socorro 0 0 0 0 Taos 6 6 3 -3 Torrance 0 0 0 0 Union 0 0 0 0 Valencia 1 1 1 0
STATE TOTAL 38 42 40 2
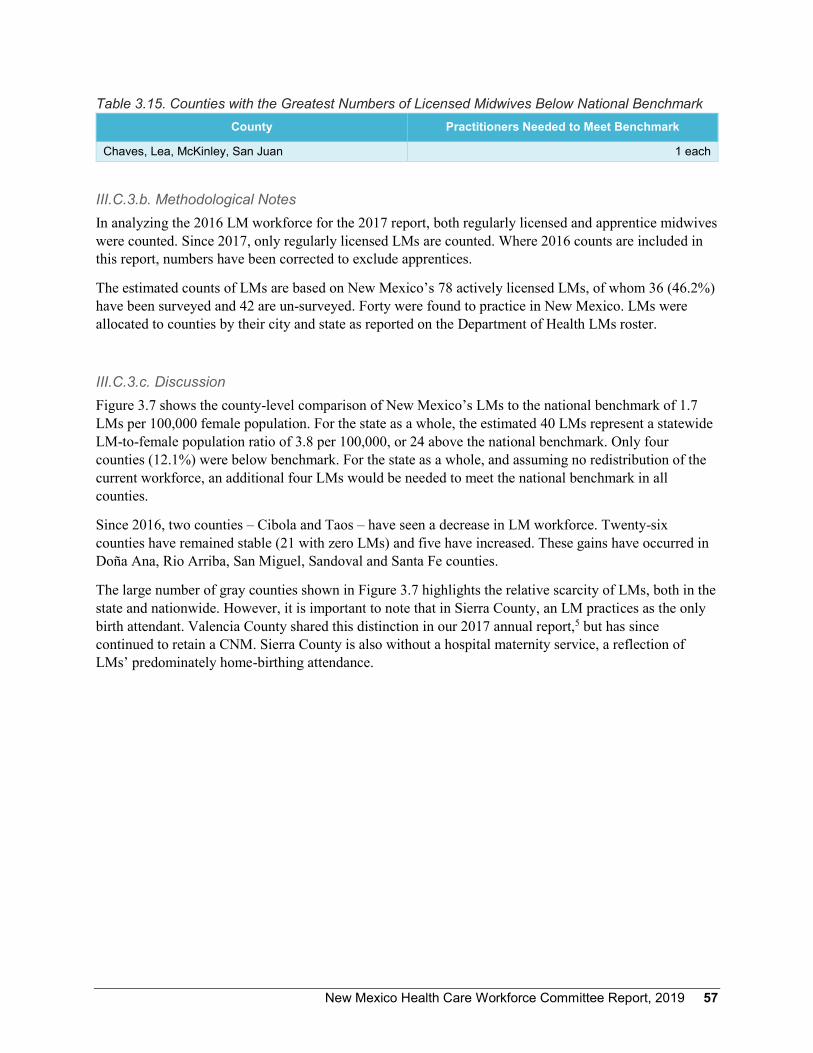
New Mexico Health Care Workforce Committee Report, 2019 57
Table 3.15. Counties with the Greatest Numbers of Licensed Midwives Below National Benchmark County Practitioners Needed to Meet Benchmark
Chaves, Lea, McKinley, San Juan 1 each
III.C.3.b. Methodological Notes In analyzing the 2016 LM workforce for the 2017 report, both regularly licensed and apprentice midwives were counted. Since 2017, only regularly licensed LMs are counted. Where 2016 counts are included in this report, numbers have been corrected to exclude apprentices.
The estimated counts of LMs are based on New Mexico’s 78 actively licensed LMs, of whom 36 (46.2%) have been surveyed and 42 are un-surveyed. Forty were found to practice in New Mexico. LMs were allocated to counties by their city and state as reported on the Department of Health LMs roster.
III.C.3.c. Discussion Figure 3.7 shows the county-level comparison of New Mexico’s LMs to the national benchmark of 1.7 LMs per 100,000 female population. For the state as a whole, the estimated 40 LMs represent a statewide LM-to-female population ratio of 3.8 per 100,000, or 24 above the national benchmark. Only four counties (12.1%) were below benchmark. For the state as a whole, and assuming no redistribution of the current workforce, an additional four LMs would be needed to meet the national benchmark in all counties.
Since 2016, two counties – Cibola and Taos – have seen a decrease in LM workforce. Twenty-six counties have remained stable (21 with zero LMs) and five have increased. These gains have occurred in Doña Ana, Rio Arriba, San Miguel, Sandoval and Santa Fe counties.
The large number of gray counties shown in Figure 3.7 highlights the relative scarcity of LMs, both in the state and nationwide. However, it is important to note that in Sierra County, an LM practices as the only birth attendant. Valencia County shared this distinction in our 2017 annual report,5 but has since continued to retain a CNM. Sierra County is also without a hospital maternity service, a reflection of LMs’ predominately home-birthing attendance.

58 New Mexico Health Care Workforce Committee Report, 2019
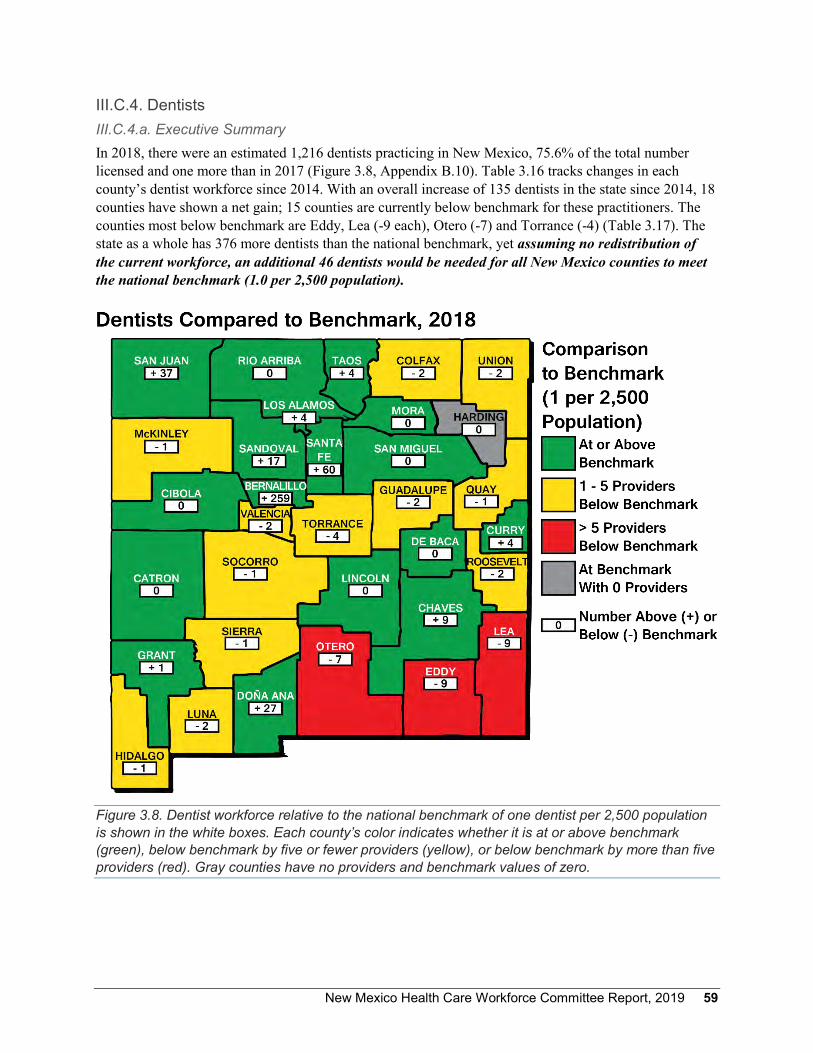
New Mexico Health Care Workforce Committee Report, 2019 59
III.C.4. Dentists III.C.4.a. Executive Summary In 2018, there were an estimated 1,216 dentists practicing in New Mexico, 75.6% of the total number licensed and one more than in 2017 (Figure 3.8, Appendix B.10). Table 3.16 tracks changes in each county’s dentist workforce since 2014. With an overall increase of 135 dentists in the state since 2014, 18 counties have shown a net gain; 15 counties are currently below benchmark for these practitioners. The counties most below benchmark are Eddy, Lea (-9 each), Otero (-7) and Torrance (-4) (Table 3.17). The state as a whole has 376 more dentists than the national benchmark, yet assuming no redistribution of the current workforce, an additional 46 dentists would be needed for all New Mexico counties to meet the national benchmark (1.0 per 2,500 population).
Figure 3.8. Dentist workforce relative to the national benchmark of one dentist per 2,500 population is shown in the white boxes. Each county’s color indicates whether it is at or above benchmark (green), below benchmark by five or fewer providers (yellow), or below benchmark by more than five providers (red). Gray counties have no providers and benchmark values of zero.

60 New Mexico Health Care Workforce Committee Report, 2019
Table 3.16. Dentist Distribution by New Mexico County Since 2014 County 2014 2015 2016 2017 2018 Net Change
Since 2014 Bernalillo 480 504 508 533 530 50 Catron 1 1 1 1 1 0 Chaves 21 24 28 32 35 14 Cibola 8 8 9 11 11 3 Colfax 4 4 4 4 3 -1 Curry 25 29 27 24 24 -1 De Baca 0 0 0 0 1 1 Doña Ana 95 104 106 109 114 19 Eddy 15 19 19 17 14 -1 Grant 13 11 13 12 12 -1 Guadalupe 1 1 2 1 0 -1 Harding 0 0 0 0 0 0 Hidalgo 0 0 0 1 1 1 Lea 19 17 23 22 19 0 Lincoln 8 10 8 9 8 0 Los Alamos 16 15 14 12 12 -4 Luna 7 7 8 7 8 1 McKinley 32 31 29 28 28 -4 Mora 1 1 2 2 2 1 Otero 19 18 17 21 20 1 Quay 1 1 1 1 2 1 Rio Arriba 10 11 14 16 16 6 Roosevelt 3 3 5 4 5 2 San Juan 71 78 88 89 87 16 San Miguel 12 10 9 10 11 -1 Sandoval 60 60 69 77 75 15 Santa Fe 112 114 121 117 120 8 Sierra 6 4 3 2 3 -3 Socorro 4 4 4 5 6 2 Taos 15 17 16 20 17 2 Torrance 2 2 2 2 2 0 Union 0 0 0 0 0 0 Valencia 20 23 21 26 29 9
STATE TOTAL 1,081 1,131 1,171 1,215 1,216 135
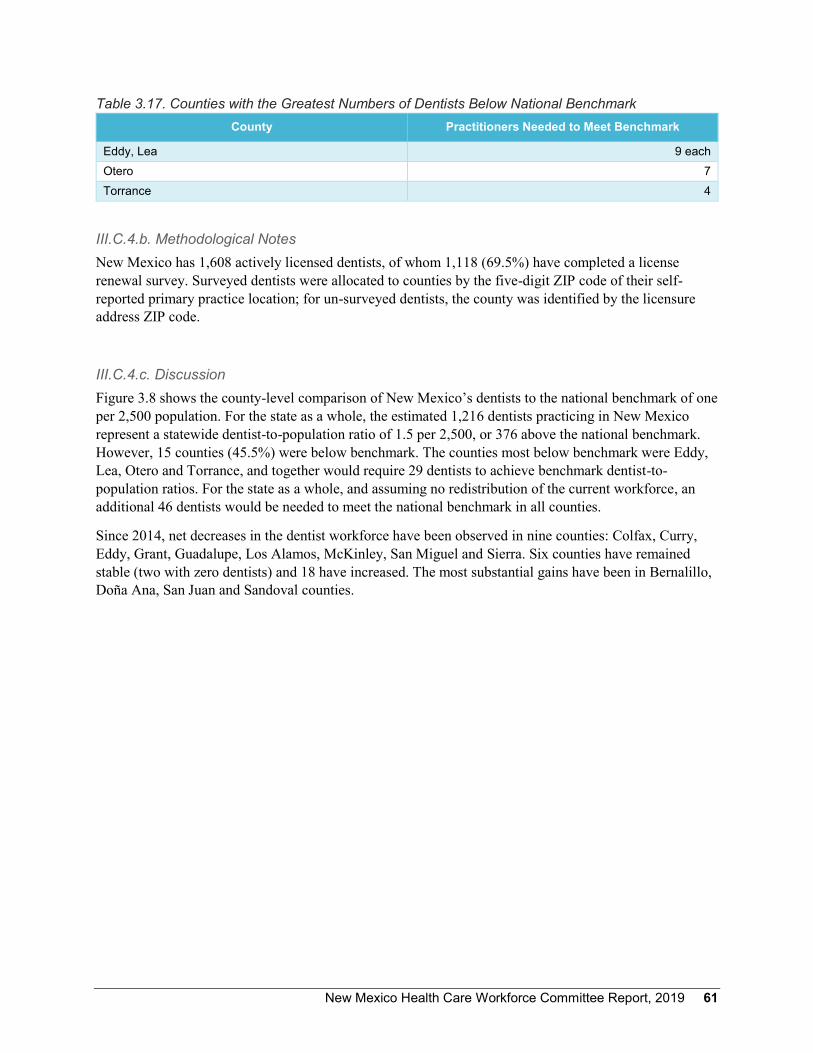
New Mexico Health Care Workforce Committee Report, 2019 61
Table 3.17. Counties with the Greatest Numbers of Dentists Below National Benchmark County Practitioners Needed to Meet Benchmark
Eddy, Lea 9 each Otero 7 Torrance 4
III.C.4.b. Methodological Notes New Mexico has 1,608 actively licensed dentists, of whom 1,118 (69.5%) have completed a license renewal survey. Surveyed dentists were allocated to counties by the five-digit ZIP code of their self-reported primary practice location; for un-surveyed dentists, the county was identified by the licensure address ZIP code.
III.C.4.c. Discussion Figure 3.8 shows the county-level comparison of New Mexico’s dentists to the national benchmark of one per 2,500 population. For the state as a whole, the estimated 1,216 dentists practicing in New Mexico represent a statewide dentist-to-population ratio of 1.5 per 2,500, or 376 above the national benchmark. However, 15 counties (45.5%) were below benchmark. The counties most below benchmark were Eddy, Lea, Otero and Torrance, and together would require 29 dentists to achieve benchmark dentist-to-population ratios. For the state as a whole, and assuming no redistribution of the current workforce, an additional 46 dentists would be needed to meet the national benchmark in all counties.
Since 2014, net decreases in the dentist workforce have been observed in nine counties: Colfax, Curry, Eddy, Grant, Guadalupe, Los Alamos, McKinley, San Miguel and Sierra. Six counties have remained stable (two with zero dentists) and 18 have increased. The most substantial gains have been in Bernalillo, Doña Ana, San Juan and Sandoval counties.

62 New Mexico Health Care Workforce Committee Report, 2019

New Mexico Health Care Workforce Committee Report, 2019 63
III.C.5. Emergency Medical Technicians III.C.5.a. Executive Summary In 2018, there were an estimated 6,501 EMTs practicing in New Mexico, 88.4% of the total number licensed and 137 more than in 2017 (Figure 3.9, Appendix B.11). Table 3.18 tracks changes in each county’s EMT workforce since 2016. There has been an overall increase of 400 EMTs in the state since 2016, and 22 counties have shown a net gain. Ten counties are below benchmark for these practitioners; the counties most below benchmark are Doña Ana (-153), Otero (-58), Valencia (-47), San Miguel (-37) and Cibola (-27) (Table 3.19). The state as a whole has 487 more EMTs than the national benchmark, yet assuming no redistribution of the current workforce, an additional 392 EMTs would be needed for all New Mexico counties to meet the national benchmark (2.87 per 1,000 population).
Figure 3.9. EMT workforce relative to the national benchmark of 2.87 EMTs per 1,000 population is shown in the white boxes. Each county’s color indicates whether it is at or above benchmark (green), below benchmark by 20 or fewer providers (yellow), or below benchmark by more than 20 providers (red).
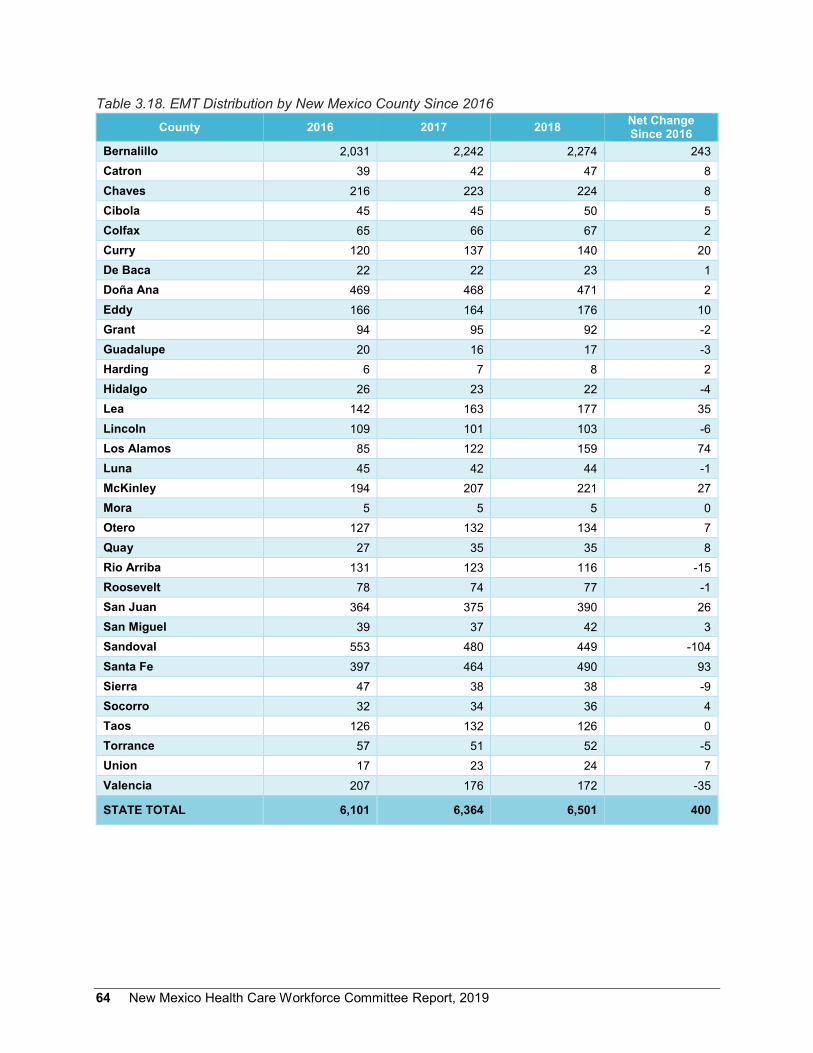
64 New Mexico Health Care Workforce Committee Report, 2019
Table 3.18. EMT Distribution by New Mexico County Since 2016 County 2016 2017 2018 Net Change
Since 2016 Bernalillo 2,031 2,242 2,274 243 Catron 39 42 47 8 Chaves 216 223 224 8 Cibola 45 45 50 5 Colfax 65 66 67 2 Curry 120 137 140 20 De Baca 22 22 23 1 Doña Ana 469 468 471 2 Eddy 166 164 176 10 Grant 94 95 92 -2 Guadalupe 20 16 17 -3 Harding 6 7 8 2 Hidalgo 26 23 22 -4 Lea 142 163 177 35 Lincoln 109 101 103 -6 Los Alamos 85 122 159 74 Luna 45 42 44 -1 McKinley 194 207 221 27 Mora 5 5 5 0 Otero 127 132 134 7 Quay 27 35 35 8 Rio Arriba 131 123 116 -15 Roosevelt 78 74 77 -1 San Juan 364 375 390 26 San Miguel 39 37 42 3 Sandoval 553 480 449 -104 Santa Fe 397 464 490 93 Sierra 47 38 38 -9 Socorro 32 34 36 4 Taos 126 132 126 0 Torrance 57 51 52 -5 Union 17 23 24 7 Valencia 207 176 172 -35
STATE TOTAL 6,101 6,364 6,501 400

New Mexico Health Care Workforce Committee Report, 2019 65
Table 3.19. Counties with the Greatest Numbers of EMTs Below National Benchmark County Practitioners Needed to Meet Benchmark
Doña Ana 153 Otero 58 Valencia 47 San Miguel 37 Cibola 27
III.C.5.b. Methodological Notes Because our identified benchmark metric includes only EMTs of license type basic, intermediate and paramedic (EMT-B, EMT-I and EMT-P),19 our analysis only includes individuals with these licenses. New Mexico also issues dispatcher and first responder licenses, but these individuals were excluded from the EMT counts.
The estimated counts of EMTs are based on New Mexico’s 8,387 actively licensed EMTs, of whom 7,358 (87.7%) are of license types EMT-B, EMT-I and EMT-P. EMTs complete surveys at initial licensure and license renewal; as a result, survey responses are available for all licensees. EMTs were allocated to counties by self-reported employment county.
III.C.5.c. Discussion Figure 3.9 shows the county-level comparison of New Mexico’s EMTs to the national benchmark of 2.87 EMTs per 1,000 population. For the state as a whole, the estimated 6,501 EMTs practicing in New Mexico represent a statewide EMT-to-population ratio of 3.1 per 1,000, or 487 above the national benchmark. However, 10 counties (30.3%) were below benchmark. The counties most below benchmark were Cibola, Doña Ana, Otero, Valencia and San Miguel, and together would require 322 EMTs to achieve benchmark EMT-to-population ratios. For the state as a whole, and assuming no redistribution of the current workforce, an additional 392 EMTs would be needed to meet the national benchmark in all counties.
Since 2016, net decreases in the EMT workforce have been observed in 11 counties. Two counties have remained stable, and 20 have increased. The most substantial decrease was observed in Sandoval County, which showed a net loss of 104 EMTs, while the largest increases occurred in Bernalillo, Santa Fe and Los Alamos counties (gains since 2016 of 243, 93 and 74, respectively).
EMTs continued to show a bimodal distribution relative to benchmark, with 16 counties falling more than 10 EMTs above benchmark and seven falling more than 20 below benchmark. In addition, this third year of survey data for EMTs confirmed prior years’ observations of notable volatility in county-level workforce. Since 2017, three counties (Bernalillo, Los Alamos and Santa Fe) have shown gains of more than 20 EMTs, and one county (Sandoval) has shown a loss greater than 20 EMTs.
As discussed in the 2018 annual report,6 it is important to remember that across all of the professions analyzed, the practitioner counts are based upon active licenses to match the national benchmarks used; the proportion of these individuals’ time spent on health care activities is not examined. With respect to EMTs, it is thought that many maintain certification to practice on a volunteer rather than full-time professional basis. Alternatively, it may be that more EMTs are needed in New Mexico than in the average state. With our scant and maldistributed workforce for many other health professions, these
66 New Mexico Health Care Workforce Committee Report, 2019
individuals may serve a larger role in New Mexico communities than in states better-supplied with health workforce. In future years, we will explore this phenomenon in greater depth.
New Mexico Health Care Workforce Committee Report, 2019 67
III.D. Status of Survey Transitions III.D.1. Pharmacists In 2017, the Board of Pharmacy restructured their survey data collection in order to remedy the committee’s earlier inability to merge licensure and survey data for a complete snapshot of these health care providers. Prior to that time, all analysis of pharmacists by the committee used licensure mailing addresses, as it was not possible to match the anonymous surveys with individual licensees. Now that surveyed practice addresses are beginning to be available, we anticipate that the distribution of the state’s pharmacists by counties will change appreciably as the mailing addresses of un-surveyed individuals are replaced with practice addresses for a more accurate understanding of the pharmacists serving communities statewide. To date, only 20.3% of the state’s registered pharmacists have completed surveys under the enhanced methodology. We plan to resume our analysis of pharmacists once a majority have been surveyed under the new system.
III.D.2. The Primary Care Workforce Physicians, certified nurse practitioners and physician assistants all contribute greatly to New Mexico’s primary care workforce. To analyze this sector of the health care workforce, in past years the committee has examined primary care advanced practice registered nurses and an estimated 40 percent of PAs practicing in primary care alongside primary care physicians.
The Board of Nursing has recently updated the options nurses can select from in identifying their area of practice. Similarly, specialty data for physician assistants began to be collected in 2017. These changes will allow more accurate identification of the members of these professions who provide primary care. At this time, however, these new responses have been collected from a relatively small proportion of these practitioners. As for pharmacists, we plan to resume our analysis of primary care physicians, advanced practice registered nurses and physician assistants once a majority of the latter two professions have been surveyed under the enhanced methodology.

68 New Mexico Health Care Workforce Committee Report, 2019
New Mexico Health Care Workforce Committee Report, 2019 69
III.E. Discussion of the Women’s Health and Birth Attendant Workforce Since the 2017 report, we have analyzed not only obstetrics and gynecology physicians (OB-GYNs), but also certified nurse-midwives (CNMs) and licensed midwives (LMs). All three types of provider contribute substantially to women’s health in New Mexico.
OB-GYNs are physicians specially trained to treat obstetric (pregnancy- and birth-related) and/or gynecological (related to the female reproductive system) health issues. OB-GYNs provide prenatal care and attend births at hospitals for both normal and high-risk pregnancies, perform caesarean deliveries if the need arises, and provide the full spectrum of women’s health care.
Certified nurse-midwives have undergone training in both nursing and midwifery; they are educated at a master’s degree level in both nursing and midwifery and certified by the American College of Nurse Midwives. The care CNMs provide includes prenatal care and birth attendance in hospitals, birthing centers and homes, as well as routine well-woman care and treatment for minor gynecological conditions.
Licensed midwives are sometimes called direct-entry midwives. Direct-entry midwives may be trained through self-study, apprenticeship or a school of midwifery. New Mexico is one of 27 states that license direct-entry midwives. In New Mexico, all LMs are required to be certified professional midwives – a certification overseen by the North American Registry of Midwives. This certification requires training and education (through apprenticeship or an accredited program such as the National College of Midwifery in Taos), supervised clinical experience and a written exam. LMs provide prenatal care and birth attendance in homes and birthing centers. They may not prescribe medications, but they do have limited authority to administer them.
New Mexico has the highest proportion of midwife-attended births in the United States. CNMs attend 8% of births in the nation as a whole, while in New Mexico, 26% of births are attended by CNMs.30 This is thought to be due to the autonomy of practice allowed CNMs in the state, the official recognition and licensure of direct-entry midwives (LMs) and our history as a frontier state.
In addition to the above practitioners, it is important to note that physicians specializing in family medicine may also provide obstetric and gynecological care to New Mexico’s women. These providers are included among the primary care physicians discussed in Section III.B.1; we have not included them here due to the difficulty of quantifying their relative contributions to primary care (for both children and adults) and obstetrics and gynecology.
In this section, there is analysis of all three types of providers exclusively practicing in women’s health and birth attendance. OB-GYNs are discussed in Section III.B.2, CNMs in Section III.C.2, and LMs in Section III.C.3. Here, we discuss what the distribution of all three provider types indicates for the health care of New Mexican women.
Table 3.20 shows the counts of all three types of women’s health providers and birth attendants by county. Notable is the absence of all three types of providers from 10 counties: Catron, De Baca, Guadalupe, Harding, Hidalgo, Mora, Quay, Roosevelt, Torrance and Union. That is, 30.3 percent of New Mexico counties have no women’s health specialists at all. These counties have changed slightly since 2017, as Hidalgo has lost its single OB-GYN.

70 New Mexico Health Care Workforce Committee Report, 2019
Table 3.20. Women’s Health Providers and Birth Attendants by County County OB-GYN
Physicians CNMs LMs TOTAL Net Change Since 2017
Bernalillo 154 101 10 265 0 Catron 0 0 0 0 0 Chaves 6 3 0 9 -1 Cibola 3 1 0 4 -1 Colfax 3 0 0 3 -1 Curry 8 3 0 11 2 De Baca 0 0 0 0 0 Doña Ana 22 14 5 41 -1 Eddy 6 1 0 7 -1 Grant 3 4 1 8 0 Guadalupe 0 0 0 0 0 Harding 0 0 0 0 0 Hidalgo 0 0 0 0 -1 Lea 10 0 0 10 0 Lincoln 3 0 0 3 1 Los Alamos 5 2 0 7 1 Luna 2 0 0 2 0 McKinley 3 7 0 10 -4 Mora 0 0 0 0 0 Otero 6 1 1 8 0 Quay 0 0 0 0 0 Rio Arriba 5 3 3 11 2 Roosevelt 0 0 0 0 0 San Juan 8 11 0 19 3 San Miguel 1 1 3 5 -3 Sandoval 10 2 4 16 -1 Santa Fe 15 11 8 34 -3 Sierra 0 0 1 1 0 Socorro 4 0 0 4 0 Taos 2 3 3 8 -6 Torrance 0 0 0 0 0 Union 0 0 0 0 0 Valencia 0 1 1 2 0
STATE TOTAL 279 169 40 488 -14
In 2018, OB-GYNs were the sole obstetric practitioners in five counties and an LM in one. Previous research has found that of the three types of provider, CNMs were least likely to practice in rural counties: in 2016, 18 percent of CNMs practiced in rural counties, compared with 28 percent of OB-GYNs and 35 percent of LMs.31

New Mexico Health Care Workforce Committee Report, 2019 71
Following the 2018 reopening of maternity services at San Miguel county’s Alta Vista Regional Hospital, 11 counties had no hospital maternity services in 2018. Eight counties lack surgical facilities in which to perform caesarean deliveries. It is a great boon to the state that the inpatient maternity service has reopened in San Miguel County, as it is the only such service in the entire northeast quadrant of the state.
The needs of rural hospitals to balance costly facilities and services with their relatively low demand due to low population density make it challenging to maintain maternity services, and some degree of regionalization of care is perhaps unavoidable due to these economic pressures. Nonetheless, it will be important to explore ways to ease access to maternity and particularly prenatal care for women in these underserved counties.

72 New Mexico Health Care Workforce Committee Report, 2019
New Mexico Health Care Workforce Committee Report, 2019 73
III.F. Demographics of Selected Health Professionals III.F.1. Executive Summary The demographic data collection required under the Work Force Data Collection, Analysis and Policy Act is a tremendous resource for workforce analysis and planning. In this section, we present for New Mexico’s physicians (MDs and DOs), PAs, RNs and CNPs/CNSs three demographic categories important for state workforce planning efforts: gender, race/ethnicity and age.
In each table, the total practitioner counts indicate the number of practitioners who completed a survey and/or completed the relevant survey item; as a result, these counts may differ from the counts presented earlier in Sections II and III. In comparison to New Mexico’s population,32 the physician workforce is more likely to be male, non-Hispanic, and Asian or (to a lesser extent) Black. While New Mexico’s physicians continue to be older than the national average, their median age (53.3) has remained stable since 2017.
In contrast, New Mexico’s PAs and nurses are more likely than the state’s population as a whole to be female; they are also more likely than the state’s population to be non-Hispanic and Asian or (for PAs) white. As is to be expected based on the length of training required, PAs, RNs and CNPs/CNSs are all younger than the state’s physicians: the median age for PAs is 43.6, for RNs 46.6 and for CNPs/CNSs 50.6.

74 New Mexico Health Care Workforce Committee Report, 2019
III.F.2. Gender Across all specialties, 35.9% of New Mexico’s physicians were female and 64.1% male in 2018 (Table 3.21). These proportions do not reflect the state’s population as a whole, but compare favorably to the national median of 33.8% female and 66.2% male.33 Female physicians make up 43.9% of PCPs, 60% of OB-GYNs and 39.4% of psychiatrists, but only 21.7% of general surgeons. The gender distribution of New Mexico’s physicians continues to remain stable: in 2012, MDs were 35.1% female and 64.8% male.1
Table 3.21. Gender of Surveyed New Mexico Physicians
Gender NM
Pop.32 All MDs and
DOs Primary Care OB-GYN General Surgeons Psychiatrists
% Count % Count % Count % Count % Count % Female 50.5% 1,623 35.9% 716 43.9% 150 60.0% 35 21.7% 109 39.4% Male 49.5% 2,892 64.1% 914 56.1% 100 40.0% 126 67.0% 168 60.6%
TOTAL 4,515 1,630 250 161 277
Table 3.22 shows the gender proportions of New Mexico’s PAs, RNs and CNPs/CNSs. Unlike physicians, these practitioners are more commonly female, with 62% of state PAs, 88% of RNs, and 86.4% of CNPs/CNSs reporting female gender.
Table 3.22. Gender of Surveyed New Mexico CNPs/CNSs and PAs
Gender NM
Pop.32 PAs RNs CNPs/CNSs
% Count % Count % Count % Female 50.5% 416 62.0% 15,417 88.0% 1,333 86.4% Male 49.5% 255 38.0% 2,109 12.0% 209 13.6%
TOTAL 1,542 671

New Mexico Health Care Workforce Committee Report, 2019 75
III.F.3. Race and Ethnicity Diversity of the health care workforce directly affects patient access to care, and is important for meeting the health care needs of New Mexico’s racially and ethnically diverse population, especially in rural and underserved communities.
Table 3.23 shows the racial diversity of New Mexico’s physicians, PAs, RNs and CNPs/CNSs compared to the state’s population as a whole. Compared to the state’s population, physicians practicing in-state are less likely to be American Indian or Alaska Native, two or more races or other races. New Mexico’s physicians are more likely than the state population as a whole to be Asian or Pacific Islander or Black or African American, and nearly equally likely to be white.
Among PAs, RNs and CNPs/CNSs, individuals reporting a race of American Indian or Alaskan Native were underrepresented and Asian or Pacific Islander individuals were slightly overrepresented. PAs were more likely than the state as a whole to report being white.
Table 3.24 shows the self-reported ethnicity of New Mexico’s physicians, PAs, RNs and CNPs/CNSs compared to the state’s population as a whole. Hispanic individuals were underrepresented across all three professions relative to the state’s population. With the exception of RNs, fewer than one in four of these health professionals self-classified as Hispanic, compared to nearly one in two in the New Mexico population. Among RNs, 30.6% identified as Hispanic.
Table 3.23. Race of Surveyed New Mexico Physicians, PAs and Nurses Compared to New Mexico’s Population
Total Counta
American Indian or Alaska Native
Asian or Pacific
Islander
Black or African
American White Other Two or
Moreb Hispanicb
NM Population32 2,084,828 197,191
(9.5%) 31,381 (1.5%)
42,187 (2.0%)
1,547,843 (74.2%)
197,944 (9.5%)
68,282 (3.3%)
See Table 3.25
All Physicians 4,436 39
(0.9%) 479
(10.8%) 128
(2.9%) 3,319
(74.8%) 358
(8.1%) 113
(2.5%)
Primary Care Physicians 1,588 22
(1.4%) 193
(12.2%) 49
(3.1%) 1,104
(69.5%) 172
(10.8%) 48
(3.0%)
OB-GYN 248 4 (1.6%)
25 (10.1%)
13 (5.2%)
188 (75.8%)
15 (6.0%)
3 (1.2%)
General Surgeons 168 1
(0.6%) 28
(16.7%) 5
(3.0%) 116
(69.0%) 14
(8.3%) 4
(2.4%)
PAs 499 19 (3.8%)
17 (3.4%)
11 (2.2%)
411 (82.4%)
25 (5.0%)
16 (3.2%)
RNsb 15,205 728 (4.8%)
675 (4.4%)
341 (2.2%)
8,401 (55.3%)
413 (2.7%)
c 4,647 (30.6%)
CNPs/CNSsb 1,437 24 (1.7%)
37 (2.6%)
28 (1.9%)
986 (68.6%)
99 (6.9%)
c 263a (18.3%)
a For the rows pertaining to New Mexico’s health care workforce, the total count represents those who answered the survey item pertaining to race.
b The nursing survey options for race and ethnicity are as follows: African American/Black, American Indian/Alaska Native, Asian/Pacific Islander, Caucasian/White, Other and Hispanic. There is no “Two or More” option.

76 New Mexico Health Care Workforce Committee Report, 2019
Table 3.24. Ethnicity of Surveyed New Mexico Physicians, PAs and Nurses Compared to New Mexico’s Population
Total Counta Hispanic or Latino
NM Population32 2,084,828 1,004,103 (48.2%)
All Physicians 3,839 653 (17.0%)
Primary Care 1,421 324 (22.8%)
OB-GYN 217 32 (14.7%)
General Surgeons 148 28
(18.9%)
Psychiatrists 237 41 (17.3%)
PAs 420 83 (19.8%)
RNs 15,205 4,647 (30.6%)
CNPs/CNSs 1,314 280 (21.3%)
a For the rows pertaining to New Mexico’s health care workforce, the total count represents those who answered the survey item pertaining to ethnicity.

New Mexico Health Care Workforce Committee Report, 2019 77
III.F.4. Age The age distribution of New Mexico physicians is shown in Table 3.25. The median age of New Mexico physicians was 53.3 in 2018. This is the youngest median age since 2012, due largely to the adjustments made to the PCP workforce discussed in III.B.1, but remains comparable to the median ages in 2017 (53.8), 2016 (53.5), 2015 (53.6) and 2012 (53.4). The state’s average physician is over one year older than the average for the nation as a whole: New Mexico physicians averaged 53.6 years of age, while the national average is 52.3.34 Nationally, New Mexico also continues to have the highest percentage of physicians aged 60 or older as reported by the Association of American Medical Colleges (37.0%, compared to 30.3% nationally).33 The percentage of physicians over 60 practicing in the state is slightly lower (34.6%), but still above the national proportion.
Table 3.25. Age of Surveyed New Mexico Physicians
Age All Physicians Primary Care OB-GYN General
Surgeons Psychiatrists
Count Percent Count Percent Count Percent Count Percent Count Percent <25 0 0.0% 0 0.0% 0 0.0% 0 0.0% 0 0.0% 25-34 387 7.3% 148 7.8% 15 5.4% 6 3.2% 6 1.9% 35-44 1,291 24.4% 476 25.0% 81 29.0% 47 25.0% 47 14.8% 45-54 1,140 21.5% 415 21.8% 53 19.0% 46 24.5% 65 20.5% 55-64 1,266 23.9% 464 24.4% 61 21.9% 41 21.8% 97 30.6% 65+ 1,190 22.5% 399 20.9% 68 24.4% 46 24.5% 101 31.9% Unknown 17 0.3% 3 0.2% 1 0.4% 2 1.1% 1 0.3% TOTAL 5,291 1,902 279 188 317 Median Age Avg. Age
53.3 53.6
52.9 53.1
52.8 53.6
54.3 54.2
59.0 58.4
The age distribution of the state’s PAs, RNs and CNPs/CNSs is shown in Table 3.26. New Mexico’s PAs are substantially younger than the state’s physicians, with a median age of 43.6. RNs tend to be older than PAs, with a median age of 46.6 years. CNPs/CNSs have gotten younger relative to physicians: in 2017, their median age was 52.3, while for 2018, the median was 50.6.
Table 3.26. Age of Surveyed New Mexico PAs and Nurses
Age PAs RNs CNPs/CNSs
Count Percent Count Percent Count Percent <25 0 0.0% 346 2.0% 1 0.1% 25-34 218 27.1% 3578 20.4% 183 11.9% 35-44 203 25.2% 4215 24.0% 381 24.7% 45-54 153 19.0% 3531 20.1% 373 24.2% 55-64 165 20.5% 3978 22.7% 405 26.3% 65+ 50 6.2% 1878 10.7% 199 12.9% Unknown 16 2.0% 0 0.0% 0 0.0% TOTAL 805 17,526 1,542 Median Age Avg. Age
43.6 45.3
46.6 47.4
50.6 50.4

78 New Mexico Health Care Workforce Committee Report, 2019
III.G. Discussion Health workforce planning requires efforts to ensure that the right professionals – and combination of professionals for effective teams – are available when and where they are needed to meet a population’s health care needs.
We have been pleased this year to be able to update 11 of the 12 professions included in the 2018 report, as well as to restore the focus section on behavioral health (Section IV) and to add nuance to our analysis of PCPs by adjusting for non-practicing individuals. We look forward to resuming our analysis of pharmacists and primary care PAs and CNPs/CNSs in the coming years. In addition, we will continue to add professions and to expand our more detailed analyses – as for primary care physicians and the women’s health workforce in recent years – and develop recommendations for training, recruitment and statewide innovations.
Knowing the number of health professionals and where they are practicing is only the first step – though a very important one – in being able to plan for current and future health care workforce needs. The national averages and standard ratios that we are using as benchmarks are meant to be tools for comparison and for representing the distribution of professionals across the state. The analyses based on these metrics do not represent access to care, i.e., whether New Mexico’s residents are able to consult health professionals where and when the need arises.
With respect to factors beyond the health care workforce affecting access to care, the committee learned with interest of the statewide transportation system for rural veterans developed under 2019 HM32. We look forward to its implementation, as well as future exploration of expanding this program to all rural residents. Doing so could improve access to secondary and tertiary health care among residents of these underserved areas.
Many factors influence access to care and the capacity of the workforce to meet the population’s needs. People living in an area with practitioner-to-population ratios above benchmark values may nevertheless lack access to care for a number of reasons. They might be unable to afford care, for example. Even with affordable health care, they might find that it takes a month or more to get an appointment with a new primary care physician or to see a specialist. Health system issues – including the time needed for preauthorization, billing and other scheduling matters – also greatly affect sufficiency in all areas of the state.
The benchmarks themselves are also inadequate for examining the dynamic nature of the health care workforce under national health care reform and new team-based care models. These new variables underscore the need to know not just the number of professionals, but also what capabilities exist in the workforce and the interconnections between professional roles and potential reconfigurations to enhance quality and capacity.
The report serves as a snapshot of how many health care professionals are practicing in New Mexico and where they are concentrated or lacking – and as a launching point for asking more specific questions about the state’s health care workforce and what actions should be taken to enhance access to care for all residents.

New Mexico Health Care Workforce Committee Report, 2019 79
Section IV
New Mexico’s Behavioral Health Workforce
IV.A. Introduction The data from the licensure survey allows us to answer specific questions for the following categories of behavioral health providers:
1. Prescribers: Includes all psychiatrists as defined in Section I.B, certified nurse practitioners or clinical nurse specialists with a practice area of behavioral health, and prescribing psychologists.
2. Independently Licensed Clinicians: Practitioners who provide therapy and psychosocial interventions for both mental illness and addictions treatment, including non-prescribing psychologists, social workers, counselors and marriage and family therapists.
3. Non-Independently Licensed Clinicians: Practitioners who have a limited scope of practice to treat mental illness and addictions treatment, including psychology associates, non-independently licensed social workers and non-independently licensed counselors.
4. Substance Use Clinicians: Practitioners who provide psychosocial interventions to treat addictions, including licensed alcohol and drugs counselors and licensed substance abuse associates. This category includes dedicated substance use clinicians and does not overlap with the other categories, regardless of independent licensure. Unlike other clinicians in the behavioral health workforce, their scope of practice does not include treatment of mental illness.
IV.B. Methodology This section presents all data for behavioral health care providers actively licensed and practicing in New Mexico during the 2018 calendar year. The same data sources and methodology was used to identify behavioral health providers as for those providers described in Section I. As discussed in Section I, using licensure data alone to determine practice location would result in over-counting providers because professionals often use a residential address to obtain licensure rather than a practice address. Counts were determined using the practice address of surveyed providers and the mailing address of un-surveyed providers. Providers with out-of-state and unknown zip codes for practice location are excluded from the counts. In 2018, 9,431 behavioral health providers with an active license were practicing in New Mexico.
Surveys are administered by the provider’s licensing board upon license renewal only. Several of the tables presented below were derived from survey data including race/ethnicity and gender. Therefore, the total providers included in these tables are lower than the total licensed in the state. In each case, only providers who responded to the survey question are included in the tables. Appendix D.1 provides detailed information about the proportion of providers who were surveyed in 2018.

80 New Mexico Health Care Workforce Committee Report, 2019
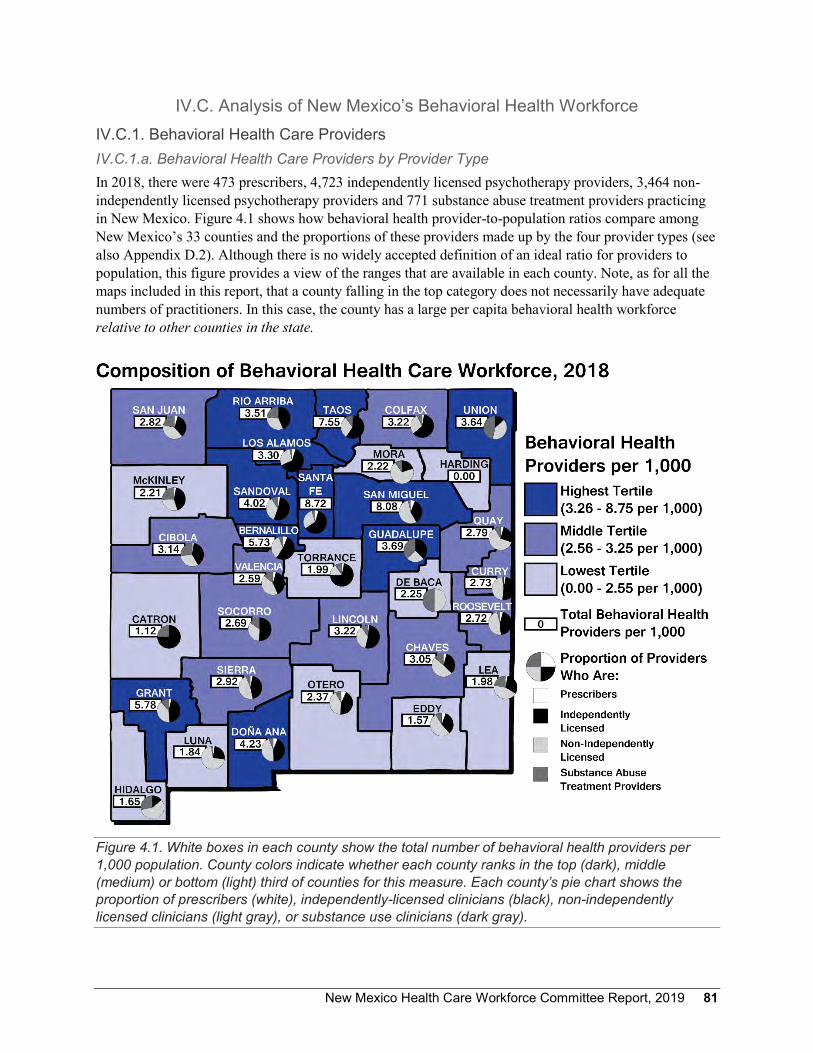
New Mexico Health Care Workforce Committee Report, 2019 81
IV.C. Analysis of New Mexico’s Behavioral Health Workforce IV.C.1. Behavioral Health Care Providers IV.C.1.a. Behavioral Health Care Providers by Provider Type In 2018, there were 473 prescribers, 4,723 independently licensed psychotherapy providers, 3,464 non-independently licensed psychotherapy providers and 771 substance abuse treatment providers practicing in New Mexico. Figure 4.1 shows how behavioral health provider-to-population ratios compare among New Mexico’s 33 counties and the proportions of these providers made up by the four provider types (see also Appendix D.2). Although there is no widely accepted definition of an ideal ratio for providers to population, this figure provides a view of the ranges that are available in each county. Note, as for all the maps included in this report, that a county falling in the top category does not necessarily have adequate numbers of practitioners. In this case, the county has a large per capita behavioral health workforce relative to other counties in the state.
Figure 4.1. White boxes in each county show the total number of behavioral health providers per 1,000 population. County colors indicate whether each county ranks in the top (dark), middle (medium) or bottom (light) third of counties for this measure. Each county’s pie chart shows the proportion of prescribers (white), independently-licensed clinicians (black), non-independently licensed clinicians (light gray), or substance use clinicians (dark gray).

82 New Mexico Health Care Workforce Committee Report, 2019
Table 4.1 shows the number of behavioral health clinicians in each category by county in 2018. Of note, eight counties do not have any access to behavioral health prescribers and two counties do not have any access to independently licensed clinicians. Appendix D.3 breaks the disciplines into smaller categories by license type and includes information about access to child psychiatry. There are no child psychiatrists in 28 out of 33 New Mexico counties.
Table 4.1. Behavioral Health Care Providers by License Category
County Prescribersa Independently
Licensed Psychotherapy
Providers
Non-Independently
Licensed Psychotherapy
Providers
Substance Use
Treatment Providers
County Total
Bernalillo 233 2,085 1,346 228 3,892 Catron 0 3 0 1 4 Chaves 9 65 96 27 197 Cibola 2 33 27 22 84 Colfax 1 24 11 3 39 Curry 4 66 62 3 135 De Baca 0 0 2 2 4 Doña Ana 57 398 412 54 921 Eddy 5 30 48 8 91 Grant 6 71 63 18 158 Guadalupe 0 6 4 6 16 Harding 0 0 0 0 0 Hidalgo 0 1 4 2 7 Lea 4 43 60 31 138 Lincoln 1 33 23 6 63 Los Alamos 3 40 18 2 63 Luna 1 11 31 1 44 McKinley 5 67 47 41 160 Mora 0 2 7 1 10 Otero 11 70 64 13 158 Quay 1 6 14 2 23 Rio Arriba 1 59 45 32 137 Roosevelt 2 23 24 2 51 San Juan 16 120 140 76 352 San Miguel 14 79 123 7 223 Sandoval 19 306 207 52 584 Santa Fe 65 799 385 59 1,308 Sierra 1 14 15 2 32 Socorro 0 23 15 7 45 Taos 3 144 75 26 248 Torrance 1 22 5 3 31 Union 0 2 6 7 15 Valencia 8 78 85 27 198 STATE TOTAL 473 4,723 3,464 771 9,431
a This column includes 306 Medical Doctors and 11 Doctors of Osteopathy.

New Mexico Health Care Workforce Committee Report, 2019 83
IV.C.1.b. Independently and Non-Independently Licensed Behavioral Health Care Providers As non-independently licensed counselors and social workers progress toward full independent licensure, they must meet regularly with an independently licensed clinician for supervision. Figure 4.2 shows the proportions of independently and non-independently licensed clinicians in each county (see also Appendix D.4). This information is helpful for developing sustainable pathways to full licensure for all clinicians. In communities with high proportions of non-independently licensed clinicians, it will be important to create structures for access to clinical supervision with independently licensed clinicians. Some rural New Mexico counties have especially high proportions of non-independently licensed clinicians, which reflects the relative scarcity of independently licensed behavioral health clinicians in these communities.
Figure 4.2. The white box for each county shows the percent of clinicians with independent licensure; colors indicate whether each county ranks in the top (dark), middle (medium) or bottom (light) third for this value. Harding County, which has no behavioral health providers, is colored gray. Pie charts show proportions of independently (black) or non-independently (gray) licensed clinicians.

84 New Mexico Health Care Workforce Committee Report, 2019
In order to strengthen our workforce, it will be helpful to expand efforts to provide clinical supervision via telehealth with a particular focus on counties that have a higher proportion of non-independently licensed behavioral health providers compared to independently licensed clinicians. Chaves, De Baca, Doña Ana, Eddy, Hidalgo, Lea, Luna, Mora, Quay, Roosevelt, Sandoval, San Juan, Sierra, Union and Valencia counties have fewer independently licensed behavioral health providers than non-independently licensed clinicians. This pattern suggests that non-independently licensed behavioral health clinicians in these counties may have difficulty obtaining the necessary supervision to reach independent licensure.
IV.C.2. Demographics of Behavioral Health Care Providers IV.C.2.a. Gender Table 4.2 provides the gender demographics of the behavioral health workforce and shows that the majority of clinicians are female, in all license categories.
Table 4.2. Gender of New Mexico Behavioral Health Care Providers Compared to New Mexico’s Population
Gender NM
Pop.32 Prescribers Independently
Licensed Psychotherapy
Providers
Non-Independently
Licensed Psychotherapy
Providers
Substance Use Treatment Providers
% Count % Count % Count % Count % Female 50.5% 222 51.9% 3,218 77.2% 2,049 83.9% 455 65.6% Male 49.5% 206 48.1% 949 22.8% 394 16.1% 239 34.4%
TOTAL 428 4,167 2,443 694
IV.C.2.b. Race and Ethnicity Tables 4.3, 4.4 and 4.5 provide information about the race and ethnicity of the 2,897 behavioral health care providers who were surveyed and answered the questions about race and ethnicity. Table 4.3 shows race data for all behavioral health care providers except for nurse practitioners and nurse specialists, because the race and ethnicity questions on the nurse licensing renewal survey included different categories. Table 4.4 shows their ethnicity. Table 4.5 describes the race and ethnicity of the 98 nurse practitioners and nurse specialists who were surveyed. Unfortunately, the behavioral health care workforce is less diverse than the population of the state.
To address health disparities and to provide culturally and linguistically competent care, it will continue to be important to actively recruit and retain healthcare professionals from diverse backgrounds. Of note, nearly 50% of non-independently licensed psychotherapy providers are of Hispanic ethnicity, compared to 23% of independently licensed psychotherapy providers. As discussed above, non-independently licensed clinicians require supervision from practitioners with independent licenses. As New Mexico continues efforts to diversify its workforce and to provide strong mentorship and support to new clinicians, it will be important to increase the pool of potential supervisors from diverse backgrounds.
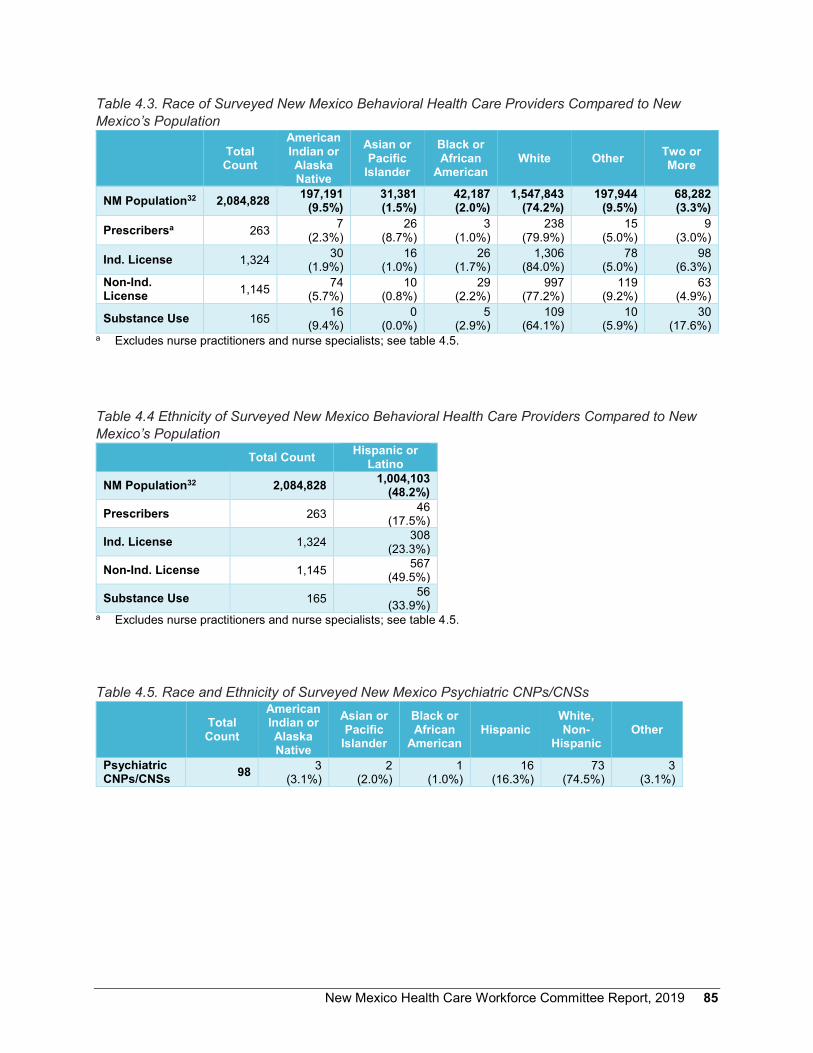
New Mexico Health Care Workforce Committee Report, 2019 85
Table 4.3. Race of Surveyed New Mexico Behavioral Health Care Providers Compared to New Mexico’s Population
Total Count
American Indian or Alaska Native
Asian or Pacific
Islander
Black or African
American White Other Two or
More
NM Population32 2,084,828 197,191 (9.5%)
31,381 (1.5%)
42,187 (2.0%)
1,547,843 (74.2%)
197,944 (9.5%)
68,282 (3.3%)
Prescribersa 263 7 (2.3%)
26 (8.7%)
3 (1.0%)
238 (79.9%)
15 (5.0%)
9 (3.0%)
Ind. License 1,324 30 (1.9%)
16 (1.0%)
26 (1.7%)
1,306 (84.0%)
78 (5.0%)
98 (6.3%)
Non-Ind. License 1,145 74
(5.7%) 10
(0.8%) 29
(2.2%) 997
(77.2%) 119
(9.2%) 63
(4.9%)
Substance Use 165 16 (9.4%)
0 (0.0%)
5 (2.9%)
109 (64.1%)
10 (5.9%)
30 (17.6%)
a Excludes nurse practitioners and nurse specialists; see table 4.5.
Table 4.4 Ethnicity of Surveyed New Mexico Behavioral Health Care Providers Compared to New Mexico’s Population
Total Count Hispanic or Latino
NM Population32 2,084,828 1,004,103 (48.2%)
Prescribers 263 46 (17.5%)
Ind. License 1,324 308 (23.3%)
Non-Ind. License 1,145 567 (49.5%)
Substance Use 165 56 (33.9%)
a Excludes nurse practitioners and nurse specialists; see table 4.5.
Table 4.5. Race and Ethnicity of Surveyed New Mexico Psychiatric CNPs/CNSs
Total Count
American Indian or Alaska Native
Asian or Pacific
Islander
Black or African
American Hispanic
White, Non-
Hispanic Other
Psychiatric CNPs/CNSs 98 3
(3.1%) 2
(2.0%) 1
(1.0%) 16
(16.3%) 73
(74.5%) 3
(3.1%)
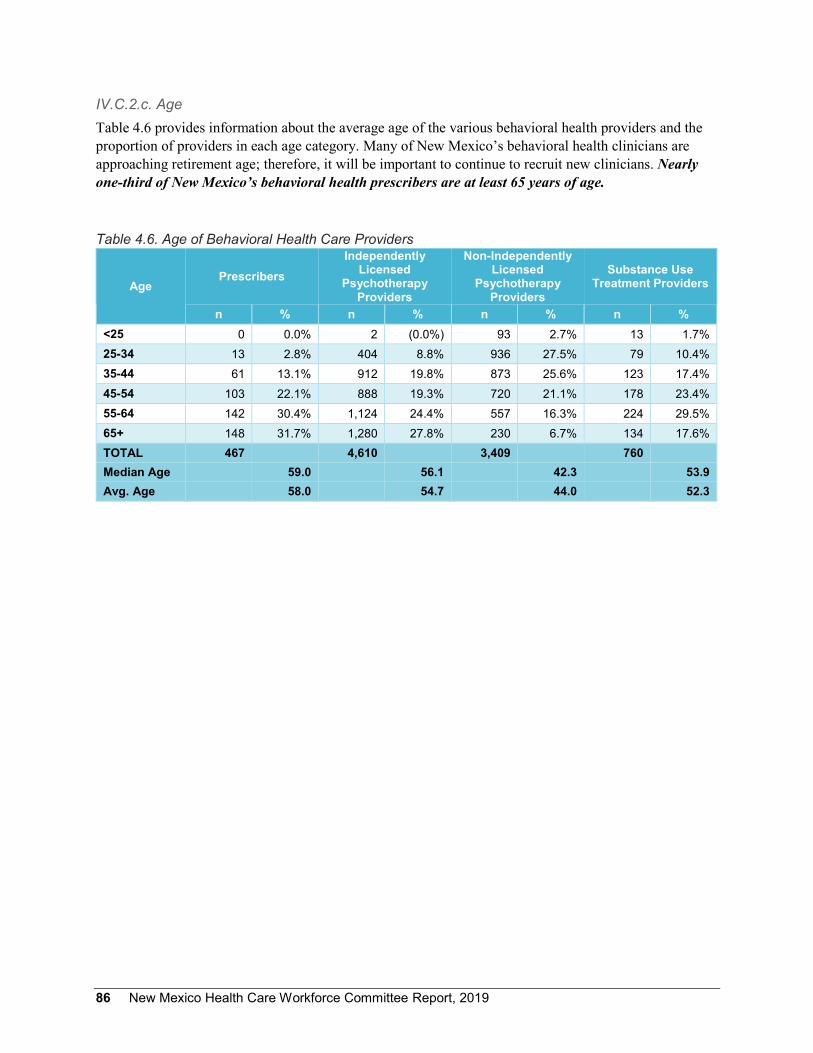
86 New Mexico Health Care Workforce Committee Report, 2019
IV.C.2.c. Age Table 4.6 provides information about the average age of the various behavioral health providers and the proportion of providers in each age category. Many of New Mexico’s behavioral health clinicians are approaching retirement age; therefore, it will be important to continue to recruit new clinicians. Nearly one-third of New Mexico’s behavioral health prescribers are at least 65 years of age.
Table 4.6. Age of Behavioral Health Care Providers
Age Prescribers
Independently Licensed
Psychotherapy Providers
Non-Independently Licensed
Psychotherapy Providers
Substance Use Treatment Providers
n % n % n % n % <25 0 0.0% 2 (0.0%) 93 2.7% 13 1.7% 25-34 13 2.8% 404 8.8% 936 27.5% 79 10.4% 35-44 61 13.1% 912 19.8% 873 25.6% 123 17.4% 45-54 103 22.1% 888 19.3% 720 21.1% 178 23.4% 55-64 142 30.4% 1,124 24.4% 557 16.3% 224 29.5% 65+ 148 31.7% 1,280 27.8% 230 6.7% 134 17.6% TOTAL 467 4,610 3,409 760 Median Age 59.0 56.1 42.3 53.9 Avg. Age 58.0 54.7 44.0 52.3

New Mexico Health Care Workforce Committee Report, 2019 87
Section V
Update on Previous Recommendations of the New Mexico Health Care Workforce Committee
V.A. Introduction Beginning with its 2014 report, the New Mexico Health Care Workforce Committee has proposed solutions to the issues highlighted in its annual analysis of the state’s health care providers. These have included both items actionable by the Legislature and more general recommendations for communities and health professional training programs. Here, we review prior years’ recommendations and their status.
V.B. Status of 2014 Recommendations V.B.1. 2014 Education and Training Recommendations Rec. 2014.1 Health professions training programs should be enhanced, including strong support for the University of New Mexico (UNM) School of Medicine, advanced practice registered nurse programs at UNM and New Mexico State University, New Mexico Nursing Education Consortium programs to increase the BSN-prepared workforce, and development of a BA/DDS program similar to UNM’s BA/MD program. As the state invests in these programs, the New Mexico Health Care Workforce Committee will need expanded tracking to analyze how many graduates practice in New Mexico.
ACTION: Supplemental appropriations to institutions for nursing program expansion increased from $1.81 million in FY 2014 to $8.39 million in FY 2016, with a decrease to $7.70 million in FY 2018. The Legislative Finance Committee reported that the number of nursing degrees awarded has increased from 932 in 2011 to 1,062 in 2014. It notes that “additional evaluation work is needed … to fully assess whether investments in expanding nurse education is working as intended.”35
The first graduates from UNM HSC’s expanded pediatric nurse practitioner, family nurse practitioner and certified nurse-midwife programs joined the workforce in 2017. Their entry into the workforce will provide an opportunity to analyze the impact of training program expansion on the state’s need for advanced practice registered nurses.
Rec. 2014.2 The state should fully support Graduate Medical Education (GME) by continuing funding for nine current GME positions and explore options for increasing the number of funded positions, particularly for practice in rural areas and underserved areas. This would entail developing additional primary care training locations throughout New Mexico.
ACTION: The Legislature fully funded nine residency slots each year in FY 2015 and FY 2016, with an emphasis on internal medicine, family medicine, general surgery and psychiatry. For these 18 slots, $1.65 million was appropriated to UNM HSC in FY 2018. Additional slots were not funded in either FY 2017 or FY 2018.

88 New Mexico Health Care Workforce Committee Report, 2019
The Legislature also appropriated $399,500 in FY 2015 and FY 2016 to support primary care residencies at Hidalgo Medical Services, a Federally Qualified Health Center in southwestern New Mexico.
The 2014 Legislature also advanced the creation of primary care residency slots by leveraging state Medicaid funds.36 This program is still in development; if successful, primary care residency development under this program could be supported through the base Medicaid funding budget for residency slots at Federally Qualified Health Centers in New Mexico primary care shortage areas.
Rec. 2014.3 The Community Health Worker certificate should be fully implemented.
ACTION: We have reiterated this recommendation (Rec. 2016.17).
V.B.2. 2014 Financial Incentives for Addressing Shortages Rec. 2014.4 Financial incentives for recruiting health care professionals should be maintained and expanded on the basis of their demonstrated efficacy. The New Mexico Health Care Workforce committee should be funded in order to collect data, conduct analyses and develop appropriate outcome measures of these programs.
ACTION: In 2015, the LFC reported several state investments in health care workforce financial aid.35 The Legislature appropriated $3.9 million for loan-for-service or loan repayment programs in FY 2016, an increase over FY 2014 levels. This included $200,000 to compensate for funds previously received from a U.S. Department of Health and Human Services matching grant that was not renewed for FY 2014 – 2015. However, we commend the state for its successful efforts to secure this grant again for FY 2019. The amount allocated to loan-for-service or loan repayment programs in FY 2018 has been reduced to $2.9 million.
In addition, the state expanded funding for Western Interstate Commission for Higher Education positions, which allow students from New Mexico to pay in-state tuition at affiliated dental and veterinary schools in exchange for three years of service in New Mexico. Funding was expanded from $1.15 million in FY 2015 to $2.27 million in FY 2016, but as of FY 2018 stands at $750,000.
Rec. 2014.5 The state tax incentive program should be evaluated for its impact on recruiting and retaining New Mexico’s rural health care workforce.
ACTION: We have reiterated this recommendation (Rec. 2015.13).
V.B.3. 2014 Recruitment for Retention in New Mexico Communities Rec. 2014.6 Recruitment efforts should address social and environmental barriers to successful recruitment.
New Mexico Health Care Workforce Committee Report, 2019 89
ACTION: The non-profit New Mexico Health Resources has continued to support recruitment of health professionals to underserved areas. In 2015 – 2016, this organization placed 62 health professionals and 30 physicians with Conrad J-1 Visa Waivers in the state.
Rec. 2014.7 Explore strategies to help manage workloads for health care practitioners and create professional support networks, particularly in health professional shortage areas.
ACTION: Several successful New Mexico programs that foster health professions career development in rural areas – including Hidalgo Medical Services, UNM Locum Tenens, the UNM Physician Access Line and UNM’s Health Extension Regional Offices – continue to help manage workloads and create professional support networks, as we reported in 2014 and 2015.
Rec. 2014.8 Enhance linkages between rural practitioners and the UNM Health Sciences Center to improve health care workforce retention.
ACTION: As we reported in 2015, telehealth technologies and virtual clinic platforms such as Project ECHO have continued to enhance primary care practice in rural New Mexico.
V.B.4 2014 New Mexico Health Care Workforce Committee Rec. 2014.9 The New Mexico Health Care Workforce Committee should be funded in order to conduct its analyses. Funding for this committee will allow it to assess the efficacy of health care workforce programs and study in depth the mental health service environment, as well as expand tracking of health care workforce recruitment and retention.
ACTION: We have reiterated this recommendation (Rec. 2015.14, 2016.18, 2017.8 and 2018.7).

90 New Mexico Health Care Workforce Committee Report, 2019
New Mexico Health Care Workforce Committee Report, 2019 91
V.C. Status of 2015 Recommendations V.C.1. 2015 Behavioral Health Recommendations Rec. 2015.1 With additional funding, UNM HSC can expand statewide access to telehealth consultation with behavioral health clinicians.
ACTION: We recognize the ongoing need to expand telehealth access to direct clinical services and real-time consultation. Given the tight fiscal environment, we will defer this recommendation for the future. In 2016, we instead recommended commencing planning for a statewide telehealth infrastructure to expand behavioral health access (Rec. 2016.8).
Rec. 2015.2 Request that the New Mexico Counseling and Therapy Practice Board and the Board of Psychologist Examiners re-examine their requirements for face-to-face mentoring (to be replaced by tele-mentoring) in order to minimize the barriers to rural practice.
ACTION: As of 2015, the New Mexico Counseling and Therapy Practice Board, the Board of Psychologist Examiners and the Board of Social Work Examiners have agreed to expand or examine expanding the definition of supervised practice toward independent licensure to include tele-mentoring.
Rec. 2015.3 Request that the New Mexico Counseling and Therapy Practice Board, the Board of Social Work Examiners and the Board of Psychologist Examiners eliminate barriers in reciprocity (e.g., eliminate requirements for time practiced in a particular state) to make New Mexico more competitive in recruiting new practitioners.
ACTION: As above, these boards have agreed to examine ways to lessen or eliminate reciprocity barriers to improve practitioner recruitment.
Rec. 2015.4 Request that the New Mexico Behavioral Health Collaborative develop reimbursement mechanisms for services delivered by psychology interns, social work interns and counseling interns when participating in electives in the public behavioral health system.
ACTION: We have reiterated this recommendation (Rec. 2016.2, 2017.10, 2018.10).
Rec. 2015.5 Request that all publicly funded higher education institutions release their licensure board pass rates to the New Mexico Behavioral Health Collaborative and the respective professional licensing boards so that the state can identify areas of continuous quality improvement to ensure that graduates are adequately prepared for licensing board examinations.
92 New Mexico Health Care Workforce Committee Report, 2019
ACTION: In 2016, the New Mexico Behavioral Health Collaborative commenced discussions with Higher Education Department to facilitate this action.
Rec. 2015.6 The New Mexico Behavioral Health Collaborative should establish financing systems that promote sustainability and employee retention. Request that the Behavioral Health Collaborative disseminate a strategic plan on this topic by the end of FY 2016.
ACTION: The New Mexico Behavioral Health Collaborative developed and disseminated a strategic plan on sustainable financing systems (see http://www.newmexico.networkofcare.org/ content/client/1446/4.-Strategic-Plan-Implementation-Updated.pdf).
Rec. 2015.7 Request that the Department of Health add social workers and counselors to the list of health care professions who are eligible for New Mexico’s Rural Healthcare Practitioner Tax Credit program.
ACTION: See update below at Rec. 2015.15.
Rec. 2015.8 Support recruitment mechanisms by expanding the Rural Primary Health Care Act to include behavioral health and contracting with a non-profit entity for recruitment services.
ACTION: We continue to recognize the ongoing need to support recruitment of behavioral health clinicians. A centralized job board has been created for all New Mexico agencies to recruit for behavioral health clinicians (see http://www.newmexico.networkofcare.org/mh/nocJobBoard/).
The Rural Primary Care Act needs to be expanded to include a specialized behavioral health entity to support recruitment and contracting. Given the tight fiscal environment, we will defer this recommendation for the future.
V.C.2. 2015 Recommendations for Other Health Professions Rec. 2015.9 We strongly recommend that the Higher Education Department take full advantage of the next opportunity to reinstate the U.S. Department of Health and Human Services matching grant to support New Mexico’s loan repayment program.
ACTION: We commend the Higher Education Department for their successful work to reinstate this funding. The funding was secured in 2018.

New Mexico Health Care Workforce Committee Report, 2019 93
Rec. 2015.10 We strongly recommend that the Legislative Health and Human Services (LHHS) and Legislative Finance Committees (LFC) support funding for loan-for-service and loan repayment programs and consider increasing funding levels to enhance rural health care practice.
ACTION: LHHS supported this recommendation in 2015. We have reiterated this recommendation (Rec. 2016.12, 2017.5 and 2018.4)
Rec. 2015.11 We recommend that loan-for-service and loan repayment programs be structured to target the professions most needed in rural areas, rather than prioritizing practitioners with the highest levels of debt.
ACTION: We have reiterated this recommendation (Rec. 2016.13, 2017.5 and 2018.4).
Rec. 2015.12 We recommend that telehealth services be encouraged and funded to assist rural physicians in managing workload and treating complex cases.
ACTION: In 2015, the LHHS endorsed $3 million in appropriations for Project ECHO. However, no additional funding was provided in the 2016 legislative session due to budgetary constraints. An additional $50,000 appropriation was made to Project ECHO in FY 2018; however, due to the across-the-board cuts, Project ECHO’s FY 2018 appropriation is less than the FY 2017 appropriation.
Rec. 2015.13 We recommend that the Department of Health cooperate with the Taxation and Revenue Department so that the New Mexico Health Care Workforce Committee can analyze the impact of the Rural Health Care Tax Credit on retention.
ACTION: LHHS requested the LFC update the 2011 study of the tax credit. As of August 2016, the Department of Health and Taxation and Revenue Department have initiated analysis of the retention impact of the Rural Health Care Tax Credit.
Rec. 2015.14 We recommend that the Legislature support funding the New Mexico Health Care Workforce Committee to study whether residents have adequate access to the various types of providers.
ACTION: The LFC has recommended supporting the committee’s workforce analysis initiatives. LHHS endorsed the 2016 Senate Bill 150 to provide $300,000 to support the work of the New Mexico Health Care Workforce Committee. However, this bill did not pass. We have reiterated this recommendation (Rec 2016.18, 2017.8 and 2018.7).
94 New Mexico Health Care Workforce Committee Report, 2019
Rec. 2015.15 We recommend that pharmacists, counselors and social workers be added to the list of health care practitioners eligible for the Rural Health Care Tax Credit.
ACTION: The 2017 House Bill 68 would have equalized the tax credit among all practitioners at the $5,000 level and added licensed counselors, pharmacists and social workers. However, this bill did not pass. We have reiterated this recommendation (Rec. 2016.5, 2017.6 and 2018.5).

New Mexico Health Care Workforce Committee Report, 2019 95
V.D. Status of 2016 Recommendations V.D.1. 2016 Behavioral Health Recommendations Rec. 2016.1 In compliance with Chapter 61 of NMSA 1978, expedite implementation of professional licensure by endorsement for social workers, counselors and therapists.
ACTION: We defer this recommendation to a future year.
Rec. 2016.2 Develop reimbursement mechanisms through Medicaid for services delivered by trainees in community settings.
ACTION: We have reiterated this recommendation (Rec. 2017.10, 2018.10).
Rec. 2016.3 Identify funding for efforts to support and prepare candidates from diverse backgrounds to complete graduate degrees in behavioral health fields.
ACTION: This recommendation is deferred, given current fiscal constraints.
Rec. 2016.4 Support Medicaid funding for community-based psychiatry residency programs in Federally Qualified Health Centers.
ACTION: The 2014 Legislature also advanced the creation of psychiatry residency slots by leveraging state Medicaid funds.36 Through this program, psychiatry residency development will be supported through the base Medicaid funding budget for residency slots at Federally Qualified Health Centers in New Mexico primary care shortage areas.
Rec. 2016.5 Request that the Department of Health add social workers and counselors to the list of health care professions who are eligible for New Mexico’s Rural Healthcare Practitioner Tax Credit program.
ACTION: As noted for Rec. 2015.15, 2017 HB 68 would have equalized the tax credit among all practitioners at the $5,000 level and added licensed counselors, pharmacists and social workers. However, this bill did not pass. We have reiterated this recommendation (Rec. 2017.6 and 2018.5).
Rec. 2016.6 Explore opportunities to leverage federal funding for the Health Information Exchange and adoption of electronic health records for behavioral health providers.

96 New Mexico Health Care Workforce Committee Report, 2019
ACTION: This recommendation is deferred, as the New Mexico Human Services Department focuses on the update of Centennial Care 2.0.
Rec. 2016.7 Bring licensing boards together to create a unified survey and dataset for behavioral health care providers.
ACTION: The Board of Psychologist Examiners is piloting an updated behavioral health survey with expanded fields to better understand the needs of behavioral health providers.
Rec. 2016.8 Convene a planning group to develop statewide telehealth infrastructure to deliver behavioral health services via telehealth to rural communities.
ACTION: The New Mexico Hospital Association has convened a planning group to explore the financing and sustainability of a statewide emergency telepsychiatry network to provide emergency consultations to patients in emergency departments.
Rec. 2016.9 Support the Collaborative Advanced Psychiatric-Education Exchange Program.
ACTION: The UNM College of Nursing was successful in receiving Health Resources and Services Administration funding to develop a post-master’s certificate in psychiatric and mental health through the Collaborative Advanced Psychiatric – Education Exchange initiative.
V.D.2. 2016 Recommendations for Other Health Professions Rec. 2016.10 Correct the recent omission by the Regulation and Licensing Department of the practice specialty item from the physicians’ online license renewal survey platform.
ACTION: We commend the New Mexico Regulation and Licensing Department for their prompt and effective response to this recommendation. The omission was resolved in January 2017.
Rec. 2016.11 Enhance the Physician Assistants’ survey with an added practice specialty item.
ACTION: The practice specialty item has been incorporated into the Physician Assistants’ license renewal survey in 2017.
Rec. 2016.12 Maintain funding for the loan-for-service and loan repayment programs at their current levels.
New Mexico Health Care Workforce Committee Report, 2019 97
ACTION: The Higher Education Department’s application to reinstate federal funds was approved by the U.S. Department of Health and Human Services in 2018. Nonetheless, we reiterate our recommendation that funding for these programs be maintained or expanded (Rec. 2017.5, 2018.4).
Rec. 2016.13 Restructure loan-for-service and loan repayment programs to target the professions most needed in rural areas, rather than prioritizing practitioners with the highest levels of debt.
ACTION: We have reiterated this recommendation (Rec. 2017.5 and 2018.4).
Rec. 2016.14 Position the Higher Education Department to take full advantage of the 2017 opportunity to reinstate the U.S. Department of Health and Human Services matching grant to support New Mexico’s loan repayment program.
ACTION: We commend the Higher Education Department for their successful application to reinstate these funds in 2018.
Rec. 2016.15 Continue funding for expanded primary and secondary care residencies in New Mexico.
ACTION: No further action has occurred since that described above for Rec. 2014.2. We have reiterated this recommendation (Rec. 2017.2 and 2018.3).
Rec. 2016.16 Support further exploration of Medicaid as an avenue for expanding residencies in New Mexico.
ACTION: See update above at Rec. 2014.2. We have reiterated this recommendation (Rec. 2017.3).
Rec. 2016.17 Continue support for the Community Health Workers certification program to promote consistency among training programs for these health professionals.
ACTION: This support continues to be needed.
Rec. 2016.18 Provide funding for the New Mexico Health Care Workforce Committee.
ACTION: We have reiterated this recommendation (Rec. 2017.8 and 2018.7).

98 New Mexico Health Care Workforce Committee Report, 2019

New Mexico Health Care Workforce Committee Report, 2019 99
V.E. Status of 2017 Recommendations V.E.1. 2017 Recommendations for All Health Professions Rec. 2017.1. Identify funding for efforts to support the New Mexico Nursing Education Consortium (NMNEC).
ACTION: We have reiterated this recommendation (Rec. 2018.1).
Rec. 2017.2. Continue funding for expanded primary and secondary care residencies in New Mexico.
ACTION: We have reiterated this recommendation (Rec. 2018.3).
Rec. 2017.3. Support further exploration of Medicaid as an avenue for expanding residencies in New Mexico.
ACTION: This avenue for expanding residencies continues to progress at the state level. We encourage continuation of this discussion.
Rec. 2017.4. Position the Higher Education Department to take full advantage of the next opportunity to reinstate the U.S. Department of Health and Human Services matching grant to support New Mexico’s state loan repayment program.
ACTION: We commend the Higher Education Department for their successful work to reinstate this funding. The funding has been secured in 2018.
Rec. 2017.5. Increase funding for state loan-for-service and loan repayment programs, and consider restructuring them to target the professions most needed in rural and underserved areas rather than prioritizing those with higher debt.
ACTION: We have reiterated this recommendation (Rec. 2018.4).
Rec. 2017.6. Request that the Department of Health add pharmacists, social workers and counselors to the health care professions eligible for New Mexico’s Rural Healthcare Practitioner Tax Credit program.
ACTION: We have reiterated this recommendation (Rec. 2018.5).

100 New Mexico Health Care Workforce Committee Report, 2019
Rec. 2017.7. Remedy the pharmacists’ survey.
ACTION: We commend the Board of Pharmacy and the Regulation and Licensing Department for their prompt action in correcting the registered pharmacists’ survey.
Rec. 2017.8. Provide funding for the New Mexico Health Care Workforce Committee.
ACTION: We have reiterated this recommendation (Rec. 2018.7).
V.E.2. 2017 Behavioral Health Recommendations Rec. 2017.9. Require that licensed behavioral health professionals receive three hours of continuing education credits each licensure cycle in the treatment of substance use disorders
ACTION: This issue has been discussed with the relevant professional boards, who are in support of this measure. We have reiterated this recommendation (Rec. 2018.9).
Rec. 2017.10. Develop reimbursement mechanisms through Medicaid for services delivered by behavioral health interns in community settings
ACTION: This recommendation has been included in Medicaid’s proposed rule, which is currently being promulgated but is not yet finalized. We have reiterated this recommendation (Rec. 2018.10).
Rec. 2017.11. Create a state Behavioral Health Workforce Center of Excellence
ACTION: We defer this recommendation.
Rec. 2017.12. Expedite direct services via telehealth by participating in interstate licensing compacts when available
ACTION: We have modified this recommendation to specifically support enacting PSYPACT (Rec. 2018.12).
New Mexico Health Care Workforce Committee Report, 2019 101
V.F. Status of 2018 Recommendations V.F.1. 2018 Recommendations for All Health Professions Rec. 2018.1. Identify funding for efforts to support the New Mexico Nursing Education Consortium (NMNEC).
ACTION: We are grateful to the Legislature for their initial funding of NMNEC in the amounts of $450,000 recurring and $50,000 non-recurring. The continuation of this program with state support will be critical to expanding the state’s supply of BSN-prepared registered nurses.
Rec. 2018.2. Direct RLD to correct its information technology system deficiencies so that all survey responses can be provided to the University of New Mexico Health Sciences Center and the committee.
ACTION: We commend RLD on their prompt restoration of the missing data.
Rec. 2018.3. Continue funding for expanded primary and secondary care residencies in New Mexico.
ACTION: We have reiterated this recommendation (Rec. 2019.10).
Rec. 2018.4. Increase funding for state loan-for-service and loan repayment programs, and consider restructuring them to target the professions most needed in rural and underserved areas rather than prioritizing those with higher debt.
ACTION: In 2017, the New Mexico Higher Education Department reported targeting professions for the state’s loan repayment program, with advanced practice registered nurses, clinical psychologists and other mental health providers receiving priority.37 We commend the New Mexico Higher Education Department on their efforts to target the state’s loan repayment program to the professions most in need.
Rec. 2018.5. Request that the Department of Health add pharmacists, social workers and counselors to the health care professions eligible for New Mexico’s Rural Healthcare Practitioner Tax Credit program.
ACTION: We have reiterated this recommendation (Rec. 2019.12).
Rec. 2018.6. Create a committee tasked with examining future health care workforce needs related to the state’s changing demographics.
ACTION: We have reiterated this recommendation (Rec. 2019.14).

102 New Mexico Health Care Workforce Committee Report, 2019
Rec. 2018.7. Provide funding for the New Mexico Health Care Workforce Committee.
ACTION: We have reiterated this recommendation (Rec. 2019.15).
Rec. 2018.8. Establish a tax credit for health care professional preceptors who work with public institutions.
ACTION: We have reiterated this recommendation (Rec. 2019.8).
V.F.2. 2018 Recommendations for Behavioral Health Professions Rec. 2018.9. Require that licensed behavioral health professionals receive three hours of continuing education credits each licensure cycle in the treatment of substance use disorders.
ACTION: No action was taken; we defer this recommendation.
Rec. 2018.10. Finalize and promulgate changes to the New Mexico Medicaid Behavioral Health Regulations to reimburse Medicaid services when delivered by behavioral health interns in community settings.
ACTION: The recommended changes were finalized and promulgated in 2019.
Rec. 2018.11. Finalize and promulgate changes to the New Mexico Medicaid Behavioral Health Regulations to identify physician assistants as a behavioral health provider type which will allow Medicaid reimbursement of services when delivered by physician assistants in behavioral health settings.
ACTION: These recommended changes were also finalized and promulgated in 2019. We look forward to the positive effects the changes described in Recommendations 2018.10 and 2018.11 together will have on the state’s behavioral health workforce and access statewide to behavioral health care.
Rec. 2018.12. Expedite direct services via telehealth by participating in the PSYPACT interstate licensing compact.
ACTION: We have reiterated this recommendation (Rec. 2019.11).

New Mexico Health Care Workforce Committee Report, 2019 103
Rec. 2018.13. Fund an infrastructure through the New Mexico Hospital Association for a centralized Telebehavioral Health Program to provide direct care to rural communities.
ACTION: This initiative has been deferred by the New Mexico Hospital Association.
V.F.3. 2018 Recommendation for Correction and Alignment of New Mexico’s Health Professionals Surveys Rec. 2018.14. Direct the pertinent professional licensing boards to make the necessary changes to align their surveys with legislative requirements and other boards’ surveys.
ACTION: The New Mexico Health Care Workforce Committee is contacting the boards to request the necessary survey amendments.

104 New Mexico Health Care Workforce Committee Report, 2019

New Mexico Health Care Workforce Committee Report, 2019 105
Section VI
2019 Recommendations of the New Mexico Health Care Workforce Committee Recommendation 1 Provide $6 million in recurring funding for tuition-free training for medical students at public institutions pledging to practice in New Mexico. This new program, to be structured as a scholarship provided in exchange for a signed commitment to practice in New Mexico for at least four years following residency, would halve the debt load of medical education for participants. The recommended $6 million in recurring funding would be sufficient to pay tuition for all MD students at the University of New Mexico (UNM) School of Medicine willing to commit to practice in the state. This would provide a powerful incentive to these medical students – 99% of whom are from the state – to remain in New Mexico to practice after their training is completed.
Recommendation 2 Double funding for the state’s medical, nursing and allied health loan-for-service programs. These programs encourage trainees to commit to working in health professional shortage areas. In state fiscal year 2017, appropriations funded only 55% of eligible applicants for the state’s health professional loan-for-service programs, including 15 medical, 33 nursing and five allied health.37 Doubling the appropriations to accommodate up to 30 medical, 66 nursing and 10 allied health students would cost up to an additional $375,000 for medical ($25,000 x 15 participants), $396,000 for nursing ($12,000 x 33 participants) and $60,000 for allied health ($12,000 x five participants), for a total of up to $831,000 in additional funding. The actual cost might well be less, as in FY 2017 the number of applications to the medical and nursing loan-for-service programs were 22 and 59 respectively, each less than the new maximums of 30 and 66.
Recommendation 3 Increase line-item appropriations to New Mexico’s community colleges for nursing program enhancement. Training nurses in-state at community colleges holds promise for increasing the supply of registered nurses in New Mexico. From state fiscal year 2004 to 2013, a total of $28.7 million in supplemental funding for nursing program enhancement was allocated to New Mexico’s public institutions via line-item appropriations.38 Allocating supplemental funding to this line item for the state’s community colleges in future years would increase the training slots available for nursing, making training at public institutions more accessible statewide.
106 New Mexico Health Care Workforce Committee Report, 2019
Recommendation 4 Continue to fund NMNEC by making the current funding of $500,000 entirely recurring. We are grateful to the Legislature for its commitment of recurring support for the New Mexico Nursing Education Consortium (NMNEC). NMNEC successfully addressed the need to increase nurses with BSN degrees for New Mexico’s nursing workforce. Funding support for NMNEC is essential to continue building partnerships between universities and community colleges to expand the BSN degree option, increase BSN-prepared nurses for New Mexico, improve efficiency, quality and educational outcomes of nursing education, increase workforce diversity by improving nursing education for minorities – particularly in rural areas – and maintain the NMNEC curriculum integrity.
Current this program receives $450,000 in recurring funding and $50,000 non-recurring appropriations. Making the total of $500,000 recurring, as requested through the RPSP process by the UNM College of Nursing, will allow NMNEC to not only continue functioning at the current level, but also work toward expanding enrollments at community colleges throughout the state.
Recommendation 5 Fund RPSP for expansion of nursing education and targeted recruitment of Native American and rural students ($199,671). New Mexico has a particular need for Native American and rural nurses. These requested funds would serve to increase undergraduate enrollment by 32 students per year at the UNM College of Nursing Rio Rancho Campus. Recruitment for these added slots will be targeted toward Native American and rural communities.
Recommendation 6 Fund RPSP for the freshman direct entry early assurance pre-licensure BSN program ($428,271). This new program aims to 1) identify and admit academically prepared high school students to the UNM College of Nursing and ensure academic success for BSN freshman direct-entry students, 2) provide the basis to advance BSN-prepared nurses into the MSN in Education or Administration or a related graduate degree, and thereby 3) continue to address the state’s nursing and nursing faculty shortage. By so doing, this new program has the potential to increase the state’s nursing workforce by both educating an additional 22 BSN-prepared nurses each year and increasing the state’s capacity to train future nurses.
Recommendation 7 Fund RPSP for the expansion of physician assistant training ($453,180). Physician assistants form a critical component of both the primary care workforce and the workforce trained in providing medication-assisted treatment for opioid addiction in New Mexico. The proposed addition of nine additional students per year to the UNM School of Medicine PA program would help to build access to these services in the state.
New Mexico Health Care Workforce Committee Report, 2019 107
Recommendation 8 Establish a tax credit for rural primary care provider and pharmacist preceptors who work with public institutions. Community-based clinical training preceptors play an important role in the clinical education of health professionals, including physicians, advanced practice registered nurses, physician assistants and pharmacists. These practicing health care professionals provide trainees with clinical experience and mentoring. They are located outside of the academic medical sites where the majority of training takes place. For example, UNM School of Medicine preceptors are located in 77 communities and 30 of New Mexico’s 33 counties, while the College of Pharmacy has sites in 48 communities and 28 counties. As a result, community preceptors provide a diversity of patients, cases and settings that broaden students’ clinical knowledge and can be instrumental in their decision to practice in rural areas.
The clinical experiences provided by community preceptors are critically needed in order to increase the state’s health workforce training capacity. Despite the important role they play and time they commit to training, however, preceptors for public institutions are typically unpaid. Public institutions, while able to provide non-monetary compensation to their preceptors such as access to library resources, must compete with private institutions that are able to pay for this valuable service. Providing a $1,000 tax credit to up to 250 primary care provider or pharmacist preceptors who provide at least 80 hours of service for public institutions, defined similarly to the comparable program in Hawaii,39 would cost the state only $250,000 in tax revenue while increasing the supply of health workforce and recognizing the valuable public service provided by volunteer preceptors in training future workforce.
Recommendation 9 Increase Nurse Educator Loan-for-Service Program awards to $12,000 per participant per year. The nurse educator loan-for-service program currently provides up to $7,500 per participant per year for individuals enrolled in a nursing program at a public institution who declare their intention to become a nurse educator at an eligible institution after completing training. As discussed in Section II.C of this report, the state is limited in its capacity to train new nurses. While limited clinical experience slots are a significant factor, difficulty finding and recruiting qualified nurse educators also plays a role. In 2017, the New Mexico Higher Education Department reported funding all eight of the eligible applicants for this program. In recent years, no more than nine have been funded.37 Increasing the award cap to $12,000 per participant per year – equal to the state’s nursing loan-for-service program – would encourage qualified individuals to commit to becoming educators for nurse training programs in the state, increasing the supply of nursing workforce.
Recommendation 10 Fulfill the state’s previous commitment to expansion of a remaining nine primary and secondary care residencies in New Mexico ($1.1 million in recurring funding), and consider further residency expansion through state funding, Medicaid funds or other mechanisms. Residency service in rural and underserved areas serves as a powerful recruitment tool. In prior years (2014, 2016, 2017 and 2018), the Committee recommended expansion of state-funded Graduate Medical Education positions, and has further recommended exploring the use of Medicaid funds to create state-supported residencies. We reiterate the need to fulfill funding of nine new primary and secondary care
108 New Mexico Health Care Workforce Committee Report, 2019
residencies, particularly for practice in areas that are rural or underserved, as residency service in such areas can be a powerful recruitment tool. In addition, we recommend examination of alternate sources of funding to further expand residencies in the state, particularly in medically underserved and rural areas to which recent medical graduates might not otherwise be exposed.
Recommendation 11 Enact legislation for New Mexico’s participation in PSYPACT, with recurring funding of $6,000 for the cost of the compact. Interstate licensure compacts allow licensed behavioral health clinicians to provide direct telehealth services in participating compact states, promoting the mobility of health professionals and decreasing barriers and obstacles for licensure in order to increase access to care to underserved populations and in rural areas. One such compact under consideration by the Legislature is the Psychology Interjurisdictional Compact (PSYPACT), which authorizes psychologists from participating states to provide HIPAA-compliant telepsychological services and face-to-face services outside of the provider’s home state for up to 30 days per year to patients in participating states without obtaining licensure in the remote jurisdiction. Since the committee’s 2018 report, 12 states have joined PSYPACT, including all of those with which New Mexico shares a border: Arizona, Utah, Colorado, Oklahoma and Texas. Both the New Mexico Psychological Association and the New Mexico Board of Psychologist Examiners strongly support PSYPACT for New Mexico. The approximate annual cost for compact participation is only $6,000.
Recommendation 12 Expand the rural health care tax credit to include pharmacists, social workers and counselors. The professions currently eligible include licensed dental hygienists, physician assistants, certified nurse-midwives, certified registered nurse anesthetists, certified nurse practitioners and clinical nurse specialists. Pharmacists are urgently needed in many areas of the state, and counselors and social workers made up 80.6% of our state behavioral health workforce in 2018. Excluding these professions from the rural health tax credit removes an incentive that might otherwise act as a recruitment and retention tool to improve access to pharmacy and mental health services outside of urban centers in the state. At the $3,000 credit level, the state would demonstrate its commitment to those members of these professions serving in rural areas and encourage those entering the profession to practice rurally.
Recommendation 13 Direct the New Mexico Taxation and Revenue Department and Department of Health to examine the effectiveness of the rural health tax credit in recruiting and retaining providers in rural areas. While we encourage the expansion of the rural health tax credit as a relatively low-cost recruitment and retention tool, we are aware of no recent studies that examine the total cost of the program, the proportion of rural practitioners who claim the credit, or outcomes such as duration of practice in rural areas for practitioners who receive the credit. We recommend that the Legislature direct the Taxation and Revenue
New Mexico Health Care Workforce Committee Report, 2019 109
Department and Department of Health to work collaboratively to generate a report detailing the scope and effectiveness of this program to inform future legislative action on this matter.
Recommendation 14 Enact memorial legislation creating a subcommittee under the New Mexico Health Care Workforce Committee to examine future health care workforce needs related to the state’s changing demographics and changing makeup of health care teams. The state population is projected to age rapidly over the coming decades, with 32.5% of the state’s population aged 60 or older by 2030, putting New Mexico third in the nation for this demographic.40 Meeting the unique health care needs of this changed population will require proactive planning at the same time we work to address the state’s current needs. Similarly to the behavioral health subcommittee that has provided valuable insights into the state’s mental health needs, we recommend the creation of a subcommittee under the New Mexico Health Care Workforce Committee, “Projection of Health Care Needs Towards 2030,” directed to examine and report on the state’s future health care workforce requirements related to the state’s changing demographics and propose actions to proactively ensure the state’s needs are met.
Recommendation 15 Provide $250,000 in recurring funding for the analytical, data management and administrative work undertaken by the New Mexico Health Care Workforce Committee. The work of the Committee incurs costs, including staff effort in analysis, data management and committee administration, as well as printing and binding of the Annual Report. Without funding, the analyses that can be conducted, the dissemination of these findings, and the research support that can be provided to efforts to mitigate New Mexico’s shortages of health professionals through recruitment and retention are severely curtailed. Recurring funding in the amount of $250,000 would allow for the expansion of analysis to include additional professions, improvements in data management, and more in-depth examinations of the state’s health care workforce and the efficacy of recruitment and retention programs.

110 New Mexico Health Care Workforce Committee Report, 2019

New Mexico Health Care Workforce Committee Report, 2019 111
References
1. New Mexico Health Care Workforce Committee. 2013 Annual Report. Albuquerque NM: University of New Mexico Health Sciences Center; 2013.
2. New Mexico Health Care Workforce Committee. 2014 Annual Report. Albuquerque NM: University of New Mexico Health Sciences Center; 2014.
3. New Mexico Health Care Workforce Committee. 2015 Annual Report. Albuquerque NM: University of New Mexico Health Sciences Center; 2015.
4. New Mexico Health Care Workforce Committee. 2016 Annual Report. Albuquerque NM: University of New Mexico Health Sciences Center; 2016.
5. Farnbach Pearson AW, Reno JR, New Mexico Health Care Workforce Committee. 2017 Annual Report. Albuquerque NM: University of New Mexico Health Sciences Center; 2017.
6. Farnbach Pearson AW, Reno JR, New Mexico Health Care Workforce Committee. 2018 Annual Report. Albuquerque NM: University of New Mexico Health Sciences Center; 2018.
7. Health Care Work Force Data Collection, Analysis and Policy Act. Vol NM Stat § 24-14C-1.; 2011.
8. Farnbach Pearson AW, Rayburn WF, Larson RS. Beyond “counting heads:” patterns of working hours among physicians and implications for future workforce needs. In: 15th Annual AAMC Health Workforce Research Conference. Alexandria VA; 2019.
9. Blackstone J, Rayburn WF, Farnbach Pearson AW, Larson RS. Obstetrician-gynecologists in general practice in New Mexico: a comparison between rural and metropolitan settings. In: 15th Annual AAMC Health Workforce Research Conference. Alexandria VA; 2019.
10. Henry J. Kaiser Family Foundation. State Health Facts: Total Nurse Practitioners per 100,000 Population. http://kff.org/other/state-indicator/nurse-practitioners-per-100000-pop/. Accessed August 28, 2015.
11. Center for Workforce Studies. 2011 State Physician Workforce Data Book. Association of American Medical Colleges; 2011. https://www.aamc.org/download/263512/data/statedata2011.pdf. Accessed August 28, 2015.
12. Rayburn W. The Obstetrician/Gynecologist Workforce in the United States Facts, Figures, and Implications 2011. The American Congress of Obstetricians and Gynecologists; 2011.
13. Ricketts TC, Thompson K, Neuwah S, McGee V. Developing an Index for Surgical Underservice (July 2011) - Indexsurg.Ashx. American College of Surgeons Health Policy Research Institute; 2011. https://www.facs.org/~/media/files/advocacy/hpri/indexsurg.ashx. Accessed August 28, 2015.
14. Burvill PW. Looking beyond the 1:10,000 ratio of psychiatrists to population. The Australian and New Zealand journal of psychiatry. 1992;26(2):265-269.

112 New Mexico Health Care Workforce Committee Report, 2019
15. National Commission on Certification of Physician Assistants. 2012 Statistical Profile of Certified Physician Assistants: An Annual Report of the National Commission on Certification of Physician Assistants. Johns Creek GA: NCCPA; 2013.
16. American Midwifery Certification Board. Certified Nurse-Midwives/Certified Midwives by State as of August 2016. Linthicum MD: AMCB; 2016. http://www.amcbmidwife.org/docs/default-document-library/number-of-cnm-cm-by-state---august-2016.pdf?sfvrsn=2. Accessed March 8, 2017.
17. Anton S, Darragh I, Khalsa MA, Nelson C, Pulley D. 2015 Annual Report. Lilburn GA: North American Registry of Midwives; 2016. http://narm.org/pdffiles/2015NARMAnnualReport.pdf. Accessed September 7, 2018.
18. Health Resources and Services Administration. Criteria for determining priorities among health professional shortage areas. Federal Register. 2003;68(104):32531-32533.
19. Federal Interagency Committee on Emergency Medical Services. 2011 National EMS Assessment. Washington DC: US Department of Transportation, National Highway Traffic Safety Administration; 2012. Available at www.EMS.gov. Accessed March 8, 2017.
20. U.S. Census Bureau. Annual Estimates of the Resident Population: April 1, 2010 to July 1, 2018 (PEPSR6H). In: 2018 Population Estimates. Washington DC: US Census Bureau; 2019. https://factfinder.census.gov. Accessed July 18, 2018.
21. Institute of Medicine. The Future of Nursing: Leading Change, Advancing Health. Washington DC: The National Academies Press; 2011.
22. Patient Protection and Affordable Care Act. Vol 124 Stat. 119.; 2010.
23. Spetz J. How will health reform affect demand for RNs? Nursing Economic$. 2014;32(1):42-44.
24. Bureau of Labor Statistics. Occupational Outlook Handbook: Registered Nurses. Washington DC: U.S. Department of Labor; 2019. https://www.bls.gov/ooh/healthcare/registered-nurses.htm. Accessed September 24, 2019.
25. New Mexico Department of Workforce Solutions. New Mexico 2018 State of the Workforce Report.; 2018.
26. National Center for Health Workforce Analysis. Supply and Demand Projections of the Nursing Workforce: 2014-2030. Washington DC: Health Resources and Services Administration; 2017.
27. American Association of Colleges of Nursing. Fact Sheet: The impact of education on nursing practice. 2017. http://www.aacnnursing.org/Portals/42/News/Factsheets/Education-Impact-Fact-Sheet.pdf. Accessed March 5, 2018.
28. Petterson S, Peterson L, Phillips RL, et al. One in Fifteen Family Physicians Principally Provide Emergency or Urgent Care. The Journal of the American Board of Family Medicine. 2014;27(4):447-448. doi:10.3122/jabfm.2014.04.130307
29. Physician Assistant Act. Vol NM Stat § 61-6-7 through 61-6-10.; 2017.

New Mexico Health Care Workforce Committee Report, 2019 113
30. Martin JA, Hamilton BE, Osterman MJK, Driscoll AK, Mathews TJ. Births: Final data for 2015. National Vital Statistics Reports. 2017;66(1).
31. Farnbach Pearson AW, Reese AL, Rayburn WF, Larson RS, Cox KJ. Access to obstetric care: understanding the demographics and distribution of obstetricians-gynecologists, certified nurse midwives and licensed direct entry midwives in underserved areas of New Mexico. In: 14th Annual AAMC Health Workforce Research Conference. Tysons VA; 2018.
32. U.S. Census Bureau. ACS Demographic and Housing Estimates, 2017. In: 2013 - 2017 American Community Survey 5-Year Estimates. Washington DC: US Census Bureau; 2018. https://factfinder.census.gov. Accessed July 18, 2018.
33. Center for Workforce Studies. 2017 State Physician Workforce Data Book. Washington DC: Association of American Medical Colleges; 2017.
34. Physicians Foundation. 2018 Survey of America’s Physicians: Practice Patterns and Perspectives. Physicians Foundation; 2018. http://www.physiciansfoundation.org/uploads/default/Biennial_Physician_Survey_2016.pdf. Accessed February 2, 2018.
35. Program Evaluation Unit. Progress Report: Adequacy of New Mexico’s Healthcare Workforce Systems. Santa Fe NM: New Mexico Legislative Finance Committee; 2015:8 pp. http://www.nmlegis.gov/lcs/handouts/ALFC 081915 Item 21 Progress Report Healthcare Workforce.pdf. Accessed September 2, 2015.
36. Kaufman A, Alfero C. A state-based strategy for expanding primary care residency. Health Affairs Blog. July 2015. http://healthaffairs.org/blog/2015/07/31/astatebasedstrategyforexpandingprimarycareresidency/ print/. Accessed November 11, 2015.
37. New Mexico Higher Education Department. Annual Report 2017. Santa Fe NM: New Mexico Higher Education Department; 2018. http://www.hed.state.nm.us/uploads/files/Data%20Research/Data%20Reports/Annual%20Report%202013%20Final.pdf. Accessed September 23, 2014.
38. Department of Health and Allied Agencies. Adequacy of New Mexico’s Healthcare Systems Workforce. Santa Fe NM: Department of Health and Allied Agencies; 2013:61 pp. http://www.nmlegis.gov/lcs/lfc/lfcdocs/perfaudit/Department%20of%20Health%20and%20Allied%20Agencies%20%E2%80%93%20Adequacy%20of%20New%20Mexico%E2%80%99s%20Healthcare%20Systems%20Workforce.pdf. Accessed September 2, 2015.
39. SB2298 SD2 HD3 CD1 Relating to Healthcare Preceptor Tax Credits. Vol HI Act 043 (18).; 2018. http://preceptortaxcredit.hawaii.edu/wp-content/uploads/2018/12/Act-43-Preceptor-Tax-Credits-GM1143_.pdf. Accessed September 27, 2019.
40. New Mexico Aging and Long-Term Services Department. New Mexico State Plan for Aging and Long-Term Services: October 1, 2017 - September 30, 2021. Santa Fe NM: New Mexico Aging and Long-Term Services Department; 2017.

114 New Mexico Health Care Workforce Committee Report, 2019

New Mexico Health Care Workforce Committee Report, 2019 115
Appendix A
Bibliography of Publications and Conference Presentations Resulting from New Mexico’s Health Care Workforce Data
Peer-Reviewed Journal Articles Altschul DB, Bonham CA, Faulkner MJ, et al. State legislative approach to enumerating behavioral health workforce shortages: lessons learned in New Mexico. American Journal of Preventive Medicine. 2018;54(6S3):S220-S229.
Farnbach Pearson AW, Moffett ML, Larson RS, Rayburn WF. Mandated self-reporting of workforce data collected during medical license application or renewal: a case study of obstetrician-gynecologists in New Mexico. Journal of Medical Regulation. 2017;103(3):6-11.
Conference Presentations Blackstone J, Rayburn WF, Farnbach Pearson AW, Larson RS. Obstetrician-gynecologists in general practice in New Mexico: a comparison between rural and metropolitan settings. In: 15th Annual AAMC Health Workforce Research Conference. Alexandria VA; 2019.
Farnbach Pearson AW, Moffett ML, Larson RS. Are primary care physician counts representative of the pediatric primary care workforce? A New Mexico case study. In: 13th Annual AAMC Health Workforce Research Conference. Alexandria VA; 2017.
Farnbach Pearson AW, Moffett ML, Larson RS, Rayburn WF. New Mexico’s rural and metropolitan obstetrician and gynecologist workforce, 1990 - 2014: implications for health policy. In: 12th Annual AAMC Health Workforce Research Conference. Chicago IL; 2016.
Farnbach Pearson AW, Rayburn WF, Larson RS. Demographic diversity of New Mexico primary care physicians by population setting. In: 14th Annual AAMC Health Workforce Research Conference. Tysons VA; 2018.
Farnbach Pearson AW, Rayburn WF, Larson RS. Beyond “counting heads:” patterns of working hours among physicians and implications for future workforce needs. In: 15th Annual AAMC Health Workforce Research Conference. Alexandria VA; 2019.
Farnbach Pearson AW, Rayburn WF, Larson RS, Cordova de Ortega LM. Access to pediatric care across New Mexico communities: ratios of pediatric to adult primary care physicians and physicians to population. In: 14th Annual AAMC Health Workforce Research Conference. Tysons VA; 2018.
Farnbach Pearson AW, Reese AL, Rayburn WF, Larson RS, Cox KJ. Access to obstetric care: understanding the demographics and distribution of obstetricians-gynecologists, certified nurse midwives and licensed direct entry midwives in underserved areas of New Mexico. In: 14th Annual AAMC Health Workforce Research Conference. Tysons VA; 2018.
Larson R. Exploring solutions to New Mexico’s health provider shortage. In: 10th Annual AAMC Health Workforce Research Conference. Washington DC; 2014.

116 New Mexico Health Care Workforce Committee Report, 2019
Moffett ML, Farnbach Pearson AW, Larson R. Factors related to the age of actively-licensed physicians in New Mexico. In: 11th Annual AAMC Health Workforce Research Conference. Alexandria VA; 2015.
Moffett ML, Farnbach Pearson AW, Larson R. Gender differences in physician practice location and patient populations. In: 11th Annual AAMC Health Workforce Research Conference. Alexandria VA; 2015.
Moffett ML, Farnbach Pearson AW, Larson RS, Rayburn WF. Value of complete cross-sectional health workforce data: obstetrician-gynecologists in New Mexico. In: 12th Annual AAMC Health Workforce Research Conference. Chicago IL; 2016.
Moffett ML, Farnbach Pearson AW, Sklar D, Larson R. Moving in, out and on: physician workforce in New Mexico. In: 11th Annual AAMC Health Workforce Research Conference. Alexandria VA; 2015.
Moffett ML, Farnbach Pearson AW, Verzi SJ, Kleban SD, Malczynski LA, McDermott GV, Larson R. Modeling future health care workforce adequacy to inform policy. In: 11th Annual AAMC Health Workforce Research Conference. Alexandria VA; 2015.
Moffett ML, Rayburn WF, Farnbach Pearson AW, Larson RS. Value of mandatory statewide collection of demographic data about obstetrician-gynecologists. In: American College of Obstetricians and Gynecologists Annual Clinical and Scientific Meeting. San Diego CA; 2017.
Reese AL, Farnbach Pearson AW, Larson RS, Rayburn W, Cox KJ. New Mexico’s metropolitan and rural CNM workforce. In: American College of Nurse-Midwives 63rd Annual Meeting and Exhibition. Savannah GA; 2018.
Opinion and Commentary Farnbach Pearson AW, Larson RS. Shortage or surplus of physicians in the United States. JAMA. 2017;318(11):1069 (1 p.).
Policy Reports New Mexico Health Care Workforce Committee. 2013 Annual Report. Albuquerque NM: University of New Mexico Health Sciences Center; 2013.
New Mexico Health Care Workforce Committee. 2014 Annual Report. Albuquerque NM: University of New Mexico Health Sciences Center; 2014.
New Mexico Health Care Workforce Committee. 2015 Annual Report. Albuquerque NM: University of New Mexico Health Sciences Center; 2015.
New Mexico Health Care Workforce Committee. 2016 Annual Report. Albuquerque NM: University of New Mexico Health Sciences Center; 2016.
Farnbach Pearson AW, Reno JR, New Mexico Health Care Workforce Committee. 2017 Annual Report. Albuquerque NM: University of New Mexico Health Sciences Center; 2017.
Farnbach Pearson AW, Reno JR, New Mexico Health Care Workforce Committee. 2018 Annual Report. Albuquerque NM: University of New Mexico Health Sciences Center; 2018.

New Mexico Health Care Workforce Committee Report, 2019 117
Appendix B
Benchmark Gap Analyses for New Mexico Health Professions

118 New Mexico Health Care Workforce Committee Report, 2019
Table B.1. Benchmark Gap Analysis of New Mexico Registered Nurses
County Population Estimated RNs Above (+) / Below (–) Benchmark
Bernalillo 678,701 8,924 3,060 Catron 3,578 7 -24 Chaves 64,689 415 -144 Cibola 26,746 172 -59 Colfax 12,110 66 -39 Curry 49,437 356 -71 De Baca 1,781 7 -8 Doña Ana 217,522 1,516 -363 Eddy 57,900 389 -111 Grant 27,346 287 51 Guadalupe 4,341 26 -12 Harding 655 0 -6 Hidalgo 4,240 6 -31 Lea 69,611 323 -278 Lincoln 19,556 120 -49 Los Alamos 19,101 141 -24 Luna 23,963 97 -110 McKinley 72,290 396 -229 Mora 4,506 10 -29 Otero 66,781 371 -206 Quay 8,253 28 -43 Rio Arriba 39,006 203 -134 Roosevelt 18,743 87 -75 San Juan 125,043 884 -196 San Miguel 27,591 218 -20 Sandoval 145,179 869 -385 Santa Fe 150,056 1,063 -233 Sierra 10,968 78 -17 Socorro 16,735 75 -70 Taos 32,835 187 -97 Torrance 15,591 12 -123 Union 4,118 24 -12 Valencia 76,456 169 -492
STATE TOTAL 2,095,428 17,526 -578

New Mexico Health Care Workforce Committee Report, 2019 119
Table B.2. Benchmark Gap Analysis of New Mexico Certified Nurse Practitioners and Clinical Nurse Specialists
County Population Estimated CNPs and CNSs
Above (+) / Below (–) Benchmark
Bernalillo 678,701 717 317 Catron 3,578 0 -2 Chaves 64,689 46 8 Cibola 26,746 13 -3 Colfax 12,110 6 -1 Curry 49,437 23 -6 De Baca 1,781 2 1 Doña Ana 217,522 174 46 Eddy 57,900 47 13 Grant 27,346 20 4 Guadalupe 4,341 4 1 Harding 655 0 0 Hidalgo 4,240 0 -3 Lea 69,611 38 -3 Lincoln 19,556 7 -5 Los Alamos 19,101 12 1 Luna 23,963 15 1 McKinley 72,290 26 -17 Mora 4,506 4 1 Otero 66,781 41 2 Quay 8,253 11 6 Rio Arriba 39,006 30 7 Roosevelt 18,743 8 -3 San Juan 125,043 37 -37 San Miguel 27,591 12 -4 Sandoval 145,179 61 -25 Santa Fe 150,056 112 23 Sierra 10,968 9 3 Socorro 16,735 11 1 Taos 32,835 26 7 Torrance 15,591 3 -6 Union 4,118 1 -1 Valencia 76,456 26 -19
STATE TOTAL 2,095,428 1,542 306

120 New Mexico Health Care Workforce Committee Report, 2019
Table B.3. Benchmark Gap Analysis of New Mexico Primary Care Physicians
County Population Estimated Primary Care Physicians (Adjusted Value)
Above (+) / Below (–) Benchmark
(Adjusted Value) Bernalillo 678,701 999 (895) 463 (359) Catron 3,578 3 (1) 0 (-2) Chaves 64,689 70 (59) 19 (8) Cibola 26,746 19 (18) -2 (-3) Colfax 12,110 9 (8) -1 (-2) Curry 49,437 39 (35) 0 (-4) De Baca 1,781 2 (2) 1 (1) Doña Ana 217,522 192 (162) 20 (-10) Eddy 57,900 34 (27) -12 (-19) Grant 27,346 34 (26) 12 (4) Guadalupe 4,341 1 (1) -2 (-2) Harding 655 0 (0) -1 (-1) Hidalgo 4,240 2 (2) -1 (-1) Lea 69,611 37 (34) -18 (-21) Lincoln 19,556 12 (11) -3 (-4) Los Alamos 19,101 35 (33) 20 (18) Luna 23,963 6 (6) -13 (-13) McKinley 72,290 59 (53) 2 (-4) Mora 4,506 1 (1) -3 (-3) Otero 66,781 39 (31) -14 (-22) Quay 8,253 4 (4) -3 (-3) Rio Arriba 39,006 29 (28) -2 (-3) Roosevelt 18,743 9 (9) -6 (-6) San Juan 125,043 92 (80) -7 (-19) San Miguel 27,591 25 (19) 3 (-3) Sandoval 145,179 122 (107) 7 (-8) Santa Fe 150,056 199 (177) 80 (58) Sierra 10,968 9 (7) 0 (-2) Socorro 16,735 18 (14) 5 (1) Taos 32,835 35 (31) 9 (5) Torrance 15,591 3 (2) -9 (-10) Union 4,118 2 (2) -1 (-1) Valencia 76,456 22 (20) -38 (-40)
STATE TOTAL 2,095,428 2,162 (1,905) 505 (248)

New Mexico Health Care Workforce Committee Report, 2019 121
Table B.4. Benchmark Gap Analysis of New Mexico Obstetricians and Gynecologists
County Population Female Population
Estimated OB-GYNs
Above (+) / Below (–)
Benchmark Bernalillo 678,701 345,729 154 81 Catron 3,578 1,689 0 0 Chaves 64,689 32,591 6 -1 Cibola 26,746 13,080 3 0 Colfax 12,110 5,968 3 2 Curry 49,437 23,794 8 3 De Baca 1,781 899 0 0 Doña Ana 217,522 110,760 22 -1 Eddy 57,900 28,750 6 0 Grant 27,346 13,918 3 0 Guadalupe 4,341 1,868 0 0 Harding 655 320 0 0 Hidalgo 4,240 2,139 0 0 Lea 69,611 33,843 10 3 Lincoln 19,556 10,010 3 1 Los Alamos 19,101 9,396 5 3 Luna 23,963 11,918 2 -1 McKinley 72,290 37,314 3 -5 Mora 4,506 2,202 0 0 Otero 66,781 32,251 6 -1 Quay 8,253 4,224 0 -1 Rio Arriba 39,006 19,931 5 1 Roosevelt 18,743 9,368 0 -2 San Juan 125,043 63,145 8 -5 San Miguel 27,591 13,920 1 -2 Sandoval 145,179 74,035 10 -6 Santa Fe 150,056 77,345 15 -1 Sierra 10,968 5,479 0 -1 Socorro 16,735 8,339 4 2 Taos 32,835 16,671 2 -2 Torrance 15,591 7,327 0 -2 Union 4,118 1,814 0 0 Valencia 76,456 38,106 0 -8
STATE TOTAL 2,095,428 1,058,143 279 57

122 New Mexico Health Care Workforce Committee Report, 2019
Table B.5. Benchmark Gap Analysis of New Mexico General Surgeons
County Population Estimated General Surgeons
Above (+) / Below (–) Benchmark
Bernalillo 678,701 78 37 Catron 3,578 0 0 Chaves 64,689 4 0 Cibola 26,746 3 1 Colfax 12,110 3 2 Curry 49,437 8 5 De Baca 1,781 0 0 Doña Ana 217,522 14 1 Eddy 57,900 5 2 Grant 27,346 3 1 Guadalupe 4,341 0 0 Harding 655 0 0 Hidalgo 4,240 0 0 Lea 69,611 3 -1 Lincoln 19,556 2 1 Los Alamos 19,101 5 4 Luna 23,963 1 0 McKinley 72,290 9 5 Mora 4,506 0 0 Otero 66,781 2 -2 Quay 8,253 1 1 Rio Arriba 39,006 4 2 Roosevelt 18,743 2 1 San Juan 125,043 7 -1 San Miguel 27,591 2 0 Sandoval 145,179 8 -1 Santa Fe 150,056 13 4 Sierra 10,968 3 2 Socorro 16,735 1 0 Taos 32,835 6 4 Torrance 15,591 0 -1 Union 4,118 1 1 Valencia 76,456 0 -5
STATE TOTAL 2,095,428 188 63
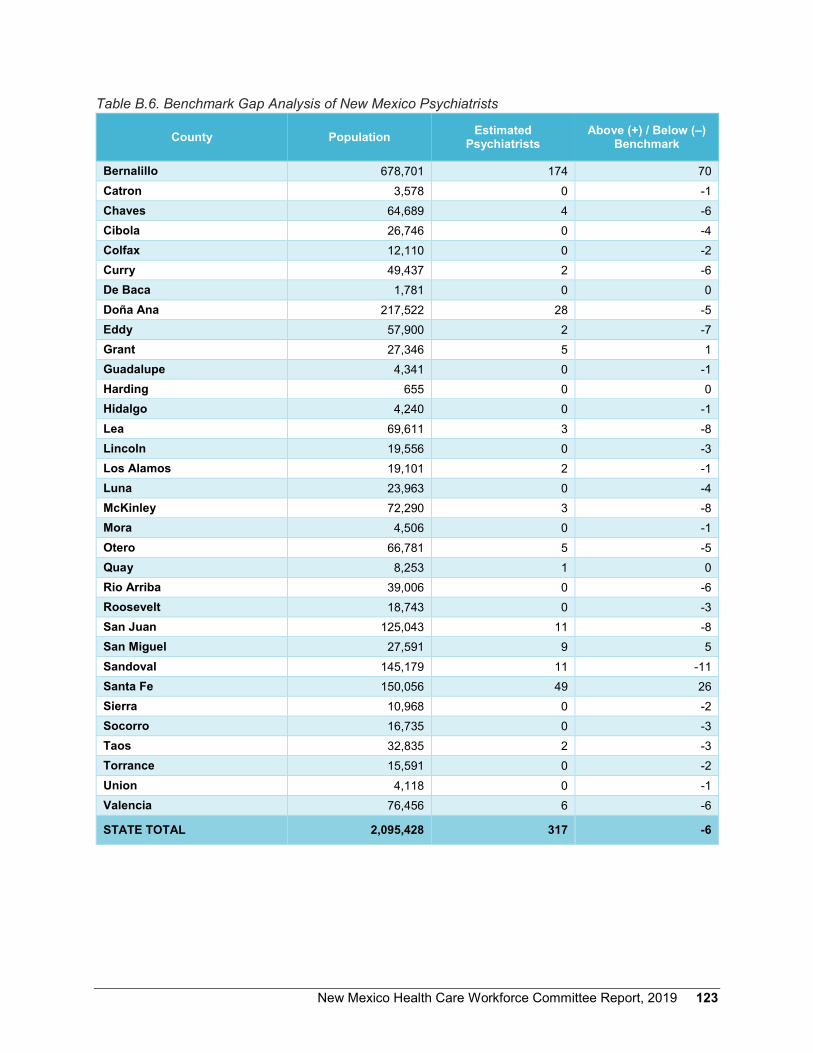
New Mexico Health Care Workforce Committee Report, 2019 123
Table B.6. Benchmark Gap Analysis of New Mexico Psychiatrists
County Population Estimated Psychiatrists
Above (+) / Below (–) Benchmark
Bernalillo 678,701 174 70 Catron 3,578 0 -1 Chaves 64,689 4 -6 Cibola 26,746 0 -4 Colfax 12,110 0 -2 Curry 49,437 2 -6 De Baca 1,781 0 0 Doña Ana 217,522 28 -5 Eddy 57,900 2 -7 Grant 27,346 5 1 Guadalupe 4,341 0 -1 Harding 655 0 0 Hidalgo 4,240 0 -1 Lea 69,611 3 -8 Lincoln 19,556 0 -3 Los Alamos 19,101 2 -1 Luna 23,963 0 -4 McKinley 72,290 3 -8 Mora 4,506 0 -1 Otero 66,781 5 -5 Quay 8,253 1 0 Rio Arriba 39,006 0 -6 Roosevelt 18,743 0 -3 San Juan 125,043 11 -8 San Miguel 27,591 9 5 Sandoval 145,179 11 -11 Santa Fe 150,056 49 26 Sierra 10,968 0 -2 Socorro 16,735 0 -3 Taos 32,835 2 -3 Torrance 15,591 0 -2 Union 4,118 0 -1 Valencia 76,456 6 -6
STATE TOTAL 2,095,428 317 -6

124 New Mexico Health Care Workforce Committee Report, 2019
Table B.7. Benchmark Gap Analysis of New Mexico Physician Assistants
County Population Estimated PAs Above (+) / Below (–) Benchmark
Bernalillo 678,701 430 224 Catron 3,578 0 -1 Chaves 64,689 14 -6 Cibola 26,746 5 -3 Colfax 12,110 5 1 Curry 49,437 10 -5 De Baca 1,781 0 -1 Doña Ana 217,522 41 -25 Eddy 57,900 13 -5 Grant 27,346 17 9 Guadalupe 4,341 0 -1 Harding 655 0 0 Hidalgo 4,240 1 0 Lea 69,611 9 -12 Lincoln 19,556 2 -4 Los Alamos 19,101 14 8 Luna 23,963 4 -3 McKinley 72,290 13 -9 Mora 4,506 0 -1 Otero 66,781 14 -6 Quay 8,253 0 -3 Rio Arriba 39,006 6 -6 Roosevelt 18,743 3 -3 San Juan 125,043 40 2 San Miguel 27,591 6 -2 Sandoval 145,179 53 9 Santa Fe 150,056 66 21 Sierra 10,968 4 1 Socorro 16,735 1 -4 Taos 32,835 20 10 Torrance 15,591 4 -1 Union 4,118 0 -1 Valencia 76,456 10 -13
STATE TOTAL 2,095,428 805 170

New Mexico Health Care Workforce Committee Report, 2019 125
Table B.8. Benchmark Gap Analysis of New Mexico Certified Nurse-Midwives
County Population Female Population
Estimated CNMs
Above (+) / Below (–)
Benchmark Bernalillo 678,701 345,729 101 77 Catron 3,578 1,689 0 0 Chaves 64,689 32,591 3 1 Cibola 26,746 13,080 1 0 Colfax 12,110 5,968 0 0 Curry 49,437 23,794 3 1 De Baca 1,781 899 0 0 Doña Ana 217,522 110,760 14 6 Eddy 57,900 28,750 1 -1 Grant 27,346 13,918 4 3 Guadalupe 4,341 1,868 0 0 Harding 655 320 0 0 Hidalgo 4,240 2,139 0 0 Lea 69,611 33,843 0 -2 Lincoln 19,556 10,010 0 -1 Los Alamos 19,101 9,396 2 1 Luna 23,963 11,918 0 -1 McKinley 72,290 37,314 7 4 Mora 4,506 2,202 0 0 Otero 66,781 32,251 1 -1 Quay 8,253 4,224 0 0 Rio Arriba 39,006 19,931 3 2 Roosevelt 18,743 9,368 0 -1 San Juan 125,043 63,145 11 7 San Miguel 27,591 13,920 1 0 Sandoval 145,179 74,035 2 -3 Santa Fe 150,056 77,345 11 6 Sierra 10,968 5,479 0 0 Socorro 16,735 8,339 0 -1 Taos 32,835 16,671 3 2 Torrance 15,591 7,327 0 -1 Union 4,118 1,814 0 0 Valencia 76,456 38,106 1 -2
STATE TOTAL 2,095,428 1,058,143 169 96
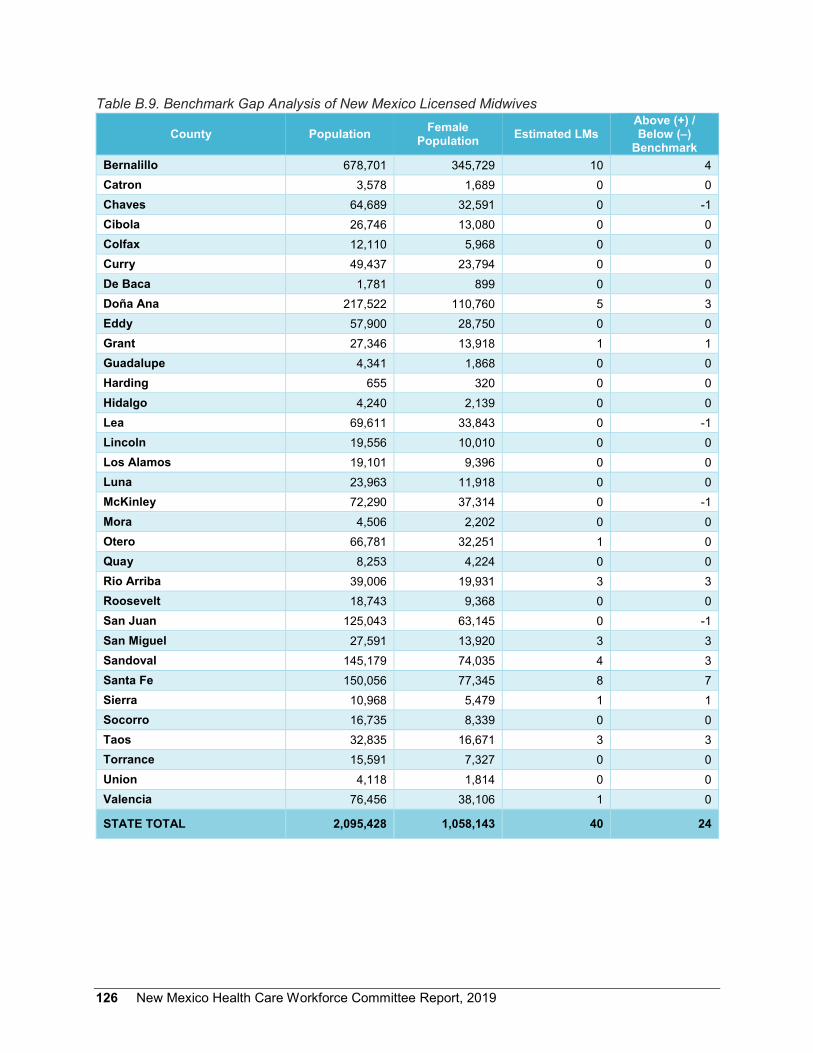
126 New Mexico Health Care Workforce Committee Report, 2019
Table B.9. Benchmark Gap Analysis of New Mexico Licensed Midwives
County Population Female Population Estimated LMs
Above (+) / Below (–)
Benchmark Bernalillo 678,701 345,729 10 4 Catron 3,578 1,689 0 0 Chaves 64,689 32,591 0 -1 Cibola 26,746 13,080 0 0 Colfax 12,110 5,968 0 0 Curry 49,437 23,794 0 0 De Baca 1,781 899 0 0 Doña Ana 217,522 110,760 5 3 Eddy 57,900 28,750 0 0 Grant 27,346 13,918 1 1 Guadalupe 4,341 1,868 0 0 Harding 655 320 0 0 Hidalgo 4,240 2,139 0 0 Lea 69,611 33,843 0 -1 Lincoln 19,556 10,010 0 0 Los Alamos 19,101 9,396 0 0 Luna 23,963 11,918 0 0 McKinley 72,290 37,314 0 -1 Mora 4,506 2,202 0 0 Otero 66,781 32,251 1 0 Quay 8,253 4,224 0 0 Rio Arriba 39,006 19,931 3 3 Roosevelt 18,743 9,368 0 0 San Juan 125,043 63,145 0 -1 San Miguel 27,591 13,920 3 3 Sandoval 145,179 74,035 4 3 Santa Fe 150,056 77,345 8 7 Sierra 10,968 5,479 1 1 Socorro 16,735 8,339 0 0 Taos 32,835 16,671 3 3 Torrance 15,591 7,327 0 0 Union 4,118 1,814 0 0 Valencia 76,456 38,106 1 0
STATE TOTAL 2,095,428 1,058,143 40 24

New Mexico Health Care Workforce Committee Report, 2019 127
Table B.10. Benchmark Gap Analysis of New Mexico Dentists
County Population Estimated Dentists Above (+) / Below (–) Benchmark
Bernalillo 678,701 530 259 Catron 3,578 1 0 Chaves 64,689 35 9 Cibola 26,746 11 0 Colfax 12,110 3 -2 Curry 49,437 24 4 De Baca 1,781 1 0 Doña Ana 217,522 114 27 Eddy 57,900 14 -9 Grant 27,346 12 1 Guadalupe 4,341 0 -2 Harding 655 0 0 Hidalgo 4,240 1 -1 Lea 69,611 19 -9 Lincoln 19,556 8 0 Los Alamos 19,101 12 4 Luna 23,963 8 -2 McKinley 72,290 28 -1 Mora 4,506 2 0 Otero 66,781 20 -7 Quay 8,253 2 -1 Rio Arriba 39,006 16 0 Roosevelt 18,743 5 -2 San Juan 125,043 87 37 San Miguel 27,591 11 0 Sandoval 145,179 75 17 Santa Fe 150,056 120 60 Sierra 10,968 3 -1 Socorro 16,735 6 -1 Taos 32,835 17 4 Torrance 15,591 2 -4 Union 4,118 0 -2 Valencia 76,456 29 -2
STATE TOTAL 2,095,428 1,216 376

128 New Mexico Health Care Workforce Committee Report, 2019
Table B.11. Benchmark Gap Analysis of New Mexico Emergency Medical Technicians
County Population Estimated EMTs Above (+) / Below (–) Benchmark
Bernalillo 678,701 2,274 326 Catron 3,578 47 37 Chaves 64,689 224 38 Cibola 26,746 50 -27 Colfax 12,110 67 32 Curry 49,437 140 -2 De Baca 1,781 23 18 Doña Ana 217,522 471 -153 Eddy 57,900 176 10 Grant 27,346 92 14 Guadalupe 4,341 17 5 Harding 655 8 6 Hidalgo 4,240 22 10 Lea 69,611 177 -23 Lincoln 19,556 103 47 Los Alamos 19,101 159 104 Luna 23,963 44 -25 McKinley 72,290 221 14 Mora 4,506 5 -8 Otero 66,781 134 -58 Quay 8,253 35 11 Rio Arriba 39,006 116 4 Roosevelt 18,743 77 23 San Juan 125,043 390 31 San Miguel 27,591 42 -37 Sandoval 145,179 449 32 Santa Fe 150,056 490 59 Sierra 10,968 38 7 Socorro 16,735 36 -12 Taos 32,835 126 32 Torrance 15,591 52 7 Union 4,118 24 12 Valencia 76,456 172 -47
STATE TOTAL 2,095,428 6,501 487

New Mexico Health Care Workforce Committee Report, 2019 129
Appendix C
Press Release Enumerating RN Job Openings
Continued on next page
130 New Mexico Health Care Workforce Committee Report, 2019

New Mexico Health Care Workforce Committee Report, 2019 131
Appendix D.
Additional Practice Details for New Mexico Behavioral Health Providers

132 New Mexico Health Care Workforce Committee Report, 2019
Table D.1. Proportion of Behavioral Health Care Providers Surveyed by Large License Category and License Type
License Type Surveyed Not Surveyed Total Prescribers
Prescribing Psychologist 27 (71.1%)
11 (28.9%) 38
CNP/CNS 118 (100.0%)
0 (0.0%) 118
All Psychiatristsa 277 (87.4%)
40 (112.6%) 317
Child & Adolescent Psychiatristb 13 (72.2%)
5 (27.8%) 18
TOTAL 417
(89.1%) 51
(10.8%) 473
Independently Licensed Psychotherapy Providers
Non-Prescribing Psychologist 324 (55.8%)
257 (44.2%) 581
Counselor 639 (30.2%)
1,477 (69.8%) 2,116
Social Worker 622 (30.7%)
1,404 (69.3%) 2,026
TOTAL 1,585
(33.6%) 3,138
(66.4%) 4,723
Non-Independently Licensed Psychotherapy Providers
Psychologist 4 (50.0%)
4 (50.0%) 8
Counselor 241 (23.7%)
774 (76.3%) 1,015
Social Worker 1,109 (45.4%)
1,332 (54.6%) 2,441
TOTAL 1,354
(39.1%) 2,110
(60.9%) 3,464
Substance Use Clinicians
Independent License 121 (25.6%)
351 (74.4%) 472
Non-Independent License 52 (17.4%)
247 (82.6%) 299
TOTAL 173
(22.4%) 598
(77.6%) 771
TOTAL 3,529 (37.4%)
5,897 (62.5%) 9,431
a This row includes 306 MDs and 11 DOs. b This row is included in the “All Psychiatrists” row.

New Mexico Health Care Workforce Committee Report, 2019 133
Table D.2. Ratio of Behavioral Health Care Providers-to-Population by Large License Category and County
County Prescribers Independently
Licensed Psychotherapy
Providers
Non-Independently
Licensed Psychotherapy
Providers
Substance Use
Treatment Providers
County Total
Bernalillo 0.34 3.07 1.98 0.34 5.73 Catron 0.00 0.84 0.00 0.28 1.12 Chaves 0.14 1.00 1.48 0.42 3.05 Cibola 0.07 1.23 1.01 0.82 3.14 Colfax 0.08 1.98 0.91 0.25 3.22 Curry 0.08 1.34 1.25 0.06 2.73 De Baca 0.00 0.00 1.12 1.12 2.25 Doña Ana 0.26 1.83 1.89 0.25 4.23 Eddy 0.09 0.52 0.83 0.14 1.57 Grant 0.22 2.60 2.30 0.66 5.78 Guadalupe 0.00 1.38 0.92 1.38 3.69 Harding 0.00 0.00 0.00 0.00 0.00 Hidalgo 0.00 0.24 0.94 0.47 1.65 Lea 0.06 0.62 0.86 0.45 1.98 Lincoln 0.05 1.69 1.18 0.31 3.22 Los Alamos 0.16 2.09 0.94 0.10 3.30 Luna 0.04 0.46 1.29 0.04 1.84 McKinley 0.07 0.93 0.65 0.57 2.21 Mora 0.00 0.44 1.55 0.22 2.22 Otero 0.16 1.05 0.96 0.19 2.37 Quay 0.12 0.73 1.70 0.24 2.79 Rio Arriba 0.03 1.51 1.15 0.82 3.51 Roosevelt 0.11 1.23 1.28 0.11 2.72 San Juan 0.13 0.96 1.12 0.61 2.82 San Miguel 0.51 2.86 4.46 0.25 8.08 Sandoval 0.13 2.11 1.43 0.36 4.02 Santa Fe 0.43 5.32 2.57 0.39 8.72 Sierra 0.09 1.28 1.37 0.18 2.92 Socorro 0.00 1.37 0.90 0.42 2.69 Taos 0.09 4.39 2.28 0.79 7.55 Torrance 0.06 1.41 0.32 0.19 1.99 Union 0.00 0.49 1.46 1.70 3.64 Valencia 0.10 1.02 1.11 0.35 2.59
TOTAL 0.23 2.25 1.65 0.37 4.50
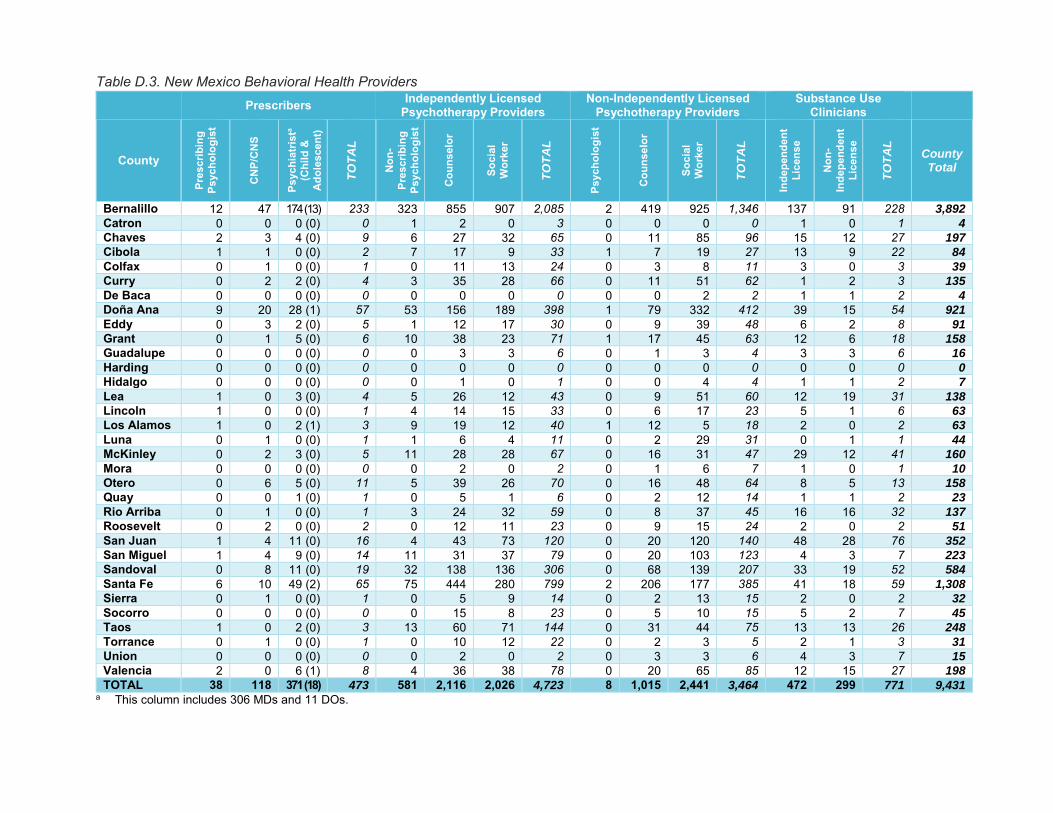
Table D.3. New Mexico Behavioral Health Providers Prescribers Independently Licensed
Psychotherapy Providers Non-Independently Licensed
Psychotherapy Providers Substance Use
Clinicians
County
Pres
crib
ing
Psyc
holo
gist
CNP
/CN
S
Psyc
hiat
rista
(Chi
ld &
A
dole
scen
t)
TO
TA
L
Non
-Pr
escr
ibin
g Ps
ycho
logi
st
Cou
nsel
or
Soci
al
Wor
ker
TO
TA
L
Psyc
holo
gist
Cou
nsel
or
Soci
al
Wor
ker
TO
TA
L
Inde
pend
ent
Lice
nse
Non
-In
depe
nden
t Li
cens
e
TO
TA
L
County Total
Bernalillo 12 47 174 (13) 233 323 855 907 2,085 2 419 925 1,346 137 91 228 3,892
Catron 0 0 0 (0) 0 1 2 0 3 0 0 0 0 1 0 1 4
Chaves 2 3 4 (0) 9 6 27 32 65 0 11 85 96 15 12 27 197
Cibola 1 1 0 (0) 2 7 17 9 33 1 7 19 27 13 9 22 84
Colfax 0 1 0 (0) 1 0 11 13 24 0 3 8 11 3 0 3 39
Curry 0 2 2 (0) 4 3 35 28 66 0 11 51 62 1 2 3 135
De Baca 0 0 0 (0) 0 0 0 0 0 0 0 2 2 1 1 2 4
Doña Ana 9 20 28 (1) 57 53 156 189 398 1 79 332 412 39 15 54 921
Eddy 0 3 2 (0) 5 1 12 17 30 0 9 39 48 6 2 8 91
Grant 0 1 5 (0) 6 10 38 23 71 1 17 45 63 12 6 18 158
Guadalupe 0 0 0 (0) 0 0 3 3 6 0 1 3 4 3 3 6 16
Harding 0 0 0 (0) 0 0 0 0 0 0 0 0 0 0 0 0 0
Hidalgo 0 0 0 (0) 0 0 1 0 1 0 0 4 4 1 1 2 7
Lea 1 0 3 (0) 4 5 26 12 43 0 9 51 60 12 19 31 138
Lincoln 1 0 0 (0) 1 4 14 15 33 0 6 17 23 5 1 6 63
Los Alamos 1 0 2 (1) 3 9 19 12 40 1 12 5 18 2 0 2 63
Luna 0 1 0 (0) 1 1 6 4 11 0 2 29 31 0 1 1 44
McKinley 0 2 3 (0) 5 11 28 28 67 0 16 31 47 29 12 41 160
Mora 0 0 0 (0) 0 0 2 0 2 0 1 6 7 1 0 1 10
Otero 0 6 5 (0) 11 5 39 26 70 0 16 48 64 8 5 13 158
Quay 0 0 1 (0) 1 0 5 1 6 0 2 12 14 1 1 2 23
Rio Arriba 0 1 0 (0) 1 3 24 32 59 0 8 37 45 16 16 32 137
Roosevelt 0 2 0 (0) 2 0 12 11 23 0 9 15 24 2 0 2 51
San Juan 1 4 11 (0) 16 4 43 73 120 0 20 120 140 48 28 76 352
San Miguel 1 4 9 (0) 14 11 31 37 79 0 20 103 123 4 3 7 223
Sandoval 0 8 11 (0) 19 32 138 136 306 0 68 139 207 33 19 52 584
Santa Fe 6 10 49 (2) 65 75 444 280 799 2 206 177 385 41 18 59 1,308
Sierra 0 1 0 (0) 1 0 5 9 14 0 2 13 15 2 0 2 32
Socorro 0 0 0 (0) 0 0 15 8 23 0 5 10 15 5 2 7 45
Taos 1 0 2 (0) 3 13 60 71 144 0 31 44 75 13 13 26 248
Torrance 0 1 0 (0) 1 0 10 12 22 0 2 3 5 2 1 3 31
Union 0 0 0 (0) 0 0 2 0 2 0 3 3 6 4 3 7 15
Valencia 2 0 6 (1) 8 4 36 38 78 0 20 65 85 12 15 27 198
TOTAL 38 118 371 (18) 473 581 2,116 2,026 4,723 8 1,015 2,441 3,464 472 299 771 9,431 a This column includes 306 MDs and 11 DOs.
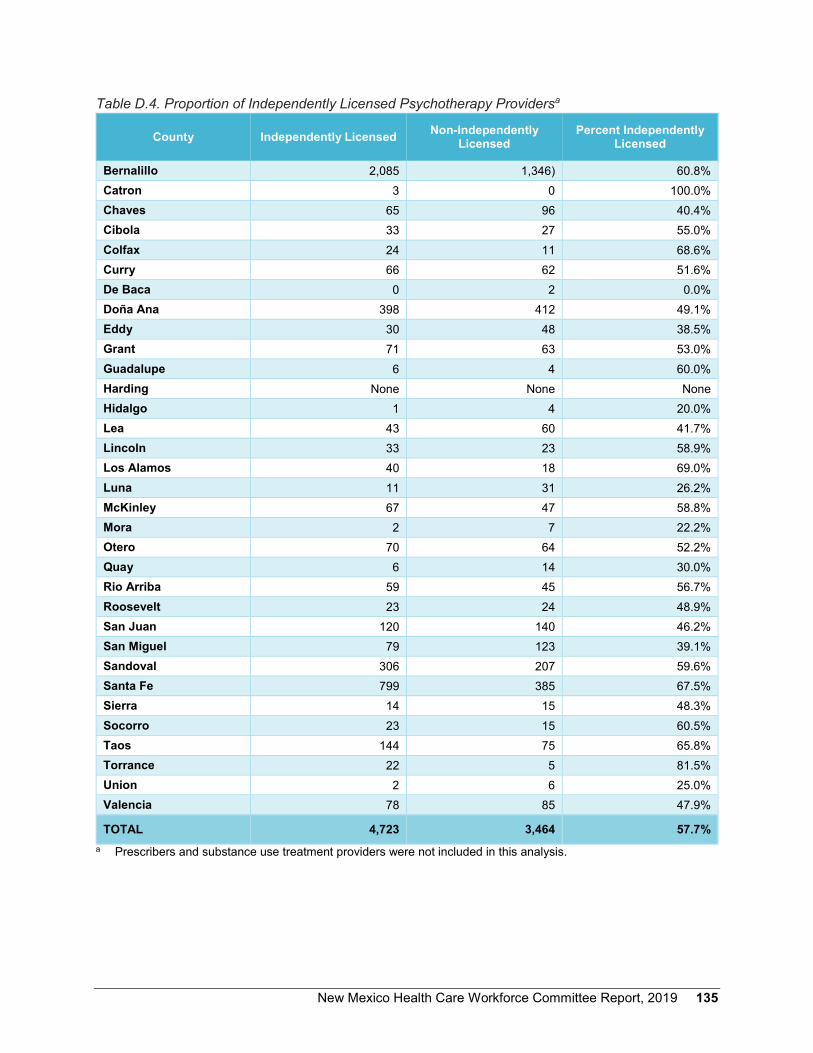
New Mexico Health Care Workforce Committee Report, 2019 135
Table D.4. Proportion of Independently Licensed Psychotherapy Providersa
County Independently Licensed Non-Independently Licensed
Percent Independently Licensed
Bernalillo 2,085 1,346) 60.8% Catron 3 0 100.0% Chaves 65 96 40.4% Cibola 33 27 55.0% Colfax 24 11 68.6% Curry 66 62 51.6% De Baca 0 2 0.0% Doña Ana 398 412 49.1% Eddy 30 48 38.5% Grant 71 63 53.0% Guadalupe 6 4 60.0% Harding None None None Hidalgo 1 4 20.0% Lea 43 60 41.7% Lincoln 33 23 58.9% Los Alamos 40 18 69.0% Luna 11 31 26.2% McKinley 67 47 58.8% Mora 2 7 22.2% Otero 70 64 52.2% Quay 6 14 30.0% Rio Arriba 59 45 56.7% Roosevelt 23 24 48.9% San Juan 120 140 46.2% San Miguel 79 123 39.1% Sandoval 306 207 59.6% Santa Fe 799 385 67.5% Sierra 14 15 48.3% Socorro 23 15 60.5% Taos 144 75 65.8% Torrance 22 5 81.5% Union 2 6 25.0% Valencia 78 85 47.9%
TOTAL 4,723 3,464 57.7% a Prescribers and substance use treatment providers were not included in this analysis.

136 New Mexico Health Care Workforce Committee Report, 2019

New Mexico Health Care Workforce Committee Report, 2019 137
Appendix E.
Survey Collection Progress, 2010 – 2018
Table E.1 depicts the state’s progress in obtaining survey data for licensed health professionals. Survey data for physicians is not collected up to a year after they obtain their license. The New Mexico Medical Board requires physicians to renew their license in the following renewal cycle after a license is issued, at which time they are required to submit a survey. After the initial renewal, they are required to renew every three years.
The New Mexico Nursing Board was the first board to implement survey collection upon licensure, and the board requires completion of a survey at the time of initial licensure in order to collect demographic data. Similarly, emergency medical technicians complete a survey at initial licensure and subsequent license renewals. As a result, all licensed nursing professionals and EMTs in the state have completed a licensure survey and are not included in Table E.1.
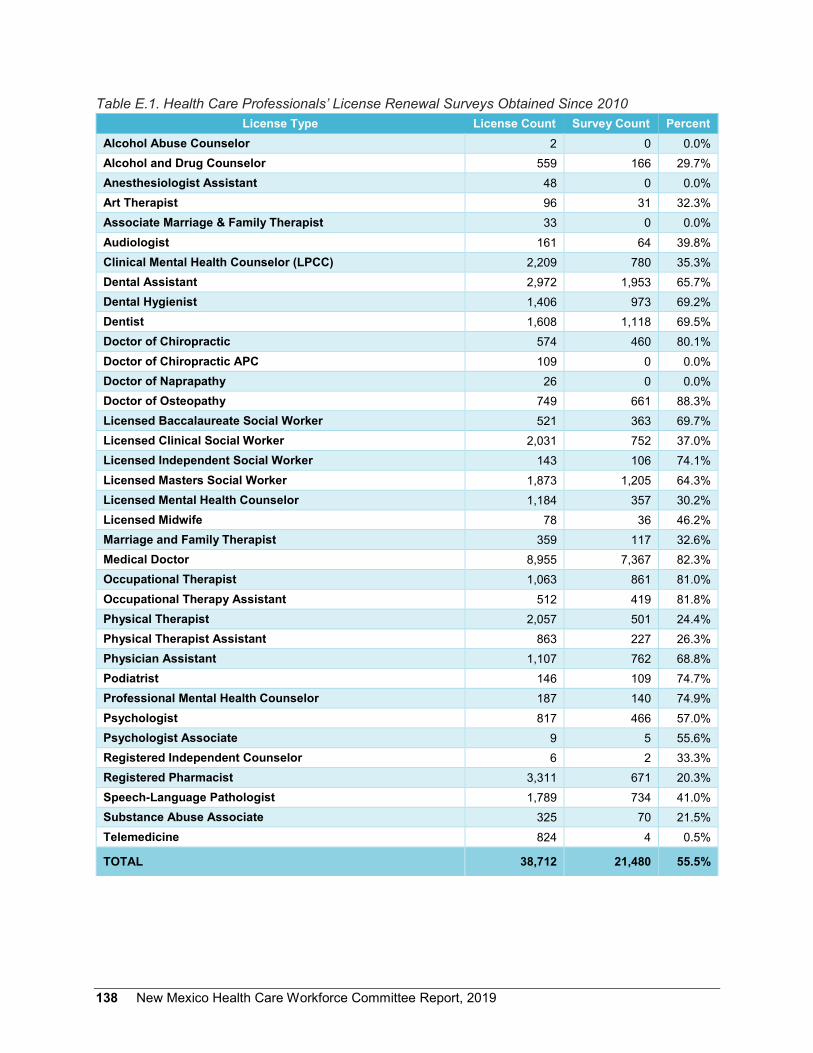
138 New Mexico Health Care Workforce Committee Report, 2019
Table E.1. Health Care Professionals’ License Renewal Surveys Obtained Since 2010
License Type License Count Survey Count Percent Alcohol Abuse Counselor 2 0 0.0% Alcohol and Drug Counselor 559 166 29.7% Anesthesiologist Assistant 48 0 0.0% Art Therapist 96 31 32.3% Associate Marriage & Family Therapist 33 0 0.0% Audiologist 161 64 39.8% Clinical Mental Health Counselor (LPCC) 2,209 780 35.3% Dental Assistant 2,972 1,953 65.7% Dental Hygienist 1,406 973 69.2% Dentist 1,608 1,118 69.5% Doctor of Chiropractic 574 460 80.1% Doctor of Chiropractic APC 109 0 0.0% Doctor of Naprapathy 26 0 0.0% Doctor of Osteopathy 749 661 88.3% Licensed Baccalaureate Social Worker 521 363 69.7% Licensed Clinical Social Worker 2,031 752 37.0% Licensed Independent Social Worker 143 106 74.1% Licensed Masters Social Worker 1,873 1,205 64.3% Licensed Mental Health Counselor 1,184 357 30.2% Licensed Midwife 78 36 46.2% Marriage and Family Therapist 359 117 32.6% Medical Doctor 8,955 7,367 82.3% Occupational Therapist 1,063 861 81.0% Occupational Therapy Assistant 512 419 81.8% Physical Therapist 2,057 501 24.4% Physical Therapist Assistant 863 227 26.3% Physician Assistant 1,107 762 68.8% Podiatrist 146 109 74.7% Professional Mental Health Counselor 187 140 74.9% Psychologist 817 466 57.0% Psychologist Associate 9 5 55.6% Registered Independent Counselor 6 2 33.3% Registered Pharmacist 3,311 671 20.3% Speech-Language Pathologist 1,789 734 41.0% Substance Abuse Associate 325 70 21.5% Telemedicine 824 4 0.5%
TOTAL 38,712 21,480 55.5%

New Mexico Health Care Workforce Committee Report, 2019 139
Appendix F.
Members of the New Mexico Health Care Workforce Committee, October 1, 2019
Name Organization
Richard Larson, Chair University of New Mexico Health Sciences Center Pamela Blackwell NM Hospital Association Caroline Bonham UNM HSC, Representing the Behavioral Health Subcommittee Albert Bourbon NM Medical Board and NM Academy of Physician Assistants William Duran NM Board of Nursing Doris Fields NM NAACP Tomas Granados NM Board of Psychologist Examiners Jerry Harrison NM Health Resources Ellen Interlandi NM Organization of Nurse Leaders Wayne Lindstrom NM Division of Behavioral Services Timothy Lopez NM Department of Health Steve Lucero NM Hispanic Medical Society Cheranne McCracken NM Board of Pharmacy Michael Moxey NM Dental Association Matthew Probst NM Academy of Physician Assistants Joseph Sanchez UNM College of Nursing Darren Shafer Presbyterian Medical Systems James Spence NM Medical Board Eugene Sun Blue Cross Blue Shield of NM Leonard Thomas U.S. Indian Health Service Dale Tinker NM Pharmacists Association Deborah Walker NM Nurses Association Barbara Webber Health Action NM Sandra Whisler NM Medical Society
Staff Megan Bateman UNM Health Sciences Center Amy Farnbach Pearson UNM Health Sciences Center Michael Haederle UNM Health Sciences Center Jessica Reno UNM Health Sciences Center

140 New Mexico Health Care Workforce Committee Report, 2019
Suggested citation: Farnbach Pearson AW, Reno JR, New Mexico Health Care Workforce Committee. 2018 Annual Report. Albuquerque NM: University of New Mexico Health Sciences Center, 2018.