new mexico dwi report 2013tru.unm.edu/crash-reports/dwi-reports/2013-dwi-report.pdfnew mexico dwi...
TRANSCRIPT

New Mexico DWI Report
2013
New Mexico Department of Transportation
Traffic Safety and Planning Divisions

ii
New Mexico Department of Transportation
Traffic Safety and Planning Divisions
P.O. Box 1149
Santa Fe, New Mexico 87504-1149
(505) 827-0427
dot.state.nm.us
Published September 2015
Available online at
tru.unm.edu
Produced for the New Mexico Department of Transportation
Traffic Safety and Planning Divisions
under Contracts C05685 and C5801
Produced by the University of New Mexico Geospatial and Population Studies (GPS)
Traffic Research Unit (TRU)
(Formerly the UNM Division of Government Research)
Distributed in compliance with New Mexico Statute 66-7-214
as a reference source regarding New Mexico traffic crashes

iii
Acknowledgements
The NMDOT Traffic Safety Division (TSD) would like to thank New Mexico’s law
enforcement agencies, state and local traffic safety officials, NMDOT Traffic Records
Program staff, NMDOT contractors, and other partner organizations for their support of
TSD programs and initiatives. Their work is central to our success in reducing alcohol-
involved crashes on New Mexico’s public roadways.
This report was produced for the NMDOT Traffic Safety and Planning Divisions under
contracts C05685 and C5801 by the University of New Mexico Geospatial and Population
Studies (GPS) Traffic Research Unit (TRU), Dr. Adélamar N. Alcántara, director. The editor
was Jessica Bloom, with maps provided by David Jacobs. Other GPS-TRU personnel who
assisted in creating this report were Maurreen Skowran and Mary Spey. GPS-TRU would like
to thank Michael Sandoval, director of the NMDOT Traffic Safety and Planning Divisions,
and all NMDOT Traffic Records Program staff, Santiago J. Montoya, Traffic Records staff
manager. Photographs are by Jake Schoellkopf, NMDOT photographer.

Table of Contents
iv
TABLE OF CONTENTS .......................................................................................................................... iv
LIST OF TABLES ..................................................................................................................................... vi
LIST OF FIGURES ................................................................................................................................... ix
LIST OF MAPS ........................................................................................................................................... x
DEFINITIONS .......................................................................................................................................... xi
2013 HIGHLIGHTS ................................................................................................................................. 1
Summary of Alcohol-involved Crashes, 2013 .................................................................................2
Summary of Alcohol-involved Fatalities and Injuries, 2013 ............................................................4
ALCOHOL-INVOLVED CRASH GEOGRAPHY ................................................................................... 6
Counties .................................................................................................................................... 12
Cities ......................................................................................................................................... 16
Rural and Urban Alcohol-involved Crashes .................................................................................. 18
CRASH CHARACTERISTICS ............................................................................................................... 20
Month, Day of Week, and Hour .................................................................................................. 20
Crash Classification .................................................................................................................... 24
Vehicles ..................................................................................................................................... 26
DEMOGRAPHICS ................................................................................................................................... 28
Age and Sex ............................................................................................................................... 28
Teens (15-19) ............................................................................................................................. 32
Young Adults (20-24) .................................................................................................................. 36
Motorcyclists ............................................................................................................................. 40
Pedestrians ................................................................................................................................ 44
Pedalcyclists (Bicyclists) ............................................................................................................. 48
Table of Contents
Table of Contents
v
Alcohol-involved Drivers ............................................................................................................ 52
Seat Position and Victims ........................................................................................................... 56
Belt Usage ................................................................................................................................. 57
DWI ENFORCEMENT ........................................................................................................................... 58
Arrests ....................................................................................................................................... 58
Convictions ................................................................................................................................ 62
Court Dispositions ...................................................................................................................... 69
Blood Alcohol Content (BAC) ...................................................................................................... 70
RATES ...................................................................................................................................................... 71
ECONOMIC IMPACT ............................................................................................................................. 75
SOURCES ................................................................................................................................................. 76
INDEX ....................................................................................................................................................... 78

List of Tables
vi
Table 1: Alcohol-involved Crashes, 2013 ......................................................................................................................... 2
Table 2: Alcohol-involved Crashes, 2004 - 2013 ............................................................................................................ 2
Table 3: Alcohol-involved Fatal Crashes, 2004 - 2013 ................................................................................................. 2
Table 4: Alcohol-involved Crashes by Crash Severity, 2004 - 2013 ........................................................................ 3
Table 5: People in Alcohol-involved Crashes by Severity of Injury, 2004 - 2013 .............................................. 4
Table 6: People Injured in Alcohol-involved Crashes by Type of Injury, 2004 - 2013 .................................... 5
Table 7: Alcohol-involved Crashes by County, 2009 - 2013 .................................................................................... 12
Table 8: Top Ten Counties for Alcohol-involved Crashes, 2009 - 2013 ............................................................. 13
Table 9: Alcohol-involved Fatal Crashes by County, 2009 - 2013......................................................................... 14
Table 10: Top Ten Counties for Alcohol-involved Fatal Crashes, 2009 - 2013 ................................................ 15
Table 11: Top Twenty Cities for Alcohol-involved Crashes, 2009 - 2013 .......................................................... 16
Table 12: Top-Ranking Cities for Alcohol-involved Fatal Crash Rates, 2009 - 2013 ..................................... 17
Table 13: Alcohol-involved Crashes and Number of People in Alcohol-involved Crashes by
Road System, 2013 ...................................................................................................................................................... 18
Table 14: Alcohol-involved Injury Crashes and Number of People Injured by Road System, 2013 ........ 18
Table 15: Alcohol-involved Fatal Crashes and Number of People Killed by Road System, 2013 ............. 18
Table 16: Alcohol-involved Crashes and Fatalities by Crash Classification and Road System, 2013 ..... 19
Table 17: Alcohol-involved Crashes by Light Condition and Road System, 2013........................................... 19
Table 18: Alcohol-involved Crashes by Month and Crash Severity, 2013 ......................................................... 20
Table 19: Alcohol-involved Crashes by Day of the Week and Crash Severity, 2013 ...................................... 21
Table 20: Alcohol-involved Crashes by Day of the Week and Three-hour Segments, 2013 ....................... 22
Table 21: Alcohol-involved Crashes by Hour and Day of the Week, 2013 ........................................................ 23
Table 22: Alcohol-involved Crashes by Crash Classification, 2009 - 2013 ........................................................ 24
Table 23: Alcohol-involved Crashes by Crash Classification and Crash Severity, 2013 ............................... 25
Table 24: Alcohol-involved Crashes by Number of Vehicles Involved and Crash Severity, 2013............. 26
Table 25: Uninsured and Insured Alcohol-involved Drivers in Crashes by Vehicle Type, 2013 .............. 26
Table 26: Alcohol-involved Drivers in Crashes by Vehicle Type and Crash Severity, 2013 ....................... 27
Table 27: Alcohol-involved Drivers in Crashes by Vehicle Type and Severity of Injury, 2013 ................. 27
Table 28: People in Alcohol-involved Crashes by Age, 2009 - 2013 .................................................................... 28
Table 29: People in Alcohol-involved Crashes by Age and Sex, 2013 ................................................................. 29
Table 30: Fatalities in Alcohol-involved Crashes by Age and Sex, 2013 ............................................................ 30
Table 31: People in Alcohol-involved Crashes by Age and Severity of Injury, 2013 ..................................... 31
Table 32: Teens (15-19) in Alcohol-involved Crashes by Severity of Injury, 2013........................................ 32
Table 33: Alcohol-involved Teen Drivers (15-19) in Crashes by Crash Severity, 2004 - 2013 .................. 33
Table 34: Alcohol-involved Teen Drivers (15-19) in Crashes by Sex, 2004 - 2013 ........................................ 34
List of Tables

List of Tables
vii
Table 35: Alcohol-involved Teen Drivers (15-19) in Crashes by Hour, 2013 .................................................. 35
Table 36: Young Adults (20-24) in Alcohol-involved Crashes by Severity of Injury, 2013 ......................... 36
Table 37: Alcohol-involved Young Adult Drivers (20-24) in Crashes by Severity, 2004 - 2013 ............... 37
Table 38: Alcohol-involved Young Adult Drivers (20-24) in Crashes by Sex, 2004 - 2013 ......................... 38
Table 39: Alcohol-involved Young Adult Drivers (20-24) by Hour, 2013 ......................................................... 39
Table 40: Alcohol-involved Motorcycle Crashes, 2013 ............................................................................................ 40
Table 41: Alcohol-involved Motorcycle Crashes by Crash Severity, 2013 ........................................................ 40
Table 42: Alcohol-involved Motorcycle Crashes, 2004 - 2013............................................................................... 41
Table 43: Top Five Counties for Alcohol-involved Motorcycle Crashes, 2009 - 2013 ................................... 41
Table 44: Alcohol-involved Motorcycle Driver Crash Rates, 2009 - 2013 ......................................................... 42
Table 45: Alcohol-involved Motorcycle Drivers in Crashes by Age and Sex, 2013 ........................................ 43
Table 46: Alcohol-involved Pedestrian Crashes, 2013 ............................................................................................. 44
Table 47: Alcohol-involved Pedestrian Crashes by Crash Severity, 2013 ......................................................... 44
Table 48: Alcohol-involved Pedestrian Crashes, 2004 - 2013 ............................................................................... 45
Table 49: Top Five Counties for Alcohol-involved Pedestrian Crashes, 2009 - 2013 ................................... 46
Table 50: Alcohol-involved Pedestrians in Alcohol-involved Crashes, 2009 - 2013 ..................................... 46
Table 51: Alcohol-involved Pedestrians in Crashes by Age, 2013 ....................................................................... 47
Table 52: Alcohol-involved Pedalcycle Crashes, 2013 ............................................................................................. 48
Table 53: Alcohol-involved Pedalcycle Crashes by Crash Severity, 2013 ......................................................... 48
Table 54: Alcohol-involved Pedalcycle Crashes, 2004 - 2013................................................................................ 49
Table 55: Top-Ranking Counties for Alcohol-involved Pedalcycle Crashes, 2009 - 2013 ........................... 50
Table 56: Alcohol-involved Pedalcyclists in Alcohol-involved Crashes, 2009 - 2013 ................................... 50
Table 57: Alcohol-involved Pedalcyclists in Crashes by Age and Sex, 2013 ..................................................... 51
Table 58: Alcohol-involved Drivers in Crashes by Sex, 2013 ................................................................................. 52
Table 59: Alcohol-involved Drivers in Crashes by License Type and Residence, 2013 ................................ 52
Table 60: Alcohol-involved Drivers in Crashes by Age and Sex, 2013 ................................................................ 54
Table 61: Alcohol-involved Drivers in Crashes by Age Group, 2004 - 2013 ..................................................... 55
Table 62: People in Alcohol-involved Crashes by Sex and Seat Position, 2013............................................... 56
Table 63: Victims of Alcohol-involved Crashes, 2013 ............................................................................................... 56
Table 64: Unbelted Fatalities in Alcohol-involved Crashes by Age and Sex, 2013 ......................................... 57
Table 65: DWI Arrests by County, 2009 - 2013 ........................................................................................................... 58
Table 66: DWI Arrests by City, 2009 - 2013 .................................................................................................................. 59
Table 67: DWI Arrests by Age and Sex, 2013 ............................................................................................................... 60
Table 68: Number of Drivers Arrested for a DWI, 2009 - 2013 ............................................................................. 61
Table 69: DWI Convictions by County, 2009 - 2013................................................................................................... 62
Table 70: Top Ten Counties for DWI Convictions, 2009 - 2013 ............................................................................ 63
Table 71: Number of Drivers with a First DWI Conviction, 2009 - 2013 ........................................................... 64
Table 72: First DWI Convictions by Age and Sex, 2013 ............................................................................................ 65

List of Tables
viii
Table 73: Repeat DWI Convictions by County, 2009 - 2013.................................................................................... 66
Table 74: Drivers Convicted of a Repeat DWI by Age, 2009 - 2013 ..................................................................... 67
Table 75: Repeat DWI Convictions by Age and Sex, 2013 ........................................................................................ 68
Table 76: Disposition of DWI Arrests by County, as of July 2014 ......................................................................... 69
Table 77: Rate Denominators: Population, Vehicle Miles Traveled, Licensed Drivers, and
Motor Vehicle Registrations, 2004 - 2013 .......................................................................................................... 71
Table 78: Alcohol-involved Crash Rates, 2004 - 2013 .............................................................................................. 72
Table 79: Alcohol-involved Fatal Crash Rates, 2004 - 2013 ................................................................................... 73
Table 80: Alcohol-involved Fatality Rates, 2004 - 2013 .......................................................................................... 74
Table 81: Human Capital Cost Estimates for Alcohol-involved Crashes, 2013 Adjusted ............................. 75
Table 82: Comprehensive Cost Estimates for Alcohol-involved Crashes, 2013 Adjusted ........................... 75
List of Figures
ix
Figure 1: Total Fatal Crashes and Alcohol-involved Fatal Crashes, 2004 - 2013 ............................................... 2
Figure 2: Alcohol-involved Total and Fatal Crashes, 2004 - 2013 ........................................................................... 3
Figure 3: People in Alcohol-involved Crashes by Severity of Injury, 2004 - 2013 ............................................ 4
Figure 4: People Injured in Alcohol-involved Crashes by Type of Injury, 2004 - 2013 ................................... 5
Figure 5: Percentage of Alcohol-involved Crashes by Month, 2013 .................................................................... 20
Figure 6: Percentage of Alcohol-involved Crashes by Day of the Week, 2013 ................................................. 21
Figure 7: Percentage of Alcohol-involved Crashes by Three-hour Segments, 2013 ...................................... 22
Figure 8: Alcohol-involved Crashes by Hour, 2013 .................................................................................................... 23
Figure 9: Alcohol-involved Crashes by Crash Classification, 2013 ...................................................................... 25
Figure 10: People in Alcohol-involved Crashes by Age and Sex, 2013 ................................................................ 29
Figure 11: Fatalities in Alcohol-involved Crashes by Age and Sex, 2013 ........................................................... 30
Figure 12: Percentage of People in Alcohol-involved Crashes by Age Group, 2013 ...................................... 31
Figure 13: Alcohol-involved Teen Drivers (15-19) in Crashes, 2004 - 2013 .................................................... 33
Figure 14: Alcohol-involved Teen Drivers (15-19) in Crashes by Sex, 2004 - 2013 ...................................... 34
Figure 15: Alcohol-involved Young Adult Drivers (20-24) in Crashes, 2004 - 2013 ..................................... 37
Figure 16: Alcohol-involved Young Adult Drivers (20-24) in Crashes by Sex, 2004 - 2013 ....................... 38
Figure 17: Percentage of Alcohol-involved Motorcycle Drivers in Crashes by Age Group, 2013 ............. 42
Figure 18: Alcohol-involved Motorcycle Drivers in Crashes by Age and Sex, 2013 ....................................... 43
Figure 19: Alcohol-involved Pedestrian Crashes, 2004 - 2013 ............................................................................. 45
Figure 20: Percentage of Alcohol-involved Pedestrians in Crashes by Age, 2013 ......................................... 47
Figure 21: Alcohol-involved Pedalcycle Crashes, 2004 - 2013 .............................................................................. 49
Figure 22: Alcohol-involved Pedalcyclists in Crashes by Age Group, 2013 ...................................................... 51
Figure 23: Percentage and Rate of Alcohol-involved Drivers in Crashes by Age Group, 2013 .................. 53
Figure 24: Alcohol-involved Drivers in Crashes by Age and Sex, 2013 .............................................................. 53
Figure 25: Alcohol-involved Drivers in Crashes by Age Group, 2013 ................................................................. 54
Figure 26: DWI Arrests by Age and Sex, 2013 .............................................................................................................. 60
Figure 27: Number of Drivers Arrested for DWI, 2009 - 2013 .............................................................................. 61
Figure 28: Top Five Counties for DWI Convictions, 2013 ........................................................................................ 63
Figure 29: First DWI Convictions by Age and Sex, 2013 ........................................................................................... 65
Figure 30: Drivers Convicted of a Repeat DWI, 2009 - 2013 .................................................................................. 67
Figure 31: Repeat DWI Convictions by Age and Sex, 2013 ...................................................................................... 68
Figure 32: Range of BAC Test Results from 2013 DWI Arrests .............................................................................. 70
Figure 33: Number of BAC Test Refusals and Percentage of BAC Test Refusals, 2004 - 2013 ................... 70
Figure 34: Alcohol-involved Crash Rates (Population and VMT), 2004 - 2013 ............................................... 72
Figure 35: Alcohol-involved Fatal Crash Rates (Population and VMT), 2004 - 2013 .................................... 73
Figure 36: Alcohol-involved Fatality Rates (Population and VMT), 2004 - 2013 ........................................... 74
List of Figures

List of Maps
x
Map 1: Alcohol-involved Crashes in New Mexico by County, 2013 ......................................................................... 6
Map 2: Location of Alcohol-involved Crashes, 2013 ..................................................................................................... 7
Map 3: Location and Density of Alcohol-involved Crashes in Albuquerque, 2013 ........................................... 8
Map 4: Location and Density of Alcohol-involved Crashes in Las Cruces, 2013 ................................................. 9
Map 5: Location and Density of Alcohol-involved Crashes in Santa Fe, 2013 .................................................. 10
Map 6: Location and Density of Alcohol-involved Crashes in Gallup, 2013 ...................................................... 11
Map 7: Location and Density of Alcohol-involved Crashes in Farmington, 2013 ........................................... 11
List of Maps

Definitions
xi
100M VMT – A measurement of the number of miles traveled annually by motor vehicles.
It is reported in units of 100 million vehicle miles traveled (100M VMT).
Aggravated DWI – A driver arrested for 1) driving with a BAC of 0.16 or higher, 2) driving
under the influence of alcohol or drugs and causing bodily injury to a human being as a
result, or 3) driving under the influence of alcohol or drugs and refusing to submit to a BAC
test at the time of arrest for DWI.
Alcohol-involved Crash – A crash for which the Uniform Crash Report indicated that 1) a
DWI citation was issued, 2) alcohol was a contributing factor, or 3) a person in control of a
vehicle (including a pedestrian or pedalcyclist) was suspected of being under the influence
of alcohol.
Alcohol-involved Driver – A person in control of a vehicle who was cited for DWI or
indicated on the Uniform Crash Report as being either suspected or determined by testing
to be under the influence of alcohol. There can be multiple alcohol-involved drivers in a
single alcohol-involved crash.
BAC – Blood alcohol concentration is expressed in units of grams of alcohol per deciliter of
blood (g/dL).
Crash – A reported incident on a public roadway involving one or more motor vehicles that
resulted in death, personal injury, or at least $500 in property damage. Crashes on private
property (such as a parking lot) are not included.
Driver – A person in control of a motorized vehicle. Pedestrians and pedalcyclists are not
drivers.
DWI – Driving while intoxicated.
DWI Arrest (Citation) – In this report, a DWI arrest (a.k.a. a DWI citation) is a driver
arrested for either DWI or aggravated DWI. New Mexico’s legal limit for presumption of
driving while intoxicated (DWI) is 0.08 for non-commercial drivers older than 21 years of
age, 0.04 for commercial vehicle drivers, and 0.02 for drivers younger than 21 years of age.
Definitions
Definitions
xii
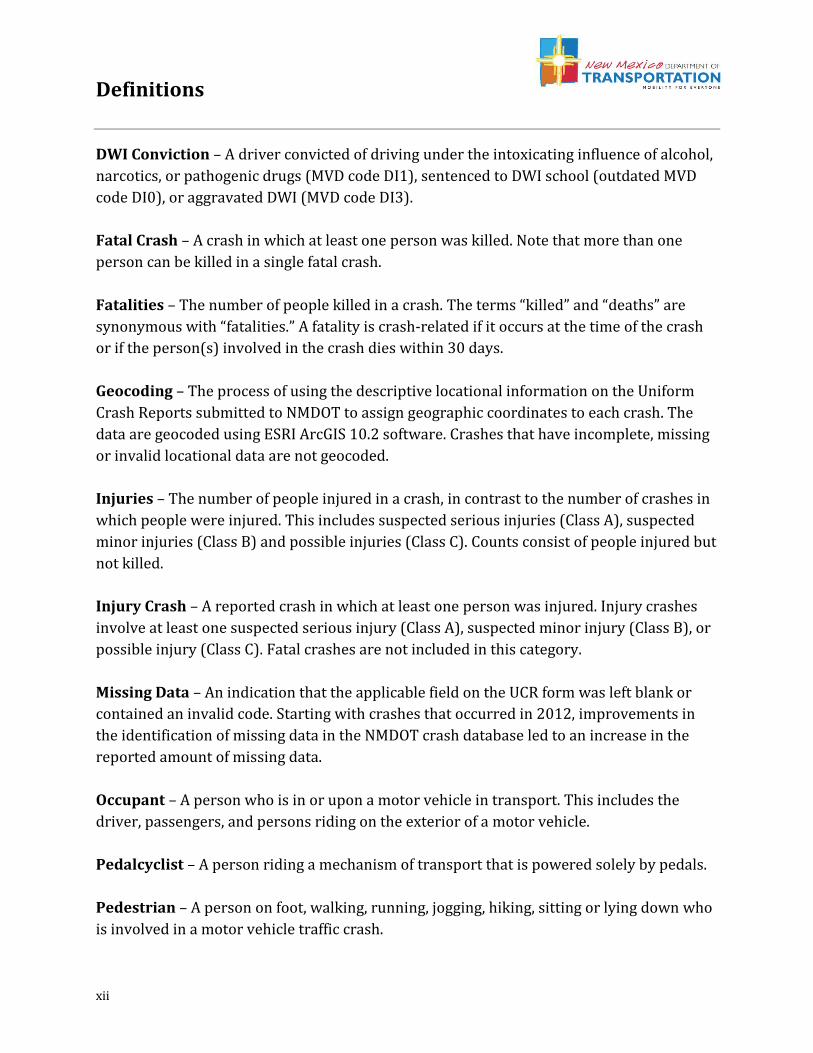
DWI Conviction – A driver convicted of driving under the intoxicating influence of alcohol,
narcotics, or pathogenic drugs (MVD code DI1), sentenced to DWI school (outdated MVD
code DI0), or aggravated DWI (MVD code DI3).
Fatal Crash – A crash in which at least one person was killed. Note that more than one
person can be killed in a single fatal crash.
Fatalities – The number of people killed in a crash. The terms “killed” and “deaths” are
synonymous with “fatalities.” A fatality is crash-related if it occurs at the time of the crash
or if the person(s) involved in the crash dies within 30 days.
Geocoding – The process of using the descriptive locational information on the Uniform
Crash Reports submitted to NMDOT to assign geographic coordinates to each crash. The
data are geocoded using ESRI ArcGIS 10.2 software. Crashes that have incomplete, missing
or invalid locational data are not geocoded.
Injuries – The number of people injured in a crash, in contrast to the number of crashes in
which people were injured. This includes suspected serious injuries (Class A), suspected
minor injuries (Class B) and possible injuries (Class C). Counts consist of people injured but
not killed.
Injury Crash – A reported crash in which at least one person was injured. Injury crashes
involve at least one suspected serious injury (Class A), suspected minor injury (Class B), or
possible injury (Class C). Fatal crashes are not included in this category.
Missing Data – An indication that the applicable field on the UCR form was left blank or
contained an invalid code. Starting with crashes that occurred in 2012, improvements in
the identification of missing data in the NMDOT crash database led to an increase in the
reported amount of missing data.
Occupant – A person who is in or upon a motor vehicle in transport. This includes the
driver, passengers, and persons riding on the exterior of a motor vehicle.
Pedalcyclist – A person riding a mechanism of transport that is powered solely by pedals.
Pedestrian – A person on foot, walking, running, jogging, hiking, sitting or lying down who
is involved in a motor vehicle traffic crash.

Definitions
xiii
Possible Injury – An injury reported or claimed which is not a fatal, suspected serious or
suspected minor injury. Possible injuries are those which are reported by the person or are
indicated by his/her behavior, but no wounds or injuries are readily evident (a.k.a. Class C
injury, “Complaint of Injury”, or “Non-visible Injury”). Examples include momentary loss of
consciousness, claim of injury, limping, or complaint of pain or nausea.
Property Damage Only Crash (PDO) – A reported crash on a public road that did not
involve injuries or fatalities but resulted in more than $500 in property damage only (a.k.a.
a Class O crash).
Rate – A rate is calculated by dividing a total count (such as total crashes, drivers, or
fatalities) by a denominator such as VMT, number of licensed drivers, or population.
Ratio of Males to Females – The number of males for every one female. The ratio of males
to females is calculated by dividing the number of males by the number of females. For
example, five males and two females have a ratio of 2.5 males for every one female.
Rural – Places not classified as urban are classified as rural.
Severity of Injury – The degree of injury to a person in a crash as describe by the KABCO
scale: K is Killed, ABC indicate injuries (A=suspected serious, B=suspected minor,
C=possible), and O indicates no apparent injuries (property damage only).
Suspected Minor Injury – A visible but not serious injury, such as abrasions, bruises and
minor lacerations, as observed by the officer at the scene of the crash. Also known as a
Class B injury or a “Visible Injury”.
Suspected Serious Injury – An injury, other than a fatal injury, in which the person was
carried from the scene of the crash or in which the injured person was unable to walk,
drive or perform normal activities he or she was capable of performing before the injury
occurred, as observed by the officer at the scene of the crash. Also known as a Class A injury
or an “Incapacitating Injury”.
Uniform Crash Report (UCR) – A statewide form, submitted by law enforcement agencies
in the state to the NMDOT, for any crash on a public roadway involving one or more motor
vehicles that resulted in death, personal injury, or at least $500 in property damage.
Urban – In crashes before 2013, “urban” is defined as a town or city with a population of at
least 2,500 people. In 2013, “urban” was redefined to correspond to the 2010 U.S. Census
Definitions
xiv
Urbanized Areas (NMDOT-adjusted) and U.S. Census Urban Clusters. This revised
definition, which is based on population density, allows densely settled areas outside of
incorporated places to be classified as “urban”, and sparsely settled areas within
incorporated boundaries to be classified as “rural”.
Vehicle – A motorized car, truck, bus, van, or motorcycle (mechanically or electrically
powered) for carrying or transporting persons or things. Pedestrians and pedalcyclists are
counted as non-motorized vehicles when in a crash with a motorized vehicle.

2013 Highlights
1
DWI
DWI arrests have decreased every year from 2010 to 2013. (Table 68, Figure 27)
As of July 2014, 53% of DWI arrests in 2013 resulted in convictions, 20% resulted in
dismissals, and 26% were awaiting disposition. (Table 76)
Crashes
There were 7.6 alcohol-involved crashes per 100 million VMT in 2013. (Table 78)
Alcohol-involved fatal crashes decreased to their lowest number (123) in the past ten
years, but made up 45% of all fatal crashes, the most in ten years. (Figure 1, Table 3)
Alcohol-involved crashes fell 41% compared with 2004. (Table 2)
People
The number of total people in alcohol-involved crashes has been reduced by 42% in the
last ten years. (Figure 3, Table 5)
Drivers
From 2004 to 2013, the number of alcohol-involved teen drivers in crashes decreased
71% (313 to 91). (Table 33, Figure 13)
From 2004 to 2013, the number of alcohol-involved young adult drivers in crashes
decreased 29% (546 to 389). (Table 37, Figure 15)
The 20-24 age group had the highest number of alcohol-involved drivers in crashes in
2013. (Table 60)
Gender Groups
Male drivers were 71% of all alcohol-involved drivers in crashes in 2013. (Table 58)
69% of all fatalities in alcohol-involved crashes were male in 2013. (Table 30)
Motorcyclists, Pedestrians and Pedalcyclists
Alcohol was involved in 8% of all motorcycle-involved crashes in 2013. (Table 42)
Out of all pedestrians in alcohol-involved crashes, 92.4% were under the influence of
alcohol. (Table 50)
Out of all pedalcyclists in alcohol-involved crashes, 90.9% were under the influence of
alcohol. (Table 56)
2013 HIGHLIGHTS
2013 Alcohol-involved Crash Summary
2
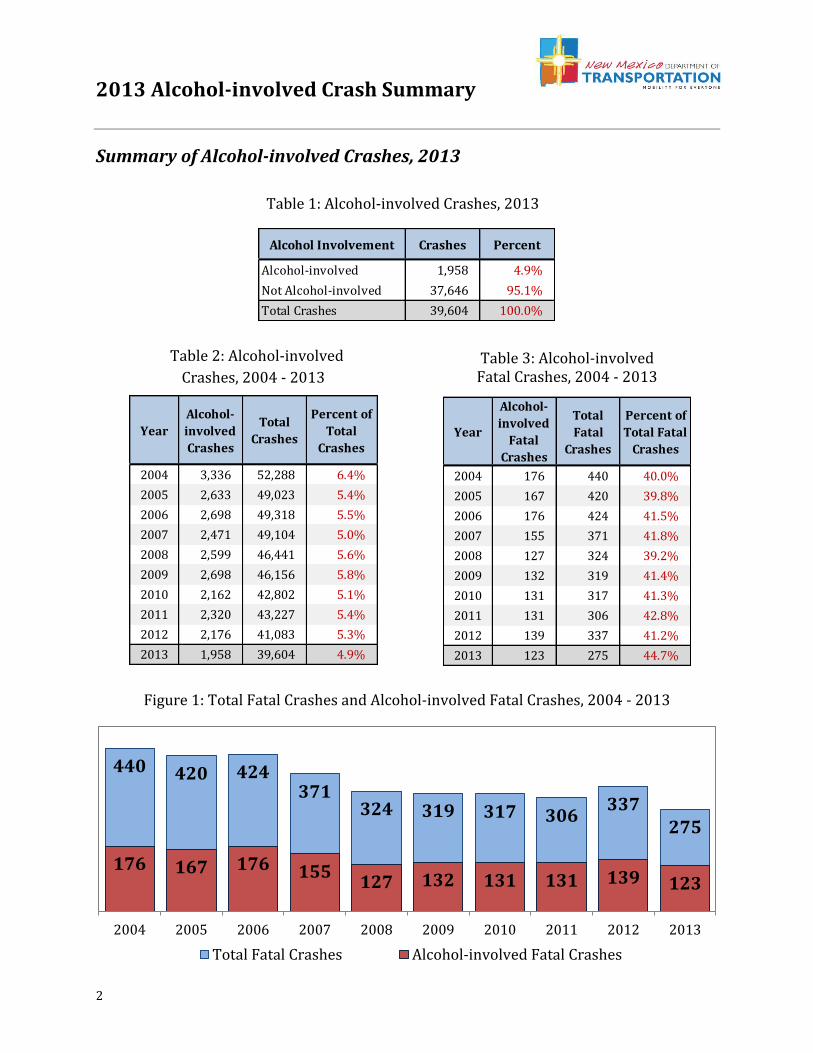
Summary of Alcohol-involved Crashes, 2013
Alcohol Involvement Crashes Percent
Alcohol-involved 1,958 4.9%
Not Alcohol-involved 37,646 95.1%
Total Crashes 39,604 100.0%
440 420 424 371
324 319 317 306 337
275
176 167 176 155 127 132 131 131 139 123
2004 2005 2006 2007 2008 2009 2010 2011 2012 2013
Total Fatal Crashes Alcohol-involved Fatal Crashes
Table 1: Alcohol-involved Crashes, 2013
Table 2: Alcohol-involved
Crashes, 2004 - 2013
Figure 1: Total Fatal Crashes and Alcohol-involved Fatal Crashes, 2004 - 2013
Table 3: Alcohol-involved Fatal Crashes, 2004 - 2013
Year
Alcohol-
involved
Crashes
Total
Crashes
Percent of
Total
Crashes
2004 3,336 52,288 6.4%
2005 2,633 49,023 5.4%
2006 2,698 49,318 5.5%
2007 2,471 49,104 5.0%
2008 2,599 46,441 5.6%
2009 2,698 46,156 5.8%
2010 2,162 42,802 5.1%
2011 2,320 43,227 5.4%
2012 2,176 41,083 5.3%
2013 1,958 39,604 4.9%
Year
Alcohol-
involved
Fatal
Crashes
Total
Fatal
Crashes
Percent of
Total Fatal
Crashes
2004 176 440 40.0%
2005 167 420 39.8%
2006 176 424 41.5%
2007 155 371 41.8%
2008 127 324 39.2%
2009 132 319 41.4%
2010 131 317 41.3%
2011 131 306 42.8%
2012 139 337 41.2%
2013 123 275 44.7%

2013 Alcohol-involved Crash Summary
3
Alcohol-involved crashes in 2013 were less than 5% of all crashes. (Table 2)
Over the last ten years, approximately 40-45% of all fatal crashes involved alcohol.
(Table 3, Figure 1)
Alcohol-involved crashes decreased 10.0% from 2012 to 2013, and were 41.3% lower
compared with 2004. (Table 2, Figure 2, Table 4)
3,336
2,633 2,698 2,471
2,599 2,698
2,162 2,320 2,176
1,958
176 167 176
155
127 132 131 131 139 123
0
40
80
120
160
200
0
1,000
2,000
3,000
4,000
5,000
2004 2005 2006 2007 2008 2009 2010 2011 2012 2013
Alco
ho
l-inv
olv
ed
Fa
tal C
rash
es
Alc
oh
ol-
inv
olv
ed
Cra
she
s
Alcohol-involved Crashes Alcohol-involved Fatal Crashes
Fatal
Crashes
Injury
Crashes
Property Damage
Only Crashes
Total
Crashes
2004 176 1,588 1,572 3,336
2005 167 1,222 1,244 2,633
2006 176 1,192 1,330 2,698
2007 155 1,080 1,236 2,471
2008 127 1,106 1,366 2,599
2009 132 1,143 1,423 2,698
2010 131 939 1,092 2,162
2011 131 1,000 1,189 2,320
2012 139 874 1,163 2,176
2013 123 823 1,012 1,958
Year
Alcohol-involved Crashes
Figure 2: Alcohol-involved Total and Fatal Crashes, 2004 - 2013
Table 4: Alcohol-involved Crashes by Crash Severity, 2004 - 2013
2013 Alcohol-involved Crash Summary
4
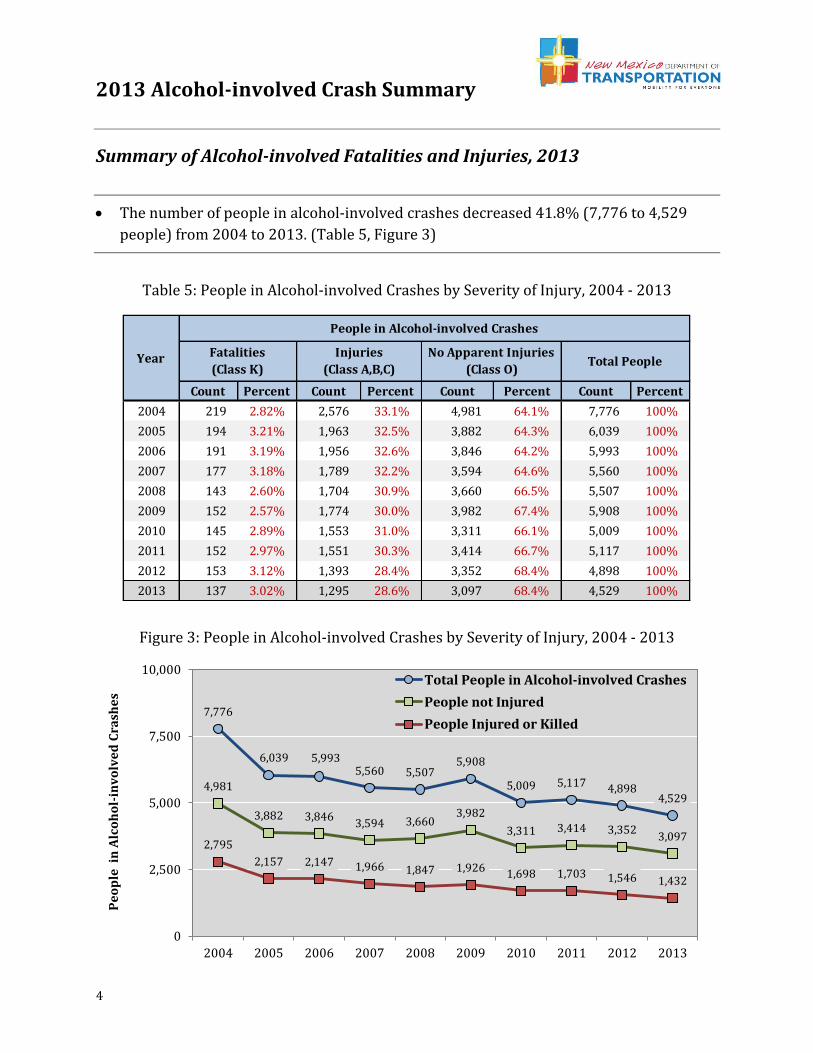
Summary of Alcohol-involved Fatalities and Injuries, 2013
The number of people in alcohol-involved crashes decreased 41.8% (7,776 to 4,529
people) from 2004 to 2013. (Table 5, Figure 3)
Count Percent Count Percent Count Percent Count Percent
2004 219 2.82% 2,576 33.1% 4,981 64.1% 7,776 100%
2005 194 3.21% 1,963 32.5% 3,882 64.3% 6,039 100%
2006 191 3.19% 1,956 32.6% 3,846 64.2% 5,993 100%
2007 177 3.18% 1,789 32.2% 3,594 64.6% 5,560 100%
2008 143 2.60% 1,704 30.9% 3,660 66.5% 5,507 100%
2009 152 2.57% 1,774 30.0% 3,982 67.4% 5,908 100%
2010 145 2.89% 1,553 31.0% 3,311 66.1% 5,009 100%
2011 152 2.97% 1,551 30.3% 3,414 66.7% 5,117 100%
2012 153 3.12% 1,393 28.4% 3,352 68.4% 4,898 100%
2013 137 3.02% 1,295 28.6% 3,097 68.4% 4,529 100%
Year Fatalities
(Class K)
Injuries
(Class A,B,C)
No Apparent Injuries
(Class O)Total People
People in Alcohol-involved Crashes
7,776
6,039 5,993 5,560 5,507
5,908
5,009 5,117 4,898 4,529
4,981
3,882 3,846 3,594 3,660
3,982
3,311 3,414 3,352 3,097
2,795
2,157 2,147 1,966 1,847 1,926 1,698 1,703 1,546 1,432
0
2,500
5,000
7,500
10,000
2004 2005 2006 2007 2008 2009 2010 2011 2012 2013
Pe
op
le i
n A
lco
ho
l-in
vo
lve
d C
rash
es
Total People in Alcohol-involved Crashes
People not Injured
People Injured or Killed
Table 5: People in Alcohol-involved Crashes by Severity of Injury, 2004 - 2013
Figure 3: People in Alcohol-involved Crashes by Severity of Injury, 2004 - 2013

2013 Alcohol-involved Crash Summary
5
Suspected serious injuries in alcohol-involved crashes decreased 67.4% (564 to 184
people) from 2004 to 2013. (Table 6, Figure 4)
Count Percent Count Percent Count Percent Count Percent
2004 564 21.9% 833 32.3% 1,179 45.8% 2,576 100%
2005 392 20.0% 683 34.8% 888 45.2% 1,963 100%
2006 336 17.2% 668 34.2% 952 48.7% 1,956 100%
2007 332 18.6% 592 33.1% 865 48.4% 1,789 100%
2008 287 16.8% 589 34.6% 828 48.6% 1,704 100%
2009 342 19.3% 645 36.4% 787 44.4% 1,774 100%
2010 319 20.5% 551 35.5% 683 44.0% 1,553 100%
2011 270 17.4% 562 36.2% 719 46.4% 1,551 100%
2012 276 19.8% 505 36.3% 612 43.9% 1,393 100%
2013 184 14.2% 488 37.7% 623 48.1% 1,295 100%
People Injured in Alcohol-involved Crashes by Type of Injury
Year Suspected Serious
Injuries (Class A)
Suspected Minor
Injuries (Class B)
Possible Injuries
(Class C)Total Injuries
(excluding fatalities)
1,179
888 952
865 828
787
683 719
612 623 833
683 668
592 589 645
551 562 505 488
564
392 336 332
287 342
319 270 276
184
0
300
600
900
1,200
2004 2005 2006 2007 2008 2009 2010 2011 2012 2013
Pe
op
le I
nju
red
in
Alc
oh
ol-
inv
olv
ed
Cra
she
s
Possible Injuries (Class C)
Suspected Minor Injuries (Class B)
Suspected Serious Injuries (Class A)
Table 6: People Injured in Alcohol-involved Crashes by Type of Injury, 2004 - 2013
Figure 4: People Injured in Alcohol-involved Crashes by Type of Injury, 2004 - 2013

Crash Geography – Maps
6
Maps
All maps are available in high-resolution color at http://tru.unm.edu.
Alcohol-involved Crash Geography
Map 1: Alcohol-involved Crashes in New Mexico by County, 2013

Crash Geography – Maps
7
All maps are available in high-resolution color at http://tru.unm.edu.
1 Points on this map represent geocodable alcohol-involved crash locations (see Geocoding, p. xii). Each crash
point is assigned a color and size according to the number of crashes that occurred at that location.
Map 2: Location of Alcohol-involved Crashes, 20131

Crash Geography – Maps
8
All maps are available in high-resolution color at http://tru.unm.edu.
2 Points on this map represent geocodable alcohol-involved crash locations (see Geocoding, p. xii). Color
shading displays where a higher number of crashes occur in close proximity. The points assist in showing the
location of crashes, but color shading shows the intensity of crashes in that area.
Map 3: Location and Density of Alcohol-involved Crashes in Albuquerque, 20132

Crash Geography – Maps
9
All maps are available in high-resolution color at http://tru.unm.edu.
3 Points on this map represent geocodable alcohol-involved crash locations (see Geocoding, p. xii). Color
shading displays where a higher number of crashes occur in close proximity. The points assist in showing the
location of crashes, but color shading shows the intensity of crashes in that area.
Map 4: Location and Density of Alcohol-involved Crashes in Las Cruces, 20133

Crash Geography – Maps
10
All maps are available in high-resolution color at http://tru.unm.edu.
4 Points on this map represent geocodable alcohol-involved crash locations (see Geocoding, p. xii). Color
shading displays where a higher number of crashes occur in close proximity. The points assist in showing the
location of crashes, but color shading shows the intensity of crashes in that area.
Map 5: Location and Density of Alcohol-involved Crashes in Santa Fe, 20134

Crash Geography – Maps
11
5 Points on this map represent geocodable alcohol-involved crash locations (see Geocoding, p. xii). Color
shading displays where a higher number of crashes occur in close proximity. The points assist in showing the
location of crashes, but color shading shows the intensity of crashes in that area.
Map 6: Location and Density of Alcohol-involved Crashes in Gallup, 20135
Map 7: Location and Density of Alcohol-involved Crashes in Farmington, 20135

Crash Geography – Counties
12
Counties
2009 2010 2011 2012 2013
Bernalillo 846 598 681 642 605 30.9% -28.5% -5.8%
Catron 2 3 1 4 2 0.1% 0.0% -50.0%
Chaves 84 68 76 93 49 2.5% -41.7% -47.3%
Cibola 59 26 32 40 22 1.1% -62.7% -45.0%
Colfax 16 20 19 17 14 0.7% -12.5% -17.6%
Curry 51 43 44 37 30 1.5% -41.2% -18.9%
De Baca 2 2 2 0 0 0.0% -100.0% -
Doña Ana 260 212 235 187 192 9.8% -26.2% 2.7%
Eddy 66 43 35 49 44 2.2% -33.3% -10.2%
Grant 33 23 32 37 35 1.8% 6.1% -5.4%
Guadalupe 11 11 8 8 2 0.1% -81.8% -75.0%
Harding 1 0 0 2 0 0.0% -100.0% -100.0%
Hidalgo 4 3 6 2 6 0.3% 50.0% 200.0%
Lea 83 98 83 72 56 2.9% -32.5% -22.2%
Lincoln 26 31 24 30 32 1.6% 23.1% 6.7%
Los Alamos 11 4 6 2 2 0.1% -81.8% 0.0%
Luna 26 19 18 5 14 0.7% -46.2% 180.0%
McKinley 170 128 138 152 153 7.8% -10.0% 0.7%
Mora 6 6 7 4 8 0.4% 33.3% 100.0%
Otero 55 54 69 71 52 2.7% -5.5% -26.8%
Quay 8 4 7 9 8 0.4% 0.0% -11.1%
Rio Arriba 88 46 50 64 56 2.9% -36.4% -12.5%
Roosevelt 26 25 15 18 10 0.5% -61.5% -44.4%
San Juan 212 206 213 199 180 9.2% -15.1% -9.5%
San Miguel 30 41 47 39 39 2.0% 30.0% 0.0%
Sandoval 111 99 101 113 108 5.5% -2.7% -4.4%
Santa Fe 208 192 214 172 159 8.1% -23.6% -7.6%
Sierra 15 12 18 12 4 0.2% -73.3% -66.7%
Socorro 29 17 11 18 18 0.9% -37.9% 0.0%
Taos 64 69 64 46 20 1.0% -68.8% -56.5%
Torrance 21 11 10 6 13 0.7% -38.1% 116.7%
Union 6 8 6 3 2 0.1% -66.7% -33.3%
Valencia 68 40 48 23 23 1.2% -66.2% 0.0%
Total 2,698 2,162 2,320 2,176 1,958 100.0% -27.4% -10.0%1 Percent changes in red are increasing trends, and percent changes in blue (negative) are decreasing trends.
Alcohol-involved CrashesCounty
Percent of All 2013
Alcohol-involved
Crashes
Percent
Change1
2009 to 2013
Percent
Change1
2012 to 2013
Table 7: Alcohol-involved Crashes by County, 2009 - 2013
Crash Geography – Counties
13
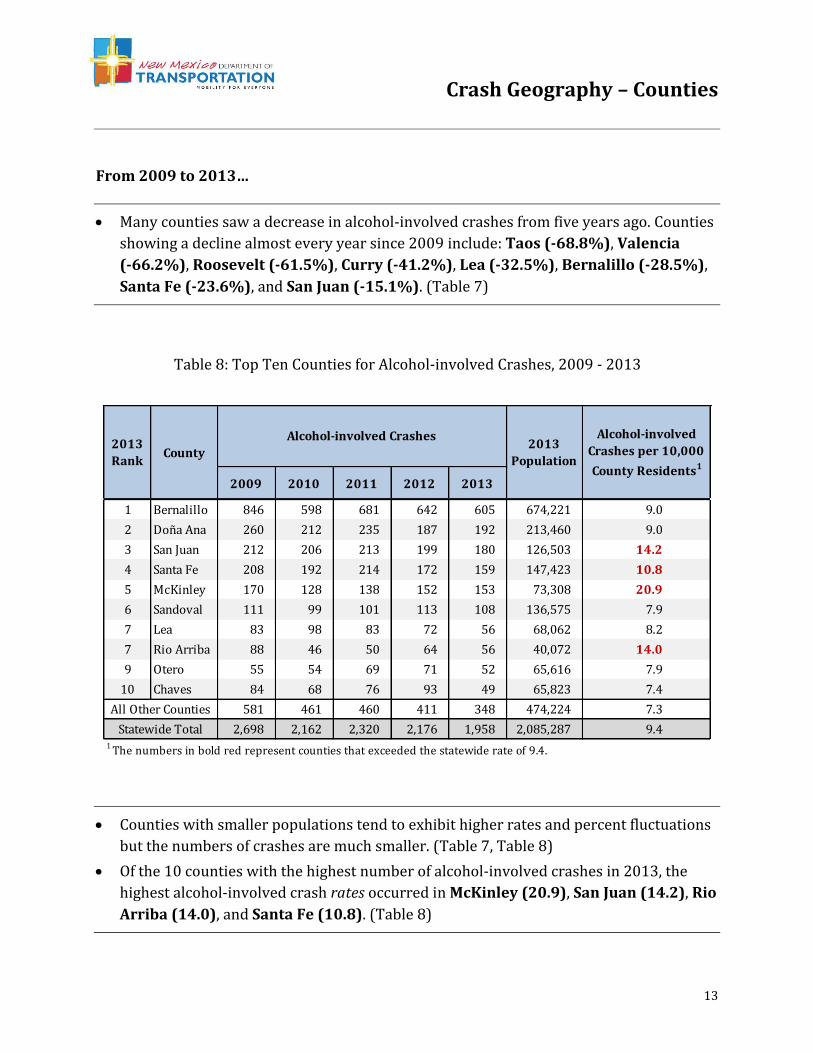
From 2009 to 2013…
Many counties saw a decrease in alcohol-involved crashes from five years ago. Counties
showing a decline almost every year since 2009 include: Taos (-68.8%), Valencia
(-66.2%), Roosevelt (-61.5%), Curry (-41.2%), Lea (-32.5%), Bernalillo (-28.5%),
Santa Fe (-23.6%), and San Juan (-15.1%). (Table 7)
Counties with smaller populations tend to exhibit higher rates and percent fluctuations
but the numbers of crashes are much smaller. (Table 7, Table 8)
Of the 10 counties with the highest number of alcohol-involved crashes in 2013, the
highest alcohol-involved crash rates occurred in McKinley (20.9), San Juan (14.2), Rio
Arriba (14.0), and Santa Fe (10.8). (Table 8)
2009 2010 2011 2012 2013
1 Bernalillo 846 598 681 642 605 674,221 9.0
2 Doña Ana 260 212 235 187 192 213,460 9.0
3 San Juan 212 206 213 199 180 126,503 14.2
4 Santa Fe 208 192 214 172 159 147,423 10.8
5 McKinley 170 128 138 152 153 73,308 20.9
6 Sandoval 111 99 101 113 108 136,575 7.9
7 Lea 83 98 83 72 56 68,062 8.2
7 Rio Arriba 88 46 50 64 56 40,072 14.0
9 Otero 55 54 69 71 52 65,616 7.9
10 Chaves 84 68 76 93 49 65,823 7.4
581 461 460 411 348 474,224 7.3
2,698 2,162 2,320 2,176 1,958 2,085,287 9.4
2013
PopulationCounty
Alcohol-involved Crashes2013
Rank
Alcohol-involved
Crashes per 10,000
County Residents1
All Other Counties
Statewide Total1 The numbers in bold red represent counties that exceeded the statewide rate of 9.4.
Table 8: Top Ten Counties for Alcohol-involved Crashes, 2009 - 2013

Crash Geography – Counties
14
2009 2010 2011 2012 2013
Bernalillo 20 22 15 28 25 20.3% 25.0% -10.7%
Catron 0 1 1 2 2 1.6% - 0.0%
Chaves 4 2 5 3 5 4.1% 25.0% 66.7%
Cibola 3 2 5 1 4 3.3% 33.3% 300.0%
Colfax 0 1 0 1 2 1.6% - 100.0%
Curry 2 0 3 2 1 0.8% -50.0% -50.0%
De Baca 0 0 1 0 0 0.0% - -
Doña Ana 13 11 4 6 7 5.7% -46.2% 16.7%
Eddy 6 3 1 4 2 1.6% -66.7% -50.0%
Grant 1 3 2 1 1 0.8% 0.0% 0.0%
Guadalupe 0 0 1 1 1 0.8% - 0.0%
Harding 0 0 0 2 0 0.0% - -100.0%
Hidalgo 1 0 0 0 1 0.8% 0.0% -
Lea 3 7 6 6 4 3.3% 33.3% -33.3%
Lincoln 0 0 1 3 4 3.3% - 33.3%
Los Alamos 0 0 0 0 0 0.0% - -
Luna 2 1 2 0 2 1.6% 0.0% -
McKinley 23 9 17 17 14 11.4% -39.1% -17.6%
Mora 0 1 2 2 0 0.0% - -100.0%
Otero 3 7 7 6 2 1.6% -33.3% -66.7%
Quay 1 0 1 0 1 0.8% 0.0% -
Rio Arriba 7 3 6 6 5 4.1% -28.6% -16.7%
Roosevelt 2 2 2 0 2 1.6% 0.0% -
San Juan 5 14 17 14 13 10.6% 160.0% -7.1%
San Miguel 3 4 4 5 2 1.6% -33.3% -60.0%
Sandoval 9 5 5 7 6 4.9% -33.3% -14.3%
Santa Fe 7 17 8 7 5 4.1% -28.6% -28.6%
Sierra 3 2 2 1 1 0.8% -66.7% 0.0%
Socorro 0 3 3 2 1 0.8% - -50.0%
Taos 6 5 5 4 3 2.4% -50.0% -25.0%
Torrance 3 1 1 4 5 4.1% 66.7% 25.0%
Union 2 1 2 0 1 0.8% -50.0% -
Valencia 3 4 2 4 1 0.8% -66.7% -75.0%
Total 132 131 131 139 123 100.0% -6.8% -11.5%
CountyAlcohol-involved Fatal Crashes Percent of All 2013
Alcohol-involved
Fatal Crashes
Percent
Change1
2009 to 2013
Percent
Change1
2012 to 2013
1 Percent changes in red are increasing trends, and percent changes in blue (negative) are decreasing trends. Percent
change cannot be calculated when the base year (2009) has zero fatalities.
Table 9: Alcohol-involved Fatal Crashes by County, 2009 - 2013

Crash Geography – Counties
15
In Doña Ana, McKinley, Otero, and Santa Fe Counties, the number of alcohol-involved
fatal crashes was much lower in 2013 than in most of the previous four years.
(Table 9, Table 10)
Bernalillo, McKinley and San Juan accounted for 42.3% of all alcohol-involved fatal
crashes in 2013. (Table 9)
In 2013, there was less than one alcohol-involved fatal crash per 10,000 residents.
(Table 10)
Of the 10 counties with the highest number of alcohol-involved fatal crashes in 2013,
the highest alcohol-involved fatal crash rates occurred in Torrance (3.2), Lincoln (2.0),
McKinley (1.9), Cibola (1.5), and Rio Arriba (1.2). (Table 10)
2009 2010 2011 2012 2013
1 Bernalillo 20 22 15 28 25 674,221 0.4
2 McKinley 23 9 17 17 14 73,308 1.9
3 San Juan 5 14 17 14 13 126,503 1.0
4 Doña Ana 13 11 4 6 7 213,460 0.3
5 Sandoval 9 5 5 7 6 136,575 0.4
6 Rio Arriba 7 3 6 6 5 40,072 1.2
6 Torrance 3 1 1 4 5 15,717 3.2
6 Santa Fe 7 17 8 7 5 147,423 0.3
6 Chaves 4 2 5 3 5 65,823 0.8
10 Lea 3 7 6 6 4 68,062 0.6
10 Lincoln 0 0 1 3 4 20,105 2.0
10 Cibola 3 2 5 1 4 27,335 1.5
35 38 41 37 26 476,683 0.5
132 131 131 139 123 2,085,287 0.6
Alcohol-involved
Fatal Crashes per
10,000 County
Residents1
All Other Counties
Statewide Total1
The numbers in bold red represent counties that exceeded the statewide rate of 0.6.
2013
Population
2013
RankCounty
Alcohol-involved Fatal Crashes
Table 10: Top Ten Counties for Alcohol-involved Fatal Crashes, 2009 - 2013

Crash Geography – Cities
16
Cities
Cities showing an overall decreasing 5-year trend in the number of alcohol-involved
crashes include: Albuquerque, Carlsbad, Hobbs, Roswell, and Taos. (Table 11)
Isleta Pueblo (56.2), Gallup (39.5), Farmington (25.5), Taos (22.7), Ruidoso (22.6),
Española (21.6), Silver City (21.4), and Las Vegas (20.5) had rates that were more
than double the 2013 statewide rate of 9.4 alcohol-involved crashes per 10,000 city
residents. (Table 11)
2009 2010 2011 2012 2013
1 Albuquerque 801 558 654 592 579 556,495 10.4
2 Las Cruces 151 130 151 113 121 101,324 11.9
2 Santa Fe 109 107 140 131 121 69,976 17.3
4 Farmington 93 79 84 84 116 45,426 25.5
5 Gallup 86 55 59 68 88 22,261 39.5
6 Rio Rancho 61 55 57 66 63 91,956 6.9
7 Alamogordo 23 28 34 30 33 31,368 10.5
8 Hobbs 51 54 48 38 31 36,041 8.6
9 Roswell 61 49 47 75 29 48,611 6.0
10 Las Vegas 17 20 25 22 28 13,691 20.5
11 Clovis 37 27 33 30 27 39,508 6.8
12 Silver City 15 11 19 19 22 10,273 21.4
12 Española 37 26 26 34 22 10,190 21.6
14 Artesia 14 3 0 3 21 11,484 18.3
15 Ruidoso 13 15 17 14 18 7,965 22.6
16 Anthony 14 13 8 18 17 9,378 18.1
16 Carlsbad 34 31 25 38 17 27,653 6.1
18 Isleta Pueblo 15 9 11 11 14 2,489 56.2
18 Bernalillo 12 21 10 7 14 8,338 16.8
20 Taos 26 28 25 22 13 5,731 22.7
1,028 843 847 761 564 - -
2,698 2,162 2,320 2,176 1,958 2,085,287 9.4
Rank1 CityAlcohol-involved Crashes 2013
Population2
Alcohol-involved
Crashes per 10,000
City Residents3
2 The population of Isleta Pueblo CDP (Census Designated Place) is from the 2010 U.S. Census. 3 Crashes per 10,000 city residents are in red if they are more than twice the statewide rate for 2013. In some cities,
nonresident drivers passing through may contribute to a high crash rate in a city with a relatively small population.
All Other Locations
Statewide Total1 Cities have the same rank if they have the same number of crashes in 2013.
Table 11: Top Twenty Cities for Alcohol-involved Crashes, 2009 - 2013

Crash Geography – Cities
17
Nakaibito (42.9), Algodones (24.9), Mescalero Apache (14.9), Upper Fruitland (12.0),
Moriarty (10.9), and Gallup (1.8) had rates that were more than double the 2013
statewide rate of 0.6 alcohol-involved fatal crashes per 10,000 residents. (Table 12)
2009 2010 2011 2012 2013
1 Nakaibito 0 0 0 0 2 466 42.9
2 Algodones 0 0 0 1 2 802 24.9
3 Mescalero Apache 0 1 0 1 2 1,338 14.9
4 Upper Fruitland 0 0 0 0 2 1,662 12.0
5 Moriarty 1 0 0 1 2 1,836 10.9
6 Gallup 5 1 0 2 4 22,261 1.8
7 Santa Fe 1 3 7 3 4 69,976 0.6
8 Farmington 1 2 0 1 2 45,426 0.4
8 Albuquerque 18 17 14 20 23 556,495 0.4
8 Roswell 1 0 1 2 2 48,611 0.4
11 Las Cruces 3 4 1 2 2 101,324 0.2
102 103 108 106 76 - -
132 131 131 139 123 2,085,287 0.6
Rank1 CityAlcohol-involved Fatal Crashes
3 Crashes per 10,000 city residents are in red if they are more than twice the statewide rate for 2013. In some cities,
nonresident drivers passing through may contribute to a high crash rate in a city with a relatively small population.4 All other crashes were in rural areas or places that had fewer than two alcohol-involved fatal crashes in 2013.
2013
Population2
Alcohol-involved
Fatal Crashes per
10,000 City
Residents3
All Other Crashes4
Statewide Total1 Cities have the same rank when they have the same alcohol-involved fatal crash rate in 2013.
2 The populations of Nakaibito, Algodones, Upper Fruitland, and Mescalero Apache are from the 2010 U.S. Census data.
Table 12: Top-Ranking Cities for Alcohol-involved Fatal Crash Rates, 2009 - 2013

Crash Geography – Rural and Urban
18
Rural and Urban Alcohol-involved Crashes
78.4% of all alcohol-involved crashes occurred on urban roadways. (Table 13)
47.2% of all alcohol-involved fatal crashes occurred on a rural non-Interstate roadways.
(Table 15)
A crash often involves multiple people. For example, there were 123 alcohol-involved
fatal crashes that resulted in 137 fatalities (people killed) in 2013. (Table 15)
Count Percent Count Percent
Rural Interstate 58 3.0% 134 3.0%
Rural Non-Interstate 365 18.6% 727 16.1%
Urban 1,535 78.4% 3,668 81.0%
Total 1,958 100.0% 4,529 100.0%
Road System
Alcohol-involved
Crashes
People in
Alcohol-involved Crashes
Count Percent Count Percent
Rural Interstate 21 2.6% 41 3.2%
Rural Non-Interstate 170 20.7% 290 22.4%
Urban 632 76.8% 964 74.4%
Total 823 100.0% 1,295 100.0%
Road System
Alcohol-involved
Injury Crashes
People Injured in
Alcohol-involved Crashes
Count Percent Count Percent
Rural Interstate 14 11.4% 15 10.9%
Rural Non-Interstate 58 47.2% 64 46.7%
Urban 51 41.5% 58 42.3%
Total 123 100.0% 137 100.0%
Road System
Alcohol-involved
Fatal Crashes
People Killed in
Alcohol-involved Crashes
Table 13: Alcohol-involved Crashes and Number of People in Alcohol-involved Crashes
by Road System, 2013
Table 14: Alcohol-involved Injury Crashes and Number of People Injured by Road System, 2013
Table 15: Alcohol-involved Fatal Crashes and Number of People Killed by Road System, 2013

Crash Geography – Rural and Urban
19
Overturn crashes were 54.7% of alcohol-involved fatalities on rural non-Interstate
roadways. (Table 16)
70.7% of all alcohol-involved crashes on rural Interstate roadways occurred in dark
(not lighted) conditions. (Table 17)
Count Percent Count Percent Count Percent Count Percent Count Percent Count Percent
Other Vehicle 14 24.1% 2 13.3% 73 20.0% 12 18.8% 669 43.6% 22 37.9%
Fixed Object 13 22.4% 1 6.7% 91 24.9% 4 6.3% 439 28.6% 5 8.6%
Overturn/Rollover 18 31.0% 6 40.0% 141 38.6% 35 54.7% 114 7.4% 7 12.1%
Parked Vehicle 0 0.0% 0 0.0% 7 1.9% 0 0.0% 118 7.7% 0 0.0%
Pedestrian 5 8.6% 5 33.3% 16 4.4% 10 15.6% 85 5.5% 19 32.8%
Other (Object) 3 5.2% 0 0.0% 8 2.2% 0 0.0% 36 2.3% 0 0.0%
Other (Non-Collision) 2 3.4% 0 0.0% 12 3.3% 2 3.1% 28 1.8% 2 3.4%
Pedalcyclist 0 0.0% 0 0.0% 1 0.3% 0 0.0% 20 1.3% 0 0.0%
Vehicle on Other Road 1 1.7% 0 0.0% 2 0.5% 0 0.0% 7 0.5% 2 3.4%
Animal 0 0.0% 0 0.0% 5 1.4% 1 1.6% 1 0.1% 0 0.0%
Railroad Train 1 1.7% 1 6.7% 2 0.5% 0 0.0% 1 0.1% 0 0.0%
Missing Data 1 1.7% 0 0.0% 7 1.9% 0 0.0% 17 1.1% 1 1.7%
Total 58 100.0% 15 100.0% 365 100.0% 64 100.0% 1,535 100.0% 58 100.0%
Alcohol-involved Crashes and Fatalities by Road System
Rural Interstate Rural Non-Interstate UrbanCrash Classification
Crashes Fatalities Crashes Fatalities Crashes Fatalities
Count Percent Count Percent Count Percent Count Percent
Daylight 14 24.1% 148 40.5% 519 33.8% 681 34.8%
Dark-Lighted 1 1.7% 34 9.3% 605 39.4% 640 32.7%
Dark-Not Lighted 41 70.7% 161 44.1% 266 17.3% 468 23.9%
Dusk 0 0.0% 9 2.5% 39 2.5% 48 2.5%
Dawn 2 3.4% 9 2.5% 22 1.4% 33 1.7%
Other/Not Stated 0 0.0% 1 0.3% 3 0.2% 4 0.2%
Missing Data 0 0.0% 3 0.8% 81 5.3% 84 4.3%
Total 58 100.0% 365 100.0% 1,535 100.0% 1,958 100.0%
Light Condition
Rural Interstate
Crashes
Rural Non-
Interstate CrashesUrban Crashes Total Crashes
Table 16: Alcohol-involved Crashes and Fatalities by Crash Classification and Road System, 2013
Table 17: Alcohol-involved Crashes by Light Condition and Road System, 2013

Crash Characteristics – Month, Day, Hour
20
Month, Day of Week, and Hour
July had the highest percentage (9.0%) of alcohol-involved crashes. (Figure 5)
Count Percent Count Percent Count Percent Count Percent
January 9 7.3% 55 6.7% 104 10.3% 168 8.6%
February 7 5.7% 69 8.4% 83 8.2% 159 8.1%
March 10 8.1% 68 8.3% 96 9.5% 174 8.9%
April 9 7.3% 65 7.9% 80 7.9% 154 7.9%
May 16 13.0% 60 7.3% 70 6.9% 146 7.5%
June 5 4.1% 77 9.4% 80 7.9% 162 8.3%
July 14 11.4% 84 10.2% 79 7.8% 177 9.0%
August 10 8.1% 73 8.9% 86 8.5% 169 8.6%
September 14 11.4% 64 7.8% 80 7.9% 158 8.1%
October 15 12.2% 68 8.3% 77 7.6% 160 8.2%
November 10 8.1% 72 8.7% 87 8.6% 169 8.6%
December 4 3.3% 68 8.3% 90 8.9% 162 8.3%
Total 123 100.0% 823 100.0% 1,012 100.0% 1,958 100.0%
Month
Alcohol-involved
Fatal Crashes
Alcohol-involved
Injury Crashes
Alcohol-involved
Property Damage
Only Crashes
Total
Alcohol-involved
Crashes
8.6% 8.1%
8.9%
7.9% 7.5%
8.3% 9.0%
8.6% 8.1% 8.2%
8.6% 8.3%
0%
4%
8%
12%
Jan Feb Mar Apr May Jun Jul Aug Sep Oct Nov Dec
Pe
rce
nta
ge
of
A
lco
ho
l-in
vo
lve
d C
rash
es
Crash Characteristics
Table 18: Alcohol-involved Crashes by Month and Crash Severity, 2013
Figure 5: Percentage of Alcohol-involved Crashes by Month, 2013

Crash Characteristics – Month, Day, Hour
21
Saturday had the highest number of alcohol-involved crashes (422 crashes) and
accounted for 21.6% of all alcohol-involved crashes in 2013. (Table 19, Figure 6)
Over half (55.1%) of all alcohol-involved crashes occurred on the weekend: Friday
(16.2%), Saturday (21.6%) and Sunday (17.3%). (Table 19, Figure 6)
Count Percent Count Percent Count Percent Count Percent
Sunday 19 15.4% 139 16.9% 180 17.8% 338 17.3%
Monday 6 4.9% 76 9.2% 104 10.3% 186 9.5%
Tuesday 11 8.9% 94 11.4% 99 9.8% 204 10.4%
Wednesday 18 14.6% 104 12.6% 111 11.0% 233 11.9%
Thursday 18 14.6% 100 12.2% 139 13.7% 257 13.1%
Friday 31 25.2% 133 16.2% 154 15.2% 318 16.2%
Saturday 20 16.3% 177 21.5% 225 22.2% 422 21.6%
Total 123 100.0% 823 100.0% 1,012 100.0% 1,958 100.0%
Total
Alcohol-involved
CrashesDay of the
Week
Alcohol-involved
Fatal Crashes
Alcohol-involved
Injury Crashes
Alcohol-involved
Property Damage
Only Crashes
17.3%
9.5% 10.4% 11.9%
13.1%
16.2%
21.6%
0%
6%
12%
18%
24%
Sunday Monday Tuesday Wednesday Thursday Friday Saturday
Pe
rce
nta
ge
of
A
lco
ho
l-in
vo
lve
d C
rash
es
Table 19: Alcohol-involved Crashes by Day of the Week and Crash Severity, 2013
Figure 6: Percentage of Alcohol-involved Crashes by Day of the Week, 2013

Crash Characteristics – Month, Day, Hour
22
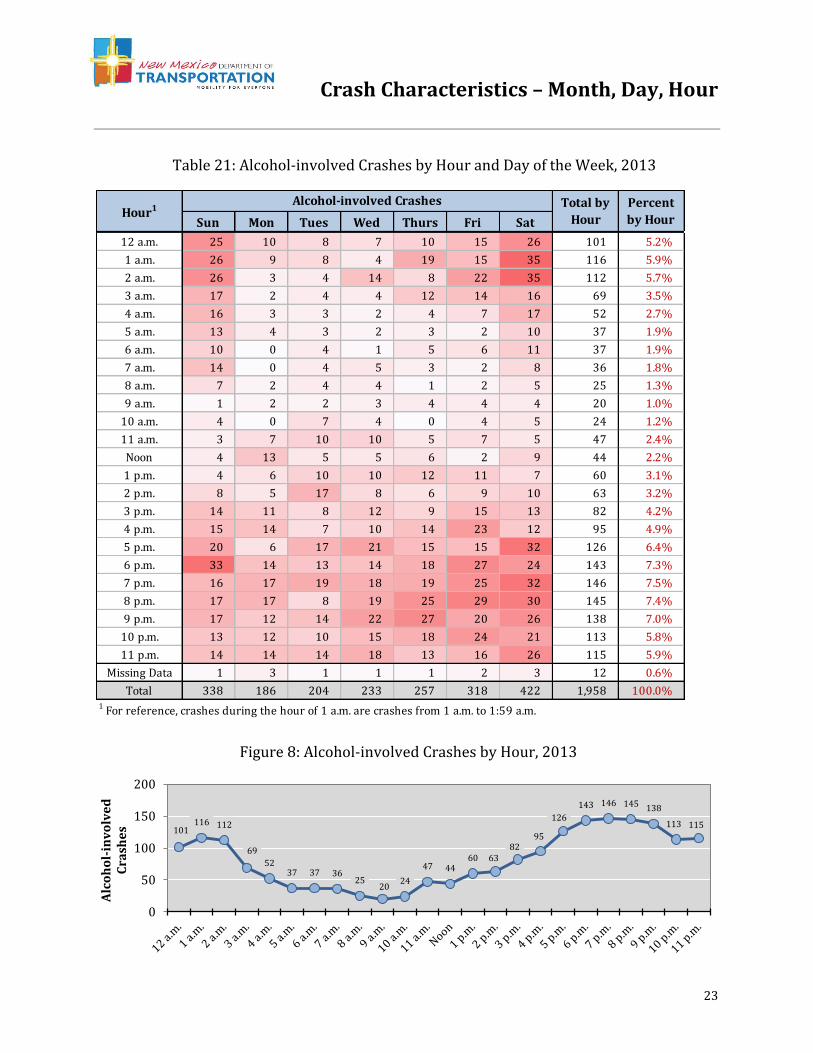
57.7% of all alcohol-involved crashes occurred from 6 p.m. to 3 a.m. (Table 20, Figure 7)
The hours from 1 a.m. to 3 a.m. on Saturday had the highest number of alcohol-involved
crashes (35 crashes each hour) in 2013. (Table 21)
Sun Mon Tues Wed Thurs Fri Sat TotalPercent
of Total
12 - 3 a.m. 77 22 20 25 37 52 96 329 16.8%
3 - 6 a.m. 46 9 10 8 19 23 43 158 8.1%
6 - 9 a.m. 31 2 12 10 9 10 24 98 5.0%
9 a.m. - 12 p.m. 8 9 19 17 9 15 14 91 4.6%
12 - 3 p.m. 16 24 32 23 24 22 26 167 8.5%
3 - 6 p.m. 49 31 32 43 38 53 57 303 15.5%
6 - 9 p.m. 66 48 40 51 62 81 86 434 22.2%
9 p.m. - 12 a.m. 44 38 38 55 58 60 73 366 18.7%
Missing Data 1 3 1 1 1 2 3 12 0.6%
Total 338 186 204 233 257 318 422 1,958 100.0%1 For reference, crashes from 3-6 a.m. are from 3 a.m. to 5:59 a.m.2 Numbers are shaded such that darker shading identifies higher numbers.
Hour1
Alcohol-involved Crashes2
16.8%
8.1%
5.0% 4.6%
8.5%
15.5%
22.2%
18.7%
0%
5%
10%
15%
20%
25%
12 - 3 a.m. 3 - 6 a.m. 6 - 9 a.m. 9 a.m. - 12p.m.
12 - 3 p.m. 3 - 6 p.m. 6 - 9 p.m. 9 p.m. - 12a.m.
Pe
rce
nta
ge
of
Alc
oh
ol-
inv
olv
ed
Cra
she
s
Table 20: Alcohol-involved Crashes by Day of the Week and Three-hour Segments, 2013
Figure 7: Percentage of Alcohol-involved Crashes by Three-hour Segments, 2013
Crash Characteristics – Month, Day, Hour
23
Sun Mon Tues Wed Thurs Fri Sat
12 a.m. 25 10 8 7 10 15 26 101 5.2%
1 a.m. 26 9 8 4 19 15 35 116 5.9%
2 a.m. 26 3 4 14 8 22 35 112 5.7%
3 a.m. 17 2 4 4 12 14 16 69 3.5%
4 a.m. 16 3 3 2 4 7 17 52 2.7%
5 a.m. 13 4 3 2 3 2 10 37 1.9%
6 a.m. 10 0 4 1 5 6 11 37 1.9%
7 a.m. 14 0 4 5 3 2 8 36 1.8%
8 a.m. 7 2 4 4 1 2 5 25 1.3%
9 a.m. 1 2 2 3 4 4 4 20 1.0%
10 a.m. 4 0 7 4 0 4 5 24 1.2%
11 a.m. 3 7 10 10 5 7 5 47 2.4%
Noon 4 13 5 5 6 2 9 44 2.2%
1 p.m. 4 6 10 10 12 11 7 60 3.1%
2 p.m. 8 5 17 8 6 9 10 63 3.2%
3 p.m. 14 11 8 12 9 15 13 82 4.2%
4 p.m. 15 14 7 10 14 23 12 95 4.9%
5 p.m. 20 6 17 21 15 15 32 126 6.4%
6 p.m. 33 14 13 14 18 27 24 143 7.3%
7 p.m. 16 17 19 18 19 25 32 146 7.5%
8 p.m. 17 17 8 19 25 29 30 145 7.4%
9 p.m. 17 12 14 22 27 20 26 138 7.0%
10 p.m. 13 12 10 15 18 24 21 113 5.8%
11 p.m. 14 14 14 18 13 16 26 115 5.9%
Missing Data 1 3 1 1 1 2 3 12 0.6%
Total 338 186 204 233 257 318 422 1,958 100.0%1 For reference, crashes during the hour of 1 a.m. are crashes from 1 a.m. to 1:59 a.m.
Percent
by HourHour1
Alcohol-involved Crashes Total by
Hour
101 116 112
69
52 37 37 36
25 20
24
47 44 60 63
82 95
126
143 146 145 138
113 115
0
50
100
150
200
Alc
oh
ol-
inv
olv
ed
C
rash
es
Table 21: Alcohol-involved Crashes by Hour and Day of the Week, 2013
Figure 8: Alcohol-involved Crashes by Hour, 2013
Crash Characteristics – Crash Classification
24
Crash Classification
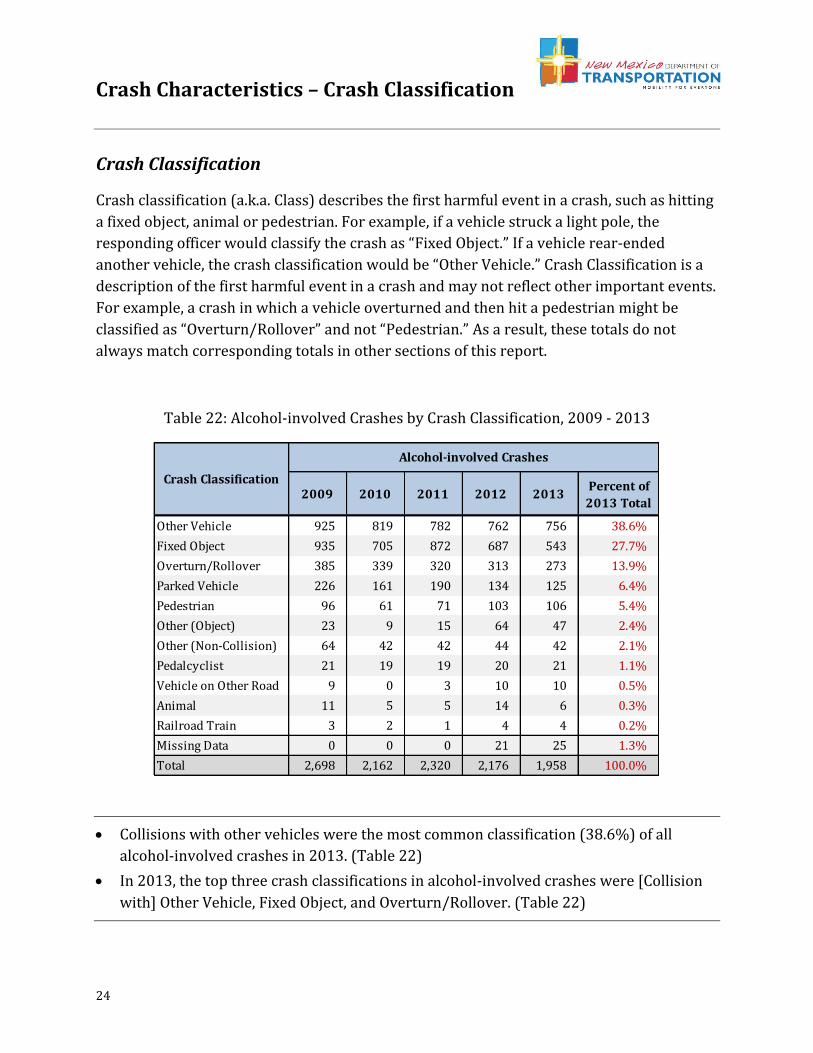
Crash classification (a.k.a. Class) describes the first harmful event in a crash, such as hitting
a fixed object, animal or pedestrian. For example, if a vehicle struck a light pole, the
responding officer would classify the crash as “Fixed Object.” If a vehicle rear-ended
another vehicle, the crash classification would be “Other Vehicle.” Crash Classification is a
description of the first harmful event in a crash and may not reflect other important events.
For example, a crash in which a vehicle overturned and then hit a pedestrian might be
classified as “Overturn/Rollover” and not “Pedestrian.” As a result, these totals do not
always match corresponding totals in other sections of this report.
Collisions with other vehicles were the most common classification (38.6%) of all
alcohol-involved crashes in 2013. (Table 22)
In 2013, the top three crash classifications in alcohol-involved crashes were [Collision
with] Other Vehicle, Fixed Object, and Overturn/Rollover. (Table 22)
2009 2010 2011 2012 2013Percent of
2013 Total
Other Vehicle 925 819 782 762 756 38.6%
Fixed Object 935 705 872 687 543 27.7%
Overturn/Rollover 385 339 320 313 273 13.9%
Parked Vehicle 226 161 190 134 125 6.4%
Pedestrian 96 61 71 103 106 5.4%
Other (Object) 23 9 15 64 47 2.4%
Other (Non-Collision) 64 42 42 44 42 2.1%
Pedalcyclist 21 19 19 20 21 1.1%
Vehicle on Other Road 9 0 3 10 10 0.5%
Animal 11 5 5 14 6 0.3%
Railroad Train 3 2 1 4 4 0.2%
Missing Data 0 0 0 21 25 1.3%
Total 2,698 2,162 2,320 2,176 1,958 100.0%
Crash Classification
Alcohol-involved Crashes
Table 22: Alcohol-involved Crashes by Crash Classification, 2009 - 2013

Crash Characteristics – Crash Classification
25
Pedestrian-classified crashes were 5.4% of all alcohol-involved crashes, but accounted
for 26.8% of alcohol-involved fatal crashes. (Table 23)
Overturn/Rollover-classified crashes were 13.9% of all alcohol-involved crashes, but
accounted for 37.4% of alcohol-involved fatal crashes. (Table 23)
Count Percent Count Percent Count Percent Count Percent
Other Vehicle 26 21.1% 351 42.6% 379 37.5% 756 38.6%
Fixed Object 10 8.1% 178 21.6% 355 35.1% 543 27.7%
Overturn/Rollover 46 37.4% 143 17.4% 84 8.3% 273 13.9%
Parked Vehicle 0 0.0% 28 3.4% 97 9.6% 125 6.4%
Pedestrian 33 26.8% 61 7.4% 12 1.2% 106 5.4%
Other (Object) 0 0.0% 17 2.1% 30 3.0% 47 2.4%
Other (Non-Collision) 4 3.3% 18 2.2% 20 2.0% 42 2.1%
Pedalcyclist 0 0.0% 15 1.8% 6 0.6% 21 1.1%
Vehicle on Other Road 1 0.8% 5 0.6% 4 0.4% 10 0.5%
Animal 1 0.8% 0 0.0% 5 0.5% 6 0.3%
Railroad Train 1 0.8% 1 0.1% 2 0.2% 4 0.2%
Missing Data 1 0.8% 6 0.7% 18 1.8% 25 1.3%
Total 123 100.0% 823 100.0% 1,012 100.0% 1,958 100.0%
Crash Classification
Alcohol-involved
Fatal Crashes
Alcohol-involved
Injury Crashes
Alcohol-involved
Property Damage
Only Crashes
Total
Alcohol-involved
Crashes
Other Vehicle 38.6%
Fixed Object 27.7%
Overturn/Rollover 13.9%
Parked Vehicle 6.4%
Pedestrian 5.4%
Other (Object) 2.4%
Other (Non-Collision) 2.1%
Pedalcyclist 1.1%
Vehicle on Other Road 0.5%
Animal 0.3%
Railroad Train 0.2% Missing Data
1.3%
Table 23: Alcohol-involved Crashes by Crash Classification and Crash Severity, 2013
Figure 9: Alcohol-involved Crashes by Crash Classification, 2013
Crash Characteristics – Vehicles
26
Vehicles
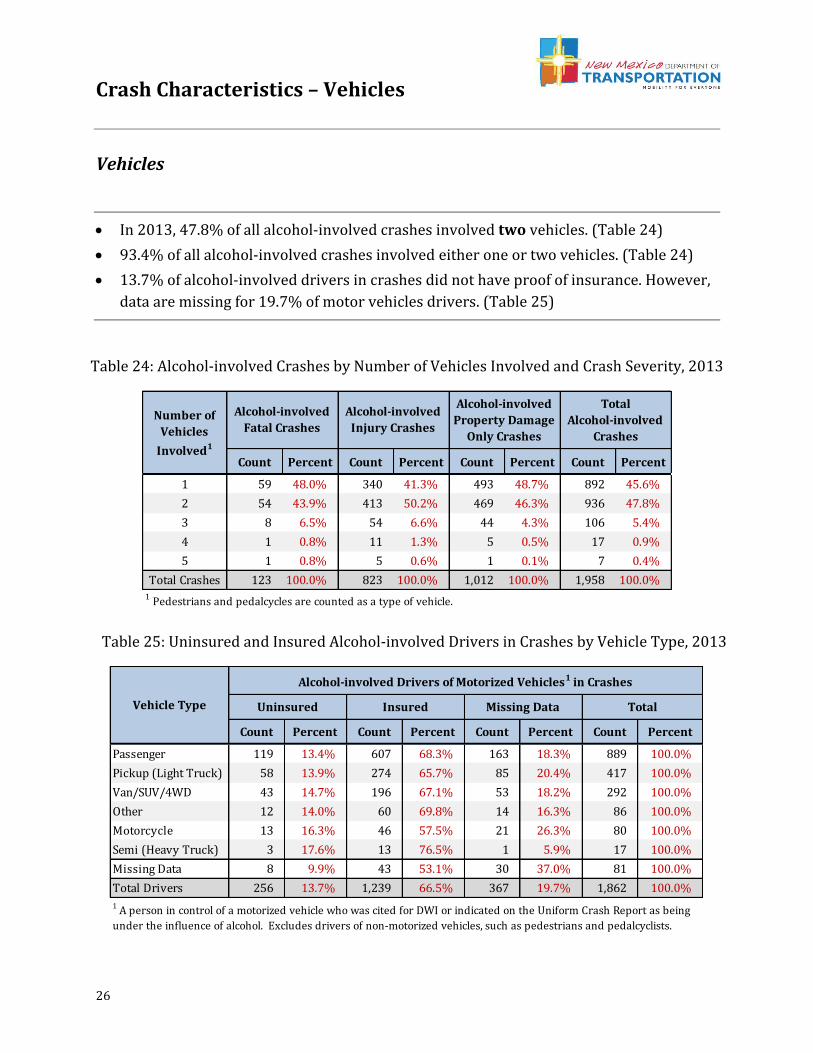
In 2013, 47.8% of all alcohol-involved crashes involved two vehicles. (Table 24)
93.4% of all alcohol-involved crashes involved either one or two vehicles. (Table 24)
13.7% of alcohol-involved drivers in crashes did not have proof of insurance. However,
data are missing for 19.7% of motor vehicles drivers. (Table 25)
Count Percent Count Percent Count Percent Count Percent
1 59 48.0% 340 41.3% 493 48.7% 892 45.6%
2 54 43.9% 413 50.2% 469 46.3% 936 47.8%
3 8 6.5% 54 6.6% 44 4.3% 106 5.4%
4 1 0.8% 11 1.3% 5 0.5% 17 0.9%
5 1 0.8% 5 0.6% 1 0.1% 7 0.4%
Total Crashes 123 100.0% 823 100.0% 1,012 100.0% 1,958 100.0%1 Pedestrians and pedalcycles are counted as a type of vehicle.
Number of
Vehicles
Involved1
Alcohol-involved
Fatal Crashes
Alcohol-involved
Injury Crashes
Alcohol-involved
Property Damage
Only Crashes
Total
Alcohol-involved
Crashes
Count Percent Count Percent Count Percent Count Percent
Passenger 119 13.4% 607 68.3% 163 18.3% 889 100.0%
Pickup (Light Truck) 58 13.9% 274 65.7% 85 20.4% 417 100.0%
Van/SUV/4WD 43 14.7% 196 67.1% 53 18.2% 292 100.0%
Other 12 14.0% 60 69.8% 14 16.3% 86 100.0%
Motorcycle 13 16.3% 46 57.5% 21 26.3% 80 100.0%
Semi (Heavy Truck) 3 17.6% 13 76.5% 1 5.9% 17 100.0%
Missing Data 8 9.9% 43 53.1% 30 37.0% 81 100.0%
Total Drivers 256 13.7% 1,239 66.5% 367 19.7% 1,862 100.0%
1 A person in control of a motorized vehicle who was cited for DWI or indicated on the Uniform Crash Report as being
under the influence of alcohol. Excludes drivers of non-motorized vehicles, such as pedestrians and pedalcyclists.
Vehicle Type
Alcohol-involved Drivers of Motorized Vehicles1 in Crashes
Uninsured Insured Missing Data Total
Table 24: Alcohol-involved Crashes by Number of Vehicles Involved and Crash Severity, 2013
Table 25: Uninsured and Insured Alcohol-involved Drivers in Crashes by Vehicle Type, 2013
Crash Characteristics – Vehicles
27
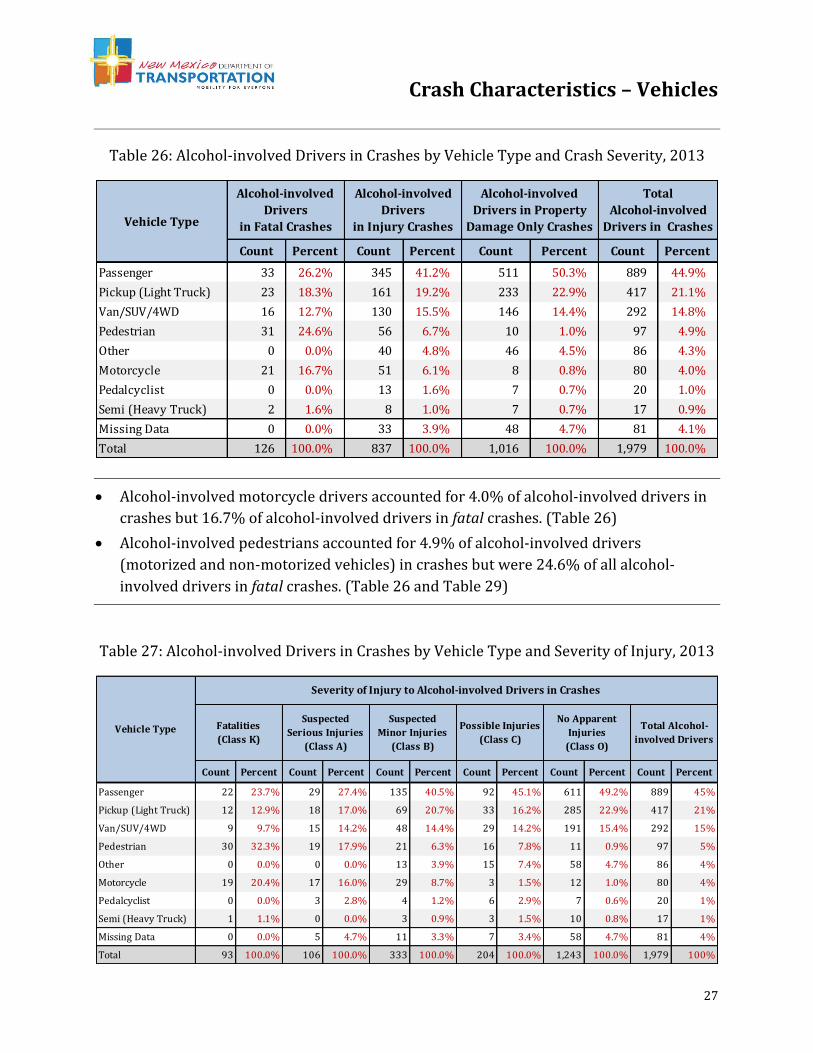
Alcohol-involved motorcycle drivers accounted for 4.0% of alcohol-involved drivers in
crashes but 16.7% of alcohol-involved drivers in fatal crashes. (Table 26)
Alcohol-involved pedestrians accounted for 4.9% of alcohol-involved drivers
(motorized and non-motorized vehicles) in crashes but were 24.6% of all alcohol-
involved drivers in fatal crashes. (Table 26 and Table 29)
Count Percent Count Percent Count Percent Count Percent
Passenger 33 26.2% 345 41.2% 511 50.3% 889 44.9%
Pickup (Light Truck) 23 18.3% 161 19.2% 233 22.9% 417 21.1%
Van/SUV/4WD 16 12.7% 130 15.5% 146 14.4% 292 14.8%
Pedestrian 31 24.6% 56 6.7% 10 1.0% 97 4.9%
Other 0 0.0% 40 4.8% 46 4.5% 86 4.3%
Motorcycle 21 16.7% 51 6.1% 8 0.8% 80 4.0%
Pedalcyclist 0 0.0% 13 1.6% 7 0.7% 20 1.0%
Semi (Heavy Truck) 2 1.6% 8 1.0% 7 0.7% 17 0.9%
Missing Data 0 0.0% 33 3.9% 48 4.7% 81 4.1%
Total 126 100.0% 837 100.0% 1,016 100.0% 1,979 100.0%
Vehicle Type
Alcohol-involved
Drivers
in Fatal Crashes
Alcohol-involved
Drivers
in Injury Crashes
Alcohol-involved
Drivers in Property
Damage Only Crashes
Total
Alcohol-involved
Drivers in Crashes
Count Percent Count Percent Count Percent Count Percent Count Percent Count Percent
Passenger 22 23.7% 29 27.4% 135 40.5% 92 45.1% 611 49.2% 889 45%
Pickup (Light Truck) 12 12.9% 18 17.0% 69 20.7% 33 16.2% 285 22.9% 417 21%
Van/SUV/4WD 9 9.7% 15 14.2% 48 14.4% 29 14.2% 191 15.4% 292 15%
Pedestrian 30 32.3% 19 17.9% 21 6.3% 16 7.8% 11 0.9% 97 5%
Other 0 0.0% 0 0.0% 13 3.9% 15 7.4% 58 4.7% 86 4%
Motorcycle 19 20.4% 17 16.0% 29 8.7% 3 1.5% 12 1.0% 80 4%
Pedalcyclist 0 0.0% 3 2.8% 4 1.2% 6 2.9% 7 0.6% 20 1%
Semi (Heavy Truck) 1 1.1% 0 0.0% 3 0.9% 3 1.5% 10 0.8% 17 1%
Missing Data 0 0.0% 5 4.7% 11 3.3% 7 3.4% 58 4.7% 81 4%
Total 93 100.0% 106 100.0% 333 100.0% 204 100.0% 1,243 100.0% 1,979 100%
Vehicle Type
Severity of Injury to Alcohol-involved Drivers in Crashes
Fatalities
(Class K)
Suspected
Serious Injuries
(Class A)
Suspected
Minor Injuries
(Class B)
Possible Injuries
(Class C)
No Apparent
Injuries
(Class O)
Total Alcohol-
involved Drivers
Table 26: Alcohol-involved Drivers in Crashes by Vehicle Type and Crash Severity, 2013
Table 27: Alcohol-involved Drivers in Crashes by Vehicle Type and Severity of Injury, 2013

Demographics – Age and Sex
28
Age and Sex
The number of 15-19 year olds in alcohol-involved crashes decreased 46.6% in the last
five years. (Table 28)
In the last five years, the number of 65-69 year olds in alcohol-involved crashes has
increased 19.7% and the number of 70-74 year olds in alcohol-involved crashes has
increased 12.8%. (Table 28)
In 2013, there were 1.8 males in alcohol-involved crashes for every female. (Table 29)
In 2013, 69.3% of fatalities in alcohol-involved crashes were male. (Table 30)
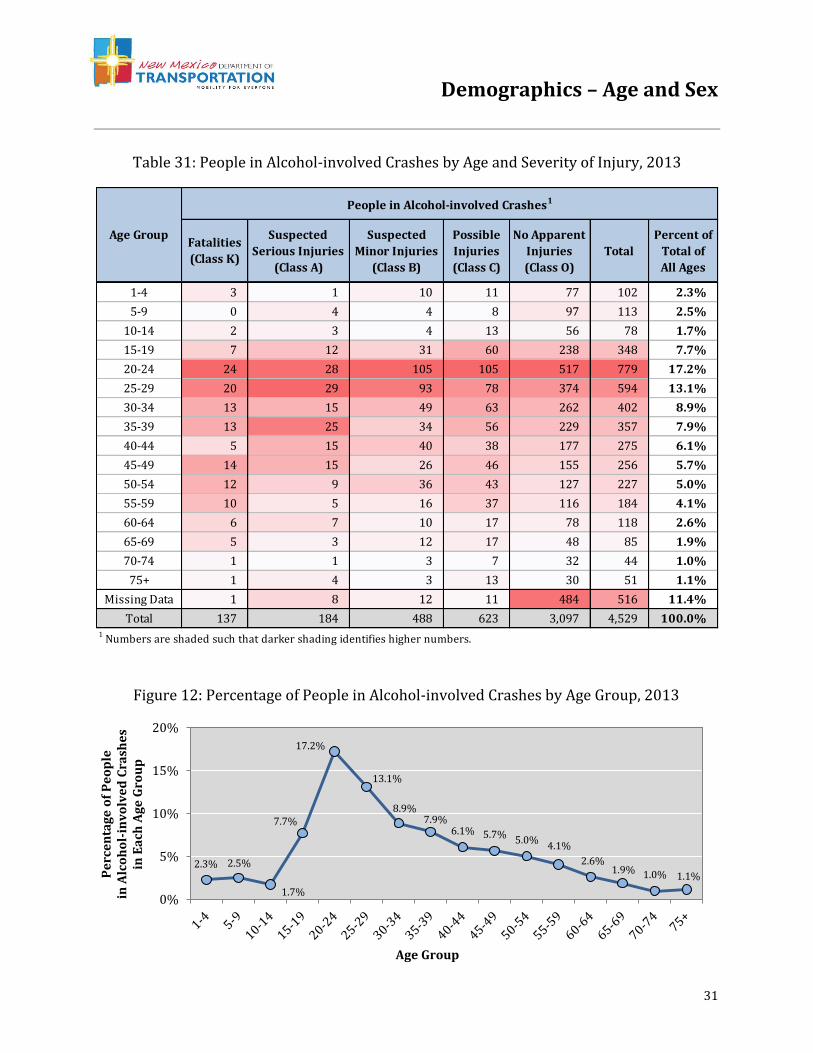
In 2013, the largest group of people in alcohol-involved crashes was 20 to 29 years of
age (30.3% of all people in alcohol-involved crashes). (Table 31, Figure 12)
2009 2010 2011 2012 2013
1-4 124 140 115 128 102 -17.7%
5-9 125 135 110 116 113 -9.6%
10-14 142 103 107 103 78 -45.1%
15-19 652 469 495 451 348 -46.6%
20-24 1,031 891 939 823 779 -24.4%
25-29 759 639 635 601 594 -21.7%
30-34 556 467 485 470 402 -27.7%
35-39 419 367 355 362 357 -14.8%
40-44 388 310 309 342 275 -29.1%
45-49 397 306 344 331 256 -35.5%
50-54 280 264 301 267 227 -18.9%
55-59 201 191 182 183 184 -8.5%
60-64 111 123 131 136 118 6.3%
65-69 71 77 81 73 85 19.7%
70-74 39 39 43 36 44 12.8%
75+ 52 46 22 55 51 -1.9%
Missing Data 561 442 463 421 516 -8.0%
Total 5,908 5,009 5,117 4,898 4,529 -23.3%1 Numbers are shaded such that darker shading identifies higher numbers.
Percent Change
2009 to 2013Age Group
People in Alcohol-involved Crashes1
Demographics
Table 28: People in Alcohol-involved Crashes by Age, 2009 - 2013

Demographics – Age and Sex
29
Count Percent Count Percent Count Percent Count Percent
1-4 51 2.0% 49 3.3% 2 0.5% 102 2.3% 1.0
5-9 53 2.0% 60 4.0% 0 0.0% 113 2.5% 0.9
10-14 33 1.3% 44 3.0% 1 0.2% 78 1.7% 0.8
15-19 206 7.9% 141 9.5% 1 0.2% 348 7.7% 1.5
20-24 505 19.4% 269 18.1% 5 1.2% 779 17.2% 1.9
25-29 404 15.5% 186 12.5% 4 0.9% 594 13.1% 2.2
30-34 255 9.8% 144 9.7% 3 0.7% 402 8.9% 1.8
35-39 229 8.8% 128 8.6% 0 0.0% 357 7.9% 1.8
40-44 164 6.3% 111 7.4% 0 0.0% 275 6.1% 1.5
45-49 163 6.2% 89 6.0% 4 0.9% 256 5.7% 1.8
50-54 146 5.6% 80 5.4% 1 0.2% 227 5.0% 1.8
55-59 129 4.9% 52 3.5% 3 0.7% 184 4.1% 2.5
60-64 82 3.1% 36 2.4% 0 0.0% 118 2.6% 2.3
65-69 56 2.1% 29 1.9% 0 0.0% 85 1.9% 1.9
70-74 25 1.0% 18 1.2% 1 0.2% 44 1.0% 1.4
75+ 28 1.1% 23 1.5% 0 0.0% 51 1.1% 1.2
Missing Data 80 3.1% 31 2.1% 405 94.2% 516 11.4% 2.6
Total 2,609 100.0% 1,490 100.0% 430 100.0% 4,529 100.0% 1.8
Ratio
Males to
Females
Age Group
People in Alcohol-involved Crashes
Males Females Missing Data Total
0.0
2.0
4.0
6.0
0
200
400
600
Ra
tio o
f Ma
les to
Fe
ma
les
Pe
op
le i
n A
lco
ho
l-in
vo
lve
d C
rash
es
in
Ea
ch A
ge
Gro
up
Age Group
Males
Females
Ratio Males to Females
Table 29: People in Alcohol-involved Crashes by Age and Sex, 2013
Figure 10: People in Alcohol-involved Crashes by Age and Sex, 2013

Demographics – Age and Sex
30
Count Percent Count Percent Count Percent
1-4 1 1.1% 2 4.8% 3 2.2% 0.5
5-9 0 0.0% 0 0.0% 0 0.0% -
10-14 0 0.0% 2 4.8% 2 1.5% -
15-19 5 5.3% 2 4.8% 7 5.1% 2.5
20-24 13 13.7% 11 26.2% 24 17.5% 1.2
25-29 16 16.8% 4 9.5% 20 14.6% 4.0
30-34 7 7.4% 6 14.3% 13 9.5% 1.2
35-39 11 11.6% 2 4.8% 13 9.5% 5.5
40-44 4 4.2% 1 2.4% 5 3.6% 4.0
45-49 13 13.7% 1 2.4% 14 10.2% 13.0
50-54 7 7.4% 5 11.9% 12 8.8% 1.4
55-59 7 7.4% 3 7.1% 10 7.3% 2.3
60-64 5 5.3% 1 2.4% 6 4.4% 5.0
65-69 4 4.2% 1 2.4% 5 3.6% 4.0
70-74 0 0.0% 1 2.4% 1 0.7% -
75+ 1 1.1% 0 0.0% 1 0.7% -
Missing Data 1 1.1% 0 0.0% 1 0.7% -
Total 95 100.0% 42 100.0% 137 100.0% 2.3
Ratio
Males to
Females
Age Group Males Females Total
Fatalities in Alcohol-involved Crashes
0.0
3.0
6.0
9.0
12.0
15.0
0
4
8
12
16
20 Ra
tio o
f Ma
le to
Fe
ma
le F
ata
lities
in A
lcoh
ol-in
vo
lve
d C
rash
es F
ata
liti
es
in A
lco
ho
l-in
vo
lve
d
Cra
she
s in
Ea
ch A
ge
Gro
up
Age Group
Males
Females
Ratio of Males to Females
Table 30: Fatalities in Alcohol-involved Crashes by Age and Sex, 2013
Figure 11: Fatalities in Alcohol-involved Crashes by Age and Sex, 2013
Demographics – Age and Sex
31
1-4 3 1 10 11 77 102 2.3%
5-9 0 4 4 8 97 113 2.5%
10-14 2 3 4 13 56 78 1.7%
15-19 7 12 31 60 238 348 7.7%
20-24 24 28 105 105 517 779 17.2%
25-29 20 29 93 78 374 594 13.1%
30-34 13 15 49 63 262 402 8.9%
35-39 13 25 34 56 229 357 7.9%
40-44 5 15 40 38 177 275 6.1%
45-49 14 15 26 46 155 256 5.7%
50-54 12 9 36 43 127 227 5.0%
55-59 10 5 16 37 116 184 4.1%
60-64 6 7 10 17 78 118 2.6%
65-69 5 3 12 17 48 85 1.9%
70-74 1 1 3 7 32 44 1.0%
75+ 1 4 3 13 30 51 1.1%
Missing Data 1 8 12 11 484 516 11.4%
Total 137 184 488 623 3,097 4,529 100.0%1 Numbers are shaded such that darker shading identifies higher numbers.
Age Group
People in Alcohol-involved Crashes1
Fatalities
(Class K)
Suspected
Serious Injuries
(Class A)
Suspected
Minor Injuries
(Class B)
Possible
Injuries
(Class C)
No Apparent
Injuries
(Class O)
Total
Percent of
Total of
All Ages
2.3% 2.5%
1.7%
7.7%
17.2%
13.1%
8.9% 7.9%
6.1% 5.7% 5.0%
4.1%
2.6% 1.9% 1.0% 1.1%
0%
5%
10%
15%
20%
Pe
rce
nta
ge
of
Pe
op
le
in A
lco
ho
l-in
vo
lve
d C
rash
es
in
Ea
ch A
ge
Gro
up
Age Group
Table 31: People in Alcohol-involved Crashes by Age and Severity of Injury, 2013
Figure 12: Percentage of People in Alcohol-involved Crashes by Age Group, 2013

Demographics – Teens (15-19)
32
Teens (15-19)
In 2013, 7 teens were killed and 103 injured in alcohol-involved crashes. (Table 32)
From 2004 to 2013, the number of alcohol-involved teen drivers6 in crashes decreased
70.9% (313 to 91). (Table 33, Table 36, Figure 13)
The rate of alcohol-involved teen drivers in crashes has decreased 67.1% from 2004 to
2013 (from 45.9 to 15.1 drivers per 10,000 licensed teen drivers). (Table 33)
In 2013, there were 2.64 alcohol-involved teen male drivers in crashes for every one
alcohol-involved teen female driver. (Table 34, Figure 14)
From 2004 to 2013, the number of male alcohol-involved teen drivers has decreased by
73.8% (from 252 to 66). (Table 34, Figure 14)
In 2013, the peak hours of alcohol-involved teen drivers in crashes were 10 p.m. to 3
a.m. (Table 35)
6 “Alcohol-involved teen drivers” are teen motor vehicle drivers who were cited for DWI or indicated on the
Uniform Crash Report as being under the influence of alcohol at the time of the crash.
Count Percent
Fatalities K 7 2.0%
Suspected Serious Injuries A 12 3.4%
Suspected Minor Injuries B 31 8.9%
Possible Injuries C 60 17.2%
No Apparent Injuries O 238 68.4%
Total 348 100.0%
Teens (15-19) in
Alcohol-involved CrashesSeverity of InjuriesInjury
Class
Table 32: Teens (15-19) in Alcohol-involved Crashes by Severity of Injury, 2013

Demographics – Teens (15-19)
33
7 Does not include alcohol-involved teen drivers for which 1) age or sex data are not available, 2) the
residence is not in New Mexico, or 3) the person is a pedestrian or pedalcyclist.
Drivers in
Fatal
Crashes
Drivers in
Injury
Crashes
Drivers in
Prop. Damage
Only Crashes
Total Teen
Drivers in
Crashes
2004 23 154 136 313 68,186 45.9
2005 12 120 135 267 68,667 38.9
2006 20 99 118 237 68,765 34.5
2007 12 105 117 234 67,133 34.9
2008 12 69 101 182 68,229 26.7
2009 12 80 121 213 66,724 31.9
2010 7 51 83 141 66,058 21.3
2011 3 68 95 166 64,091 25.9
2012 9 71 81 161 68,554 23.5
2013 5 31 55 91 60,243 15.1
NM
Licensed
Teen
Drivers
15-19
Alcohol-involved Teen Drivers (15-19)
of Vehicles in Crashes
Year
Alcohol-involved
Teen Drivers in
Crashes per 10,000
Licensed Teen
Drivers
313
267
237 234
182
213
141 166 161
91
45.9
38.9 34.5 34.9
26.7
31.9
21.3 25.9
23.5
15.1
0.0
20.0
40.0
60.0
80.0
0
100
200
300
400
2004 2005 2006 2007 2008 2009 2010 2011 2012 2013
Alco
ho
l-inv
olv
ed
Te
en
Driv
ers (1
5-1
9)
in C
rash
es
pe
r 10
,00
0 L
icen
sed
Te
en
Driv
ers
Alc
oh
ol-
inv
olv
ed
Te
en
Dri
ve
rs (
15
-19
)
in C
rash
es
Alcohol-involved Teen Drivers in Crashes
Alcohol-involved Teen Drivers in Crashes per 10,000 Licensed Teen Drivers
Table 33: Alcohol-involved Teen Drivers7 (15-19) in Crashes by Crash Severity, 2004 - 2013
Figure 13: Alcohol-involved Teen Drivers7 (15-19) in Crashes, 2004 - 2013

Demographics – Teens (15-19)
34
8 Does not include alcohol-involved teen drivers for which 1) age or sex data are not available, 2) the
residence is not in New Mexico, or 3) the person is a pedestrian or pedalcyclist.
Males Females Total
2004 252 61 313 4.13
2005 215 52 267 4.13
2006 181 56 237 3.23
2007 182 52 234 3.50
2008 142 40 182 3.55
2009 157 56 213 2.80
2010 112 29 141 3.86
2011 125 41 166 3.05
2012 105 56 161 1.88
2013 66 25 91 2.64
Alcohol-involved Teen Drivers (15-19)
of Vehicles in CrashesYearRatio Males to
Females
252
215
181 182
142 157
112 125
105
66 61
52 56 52 40
56
29 41
56
25
0.0
1.0
2.0
3.0
4.0
5.0
6.0
0
50
100
150
200
250
300
2004 2005 2006 2007 2008 2009 2010 2011 2012 2013
Ra
tio o
f Alco
ho
l-inv
olv
ed
Te
en
Ma
le
Driv
ers to
Te
en
Fe
ma
le D
rive
rs
Alc
oh
ol-
inv
olv
ed
Te
en
Dri
ve
rs
(15
-19
) in
Cra
she
s
Male Teen Drivers
Female Teen Drivers
Ratio Males to Females
Table 34: Alcohol-involved Teen Drivers8 (15-19) in Crashes by Sex, 2004 - 2013
Figure 14: Alcohol-involved Teen Drivers8 (15-19) in Crashes by Sex, 2004 - 2013

Demographics – Teens (15-19)
35
9 Does not include alcohol-involved teen drivers for which 1) age or sex data are not available, 2) the
residence is not in New Mexico, or 3) the person is a pedestrian or pedalcyclist.
Count Percent
Midnight 9 9.9%
1 a.m. 6 6.6%
2 a.m. 10 11.0%
3 a.m. 6 6.6%
4 a.m. 4 4.4%
5 a.m. 2 2.2%
6 a.m. 1 1.1%
7 a.m. 4 4.4%
8 a.m. 4 4.4%
9 a.m. 0 0.0%
10 a.m. 0 0.0%
11 a.m. 1 1.1%
Noon 0 0.0%
1 p.m. 4 4.4%
2 p.m. 1 1.1%
3 p.m. 3 3.3%
4 p.m. 3 3.3%
5 p.m. 1 1.1%
6 p.m. 2 2.2%
7 p.m. 2 2.2%
8 p.m. 4 4.4%
9 p.m. 5 5.5%
10 p.m. 10 11.0%
11 p.m. 9 9.9%
Missing Data 0 0.0%
Total 91 100.0%
Hour 1Alcohol-involved Teen
Drivers (15-19)
1 For reference, crashes during the hour of
1 a.m. are from 1 a.m. to 1:59 a.m.
Table 35: Alcohol-involved Teen Drivers9 (15-19) in Crashes by Hour, 2013
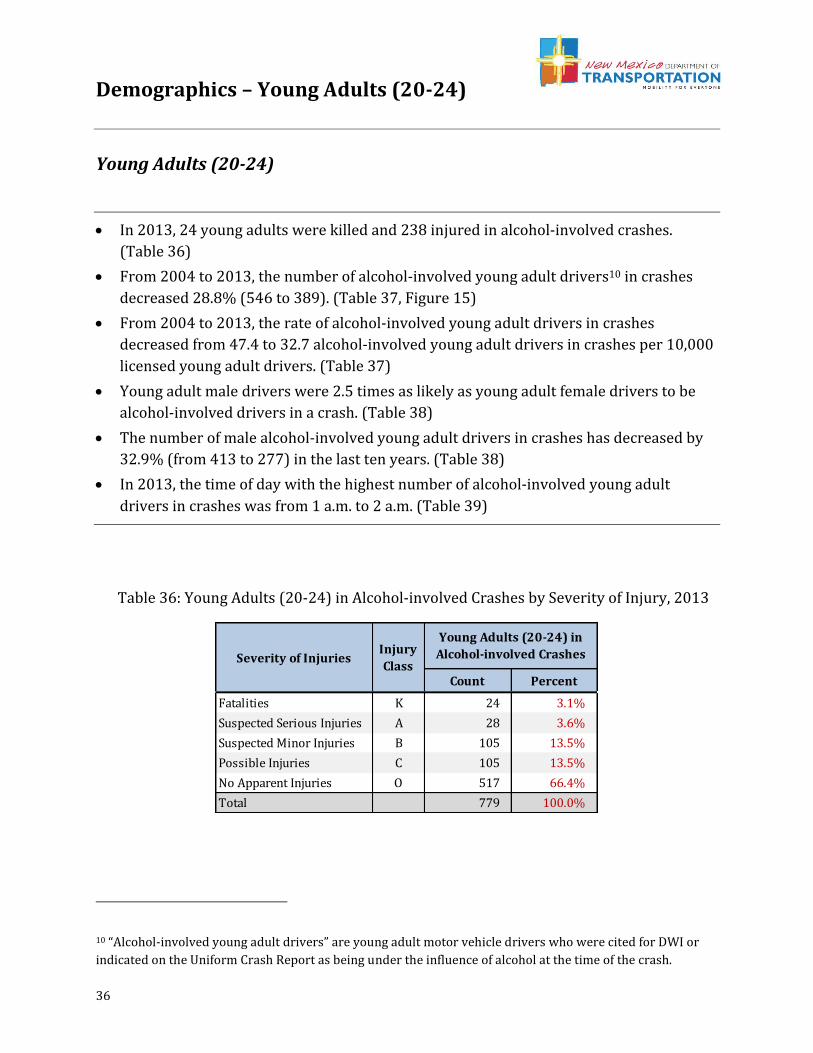
Demographics – Young Adults (20-24)
36
Young Adults (20-24)
In 2013, 24 young adults were killed and 238 injured in alcohol-involved crashes.
(Table 36)
From 2004 to 2013, the number of alcohol-involved young adult drivers10 in crashes
decreased 28.8% (546 to 389). (Table 37, Figure 15)
From 2004 to 2013, the rate of alcohol-involved young adult drivers in crashes
decreased from 47.4 to 32.7 alcohol-involved young adult drivers in crashes per 10,000
licensed young adult drivers. (Table 37)
Young adult male drivers were 2.5 times as likely as young adult female drivers to be
alcohol-involved drivers in a crash. (Table 38)
The number of male alcohol-involved young adult drivers in crashes has decreased by
32.9% (from 413 to 277) in the last ten years. (Table 38)
In 2013, the time of day with the highest number of alcohol-involved young adult
drivers in crashes was from 1 a.m. to 2 a.m. (Table 39)
10 “Alcohol-involved young adult drivers” are young adult motor vehicle drivers who were cited for DWI or
indicated on the Uniform Crash Report as being under the influence of alcohol at the time of the crash.
Count Percent
Fatalities K 24 3.1%
Suspected Serious Injuries A 28 3.6%
Suspected Minor Injuries B 105 13.5%
Possible Injuries C 105 13.5%
No Apparent Injuries O 517 66.4%
Total 779 100.0%
Severity of InjuriesInjury
Class
Young Adults (20-24) in
Alcohol-involved Crashes
Table 36: Young Adults (20-24) in Alcohol-involved Crashes by Severity of Injury, 2013

Demographics – Young Adults (20-24)
37
11 Does not include young adult drivers for which 1) age or sex data are not available, 2) the residence is not
in New Mexico, or 3) the person is a pedestrian or pedalcyclist.
Drivers in
Fatal
Crashes
Drivers in
Injury
Crashes
Drivers in Prop.
Damage Only
Crashes
Total Young
Adult Drivers in
Crashes
2004 31 250 265 546 115,090 47.4
2005 31 236 241 508 117,677 43.2
2006 33 208 212 453 119,628 37.9
2007 26 200 265 491 119,495 41.1
2008 22 196 230 448 120,296 37.2
2009 25 210 272 507 121,192 41.8
2010 22 168 222 412 122,562 33.6
2011 18 206 236 460 122,293 37.6
2012 14 151 226 391 122,911 31.8
2013 20 138 231 389 119,028 32.7
Year
Licensed
Young Adult
Drivers
(20-24)
Alcohol-involved Young
Adult Drivers (20-24)
in Crashes per 10,000
Licensed Young Adult
Drivers
Alcohol-involved Young Adult Drivers (20-24)
of Vehicles in Crashes
546 508
453 491
448
507
412
460
391 389 47.4
43.2
37.9 41.1
37.2
41.8
33.6
37.6
31.8 32.7
0.0
20.0
40.0
60.0
0
200
400
600
2004 2005 2006 2007 2008 2009 2010 2011 2012 2013
Alco
ho
l-inv
olv
ed
Yo
un
g A
du
lt Driv
ers
(20
-24
) in C
rash
es
pe
r 10
,00
0 L
icen
sed
Yo
un
g A
du
lt Driv
ers
Alc
oh
ol-
inv
olv
ed
Yo
un
g A
du
lt D
riv
ers
(2
0-2
4)
in C
rash
es
Alcohol-involved Young Adult Drivers (20-24) in Crashes
Alcohol-involved Young Adult Drivers (20-24) in Crashes per 10,000 Licensed Young Adult Drivers
Table 37: Alcohol-involved Young Adult Drivers11 (20-24) in Crashes by Severity, 2004 - 2013
Figure 15: Alcohol-involved Young Adult Drivers11 (20-24) in Crashes, 2004 - 2013

Demographics – Young Adults (20-24)
38
12 Does not include young adult drivers for which 1) age or sex data are not available, 2) the residence is not
in New Mexico, or 3) the person is a pedestrian or pedalcyclist.
Males Females Total
2004 413 133 546 3.11
2005 383 125 508 3.06
2006 355 98 453 3.62
2007 400 91 491 4.40
2008 351 97 448 3.62
2009 385 122 507 3.16
2010 321 91 412 3.53
2011 322 138 460 2.33
2012 286 105 391 2.72
2013 277 112 389 2.47
Year
Alcohol-involved Young Adult Drivers
(20-24) in Crashes Ratio Males
to Females
413 383
355
400
351
385
321 322
286 277
133 125 98 91 97
122 91
138 105 112
0.0
3.0
6.0
0
250
500
Ra
tio o
f Alco
ho
l-inv
olv
ed
Y
ou
ng
Ad
ult M
ale
Driv
ers to
Y
ou
ng
Ad
ult F
em
ale
Driv
ers
Alc
oh
ol-
inv
olv
ed
Yo
un
g A
du
lt D
riv
ers
(2
0-2
4)
in C
rash
es
Male Young Adult Drivers Female Young Adult Drivers Ratio Males to Females
Table 38: Alcohol-involved Young Adult Drivers12 (20-24) in Crashes by Sex, 2004 - 2013
Figure 16: Alcohol-involved Young Adult Drivers12 (20-24) in Crashes by Sex, 2004 - 2013

Demographics – Young Adults (20-24)
39
13 Does not include young adult drivers for which 1) age or sex data are not available, 2) the residence is not
in New Mexico, or 3) the person is a pedestrian or pedalcyclist.
Count Percent
Midnight 28 7.2%
1 a.m. 39 10.0%
2 a.m. 39 10.0%
3 a.m. 27 6.9%
4 a.m. 21 5.4%
5 a.m. 17 4.4%
6 a.m. 15 3.9%
7 a.m. 9 2.3%
8 a.m. 4 1.0%
9 a.m. 3 0.8%
10 a.m. 3 0.8%
11 a.m. 2 0.5%
Noon 4 1.0%
1 p.m. 3 0.8%
2 p.m. 7 1.8%
3 p.m. 12 3.1%
4 p.m. 8 2.1%
5 p.m. 13 3.3%
6 p.m. 13 3.3%
7 p.m. 21 5.4%
8 p.m. 20 5.1%
9 p.m. 28 7.2%
10 p.m. 24 6.2%
11 p.m. 25 6.4%
Missing Data 4 1.0%
Total 389 100.0%
Hour 1
Alcohol-involved Young Adult
Drivers (20-24) in Crashes
1 For reference, crashes during the hour of 1 a.m. are
from 1 a.m. to 1:59 a.m.
Table 39: Alcohol-involved Young Adult Drivers13 (20-24) by Hour, 2013
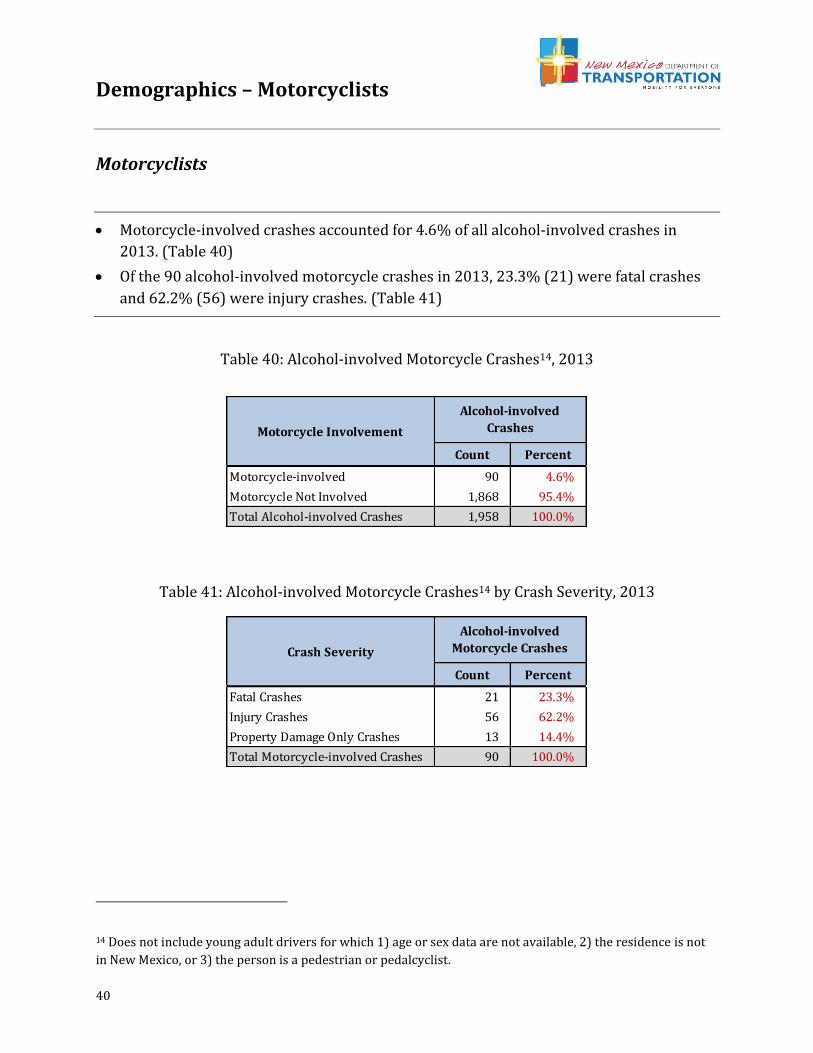
Demographics – Motorcyclists
40
Motorcyclists
Motorcycle-involved crashes accounted for 4.6% of all alcohol-involved crashes in
2013. (Table 40)
Of the 90 alcohol-involved motorcycle crashes in 2013, 23.3% (21) were fatal crashes
and 62.2% (56) were injury crashes. (Table 41)
14 Does not include young adult drivers for which 1) age or sex data are not available, 2) the residence is not
in New Mexico, or 3) the person is a pedestrian or pedalcyclist.
Count Percent
Motorcycle-involved 90 4.6%
Motorcycle Not Involved 1,868 95.4%
Total Alcohol-involved Crashes 1,958 100.0%
Alcohol-involved
CrashesMotorcycle Involvement
Count Percent
Fatal Crashes 21 23.3%
Injury Crashes 56 62.2%
Property Damage Only Crashes 13 14.4%
Total Motorcycle-involved Crashes 90 100.0%
Crash Severity
Alcohol-involved
Motorcycle Crashes
Table 40: Alcohol-involved Motorcycle Crashes14, 2013
Table 41: Alcohol-involved Motorcycle Crashes14 by Crash Severity, 2013

Demographics – Motorcyclists
41
Since 2006, alcohol-involved motorcycle crashes accounted for 8% to 10% of all
motorcycle crashes. (Table 42)
In 2013, 46% of all alcohol-involved motorcycle crashes occurred in two counties –
Bernalillo and Doña Ana. (Table 43)
15 An alcohol-involved motorcycle crash is a crash involving one or more motorcyclists in which any vehicle
driver or motorcycle driver in the crash was alcohol-involved.
Alcohol-
involvedTotal
Percent
Alcohol-involved
2004 95 1,042 9.1%
2005 65 1,119 5.8%
2006 100 1,261 7.9%
2007 112 1,261 8.9%
2008 130 1,485 8.8%
2009 109 1,381 7.9%
2010 104 1,223 8.5%
2011 116 1,319 8.8%
2012 120 1,214 9.9%
2013 90 1,131 8.0%
Year
Motorcycle-involved Crashes
2009 2010 2011 2012 2013
1 Bernalillo 33 17 34 22 23 674,221 3.4
2 Doña Ana 16 12 10 17 18 213,460 8.4
3 San Juan 11 11 15 7 6 126,503 4.7
4 Lincoln 2 3 1 3 6 20,105 29.8
5 Colfax 1 2 1 2 5 13,094 38.2
5 Santa Fe 4 9 10 12 5 147,423 3.4
5 Otero 2 4 8 3 5 65,616 7.6
40 46 37 54 22 824,865 2.7
109 104 116 120 90 2,085,287 4.3
Alcohol-involved
Motorcycle Crashes
per 100,000 County
Residents
All Other Counties
Statewide Total
2013
RankCounty
Alcohol-involved Motorcycle Crashes2013
Population
Table 42: Alcohol-involved Motorcycle Crashes15, 2004 - 2013
Table 43: Top Five Counties for Alcohol-involved Motorcycle Crashes15, 2009 - 2013
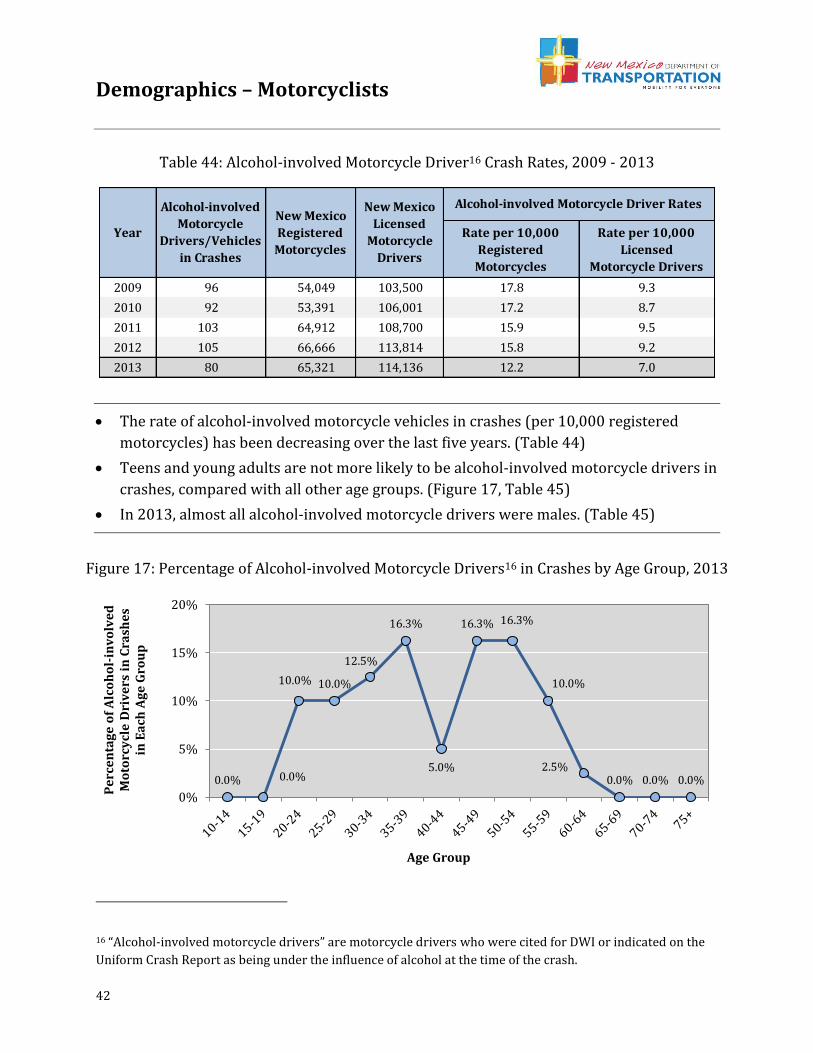
Demographics – Motorcyclists
42
The rate of alcohol-involved motorcycle vehicles in crashes (per 10,000 registered
motorcycles) has been decreasing over the last five years. (Table 44)
Teens and young adults are not more likely to be alcohol-involved motorcycle drivers in
crashes, compared with all other age groups. (Figure 17, Table 45)
In 2013, almost all alcohol-involved motorcycle drivers were males. (Table 45)
16 “Alcohol-involved motorcycle drivers” are motorcycle drivers who were cited for DWI or indicated on the
Uniform Crash Report as being under the influence of alcohol at the time of the crash.
Rate per 10,000
Registered
Motorcycles
Rate per 10,000
Licensed
Motorcycle Drivers
2009 96 54,049 103,500 17.8 9.3
2010 92 53,391 106,001 17.2 8.7
2011 103 64,912 108,700 15.9 9.5
2012 105 66,666 113,814 15.8 9.2
2013 80 65,321 114,136 12.2 7.0
New Mexico
Licensed
Motorcycle
Drivers
Alcohol-involved Motorcycle Driver Rates
Year
Alcohol-involved
Motorcycle
Drivers/Vehicles
in Crashes
New Mexico
Registered
Motorcycles
0.0% 0.0%
10.0% 10.0%
12.5%
16.3%
5.0%
16.3% 16.3%
10.0%
2.5% 0.0% 0.0% 0.0%
0%
5%
10%
15%
20%
Pe
rce
nta
ge
of
Alc
oh
ol-
inv
olv
ed
M
oto
rcy
cle
Dri
ve
rs i
n C
rash
es
in
Ea
ch A
ge
Gro
up
Age Group
Table 44: Alcohol-involved Motorcycle Driver16 Crash Rates, 2009 - 2013
Figure 17: Percentage of Alcohol-involved Motorcycle Drivers16 in Crashes by Age Group, 2013

Demographics – Motorcyclists
43
17 “Alcohol-involved motorcycle drivers” are motorcycle drivers who were cited for DWI or indicated on the
Uniform Crash Report as being under the influence of alcohol at the time of the crash.
Count Percent Count Percent Count Percent Count Percent
10-14 0 0.0% 0 0.0% 0 0.0% 0 0.0% -
15-19 0 0.0% 0 0.0% 0 0.0% 0 0.0% -
20-24 7 9.5% 1 20.0% 0 0.0% 8 10.0% 7
25-29 8 10.8% 0 0.0% 0 0.0% 8 10.0% -
30-34 9 12.2% 1 20.0% 0 0.0% 10 12.5% 9
35-39 12 16.2% 1 20.0% 0 0.0% 13 16.3% 12
40-44 3 4.1% 1 20.0% 0 0.0% 4 5.0% 3
45-49 12 16.2% 0 0.0% 1 100.0% 13 16.3% -
50-54 13 17.6% 0 0.0% 0 0.0% 13 16.3% -
55-59 7 9.5% 1 20.0% 0 0.0% 8 10.0% 7
60-64 2 2.7% 0 0.0% 0 0.0% 2 2.5% -
65-69 0 0.0% 0 0.0% 0 0.0% 0 0.0% -
70-74 0 0.0% 0 0.0% 0 0.0% 0 0.0% -
75+ 0 0.0% 0 0.0% 0 0.0% 0 0.0% -
Missing Data 1 1.4% 0 0.0% 0 0.0% 1 1.3% -
Total 74 100% 5 100% 1 100% 80 100% 15
Age Group
Alcohol-involved Motorcycle Drivers in Crashes Ratio
Males to
FemalesMales Females TotalMissing Data
7 8
9
12
3
12 13
7
2 1 1 1 1 1
0
5
10
15
Alc
oh
ol-
inv
olv
ed
M
oto
rcy
cle
Dri
ve
rs i
n C
rash
es
in
Ea
ch A
ge
Gro
up
Age Group
Males
Females
Table 45: Alcohol-involved Motorcycle Drivers17 in Crashes by Age and Sex, 2013
Figure 18: Alcohol-involved Motorcycle Drivers17 in Crashes by Age and Sex, 2013

Demographics – Pedestrians
44
Pedestrians
Alcohol-involved pedestrian crashes accounted for 5.3% of all alcohol-involved crashes
in 2013. (Table 46)
Of the 103 alcohol-involved pedestrian crashes in 2013, 30.1% (31) were fatal crashes
and 59.2% (61) were injury crashes. (Table 47)
18 An alcohol-involved pedestrian crash is a crash involving one or more pedestrians in which any driver or
pedestrian in the crash was alcohol-involved.
Count Percent
Pedestrian-involved 103 5.3%
Pedestrian Not Involved 1,855 94.7%
Total Alcohol-involved Crashes 1,958 100.0%
Pedestrian Involvement
Alcohol-involved
Crashes
Count Percent
Fatal Crashes 31 30.1%
Injury Crashes 61 59.2%
Property Damage Only Crashes 11 10.7%
Total Alcohol-involved Pedestrian Crashes 103 100.0%
Crash Severity
Alcohol-involved
Pedestrian Crashes
Table 46: Alcohol-involved Pedestrian Crashes18, 2013
Table 47: Alcohol-involved Pedestrian18 Crashes by Crash Severity, 2013

Demographics – Pedestrians
45
In 2013, 20.3% of all pedestrian-involved crashes were alcohol-involved, down from
23.1% in 2004. (Table 48, Figure 19)
Alcohol-involved pedestrian crashes have been increasing since 2011. (Table 48)
19 An alcohol-involved pedestrian crash is a crash involving one or more pedestrians where any driver or
pedestrian in the crash was alcohol-involved.
Total Alcohol-involvedPercent
Alcohol-involved
2004 511 118 23.1%
2005 450 104 23.1%
2006 484 99 20.5%
2007 488 106 21.7%
2008 487 89 18.3%
2009 504 97 19.2%
2010 416 68 16.3%
2011 414 74 17.9%
2012 432 100 23.1%
2013 507 103 20.3%
Year
Pedestrian-involved Crashes
23.1% 23.1%
20.5% 21.7%
18.3% 19.2%
16.3% 17.9%
23.1% 20.3%
0%
10%
20%
30%
2004 2005 2006 2007 2008 2009 2010 2011 2012 2013
Alc
oh
ol-
inv
olv
ed
Pe
de
stri
an
C
rash
es
as
a P
erc
en
tag
e o
f A
ll P
ed
est
ria
n C
rash
es
Table 48: Alcohol-involved Pedestrian Crashes19, 2004 - 2013
Figure 19: Alcohol-involved Pedestrian Crashes19, 2004 - 2013

Demographics – Pedestrians
46
In 2013, over 75% of all alcohol-involved pedestrian crashes occurred in three counties
- Bernalillo, McKinley, and San Juan. (Table 49)
Out of all pedestrians in alcohol-involved crashes, 92.4% were under the influence of
alcohol. (Table 50)
In 2013, 69.1% of all alcohol-involved pedestrians in crashes were between the ages of
20 and 49 years old. (Figure 20, Table 51)
In 2013, 78.4% of alcohol-involved pedestrians in crashes were male. (Table 51)
2009 2010 2011 2012 2013
1 Bernalillo 43 31 32 47 45 674,221 0.7
2 McKinley 17 6 6 12 19 73,308 25.9
3 San Juan 6 8 9 14 14 126,503 11.1
4 Santa Fe 11 8 7 7 8 147,423 5.4
5 Doña Ana 1 3 3 4 3 213,460 1.4
19 12 17 16 14 850,372 1.6
97 68 74 100 103 2,085,287 4.9
All Other Counties
Statewide Total1 An alcohol-involved pedestrian crash is a crash involving one or more pedestrians in which any driver or
pedestrian in the crash was alcohol-involved.
2013
RankCounty
Alcohol-involved Pedestrian Crashes1
2013
Population
Alcohol-involved
Pedestrian Crashes
per 100,000 County
Residents
Pedestrians
Under the Influence
of Alcohol1
All Pedestrians in
Alcohol-involved
Crashes
Percent of Pedestrians
Under the Influence
of Alcohol2
2009 78 104 75.0%
2010 67 75 89.3%
2011 59 74 79.7%
2012 96 103 93.2%
2013 97 105 92.4%
Year
Pedestrians in Alcohol-involved Crashes
1 Pedestrians who were indicated on the Uniform Crash Report as being under the
influence of alcohol at the time of the crash.2 The percentage of pedestrians under the influence of alcohol out of all pedestrians in
alcohol-involved crashes.
Table 49: Top Five Counties for Alcohol-involved Pedestrian Crashes, 2009 - 2013
Table 50: Alcohol-involved Pedestrians in Alcohol-involved Crashes, 2009 - 2013

Demographics – Pedestrians
47
20 “Alcohol-involved pedestrians” are pedestrians who were indicated on the Uniform Crash Report as being
under the influence of alcohol at the time of the crash.
0.0% 0.0%
10.3%
15.5%
5.2%
11.3% 10.3%
16.5%
6.2%
8.2%
5.2%
2.1% 1.0%
0.0% 0%
5%
10%
15%
20%
Pe
rce
nta
ge
of
Alc
oh
ol-
inv
olv
ed
P
ed
est
ria
ns
in C
rash
es
b
y E
ach
Ag
e G
rou
p
Age Group
Count Percent Count Percent Count Percent Count Percent
10-14 0 0.0% 0 0.0% 0 0.0% 0 0.0% -
15-19 0 0.0% 0 0.0% 0 0.0% 0 0.0% -
20-24 7 9.2% 3 16.7% 0 0.0% 10 10.3% 2.3
25-29 14 18.4% 1 5.6% 0 0.0% 15 15.5% 14.0
30-34 4 5.3% 1 5.6% 0 0.0% 5 5.2% 4.0
35-39 8 10.5% 3 16.7% 0 0.0% 11 11.3% 2.7
40-44 8 10.5% 2 11.1% 0 0.0% 10 10.3% 4.0
45-49 12 15.8% 3 16.7% 1 33.3% 16 16.5% 4.0
50-54 5 6.6% 1 5.6% 0 0.0% 6 6.2% 5.0
55-59 6 7.9% 2 11.1% 0 0.0% 8 8.2% 3.0
60-64 4 5.3% 1 5.6% 0 0.0% 5 5.2% 4.0
65-69 2 2.6% 0 0.0% 0 0.0% 2 2.1% -
70-74 1 1.3% 0 0.0% 0 0.0% 1 1.0% -
75+ 0 0.0% 0 0.0% 0 0.0% 0 0.0% -
Missing Data 5 6.6% 1 5.6% 2 66.7% 8 8.2% 5.0
Total 76 100.0% 18 100.0% 3 100.0% 97 100.0% 4.21 The ratio of males to females is calculated only when there is at least one of each sex in that age group in a crash.
Age Group Males Females Missing Data Total
Alcohol-involved Pedestrians in Crashes Ratio
Males to
Females1
Table 51: Alcohol-involved Pedestrians20 in Crashes by Age, 2013
Figure 20: Percentage of Alcohol-involved Pedestrians20 in Crashes by Age, 2013

Demographics – Pedalcyclists
48
Pedalcyclists (Bicyclists)
Alcohol-involved pedalcycle crashes accounted for 1.1% of all alcohol-involved crashes
in 2013. (Table 52)
Of the 22 alcohol-involved pedalcycle crashes, none (0) were fatal crashes and 68.2%
(15) were injury crashes. (Table 53)
21 An alcohol-involved pedalcycle crash is a crash involving one or more pedalcyclists in which any vehicle
driver or pedalcyclist in the crash was alcohol-involved.
Count Percent
Pedalcycle-involved 22 1.1%
Pedalcycle Not Involved 1,936 98.9%
Total Alcohol-involved Crashes 1,958 100.0%
Pedalcycle Involvement
Alcohol-involved
Crashes
Count Percent
Fatal Crashes 0 0.0%
Injury Crashes 15 68.2%
Property Damage Only Crashes 7 31.8%
Total Alcohol-involved Pedalcycle Crashes 22 100.0%
Crash Severity
Alcohol-involved
Pedalcycle Crashes
Table 52: Alcohol-involved Pedalcycle Crashes21, 2013
Table 53: Alcohol-involved Pedalcycle Crashes21 by Crash Severity, 2013

Demographics – Pedalcyclists
49
In the last five years (2009 - 2013) the percent of alcohol-involved pedalcyclist crashes
has remained at 6% to 7% of all pedalcycle-involved crashes. (Table 54, Figure 21)
In 2013, 7.1% of all pedalcycle-involved crashes were alcohol-involved, the highest
percentage since 2006. (Table 54, Figure 21)
22 An alcohol-involved pedalcycle crash is a crash involving one or more pedalcyclists in which any vehicle
driver or pedalcyclist in the crash was alcohol-involved.
Alcohol-
involvedTotal
Percent
Alcohol-involved
2004 24 391 6.1%
2005 29 388 7.5%
2006 28 386 7.3%
2007 18 368 4.9%
2008 15 391 3.8%
2009 22 371 5.9%
2010 20 354 5.6%
2011 21 345 6.1%
2012 22 388 5.7%
2013 22 308 7.1%
Year
Pedalcycle-involved Crashes
6.1%
7.5% 7.3%
4.9%
3.8%
5.9% 5.6% 6.1% 5.7%
7.1%
0%
4%
8%
12%
2004 2005 2006 2007 2008 2009 2010 2011 2012 2013
Alc
oh
ol-
inv
olv
ed
P
ed
alc
ycl
e C
rash
es
as
a
Pe
rce
nta
ge
of
All
P
ed
alc
ycl
e C
rash
es
Table 54: Alcohol-involved Pedalcycle Crashes22, 2004 - 2013
Figure 21: Alcohol-involved Pedalcycle Crashes22, 2004 - 2013

Demographics – Pedalcyclists
50
In 2013, 31.8% of all alcohol-involved pedalcycle crashes occurred in Bernalillo County.
(Table 55)
Out of all pedalcyclists in alcohol-involved crashes, 90.9% were under the influence of
alcohol. (Table 56)
In 2013, 80% of alcohol-involved pedalcyclists in crashes were male. (Table 57)
2009 2010 2011 2012 2013
1 Bernalillo 13 7 10 13 7 674,221 1.0
2 Santa Fe 2 3 2 0 4 147,423 2.7
3 Valencia 0 1 1 0 2 76,284 2.6
4 Doña Ana 2 2 2 3 2 213,460 0.9
5 7 6 6 7 973,899 0.7
22 20 21 22 22 2,085,287 1.11 An alcohol-involved pedalcycle crash is a crash involving one or more pedalcyclists where any driver or
pedalcyclist in the crash was alcohol-involved.
2013
RankCounty
Alcohol-involved Pedalcycle Crashes1
2013
Population
Alcohol-involved
Pedalcycle Crashes
per 100,000 County
Residents
All Other Counties
Statewide Total
Pedalcyclists
Under the Influence
of Alcohol1
All Pedalcyclists in
Alcohol-involved
Crashes
Percent of Pedalcyclists
Under the Influence
of Alcohol2
2009 14 23 60.9%
2010 18 21 85.7%
2011 20 21 95.2%
2012 21 22 95.5%
2013 20 22 90.9%
Year
Pedalcyclists in Alcohol-involved Crashes
1 Pedalcyclists who were indicated on the Uniform Crash Report as being under the
influence of alcohol at the time of the crash.
2 The percentage of pedalcyclists under the influence of alcohol out of all pedalcyclists in
alcohol-involved crashes.
Table 55: Top-Ranking Counties for Alcohol-involved Pedalcycle Crashes, 2009 - 2013
Table 56: Alcohol-involved Pedalcyclists in Alcohol-involved Crashes, 2009 - 2013

Demographics – Pedalcyclists
51
23 “Alcohol-involved pedalcyclists” are pedalcyclists who were indicated on the Uniform Crash Report as
being under the influence of alcohol at the time of the crash.
Count Percent Count Percent Count Percent Count Percent
1-4 0 0.0% 0 0.0% 0 0.0% 0 0.0% -
5-9 0 0.0% 0 0.0% 0 0.0% 0 0.0% -
10-14 1 6.3% 0 0.0% 0 0.0% 1 5.0% -
15-19 0 0.0% 0 0.0% 0 0.0% 0 0.0% -
20-24 1 6.3% 0 0.0% 0 0.0% 1 5.0% -
25-29 0 0.0% 0 0.0% 0 0.0% 0 0.0% -
30-34 2 12.5% 1 50.0% 0 0.0% 3 15.0% 2.0
35-39 2 12.5% 0 0.0% 0 0.0% 2 10.0% -
40-44 0 0.0% 0 0.0% 0 0.0% 0 0.0% -
45-49 3 18.8% 0 0.0% 0 0.0% 3 15.0% -
50-54 2 12.5% 1 50.0% 0 0.0% 3 15.0% 2.0
55-59 2 12.5% 0 0.0% 0 0.0% 2 10.0% -
60-64 0 0.0% 0 0.0% 0 0.0% 0 0.0% -
65-69 0 0.0% 0 0.0% 0 0.0% 0 0.0% -
70-74 1 6.3% 0 0.0% 0 0.0% 1 5.0% -
75+ 0 0.0% 0 0.0% 0 0.0% 0 0.0% -
Missing Data 2 12.5% 0 0.0% 2 100.0% 4 20.0% -
Total 16 100.0% 2 100.0% 2 100.0% 20 100.0% 8.01 The ratio of males to females is calculated only when there is at least one of each sex in that age group in a crash.
Ratio1
Males to
Females
Age Group Males Females Total
Alcohol-involved Pedalcyclists in Crashes
Missing Data
0 0
1
0
1
0
3
2
0
3 3
2
0 0
1
0 0
1
2
3
4
5
Alc
oh
ol-
inv
olv
ed
P
ed
alc
ycl
ists
in
Cra
she
s
in E
ach
Ag
e G
rou
p
Age Group
Table 57: Alcohol-involved Pedalcyclists23 in Crashes by Age and Sex, 2013
Figure 22: Alcohol-involved Pedalcyclists23 in Crashes by Age Group, 2013

Demographics – Alcohol-involved Drivers
52
Alcohol-involved Drivers
This section presents drivers who were indicated on the Uniform Crash Report as being
under the influence of alcohol at the time of the crash.
Male drivers were 71.3% of all alcohol-involved drivers in crashes in 2013. (Table 58)
Out-of-state drivers were 5.7% of all alcohol-involved drivers in 2013. (Table 59)
24 Does not include drivers for which 1) age is less than 15, 2) age or sex data are not available, 3) residence is
not in New Mexico (excepting Table 59), or 4) the person is a pedestrian or pedalcyclist.
Count Percent
Males 1,148 71.3%
Females 462 28.7%
Total Drivers 1,610 100.0%
SexAlcohol-involved Drivers
Count Percent Count Percent Count Percent Count Percent
Operator 1,212 96.8% 38 3.0% 2 0.2% 1,252 100%
CDL Class A 29 74.4% 10 25.6% 0 0.0% 39 100%
CDL Class B 12 92.3% 1 7.7% 0 0.0% 13 100%
CDL Class C 18 39.1% 25 54.3% 3 6.5% 46 100%
Learner's Permit 1 100.0% 0 0.0% 0 0.0% 1 100%
ID (Non-license) 180 94.7% 10 5.3% 0 0.0% 190 100%
None 7 100.0% 0 0.0% 0 0.0% 7 100%
CDL Non-Commercial 4 66.7% 2 33.3% 0 0.0% 6 100%
Motorcycle Only 3 100.0% 0 0.0% 0 0.0% 3 100%
Missing Data 144 81.8% 13 7.4% 19 10.8% 176 100%
Total 1,610 92.9% 99 5.7% 24 1.4% 1,733 100%
New Mexico Resident Out of State Missing Data Total DriversType of Driver
License
Alcohol-involved Drivers (Residents and Non-Residents)
Table 58: Alcohol-involved Drivers24 in Crashes by Sex, 2013
Table 59: Alcohol-involved Drivers24 in Crashes by License Type and Residence, 2013

Demographics – Alcohol-involved Drivers
53
The 20-24 age group had both the highest number and rate of alcohol-involved drivers
in crashes in 2013. (Table 60, Figure 23, Figure 25)
The 25-29 age group accounted for 17.8% of all alcohol-involved drivers in crashes and
had the second-highest alcohol-involved driver crash rate. (Table 60, Figure 23)
25 Does not include drivers for which 1) age is less than 15, 2) age or sex data are not available, 3) the
residence is not in New Mexico, or 4) the person is a pedestrian or pedalcyclist.
6%
24%
18%
11% 11%
8% 7% 6%
4% 3%
1% 0.4% 0.6%
0
20
40
60
0%
10%
20%
30%
Alco
ho
l-inv
olv
ed
Driv
ers
pe
r 10
,00
0 L
icen
sed
Driv
ers
in E
ach
Ag
e G
rou
p
Pe
rce
nta
ge
of
all
Alc
oh
ol-
inv
olv
ed
D
riv
ers
in
Ea
ch A
ge
Gro
up
Age Group
Percentage of all Alcohol-involved Drivers in Crashes
0.0
2.0
4.0
6.0
8.0
0
100
200
300
400 Ra
tio o
f Ma
les to
Fe
ma
les A
lco
ho
l-in
vo
lve
d D
riv
ers
in
Ea
ch A
ge
Gro
up
Age Group
Males
Females
Ratio Male to Female
Figure 23: Percentage and Rate of Alcohol-involved Drivers25 in Crashes by Age Group, 2013
Figure 24: Alcohol-involved Drivers in Crashes by Age and Sex, 2013

Demographics – Alcohol-involved Drivers
54
26 Does not include drivers for which 1) age is less than 15, 2) age or sex data are not available, 3) the
residence is not in New Mexico, or 4) the person is a pedestrian or pedalcyclist.
Count Percent Count Percent Count Percent
15-19 66 5.7% 25 5.4% 91 5.7% 2.6 60,243 15.1
20-24 277 24.1% 112 24.2% 389 24.2% 2.5 119,028 32.7
25-29 207 18.0% 80 17.3% 287 17.8% 2.6 133,363 21.5
30-34 119 10.4% 59 12.8% 178 11.1% 2.0 139,586 12.8
35-39 129 11.2% 46 10.0% 175 10.9% 2.8 124,709 14.0
40-44 81 7.1% 43 9.3% 124 7.7% 1.9 123,295 10.1
45-49 73 6.4% 40 8.7% 113 7.0% 1.8 122,726 9.2
50-54 73 6.4% 27 5.8% 100 6.2% 2.7 140,097 7.1
55-59 53 4.6% 12 2.6% 65 4.0% 4.4 137,236 4.7
60-64 39 3.4% 9 1.9% 48 3.0% 4.3 125,240 3.8
65-69 19 1.7% 4 0.9% 23 1.4% 4.8 101,262 2.3
70-74 6 0.5% 1 0.2% 7 0.4% 6.0 69,936 1.0
75+ 6 0.5% 4 0.9% 10 0.6% 1.5 82,114 1.2
Total 1,148 100% 462 100% 1,610 100% 2.5 1,478,835 10.9
Age
GroupMales Females
Alcohol-involved Drivers in Crashes
Ratio
Male to
Female
Total
2013
Licensed
Drivers
Rate
(Alcohol-involved
Drivers per 10,000
Licensed Drivers
in Each Age Group)
91
389
287
178 175
124 113 100 65 48
23 7 10
0
100
200
300
400
500
Alc
oh
ol-
inv
olv
ed
Dri
ve
rs
in E
ach
Ag
e G
rou
p
Age Group
Number of Alcohol-involved Drivers in Crashes
Table 60: Alcohol-involved Drivers26 in Crashes by Age and Sex, 2013
Figure 25: Alcohol-involved Drivers26 in Crashes by Age Group, 2013

Demographics – Alcohol-involved Drivers
55
27 Does not include drivers for which 1) age is less than 15, 2) age or sex data are not available, 3) the
residence is not in New Mexico, or 4) the person is a pedestrian or pedalcyclist.
2004 2005 2006 2007 2008 2009 2010 2011 2012 2013
15 - 19 313 267 237 234 182 213 141 166 161 91 -70.9%
20 - 24 546 508 453 491 448 507 412 460 391 389 -28.8%
25 - 29 365 314 344 330 320 383 304 344 296 287 -21.4%
30 - 34 303 209 214 177 199 271 244 240 241 178 -41.3%
35 - 39 266 186 193 176 170 192 163 170 169 175 -34.2%
40 - 44 256 210 169 174 149 176 159 153 151 124 -51.6%
45 - 49 181 154 148 168 158 170 140 159 143 113 -37.6%
50 - 54 133 100 117 103 94 111 122 119 110 100 -24.8%
55 - 59 78 64 58 76 65 73 74 67 63 65 -16.7%
60 - 64 45 41 29 25 36 44 41 50 46 48 6.7%
65 - 69 20 18 19 13 14 21 25 29 23 23 15.0%
70 - 74 17 15 10 17 10 8 6 11 10 7 -58.8%
75+ 14 6 10 8 8 14 4 5 13 10 -28.6%
Total 2,537 2,092 2,001 1,992 1,853 2,183 1,835 1,973 1,817 1,610 -36.5%1 Numbers are shaded such that darker shading identifies higher numbers.
Age
Group
Alcohol-involved Drivers in Crashes1 Percent
Change 2004-2013
Table 61: Alcohol-involved Drivers27 in Crashes by Age Group, 2004 - 2013
Photo Courtesy NMDOT

Demographics – Seat Position and Victims
56
Seat Position and Victims
There were 89 male and 5 female motorcycle drivers in alcohol-involved crashes in
2013, resulting in a male-to-female motorcycle driver ratio of 17.8 to 1. (Table 62)
There were 18 male and 2 female pedalcyclists in alcohol-involved crashes in 2013,
resulting in a male-to-female pedalcyclist ratio of 9.0 to 1. (Table 62)
In 2013, over half of all people in alcohol-involved crashes were victims. (Table 63)
Males Females Missing Data Total
Vehicle Occupants
Drivers 1,381 672 34 2,087 2.1
Front Seat Passengers 402 361 9 772 1.1
All Other Passengers 248 200 9 457 1.2
Motorcyclists
Motorcycle Drivers 89 5 2 96 17.8
Motorcycle Passengers 2 9 3 14 0.2
Nonmotorists
Pedalcyclists 18 2 2 22 9.0
Pedestrians 81 19 5 105 4.3
Missing Data 388 222 366 976 1.7
Total People 2,609 1,490 430 4,529 1.8
Ratio
Males to
Females
Seat PositionPeople in Alcohol-involved Crashes
Victims1 44 78 155 419 1,854 2,550 56.3%
Non-victims2 93 106 333 204 1,243 1,979 43.7%
Total People 137 184 488 623 3,097 4,529 100.0%
2 Non-victims are any alcohol-involved drivers, pedalcyclists or pedestrians.
1 Victims are all passengers and any non-alcohol-involved drivers, pedalcyclists or pedestrians.
Victim
Category
People in Alcohol-involved Crashes
Fatalities
(Class K)
Suspected
Serious Injuries
(Class A)
Suspected
Minor Injuries
(Class B)
Possible
Injuries
(Class C)
No Apparent
Injuries
(Class O)
Total
People
Percent
of Total
Table 62: People in Alcohol-involved Crashes by Sex and Seat Position, 2013
Table 63: Victims of Alcohol-involved Crashes, 2013

Demographics – Belt Usage
57
Belt Usage
There were 41 male and 25 female unbelted fatalities in alcohol-involved crashes in
2013. (Table 64)
One in five of all unbelted fatalities in alcohol-involved crashes were 20-24 years of age
(22.7%). (Table 64)
28 Fatalities of people in passenger cars, pickups, and van/4WD/SUVs in alcohol-involved crashes.
Count Percent Count Percent Count Percent
1-4 1 2.4% 1 4.0% 2 3.0% 1.0
5-9 0 0.0% 0 0.0% 0 0.0% -
10-14 0 0.0% 2 8.0% 2 3.0% -
15-19 5 12.2% 1 4.0% 6 9.1% 5.0
20-24 7 17.1% 8 32.0% 15 22.7% 0.9
25-29 8 19.5% 3 12.0% 11 16.7% 2.7
30-34 4 9.8% 4 16.0% 8 12.1% 1.0
35-39 4 9.8% 1 4.0% 5 7.6% 4.0
40-44 2 4.9% 0 0.0% 2 3.0% -
45-49 2 4.9% 0 0.0% 2 3.0% -
50-54 1 2.4% 3 12.0% 4 6.1% 0.3
55-59 4 9.8% 1 4.0% 5 7.6% 4.0
60-64 2 4.9% 1 4.0% 3 4.5% 2.0
65-69 0 0.0% 0 0.0% 0 0.0% -
70-74 0 0.0% 0 0.0% 0 0.0% -
75 + 1 2.4% 0 0.0% 1 1.5% -
Missing Data 0 0.0% 0 0.0% 0 0.0% -
Total 41 100.0% 25 100.0% 66 100.0% 1.6
Age Group
Ratio
Males to
FemalesTotalFemalesMales
Unbelted Fatalities in Alcohol-involved Crashes
Table 64: Unbelted Fatalities28 in Alcohol-involved Crashes by Age and Sex, 2013

DWI Enforcement – Arrests
58
Arrests
29 “County” refers to the county where the person was arrested for DWI, not their county of residence. DWI
arrests are for either DWI or aggravated DWI.
2009 2010 2011 2012 2013
Bernalillo 6,776 5,331 5,004 4,808 3,968 31.4% -41.4% -17.5%
Catron 24 21 21 14 6 0.0% -75.0% -57.1%
Chaves 344 379 326 319 222 1.8% -35.5% -30.4%
Cibola 501 472 296 244 205 1.6% -59.1% -16.0%
Colfax 73 88 103 56 55 0.4% -24.7% -1.8%
Curry 459 434 280 264 133 1.1% -71.0% -49.6%
De Baca 18 10 10 10 9 0.1% -50.0% -10.0%
Doña Ana 1,638 1,524 1,321 1,329 1,293 10.2% -21.1% -2.7%
Eddy 357 350 336 288 220 1.7% -38.4% -23.6%
Grant 276 227 242 178 187 1.5% -32.2% 5.1%
Guadalupe 92 55 48 50 49 0.4% -46.7% -2.0%
Harding 4 2 1 1 0 0.0% -100.0% -100.0%
Hidalgo 97 70 43 66 41 0.3% -57.7% -37.9%
Lea 534 447 373 319 357 2.8% -33.1% 11.9%
Lincoln 186 255 157 135 108 0.9% -41.9% -20.0%
Los Alamos 54 42 56 62 56 0.4% 3.7% -9.7%
Luna 216 131 150 126 100 0.8% -53.7% -20.6%
McKinley 1,187 992 752 615 738 5.8% -37.8% 20.0%
Mora 36 35 22 16 26 0.2% -27.8% 62.5%
Otero 326 280 247 302 356 2.8% 9.2% 17.9%
Quay 81 68 65 60 61 0.5% -24.7% 1.7%
Rio Arriba 468 390 271 265 395 3.1% -15.6% 49.1%
Roosevelt 155 155 156 84 67 0.5% -56.8% -20.2%
Sandoval 618 601 535 702 699 5.5% 13.1% -0.4%
San Juan 1,747 1,575 1,422 1,210 1,193 9.4% -31.7% -1.4%
San Miguel 313 347 222 185 185 1.5% -40.9% 0.0%
Santa Fe 1,258 1,148 1,111 922 899 7.1% -28.5% -2.5%
Sierra 92 147 151 132 88 0.7% -4.3% -33.3%
Socorro 239 177 213 174 105 0.8% -56.1% -39.7%
Taos 236 318 214 173 198 1.6% -16.1% 14.5%
Torrance 114 91 80 74 69 0.5% -39.5% -6.8%
Union 21 15 15 17 10 0.1% -52.4% -41.2%
Valencia 506 512 316 260 290 2.3% -42.7% 11.5%
Missing Data 28 35 106 223 254 2.0% 807.1% 13.9%
Total DWI Arrests 19,074 16,724 14,665 13,683 12,642 100.0% -33.7% -7.6%
CountyDWI Arrests Percent of
all 2013
DWI Arrests
Percent
Change
2009-2013
Percent
Change
2012-2013
DWI Enforcement
Table 65: DWI Arrests by County29, 2009 - 2013

DWI Enforcement – Arrests
59
30 “City” refers to the city residence of the driver, not the city where the driver was arrested for DWI. DWI
arrests are for either DWI or aggravated DWI.
2009 2010 2011 2012 2013
Alamogordo 202 175 175 186 209 1.7% 3.5% 12.4%
Albuquerque 5,564 4,479 4,159 3,999 3,422 27.1% -38.5% -14.4%
Anthony 98 104 77 107 120 0.9% 22.4% 12.1%
Artesia 112 117 107 85 46 0.4% -58.9% -45.9%
Aztec 146 135 109 103 98 0.8% -32.9% -4.9%
Belen 183 174 120 109 125 1.0% -31.7% 14.7%
Bernalillo 118 76 93 84 80 0.6% -32.2% -4.8%
Bloomfield 156 139 137 93 98 0.8% -37.2% 5.4%
Carlsbad 239 211 202 186 157 1.2% -34.3% -15.6%
Clovis 375 339 240 242 124 1.0% -66.9% -48.8%
Corrales 51 50 35 45 34 0.3% -33.3% -24.4%
Cuba 63 59 64 48 46 0.4% -27.0% -4.2%
Deming 191 123 142 115 99 0.8% -48.2% -13.9%
Edgewood 81 67 63 67 50 0.4% -38.3% -25.4%
Española 244 250 176 148 183 1.4% -25.0% 23.6%
Farmington 664 547 579 498 481 3.8% -27.6% -3.4%
Fruitland 106 118 97 74 82 0.6% -22.6% 10.8%
Gallup 392 330 241 186 208 1.6% -46.9% 11.8%
Grants 145 145 91 77 68 0.5% -53.1% -11.7%
Hobbs 330 284 235 192 233 1.8% -29.4% 21.4%
Kirtland 89 108 94 70 58 0.5% -34.8% -17.1%
Las Cruces 1,064 941 851 739 754 6.0% -29.1% 2.0%
Las Vegas 223 255 168 140 148 1.2% -33.6% 5.7%
Los Alamos 61 46 72 55 56 0.4% -8.2% 1.8%
Los Lunas 394 355 259 257 243 1.9% -38.3% -5.4%
Lovington 117 84 64 71 50 0.4% -57.3% -29.6%
Portales 134 132 113 67 58 0.5% -56.7% -13.4%
Ranchos de Taos 57 82 47 51 56 0.4% -1.8% 9.8%
Raton 35 37 46 23 27 0.2% -22.9% 17.4%
Rio Rancho 585 501 504 553 489 3.9% -16.4% -11.6%
Roswell 320 348 329 302 226 1.8% -29.4% -25.2%
Ruidoso 69 80 50 45 39 0.3% -43.5% -13.3%
Santa Fe 1,098 922 920 865 795 6.3% -27.6% -8.1%
Shiprock 207 212 149 128 148 1.2% -28.5% 15.6%
Silver City 149 129 142 111 115 0.9% -22.8% 3.6%
Socorro 117 99 92 94 55 0.4% -53.0% -41.5%
Sunland Park 84 62 76 81 61 0.5% -27.4% -24.7%
T or C 50 65 70 63 36 0.3% -28.0% -42.9%
Taos 95 124 104 77 73 0.6% -23.2% -5.2%
Thoreau 59 50 39 30 34 0.3% -42.4% 13.3%
Tucumcari 48 41 31 48 39 0.3% -18.8% -18.8%
Missing Data 55 35 8 20 13 0.1% -76.4% -35.0%
All Other Cities 4,504 4,094 3,295 3,149 3,106 24.6% -31.0% -1.4%
Total DWI Arrests 19,074 16,724 14,665 13,683 12,642 100.0% -33.7% -7.6%
CityDWI Arrests Percent of
all 2013
DWI Arrests
Percent
Change
2009-2013
Percent
Change
2012-2013
Table 66: DWI Arrests by City30, 2009 - 2013

DWI Enforcement – Arrests
60
31 DWI arrests are for either DWI or aggravated DWI.
Count Percent Count Percent Count Percent Count Percent
<15 0 0.0% 0 0.0% 0 0.0% 0 0.0% -
15-19 359 4.2% 116 3.7% 58 6.1% 533 4.2% 3.1
20-24 1,673 19.5% 683 21.9% 186 19.6% 2,542 20.1% 2.4
25-29 1,642 19.2% 602 19.3% 186 19.6% 2,430 19.2% 2.7
30-34 1,241 14.5% 471 15.1% 141 14.9% 1,853 14.7% 2.6
35-39 926 10.8% 336 10.8% 93 9.8% 1,355 10.7% 2.8
40-44 744 8.7% 331 10.6% 81 8.5% 1,156 9.1% 2.2
45-49 651 7.6% 235 7.5% 78 8.2% 964 7.6% 2.8
50-54 596 7.0% 196 6.3% 49 5.2% 841 6.7% 3.0
55-59 366 4.3% 83 2.7% 37 3.9% 486 3.8% 4.4
60-64 219 2.6% 36 1.2% 19 2.0% 274 2.2% 6.1
65-69 99 1.2% 23 0.7% 11 1.2% 133 1.1% 4.3
70-74 37 0.4% 4 0.1% 6 0.6% 47 0.4% 9.3
75 + 19 0.2% 6 0.19% 2 0.2% 27 0.2% 3.2
Missing Data 0 0.0% 0 0.0% 1 0.1% 1 0.0% -
Total 8,572 100.0% 3,122 100.0% 948 100.0% 12,642 100.0% 2.7
Age Group
DWI Arrests by Age and Sex Ratio
Males to
Females
Males Females Unknown Total
0.0
3.0
6.0
9.0
12.0
0
500
1,000
1,500
2,000
Ra
tio o
f Ma
le D
WI A
rrests
to F
em
ale
DW
I Arre
sts
DW
I A
rre
sts
in
Ea
ch A
ge
Gro
up
Age Group
Males
Females
Ratio Males to Females
Table 67: DWI Arrests by Age and Sex31, 2013
Figure 26: DWI Arrests by Age and Sex31, 2013

DWI Enforcement – Arrests
61
32 DWI arrests are for either DWI or aggravated DWI.
2009 2010 2011 2012 2013
<15 6 2 2 3 0 -100.0%
15-19 1,220 956 826 705 533 -56.3%
20-24 3,914 3,354 3,095 2,839 2,542 -35.1%
25-29 3,490 3,132 2,778 2,410 2,430 -30.4%
30-34 2,470 2,220 2,044 1,985 1,853 -25.0%
35-39 2,143 1,736 1,448 1,416 1,355 -36.8%
40-44 1,841 1,592 1,322 1,287 1,156 -37.2%
45-49 1,726 1,487 1,222 1,082 964 -44.1%
50-54 1,106 1,111 885 894 841 -24.0%
55-59 606 581 567 531 486 -19.8%
60-64 322 317 286 312 274 -14.9%
65-69 150 149 123 158 133 -11.3%
70-74 50 56 46 40 47 -6.0%
75 + 27 30 21 20 27 0.0%
Missing Data 3 1 0 1 1 -66.7%
Total 19,074 16,724 14,665 13,683 12,642 -33.7%
Age
Group
Drivers Arrested for DWI1 Percent
Change
2009-2013
1 The number of drivers are shaded such that darker shading identifies higher numbers.
19,074 16,724
14,665 13,683 12,642
0
8,000
16,000
24,000
2009 2010 2011 2012 2013
Dri
ve
rs A
rre
ste
d f
or
DW
I
Table 68: Number of Drivers Arrested for a DWI32, 2009 - 2013
Figure 27: Number of Drivers Arrested for DWI32, 2009 - 2013

DWI Enforcement – Convictions
62
Convictions
33 “County” refers to the location where the driver was arrested for DWI, not their county of residence.
2009 2010 2011 2012 2013
Bernalillo 5,538 4,492 4,132 4,119 3,012 28.1% -45.6% -26.9%
Catron 20 16 17 13 7 0.1% -65.0% -46.2%
Chaves 357 343 345 331 216 2.0% -39.5% -34.7%
Cibola 328 328 227 207 125 1.2% -61.9% -39.6%
Colfax 84 63 77 45 44 0.4% -47.6% -2.2%
Curry 366 404 291 264 173 1.6% -52.7% -34.5%
De Baca 11 9 11 6 11 0.1% 0.0% 83.3%
Doña Ana 1,469 1,437 1,253 1,256 1,037 9.7% -29.4% -17.4%
Eddy 341 335 369 311 222 2.1% -34.9% -28.6%
Grant 238 229 199 144 184 1.7% -22.7% 27.8%
Guadalupe 73 62 38 41 47 0.4% -35.6% 14.6%
Harding 3 0 2 1 0 0.0% -100.0% -100.0%
Hidalgo 98 68 38 56 45 0.4% -54.1% -19.6%
Lea 495 458 430 286 367 3.4% -25.9% 28.3%
Lincoln 210 212 196 162 128 1.2% -39.0% -21.0%
Los Alamos 55 42 42 62 46 0.4% -16.4% -25.8%
Luna 189 122 134 130 95 0.9% -49.7% -26.9%
McKinley 916 923 657 526 571 5.3% -37.7% 8.6%
Mora 35 31 20 8 19 0.2% -45.7% 137.5%
Otero 333 284 258 248 303 2.8% -9.0% 22.2%
Quay 81 54 62 50 62 0.6% -23.5% 24.0%
Rio Arriba 354 311 234 181 256 2.4% -27.7% 41.4%
Roosevelt 138 142 143 116 80 0.7% -42.0% -31.0%
Sandoval 570 524 444 558 702 6.6% 23.2% 25.8%
San Juan 1,769 1,457 1,573 1,171 1,105 10.3% -37.5% -5.6%
San Miguel 296 310 220 171 165 1.5% -44.3% -3.5%
Santa Fe 979 883 895 892 667 6.2% -31.9% -25.2%
Sierra 97 119 145 123 78 0.7% -19.6% -36.6%
Socorro 199 120 162 151 119 1.1% -40.2% -21.2%
Taos 175 247 183 119 148 1.4% -15.4% 24.4%
Torrance 98 91 81 59 75 0.7% -23.5% 27.1%
Union 15 10 12 12 16 0.1% 6.7% 33.3%
Valencia 289 345 292 215 240 2.2% -17.0% 11.6%
Missing Data 25 19 54 59 337 3.1% 1248.0% 471.2%
Total Convictions 16,244 14,490 13,236 12,093 10,702 100.0% -34.1% -11.5%
CountyDWI Convictions Percent of
all 2013
Convictions
Percent
Change
2009-2013
Percent
Change
2012-2013
Table 69: DWI Convictions by County33, 2009 - 2013

DWI Enforcement – Convictions
63
In New Mexico, there were 51.3 DWI convictions per 10,000 residents in 2013. San Juan
(87.3), McKinley (77.9), Lea (53.9), and Sandoval (51.4) had DWI conviction rates
higher than the statewide rate of 51.3. (Table 70)
34 “County” refers to the location where the driver was arrested for DWI, not their county of residence.
2009 2010 2011 2012 2013
1 Bernalillo 5,538 4,492 4,132 4,119 3,012 674,221 44.7
2 Doña Ana 1,469 1,437 1,253 1,256 1,037 213,460 48.6
3 San Juan 1,769 1,457 1,573 1,171 1,105 126,503 87.3
4 Santa Fe 979 883 895 892 667 147,423 45.2
5 Sandoval 570 524 444 558 702 136,575 51.4
6 McKinley 916 923 657 526 571 73,308 77.9
7 Chaves 357 343 345 331 216 65,823 32.8
8 Eddy 341 335 369 311 222 55,471 40.0
9 Lea 495 458 430 286 367 68,062 53.9
10 Curry 366 404 291 264 173 50,598 34.2
3,444 3,234 2,847 2,379 2,630 473,843 55.5
16,244 14,490 13,236 12,093 10,702 2,085,287 51.3Statewide Total
New Mexico DWI Total Convictions 2013
Population
DWI Convictions
per 10,000 County
Residents, 2013
2013
RankCounty
All Other Counties
28%
10%
10%
6%
7%
39%
Bernalillo 28.1%
Doña Ana 9.7%
San Juan 10.3%
Santa Fe 6.2%
Sandoval 6.6%
All Other 39.0%
Table 70: Top Ten Counties for DWI Convictions34, 2009 - 2013
Figure 28: Top Five Counties for DWI Convictions34, 2013

DWI Enforcement – Convictions
64
35 “County” refers to the location where the driver was arrested for DWI, not their county of residence.
2009 2010 2011 2012 2013
Bernalillo 3,400 2,595 2,367 2,419 1,836 31.2% -46.0% -24.1%
Catron 7 8 5 7 3 0.1% -57.1% -57.1%
Chaves 210 210 189 172 123 2.1% -41.4% -28.5%
Cibola 162 148 118 108 64 1.1% -60.5% -40.7%
Colfax 52 47 41 23 23 0.4% -55.8% 0.0%
Curry 239 250 182 147 87 1.5% -63.6% -40.8%
De Baca 7 2 5 3 8 0.1% 14.3% 166.7%
Doña Ana 943 830 713 742 589 10.0% -37.5% -20.6%
Eddy 214 191 199 164 134 2.3% -37.4% -18.3%
Grant 133 124 101 66 86 1.5% -35.3% 30.3%
Guadalupe 43 27 19 23 23 0.4% -46.5% 0.0%
Harding 1 0 1 0 0 0.0% -100.0% 0.0%
Hidalgo 64 45 29 43 32 0.5% -50.0% -25.6%
Lea 311 263 219 168 210 3.6% -32.5% 25.0%
Lincoln 126 134 109 86 78 1.3% -38.1% -9.3%
Los Alamos 39 20 21 40 21 0.4% -46.2% -47.5%
Luna 106 64 73 70 50 0.9% -52.8% -28.6%
McKinley 438 436 280 235 257 4.4% -41.3% 9.4%
Mora 17 16 8 2 8 0.1% -52.9% 300.0%
Otero 193 166 150 151 173 2.9% -10.4% 14.6%
Quay 53 34 32 29 34 0.6% -35.8% 17.2%
Rio Arriba 157 128 104 79 94 1.6% -40.1% 19.0%
Roosevelt 89 84 90 77 53 0.9% -40.4% -31.2%
Sandoval 311 265 249 305 382 6.5% 22.8% 25.2%
San Juan 907 694 757 546 524 8.9% -42.2% -4.0%
San Miguel 123 133 87 68 66 1.1% -46.3% -2.9%
Santa Fe 549 466 462 493 353 6.0% -35.7% -28.4%
Sierra 62 68 80 72 43 0.7% -30.6% -40.3%
Socorro 98 62 78 71 58 1.0% -40.8% -18.3%
Taos 105 132 94 65 82 1.4% -21.9% 26.2%
Torrance 46 43 41 44 34 0.6% -26.1% -22.7%
Union 10 8 9 10 11 0.2% 10.0% 10.0%
Valencia 132 160 146 106 121 2.1% -8.3% 14.2%
Missing Data 13 9 26 35 218 3.7% 1576.9% 522.9%
Total 9,360 7,862 7,084 6,669 5,878 100.0% -37.2% -11.9%
CountyFirst DWI Convictions Percent of
First 2013
Convictions
Percent
Change
2009-2013
Percent
Change
2012-2013
Table 71: Number of Drivers with a First DWI Conviction35, 2009 - 2013

DWI Enforcement – Convictions
65
36 “Age” refers to age at the time of conviction (not age at the time of arrest).
Count Percent Count Percent Count Percent Count Percent
<15 0 0.0% 0 0.0% 0 0.0% 0 0.0% -
15-19 180 5.0% 70 4.3% 27 0.0% 277 4.7% 2.6
20-24 938 26.2% 412 25.1% 116 0.0% 1,466 24.9% 2.3
25-29 776 21.7% 342 20.9% 133 0.0% 1,251 21.3% 2.3
30-34 503 14.1% 243 14.8% 101 0.0% 847 14.4% 2.1
35-39 348 9.7% 160 9.8% 73 0.0% 581 9.9% 2.2
40-44 230 6.4% 156 9.5% 65 0.0% 451 7.7% 1.5
45-49 211 5.9% 101 6.2% 55 0.0% 367 6.2% 2.1
50-54 161 4.5% 78 4.8% 38 0.0% 277 4.7% 2.1
55-59 99 2.8% 45 2.7% 26 0.0% 170 2.9% 2.2
60-64 73 2.0% 20 1.2% 11 0.0% 104 1.8% 3.7
65-69 38 1.1% 10 0.6% 8 0.0% 56 1.0% 3.8
70-74 14 0.4% 0 0.0% 5 0.0% 19 0.3% 14.0
75 + 8 0.2% 2 0.1% 1 0.0% 11 0.2% 4.0
Missing Data 0 0.0% 0 0.0% 1 0.0% 1 0.0% -
Total 3,579 100.0% 1,639 100.0% 660 0.0% 5,878 100.0% 2.2
Ratio
Males to
Females
First DWI Convictions
Age Group Missing Data TotalFemalesMales
0.0
3.0
6.0
9.0
12.0
15.0
0
300
600
900
1,200
1,500
Ra
tio o
f Ma
les to
Fe
ma
les
for F
irst DW
I Co
nv
iction
s
Fir
st D
WI
Co
nv
icti
on
s
in E
ach
Ag
e G
rou
p
Age Group
Males
Females
Ratio Males to Females
Table 72: First DWI Convictions by Age36 and Sex, 2013
Figure 29: First DWI Convictions by Age36 and Sex, 2013

DWI Enforcement – Convictions
66
37 These are the number of drivers repeatedly convicted of either DWI or aggravated DWI.
“County” refers to the location where the driver was arrested for DWI, not their county of residence.
2009 2010 2011 2012 2013
Bernalillo 2,138 1,897 1,765 1,700 1,176 24.4% -45.0% -30.8%
Catron 13 8 12 6 4 0.1% -69.2% -33.3%
Chaves 147 133 156 159 93 1.9% -36.7% -41.5%
Cibola 166 180 109 99 61 1.3% -63.3% -38.4%
Colfax 32 16 36 22 21 0.4% -34.4% -4.5%
Curry 127 154 109 117 86 1.8% -32.3% -26.5%
De Baca 4 7 6 3 3 0.1% -25.0% 0.0%
Doña Ana 526 607 540 514 448 9.3% -14.8% -12.8%
Eddy 127 144 170 147 88 1.8% -30.7% -40.1%
Grant 105 105 98 78 98 2.0% -6.7% 25.6%
Guadalupe 30 35 19 18 24 0.5% -20.0% 33.3%
Harding 2 0 1 1 0 0.0% -100.0% -100.0%
Hidalgo 34 23 9 13 13 0.3% -61.8% 0.0%
Lea 184 195 211 118 157 3.3% -14.7% 33.1%
Lincoln 84 78 87 76 50 1.0% -40.5% -34.2%
Los Alamos 16 22 21 22 25 0.5% 56.3% 13.6%
Luna 83 58 61 60 45 0.9% -45.8% -25.0%
McKinley 478 487 377 291 314 6.5% -34.3% 7.9%
Mora 18 15 12 6 11 0.2% -38.9% 83.3%
Otero 140 118 108 97 130 2.7% -7.1% 34.0%
Quay 28 20 30 21 28 0.6% 0.0% 33.3%
Rio Arriba 197 183 130 102 162 3.4% -17.8% 58.8%
Roosevelt 49 58 53 39 27 0.6% -44.9% -30.8%
Sandoval 259 259 195 253 320 6.6% 23.6% 26.5%
San Juan 862 763 816 625 581 12.0% -32.6% -7.0%
San Miguel 173 177 133 103 99 2.1% -42.8% -3.9%
Santa Fe 430 417 433 399 314 6.5% -27.0% -21.3%
Sierra 35 51 65 51 35 0.7% 0.0% -31.4%
Socorro 101 58 84 80 61 1.3% -39.6% -23.8%
Taos 70 115 89 54 66 1.4% -5.7% 22.2%
Torrance 52 48 40 15 41 0.8% -21.2% 173.3%
Union 5 2 3 2 5 0.1% 0.0% 150.0%
Valencia 157 185 146 109 119 2.5% -24.2% 9.2%
Missing Data 12 10 28 24 119 2.5% 891.7% 395.8%
Total 6,884 6,628 6,152 5,424 4,824 100.0% -29.9% -11.1%
County
Repeat DWI Convictions Percent of
all 2013
Convictions
Percent
Change
2009-2013
Percent
Change
2012-2013
Table 73: Repeat DWI Convictions by County37, 2009 - 2013
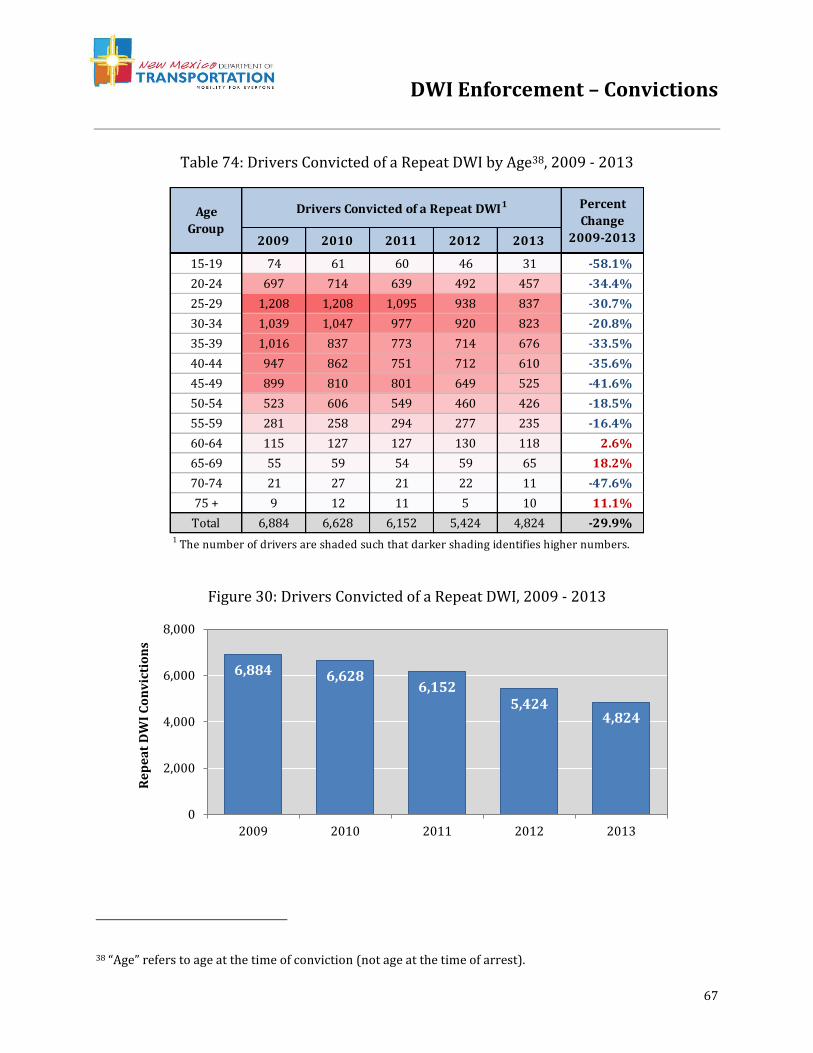
DWI Enforcement – Convictions
67
38 “Age” refers to age at the time of conviction (not age at the time of arrest).
2009 2010 2011 2012 2013
15-19 74 61 60 46 31 -58.1%
20-24 697 714 639 492 457 -34.4%
25-29 1,208 1,208 1,095 938 837 -30.7%
30-34 1,039 1,047 977 920 823 -20.8%
35-39 1,016 837 773 714 676 -33.5%
40-44 947 862 751 712 610 -35.6%
45-49 899 810 801 649 525 -41.6%
50-54 523 606 549 460 426 -18.5%
55-59 281 258 294 277 235 -16.4%
60-64 115 127 127 130 118 2.6%
65-69 55 59 54 59 65 18.2%
70-74 21 27 21 22 11 -47.6%
75 + 9 12 11 5 10 11.1%
Total 6,884 6,628 6,152 5,424 4,824 -29.9%
Age
Group
Drivers Convicted of a Repeat DWI1 Percent
Change
2009-2013
1 The number of drivers are shaded such that darker shading identifies higher numbers.
6,884 6,628 6,152
5,424 4,824
0
2,000
4,000
6,000
8,000
2009 2010 2011 2012 2013
Re
pe
at
DW
I C
on
vic
tio
ns
Table 74: Drivers Convicted of a Repeat DWI by Age38, 2009 - 2013
Figure 30: Drivers Convicted of a Repeat DWI, 2009 - 2013

DWI Enforcement – Convictions
68
39 “Age” refers to age at the time of conviction (not age at the time of arrest).
Count Percent Count Percent Count Percent Count Percent
15-19 25 0.7% 4 0.4% 2 1.2% 31 0.6% 6.3
20-24 349 9.4% 87 9.1% 21 12.5% 457 9.5% 4.0
25-29 641 17.3% 168 17.7% 28 16.7% 837 17.4% 3.8
30-34 623 16.8% 168 17.7% 32 19.0% 823 17.1% 3.7
35-39 533 14.4% 123 12.9% 20 11.9% 676 14.0% 4.3
40-44 445 12.0% 143 15.0% 22 13.1% 610 12.6% 3.1
45-49 390 10.5% 114 12.0% 21 12.5% 525 10.9% 3.4
50-54 325 8.8% 89 9.4% 12 7.1% 426 8.8% 3.7
55-59 198 5.3% 32 3.4% 5 3.0% 235 4.9% 6.2
60-64 102 2.8% 12 1.3% 4 2.4% 118 2.4% 8.5
65-69 55 1.5% 9 0.9% 1 0.6% 65 1.3% 6.1
70-74 11 0.3% 0 0.0% 0 0.0% 11 0.2% -
75 + 8 0.2% 2 0.2% 0 0.0% 10 0.2% 4.0
Total 3,705 100.0% 951 100.0% 168 100.0% 4,824 100.0% 3.9
Age
Group
Repeat DWI Convictions Ratio
Males to
FemalesMales Females Missing Data Total
0
5
10
15
20
0
200
400
600
800
Ra
tio o
f Ma
les to
Fe
ma
les
for R
ep
ea
t DW
I Co
nv
iction
s Re
pe
at
DW
I C
on
vic
tio
ns
in
Ea
ch A
ge
Gro
up
Age Group
Males
Females
Ratio Males to Females
Table 75: Repeat DWI Convictions by Age39 and Sex, 2013
Figure 31: Repeat DWI Convictions by Age39 and Sex, 2013

DWI Enforcement – Dispositions
69
Court Dispositions
40 In this table only, DWI convictions and dismissals are the number of arrests in 2013 that resulted in a
conviction or dismissal, as reported in the NM MVD Citation Tracking System (CTS) as of July, 2014.
Count Percent Count Percent Count Percent
Bernalillo 1,672 42% 1,111 28% 1,185 30% 3,968 172 176
Catron 4 67% 2 33% 0 0% 6 44 96
Chaves 151 68% 20 9% 51 23% 222 147 153
Cibola 78 38% 27 13% 100 49% 205 138 139
Colfax 28 51% 9 16% 18 33% 55 122 136
Curry 89 67% 8 6% 36 27% 133 137 91
De Baca 6 67% 1 11% 2 22% 9 55 39
Doña Ana 577 45% 203 16% 513 40% 1,293 158 160
Eddy 155 70% 20 9% 45 20% 220 95 162
Grant 128 68% 31 17% 28 15% 187 125 141
Guadalupe 36 73% 8 16% 5 10% 49 85 149
Harding 0 - 0 - 0 - 0 - -
Hidalgo 29 71% 4 10% 8 20% 41 53 105
Lea 245 69% 52 15% 60 17% 357 90 141
Lincoln 84 78% 13 12% 11 10% 108 84 78
Los Alamos 46 82% 9 16% 1 2% 56 133 110
Luna 65 65% 14 14% 21 21% 100 81 109
McKinley 431 58% 174 24% 133 18% 738 97 153
Mora 15 58% 5 19% 6 23% 26 153 274
Otero 242 68% 29 8% 85 24% 356 92 96
Quay 38 62% 14 23% 9 15% 61 90 141
Rio Arriba 134 34% 151 38% 110 28% 395 154 182
Roosevelt 47 70% 10 15% 10 15% 67 172 204
Sandoval 440 63% 87 12% 172 25% 699 124 164
San Juan 799 67% 159 13% 235 20% 1,193 114 154
San Miguel 109 59% 21 11% 55 30% 185 132 173
Santa Fe 467 52% 226 25% 206 23% 899 138 122
Sierra 50 57% 24 27% 14 16% 88 85 135
Socorro 61 58% 30 29% 14 13% 105 145 171
Taos 90 45% 52 26% 56 28% 198 134 84
Torrance 56 81% 0 0% 13 19% 69 83 -
Union 9 90% 1 10% 0 0% 10 38 186
Valencia 152 52% 55 19% 83 29% 290 164 187
Missing Data 230 91% 17 7% 7 3% 254 114 97
Statewide 6,763 53% 2,587 20% 3,292 26% 12,642 134 160
County
Total
Number of
DWI Arrests
in 2013
Number of DWI
Arrests in 2013
Resulting in
Convictions
Number of DWI
Arrests in 2013
Resulting in
Dismissals
Number of DWI
Arrests in 2013
Awaiting
Disposition
Average
Number of
Days to DWI
Conviction
Average
Number of
Days to DWI
Dismissal
Table 76: Disposition of DWI Arrests by County, as of July 201440

DWI Enforcement – Blood Alcohol Content
70
Blood Alcohol Content (BAC)
In 2013, 25.6% of BAC tests were refused (3,009 out of 11,742 known tests). (Figure 33)
41 For reference, a BAC of <0.04 is a non-zero BAC less than 0.04. A BAC of 0.04 includes 0.04 and ranges up to
but not including 0.06. The term ‘Unknown’ (‘Unk’) identifies a 0.0 BAC of unspecified BAC test type. Test
refusals, and BAC test results rejected, invalid or withdrawn, are excluded.
90
0
22
50
27
48
9
81
6 99
7
1,1
00
1,1
31
97
7
78
3
59
2
34
1
23
7 16
7
10
5
14
1
0
400
800
1,200
1,600
Unk 0 <0.04 0.04 0.06 0.08 0.1 0.12 0.14 0.16 0.18 0.2 0.22 0.24 0.26 0.28 0.30+
BA
C T
est
s
BAC Test Results (g/dL)
3,422 3,284 3,286 3,841 4,042 3,733
3,395 3,167 2,939 3,009
17.7% 18.6% 18.8%
20.8% 22.1% 21.4%
22.4% 23.7% 23.5%
25.6%
0%
10%
20%
30%
0
2,000
4,000
6,000
2004 2005 2006 2007 2008 2009 2010 2011 2012 2013
Pe
rcen
tag
e o
f BA
C T
ests R
efu
sed
B
AC
Te
sts
Re
fuse
d
Figure 32: Range of BAC Test Results from 2013 DWI Arrests41
Figure 33: Number of BAC Test Refusals and Percentage of BAC Test Refusals, 2004 - 2013

Rates
71
Changes in traffic volume, state population, licensed drivers, and registered vehicles affect
the number of crashes that occur in any given year or place. Using rates instead of the raw
number of crashes enables statistical comparisons across geographies, time periods, and
populations. Rates are a way of standardizing measurements to a common base (e.g., per
100 Million VMT or per 100,000 population) so the results can be directly comparable
regardless of to whom, where, and when the event occurred. Below is an example equation
of how rates are calculated, using data from Table 1 and Table 77. Table 77 presents the
denominators used in calculating different traffic crash rates. Depending on the context,
crash rates can be expressed in any of the following ways: number of crashes per 100
million vehicle miles traveled (VMT), number of crashes per 100,000 people, number of
drivers in crashes per 10,000 licensed drivers, or number of vehicles in crashes per 10,000
registered vehicles.
𝑪𝒓𝒂𝒔𝒉 𝑹𝒂𝒕𝒆 = 𝑪𝒓𝒂𝒔𝒉 𝑭𝒓𝒆𝒒𝒖𝒆𝒏𝒄𝒚 𝒊𝒏 𝒂 𝑷𝒆𝒓𝒊𝒐𝒅
𝑬𝒙𝒑𝒐𝒔𝒖𝒓𝒆 𝒊𝒏 𝑺𝒂𝒎𝒆 𝑷𝒆𝒓𝒊𝒐𝒅=
𝟏,𝟗𝟓𝟖 𝐚𝐥𝐜𝐨𝐡𝐨𝐥 𝐜𝐫𝐚𝐬𝐡𝐞𝐬 𝐢𝐧 𝟐𝟎𝟏𝟑
𝟐𝟓𝟔.𝟖𝟐 𝟏𝟎𝟎𝐌 𝐕𝐌𝐓 𝐢𝐧 𝟐𝟎𝟏𝟑= 𝟕. 𝟔 𝐚𝐥𝐜𝐨𝐡𝐨𝐥 𝐜𝐫𝐚𝐬𝐡𝐞𝐬 𝐩𝐞𝐫 𝟏𝟎𝟎𝐌 𝐕𝐌𝐓
Year
New Mexico
Population1,3
(U.S. Census,
July 1st Estimates)
New Mexico
Vehicle Miles
Traveled
(100M VMT)2,3
New Mexico
Licensed
Drivers3
New Mexico
Motor Vehicle
Registrations3
2004 1,903,808 217.94 1,289,089 1,579,258
2005 1,932,274 237.93 1,322,258 1,586,034
2006 1,962,137 244.67 1,358,638 1,624,315
2007 1,990,070 247.50 1,389,962 1,646,112
2008 2,010,662 246.13 1,407,193 1,616,947
2009 2,036,802 245.21 1,424,231 1,674,753
2010 2,064,982 241.77 1,442,737 1,665,882
2011 2,077,919 258.89 1,455,481 1,772,040
2012 2,083,540 257.85 1,493,766 1,805,790
2013 2,085,287 256.82 1,478,868 1,882,466
2 100M VMT = 100 million vehicle miles traveled. The calculation method for VMT was revised by
NMDOT beginning in 2011.3 Detailed source information is in the Sources section at the end of this publication.
1 Each year, the U.S. Census publishes revisions to previous population estimates. Therefore, rates
based on population in this publication are not comparable to rates published in prior years.
Rates
Table 77: Rate Denominators: Population, Vehicle Miles Traveled, Licensed Drivers, and Motor Vehicle Registrations, 2004 - 2013

Rates
72
42 The calculation method for VMT was revised by NMDOT beginning in 2011.
Alcohol-involved
Crashes per
100,000
Population
Alcohol-involved
Crashes per 100
Million Vehicle
Miles Traveled
(100M VMT)
Alcohol-involved
Crashes per
100,000 Licensed
Drivers
Alcohol-involved
Crashes per
100,000 Registered
Vehicles
2004 175.2 15.3 258.8 211.2
2005 136.3 11.1 199.1 166.0
2006 137.5 11.0 198.6 166.1
2007 124.2 10.0 177.8 150.1
2008 129.3 10.6 184.7 160.7
2009 132.5 11.0 189.4 161.1
2010 104.7 8.9 149.9 129.8
2011 111.7 9.0 159.4 130.9
2012 104.4 8.4 145.7 120.5
2013 93.9 7.6 132.4 104.0
Year
Alcohol-involved Crash Rates
175.2
136.3 137.5
124.2 129.3 132.5
104.7 111.7
104.4 93.9
15.3
11.1 11.0 10.0
10.6 11.0
8.9 9.0 8.4
7.6
0
5
10
15
20
0
50
100
150
200
2004 2005 2006 2007 2008 2009 2010 2011 2012 2013
To
tal A
lcoh
ol-in
vo
lve
d C
rash
es
pe
r 10
0M
Ve
hicle
Mile
s Tra
ve
led
To
tal
Alc
oh
ol-
inv
olv
ed
Cra
she
s
pe
r 1
00
,00
0 P
op
ula
tio
n
Total Alcohol-involved Crashes per 100,000 Population
Total Alcohol-involved Crashes per 100M Vehicle Miles Traveled
Table 78: Alcohol-involved Crash Rates, 2004 - 201342
Figure 34: Alcohol-involved Crash Rates (Population and VMT), 2004 - 201342

Rates
73
43 The calculation method for VMT was revised by NMDOT beginning in 2011.
Alcohol-involved
Fatal Crashes per
100,000
Population
Alcohol-involved
Fatal Crashes per
100 Million Vehicle
Miles Traveled
(100M VMT)
Alcohol-involved
Fatal Crashes per
100,000 Licensed
Drivers
Alcohol-involved
Fatal Crashes per
100,000 Registered
Vehicles
2004 9.2 0.81 13.7 11.1
2005 8.6 0.70 12.6 10.5
2006 9.0 0.72 13.0 10.8
2007 7.8 0.63 11.2 9.4
2008 6.3 0.52 9.0 7.9
2009 6.5 0.54 9.3 7.9
2010 6.3 0.54 9.1 7.9
2011 6.3 0.51 9.0 7.4
2012 6.7 0.54 9.3 7.7
2013 5.9 0.48 8.3 6.5
Year
Alcohol-involved Fatal Crash Rates
9.2 8.6
9.0
7.8
6.3 6.5 6.3 6.3 6.7
5.9
0.81
0.70 0.72
0.63
0.52 0.54 0.54 0.51
0.54 0.48
0.0
0.4
0.8
1.2
0.0
4.0
8.0
12.0
2004 2005 2006 2007 2008 2009 2010 2011 2012 2013
Alco
ho
l-inv
olv
ed
Fa
tal C
rash
es
pe
r 10
0M
Ve
hicle
Mile
s Tra
ve
led
Alc
oh
ol-
inv
olv
ed
Fa
tal
Cra
she
s
pe
r 1
00
,00
0 P
op
ula
tio
n
Alcohol-involved Fatal Crashes per 100,000 Population
Alcohol-involved Fatal Crashes per 100M Vehicle Miles Traveled
Table 79: Alcohol-involved Fatal Crash Rates, 2004 - 201343
Figure 35: Alcohol-involved Fatal Crash Rates (Population and VMT), 2004 - 201343

Rates
74
44 An alcohol-involved fatality is any crash-related fatality in which at least one driver in the crash was cited
for DWI or indicated by the officer on the crash report as being under the influence of alcohol.
Alcohol-involved
Fatalities per
100,000
Population
Alcohol-involved
Fatalities per 100
Million Vehicle
Miles Traveled
(100M VMT)
Alcohol-involved
Fatalities per
100,000 Licensed
Drivers
Alcohol-involved
Fatalities per
100,000
Registered
Vehicles
2004 11.5 1.00 17.0 13.9
2005 10.0 0.82 14.7 12.2
2006 9.7 0.78 14.1 11.8
2007 8.9 0.72 12.7 10.8
2008 7.1 0.58 10.2 8.8
2009 7.5 0.62 10.7 9.1
2010 7.0 0.60 10.1 8.7
2011 7.3 0.59 10.4 8.6
2012 7.3 0.59 10.2 8.5
2013 6.6 0.53 9.3 7.3
Alcohol-involved Fatality Rates
Year
11.5
10.0 9.7
8.9
7.1 7.5
7.0 7.3 7.3
6.6
1.00
0.82 0.78 0.72
0.58 0.62 0.60 0.59 0.59
0.53
0.0
0.4
0.8
1.2
1.6
0.0
3.0
6.0
9.0
12.0
2004 2005 2006 2007 2008 2009 2010 2011 2012 2013
Fa
talitie
s in A
lcoh
ol-in
vo
lve
d C
rash
es
pe
r 10
0M
Ve
hicle
Mile
s Tra
ve
led
F
ata
liti
es
in A
lco
ho
l-in
vo
lve
d C
rash
es
p
er
10
0,0
00
Po
pu
lati
on
Alcohol-involved Fatalities per 100,000 Population
Alcohol-involved Fatalities per 100M Vehicle Miles Traveled
Table 80: Alcohol-involved Fatality Rates, 2004 - 201344
Figure 36: Alcohol-involved Fatality Rates (Population and VMT), 2004 - 201344
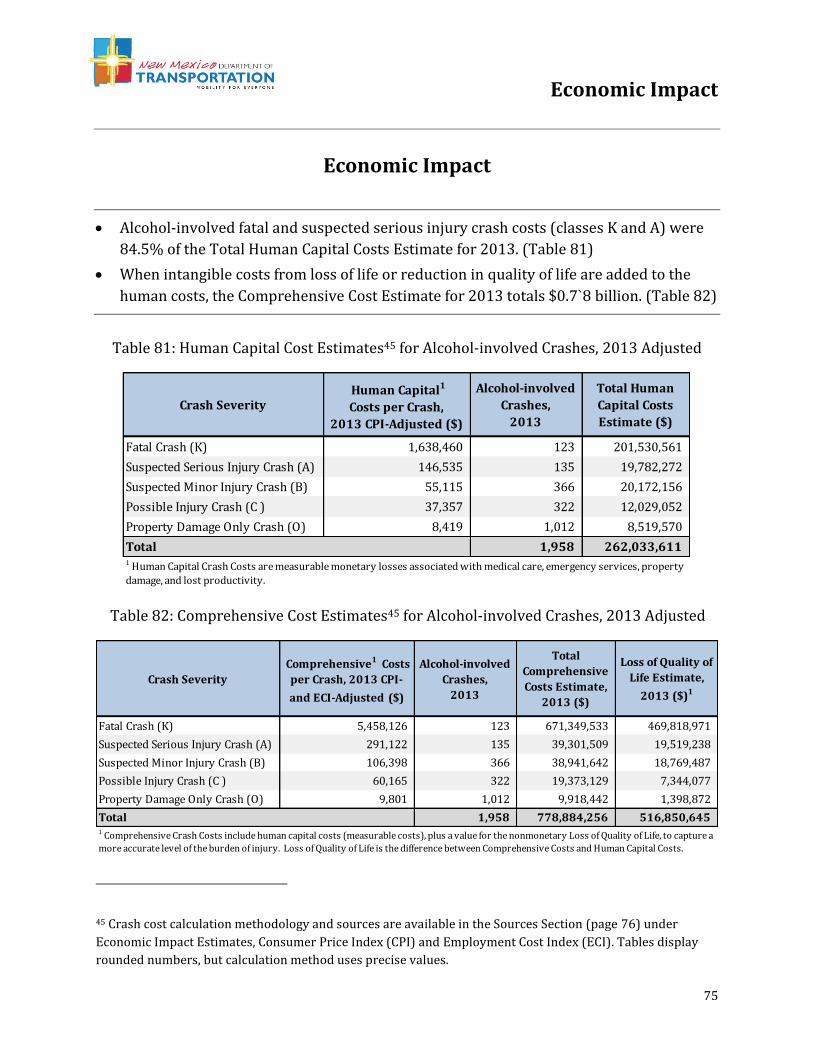
Economic Impact
75
Alcohol-involved fatal and suspected serious injury crash costs (classes K and A) were
84.5% of the Total Human Capital Costs Estimate for 2013. (Table 81)
When intangible costs from loss of life or reduction in quality of life are added to the
human costs, the Comprehensive Cost Estimate for 2013 totals $0.7`8 billion. (Table 82)
45 Crash cost calculation methodology and sources are available in the Sources Section (page 76) under
Economic Impact Estimates, Consumer Price Index (CPI) and Employment Cost Index (ECI). Tables display
rounded numbers, but calculation method uses precise values.
Crash Severity Human Capital1
Costs per Crash,
2013 CPI-Adjusted ($)
Alcohol-involved
Crashes,
2013
Total Human
Capital Costs
Estimate ($)
Fatal Crash (K) 1,638,460 123 201,530,561
Suspected Serious Injury Crash (A) 146,535 135 19,782,272
Suspected Minor Injury Crash (B) 55,115 366 20,172,156
Possible Injury Crash (C ) 37,357 322 12,029,052
Property Damage Only Crash (O) 8,419 1,012 8,519,570
Total 1,958 262,033,611 1 Human Capital Crash Costs are measurable monetary losses associated with medical care, emergency services, property
damage, and lost productivity.
Crash Severity
Comprehensive1 Costs
per Crash, 2013 CPI-
and ECI-Adjusted ($)
Alcohol-involved
Crashes,
2013
Total
Comprehensive
Costs Estimate,
2013 ($)
Loss of Quality of
Life Estimate,
2013 ($)1
Fatal Crash (K) 5,458,126 123 671,349,533 469,818,971
Suspected Serious Injury Crash (A) 291,122 135 39,301,509 19,519,238
Suspected Minor Injury Crash (B) 106,398 366 38,941,642 18,769,487
Possible Injury Crash (C ) 60,165 322 19,373,129 7,344,077
Property Damage Only Crash (O) 9,801 1,012 9,918,442 1,398,872
Total 1,958 778,884,256 516,850,645 1 Comprehensive Crash Costs include human capital costs (measurable costs), plus a value for the nonmonetary Loss of Quality of Life, to capture a
more accurate level of the burden of injury. Loss of Quality of Life is the difference between Comprehensive Costs and Human Capital Costs.
Economic Impact
Table 81: Human Capital Cost Estimates45 for Alcohol-involved Crashes, 2013 Adjusted
Table 82: Comprehensive Cost Estimates45 for Alcohol-involved Crashes, 2013 Adjusted
Sources
76
Consumer Price Index (CPI) – Bureau of Labor Statistics (BLS), Consumer Price Index
Detailed Report, Data for January 2014, Table 1A, Expenditure Category: "All Items",
Column: Annual Average CPI 2013. Available at: http://www.bls.gov/cpi/cpid1401.pdf.
Crash Data – Crash data are from the NMDOT Uniform Crash Reports (UCR), submitted by
law enforcement agencies in the state, for any incident on a public roadway involving
one or more motor vehicles that resulted in death, injury, or at least $500 in property
damage. These reports are processed by the NMDOT Traffic Records Program, and
analyzed by the University of New Mexico, Geospatial and Population Studies (GPS),
Traffic Research Unit (TRU), formerly the Division of Government Research.
DWI Citation Tracking System (CTS) – New Mexico Taxation and Revenue Department
(NM TRD) Motor Vehicle Division (MVD), DWI Citation Tracking System (CTS) and
Conviction files, as of July 2014. Arrests and convictions include both DWI and
aggravated DWI. Except where footnoted, conviction counts are based on the MVD
Conviction file. Repeat offenders are identified by license number.
Economic Impact Estimates – American Association of State Highway and Transportation
Officials Highway Safety Manual, 1st Edition, Volume 1, 2010, Appendix 4A, pp. 4-84 to
4-88. AASHTO HSM cost estimate calculations are based on the Crash Cost Estimates by
Maximum Police-Reported Injury Severity Within Selected Crash Geometries, FHWA-HRT-
05-051: October 2005.
Employment Cost Index (ECI) – Bureau of Labor Statistics (BLS), Employment Cost Index
Historical Listing – Volume III, April 2015, Table 5, Category: All Workers, 2013, June
Index. Available at: http://www.bls.gov/web/eci/echistrynaics.pdf.
Licensed Drivers – New Mexico Taxation and Revenue Department (NM TRD), Motor
Vehicle Division (MVD), 2004 – 2013 July data.
Population – U.S. Census Bureau, Population Division. Annual Estimates of the Resident
Population: April 1, 2010, to July 1, 2013 (NST-EST2013-01). Release dates: For
counties, March 2014 (CO-EST2013-01-35). For Cities and Towns (Incorporated Places
and Minor Civil Divisions), May 2014 (SUB-EST2013). For pre-2010 population only:
Annual Estimates of the Resident Population for Counties: April 1, 2010, to July 1, 2013.
Release date: March 2013 (CO-EST2012-01-35). Subcounty Resident Population
Sources

Sources
77
Estimates for Cities and Towns (Incorporated Places and Minor Civil Divisions): April 1,
2010, to July 1, 2013. Release Date: June 2013 (SUB-EST2011-35). Available at:
http://www.census.gov/popest/index.html.
Urban Areas – New Mexico Department of Transportation, Asset Management and
Planning. 2010 U.S. Census Urbanized Area Boundaries, NMDOT-Adjusted, and U.S. Census
Urban Clusters. August 21, 2013. In crashes before 2013, “urban” was defined as a town
or city with a population of at least 2,500 people.
Registered Motor Vehicles and Motorcycles – U.S. Department of Transportation,
Federal Highway Administration, Office of Highway Policy Information. Highway
Statistics Series, 2013, Vehicles. Table MV-1. January 2015. Accessed June 19, 2015.
http://www.fhwa.dot.gov/policyinformation/statistics/2013/mv1.cfm.
Vehicle Miles Traveled (VMT) – New Mexico Department of Transportation, Planning
Division, Traffic Data Reporting Section. Daily Vehicle Miles Traveled (DVMT in
thousands) By County and Functional Classification. The calculation method for VMT was
revised by NMDOT beginning in 2011. VMT (reported in units of 100 million vehicle
miles traveled) are based on the daily average vehicle miles traveled and the system
mileages by county and functional classification.
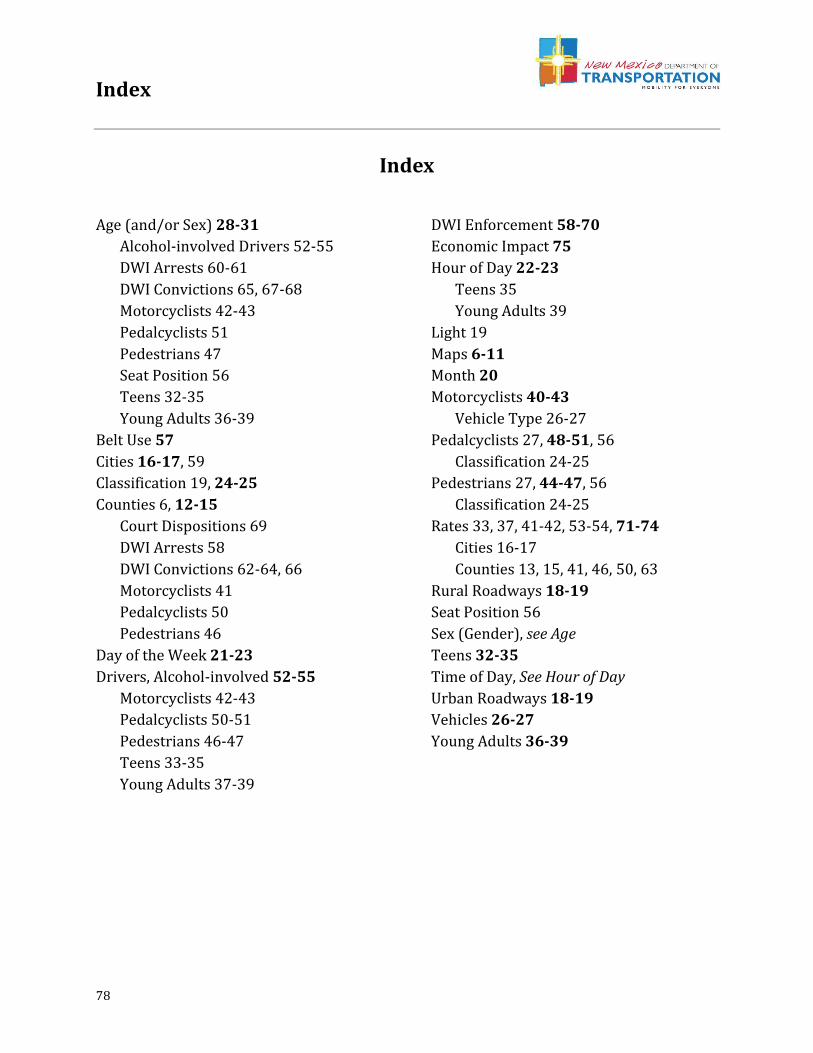
Index
78
Age (and/or Sex) 28-31
Alcohol-involved Drivers 52-55
DWI Arrests 60-61
DWI Convictions 65, 67-68
Motorcyclists 42-43
Pedalcyclists 51
Pedestrians 47
Seat Position 56
Teens 32-35
Young Adults 36-39
Belt Use 57
Cities 16-17, 59
Classification 19, 24-25
Counties 6, 12-15
Court Dispositions 69
DWI Arrests 58
DWI Convictions 62-64, 66
Motorcyclists 41
Pedalcyclists 50
Pedestrians 46
Day of the Week 21-23
Drivers, Alcohol-involved 52-55
Motorcyclists 42-43
Pedalcyclists 50-51
Pedestrians 46-47
Teens 33-35
Young Adults 37-39
DWI Enforcement 58-70
Economic Impact 75
Hour of Day 22-23
Teens 35
Young Adults 39
Light 19
Maps 6-11
Month 20
Motorcyclists 40-43
Vehicle Type 26-27
Pedalcyclists 27, 48-51, 56
Classification 24-25
Pedestrians 27, 44-47, 56
Classification 24-25
Rates 33, 37, 41-42, 53-54, 71-74
Cities 16-17
Counties 13, 15, 41, 46, 50, 63
Rural Roadways 18-19
Seat Position 56
Sex (Gender), see Age
Teens 32-35
Time of Day, See Hour of Day
Urban Roadways 18-19
Vehicles 26-27
Young Adults 36-39
Index