new mexico dwi offender
TRANSCRIPT

New Mexico DWI Offender Characteristics
and Recidivism Report 2003 - 2013
Substance Abuse Epidemiology Section
Injury and Behavioral Epidemiology Bureau Epidemiology and Response Division
December 2014

Table of Contents
Executive Summary ...................................................................................................................... 2 Recommendations ......................................................................................................................... 4 Introduction ................................................................................................................................... 5
Total and Alcohol-Involved Crash Deaths and Legislative and Administrative Actions New Mexico, 1980 – 2013…………………………………………………………………………....5
Methods .......................................................................................................................................... 8 New Mexico DWI Screening and Tracking System and Citation Tracking System ............. 10
Number of DWI Convictions and Screenings in New Mexico, 2003 – 2013 ........................... 10 County DWI Screenings.............................................................................................................. 11
Percentage of DWI Convictions Screened ................................................................................ 11 DWI Convictions Screened by County ..................................................................................... 12 Percentage of DWI Convictions Screened by County .............................................................. 13
DWI Offender Characteristics ................................................................................................... 14
Gender of DWI Offenders. ........................................................................................................ 14 Race/Ethnicity of DWI Offenders ............................................................................................. 16 Age Distribution of DWI Offenders. ........................................................................................ 18 Highest Grade Completed by DWI Offenders .......................................................................... 20 Marital Status of DWI Offenders .............................................................................................. 22 Employment Status of DWI Offenders. .................................................................................... 24
Substance Abuse Information .................................................................................................... 26
Blood Alcohol Content (BAC) Levels .................................................................................... 26 Source of Alcohol Before Arrest ............................................................................................... 27 Primary Drug Used by DWI Offenders .................................................................................... 29 Age of Initial Monthly Alcohol Use among DWI Offenders .................................................... 30
Sentencing Information............................................................................................................... 31
Sanctions Assigned to DWI Offenders in New Mexico, 2003 – 2013...................................... 31 Treatment Information ............................................................................................................... 32
Treatment Levels Recommended by Screening in New Mexico, 2013 .................................... 32 Recidivism .................................................................................................................................... 34 DWI Re-Arrest Rates, New Mexico, 2003 – 2013 .................................................................... 34 DWI Three and Five Year Re-Arrest Rates, New Mexico, 2003-2010………………………..35
Re-Arrest by County of Conviction, New Mexico, 2003 – 2013 ............................................. 36 Re-Arrest by Race/Ethnicity, New Mexico, 2003 – 2013 ......................................................... 37 Re-Arrest by Gender, New Mexico, 2003 – 2013..................................................................... 38 Re-Arrest by Age Group, New Mexico, 2003 – 2013 .............................................................. 39 Re-Arrest by the Number of Prior DWI Convictions, New Mexico, 2003 – 2013 ................... 40 Re-Arrest by Source of Alcohol before Arrest, New Mexico, 2003 – 2013 ............................. 41
Acknowledgements ...................................................................................................................... 42 Appendix ...................................................................................................................................... 43
1

Executive Summary Prior to 1997, New Mexico had the highest rate of alcohol-related motor vehicle crash (AR-MVC) deaths in the United States. However, New Mexico’s AR-MVC death rates and its rank in the nation have dropped considerably. In 2002, New Mexico’s rate was 0.96 deaths per 100 million vehicle miles traveled, fifth in the United States and more than twice the national rate. By 2012, the most recent data available, New Mexico’s rate had decreased by forty-two percent to 0.56 deaths per 100 million vehicle miles traveled, which was twelfth in the nation and only 1.2 times the national rate. Many factors have likely been involved in this decline, including a driving while intoxicated (DWI) prevention project that pays for full time DWI officers in several counties that has been in place since 2005, funded by the National Highway Traffic Safety Administration (NHTSA); and ongoing DWI prevention programs administered by the Department of Finance and Administration (DFA), Department of Transportation, Department of Health, the Children Youth and Families Department, and the Human Services Department This report is published periodically in order to describe aspects of the DWI problem that can best be monitored by combining DWI citation data with screening and tracking information on DWI offenders. Information for this report was drawn from the NM DWI Screening and Tracking System maintained by the DFA as part of its Local DWI (LDWI) Program. The LDWI Program provides oversight to the 33 county DWI programs. The county DWI programs collect alcohol screening information on DWI offenders using a standard screening instrument; track completion of sanctions by these offenders (including probation, DWI school, victim impact panel, treatment, community service, jail, and ignition interlock); and enter these data into the NM DWI Screening and Tracking System, which is housed at ADE Incorporated of Clarkston, Michigan. For the purposes of this report, this screening and tracking information was linked to data from the Citation Tracking System (CTS), which is a database maintained by the Motor Vehicle Division of the New Mexico Taxation and Revenue Department. The CTS contains arrest and conviction records of all DWI offenders in New Mexico since July 1984. Linking the two databases creates a more complete profile of convicted DWI offenders in New Mexico. The major findings from 2003-2013 from this analysis were:
• DWI convictions based on arrests in New Mexico fell from a peak of 13,561 in 2009 to 8,397 in 2013.
• Over the 11 years from 2003-2013, an average of 80% of DWI offenders were screened. The screening rate increased from 65% in 2003 to 91% in 2013.
• Characteristics of DWI offenders in 2013
o Males were more likely to be DWI offenders than females. o There are racial/ethnic disparities among DWI conviction data. Hispanics
and American Indians were overrepresented among DWI offenders
2

compared to the New Mexico population. o The largest group of offenders was 25-34 years old. This age group
comprised 34% of offenders, while they made up only 18% of the general population. The age groups 18-24 years and 35-44 years were also over-represented among DWI offenders relative to their presence in the general population of New Mexico. Ages 45-54, 55-64 years and 65 years and over were under-represented among DWI offenders.
o DWI offenders were more likely to have graduated from high school, but less likely to have completed post-high school education than the NM population.
o DWI offenders were more likely to have never been married than the general New Mexico population.
o Although DWI offenders were more likely to be unemployed than the general population, the majority (62%) of DWI offenders were employed.
o Bars were the most frequently reported source of alcohol before arrest for DWI offenders (30%). Nearly a third of DWI offenders initiated monthly consumption of alcohol between the ages of 12 and 18. Approximately a quarter began drinking alcohol monthly between the ages of 15 and 18.
• Ignition interlock, community service, probation, and DWI school were the most frequently utilized DWI sanctions. At least one of these sanctions was applied to approximately 80% of offenders.
o Ignition interlock, community service, probation, DWI school and victim
impact panels have had relatively stable utilization rates over the past five years.
o The utilization rate of jail sanctions has decreased over the past five years, while the use of treatment has increased.
• Characteristics of DWI offenders that have been re-arrested (recidivists):
o In the time period assessed, 22% of DWI offenders were rearrested at least
once for DWI within 120 months (ten years) of their first conviction; 13% were rearrested within 36 months of their first conviction and 18% within 60 months. The time to recidivism is defined as the time between conviction and the first re-arrest.
o Between 2003 and 2011, 36 month recidivism rates (the percentage of offenders who are rearrested within 36 months of their first conviction) decreased 38%. 60 month recidivism rates fell 52% between 2003 and 2009.
o Recidivism rates were highest in Rio Arriba and McKinley counties. o American Indians were the most likely to be re-arrested, with a risk of re-
arrest 80% higher than that of Non-Hispanic Whites. Blacks and Hispanics had 12% and 39% higher risks of re-arrest than Non-Hispanic Whites.
o Males had a higher risk of re-arrest than females. o There was a clear association between offender’s age and risk of re-arrest,
3

with younger offenders having a higher risk of re-arrest during the 11-year follow-up period analyzed for this report. For example, the 11-year re-arrest rate was 28% among 18-24 year-olds, 23% among 25-34 year olds, and 22% among 35-44 year olds.
o DWI offenders with no arrests prior to the arrest that led to the current conviction were less likely to be re-arrested than were those with prior arrests. Risk of re-arrest increased with the number of prior convictions, with risk particularly elevated among offenders with three or more prior arrests.
o DWI offenders who obtained the alcohol consumed before their arrest at a grocery, convenience, or liquor store were more likely to be re-arrested than those who obtained alcohol from other sources.
4

Recommendations
• The percentage of convicted DWI offenders who were screened has increased steadily over the last 11 years. However, even with this clear improvement, judiciary and other agencies should be encouraged to more fully comply with the requirement to screen and track DWI offenders.
• The Screening and Tracking System should continue to be improved to support reporting and program evaluation. The recent addition of standard excessive drinking indicators (e.g., binge drinking, chronic heavy drinking, and alcohol-impaired driving) as well as standard “alcohol problem” screening instruments (e.g., the “cut-annoyed-guilty-eye” (CAGE) and Alcohol Use Disorders Identification Test (AUDIT) screening tools) will increase the understanding of alcohol use among DWI offenders and how it compares to the general population These tools will also help inform selection of the most appropriate prevention strategies for reducing DWI-related problems.
• Prevention interventions should primarily target males and people under age 45 (especially young adults aged 25-34). American Indians and Hispanics should be a primary focus.
• Because younger age groups have high rates of arrest and re-arrest, because almost one-third of offenders began drinking monthly between 12 and 18 years of age, and because early initiation of alcohol use is strongly associated with the development of alcohol dependence among adults, DWI prevention efforts should include a focus on reducing underage drinking. While education alone has been shown to be effective in changing knowledge and attitudes, it is less effective in changing drinking behavior. For this reason, educational efforts should be complemented by efforts to reduce the availability of alcohol to underage drinkers, using recommended strategies such as enforcement of minimum drinking age laws (through compliance checks and shoulder tap operations), keg registration, social host liability laws, and party patrols.
• Increasing the price of alcoholic beverages is an effective strategy for reducing alcohol-related harm, including DWI. Evidence suggests that this strategy especially impacts the consumption of high risk groups including underage and chronic heavy drinkers. Comprehensive drinking-driving counter-measures such as increased DWI law enforcement coupled with a mass media campaign are effective in reducing alcohol-related motor vehicle crash deaths. Minimum drinking age laws and their enforcement, as well as stronger liquor control regulations (e.g., prohibiting sales and service to underage and intoxicated persons) and their enforcement are also effective in reducing negative consequences of excessive drinking. Finally, screening for problem drinking and brief intervention for problem drinkers is an effective evidence-based prevention strategy that should be more broadly deployed.
• The DFA Local Government Division (LGD) should continue to work with the state Tribal DWI Task Force, the Office of the Governor, and tribal governments to provide DWI prevention programs and services in tribal areas and to tribal members.
5

Introduction
New Mexico has made substantial progress in reducing alcohol-related crash deaths over the last two decades. Driving While Impaired (DWI) legislation and programs have contributed to this decline.
Total and Alcohol-Involved Crash Deaths, Legislative and Administrative Actions in New Mexico, 1980-2013
In 1993, the State of New Mexico Legislature enacted the Local DWI Program Act and established the Local DWI (LDWI) Grant Fund. The Local Government Division (LGD) of the Department of Finance and Administration (DFA) administers the fund. All appropriations are awarded upon DWI Grant Council approval in accordance with the program established under the LDWI Grant Program Act. Since 1997, the LGD has had an agreement with the Epidemiology and Response Division of the New Mexico Department of Health to analyze and report DWI-related data for the 33-county LDWI Program. This reporting is based on data from the New Mexico DWI Screening and Tracking System linked with data from the Motor Vehicle Division’s Citation Tracking
0
100
200
300
400
500
600
700
1980
1981
1982
1983
1984
1985
1986
1987
1988
1989
1990
1991
1992
1993
1994
1995
1996
1997
1998
1999
2000
2001
2002
2003
2004
2005
2006
2007
2008
2009
2010
2011
2012
2013
Num
ber
of D
eath
s
Total Deaths Alcohol involved
Alcohol impaired
Child Restraint
4/83
Administrative License
Revocation
Posting from 55 mph to 65 mph
4/87
Pickups included in Seat
Belt Law Initiation of ODWI2/93
New DWI Laws7/93
Increased speed limit
posting5/96
Drive up windows closed8/98
Limited license to offenders who install
ignition interlocks7/99
Interlock required on repeat and aggravated offenders
3/02
Interlock required on all
offenders3/05
Alcohol-involved deaths are those where alcohol was reported to be involved in the crash; Alcohol-impaired deaths are those where a driver had a BAC of at least .08
Source: Department ofTransportation, Traffic Safety Division; Institute for Public Law,
Safety Belt Use Act
1/86
Interlock required for out of state drivers with DWI 7/07
Six months of Interlock use
for reinstatement
6

System (CTS). The CTS has all arrest and conviction information on all offenders but lacks the demographic and sanction information that is captured by the New Mexico DWI Screening and Tracking System. Linking the two databases creates a more complete profile of offenders convicted of DWI in New Mexico. The New Mexico DWI Screening and Tracking System consists of a database used to monitor DWI offenders after sentencing. Since 1997, all 33 county LDWI programs have used the system to collect alcohol screening information and to track the completion of court-ordered DWI sanctions by DWI offenders within their counties. LDWI program staff in each county enter all information into the system. The system contains DWI offender data such as name, social security number, birth date, and address. It also contains screening information self-reported by offenders during a screening session conducted by the LDWI program staff following (or in some rare cases preceding) conviction. This screening information is collected via the offender’s written responses to the NEEDS Survey instrument, an alcohol and substance abuse screening instrument developed and maintained by ADE, Inc. This instrument includes 130 questions designed to assess the severity of the offender’s substance abuse, and his or her emotional stability, personal support system, criminal history, and overall need for services. In addition to this screening information, the system also captures each offender’s DWI sanctions from the court’s Judgment and Sentencing (J&S) document. These J&S data include the name of the sentencing judge, sanction start and completion dates, information about where the offender is sent for a particular sanction, and how many sessions or days were assigned for each specific sanction. Seven penalties or sanctions are monitored: a) DWI School, which is a required class on driver safety for first offenders, b) Alcohol and substance abuse treatment, whether inpatient, outpatient or self-help
groups such as Alcoholics Anonymous, c) Probation, either supervised or unsupervised, d) Community service, requiring time spent at a community activity such as collecting
trash along roadways, e) Victim impact panel, attending a meeting with victims of DWI crashes, f) Jail, which is being sentenced to jail for one or more days, g) Ignition interlock, which is being required to install an ignition interlock in their
vehicle. The Citation Tracking System (CTS) is the repository for information on all DWI citations in the state, beginning with arrests in July 1984. The CTS is used by the Motor Vehicle Division of the New Mexico Taxation and Revenue Department to support the administrative revocation of drivers' licenses for DWI under the implied consent act (NMSA 66-8-107 to 66-8-112). Licenses may be revoked for refusal to submit to a chemical test, or for blood alcohol concentration (BAC) levels of .08 or higher. The CTS is also used to schedule and track the results of hearings requested by drivers whose licenses have been revoked. Additionally, the CTS is used to record the results of court action on DWI citations. The only New Mexico DWI citation data not captured in the CTS during the time covered by this report are data pertaining to arrests by tribal law enforcement agencies.
7

Methods New Mexico DWI Screening and Tracking System data were linked with person-based CTS data to provide a more complete arrest and conviction record for all offenders in the DWI programs in each of New Mexico’s 33 counties. Offenders in both databases were linked probabilistically using The Link King software (http://the-link-king.com/). Personal identifiers used in the linkage process included social security number, date of birth, first name, last name, middle initial, sex, and driver’s license number. The linkage process calculates a total score that indicates, for any pair of records, how likely it is that they both refer to the same person. The total score for a linkage between any two records is the weighted sum of the scores generated from matching individual fields. Any linkages with scores that are over the cut off value were selected into the linked result. However, the final linked dataset was created after the uncertain matches were manually reviewed. Once CTS data and New Mexico DWI Screening and Tracking System cases were matched, the DWI citation that led to the first conviction with a corresponding screening and tracking record was identified as the reference case. The identification of a reference case enabled categorization of prior DWIs and re-arrests relative to that case. Match rates varied over the years, but overall 91.4 percent of the screening records in the NM DWI Screening and Tracking System dataset for 2003-2013 were matched with a specific DWI arrest (in the CTS dataset). In 2010 the LDWI programs also tracked people referred for reasons other than DWI (e.g. domestic violence), but only cases referred for DWI were included in the matching process. Match rates have been somewhat lower on average after 2010, suggesting that some non-DWI cases may have been misclassified as DWI cases. For cases in 2010-2013 where the sanctions included interlock, DWI school or Victim Impact panel, 95% of cases were matched to a specific DWI arrest. Only cases matched to a specific DWI arrest were included in the analysis. The linked dataset was used to describe DWI offender characteristics, including gender, race/ethnicity, age, educational attainment, marital status and employment for all DWI offenders convicted in 2013 and subsequently screened. DWI offenders were compared to the NM general population using two sources. Estimates of gender, race/ethnicity, and age among the 2013 general adult (18+) New Mexico population were calculated by University of New Mexico (UNM), Geospatial and Population Studies (GPS) Program, (bber.unm.edu/bber_research_demPop.html). Data from the U.S. Census were used for estimates of educational attainment, marital status and employment among the general adult New Mexico population (U. S. Census Bureau, American Community Survey, 5-Year Estimates) because these variables are not available from UNM GPS. Substance abuse information, blood alcohol concentration, source of alcohol before arrest, primary drug used and age of initial monthly alcohol use were assessed; as were DWI sanctions and recommended treatment levels. The linked dataset was also used to assess rates of DWI recidivism and to identify characteristics of DWI offenders that are associated with re-arrest, including race/ethnicity, gender, age group, prior DWI convictions, and source of alcohol before arrest. Recidivism was analyzed using survival analysis techniques. These techniques are useful for tracking
8

“time to failure”, which is the time elapsed between an initial event (in this case a DWI conviction) and a follow-up event (in this case, the first DWI re-arrest following this conviction). For purposes of this report, recidivism was defined as having at least one DWI re-arrest following a conviction. Re-arrest rates were calculated among the cohort of DWI offenders with a conviction, as the percent of such offenders with at least one DWI re-arrest during the follow-up period. One of the survival analysis techniques, Cox Regression, enables comparison of the risk of failure (i.e., first re-arrest) between population sub-groups (e.g., by sex). This comparison is reported as a relative risk, also known as a hazard ratio. In this report, survival (time to re-arrest, re-arrest rates, hazard ratios) was compared for one characteristic at a time (e.g., by sex or race; but not by sex and race together). Confidence intervals for parameter estimates were also calculated and shown as brackets in these figures.
9

New Mexico DWI Screening and Tracking System and Citation Tracking System
Number of DWI Convictions and Screenings,
New Mexico, 2003 - 2013
Sources: Citation Tracking System (CTS), New Mexico Taxation and Revenue Department NM Screening & Tracking System, New Mexico Department of Finance and Administration
This figure provides the annual number of offenders who have been screened by the NM DWI Screening and Tracking System, compared to the number of convictions reported by CTS. In 2003, there were 8,567 offenders screened by the NM DWI Screening and Tracking System, and 13,083 convictions reported in the CTS. In 2013 there were 7,677 offenders screened and 8,397 convictions reported in the CTS. During the period 2003-2013 the average time from arrest to conviction has risen slowly from 4.5 months in 2003 to 6.3 months in 2013. During this period the annual number of offenders screened as a proportion of the annual number of convictions increased steadily from 65% in 2003 to 91% in 2013. These figures include matched cases only, so actual screening rates are higher.
0
2,000
4,000
6,000
8,000
10,000
12,000
14,000
16,000
2003 2004 2005 2006 2007 2008 2009 2010 2011 2012 2013
DWI ConvictionsMatched Screenings
10

County DWI Screenings The following chart shows percentage of convicted DWI offenders screened by the NM DWI Screening and Tracking System for eleven years, 2003-2013. For these 11 years, all 33 counties were included. The percentage of those screened has increased steadily since 2003. From 2003 to 2009, total annual screenings in New Mexico increased by more than 36% from 8,567 to11,179. Screenings have since decreased 34% to 7,677 in 2013 in line with a decrease in DWI convictions. From 2003 to 2013, 11 counties increased the number of screenings provided for DWI offenders, and 21 counties decreased the number of screenings. From 2009 to 2013, two counties have increased screenings (Sandoval and De Baca), four counties have had decreases less than 20% (Otero, Sierra, Taos and Valencia) and nine counties had decreases of 50% or more (Catron, Cibola, Colfax, Harding, Hidalgo, Los Alamos, Luna, Roosevelt and San Miguel).
Percentage of DWI Convictions Screened,
New Mexico, 2003 - 2013
Source: Linked NM DWI Screening and Tracking System and CTS convicted DWI offenders, 2002-2013
The percentage of DWI offenders screened from 2003 to 2013 increased substantially, from 65% to 91%. These numbers include only matched cases from the screening and tracking file, so they understate the fraction of DWI offenders screened by a few percent. The counties with the highest average annual DWI screening percentages during 2011-2013 were De Baca (100%), Harding (100%), Sandoval (100%), Socorro (100%) Taos (100%). Santa Fe (99%) and Sierra (98%). The counties with the lowest average DWI screening percentages in 2011-2013 were Los Alamos (60%), Roosevelt (64%), Union (66%), San Juan (67%) and Lincoln (68%); although it should be noted that rates have been improving considerably in several of these counties in recent years compared to 2005-2007.
65%72% 74% 77% 78% 79%
82%87% 86% 89% 91%
0%
20%
40%
60%
80%
100%
2003 2004 2005 2006 2007 2008 2009 2010 2011 2012 2013
Perc
ent
11

DWI Convictions Screened by County, New Mexico, 2003-2013 County Name 2003 2004 2005 2006 2007 2008 2009 2010 2011 2012 2013
*Percent change
2003-2013
Bernalillo 3197 3210 3484 3451 3935 3846 3761 3293 2848 3198 2369 -25.9 Catron 24 15 14 11 12 12 15 13 8 10 4 -83.3 Chaves 134 158 188 191 219 298 270 272 261 248 156 16.4 Cibola 271 270 226 223 252 187 192 194 170 143 84 -69 Colfax 49 70 50 34 42 54 67 44 54 33 32 -34.7 Curry 116 97 132 181 194 184 227 276 201 176 124 6.9 De Baca 4 7 3 6 8 6 8 5 6 5 9 125 Dona Ana 575 777 695 849 945 1210 1156 1071 899 898 743 29.2 Eddy 195 191 241 193 241 245 248 254 302 233 167 -14.4 Grant 137 119 120 119 104 139 186 184 158 107 129 -5.8 Guadalupe 38 29 37 26 27 44 50 43 25 32 33 -13.2 Harding 1 1 5 2 2 9 1 2 1 . . . Hidalgo 23 25 46 50 42 63 64 46 29 35 28 21.7 Lea 291 258 201 220 246 287 301 272 236 186 225 -22.7 Lincoln 36 9 28 118 83 98 123 124 120 91 64 77.8 Los Alamos 18 22 42 21 41 18 33 29 31 26 14 -22.2 Luna 101 126 84 78 110 108 116 80 92 89 55 -45.5 McKinley 433 587 490 602 642 645 676 642 462 361 424 -2.1 Mora 20 16 23 8 38 19 28 22 14 5 14 -30 Otero 241 227 249 250 238 261 266 208 203 179 234 -2.9 Quay 81 75 68 50 74 59 53 48 36 38 37 -54.3 Rio Arriba 190 188 244 284 334 295 236 222 154 102 139 -26.8 Roosevelt 88 76 64 88 97 89 85 80 84 73 32 -63.6 San Juan 409 647 905 894 1011 965 1031 805 885 698 647 58.2 San Miguel 187 232 227 226 227 211 221 239 159 118 103 -44.9 Sandoval 263 339 330 385 392 430 440 402 359 415 544 106.8 Santa Fe 890 971 841 764 751 695 690 649 694 703 527 -40.8 Sierra 53 49 41 41 52 70 71 67 112 90 60 13.2 Socorro 84 102 135 128 112 131 176 96 110 117 95 13.1 Taos 109 99 90 81 102 103 113 151 132 75 107 -1.8 Torrance 93 71 79 87 79 69 76 71 59 45 47 -49.5 Union 4 15 18 17 24 17 11 7 7 8 8 100 Valencia 212 264 213 169 132 120 185 233 186 166 163 -23.1 Total 8567 9342 9613 9847 10808 10987 11176 10144 9097 8703 7417 -13.4%
Source: Citation Tracking System (CTS), New Mexico Taxation and Revenue Department NM Screening & Tracking System, New Mexico Department of Finance and Administration
12

Percentage of DWI Convictions Screened by County, New Mexico, 2003-2013
County Name 2003 2004 2005 2006 2007 2008 2009 2010 2011 2012 2013 Bernalillo 84.0 96.4 84.4 83.5 81.6 76.2 80.2 89.8 88.0 93.8 100.0 Catron 85.7 65.2 60.9 40.7 57.1 80.0 100.0 92.9 88.9 100.0 100.0 Chaves 77.9 66.7 77.0 100.0 100.0 85.6 87.1 93.8 89.1 88.3 88.6 Cibola 82.6 82.3 77.1 82.6 76.6 77.3 75.0 80.5 95.0 93.5 98.8 Colfax 49.0 56.5 60.2 47.9 59.2 65.9 94.4 88.0 90.0 94.3 100.0 Curry 38.7 33.9 62.6 53.6 62.2 71.6 79.6 82.9 80.4 78.6 83.2 De Baca 33.3 77.8 100.0 75.0 72.7 75.0 72.7 55.6 100.0 100.0 100.0 Dona Ana 46.7 59.3 50.9 58.8 68.4 87.5 97.9 95.8 90.6 91.5 99.5 Eddy 70.7 68.7 91.6 75.7 82.5 85.1 83.8 92.0 96.2 91.0 88.4 Grant 76.5 69.6 75.5 77.8 74.8 93.3 95.4 95.3 95.2 95.5 92.8 Guadalupe 64.4 78.4 86.0 70.3 69.2 91.7 89.3 76.8 78.1 100.0 91.7 Harding 50.0 50.0 100.0 66.7 66.7 81.8 50.0 100.0 100.0 . . Hidalgo 35.9 43.1 66.7 82.0 76.4 79.7 79.0 75.4 85.3 74.5 82.4 Lea 71.5 71.5 78.2 77.2 71.7 73.2 78.2 80.5 75.9 87.7 81.2 Lincoln 16.7 4.2 14.4 67.8 62.4 67.6 70.7 77.0 74.5 68.9 61.0 Los Alamos
64.3 64.7 85.7 100.0 100.0 75.0 68.8 74.4 93.9 51.0 35.9
Luna 70.6 73.3 58.7 63.9 62.9 70.1 74.4 79.2 83.6 83.2 75.3 McKinley 60.8 62.7 73.2 84.8 79.1 81.9 85.5 82.5 85.6 84.5 97.2 Mora 80.0 48.5 74.2 50.0 92.7 82.6 100.0 81.5 82.4 100.0 100.0 Otero 61.3 58.8 71.3 81.4 86.5 92.6 89.9 84.6 89.8 87.3 94.0 Quay 81.8 85.2 94.4 83.3 78.7 90.8 86.9 100.0 81.8 92.7 88.1 Rio Arriba 76.9 74.0 83.0 87.1 89.3 88.1 89.4 94.1 87.5 79.7 85.8 Roosevelt 69.3 77.6 60.4 64.7 60.2 78.1 73.3 67.8 72.4 70.2 47.8 San Juan 25.7 42.0 60.0 67.4 69.7 63.9 64.8 64.0 64.3 68.6 69.9 San Miguel 69.3 73.4 85.7 87.3 81.7 85.8 92.5 98.4 87.4 86.8 82.4 Sandoval 80.4 82.9 84.4 89.7 86.9 89.6 96.5 98.0 100.0 100.0 100.0 Santa Fe 80.3 81.8 80.9 84.6 81.6 82.6 86.4 94.5 98.7 97.8 100.0 Sierra 44.5 53.8 61.2 56.9 78.8 83.3 91.0 78.8 94.1 100.0 100.0 Socorro 76.4 73.9 82.3 74.9 78.3 97.8 100.0 100.0 100.0 100.0 100.0 Taos 68.1 76.7 61.6 71.1 68.5 88.0 82.5 85.8 100.0 100.0 100.0 Torrance 80.9 65.1 78.2 71.3 76.7 75.8 90.5 93.4 81.9 84.9 75.8 Union 80.0 60.0 81.8 81.0 88.9 100.0 73.3 70.0 70.0 66.7 61.5 Valencia 69.3 80.2 80.7 100.0 86.8 100.0 90.7 91.7 84.5 98.2 92.6 Total 65.4% 71.6% 73.8% 76.7% 77.7% 78.9% 82.4% 86.8% 85.9% 89.1% 91.4%
Sources: Citation Tracking System (CTS), New Mexico Taxation and Revenue Department NM Screening & Tracking System, New Mexico Department of Finance and Administration
13

DWI Offender Characteristics
Gender of the DWI Offender Population in New Mexico and the New Mexico Adult Population, 2013
Sources: Linked NM DWI Screening and Tracking System and CTS convicted DWI offenders, 2013 New Mexico Population Estimates, GPS, UNM, 2014
This section reports characteristics of all DWI offenders convicted and screened by LDWI programs in 2013. DWI offender characteristics were self-reported using the screening questionnaire for convicted DWI offenders; or reported from the CTS if these data were available in that system. There was a much higher proportion of males and a much lower proportion of females among DWI offenders than in New Mexico’s adult population. In other words, males are over-represented in the New Mexico DWI offender population and females are under-represented.
72.1
27.9
48.7 51.3
0
10
20
30
40
50
60
70
80
90
Male Female
Perc
ent (
%)
DWI OffendersNM Population
14

From 2003 to 2009, the rate among females increased while the rate among males was largely unchanged. The decrease in the male rate after 2009 was much sharper than the decrease in the female rate over that time period. The result of these two trends has been a steady increase in the percent of screened offenders who are female.
0
10
20
30
40
50
60
70
80
90
2004 2005 2006 2007 2008 2009 2010 2011 2012 2013
Perc
ent o
f scr
eene
d of
fend
ers
Gender of DWI Offenders, New Mexico, 2003-2013
Female Male
0100200300400500600700800900
2003 2004 2005 2006 2007 2008 2009 2010 2011 2012 2013Scre
enin
gs p
er 1
00,0
00 p
opul
atio
n
DWI Screenings per 100,000 Population by Gender, New Mexico, 2003-2013
Female Male
15

Race/Ethnicity of the DWI Offender Population in New Mexico
and the New Mexico Adult Population, 2013
Sources: Linked NM DWI Screening and Tracking System and CTS convicted DWI offenders, 2013 New Mexico Population Estimates, GPS, UNM, 2014
There were disproportionate numbers of Hispanics and American Indians convicted of DWI compared to their proportions in the New Mexico adult population. The percentage of DWI offenders who identified as white was lower than in the general population.
49.4
27.7
19.9
2.60.3
42.646.2
7.8
1.9 1.60
10
20
30
40
50
60
70
Hispanic White AmericanIndian
AfricanAmerican
Asian
Perc
ent (
%)
DWI OffendersNM Population
16

The rates of screenings per 100,000 population for the three largest racial/ethnic groups all declined after 2009. From 2009 to 2013, the rate for whites declined by 32%, for Hispanics by 37% and for American Indians by 40%. The overall rate of screenings fell by 34%. The disparities among the racial/ethnic groups have decreased over the past 5 years.
Because the rates fell similar amounts, the distribution of the racial/ethnic groups among offenders changed relatively little. Whites account for a larger percentage of screened offenders while Hispanics account for a smaller percentage.
0
200
400
600
800
1000
1200
1400
2003 2004 2005 2006 2007 2008 2009 2010 2011 2012 2013Scre
enin
gs p
er 1
00,0
00 p
opul
atio
n
Screenings per 100,000 Population by Race/Ethnicity, New Mexico, 2003-2013
American Indian White Hispanic
0
10
20
30
40
50
60
2003 2004 2005 2006 2007 2008 2009 2010 2011 2012 2013
Perc
ent o
f mat
ched
scre
enin
gs
Race/Ethnicity of DWI Offenders, New Mexico, 2003-2013
American Indian Hispanic White
17

Age Distribution of DWI Offenders in New Mexico
and the New Mexico Adult Population, 2013
Sources: Linked NM DWI Screening and Tracking System and CTS convicted DWI offenders, 2013 New Mexico Population Estimates, GPS, UNM, 2014
In general, the age distribution of offenders convicted of DWI in 2013 was younger than the New Mexico population. Persons 18-44 years of age were over-represented in the DWI offender population. Persons in New Mexico 45 years of age and older were underrepresented in the DWI offender population.
25.3
33.9
19.9
13.8
5.7
1.5
7.7
18.216.9
19.4 17.919.8
0
5
10
15
20
25
30
35
40
45
50
18-24 25-34 35-44 45-54 55-64 65+
Perc
ent (
%)
DWI OffendersNM Population
18

Rates have fallen for all age groups since 2009, and since 2007 for those 18-24.
As a fraction of all screenings, those 25-34 became the largest group in 2009 as the rate has fallen in the 18-24 age group.
0
200
400
600
800
1000
1200
1400
1600
1800
2003 2004 2005 2006 2007 2008 2009 2010 2011 2012 2013
Scre
enin
gs p
er 1
00,0
00
Screenings per 100,000 Population by Age, New Mexico, 2003-2013
18-24 25-34 35-44 45-54 55-64 65+
0
5
10
15
20
25
30
35
40
2003 2004 2005 2006 2007 2008 2009 2010 2011 2012 2013
Perc
ent
Age Distribution of DWI Screenings, New Mexico, 2003-2013
18-24 25-34 35-44 45-54 55-64 65+
19

Highest Grade Completed for DWI Offenders in New Mexico and the New Mexico Adult Population, 2013
Sources: Linked NM DWI Screening and Tracking System and CTS convicted DWI offenders, 2013 US Census Bureau, 2013 ACS 5-year estimate, 25+ years of age
Convicted DWI offenders were less likely to have pursued higher education (beyond high school) than those in the general population. However, they were more likely to have graduated high school.
4.4
16.7
39.0 39.8
7.3 9.0
26.4
57.2
0
10
20
30
40
50
60
Less than High School Some High School Graduated High School More than High School
Perc
ent (
%)
DWI OffendersNM Population
20

Since 2009, the proportion of screened offenders who were high school graduates or dropouts has been decreasing while the proportion of offenders with more than a high school education has been increasing. In 2012 and 2013, the largest group has been those with more than a high school education.
0
5
10
15
20
25
30
35
40
45
50
2003 2004 2005 2006 2007 2008 2009 2010 2011 2012 2013
Perc
ent o
f mat
ched
scre
enin
gs
Highest Grade Completed for DWI Offenders in New Mexico, 2003-2013
Less than High School Some High School
Graduated High School More than High School
21

Marital Status of DWI Offenders in New Mexico and the New Mexico Adult Population, 2013
Sources: Linked NM DWI Screening and Tracking System and CTS convicted DWI offenders, 2013 US Census Bureau, 2013 ACS 3-year estimate, 15+ years of age
Convicted DWI offenders were less likely to be married than the general NM population. This may be partially due to the fact that the DWI offender population was younger than the general NM population.
29.3
5.4
14.2
1.6
49.545.7
1.9
13.0
5.9
33.6
0.0
10.0
20.0
30.0
40.0
50.0
60.0
Married Separated Divorced Widow/Widower Never Married
Perc
ent (
%)
DWI OffendersNM Population
22

The fraction of screened offenders who have never married has steadily increased over the period from 2003 to 2009, while the fraction who are married has steadily decreased. The proportion of offenders who were separated, divorced or widowed has remained fairly stable.
0
10
20
30
40
50
60
2003 2004 2005 2006 2007 2008 2009 2010 2011 2012 2013
Perc
ent o
f mat
ched
scre
enin
gs
Marital Status of DWI Offenders, New Mexico, 2003-2013
Never Married Married Separated/divorced/widowed
23

Employment Status of DWI Offenders in New Mexico and the New Mexico Adult Population, 2013
Sources: Linked NM DWI Screening and Tracking System and CTS convicted DWI offenders, 2013 US Census Bureau, 2013 ACS 3-year estimate, 16+ years of age
This figure shows the employment status of DWI offenders in 2013 compared to the New Mexico population. Compared to the general NM population, convicted DWI offenders were more likely to be unemployed than the general population. However, they were also more likely to be employed than the general New Mexico population. This is because among DWI offenders, a smaller percentage were “not in the workforce” (students, homemakers, disabled persons, and retired persons) than the general population.
62.4
23.1
14.1
54.1
6.1
39.8
0.0
10.0
20.0
30.0
40.0
50.0
60.0
70.0
80.0
Employed Unemployed Not in Workforce
Perc
ent (
%)
DWI OffendersNM Population
24

The rate of employment among screened offenders fell sharply between 2008 and 2009, although they remain the largest group. Employment has been slow to recover among offenders, while the number who are not in the workforce has increased.
0
10
20
30
40
50
60
70
80
2003 2004 2005 2006 2007 2008 2009 2010 2011 2012 2013
Perc
ent o
f mat
ched
scre
enin
gsEmployment Status of DWI offenders in New Mexico,
2003-2013
Employed unemployed Not in workforce
25

Substance Abuse Information
Blood Alcohol Content (BAC) Levels Among Convicted DWI Offenders, New Mexico, 2013
Source: Linked NM DWI Screening and Tracking System and CTS convicted DWI offenders, 2013
The alcohol and substance abuse information shown in this section came from both the screening and tracking self-administered screening questionnaire and from the CTS record of BAC testing. A substantial number of offenders (22%) were missing BAC test data from either source in 2013 due to refusal to be tested or to incomplete/missing test results (CTS); or to refusal to self-report test results (Screening and Tracking System). For those offenders with reported results, if the BAC in the CTS file was greater than 0.00 then that BAC was reported (95% of reported BACs); if the BAC in the CTS file was missing or 0.00, but the BAC in the screening and tracking file was greater than 0.00, then that BAC was reported (5% of reported BACs). This figure shows the distribution of BAC levels based on these data sources, for offenders convicted in 2013. The mean BAC level was 0.16 g/dl.
1.8
18.1
30.4
43.3
6.4
0 5 10 15 20 25 30 35 40 45 50
BAC 0.30+
BAC 0.20-<0.30
BAC 0.15-<0.20
BAC 0.08-<0.15
BAC <0.08
Percent (%)
26

Source of Alcohol before Arrest among Convicted DWI Offenders, New Mexico, 2013
Liquor Source Number Percent Unknown 1586 26.0% Bar 1812 29.7% Someone Else Home 994 16.3% Your Home 704 11.6% Social Gathering/Party 593 9.7% Grocery/Convenience Store 530 8.7% Liquor Store 504 8.3% Other 630 10.3% Restaurant 324 5.3% Total 6091
Source: NM DWI Screening and Tracking System.
These data are self-reported, and since about a quarter of offenders did not indicate the alcohol source, they should be interpreted with caution. Bars and restaurants – alcohol outlets licensed for on-premise consumption - have been the most frequent source of alcohol prior to arrest (35%). Bars made up more than 80% of this category in 2013. Note that while bars are by far the most frequently reported liquor source by DWI offenders, bars and restaurants are the least frequently reported liquor source among offenders who have been re-arrested (see page 38). Informal sources – gatherings, parties, other people’s houses – are the next most frequent source among offenders who reported a source. Retail stores – alcohol outlets not licensed for on-premise consumption – are the third most frequent source.
27

Source of Alcohol before Arrest among Convicted DWI Offenders by Year of Reference Violation,
New Mexico, 2000-2013
Source: NM DWI Screening and Tracking System. Unknown source excluded. Over time, there appears to be an inverse relationship between the bar/restaurant category and the informal sources: when one accounts for a larger fraction, the other accounts for a smaller fraction. The other sources account for a relatively stable fraction over time.
0
5
10
15
20
25
30
35
40
2002
2003
2004
2005
2006
2007
2008
2009
2010
2011
2012
2013
Perc
ent
DWI convictions by liquor source, NM 2000-2013
Bar / restaurant
Social gathering / party /someone else's home
Grocery/ liquor/ conveniencestore
Own home
Other
28

Primary Substance Used by DWI Offenders*, New Mexico, 2013
* The substance “tried or used most often” during the three years prior to arrest. Source: NM DWI Screening and Tracking System
This chart shows the primary drug used by DWI offenders in the NM DWI Screening and Tracking System. Alcohol was the primary substance used by 69.8% of offenders. Marijuana was the second most common primary substance identified (9.1%). Other drugs accounted for very small percentages (3.1% combined).
Alcohol, 69.8%
Unknown, 10.1%
Marijuana, 9.1%
None, 6.8%
Narcotics, 1.4%
Sedatives, 1.6%
Stimulants, 0.9%
Other, 0.2%
Alcohol Unknown Marijuana None
Narcotics Sedatives Stimulants Other
29

Age of Initial Monthly Alcohol Use among DWI Offenders,
New Mexico, 2013
Source: NM DWI Screening and Tracking System
Approximately one-third (27%) of offenders began monthly alcohol use at an age corresponding closely to the middle- and high-school years (12 – 18 years old). Monthly alcohol use was initiated by 2% of offenders at an age less than 12; by approximately 4% of offenders between the ages of 12 and 14; and by 24% of offenders between the ages of 15 and 18. Another 21% stated they have never used alcohol monthly. Among those who reported using alcohol monthly (excluding the unknown and never categories), 87% began between the ages of 15 and 29.
Age Began Using Alcohol Monthly
Number Percent Unknown 780 10.2
Never used alcohol monthly 1627 21.2
Less than 12 years old 151 2.0 12-14 (middle school age) 271 3.5
15-18 (high school age) 1819 23.7 19-20 805 10.5 21-29 1976 25.7 30-39 186 2.4 40-49 44 0.6 50-59 8 0.1
60+ 10 0.1 Total 7677
30

Sentencing Information
Sanctions Assigned to DWI Offenders by Year of Reference Violation, New Mexico, 2003-2013
Note: DWI offenders can be assigned to more than one sanction per conviction. Percentages total to more than 100% because a single offender may receive multiple sanctions. Source: NM DWI Screening and Tracking System
This sentencing information represents data entered into the NM DWI Screening and Tracking System by LDWI Program staff. This information is most often entered from a copy of the court J&S document. This information is not based on J&S data from the Administrative Office of the Courts (e.g., a dataset recording actual J&S sanctions) because digital J&S data has not been available. Offenders are sentenced to one or more of several different sanctions for each DWI conviction. The most common sanction for DWI offenders in 2013 was probation (81% of all offenders). Other common sanctions in 2013 included community service (77%), ignition interlock (75%), DWI school (67%), participation in a victim impact panel (63%), outpatient or inpatient treatment (19%), and jail (25%). Probation, DWI school, and victim impact panels have historically been the most frequently assigned sanctions. Since 2002, ignition interlock, and, since 2005, community service have been used with increasing frequency, and are now among the most common sanctions. Jail has become a less common sanction since 2008, while treatment has become more common.
0
10
20
30
40
50
60
70
80
90
100
2003 2004 2005 2006 2007 2008 2009 2010 2011 2012 2013
Ignition Interlock
CommunityServiceProbation
DWI School
Victim ImpactPanelTreatment
Jail
31

Treatment Information Treatment Levels Recommended by Screening
in New Mexico, 2013
* Includes outpatient care and intensive outpatient care Source: NM DWI Screening and Tracking System
Chart Notes: • No Referral or Referral to Education - recommended for individuals who may have had a substance abuse problem
at one time, but report no use for at least one year. • Outpatient Treatment - recommended for individuals who report abstinence but their current attitude and/or high risk
behavior suggests further investigation is needed. Includes some individuals who report a history of substance abuse but report recent abstinence.
• Intensive Outpatient Treatment beyond Detoxification - although this person may not require medical monitoring, his emotional and environmental circumstances may be too unstable for him to function without close monitoring.
• Inpatient Treatment - recommended because of a person’s apparent cross addiction history of substance abuse treatment, and current emotional and environmental vulnerability.
• Medical Monitoring - recommended because of an individual’s apparent substance abuse addiction, history of substance abuse treatment, and other medical problems which may relate to substance abuse and current emotional and/or environmental vulnerability.
In 2013, of offenders recommended for treatment, outpatient alcohol treatment was recommended for 64% of convicted offenders screened by the NM DWI Screening and Tracking System. Only 5% were recommended for residential treatment, with an additional 0.2% recommended for medical monitoring in an inpatient setting. The screening questionnaire provides an assessment of the need
Unknown10.4%
Outpatient*63.9%
No Referral or referral to Education
20.9%
Residential Treatment
4.6%
Medically Managed IP
0.2%
32

for substance abuse treatment for each DWI offender. Treatment levels were derived from the American Society of Addiction Medicine (ASAM) guidelines and the American Psychiatric Association Diagnostic and Statistical Manual, Fourth Revision, 1981 (DSM-IV). If an offender’s score on the screening survey indicates that some level of treatment is appropriate, this recommendation may be included as a sanction in the sentence.
33

Recidivism Recidivism is defined here as a re-arrest for DWI following a DWI conviction. Recidivism is reported here both in terms of the overall percent re-arrested, and in terms of re-arrest rates estimated by survival analyses performed on the linked NM DWI Screening and Tracking System /CTS dataset. Survival rates show the probabilities of a re-arrest over time. The survival analysis presented below was completed for calendar years 2003-2013. The line graph shows the percentage of DWI offenders who had been re-arrested by the number of months that had elapsed since their reference DWI conviction (the conviction for which they were screened and entered into the DWI Screening and Tracking System). The 2003-2013 average re-arrest curve shows that 22.4% of DWI offenders were re-arrested within 120 months (10 years) of their reference DWI conviction. Half (51%) of those re-arrested were re-arrested within two and one-half years of their conviction; two-thirds (66%) were re-arrested within three and one-half years; and over three quarters (77%) of re-arrestees were re-arrested within four and one-half years of their conviction. Only 4% were re-arrested more than 8 years after their conviction.
DWI Re-Arrest Rates*, New Mexico, 2003-2013
* Percent of DWI offenders with at least one DWI re-arrest during the follow-up period. Source: Linked NM DWI Screening and Tracking System and CTS convicted DWI offenders, 2003-2013
0 6 12 18 24 30 36 42 48 54 60 66 72 78 84 90 96 102 108 114 120% Rearrested 0 2.6 5 7.4 9.6 12 13 15 16 17 18 19 20 20 21 21 21 22 22 22 22
0
10
20
30
Perc
ent R
e-Ar
rest
ed
Months
34

DWI 36 and 60 Month Re-Arrest Rates*,
New Mexico, 2003-2011
* Percent of DWI offenders with at least one DWI re-arrest during the follow-up period. Source: Linked NM DWI Screening and Tracking System and CTS convicted DWI offenders, 2003-2013
The chart above shows the cumulative percentage of people convicted each year who had been rearrested at least once within 36 months (3 years) or 60 months (5 years). The rate of recidivism over three years has fallen by more than half between 2003 and 2011, while the rate over 5 years has fallen by 38% between 2003 and 2009. The relative contributions of the level of DWI by offenders after conviction and the level of enforcement activity are not known. The bar charts on the following pages show the overall percent of DWI offenders in a particular category that had been re-arrested, regardless of time since their reference DWI conviction. Also included are charts showing hazard ratios, or the relative risk of re-arrest of one particular group with respect to a comparison group, while controlling for the amount of time since the reference violation.
0
5
10
15
20
25
30
2003 2004 2005 2006 2007 2008 2009 2010 2011
Perc
emt r
e-ar
rest
ed
Year of conviction
36 month
60 month
-38%
-52%
35

Overall Percent of Convicted DWI Offenders with a Re-Arrest by County of Conviction, New Mexico, 2003-2013
Source: Linked NM DWI Screening and Tracking System and CTS convicted DWI offenders, 2003-2013 3
Re-arrest rates from New Mexico’s 33 counties from 2003-2013 indicate that Rio Arriba and McKinley counties had the highest re-arrest rates, with 32%, followed closely by Cibola (28.9%), San Miguel (28.4%), and Mora (27.7%). Ten counties had significantly higher DWI re-arrest rates than Bernalillo County. These counties were Rio Arriba, McKinley, Cibola, San Miguel, Mora, Socorro, San Juan, Santa Fe, Valencia, and Grant. Counties with statistically significantly lower DWI re-arrest rates than Bernalillo County were Doña Ana, Lincoln, Eddy, Chaves, Lea, Colfax, Sierra, Curry, Hidalgo, and Union.
14.6
15.0
15.7
16.3
16.4
17.4
17.6
17.9
18.0
18.6
19.4
19.6
20.1
21.0
21.3
21.5
21.8
22.2
22.4
23.3
23.5
24.4
24.4
24.8
25.3
26.1
26.5
27.2
27.7
28.4
28.9
31.9
32.0
0 5 10 15 20 25 30 35
UnionHidalgo
CurrySierraColfax
LeaChavesLincoln
EddyQuay
Dona AnaRoosevelt
OteroBernalillo
GuadalupeLuna
TorranceSandoval
TaosLos Alamos
GrantCatron
De BacaValenciaSanta FeSan JuanHardingSocorro
MoraSan Miguel
CibolaMcKinley
Rio Arriba
Percent (%)
36
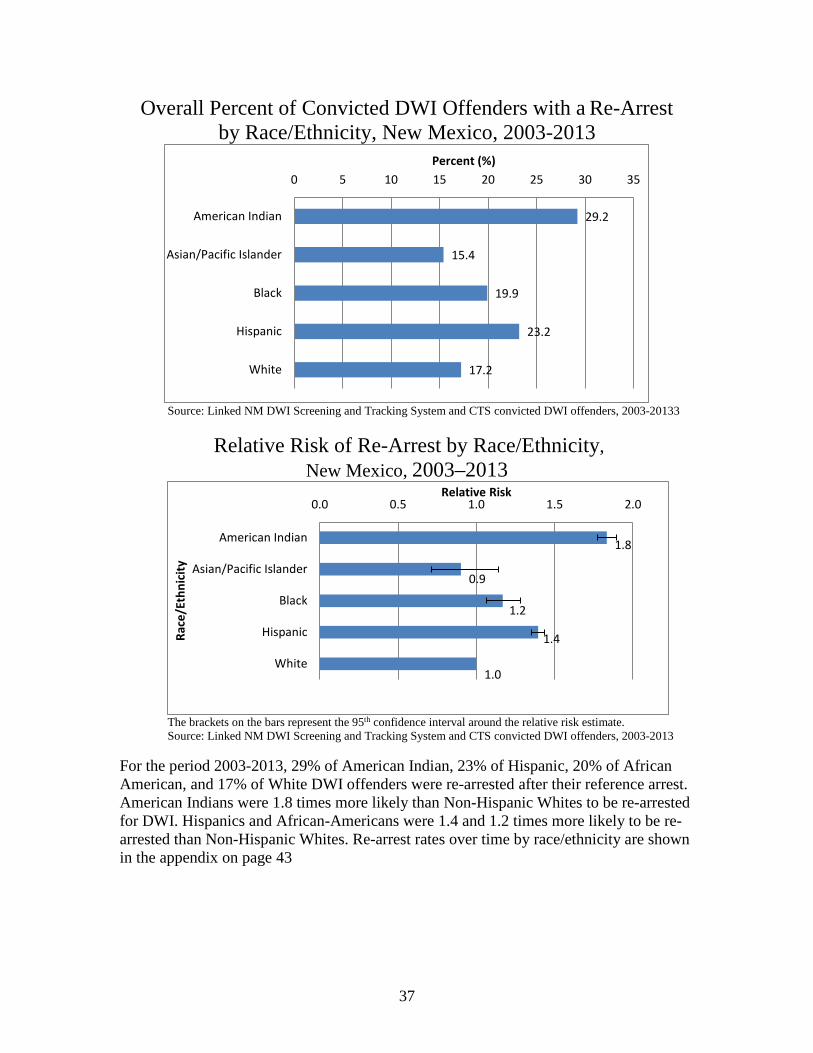
Overall Percent of Convicted DWI Offenders with a Re-Arrest by Race/Ethnicity, New Mexico, 2003-2013
Source: Linked NM DWI Screening and Tracking System and CTS convicted DWI offenders, 2003-20133
Relative Risk of Re-Arrest by Race/Ethnicity, New Mexico, 2003–2013
The brackets on the bars represent the 95th confidence interval around the relative risk estimate. Source: Linked NM DWI Screening and Tracking System and CTS convicted DWI offenders, 2003-2013
For the period 2003-2013, 29% of American Indian, 23% of Hispanic, 20% of African American, and 17% of White DWI offenders were re-arrested after their reference arrest. American Indians were 1.8 times more likely than Non-Hispanic Whites to be re-arrested for DWI. Hispanics and African-Americans were 1.4 and 1.2 times more likely to be re-arrested than Non-Hispanic Whites. Re-arrest rates over time by race/ethnicity are shown in the appendix on page 43
29.2
15.4
19.9
23.2
17.2
0 5 10 15 20 25 30 35
American Indian
Asian/Pacific Islander
Black
Hispanic
White
Percent (%)
1.8
0.9
1.2
1.4
1.0
0.0 0.5 1.0 1.5 2.0
American Indian
Asian/Pacific Islander
Black
Hispanic
White
Relative Risk
Race
/Eth
nici
ty
37

Overall Percent of Convicted DWI Offenders with a Re-Arrest by Gender, New Mexico, 2003-2013
Source: Linked NM DWI Screening and Tracking System and CTS convicted DWI offenders, 2003–2013
Relative Risk of Re-Arrest by Gender, New Mexico, 2003–2013
The brackets on the Female bar represent the 95th confidence interval around the relative risk estimate. Source: Linked NM DWI Screening and Tracking System and CTS convicted DWI offenders, 2003-2013
For the period 2003-2013, 24% of males and 18% of females were re-arrested after their reference arrest. Females were 30% less likely to be re-arrested for DWI than males. Re-arrest rates over time by gender are shown in the appendix on page 44
17.5
24.2
0 5 10 15 20 25 30
Female
Male
Percent (%)
0.70
1
0.0 0.2 0.4 0.6 0.8 1.0 1.2
Female
Male
Relative Risk
38

Overall Percent of Convicted DWI Offenders with a Re-Arrest by Age Group, New Mexico, 2003-2013
Source: Linked NM DWI Screening and Tracking System and CTS convicted DWI offenders, 2003–2013
Relative Risk of Re-Arrest by Age Group, New Mexico, 2003-20133
The brackets on the age group bars represent the 95th confidence interval around the relative risk estimate. Source: Linked NM DWI Screening and Tracking System and CTS convicted DWI offenders, 2003–2013
There was a pronounced gradient in re-arrest rates by age, with higher re-arrest rates among the younger age groups. Offenders under age 24 had a significantly higher risk of re-arrest than young adults (aged 25-34), who, in turn, had a significantly higher risk of arrest than older adults. Adults aged 45-54 were 44% less likely to be re-arrested than 15-24 year olds, while adults aged 55-64 were 60% less likely, and adults aged 60 and over were 74% less likely.
8.3
12.4
16.7
21.8
22.6
28.0
0 5 10 15 20 25 30
65+
55-64
45-54
35-44
25-34
18-24
Percent (%)
0.26
0.40
0.56
0.75
0.781.00
0.0 0.2 0.4 0.6 0.8 1.0 1.2
65+
55-64
45-54
35-44
25-34
18-24
Relative Risk
Age
39

Overall Percent of Convicted DWI Offenders with a Re-Arrest by the Number of Prior DWI Arrests,
New Mexico, 2003-2013
Source: Linked NM DWI Screening and Tracking System and CTS convicted DWI offenders, 2003-2013
Overall, convicted DWI offenders with no prior arrests were the least likely to be re-arrested (20%). Offenders with 3 or more prior arrests were the most likely to be re-arrested (27%).
Relative Risk of Re-Arrest Rates by Number of Prior DWI Arrests, New Mexico, 2003-2013
The brackets on the prior arrest bars represent the 95th confidence interval around the relative risk estimate. Source: Linked NM DWI Screening and Tracking System and CTS convicted DWI offenders, 2003-2013
Risk of re-arrest increased with the number of prior arrests. Those with 1 or 2 prior arrests were 31% more likely to be rearrested, and those with 3 or more prior arrests were 41% more likely to be rearrested as those with no prior arrests. Re-arrest rates over time by prior arrests are shown in the appendix on page 44.
27.0
25.8
25.4
20.1
0 5 10 15 20 25 30
3+
2
1
0
Percent (%)
1.41
1.33
1.31
1
0.0 0.2 0.4 0.6 0.8 1.0 1.2 1.4 1.6
3+
2
1
0
Relative Risk
Prio
r Arr
ests
40

Overall Percent of Convicted DWI Offenders with a Re-Arrest by Source of Alcohol before Arrest,
New Mexico, 2003-2013
Source: Linked NM DWI Screening and Tracking System and CTS convicted DWI offenders, 2003-2013
Offenders convicted of DWI who obtained their alcohol at a grocery store, a convenience store, or a liquor store had the highest rate of re-arrest (27%).
Relative Risk of Re-Arrest by Source of Alcohol before Arrest, New Mexico, 2003-2013
The brackets on the source bars represent the 95th confidence interval around the relative risk estimate. Source: Linked NM DWI Screening and Tracking System and CTS convicted DWI offenders, 2003-2013
Compared to DWI offenders who obtained their alcohol from a bar or restaurant, those who obtained alcohol at a grocery, convenience, or liquor store were 32% more likely to be re-arrested; those who obtained alcohol at their own home, at someone else’s home, or at a social gathering were 15% more likely to be re-arrested.
20.9
23.4
23.7
24.2
26.6
0 5 10 15 20 25 30
Bar/Restaurant
Other
Own Home/Other Home
Social Gathering
Grocery/Conventience/LiquorStores
Percent (%)
1.00
1.13
1.15
1.18
1.32
0.0 0.2 0.4 0.6 0.8 1.0 1.2 1.4 1.6
Bar/Restaurant
Other
Own Home/Other Home
Social Gathering
Grocery/Conventience/LiquorStores
Risk
41

Acknowledgements
This report was prepared by Jim Davis, MA, Substance Abuse Epidemiology Section, Injury and Behavioral Epidemiology Bureau, Epidemiology and Response Division, New Mexico Department of Health. This report could not have been completed without assistance from the DWI Coordinators in each county in New Mexico and the screeners and trackers from the county DWI programs who provided the data for this report. We would also like to thank the New Mexico Taxation and Revenue Department (NM-TRD) for allowing the use of the statewide Citation Tracking System We also acknowledge members of the Local Government Division, Department of Finance and Administration with whom we have a cooperative agreement to produce this report. Finally, we thank personnel from ADE, Inc. who provide the software for the screening and tracking program to the State of New Mexico.
42

APPENDIX
DWI Re-Arrest Rates* by Year of Conviction New Mexico, 2003-2013
* Percent of DWI offenders with at least one DWI re-arrest during the follow-up period.
Recidivism rates have been falling over time. People convicted in later years tend to have lower recidivism rates at each time step after conviction than people arrested in earlier years. The recidivism curve for each year of conviction is generally lower than the curve for the previous year, as shown above.
0
5
10
15
20
25
30
0 6 12 18 24 30 36 42 48 54 60
Perc
ent r
earr
este
d
Months after conviction
2003
2004
2005
2006
2007
2008
2009
2010
2011
2012
43

DWI Re-Arrest Rates* by Race/Ethnicity
New Mexico, 2003-2013
* Percent of DWI offenders with at least one DWI re-arrest during the follow-up period. Source: Linked NM DWI Screening and Tracking System and CTS convicted DWI offenders, 2003-2013
American Indian offenders have a DWI re-arrest rate of 13% at 24 months, 22% at 48 months, 26% at 72 months, 27% at 84 months, and 28% at 96 months. The rate among Hispanics is 10% after 24 months, 16% after 48 months, 20% after 72 months, and 21% after 84 months and 22% after 96 months. The rates among Whites are 7%, 12%, 15%, 16%, and 16% at 24, 48, 72, 84, and 96 months, respectively. Rates among Blacks are 9%, 15%, 18%, 19%, and 19% at 24, 48, 72, 84, and 96 months, respectively.
DWI Re-Arrest Rates* by Gender, New Mexico, 2003-2013
* Percent of DWI offenders with at least one DWI re-arrest during the follow-up period. Source: Linked NM DWI Screening and Tracking System and CTS convicted DWI offenders, 2003-2013
This graph presents male and female DWI re-arrest rates. Convicted male DWI offenders had re-arrest rates about 40% higher than female offenders over the 11 years. After 132 months, 24.2% of males had been re-arrested for DWI while only 17.5% of females had been re-arrested for DWI.
05
101520253035404550
0 6 12 18 24 30 36 42 48 54 60 66 72 78 84 90 96 102 108 114 120 126 132
Perc
ent (
%)
Months of following conviction
American-IndianHispanicAfrican-AmericanWhiteAsian
05
101520253035404550
0 6 12 18 24 30 36 42 48 54 60 66 72 78 84 90 96 102 108 114 120 126 132
Perc
ent (
%)
Months following conviction
Male
Female
44

DWI Re-Arrest Rates* by Age, New Mexico, 2003-2013
* Percent of DWI offenders with at least one DWI re-arrest during the follow-up period. Source: Linked NM DWI Screening and Tracking System and CTS convicted DWI offenders, 2003-2013
There were markedly different re-arrest trajectories by age, with younger arrestees more likely to be arrested across the entire follow-up period; and with re-arrest rates after 96 months ranging from 27% for 15-24 year olds, to 16% for 45-54 year olds, to 8% for offenders aged 65 and older.
DWI Re-Arrest Rates* by Number of Prior Convictions New Mexico, 2003-2013
* Percent of DWI offenders with at least one DWI re-arrest during the follow-up period. Source: Linked NM DWI Screening and Tracking System and CTS convicted DWI offenders, 2003-2013
Those with three prior DWI convictions were most likely to be re-arrested within 132 months (11 years), with a re-arrest rate of 27% within 132 months of their reference DWI conviction. Those with no prior convictions were the least likely to be re-arrested (20% after 132 months).
05
101520253035404550
0 6 12 18 24 30 36 42 48 54 60 66 72 78 84 90 96 102
108
114
120
126
132
Perc
ent (
%)
Months following conviction
15-24 years old25-34 years old35-44 years old45-54 years old55-64 years old65+ years old
05
101520253035404550
0 6 12 18 24 30 36 42 48 54 60 66 72 78 84 90 96 102 108 114 120 126 132
Perc
ent (
%)
Months following conviction
4+3210
45

DWI Re-Arrest Rates* by Source of Alcohol before Arrest New Mexico, 2003 - 2013
* Percent of DWI offenders with at least one DWI re-arrest during the follow-up period. Source: Linked NM DWI Screening and Tracking System and CTS convicted DWI offenders, 2003–2013
Offenders whose source of alcohol for their reference arrest was a grocery store, a convenience store, or a liquor store had the highest rate of re-arrest (27%) when compared to those with other sources of alcohol, although the difference in re-arrest rates between these sources wasn’t as pronounced as for some of the other categories presented above. Those who obtained their alcohol at a bar or restaurant were the least likely to be re-arrested (21%) after 132 months.
0
5
10
15
20
25
30
35
40
45
50
0 6 12 18 24 30 36 42 48 54 60 66 72 78 84 90 96 102 108 114 120 126 132
Perc
ent (
%)
Months following conviction
Bar/Restaurant
Grocery/Convenience/Liquor store
Own home/Other Home
Social Gathering/Party
Other
46