new jorunal of physics - kaist
TRANSCRIPT

T h e o p e n – a c c e s s j o u r n a l f o r p h y s i c s
New Journal of Physics
Electr on temperature and pressure dependencesof nonlinear phenomena in dustparticle oscillation in dc plasmas
C R Seon1, S Park2, W Choe1,3, C H Seo1, H Y Park1, K B Chai 1
and Y H Shin 2
1 Department of Physics, Korea Advanced Institute of Science and Technology,335 Gwahangno, Yuseong-gu, Daejeon 305-701, Korea2 Korea Research Institute of Standards and Science, 1 Doryong-dong,Yuseong-gu, Daejeon 305-340, KoreaE-mail:[email protected]
New Journal of Physics 10 (2008) 013025 (12pp)Received 5 October 2007Published 23 January 2008Online athttp://www.njp.org/doi:10.1088/1367-2630/10/1/013025
Abstract. Experiments and calculations were performed to study thedependence of the nonlinear dust oscillatory motion on electron temperatureand gas pressure in direct current plasmas. The frequency spectra of the dustparticle oscillations induced by an excitation wire were measured in differentdischarge conditions. At higher electron temperature in accordance with thehigher cathode voltage, the nonlinear phenomena of the oscillation spectrabecame more prominent. The amplitude of the subharmonic resonance peak waslarge and the frequency shift of the primary resonance peak was observed to bemore significant in the case of high electron temperature. The force profile nearthe particle trap position was calculated in order to understand the dependence ofthe oscillation spectra on the electron temperature and the electron density. Theelectron temperature dependence of the particle oscillation was well explainedfrom the calculated force profile. In addition, it was experimentally shown thatthe amplitudes of both the subharmonic resonance and the primary resonancebecame large as the pressure was decreased, which was consistent with thecalculation.
3 Author to whom any correspondence should be addressed.
New Journal of Physics 10 (2008) 0130251367-2630/08/013025+12$30.00 © IOP Publishing Ltd and Deutsche Physikalische Gesellschaft

2
Contents
1. Introduction 22. Experimental set-up 33. Plasma-sheath model, charging and exerted forces 44. Results and discussions 55. Conclusions 10Acknowledgments 12References 12
1. Introduction
The oscillatory motion of dust particles has attracted great interest for its unusual physicalbehaviours [1]–[5]. The oscillation spectra of the micro size particles have been also studiedto examine the feasibility of them being a diagnostic method. These studies aimed at themeasurement of the charge of micro particles [6] and the analysis of the potential structurenear the trap position in plasmas [1]–[3]. For example, the electrostatic potential profile wasobtained by analyzing the frequency spectra of the vertical oscillations [1].
Dust particles are usually negatively charged due to the larger mobility of electrons than ofions. These particles experience various forces, and they are trapped at the equilibrium positionnear the boundary between the sheath and the bulk plasma. The forces exerted on a dust particleinclude gravity, the electrostatic force in the plasma sheath, the ion drag force induced by theion movement, the thermophoretic force from the gas temperature gradient and the neutraldrag force due to collisions with neutral particles. The particle oscillations could be inducedby delayed charging of the dust particles [4] or plasma instability [5], but in most cases theoscillations are induced by externally driven forces using an excitation wire [1]–[3] or a focusedlaser beam [6] with a proper frequency.
The causes of the nonlinear phenomena of the particle oscillations are the asymmetryof the trapping forces and the spatial dependence of the externally driven force. There aremany important factors affecting the nonlinearity of the particle oscillations, such as gaspressure, electrostatic potential profile, particle size, electron density, electron temperatureetc. For example, it was reported that the nonlinear behaviour of dust particles was relatedto the anharmonic potential profile [1]. The nonlinear oscillations caused by electron densitymodulation due to the excitation wire were theoretically investigated, and the cause ofthe parametric resonance was explained [2]. It was also demonstrated that the observednonlinearities could be related to a position dependent charge variation of micro-spheres [3].The particle size dependence of the oscillation spectrum was investigated experimentally tounderstand the role of particle size, and the pressure dependence of the oscillation spectrumwas also studied by numerical simulation [7].
The aforementioned studies were on the dependence of the oscillation spectra on potentialprofile, particle charge, pressure and particle size. In this paper, experiments and calculationswere performed to investigate the dependence of the oscillation spectra on electron temperatureand electron density. In particular, the subharmonic resonance region was studied, whichhas shown a strong dependence on the force asymmetry and the parametric resonance.
New Journal of Physics 10 (2008) 013025 (http://www.njp.org/)

3
Figure 1. A schematic diagram of the experimental arrangement. A He–Nelaser was prepared for particle observation and the dust dispenser was used forinjecting SiO2 particles into the argon plasma. An excitation wire connectedto a function generator was used to drive particle oscillation in the directionperpendicular to the cathode surface.
An experiment on the gas pressure dependence was also performed, and the result was in goodagreement with the numerical calculations given in [7].
In section2, the experimental set-up for measuring the dust oscillation spectra is described.The modeling method for the plasma sheath and the particle charge calculation is demonstratedin section3. In the following sections, the measurement results of the oscillation spectra and theplasma parameters are described and discussed.
2. Experimental set-up
Experiments were conducted using a direct current (dc) plasma source as shown in figure1.The plasma was produced between a circular anode and a cathode of 16 cm diameter, whichwere separated vertically by 11 cm. The chosen experimental parameters were a dc voltagerange of−(280–350) V and a pressure range of 140–250 mTorr argon gas. A dust dispenser wasused to inject mono-disperse 1.5µm radius SiO2 particles into the argon plasma. To confinethe injected particles inside a narrow region, a copper ring of 4.8 cm outer diameter and 3.7 cminner diameter was placed on the cathode. The injected particles were trapped at about 10 mmabove the cathode surface.
Measurements of the trapped dust oscillation amplitude were performed by forward andbackward frequency sweep of the alternating current (ac) voltage with 1 Hz step frequency onthe excitation wire. To visualize the oscillation trajectories, a 632.8 nm He–Ne laser was used,and the image of the trapped particles was recorded using a set of zoom lenses, a charge-coupleddevice (CCD) camera and a video capture board. A Langmuir probe with 0.5 mm radius and7 mm length was used for measuring electron temperature and density under various discharge
New Journal of Physics 10 (2008) 013025 (http://www.njp.org/)

4
conditions in the absence of trapped dust particles. The probe signal was measured at the centerof the electrode and 30 mm above the lower electrode (10 mm above the particle trap position).The electron temperature and density were obtained from the probe signal by using the BRL(Bernstein–Rabinowitz–Laframboise) theory, in which the electron distribution was assumed tobe Maxwellian [8].
The excitation wire made of a 0.25 mm radius tungsten wire was located above the cathodeand connected to a function generator for providing an ac voltage (1–10 V), which induced theforced oscillation of the trapped particles. In order to apply nearly the same force to the particlesin various discharge conditions, the position of the wire located above the cathode was varied asthe particle trap position varied, i.e. the wire position was maintained to be about 5 mm belowthe particle trap position, which was inside the sheath. To check the effect of the wire voltageon the particle, the particle movement was monitored when the wire voltage was slowly varied.As the positive voltage was applied to the wire, the particle moved toward the wire and viceversa.
3. Plasma-sheath model, charging and exerted forces
In order to model the dust oscillatory motion, calculation of the forces exerted on a dust particlewas performed with a proper plasma sheath model. The plasma sheath modeling was done bysolving a set of equations expressed as [9]–[11]
niui = n0uB, (1)
miniuidui
dz= −nie
dφ
dz− mini
π
2λiu2
i , (2)
ne = n0 exp
(eφ
kTe
), (3)
ε0d2φ
dz2 = −e(ni − ne), (4)
where ni, ui, n0 and uB are ion density and speed in the sheath, ion density and Bohmspeed at the sheath boundary, respectively, andz is the vertical coordinate with respect tothe bottom electrode surface. Also,mi, λi, φ, ne, Te and k denote ion mass, ion mean freepath, electrostatic potential, electron density, electron temperature and Boltzmann constant,respectively. Equations (1)–(4) were calculated following the procedure in [7].
The dust particle charge was calculated by considering the electron current and the ioncurrent flowing into the particle. The electron and the ion current are the collision frequencytimes the charge of each species, respectively. The collision frequency of the electron and theion νe andνi are given as [10]
νe = πr 2ne
√8kTe
πmeexp
(eQ
4πε0rkTe
), (5)
νi = πr 2ni
√8kTi
πmi+ u2
i
{1−
eQ
2πε0rmi
(u2
i + 8kTiπmi
)}, (6)
New Journal of Physics 10 (2008) 013025 (http://www.njp.org/)

5
whereQ, r andTi are dust charge, dust radius and ion temperature, respectively. Because thedust particle is charged until these two frequencies are balanced, the particle charge is obtainedby setting these equations equal.
Using the potential and the charge calculated from equations (1)–(6), the electrostatic forceacting upon each particle was obtained, and the ion drag force was calculated by followingequation (7) of [7] written as
Fid(ui) = nimi√
πa2v2t
∫∞
0du
e−(u2+u20)
u20
× [2u0u cosh(2u0u) − sinh(2u0u)]
×
[u2 + 2ε + 4
ε2
u2ln
1 +δ−2(u4 + 2δu2)
1 +ε−2(u4 + 2εu2)
], (7)
where u0 ≡ ui/vt, vt =√
2kTi/mi, ε ≡ Qe/4πε0miv2t a, δ ≡ Qe/4πε0miv
2t λD and λD is the
Debye length, respectively.Taking the oscillation driving force due to the excitation wire into account, the total force
exerted on a particle is expressed as
Ftot(z, Vwire) = −ηdz
dt+ Fion(z, Vwire) + Felec(z, Vwire) + Fg + Fwire(z, Vwire), (8)
whereη is the drag coefficient of the neutral drag force, andFion, Felec andFg are the ion dragforce, the electrostatic force, and gravity, respectively, andFwire = F0 cos(2π f t) is the forcedue to the voltage applied to the excitation wire at the driving frequencyf . The thermophoreticforce was not considered because the gradient of the gas temperature was negligible in ourexperimental conditions.
In this work, the measured oscillation spectra showed both the primary and thesubharmonic resonance peaks, and moreover the amplitude of the subharmonic resonanceappeared to be as high as that of the primary resonance. From the fact that the amplitude ofthe subharmonic resonance is comparable to or even larger than that of the primary resonancein the presence of the electron density modulation, we consider that the excitation wire not onlydirectly forces the particle but also induces the electron density modulation [1, 2, 7]. Therefore,Fion, Felec andFg depend not only on the particle positionz, but also on the modulated electrondensity(ne)mod, which varies withVwire.
Here, the excitation forceFwire is dependent on the particle positionz and the wire voltageVwire. Following equation (6) of [12], Fwire is given as
Fwire =QVwire
ln(2d/rw)
[1
2d − (h +1z)−
1
h +1z
], (9)
whered is the distance from the wire to the upper electrode,rw is the wire radius,h denotes thedistance between the wire and the equilibrium position of the particlez0 and1z ≡ z− z0.
4. Results and discussions
The oscillation spectra were measured at various cathode voltages and gas pressures to findthe dependence on electron temperature, density and pressure. The voltage on the cathode forgenerating the dc plasmas was considered to be a variable while the pressure remained fixed at184 mTorr. Several nonlinear phenomena were observed in the oscillation spectra.
New Journal of Physics 10 (2008) 013025 (http://www.njp.org/)

6
0.5
1.0
1.5
Vwire = 1 V
5 V 10 V
pk-p
k am
plitu
de (
mm
)
0.5
1.0
1.5
0.5
1.0
1.5
0.5
1.0
1.5
ps
p
p
p s
ss
280 V 290 V
300 V 310 V
330 V
0.5
1.0
1.5
0 20 40 60 80 100
0.5
1.0
1.5
Frequency (Hz)
0 20 40 60 80 100
0.5
1.0
1.5
0.5
1.0
1.5
p p
ps
p
s
320 V
340 V 350 V
Figure 2. Particle oscillation spectra at different cathode voltages.Vcath=
280–350 V,p = 184 mTorr andVwire = 1, 5 and 10 V. Primary and subharmonicpeaks were observed. On the plots, P and S denote the primary resonance peakand the subharmonic resonance peak, respectively.
Figure 2 shows the measured particle oscillation spectra with the cathode bias voltageVcath and the excitation wire voltageVwire varied. A few noticeable observations were madein the range ofVcath= 280–350 V. Firstly, the subharmonic resonance peak(2ω0) began to
New Journal of Physics 10 (2008) 013025 (http://www.njp.org/)

7
280 300 320 340 360
1.0
1.5
2.0
2.5
3.0(a) (b)
Te
(eV
)
Cathode voltage (V)280 300 320 340 360
0
2
4
6
8
10
12
n e (x
108
cm–3
)
Cathode voltage (V)
Figure 3. The measured bulk electron temperature and density at differentcathode voltages.
appear atVcath= 300 V andVwire = 10 V (solid curve), and the peak became more prominentat Vcath> 330 V. The subharmonic peak also appeared atVwire = 5 V (dashed curve) at higherVcath(>330 V). However, it did not show up at too lowVwire. Secondly, asVwire was raisedfrom 1 to 10 V, the primary resonance frequencyω0 shifted toward the lower frequency atVcath> 300 V. For example,ω0 was 37 Hz atVwire = 1 V but it was 27 Hz atVwire = 10 V, intheVcath= 320 V discharge case. Thirdly,ω0 was up-shifted at lowVwire (Vwire = 1 V, dash dotcurve) atVcath= 290–300 V. In theVcath= 290 V case,ω0 was about 27 Hz, but it was about37 Hz withVcath> 300 V atVwire = 1 V.
In particular, the reason for the noticeable changes atVcath= 290–300 V might be thedependence of the particle oscillations on plasma parameters. As shown in figure3(a), theelectron temperatureTe measured in the cathode voltage range increased significantly from1.55 eV at 290 V to 2.20 eV at 300 V. However, the change in the electron densityne was notas significant asTe, as depicted in figure3(b). Therefore, the abrupt change in the oscillationspectra is thought to be due to the large change in the electron temperature. The abrupt changeof Te at Vcath= 290–300 V is considered to be due to the variation of the secondary electronemission coefficientγ . The secondary electron emission from the cathode surface is a functionof Vcath, and the relation betweenγ andVcath is nonlinear [13]. Following figure 8 of [13], Vcathatwhichγ increases corresponds to 290–300 V under our experimental conditions. Moreover, thetemperature of the secondary electron emission is about 1–5 eV [14], so the enhanced emissionof secondary electrons results in the variation ofTe in Vcath= 290–300 V. The discharge currentwas also increased from 2.9 mA atVcath= 290 V to 3.45 mA atVcath= 300 V. Because thechange inne was not significant, the discharge current increase was also caused by theTe
increase.Although the particle oscillations were induced by the driving force provided by the ac
voltage on the excitation wire, the particle motions were also affected by the internal forceFint
(= Fion + Felec+ Fg) near the trapped region of the particles. Since theFint profile, Fint(z) maybe changed by variation of the plasma parameters, it was calculated numerically at variousVcath,by using equations (1)–(6). The measuredne andTe at eachVcath were used as input parametersin the calculations. If we take the parametric resonance into consideration, the electron densitywould be modulated by the excitation wire. To investigate the effect of this density modulation,Fint(z) was calculated with various electron densities(ne)mod = 0.6ne, 0.8ne, ne, 1.2ne and 1.4ne,
New Journal of Physics 10 (2008) 013025 (http://www.njp.org/)

8
wherene is the measured electron density at eachVcath. Because the experimental conditionsin this paper were nearly the same as those in [7], it was assumed that(ne)mod = 0.6ne
corresponded to the maximumVwire (Vwire = +10 V) and (ne)mod = 1.4ne corresponded to theminimum Vwire (Vwire = −10 V), using the results from [7]. Figure 4 shows the calculatedFint(z) at Vcath= 280–350 V. The direction of the net force is toward the equilibrium position,z0. The five curves in each plot correspond to the five different(ne)mod. The three blackdots in each plot represent the forces at1z (= z− z0) = + 0.7, 0 and− 0.7 mm, respectively,where + 0.7 and− 0.7 mm correspond approximately to the maximum and the minimum ofthe particle displacement1z in our experimental condition. The force at1z = +0.7 mm is theforce on the curve of the(ne)mod = 0.6ne case and the force at1z = − 0.7 mm is the forceon the curve of the(ne)mod = 1.4ne case, because the particle is located closest to the wire(1z = − 0.7 mm) at Vwire = +10 V((ne)mod = 0.6ne), and the particle is located farthest fromthe wire (1z = + 0.7 mm) atVwire = −10 V(ne)mod = 1.4ne).
As shown in figure4, Fint(z) changed abruptly atVcath= 290–300 V. In other words,at 1z = −0.7 mm, a particle experiences 2.8× 10⁻¹² N at 290 V, but 5.9× 10⁻¹² N at 300 V.However,Fint at 1z = +0.7 mm does not change much atVcath= 280–350 V, and it has smallvalues less than 2.0× 10⁻¹² N. The abrupt change ofFint near 1z = −0.7 mm makes thesubharmonic resonance peak(2ω0) appear atVcath> 300 V because of the asymmetry ofFint(z).This change ofFint(z) is believed to be related to theTe increase from 1.55 eV at 290 V to2.20 eV at 300 V.
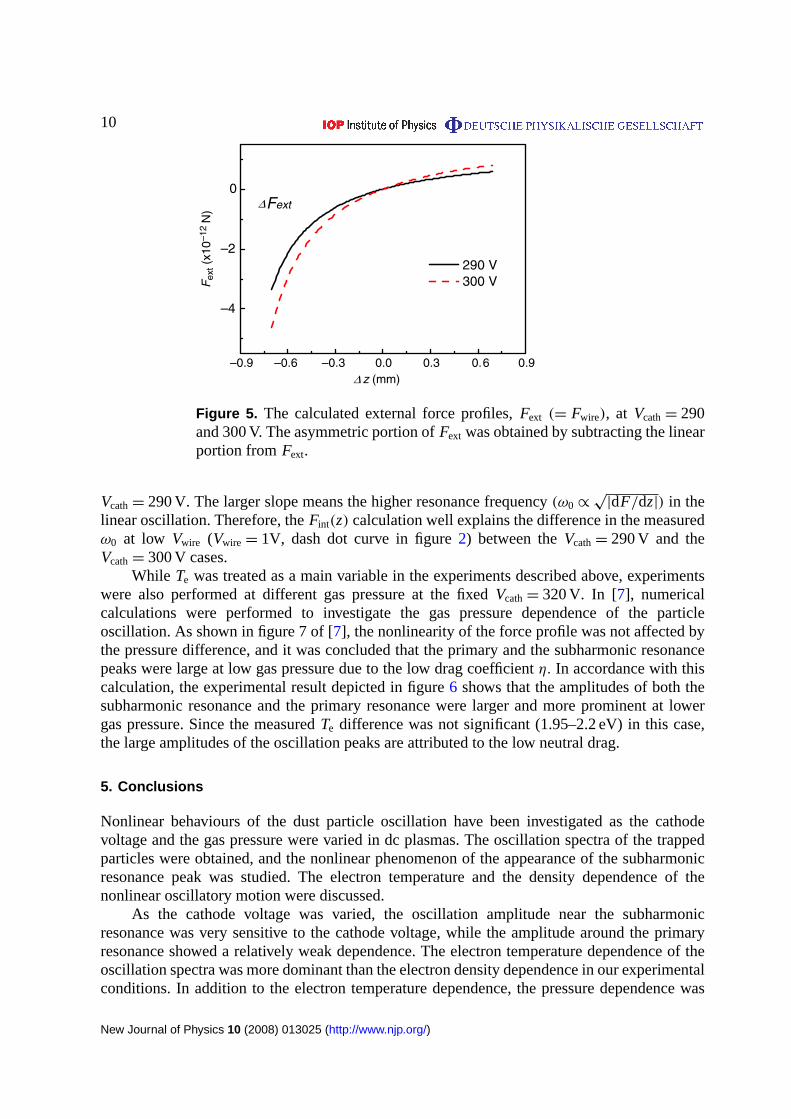
In addition to theFint profile, the profile of the external force,Fext = Fwire was calculatedfrom equation (9) at Vcath= 290 and 300 V. The particle chargeQ was obtained byequations (1)–(6) at eachVcath. Here, 1z = − 0.7 mm corresponds to the maximumVwire
(Vwire = +10 V) and the1z = +0.7 mm corresponds to the minimumVwire (Vwire = −10 V).Figure 5 showsFext as a function of1z. The force profiles are asymmetric with respect to1z = 0 mm, and the asymmetry becomes large as the particle positionz is close to the wire, i.e.as1z becomes more negative. The linear portion ofFext, lin(Fext), was subtracted fromFext, and1Fext (≡ Fext − lin(Fext)) was calculated. Since the linear portion ofFext contributes only to theprimary resonance,1Fext is the portion ofFext affecting the nonlinear resonance in the particleoscillation. At1z = −0.7 mm,1Fext
∼= −2.0× 10⁻¹² N at 290 V and1Fext∼= −2.7× 10⁻¹² N
at 300 V, respectively. To understand the effect of1Fext on the total force profile, it is necessaryto compare the values of1Fext with the values ofFint. At 1z = −0.7 mm,Fint is 2.8× 10⁻¹² Nat 290 V and 5.9× 10⁻¹² N at 300 V, respectively. However, if1Fext is included in the totalforce profile(Ftot ≡ Fint +1Fext), Ftot at 1z = −0.7 mm become 0.8× 10⁻¹² N at 290 V and3.2× 10−12 N at 300 V, whileFtot at 1z = +0.7 mm are about 1.0× 10⁻¹² N in both cases. Inother words,Ftot at 1z = −0.7 mm is nearly the same as the value at1z = +0.7 mm in theVcath= 290 V case, butFtot at 1z = −0.7 mm is much larger than at1z = +0.7 mm in theVcath= 300 V case. Consequently,1Fext makes the total force profile become nearly linear at290 V, but it does not significantly affect the nonlinearity of the total force profile at 300 V.
These calculations imply thatTe is critical to the force profile, because figures3 and 4demonstrate thatFint(z) is affected mainly byTe. The higherTe makes the particle oscillationmore nonlinear as shown in figure2. However, the electron densityne does not significantlyaffect the force profile, even though it affects the particle trap position (whereFint = 0) as shownin figure4.
The quantitative difference in the primary resonance frequencyω0 can also be explainedby figure 4. In the figure, the slope ofFint(z) at Fint = 0 is larger atVcath= 300 V than at
New Journal of Physics 10 (2008) 013025 (http://www.njp.org/)

9
–2
0
2
4
6
8
10 0.6ne 0.8ne ne 1.2ne 1.4ne
Fin
t (x1
0–12 N
)
–2
0
2
4
6
8
10
–2
0
2
4
6
8
10
–2
0
2
4
6
8
10
10
–0.7 mm
+0.7 mm
0 mm
280 V
300 V
320 V 330 V
310 V
290 V
–2
0
2
4
6
8
–2
0
2
4
6
8
10
7 10 11–2
0
2
4
6
8
10
Distance from the cathode, z (mm)
7 10 11–2
0
2
4
6
8
10
340 V 350 V
98 98
Figure 4. The calculated internal force profiles,Fint (= Fion + Felec+ Fg), withvarious Te and ne values atVcath= 280–350 V. In each plot, five curves areshown for the modulated(ne)mod = 0.6ne, 0.8ne, ne, 1.2ne and 1.4ne, wherene
is the measured electron density at eachVcath. The three black dots in each plotindicate the forces at1z = +0.7, 0,−0.7 mm, respectively. The pressure used inthe calculation was 184 mTorr, which was the experimental value.
New Journal of Physics 10 (2008) 013025 (http://www.njp.org/)
10
–0.9 –0.6 –0.3 0.0 0.3 0.6 0.9
–4
–2
0F
ext (
x10–
12 N
)
∆
∆
z (mm)
290 V 300 V
Fext
Figure 5. The calculated external force profiles,Fext (= Fwire), at Vcath= 290and 300 V. The asymmetric portion ofFext was obtained by subtracting the linearportion fromFext.
Vcath= 290 V. The larger slope means the higher resonance frequency(ω0 ∝√
|dF/dz|) in thelinear oscillation. Therefore, theFint(z) calculation well explains the difference in the measuredω0 at low Vwire (Vwire = 1V, dash dot curve in figure2) between theVcath= 290 V and theVcath= 300 V cases.
While Te was treated as a main variable in the experiments described above, experimentswere also performed at different gas pressure at the fixedVcath= 320 V. In [7], numericalcalculations were performed to investigate the gas pressure dependence of the particleoscillation. As shown in figure 7 of [7], the nonlinearity of the force profile was not affected bythe pressure difference, and it was concluded that the primary and the subharmonic resonancepeaks were large at low gas pressure due to the low drag coefficientη. In accordance with thiscalculation, the experimental result depicted in figure6 shows that the amplitudes of both thesubharmonic resonance and the primary resonance were larger and more prominent at lowergas pressure. Since the measuredTe difference was not significant (1.95–2.2 eV) in this case,the large amplitudes of the oscillation peaks are attributed to the low neutral drag.
5. Conclusions
Nonlinear behaviours of the dust particle oscillation have been investigated as the cathodevoltage and the gas pressure were varied in dc plasmas. The oscillation spectra of the trappedparticles were obtained, and the nonlinear phenomenon of the appearance of the subharmonicresonance peak was studied. The electron temperature and the density dependence of thenonlinear oscillatory motion were discussed.
As the cathode voltage was varied, the oscillation amplitude near the subharmonicresonance was very sensitive to the cathode voltage, while the amplitude around the primaryresonance showed a relatively weak dependence. The electron temperature dependence of theoscillation spectra was more dominant than the electron density dependence in our experimentalconditions. In addition to the electron temperature dependence, the pressure dependence was
New Journal of Physics 10 (2008) 013025 (http://www.njp.org/)

11
0.5
1.0
1.5
0.5
1.0
1.5pk
–pk
ampl
itude
(m
m) Vwire = 1V
5V
p s
ps
192 mTorr
144 mTorr
0 20 40 60 80 100
0.5
1.0
1.5
Frequency (Hz)
p s
208 mTorr
Figure 6. The particle oscillation spectra at different pressure, 144, 192 and208 mTorr.Vcath= 320 V andVwire = 1 and 5 V, respectively. Primary (P) andsubharmonic (S) peaks are seen.
also studied. As the pressure was reduced, both the primary resonance and the subharmonicresonance peak increased, and these results agreed well with our previous reports [7]. Forfurther understanding, the numerical calculation of the force profile was performed in the
New Journal of Physics 10 (2008) 013025 (http://www.njp.org/)

12
various discharge conditions. The asymmetry of the force profile was significantly affected bythe electron temperature. More theoretical studies to find the correlation between these forceprofiles and the oscillation spectra are needed.
The results in this work suggest that the nonlinear oscillatory motion of the particles couldbe controlled by the electron temperature and the gas pressure.
Acknowledgments
We thank Dr Junghee Kim. This work was supported by the Ministry of Commerce, Industryand Energy of the Republic of Korea.
References
[1] Ivlev A V, Stterlin R, Steinberg V, Zuzic M and Morfill G 2000Phys. Rev. Lett.854060[2] Sorasio G, Resendes D P and Shukla P K 2002Phys. Lett.A 29367[3] Zafiu C, Melzer A and Piel A 2001Phys. Rev.E 63066403[4] Nunomura S, Misawa R, Ohno N and Takamura S 1999Phys. Rev. Lett.831970[5] Samarian A A, James B W, Vladimirov S V and Cramer N F 2001Phys. Rev.E 64025402[6] Homann A, Melzer A and Piel A 1999Phys. Rev.E 593835[7] Park S, Seon C R and Choe W 2004Phys. Plasmas115095[8] Bernstein I B and Rabinowitz I N 1959Phys. Fluids2 112[9] Riemann K-U 1997Phys. Plasmas4 4158
[10] Riemann K-U 2003J. Phys. D: Appl. Phys.362811[11] Lieberman M A and Lichtenberg A J 1994Principles of Plasma Discharges and Materials Processing
(New York: Wiley)[12] Wang Y-N, Hou L-J and Wang X 2002Phys. Rev. Lett.89155001[13] Auday G, Guillot Ph, Galy J and Brunet H 1998J. Appl. Phys.835917[14] Goertz C K 1989Rev. Geophys.27271
New Journal of Physics 10 (2008) 013025 (http://www.njp.org/)