new jersey bankers association - griffin financial group … · new jersey bankers association ....
TRANSCRIPT
MEMBER FINRA/SIPC
Valuing and Assessing Mortgage Company Acquisitions:
Is this the market to enter/expand residential lending? May 17, 2013
New Jersey Bankers Association
Speaker: Richard A. “Dick” Vader, Senior Managing Director, Griffin Financial Group LLC
2
Valuing and Assessing Mortgage Company Acquisitions:
Is this the market to enter/expand residential lending? In this session, attendees will learn the pros and cons of entering the mortgage banking market.
Strategic issues, as well as various operational considerations, will be discussed, including recommendations for how to structure such a transaction and properly incent both sides to create a “win-win deal.”
Speaker: Richard A. “Dick” Vader, Senior Managing Director, Griffin Financial Group LLC
New Jersey Bankers - Speaker Synopsis
3
Mortgage Banking | Past – Present – Future
Volumes – Mix – Rates

4 Source: Freddie Mac Investor Presentation
Home Price Performance (2012 vs. 2006)
Mortgage Banking Environment
The housing bubble burst in 2007, halting new and existing home sales. In some states, home owners lost more than 40-50% of their home values.
5 Source: Freddie Mac Investor Presentation
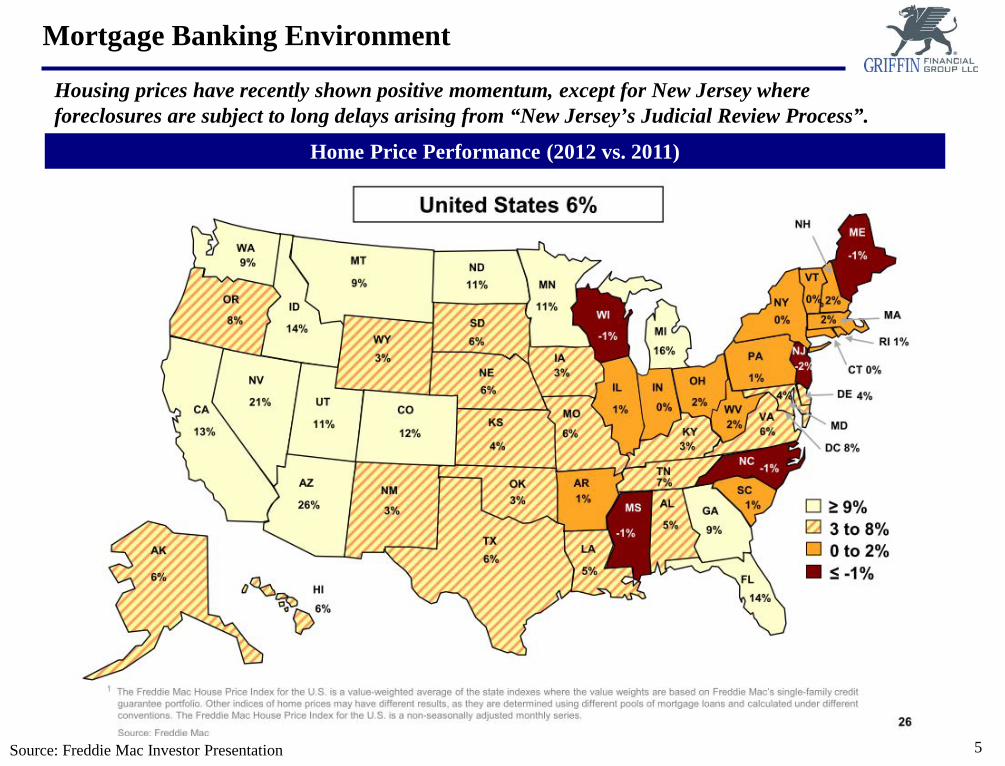
Home Price Performance (2012 vs. 2011)
Mortgage Banking Environment
Housing prices have recently shown positive momentum, except for New Jersey where foreclosures are subject to long delays arising from “New Jersey’s Judicial Review Process”.
6
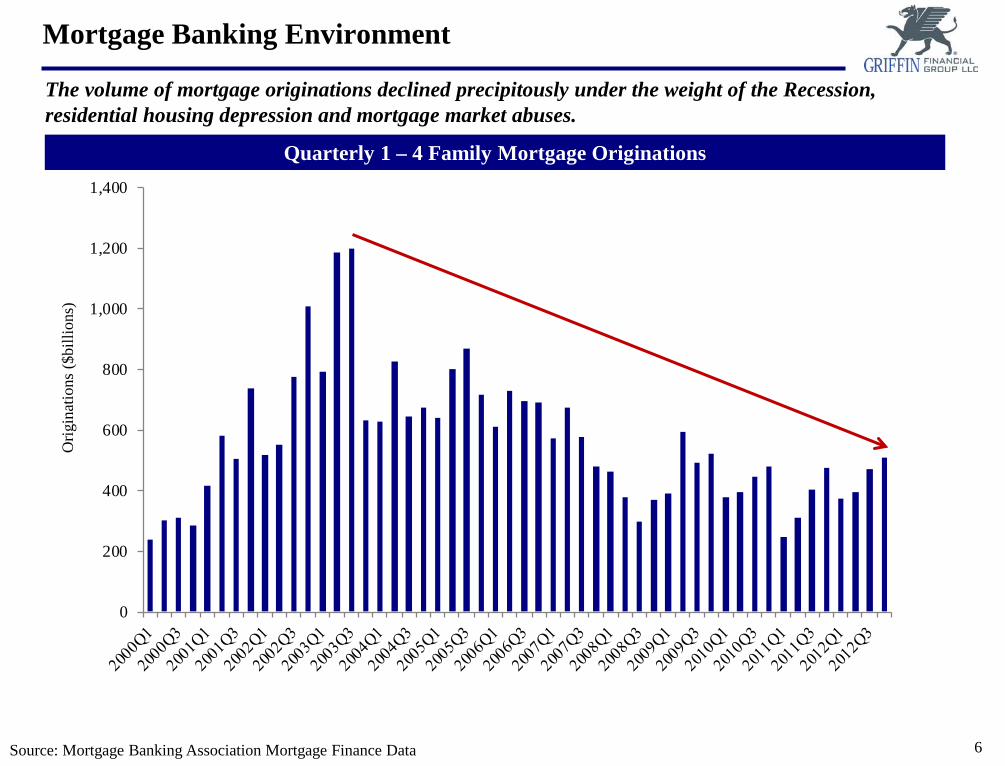
The volume of mortgage originations declined precipitously under the weight of the Recession, residential housing depression and mortgage market abuses.
0
200
400
600
800
1,000
1,200
1,400
Quarterly 1 – 4 Family Mortgage Originations
Mortgage Banking Environment O
rigin
atio
ns ($
billi
ons)
Source: Mortgage Banking Association Mortgage Finance Data
7
Mortgage Banking Environment
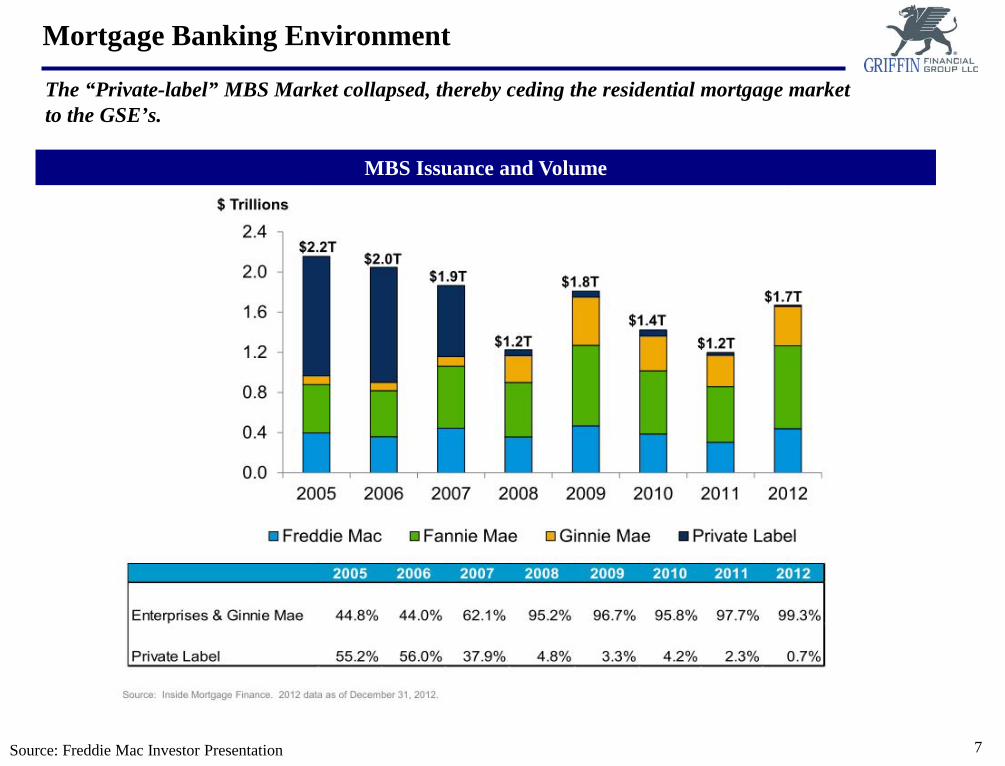
The “Private-label” MBS Market collapsed, thereby ceding the residential mortgage market to the GSE’s.
MBS Issuance and Volume
Source: Freddie Mac Investor Presentation
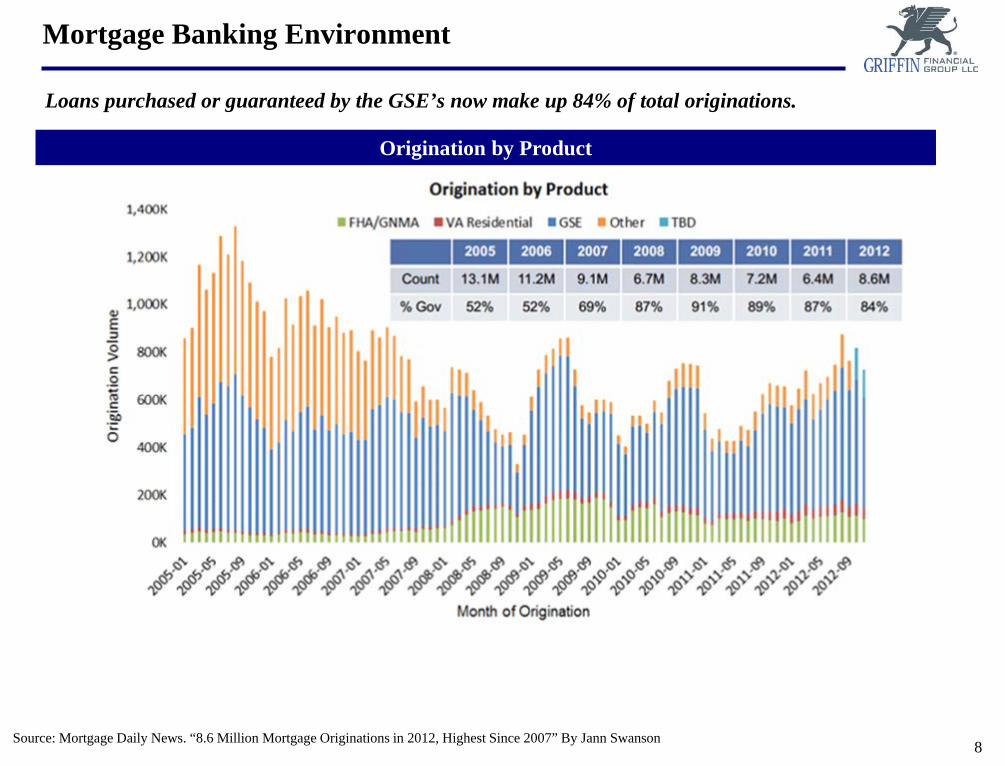
8 Source: Mortgage Daily News. “8.6 Million Mortgage Originations in 2012, Highest Since 2007” By Jann Swanson
Origination by Product
Mortgage Banking Environment
Loans purchased or guaranteed by the GSE’s now make up 84% of total originations.
9
0
100
200
300
400
500
600
2011Q1 2011Q2 2011Q3 2011Q4 2012Q1 2012Q2 2012Q3 2012Q4
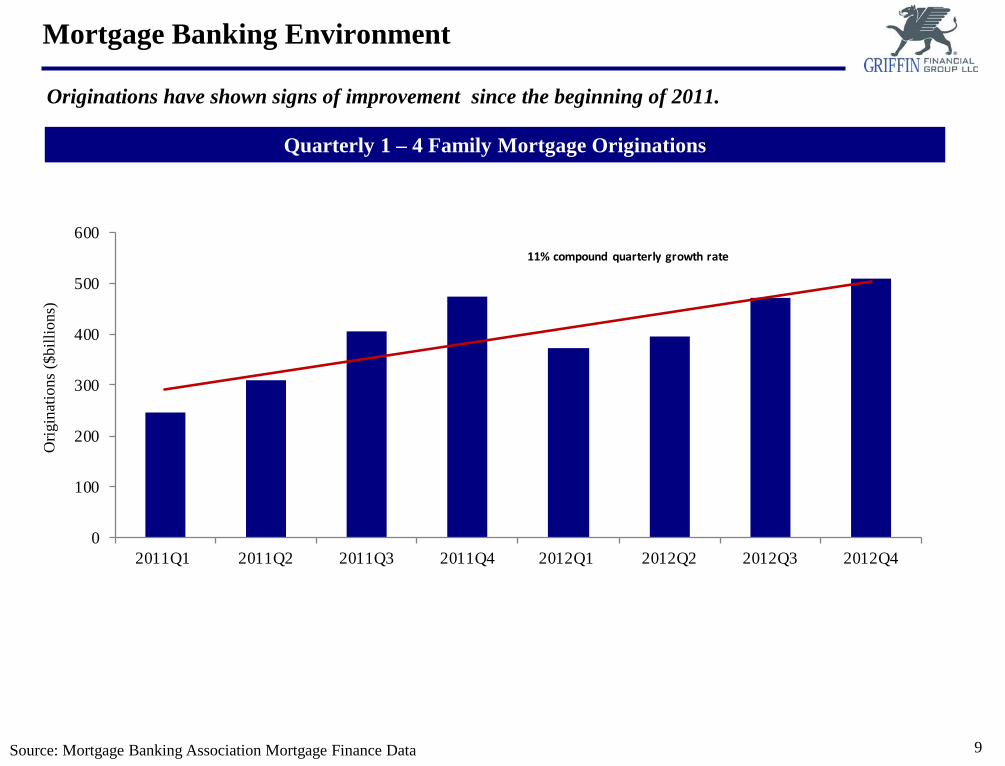
11% compound quarterly growth rate
Quarterly 1 – 4 Family Mortgage Originations
Source: Mortgage Banking Association Mortgage Finance Data
Mortgage Banking Environment
Originations have shown signs of improvement since the beginning of 2011.
Orig
inat
ions
($bi
llion
s)
10
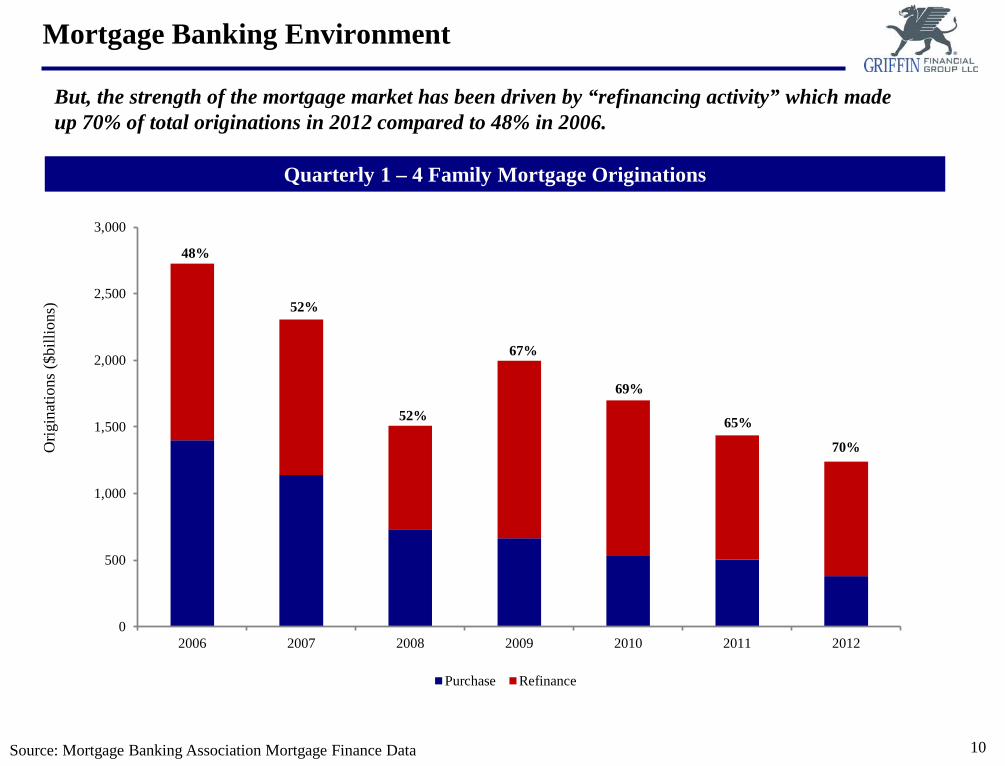
But, the strength of the mortgage market has been driven by “refinancing activity” which made up 70% of total originations in 2012 compared to 48% in 2006.
Quarterly 1 – 4 Family Mortgage Originations
Source: Mortgage Banking Association Mortgage Finance Data
Mortgage Banking Environment
0
500
1,000
1,500
2,000
2,500
3,000
2006 2007 2008 2009 2010 2011 2012
Purchase Refinance
70%
65%
69%
67%
52%
52%
48%
Orig
inat
ions
($bi
llion
s)

11
30-Year Mortgage Rates
Source: Freddie Mac Investor Presentation
Borrowers have been enticed to refinance mortgages by historically low interest rates.
Mortgage Banking Environment
12 Source: Mortgage Daily News. “8.6 Million Mortgage Originations in 2012, Highest Since 2007” By Jann Swanson
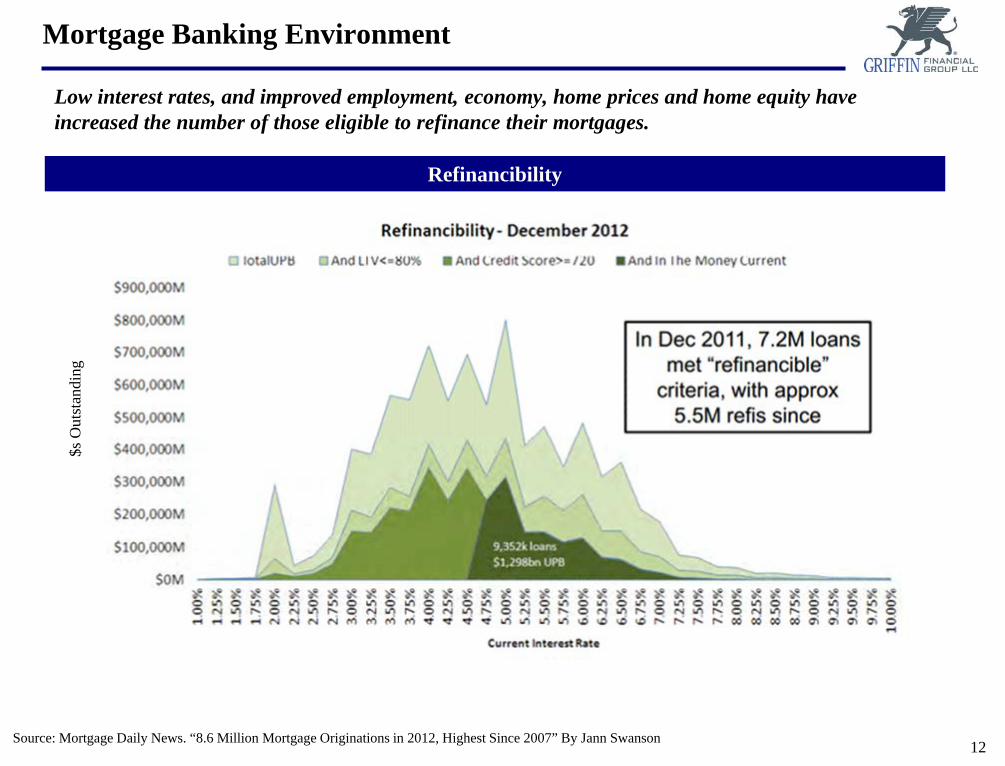
Refinancibility
Low interest rates, and improved employment, economy, home prices and home equity have increased the number of those eligible to refinance their mortgages.
Mortgage Banking Environment $s
Out
stan
ding
13
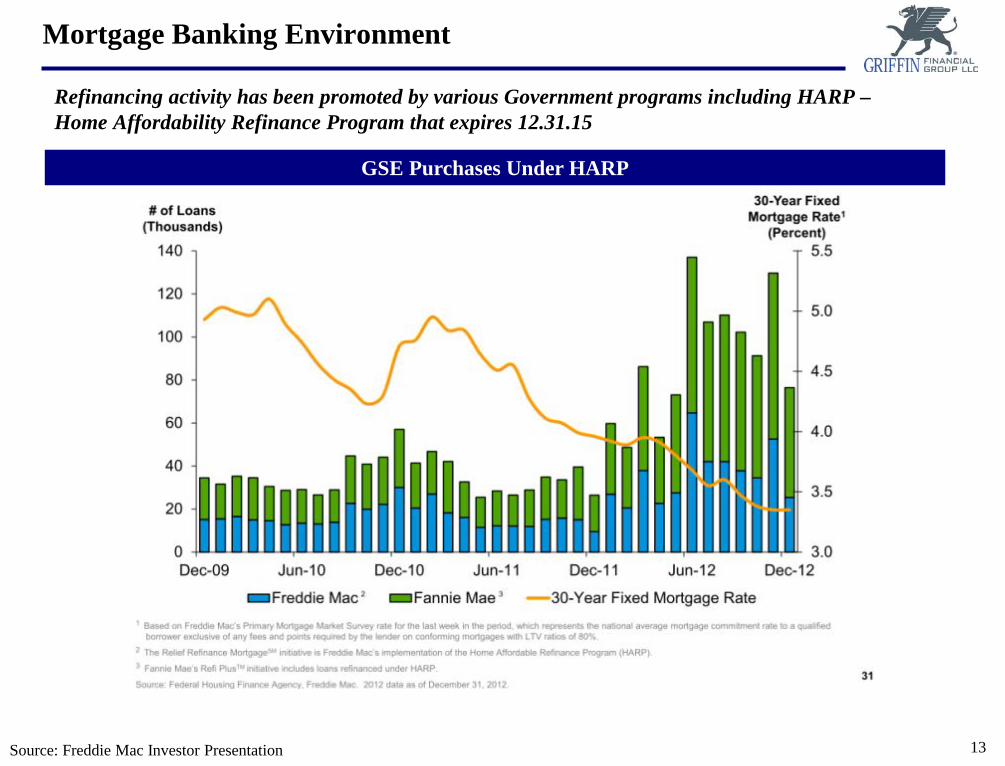
GSE Purchases Under HARP
Source: Freddie Mac Investor Presentation
Refinancing activity has been promoted by various Government programs including HARP – Home Affordability Refinance Program that expires 12.31.15
Mortgage Banking Environment
14
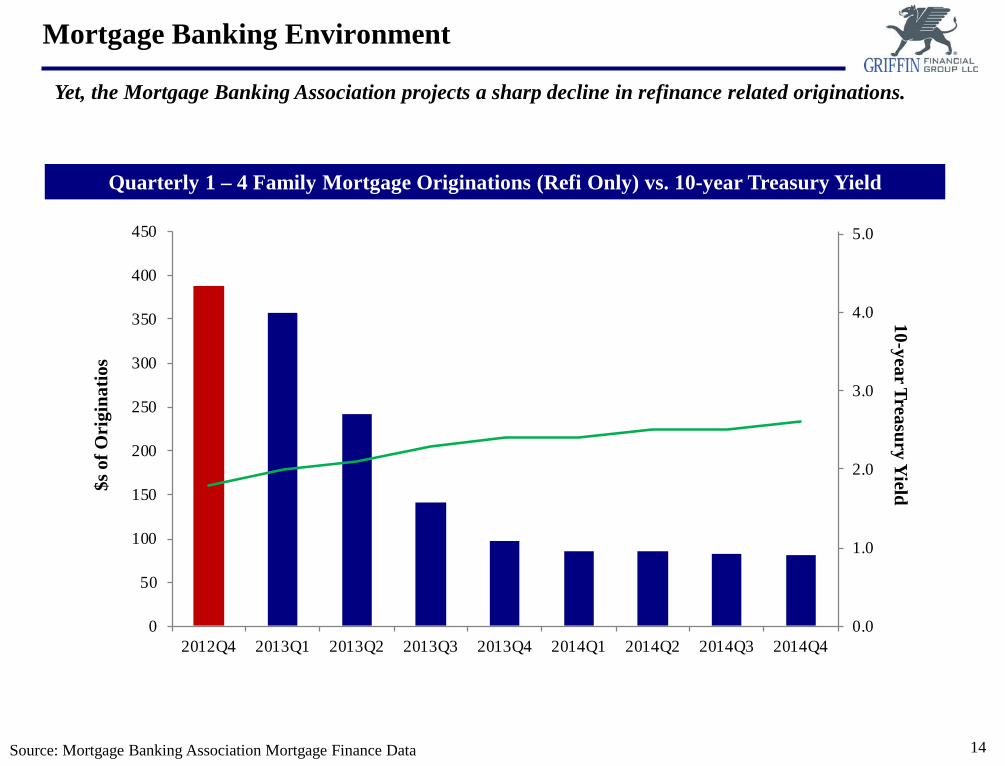
Quarterly 1 – 4 Family Mortgage Originations (Refi Only) vs. 10-year Treasury Yield
Source: Mortgage Banking Association Mortgage Finance Data
Yet, the Mortgage Banking Association projects a sharp decline in refinance related originations.
0.0
1.0
2.0
3.0
4.0
5.0
0
50
100
150
200
250
300
350
400
450
2012Q4 2013Q1 2013Q2 2013Q3 2013Q4 2014Q1 2014Q2 2014Q3 2014Q4
Mortgage Banking Environment
$s o
f Ori
gina
tios
10-year Treasury Yield

15
0
50
100
150
200
250
2012Q4 2013Q1 2013Q2 2013Q3 2013Q4 2014Q1 2014Q2 2014Q3 2014Q4
Quarterly 1 – 4 Family Mortgage Originations (Purchase Only)
Mortgage Banking Environment
While purchase activity is expected to increase modestly, this will NOT be enough to offset the expected decline in refinancing activity.
Source: Mortgage Banking Association Mortgage Finance Data
$s o
f Ori
gina
tios

16
Quarterly 1 – 4 Family Mortgage Originations
Mortgage Banking Environment
The Mortgage Bankers Association estimates total originations to fall from $1.8 trillion for 2012 to $1.5 trillion in 2013 and in $1.1 trillion in 2014
Source: Mortgage Banking Association Mortgage Finance Data
$s o
f Ori
gina
tios
0
200
400
600
800
1,000
1,200
1,400
Purchase Refinance
Forecast
$1,750 originations
$1,478 originations
$1,091 originations
Actual
17
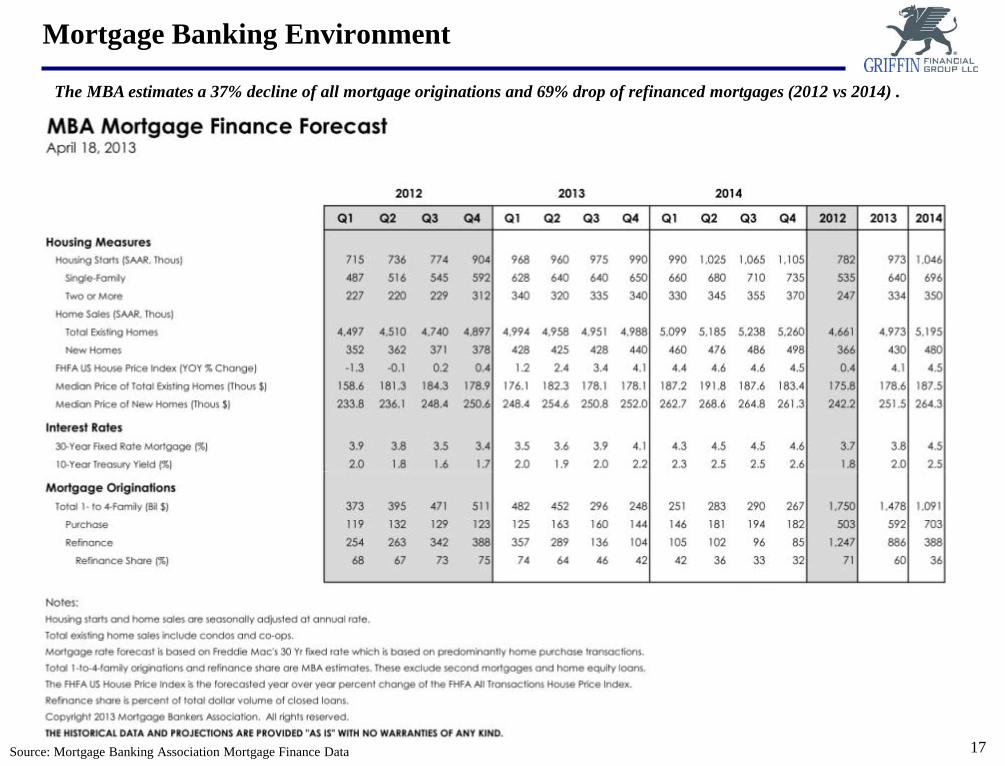
Mortgage Banking Environment
The MBA estimates a 37% decline of all mortgage originations and 69% drop of refinanced mortgages (2012 vs 2014) .
Source: Mortgage Banking Association Mortgage Finance Data

18
♦ Since the beginning of the “Great Recession”, overall mortgage origination activity has dropped considerably: • Mortgage originations related to purchase activity have dropped from a high of $432 billion in the 2nd
quarter of 2005 to $123 billion in the 4th quarter of 2012 • Mortgage originations related to refinance activity has remained strong as low absolute interest rates and
Government programs have bolstered volume
♦ Both the Mortgage Bankers Association and Moody’s Analytics expect a sharp decline of mortgage originations starting in the second half of 2013: • Mortgage activity related to purchases will remain depressed relative to historical levels, but will show
signs of improvement over the next few years with new household formation • Mortgage activity related to refinancing is expected to fall by approximately 75% from the 4th quarter of
2012 to the 4th quarter of 2013
♦ The growth rates of mortgage banking revenue looks to be unsustainable going forward (and may have peaked in 2012Q3), as the decline of volume will reduce revenue and profitability (fewer loans to absorb fixed costs).
Summary of Current and Forecasted Origination Activity

19
Recent Mortgage Banking Operating Performance
20
Operating Performance
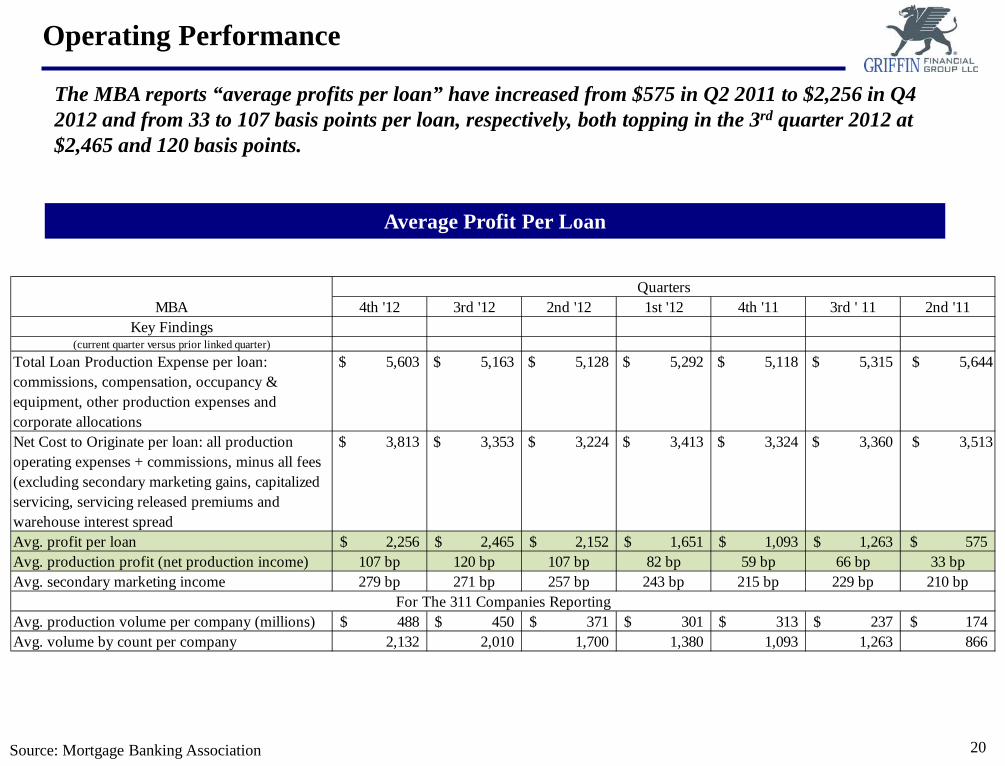
Average Profit Per Loan
The MBA reports “average profits per loan” have increased from $575 in Q2 2011 to $2,256 in Q4 2012 and from 33 to 107 basis points per loan, respectively, both topping in the 3rd quarter 2012 at $2,465 and 120 basis points.
Source: Mortgage Banking Association
4th '12 3rd '12 2nd '12 1st '12 4th '11 3rd ' 11 2nd '11Key Findings
(current quarter versus prior linked quarter)
Total Loan Production Expense per loan: commissions, compensation, occupancy & equipment, other production expenses and corporate allocations
$ 5,603 $ 5,163 $ 5,128 $ 5,292 $ 5,118 $ 5,315 $ 5,644
Net Cost to Originate per loan: all production operating expenses + commissions, minus all fees (excluding secondary marketing gains, capitalized servicing, servicing released premiums and warehouse interest spread
$ 3,813 $ 3,353 $ 3,224 $ 3,413 $ 3,324 $ 3,360 $ 3,513
Avg. profit per loan 2,256$ 2,465$ 2,152$ 1,651$ 1,093$ 1,263$ 575$ Avg. production profit (net production income) 107 bp 120 bp 107 bp 82 bp 59 bp 66 bp 33 bpAvg. secondary marketing income 279 bp 271 bp 257 bp 243 bp 215 bp 229 bp 210 bp
Avg. production volume per company (millions) 488$ 450$ 371$ 301$ 313$ 237$ 174$ Avg. volume by count per company 2,132 2,010 1,700 1,380 1,093 1,263 866
MBAQuarters
For The 311 Companies Reporting

21
Operating Performance – 4th Quarter 2012 vs. 4th Quarter 2011
Profit Metrics 4th Quarter 2012 vs. 2011
The MBA most recently reports profits per loan of $2,256 vs. $1,093 or 107 vs. 58 basis points on the strength of Net Secondary Marketing Income.
Source: Mortgage Banking Association
Basis Points Dollars Per Loan Basis Points Dollars Per Loan % Change
Revenues: Total Loan Production Revenues: 60% origination fees, and 32% underwriting, processing, adm fees (a) 82 1,790$ 83 1,794$ -0.2%Expenses: Total Personnel: 46% sales, 24% fulfillment, 19% production 162 3,569$ 158 3,226$ 10.6% Occupancy & Equipment 11 247 14 287 -13.9% Technology 4 91 4 87 4.6% Total Other Direct 60 1,311 59 1,225 7.0%Direct Loan Production Expenses 238 5,218$ 235 4,825$ 8.1%Corporate Allocation 18 385 14 293 31.4%Total Loan Production Expenses (b) 255 5,603$ 249 5,118$ 9.5%
Net Loan Production Operating Income (Loss) (a-b) (173) (3,813) (160) (3,325) 14.7%Net Interest Income - Warehousing 1 23 3 62 Net Secondary Marketing Income 279 6,046 215 4,344 39.2%
Total Net Production Income 107 2,256$ 58 1,093$ 106.4%
2012 2011

22
Operating Performance – By Type of Mortgage Banker
Profit Metrics 4th Quarter 2012
The MBA most recently reports banks having the lowest Net Loan Production Operating Income (Loss), but also the lowest Net Secondary Marketing Income.
Source: Mortgage Banking Association
Bank / Thrift Independents Others Total
Total Loan Production Revenues 66 85 85 82
Total Loan Production Expenses 194 272 234 255
Net Loan Production Operating Income (Loss) (128) (187) (148) (173)
Net Secondary Marketing Income 229 288 287 279
Total Net Production Income 107 101 140 107
2012 - Roll-up (basis points)

23
♦ While the mortgage market has typically been very efficient, investors clawing for yield have bid up mortgages in the secondary market. The spread between the 30-year current coupon yield and the average mortgage rate reached 170 bps in September 2012. Today the spread is around 110 bps.
Secondary Market Spreads Are at Historical Highs
30-Year FNMA Current Coupon Yield vs. National Avg. Mortgage Rate
170 bps
Data source: Bloomberg
24
Other Considerations In Entering Mortgage Banking

25
♦ Mortgages are considered in the “pipeline” from the point of application until the loan is either (1) is sold into the secondary market, (2) is put into the originators loan portfolio or (3) “falls out” • A mortgage “falls out” when the customer does not close on the mortgage after being granted a “rate
lock”
♦ Pipeline Risk is a function of potential rate movements between application and closing, and the possibility the loan falling out. • If the loan is being sold into the secondary market, there is also risk that the secondary market yield
will move against the “rate lock” before closing
♦ In order to hedge the interest rate risk, an institution can use several strategies to “lock in” the sale of the loan at prevailing market rates. The institution then either locks the loan and rate in with an investor and commits to deliver the loan if settlement occurs (“Best Efforts”) or commits to deliver the locked loan in a binding (“Mandatory”) delivery program with an investor. • The most common forward delivery tool is the “To Be Announced” market. This is the forward
mortgage backed security pass-through market. • Some mortgage divisions will use futures contracts and over the counter mortgage options as well
Other Mortgage Banking Considerations - Pipeline Risk
26
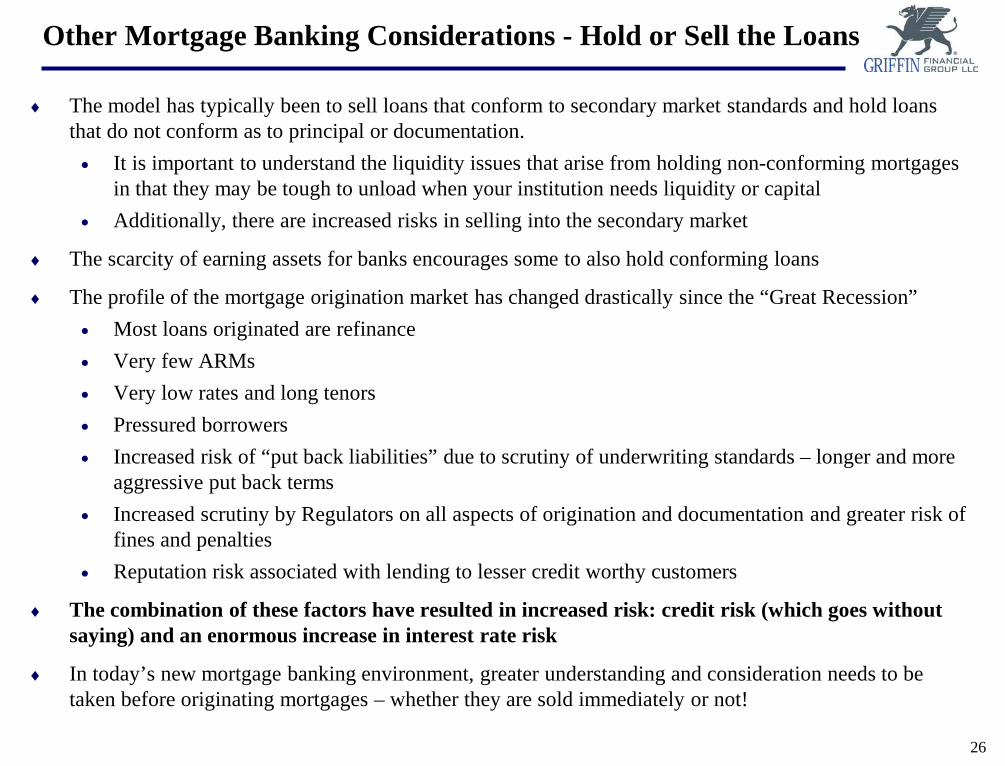
♦ The model has typically been to sell loans that conform to secondary market standards and hold loans that do not conform as to principal or documentation. • It is important to understand the liquidity issues that arise from holding non-conforming mortgages
in that they may be tough to unload when your institution needs liquidity or capital • Additionally, there are increased risks in selling into the secondary market
♦ The scarcity of earning assets for banks encourages some to also hold conforming loans
♦ The profile of the mortgage origination market has changed drastically since the “Great Recession” • Most loans originated are refinance • Very few ARMs • Very low rates and long tenors • Pressured borrowers • Increased risk of “put back liabilities” due to scrutiny of underwriting standards – longer and more
aggressive put back terms • Increased scrutiny by Regulators on all aspects of origination and documentation and greater risk of
fines and penalties • Reputation risk associated with lending to lesser credit worthy customers
♦ The combination of these factors have resulted in increased risk: credit risk (which goes without saying) and an enormous increase in interest rate risk
♦ In today’s new mortgage banking environment, greater understanding and consideration needs to be taken before originating mortgages – whether they are sold immediately or not!
Other Mortgage Banking Considerations - Hold or Sell the Loans
27
Other Mortgage Banking Considerations - Servicing
♦ There is economic value in holding the Mortgage Servicing Rights (MSRs) associated with originated mortgages. The originator can monetize the value of these rights in two ways: • Selling the loans as “servicing released.” This allows for better initial price execution (i.e. you get paid more for
releasing the rights) • Selling the loans “servicing retained.” This allows the originator to collect the fees associated with servicing the
loans
♦ A mortgage servicer earns a percentage of each mortgage payment made by a borrower to a mortgage servicer as compensation for keeping a record of payments, collecting and making escrow payments, passing principal and interest payments along to the noteholder, etc. Servicing fees generally range from 0.25-0.50% of the remaining principal balance of the mortgage each month.
♦ Mortgage servicers also benefit from being able to invest and earn interest on a borrower's escrow payments as they are collected until they are paid out to taxing authorities, insurance companies, etc.
♦ The business of mortgage servicing has also come under the pressure of regulators and legislators. Compliance costs have increased substantially as additional rules and procedures have been put in place to protect consumers.
♦ As a result, many of the larger banks have sold down their MSR portfolios. Most notably, Bank of America has sold a large portion of its MSR portfolio in the past year.

28
Mortgage Banking | Regulatory Actions

29
♦ In many ways, the residential loan market is much different than it used to be. Perhaps the most significant of these changes, especially for those looking to enter the space, is the increase in compliance needed to operate a mortgage banking business. • Since the onset of the “Great Recession”, we have witnessed an increased role in how the
government interacts with banking and mortgage finance: • TARP, TALF, SBLF, etc… • Dodd-Frank • Quantitative Easing (unprecedented in scale and scope) • HARP and HAMP • SAFE Act (licensing of mortgage officers) • GSE reform • Consumer Financial Protection Bureau • Regulation Z
♦ The result is a need for more resources dedicated to compliance, which translates into higher costs.
Compliance
30
Truth in Lending Act, Regulation Z, Dodd Frank and the CFPB
Originator Qualification and Compensation (Regulation Z):
♦ The new rule (generally effective January 10, 2014) prohibits a loan officer or broker from being compensated based on loan terms (other than size)
♦ Prohibits the loan officer or broker from being paid by both the consumer and the lender i.e. dual compensation
♦ Sets uniform standards for qualifying and screening loan originators: • Must meet character, fitness, and financial responsibility reviews; • Must be screened for felony convictions; and, • Required to undertake training to ensure they have the knowledge about the rules governing the
types of loans they originate.
♦ Extends recordkeeping requirements to both the creditors and mortgage brokers for three years
♦ Prohibits mandatory arbitration (effective June 1, 2013)
Regulatory Landscape
Source: Mortgage Bankers Association, Consumer Financial Protection Bureau

31
♦ Qualified Mortgages that have a safe harbor status, are generally lower-priced, prime loans that are given to consumers who are considered to be less risky.
♦ These loans require documentation of the borrower’s ability to repay, but will offer lenders the greatest legal certainty that they are complying with the new Ability-to-Repay rule.
♦ Under the Ability-to-Repay rule, all new mortgages must comply with basic requirements that protect consumers from taking on loans they don’t have the financial means to pay back. • Financial information has to be supplied and verified • A borrower has to have sufficient assets or income to pay back the loan • Teaser rates can not mask the true cost of a mortgage
♦ Two Tests: (1.) P&I equal to or less than 43% of pre-tax income, or (2.) a “Pass Grade” when fed into the automated underwriting engines maintained by Fannie Mae, Freddie Mac or the FHA which test will be eliminated when those agencies come out of bankruptcy. Subject to the government loan ceilings which stand at $417,000 nationally, but rise to as high as $729,750 in high-cost housing markets such as New York, Los Angeles and San Francisco.
♦ CFPB grants the strongest level of legal (creditor rights) protection to loans that carry a prime mortgage rate, or a rate within 1.5 percentage points of the national average
CFPB – Qualified Mortgages
32
Licensing Costs
♦ States have traditionally licensed mortgage companies; however a growing number of states are moving beyond corporate licensing and requiring the licensing of loan officers and even support staff. Additionally, an increasing number of states are adding onerous requirements to existing mortgage company licensing. These new laws and regulations are adding significant costs to mortgage companies, particularly for national and multi-state lenders. In NJ: • Company is required to have a net worth of $50,000 and a surety bond for $150,000 • Control persons are required to undergo federal and state criminal background checks • Individuals must pass a written exam • Individual pre-licensing requirements include approved education courses of 20 or more hours,
including 4 hours of New Jersey specific courses
Employee vs Sub Contractor
♦ Qualification requirements and the complex safe harbor provisions of Regulation Z, along with the state licensing issues, team up to effectively require many brokers to become employees of the originator. This generates a host of legal, tax and administrative issues, that all translate into higher costs.
Fines & Penalties
♦ Fines and penalties assessed to the mortgage industry for poor documentation or practices like robo signing, improper foreclosures and collection practices, liberal loan products, etc. have become more severe and more commonplace
Other Issues
Source: Mortgage Bankers Association, Consumer Financial Protection Bureau, NJ Department of Banking & Insurance

33
Schedule RC-P Analysis

34
♦ Schedule RC-P is to be completed by 1. all banks with $1 billion or more in total assets, and 2. those banks with less than $1 billion in total assets where any of the following (domestic)
residential mortgage banking activities exceeds $10 million for two consecutive quarters for: Closed and Open Ended First and Junior liens 1-4 family residential mortgage loans originations, sales or held for sale or trading.
♦ If the bank is less than $1 billion, complete Sch. RC-P beginning the 2nd quarter in which the $10 million threshold is exceeded and continue schedule through the end of the calendar year. • Open-end mortgages (HELOCs) should be reported using the “total commitment under the lines of
credit”. • Closed end 1-4 family residential mortgages are defined in Schedule RC-C, part 1.c.(2), and Open-
end 1-4 family residential mortgages are defined in Schedule RC-C, part I, item 1.c.(1). And, held for trading are defined in Schedule RC-D and RC, item 5, “Trading assets”.
• Open-end loans Sch. RC-P (1) “total commitment under the lines of credit” means the total amount of the lines of credit granted to customers at the time originated; (2) for originations of such open-end loans, “principal amount funded under the lines of credit” means the total amount at initial funding of newly established lines of credit, and (3) open-end loans purchased, sold, held for sale or trading, and repurchased or indemnified, “principal amount funded under the lines of credit” means the principal balance outstanding of loans at the transaction date or at quarter-end, as appropriate.
Schedule RC-P – Reporting B&T Mortgage Banking Activities
Instruction to complete Call Report Schedule RC-P “1-4 Family Residential Mortgage Banking Activities”: link http://www.ffiec.gov/PDF/FFIEC_forms/FFIEC031_FFIEC041_201203_i.pdf
35
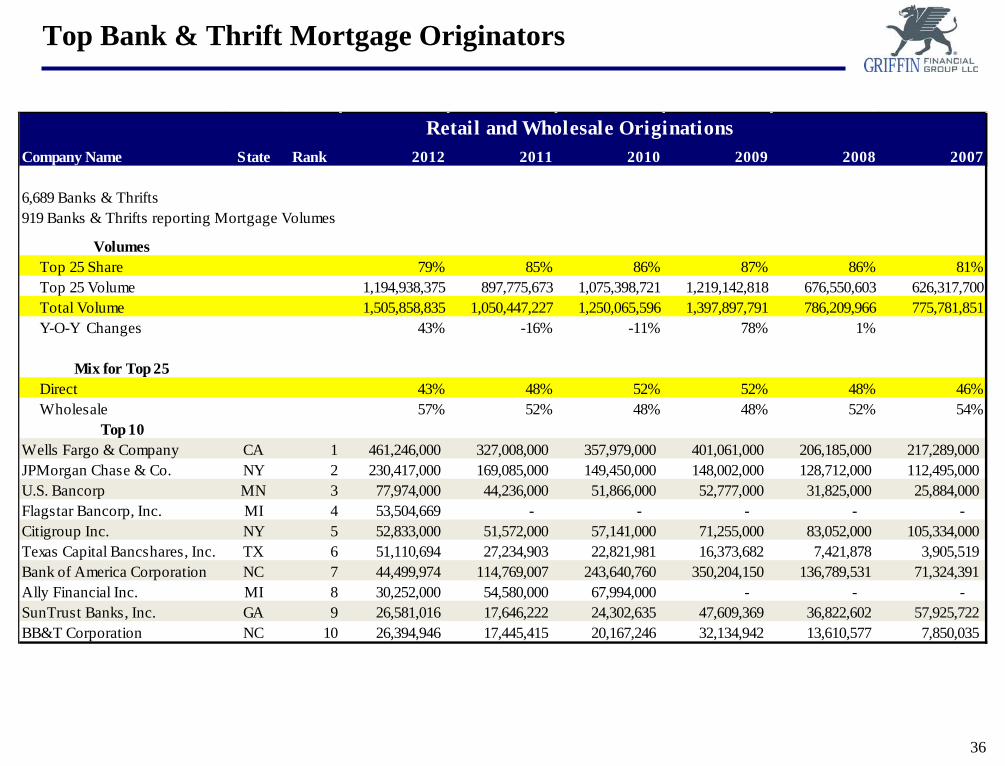
♦ B&T - Retail and Wholesale Originations ♦ The volume of 2012 B&T Originations reached 1.5 trillion a +43% increase over the prior year after declines of
(16%) and (11%) in 2011 and 2010, respectively and a +78% increase in 2009 versus 2008. ♦ 2008 represents the low point. ♦ The Top 25 B&Ts (based on 2012 rankings) Share of Market declined to 79% after topping 87% earlier, and ♦ The Top 25’s mix of Direct versus Wholesale originations declined to 43% and 57%, respectively in 2012, after
having ranged 43 – 52% Direct and 57 – 48% Wholesale, in the past.
♦ Top 25 standings: ♦ Wells Fargo topped the charts every year since 2007 with 2012 originations totaling $461 billion. That’s twice the
volume of its nearest rival JP Morgan. ♦ Bank of American’s volumes continues to decline precipitously. Countrywide’s acquisition was heralded as a
“Milestone”, but continues to be a “Millstone”. ♦ Six Thrifts joined the ranks of the Top 25 as they are now required to file Call Reports and Sch. RC-P:
♦ Flagstar Bancorp, Inc., MI ♦ United Services Automobile Association, TX ♦ Viewpoint Financial Services Group, Inc., TX ♦ EverBank Financial Group, Inc., FL ♦ Union Savings Bank, OH ♦ Silver Queen Financial Services, Inc., CO
Schedule RC-P – Observations
SNL DataSource | Schedule RC-P 1-4 Family Residential Mortgage Banking Activities
36
Top Bank & Thrift Mortgage Originators
Company Name State Rank 2012 2011 2010 2009 2008 2007
6,689 Banks & Thrifts919 Banks & Thrifts reporting Mortgage Volumes
Volumes Top 25 Share 79% 85% 86% 87% 86% 81% Top 25 Volume 1,194,938,375 897,775,673 1,075,398,721 1,219,142,818 676,550,603 626,317,700 Total Volume 1,505,858,835 1,050,447,227 1,250,065,596 1,397,897,791 786,209,966 775,781,851 Y-O-Y Changes 43% -16% -11% 78% 1%
Mix for Top 25 Direct 43% 48% 52% 52% 48% 46% Wholesale 57% 52% 48% 48% 52% 54%
Top 10Wells Fargo & Company CA 1 461,246,000 327,008,000 357,979,000 401,061,000 206,185,000 217,289,000 JPMorgan Chase & Co. NY 2 230,417,000 169,085,000 149,450,000 148,002,000 128,712,000 112,495,000 U.S. Bancorp MN 3 77,974,000 44,236,000 51,866,000 52,777,000 31,825,000 25,884,000 Flagstar Bancorp, Inc. MI 4 53,504,669 - - - - - Citigroup Inc. NY 5 52,833,000 51,572,000 57,141,000 71,255,000 83,052,000 105,334,000 Texas Capital Bancshares, Inc. TX 6 51,110,694 27,234,903 22,821,981 16,373,682 7,421,878 3,905,519 Bank of America Corporation NC 7 44,499,974 114,769,007 243,640,760 350,204,150 136,789,531 71,324,391 Ally Financial Inc. MI 8 30,252,000 54,580,000 67,994,000 - - - SunTrust Banks, Inc. GA 9 26,581,016 17,646,222 24,302,635 47,609,369 36,822,602 57,925,722 BB&T Corporation NC 10 26,394,946 17,445,415 20,167,246 32,134,942 13,610,577 7,850,035
Retail and Wholesale Originations
37
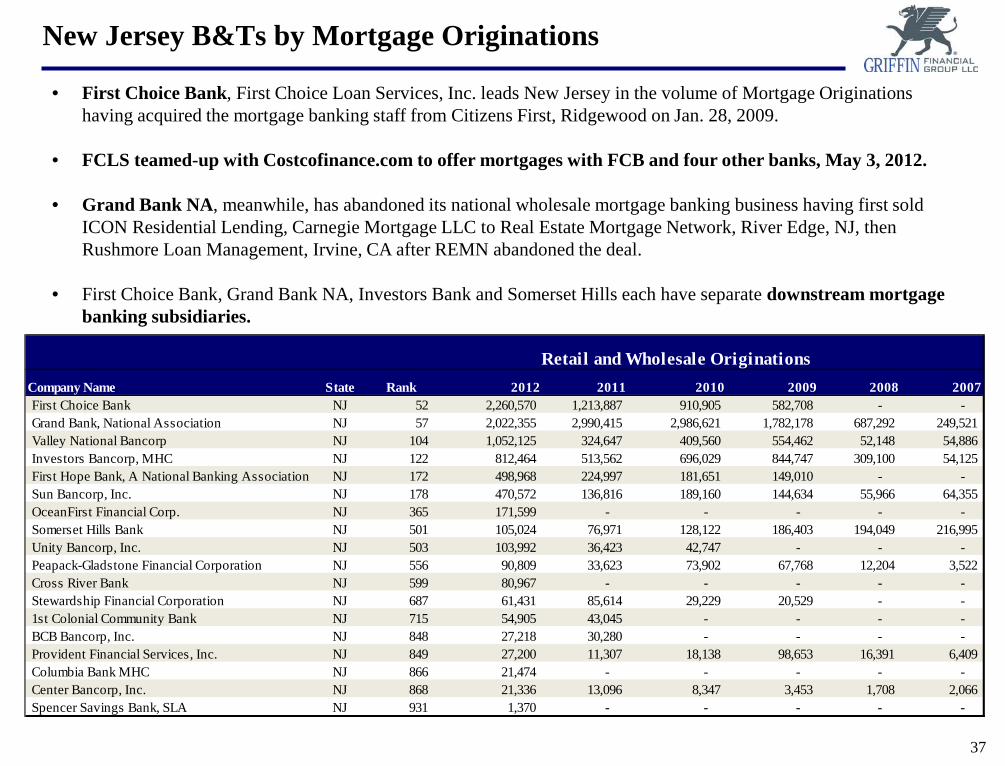
New Jersey B&Ts by Mortgage Originations
• First Choice Bank, First Choice Loan Services, Inc. leads New Jersey in the volume of Mortgage Originations having acquired the mortgage banking staff from Citizens First, Ridgewood on Jan. 28, 2009.
• FCLS teamed-up with Costcofinance.com to offer mortgages with FCB and four other banks, May 3, 2012.
• Grand Bank NA, meanwhile, has abandoned its national wholesale mortgage banking business having first sold ICON Residential Lending, Carnegie Mortgage LLC to Real Estate Mortgage Network, River Edge, NJ, then Rushmore Loan Management, Irvine, CA after REMN abandoned the deal.
• First Choice Bank, Grand Bank NA, Investors Bank and Somerset Hills each have separate downstream mortgage banking subsidiaries.
Company Name State Rank 2012 2011 2010 2009 2008 2007First Choice Bank NJ 52 2,260,570 1,213,887 910,905 582,708 - - Grand Bank, National Association NJ 57 2,022,355 2,990,415 2,986,621 1,782,178 687,292 249,521 Valley National Bancorp NJ 104 1,052,125 324,647 409,560 554,462 52,148 54,886 Investors Bancorp, MHC NJ 122 812,464 513,562 696,029 844,747 309,100 54,125 First Hope Bank, A National Banking Association NJ 172 498,968 224,997 181,651 149,010 - - Sun Bancorp, Inc. NJ 178 470,572 136,816 189,160 144,634 55,966 64,355 OceanFirst Financial Corp. NJ 365 171,599 - - - - - Somerset Hills Bank NJ 501 105,024 76,971 128,122 186,403 194,049 216,995 Unity Bancorp, Inc. NJ 503 103,992 36,423 42,747 - - - Peapack-Gladstone Financial Corporation NJ 556 90,809 33,623 73,902 67,768 12,204 3,522 Cross River Bank NJ 599 80,967 - - - - - Stewardship Financial Corporation NJ 687 61,431 85,614 29,229 20,529 - - 1st Colonial Community Bank NJ 715 54,905 43,045 - - - - BCB Bancorp, Inc. NJ 848 27,218 30,280 - - - - Provident Financial Services, Inc. NJ 849 27,200 11,307 18,138 98,653 16,391 6,409 Columbia Bank MHC NJ 866 21,474 - - - - - Center Bancorp, Inc. NJ 868 21,336 13,096 8,347 3,453 1,708 2,066 Spencer Savings Bank, SLA NJ 931 1,370 - - - - -
Retail and Wholesale Originations
38
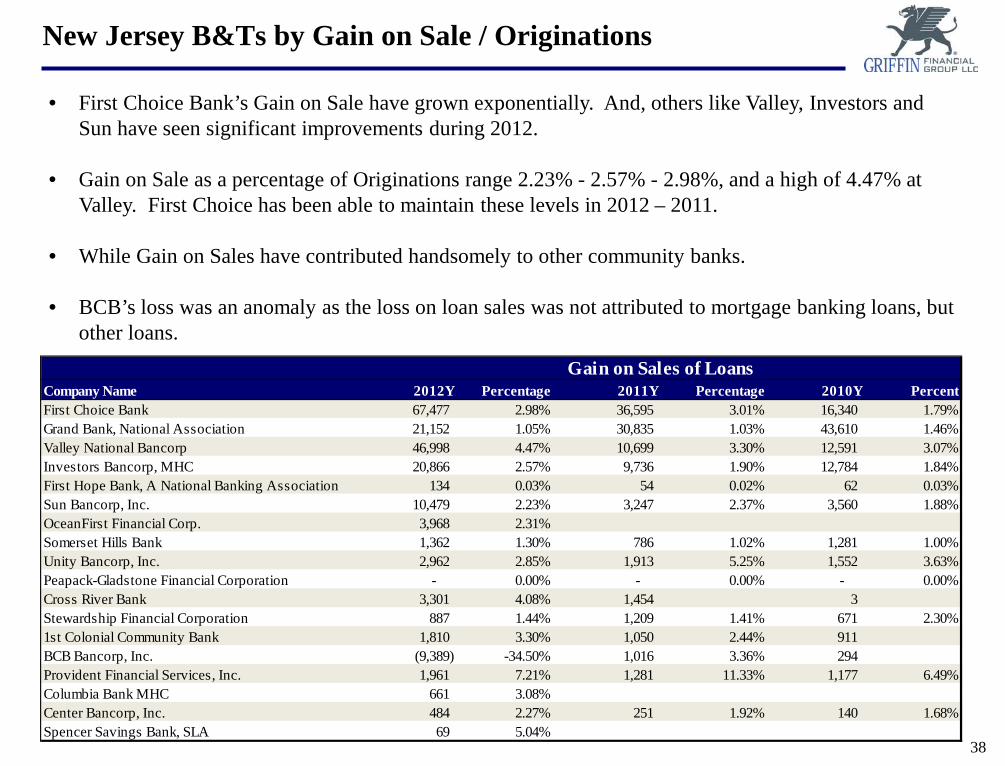
New Jersey B&Ts by Gain on Sale / Originations
• First Choice Bank’s Gain on Sale have grown exponentially. And, others like Valley, Investors and Sun have seen significant improvements during 2012.
• Gain on Sale as a percentage of Originations range 2.23% - 2.57% - 2.98%, and a high of 4.47% at Valley. First Choice has been able to maintain these levels in 2012 – 2011.
• While Gain on Sales have contributed handsomely to other community banks.
• BCB’s loss was an anomaly as the loss on loan sales was not attributed to mortgage banking loans, but other loans.
Company Name 2012Y Percentage 2011Y Percentage 2010Y PercentFirst Choice Bank 67,477 2.98% 36,595 3.01% 16,340 1.79%Grand Bank, National Association 21,152 1.05% 30,835 1.03% 43,610 1.46%Valley National Bancorp 46,998 4.47% 10,699 3.30% 12,591 3.07%Investors Bancorp, MHC 20,866 2.57% 9,736 1.90% 12,784 1.84%First Hope Bank, A National Banking Association 134 0.03% 54 0.02% 62 0.03%Sun Bancorp, Inc. 10,479 2.23% 3,247 2.37% 3,560 1.88%OceanFirst Financial Corp. 3,968 2.31%Somerset Hills Bank 1,362 1.30% 786 1.02% 1,281 1.00%Unity Bancorp, Inc. 2,962 2.85% 1,913 5.25% 1,552 3.63%Peapack-Gladstone Financial Corporation - 0.00% - 0.00% - 0.00%Cross River Bank 3,301 4.08% 1,454 3 Stewardship Financial Corporation 887 1.44% 1,209 1.41% 671 2.30%1st Colonial Community Bank 1,810 3.30% 1,050 2.44% 911 BCB Bancorp, Inc. (9,389) -34.50% 1,016 3.36% 294 Provident Financial Services, Inc. 1,961 7.21% 1,281 11.33% 1,177 6.49%Columbia Bank MHC 661 3.08%Center Bancorp, Inc. 484 2.27% 251 1.92% 140 1.68%Spencer Savings Bank, SLA 69 5.04%
Gain on Sales of Loans

39
Mortgage Banking as a “Lifeline”
• Mortgage Banking revenue has been a “Lifeline” for those having net losses and inadequate capital. • Common Stock pricing metrics have little basis for the under-capitalized B&Ts with losses.
Company Name State Total Assets
($000)Net Income
($000)
Net Gain on Sale of Loans
and Leases ($000)
Net Gain to Absolute Net
IncomeROAA
(% )
Tang Common
Eqty/ Tang Assts (% )
Price/ LTM Earnings Price/ TBV
2012Y 2012Y 2012Y 2012Y 2012Y 2012Y
Public Banks & Thrifts with assets of $5 billion or less, Net Losses or TCE of Less Than 6% Naugatuck Valley Financial Corporation CT 532,743 -9,528 338 3.5% -1.71 13.72 NM 77 First Marblehead Corporation MA 538,222 -38,425 149 0.4% NA 32.12 NM 91 First Mariner Bancorp MD 1,379,349 17,009 48,068 282.6% 1.38 -0.54 1.4 NMCarolina Bank Holdings, Inc. NC 692,093 7,502 13,479 179.7% 1.11 5.53 5.8 98 1st Financial Services Corporation NC 710,431 1,270 3,080 242.5% 0.18 0.45 12.0 89 Uwharrie Capital Corp NC 545,007 404 4,016 994.1% 0.08 5.93 NM 70 Randolph Bank & Trust Company NC 295,553 -146 1,608 1101.4% -0.05 5.76 NM 41 First National Bank of Shelby NC 853,808 -3,414 1 0.0% -0.39 11.19 NM 65 Four Oaks Fincorp, Inc. NC 869,058 -3,747 410 10.9% -0.41 3.00 NM 62 Yadkin Valley Financial Corporation NC 1,923,572 -8,673 1,942 22.4% -0.44 7.30 NM 120 First Bancorp NC 3,246,859 -23,406 2,381 10.2% -0.71 6.81 NM 118 NewBridge Bancorp NC 1,708,707 -25,254 2,636 10.4% -1.47 4.96 NM 116 First South Bancorp, Inc. NC 707,713 -10,977 1,975 18.0% -1.50 10.01 NM 90 FNB United Corp. NC 2,151,564 -40,005 2,035 5.1% -1.75 4.09 NM 188 New Millennium Bank NJ 188,507 -1,665 4 0.2% -0.83 3.09 NA NASun Bancorp, Inc. NJ 3,224,030 -50,491 10,479 20.8% -1.60 6.94 NM 124 Suffolk Bancorp NY 1,622,464 -1,748 1,937 110.8% -0.11 10.06 NM 110 Carver Bancorp, Inc. NY 640,637 -7,174 852 11.9% -1.14 1.61 NM 186 First National Community Bancorp, Inc. PA 968,274 -13,711 858 6.3% -1.35 3.75 NM 170 Royal Bancshares of Pennsylvania, Inc. PA 775,195 -14,600 2,057 14.1% -1.77 3.25 NM 70 Orrstown Financial Services, Inc. PA 1,232,668 -38,454 2,420 6.3% -2.84 7.05 NM 136 First Reliance Bancshares, Inc. SC 419,130 276 1,331 482.2% 0.06 5.49 NM 31 Palmetto Bancshares, Inc. SC 1,145,939 -1,864 -913 -49.0% -0.16 8.58 NM 172 HCSB Financial Corporation SC 472,694 -5,865 375 6.4% -1.12 -4.58 NM NMFirst Federal of South Carolina, FSB (MHC) SC 104,895 -1,703 379 22.3% -1.53 5.45 NM 11 First Security Group, Inc. TN 1,063,555 -37,570 974 2.6% -3.38 -0.38 NM NMFirst Capital Bancorp, Inc. VA 542,949 -6,006 669 11.1% -1.13 7.67 NM 95 Village Bank and Trust Financial Corp. VA 508,154 -10,399 8,562 82.3% -1.97 4.72 NM 87
40
Valuation Considerations
41
♦ Mortgage banking revenues are volatile as the fundamentals change rapidly with interest rates and economic factors: • Interest rates drive refinance activity • The economy, household formations and demand for housing drive purchase activity • Government programs (as we have seen in this last recession) can drive both refinance (HOPE,
HARP, Obama Mortgages – Making Home Affordable) and purchases (loans and equity subsidies, First Time Home Buyer Tax Credits in the Housing and Economic Recovery Act 2008 repayable over 15 years)
♦ As revenues are volatile, institutional investors often look at mortgage banking income differently than income driven by core banking and apply a discount to that earnings stream in determining valuations
♦ Griffin identified banks having mortgage banking revenue as a significant contributor to revenue. Virginia banks appear to have significant mortgage banking businesses among the 10 largest by Net Gains to Assets.
Valuation Considerations

42
♦ While Mortgage Banking may be a significant contributor to the top line its contribution to the bottom line may be muted!
♦ Mortgage banking is less expense efficient than community banking as Non-interest Expense to Total Income ratios for mortgage banking exceeds those of community banks by a wide margin.
♦ Mortgage banking grosses-up both revenue and expenses.
Valuation Considerations – Segment Analysis
Select Segment Reports Summary
Monarch Financial Holdings, Inc BankingMortgage Banking
Net interest income 39,677,512$ 874,720$ Provision expense (4,831,133) - Non-interest income 5,222,612 86,056,021 Non-interest expense (24,168,712) (81,604,729) Pre-tax net income 15,900,279$ 5,326,012$ Non-int. exp. to TOI -54% -94%
Access National Corporation BankingMortgage Banking
Net interest income 30,975,000$ 1,196,000$ Provision expense - - Non-interest income 2,664,000 51,319,000 Non-interest expense (18,909,000) (36,859,000) Pre-tax net income 14,730,000$ 15,656,000$ Non-int. exp. to TOI -56% -70%
Cardinal Financial Corporation BankingMortgage Banking
Net interest income 89,472,000$ 2,365,000$ Provision expense (6,865,000) (285,000) Non-interest income 5,868,000 54,794,000 Non-interest expense (43,495,000) (29,529,000) Pre-tax net income 44,980,000$ 27,345,000$ Non-int. exp. to TOI -46% -52%
2012
2012
2012

43
♦ Community banks having significant mortgage banking operations are valued differently than community banks without mortgage banking revenue:
Valuation Considerations: Banks with Significant MB Revenue
Banks & Thrifts With Significant Mortgage Banking Operations
Price/Earnings Price/
Tangible Book Value
2012 ROAE
Significant Mortgage Banking 8.8x 120% 11.51%
Some Mortgage Banking 13.6x 130% 8.16%
No Mortgage Banking 15.4x 118% 7.99%
Public B&T Between $1 B & $20 B 13.4x 128% 8.13%
SNL U.S. Bank & Thrift Index* 11.8x 147%
Data source: SNL Financial. Population includes public banks & thrifts between $1 billion and $20 billion in total assets “Significant”: mortgage banking loan sales > 25% of total assets “Some”: mortgage banking loan sales > 0 and <25% of total assets * SNL U.S. Bank & Thrift Index is weighted by market cap
44
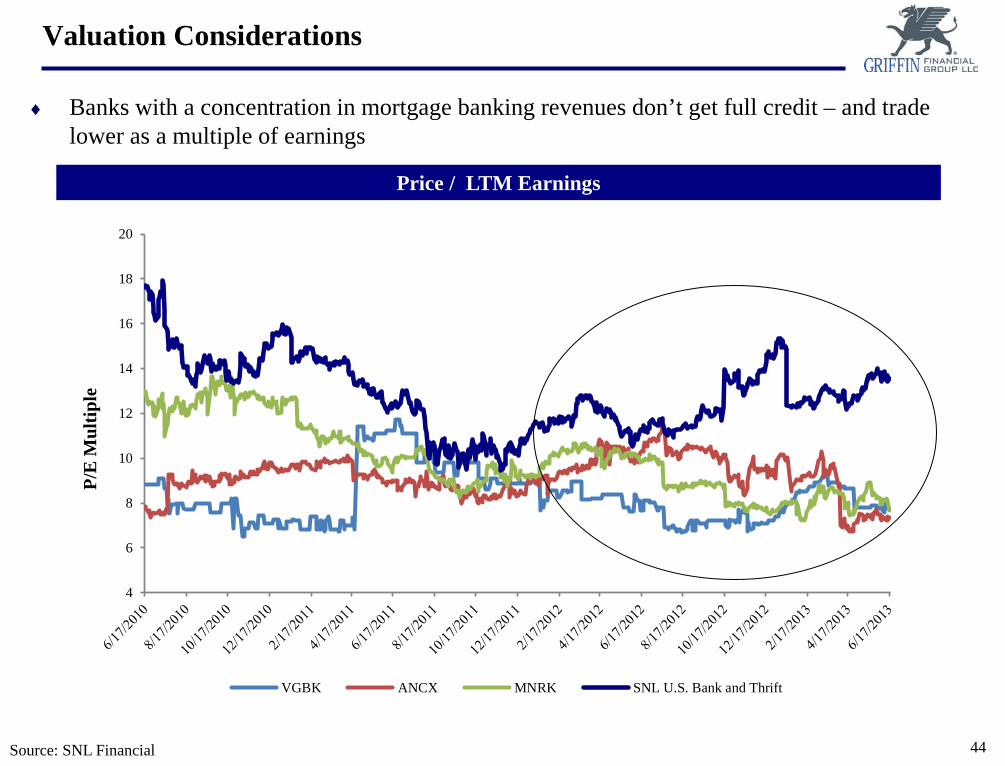
♦ Banks with a concentration in mortgage banking revenues don’t get full credit – and trade lower as a multiple of earnings
Valuation Considerations
Price / LTM Earnings
Source: SNL Financial
4
6
8
10
12
14
16
18
20
VGBK ANCX MNRK SNL U.S. Bank and Thrift
P/E
Mul
tiple
45
Building or Buying a Mortgage Banking Operations

46
Cons
♦ Building will be costly and time consuming. Must hire the right people, sign the right contracts and get the infrastructure in place
♦ It may take a good amount of time to ramp-up the amount of volume needed to cover fixed costs and be profitable
♦ Expertise to manage the business may not be resident in-house, and be costly to acquire
Building Mortgage Banking Business – Pros & Cons
Pros
♦ Entering slowly will allow time for bank management to adjust, building upon existing infrastructure
♦ Many banks have the right community contacts resident within the bank and board: sourcing through local relators, accountants, financial planners and lawyers is key
♦ Small changes in the bank’s business model will meet with a more favorable reaction from the primary regulator
♦ Growth and focus can be more easily controlled and directed
♦ Overall costs can be less, providing it is well planned and executed
♦ Complementary businesses (i.e. title insurance) can be added as the business grows

47
Cons
♦ Risk of overpaying is high, as sellers’ price expectations are very high, despite the uncertainty in the future of originations
♦ Likely will add goodwill and intangibles and be dilutive to tangible book value
♦ Maintaining purchased origination volume generally means that principals and brokers need to be retained and incented
♦ Mortgage banking is a relationship driven business, and purchased relationships are often difficult to maintain
♦ A stock merger as opposed to a purchase could potentially expose the buyer to pre-transaction repurchase or put obligations.
♦ Thorough due diligence is required
Pros
♦ The infrastructure is already built, saving management a great deal of time and effort in hiring people, bidding out contracts, etc.
♦ The mortgage bank will have licenses and a track record with GSEs
♦ A transaction may be accretive to earnings immediately depending upon consideration paid and structure
♦ Immediate revenue enhancement opportunities as you will be able to cross sell the mortgage banking platform to current customers
Buying a Mortgage Banking Business – Pros & Cons

48
♦ Valuing a mortgage bank based on comparable transactions is generally difficult, given that there are few in number, and most transactions involving small mortgage originators are generally: • Not public with little information publicly disclosed • Involve originators with varying business models and concentrations, and distribution channels • Involve constituents with different interests, motivations and varying levels of post transaction
involvement and incentive
♦ However, if a relevant comparable transaction or group can be established, this can serve as a data point.
♦ Using publicly traded companies as an input for value can also be helpful, but also is subject to similar constraints: • Larger mortgage operations have different economies of scale, and often reach different markets for
both originating, acquiring and selling loans • May have other operations such as servicing and wealth management, investment banking, etc. • [Trading] prices exclude any change of control premium associated with a sale of a company
♦ A discounted cash flow model is often the most useful for valuing a mortgage business, and this requires in-depth knowledge of the company, as well as the basis for future expectations for the host of environmental factors that will influence the company’s future performance
♦ Science? No, “Art” at best!
Buying A Mortgage Bank: Valuation

49
♦ Given the prognosis for volatility of future earnings, including a portion of the purchase price as an earn out is prudent.
♦ Earn outs can be tied to future origination volumes, revenues, EBITDA, or other metrics, and sometimes comprise 50% or more of the purchase price.
♦ Typically the principals are critical to continued success, and their continued employment is generally required. Non compete agreements for other key personnel are also commonplace.
♦ Non competes with former owners generate intangible assets that are valued as part of the consideration and amortized over the term. Non competes with employees are compensation expense recorded during the period.
♦ The fair value of the earn out is also part of the purchase price. The estimated value is recorded at the close of the transaction (typically on a probability weighted and discounted basis), with changes in value recorded in earnings over the earn out period. Introduces more earnings volatility than community banking
♦ A “win-win” structure effectively incents the seller to stay and grow the business, while the buyer provides a platform to grow the business better.
Buying A Mortgage Bank: Earn Outs & Incentives

50
Acquisition Studies – Select Mortgage Banking Acquisitions
51
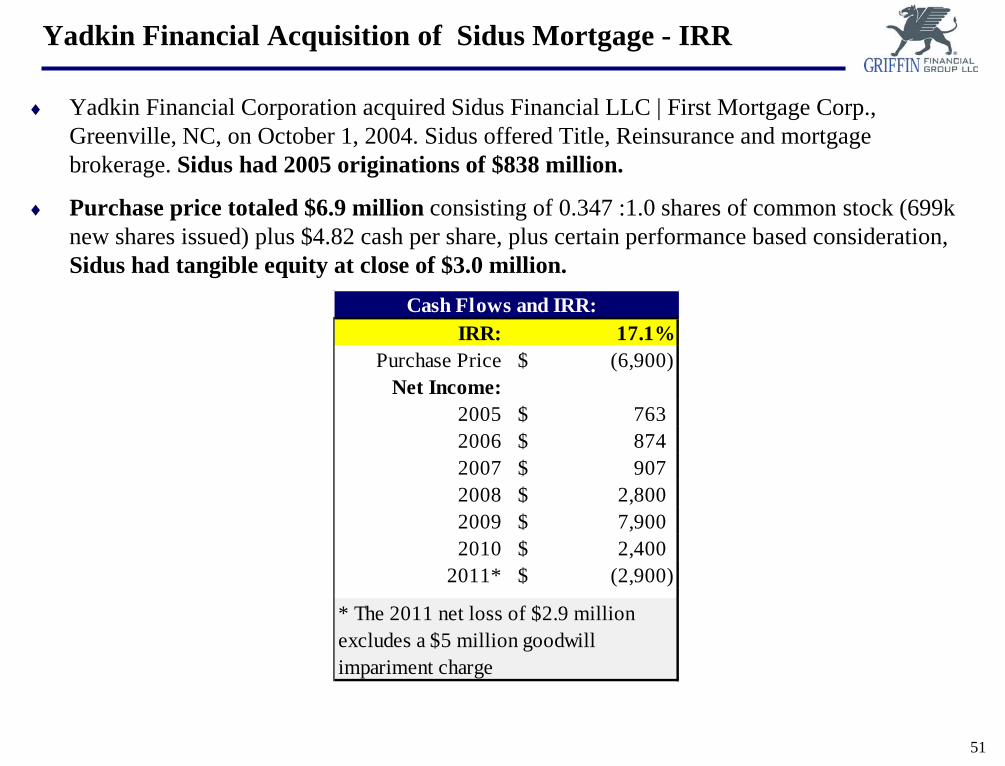
♦ Yadkin Financial Corporation acquired Sidus Financial LLC | First Mortgage Corp., Greenville, NC, on October 1, 2004. Sidus offered Title, Reinsurance and mortgage brokerage. Sidus had 2005 originations of $838 million.
♦ Purchase price totaled $6.9 million consisting of 0.347 :1.0 shares of common stock (699k new shares issued) plus $4.82 cash per share, plus certain performance based consideration, Sidus had tangible equity at close of $3.0 million.
Yadkin Financial Acquisition of Sidus Mortgage - IRR
IRR: 17.1%Purchase Price (6,900)$
Net Income:2005 763$ 2006 874$ 2007 907$ 2008 2,800$ 2009 7,900$ 2010 2,400$
2011* (2,900)$
Cash Flows and IRR:
* The 2011 net loss of $2.9 million excludes a $5 million goodwill impariment charge

52
♦ MVB Financial Corporation ($726 million in assets), Fairmont, West Virginia acquired Potomac Mortgage Group, LLC, Fairfax, Virginia on December 12, 2012
♦ The aggregate purchase price was $19 million ($17 million cash and 83,333 shares of MVB Financial common stock), creating $16.7 million in goodwill
♦ MVB entered into a 5 year (with a 3 year extension term) employment agreement with Pres. & CEO of Potomac that provides for a base salary that is greater than the total compensation of the President & CEO of the MVB • President & CEO of MVB total compensation: $432,703
♦ President of Mortgage Banking subsidiary: • Base Salary: $500,000 • Commissions: Yes • Annual Bonus: 7.5% of PMG’s Pre-tax profits • Performance Bonuses: Bonuses based on pretax earnings exceeding certain thresholds • Options: 5,000 options vesting over 5-years • Severance w/o cause: 18-months of gross compensation
MVB Financial’s Acquisition of Potomac

53
♦ Origination volumes are expected to fall from currents highs
♦ Secondary market spreads and overall profitability will likely fall from current highs
♦ Valuations on this kind of business line are subject to discounts due to volatility of earnings
♦ Mortgage banking can provide a bank with meaningful tangible book value creation; however, consider limiting mortgage banking operations in order to control earnings volatility and potential negative impact on valuation
♦ Building or buying a mortgage bank requires thoughtfulness around strategy, structure and cultural dynamics that result from this kind of business
Summary of Thoughts

54
♦ The Halcyon Days of Banking are OVER!
♦ Structural, cyclical, legal and regulatory developments threaten small banks.
♦ Core portfolio lending businesses have been eviscerated by: • the lending market’s evolution to securitization, and • the emergence and now resurrection of “Shadow Banks”.
♦ Monetary Policies have led to: • artificially low interest rates, • low net interest income, and • low net income, as demand for credit remains muted.
♦ Fiscal stimulus policies are not sustainable, and the “Aging of America” will redirect spending to the care of our Senior Citizens.
♦ Mortgage lending has been an especially prosperous business for those able to capture the refinance business that appears to have crested.
♦ New Jersey, Pennsylvania and New York’s mortgage market is vast, notwithstanding the mortgage market’s ebbs and flows.
♦ New Jersey’s “Judicial Review Logjam” and backlog of foreclosure inventory should soon free homes for sale and create a period of purchase mortgage lending opportunities.
♦ Banks that are deeply invested in residential mortgage lending already have expressed a desire to ramp-up their residential and commercial multi-family mortgage banking activities.
Call To Action

55
♦ Building a mortgage banking operation may be preferable to Buying a mortgage banking operation.
♦ The Commitment to Mortgage Banking as a Profit Center • The “Minimum commitment to mortgage banking as a ‘profit center or business line’ should be 5 –
6 mortgage brokers producing $10 million or more a month, or $120 – $250 million of annual production for mandatory delivery. Otherwise mortgages are just a “product and not a profit center”.
Call To Action

56

57
• 30 years of investment banking and commercial banking experience with niche, major and regional investment banks, broker dealers and banks
• Experience includes senior responsibility for 45 mergers and acquisitions and 25 securities offerings, including bank and insurance companies’ mutual-to-stock conversions
• Professional experience includes tenures with bank boutiques Keefe, Bruyette & Woods, Inc. and Alex Sheshunoff & Co., Inc.; major and regional securities firms Kidder, Peabody & Co., Inc., The First Boston Corporation and Advest, Inc.; and niche firm of McColl Partners LLC
• Former Corporate Finance Director of a multi-billion dollar community bank
Richard Vader
Senior Managing Director Financial Institutions Group Griffin Financial Group LLC 620 Freedom Business Center King of Prussia, PA 19406 Phone: 484.663.1936 Email: [email protected]

58
This presentation is not considered complete without the accompanying oral presentation made by Griffin Financial Group (“Griffin”).
Any projections or recommendations contained herein involve many assumptions regarding trends, company-specific operating characteristics, financial market perceptions and the general state of the economy as well as internal factors within management control, such as capital investment. As such, any projections contained herein represent only one of an infinite number of outcomes and should not be construed as the only possible outcome.
The information contained in this presentation and attached exhibits have been obtained from sources that are believed to be reliable. Griffin makes no representations or warranties as to the accuracy or completeness of the information herein.
All terms and conditions contained herein are based upon current market conditions and are estimates based upon prevailing market rates. Any or all estimates may or may not change as market conditions dictate. As such, any or all terms and conditions presented herein are preliminary in nature and should not be construed, either in whole or in part, as a commitment to perform or provide any specific services. Any and all services that may be provided by Griffin or any other entity referred to in this discussion outline will be contingent upon the signing of a proposal or contract.
Griffin Financial Group, Inc. does not provide legal, tax or accounting advice. Any statement contained in this communication (including any attachments) concerning U.S. tax matters was not intended or written to be used, and cannot be used, for the purpose of avoiding penalties under the Internal Revenue Code, and was written to support the promotion or marketing of the transaction(s) or matter(s) addressed. Clients of Griffin Financial Group, Inc. should obtain their own independent tax and legal advice based on their particular circumstances.
Disclosure Statement