new guinea research unit bulletin number 6 the european
TRANSCRIPT

New Guinea Research Unit Bulletin
Number 6
THE EUROPEAN LAND SETTLEMENT SCHEME
A T POPONDETTA
D . R . HOWLETT
April 1 9 6 5
Published by the New Guinea Research Unit , Australian National University, G.P. O. Box4, Canberra , A . C. T . and P . O. Box419 , Port Moresby, Papua-New Guinea


A UST RA LIAN NATIONAL UNIVERSITY
Research School of Pacifi c Studies
New Guinea Re search Unit Committee
Profes sor Sir John C rawford, Chairman, Director of the School
Professor J. W. Davidson, Department of History and Government
Dr . H. C . Brookfield, Department of Geography
Dr. Paula Brown, Department of Anthropology and Sociology
Mr. E. K. Fisk, Department of Economi c s
Dr. D. G . Bettison, N e w Guinea Research Unit
April 1 9 6 5
Editor, New Guinea Re search Unit Bulletin
D. G. Bettison


CONTENTS
Preface
Origins of the Scheme . . . . . . . . . . . . . . . . . . . . . . . . . . . .
The Physical Setting . . . . . . . . • . . . . . . . . . . . . • . . . . . . .
The Plantation Survey . . . . . . . . . . . . . . . . . . . . . . . . . . .
Land Use . . . . . . . . . . . . . . . . . . . . . . . . . . . . . . . . . . . . . . .
Labour . . . . . . . . . . . . . . . . . . . . . . . . . . . . . . . . . . . . . . . . .
Proces sing and Marketing
Capital . . . . . . . . . . . . . . . . . . . . . . . . . . . . . . . . . . . . . . . . .
Rac e Relations . . . . . . . . . . . . . . . . . . . . . . . . . . . . . . . . . .
Some Conclusions . . . . . . . . . . . . . . . . . . . . . . . . . . . . . . .
Appendix . . . . . . . . . . . . . . . . . . . . . . . . . . . . . . . . . . . . . . .
Bibliography . . . . . . . . . . . . . . . . . . . . . . . . . . . . . . . . . . . .
Maps . . . . . . . . . . . . . . . . . . . . . . . . . . . . . . . . . . . . . . . . . .
(i)
Page
1
2
9
1 3
1 6
2 8
43
46
5 3
5 6
6 0
7 3
74


List of Table s
Table No . De s cription
1 A rea, ownership, management and c rop on European plantations in the Popondetta area
2 Land use, 2 0 plantations, 1 9 6 2
3 Land use, 2 0 plantations, 1 9 64
4 Production, actual and potential - 2 0 plantations
5 Programme of land development under cocoa by year of operation
6 Anticipated maximum area of c ocoa when plantation fully developed
7 Labour employed on 2 0 plantations (by plac e of origin and oc cupation) 1 9 6 2
8 Labour employed on 2 0 plantations (by place of origin and oc cupation) 1 9 6 4
9 Labour employed on 2 0 plantations (by plac e of origin and basis of employ ment) 1 9 6 2
1 0 Labour employed on 2 0 plantations (by plac e of origin and basis of employment) 1 9 6 4
11 Casual labour employed on 2 0 plantations (by length of e mployment) 1 9 6 2
1 2 Casual labour employed on 2 0 plantations (by length of employment) 1 9 6 4
(ii )
1 4
1 7
1 8
2 1
2 5
2 7
2 9
3 0
3 3
3 3
3 6
3 6


Table No. Des cription
1 3 Husbandry practices and labour requirenients, 1 9 6 2
1 4 Labourers p e r 1 00 a c r e s of planted cocoa, 1 9 6 2
1 5 Rank order o f labourers eniployed -per 1 00 acres cocoa
1 6 Europeans: 2 0 saniple plantations, 1 9 6 2
1 7 Suniniary o f developniental costs for sole cocoa ( froni the Henderson and B. A. E. reports)
1 8 C apitali sation o f 2 0 plantations
( iii )
3 7
3 9
40
44
47
48


PREFACE
I wish to make grateful acknowledgement to the New Guinea Re search Unit for its assistance in making this research possibl e . I was a Re search A s si stant with the Unit for six months in 1 9 62 , when the initial survey was conducted, and was given a further grant in 1 9 6 4 to continue the earlier work.
I should also like to expr e s s my appre ciation to thos e who read drafts of the paper and contributed much valuable advice and c riticism, in particular to Dr. D. G. B ettis on for his editorial assistance.
1
D. R. Howlett
D epartment of Geography Unive rsity of Sydney

Origins of the Scheme
The re search fo r this paper was unde rtaken as part of a b road programme of land tenure research b eing c onducted by the New Guinea Re search Unit . The aim of the re search programme i s to make detailed studies of selected areas where different forms of land tenure exist, to see which system is
(a) mo st c onducive to maximum productivity per acre, per man, and per unit of capital ;
(b) be st suited to the introduction of new techniques of production;
( c ) best adapted to the e merging patterns of social and work organisation; and
( d) which factors influence indigenous people in deter mining the acceptability or otherwi s e of the various s cheme s or the decision to modify their existing patterns of land tenure and work organi sation on their own land. ( 1 )
The Orokaiva area of the Northern District was s elected for the initial studie s because o f the atte mpts at cash cropping there under a variety of land tenure systems . The se include the government - financed Ex-Service men ' s C redit Scheme ( for both Papuans and Europeans) , the Higaturu C ouncil Land Re gistration Scheme, the Yega proj ect, communal plantations, and traditional tenure forms. This pape r deals with one of thes e experiments, the European sector of the ExS e rvice men ' s C redit Sche me, which is the first of its kind in Papua. Comparison with other tenure systems in the area must await completion of other studi e s which are now in progre s s . Until the trees or the Scheme ' s plantations come into full production (about 1 9 6 6 - 7 ) it will not be pos sible to reach final c onclusions about the adequacy of the loan to s ettlers in te rms of the local environment, labour availability and other factors . This paper, then, s ets out to trace the o ri gin and
( 1) Crocombe, 1962: 1 .
2

development of the Scheme to date and to make information available on management and development practices.
Before discussing this particular Scheme, the following brief comments are offered on the plantation industry of the Territory which is controlled by non -indigenous owners . ( 1 ) It seems that the pattern of development which followed the first world war is being repeated after the second . During the mid - 1 92 0s propertie s expropriated from the Ger mans in New Guinea were offered for sale (largely freehold) . (2 ) During the economic depre ssion of the 1 93 0 s many of the plantations owned by individuals were acquired by companies . The de cade of the 1 9 3 0s thus be came characterised by a plan tation economy which was largely c ompany -owned and manager -operate d, generally at a low level of efficiency and production . ( 3 )
The main plantation crop in New Guinea was copra and in Papua rubber, and the industry was beset by instability due to widely fluctuating prices and high turnover in mana gerial staff . Profits, such as they were, went largely overs eas, mainly to Australia, and perhaps becaus e plantation managers were not usually involved in a personal sense in development, relations with labour tended to be poor and there was little incentive to realise maximum production potential . Agricultural extension services virtually were non -existent and financ e for plantation development by individuals was not readily available .
After the s econd world war new areas of land were
(1) Mainly European (including Australian) and Chinese .
(2) Sale of Expropriated Territories . . • • , 1925, p. 19. This publication also specifies that intending purchasers must be either Australian soldiers who are natural-born British subjects, or companies with at least two-thirds of the shares held by natural-born British subjects (p. 2 1 ).
(3) It is not possible to support the statement about low levels of efficiency and production with references, as there is virtually no published material available on the pre-war plantation industry; however, the assumption would appear "to be valid in that current expectation of yields, labour productivity , etc. is considerably higher than it was even in the mid- 1950s.
3

again made available for leasing as agricultural holdings, not, this time, as a result of expropriation, but due to the extension of Admini strative control into recently discovered areas, particularly the Highlands . New crops such as cocoa and coffee were planted on a much greate r scale . And the trend toward individually - owned and operated plantations reappeared be cause many e x - s e rvicemen who had been in Papua -New Guinea during the war were attracted to return . This trend probably reached its peak by about 1 9 54, by which time a c on siderable area of land had been leased to individual expatriate s .
By about 1 9 5 6 - 7 many of the planters who had come to the country in the postwar period were in financial difficulty . Some of the main aggravating factors were in sufficient capital, the length of time (usually several years ) before a return on inve stment could be reali sed from plantation production, fluctuating prices and uncertain markets in the face of competition from other countries with establishe d marketing agreements, and rising costs of labour . For example, a survey of the cocoa industry in the Territory by Bureau of Agricultural Economics in 1 9 5 7-8 c ommented
. . . individual s ettlers opening up new areas may fac e a formidable task . This is a feature o f plantation c rops, where the capital investment is relatively hi gh and worthwhile returns are not immediately forthcoming . . . Bankers in the Territo ry indicated that the re was little recent demand for bank finance in plantation development . This has been due in part to the gene ral availability of funds for investment in existing plantations and in company enterpris e s , but als o to the inability of individuals to borrow from banks unl e s s they had already e stablished a substantial equity in their new plantations. It is likely that an increasing number of individual planters on new s ole cocoa plantations will require bank finance in the next few years to complete the development already unde r way. ( 1 )
Thi s statement applied equally at that time to c offee planta tions in the Highlands .
( 1 ) Department of Territories, 1958: 26-7.
4

Once again, a number of planters had been forced to sell their properties after only a few years, often to companies formed in Australia . This was an unwelcome step for the Territory 's e conomy, both in terms of the outflow of profits from the country, and of production rates, which are invariably lower under c ompany management . It was es pecially unwelcome as the problem of e conomic development in the Territory was becoming crucial : government financ e was inadequate t o meet increased demands for health, educa tion, transport and other services, and the growing realisation that political independence would be sought much sooner than most people had hitherto thought, lent urgency to the goal of economi c viability.
The government 's obligations to protect the in terests and foster the welfare of the European community of Papua-New Guinea have been no less firmly stated than have those towards the indigenous peopl e . Government policy and planning has accepted expatriate enterprise as a nec essity for the development and progress of the Territory. Furthermore, most Europeans enj oy a higher e conomic and social status in Papua -New Guinea than they would in Australia and thus far the Administration has seemed to be anxious to preserve this status, and to prevent the e mergence of any white group with incomes below the levels accepted by Australians in the Territory.
By 1 9 58 , therefore, it see ms to have appeared necessary to the government to take direct action on behalf of the expatriate planters, not only to assist those whose properties were in financial difficulty but also to stimulate further the production of export crops by making land and capital available to attract more settler -produc ers. It is against this background of e conomic, social and political(!) issues that the Minister for Territories announced in 1 9 5 8 the intro duction of a scheme to provide land and credit to ex-servicemen . Coming as it did thirteen years after the end of the war, the scheme appears to have been primarily a means of
( 1 ) The Returned Servicemen's League both in the Territory and in Australia was influential; one informant stated that R. S. L. pressure was the most important single factor that led to the introduction of the Scheme.
5

extending aid to expatriates, but, having made such prov1s1on in the name of ex - s ervicemen, the scheme had of neces sity to provide s ome assi stance for Papuan ex-s ervicemen as well as European ex - s ervicemen. ( 1 )
Early in 1 9 58 Brookfield, discus sing the prospects for European development in the Territory, commented that :
Mention should perhaps be made of various proposals to establish European small -farmer settlers, particu larly "Soldier Settlers " at various places in New Guinea . . . . C ost alone ha s dis credited such s cheme s; e stablishment and initial maintenance of each s ettler would cost the Australian taxpayer tens of thousands of pounds per head . ( 2 )
Several months later, however, in May 1 9 5 8 , Mr . Hasluck announced in a pre s s release that such a s cheme would be introduced:
The s c he me will enable credit to be made available to ex - servicemen settlers who are already occupying agricultural land holdings in the Territory, or who ob tain agricultural land holdings through the normal method of application for land advertised as available for leasing . . . Loans may be made to qualified eligible ex - s ervic emen for the purpos e of providing working capital, paying for and effecting improvements, equipping stock, plant and equipment, and dis charging any mortgage s, charge, bill of sale or other encumbrance on the property .
The legi slation was effe cted in October 1 9 5 8 when the Ex Servicemen ' s Credit Ordinance was gazetted . A Credit Board was set up and applications invited for loans . The maximum amount of credit available to any person ( in practi c e only to Europeans ) was £ 2 5 , OOO, to be repaid over a maximum period of 2 5 years at 3 3/4% interest . This, together with the cost of providing surveys , roads, s chools and the like for the new
( 1 ) See Papua-New Guinea Agricultural Journal, Vol. 15 , Nos. 3-4 (articles by R.J. Cheetham) for studies concerning the Papuan ex-servicemen.
(2) Brookfield , H. C. in Wilkes, ed. , 1 958:23.
6

settle rs would indeed, as Brookfield predicted, involve the Australian taxpayers in tens of thousands of pounds, but for the reasons discussed above the financial burden was apparently outweighed by considerations which the government felt to be more important .
The amount of the loan in each individual case was to be determined on the crite rion of the capital nece ssary for development to "home maintenance area " . This concept is defined in the Ordinance as follows:
An area developed to a stage of production, bas ed on suitable land us e, which, on average yields and prices would, in the opinion of the Board, in each particular cas e be sufficient to provide a reasonable living for a borrowe r after meeting such financial commitments as would be incu rred by a pe rson pos s e ssing no capital.
The fundamental concept dete rmining siz e of loan was that of "a reasonable living for the borrower ", but the Board has never stated publicly what level of income it con siders to be reasonable . ( 1) In the matte r of land subdivision and determination of optimum area, conside ration was given to the nece s sity of plantation income to provide a "reasonable living " plus funds for the amorti sation of capital invested . ( 2 ) For the Northern District settle rs this area was dete rmined as 4 0 0 - 5 00 acres on the following premises: one European should be able to manage efficiently 1 00 laboure rs, who are sufficient to develop 3 00 acre s of cocoa; in addition, s ome 5 0
( 1 ) Though it obviously considers a " reasonable living" to be many times higher for Europeans than for Papuans.
(2) Optimum area size varies somewhat according to locality, soil fertility , etc. , and is usually expressed in terms of arable land suitable for a specific crop, thus:
Cocoa: 200-250 acres arable land Coffee: Coconuts: Rubber:
100 600 200
II
II
II
II
II
II
II
II
11 (for high-yielding clonal seed) . Often there is not a great difference between minimum and optimum areas. An area of land containing less than two optimum areas generally was made available for leasing in toto, but if land could be conveniently subdivided into two or more optimum areas this was done .
7

a c res or more were included as a "servic e area" for buildings, gardens, rec reation, road development, and whatever un utilisable land must be included to fulfil the s e requirements .
To be eligible for a loan, the applicant was re -quired to have served a ce rtain length of time in either the second world war, or the Malayan or Korean operations ; to have spent a specified period of re sidenc e in the Territory;O> and to have "a knowledge and expe rience of agriculture suf ficient to enable him to engage suc ces sfully in agriculture in the Territory ". Although not expressly stated in the Or dinance, it was stres sed in pre ss statements that
The experienc e of an applicant in tropical agriculture and management of native labour will be carefully considered by the Clas sification Committee . . .
( 2 )
The basic condition of the loan was that the pe rson in receipt of it
. . . shall reside on and devote his full time to the management of the property the subj ect of the loan, unless the Board in any particular case othe rwise approve s .
By April, 1 9 5 9 , several months after the legisla tion to provide c redit had been anacted, loans totalling nearly £ 1 8 0 , OOO had been approved and a numbe r of furthe r applica tions were being considered . ( 3 ) Many of thes e initial loans were in the form of assistance to plantations already being developed, and were the refore less than the maximum amount of £ 2 5 , OOO per individual, though in the No rthe rn District almost all the early loans to Europeans w e re for the full amount . In November 1 9 6 2 it was announced that nearly £ 3 , OOO, OOO had been made available for agricultural development when the s cheme closed in the beginning of that month . ( 4 )
( 1 ) The residential qualification required an applicant to have resided in Papua-New Guinea for at least five years prior to, but not necessarily immediately prior to, the commencement of the Scheme.
(2) By the Minister on 25. 5 . 58 and by the Administrator on 1 1 . 1 1 . 58.
(3) Though not all of these were for settlers in the Northern District.
(4) South Pacific Post, 9. 1 1 . 62.
8

By August 1964, a s pokesman for the Credit Board stated that 1 3 1 loans, totalling £ 1 1 2 , 5 5 0, had been made to Papuans and New Guineans and 1 4 1 loans, totalling £3 , 1 2 0, OOO, had been made to Europeans . ( 1 )
In April 1 9 5 9 twenty blocks of land suitable for cocoa, coconuts, rubber and lowlands coffee (Robusta) were advertis ed as being available for lease (in practice to Euro peans only) in the Popondetta area . ( 2 ) This land in the Popondetta area repres ents one of the greatest concentrations of new agricultural development in the country . Some appli cants for a loan in other parts of the c ountry had been rejected be cause the size or potential of their existing propertie s did not warrant the capitalisation they had propos ed; and it was suggested that they might consider the opportunity to develop a new block with better economi c prospe cts, such as tho se adverti s ed in the Popondetta district. ( 3 )
The Physical Setting
The Popondetta plains are among the most fertile regions in the Territory. A gently -graded plain composed of re cent alluvial and volcanic materials extends from the piedmonts of Mount Lamington and the Hydrographer Range
( 1 ) By District, the allocation o f blocks to mid- 1964 was as follows: District European Pa11uan/New Guinean
Central 1 9 2 Gulf 1 Milne Bay 4 Northern 29 78 Bougainville 6 Eastern Highlands 20 Madang 2 1 Mo robe 1 8 1 8 New Britain 2 7 1 5 New Ireland 6 1 Sepik 15 Western Highlands 10
(2) Land was also advertised in other parts of the Territory, notably the Warangoi Valley in New Britain.
(3) Several of the European settlers now in the Popondetta area acted on this suggestion and disposed of uneconomic blocks which they had been working elsewhere.
9

northwards , the soft unconsolidated sediments s cored by streams and rive rs. The areas which contain the greate st concentration of plantations are desc ribed by the CSIRO team which surveyed the area in 1 9 5 3 as consisting of piedmont te rraces, dis sected volcanic plains and volcanic outwash plains, ranging in altitude from about 1 00 to 1400 feet above sea level . ( 1 ) A characte ristic of the rive rs here, which de rive largely from Mount Lamington, is their liability to flash flooding after rains; although they rarely rise beyond bankfall stage, unpredictable rises in level in unbridged rive rs is a hindrance to local travel .
For the most part the Popondetta piedmonts and plains are cove red by dense tropical rain forest vegetation with the usual complexity of specie s . Much of it is still vi rgin bush, (2 ) interspersed with s mall areas under current cultivation or re growth ve getation . Towards the coast, how ever, there are large swampy areas and a c ons equent ve geta tional change: discontinuous strips of grassland, in which Saccharum spontaneum and lmpe rata cylindrica are typical, are increasingly found inte rspe rsed w ith the forest and gras sland .
The climate i s characte rised by heavy rainfall, uniformly high temperatures and hi gh humidity . Meteoro logical data is scarce and for the short -te rm, but rainfall data colle cted from a number of plantations as well as for Popon detta sugge st that ove r an area extending about fifteen mile s inland from the coast the rainfall i s about 1 0 0 inche s annually, with heavier falls between the months of October to March than in the rest of the year, although the re is no real dry season . In the drier months, roughly April to Octobe r, southeast winds are dominant; in the wette r months the winds are mainly northwest. Furthe r inland across the foothill s there is a marked inc rease in rainfall to almost 2 00 inche s annually, and it is even le ss distinctly s easonal in nature. A factor of some importance for agriculture is the rainfall
( 1 ) "Lands of the Buna-Kokoda Area", CSIRO Land Research Series 10, Melbourne 1964.
(2) i. e . , at least not used within the memory of the local inhabitants.
1 0

variability, particularly from month to month, but occasionally fo r periods of several months togethe r . For example, the rainfall during the 1 9 6 3 - 4 "wet" s eason was well below ex pectation and most plante rs claimed to have suffe red los s of production as a result .
Tempe rature s are mainly within the range 7 0 - 9 0 de grees F . , with the season of northwe st winds being slightly hotter . The high temperature s and high humidity make for an enervating climate, although nights are usually comfortably cool, and minimum temperatures seem to be influenced by comparatively slight increases in altitude .
On the whole, the combination of soils and te rrain, rainfall and temperature, make this area eminently suitable for the production of tropical comme rcial crops . The CSIRO Repo rt states that there are no major (environmental) limita tions to plant growth for the greater part of the year in this area, and that some characte ri stics of the climate, such as cloud cover, are indeed beneficial to tree c rops such as coffee and cocoa, which are grown under partial shade . ( 1 )
And, in contrast to some othe r acces sible fertile areas of the Territory, the Northern District i s not dens ely populated, and the re was a conside rable area of C rown Land available for plantation development . (2 )
Although there seems to have been no s pecifi c direction to the soldier settlers to plant cocoa rathe r than one or a combination of the othe r tropi cal plantation crops fo r which the district i s suitable, most of the s ettlers planted cocoa. So far as environmental conditions are conc e rned, the land around Popondetta appears equally suitable for cocoa, rubbe r or Robusta coffee, although less favourable for copra
( 1 ) CSIRO Land Research Series No. 10:52.
(2) Up to 1959 the Administration had acquired about 65, OOO acres of land in the Popondetta sub-district, although a considerable part of this was grassland for a kenaf scheme which failed. But there were 33 , OOO acres of timber land at Sangara near Popondetta .
1 1

production than areas neare r the coast . But s everal non environmental factors were responsible for the choic e of cocoa as the first c rop in the district. A major problem for pro ducers of tropical c rops i s the que stion of markets, and cocoa was at that time (19 5 8 - 9 ) considered to be the most promising crop. The marketing of coffee from the Te rritory at the end of the 19 5 0s was proving difficult, and a quantity of coffee remaine d un sold at the end of each season, although a market ing agreement has subsequently been negotiated which has relieved the position . (1) The Territory also has an arrange ment with Australia to market its rubber production(2 ) but even so, production of these c rops cannot greatly exceed the amount which Australia can comfo rtably absorb . Apart from the persistent threat of competition from synthetics to the rubber industry, rubber has the further disadvantages , a s against coc oa, that i t is more expensive to establish, (3) that tapping doe s not commence until the fifth year and trees do not reach full maturity until the tenth year, that a highe r order of skill is required of the labour force and that more extensive processing on the plantation is necess ary befo re it can be marketed .
( 1 ) S ince August 196 1 , a s a result of negotiation between coffee producers, coffee buying agencies in Australia , the Administration of Papua-New Guine a , and the Australian Departments ofTrade and Territories, the arrangement has been that agents purchasing 28% of their coffee requirements from Territory production may import the balance of their requirements duty-free. This percentage was adopted because the Territory currently produces about 30% of Australia's coffee requirements. How long this arrangement will continue to be satisfactory to producers is in question; coffee production from Papua-New Guinea is increasing rapidly each year as native plantings come into bearing. No import duty is imposed on Territory coffee on the Australian market; on coffee from all other areas the duty is 3d. per pound.
(2) Australian manufacturers receive all rubber produced in the Territory in return for an import tax reduction thus allowable on rubber imports from other countries. All marketing is handled by the Papuan Rubber Pool. Australian representatives arrange sales of all shipments to the various manufacturers.
(3) One informant suggested that at least £40, OOO would be needed to establish a minimum area of 350 acres under rubber.
12

The Plantation Survey
A survey of selected European plantations in the district was conducted during June -July 1 9 62, and the same plantations were revisited briefly during May 1 9 6 4 . Table 1 lists all the plantations in Popondetta sub -district giving area, type of own ership and management, main crop or crops produced, and year of occupation . Of the plantations operated by individual owners, the table s eparates those which rec eive credit under the Ex -Se rvicemen's Scheme ( Nos. 12-3 8) from those which do not (Nos. 1 - 1 1) . In order to preserve anony mity the twenty plantations included in the survey are not distinguished from those which were not included .
The nature of the sample des erve s some explana tion. It was proposed to include in the survey firstly a sample of plantations which were producing cocoa as their sole or major crop, which were managed by the owne r, and which were wholly or mainly financed by the Ex-Servicemen ' s C redit Scheme . The reason for the last criterion was that the amount of capital made available by the s cheme (a major determinant of the rate of development) , appeared adequate, thus creating an ideal situation in which to study plantation development .
The survey did not include either pre -war plantations or company -owned plantations: in the former case it was felt that few comparisons could be made at this stage with the Ex -Servicemen ' s blocks, which were still in the early developmental phase when the initial survey was undertaken; in the latter case it was found difficult to obtain ac c e s s to records, which were usually held either in the c ompany ' s head offi ces in Australia or with accountants in other towns in the Territory . It would, however, be useful to include the s e two cate gories of plantation in a mor e extensive survey at a time when the Ex -Se rvicemen ' s plantations are in full production.
Secondly, the sample includes two properties which are operating without as sistance from the C redit Board, in one instance unde r individual owne r -managership, in the othe r by partnership . These were included in the survey because in all respects but source of capital they could be compared with the Ex -Se rvic e men ' s blocks. Finally, three
1 3

Area1
No.
1 2 3 4 5 6
7 8 9
10 1 1
1 2 1 3 14 1 5 16 1 7 1 8 1 9 20 2 1 22 23 24 25 26 27 28 29 30 3 1 3 2 3 3 34 35 36 37 38
Table 1
ownershiE1 management and croE on EuroEean Elantations in the PS?ondetta area
Area (acres) Ownership Management Crops (+) Year Occupied
2,870 Company 2-3 managers R,ca Prewar 1,000 Company Manager R Prewar 1,550 Company Manager Ca, co Prewar
840 Company Manager Ca ? 2,850 Company 2 managers Ca c. 1 955
440 Company Manager Ca c. 1 955
920 Individual Owner R, ea, cf Pre war 672 Individual Owner Ca 1 956 430 Partnership Partners Ca 1 958 440 Individual Manager Ca ? 510 Individual Owner Ca 1 96 1
530 Individual Owner Ca, cf, co 1 955 510 Individual Owner Ca 1 955
1, 280 Individual Owner Ca 1 956 c.500 Individual Owner Ca ?
400 Individual Owner Ca 1 959 440 Individual Owner Ca,pn 1 959 400 Individual Owner Ca 1 959 440 Individual Owner Ca 1 959 550 Individual Owner Ca 1 959 440 Individual Owner Ca 1 959 400 Individual Owner Ca 1 959 400 Individual Owner Ca 1 959 470 Individual Owner Ca 1 959 430 Individual Owner Ca 1 959 450 Individual Owner Ca,cf, co 1 959 400 Individual Owner Ca 1 959 420 Individual Owner Ca 1 959 400 Individual Owner Ca 1 959 430 Individual Owner Ca, co 1 960 440 Individual Owner Ca 1 960 570 Individual Owner Ca 1 960 410 Individual Owner Ca, co 1960 390 Individual Owner Ca 1 960 536 Individual Owner Ca 1 96 1 488 Individual Owner Ca 1 96 1 300 Individual Owner Ca 1 96 1
748 Individual Owner Ca 1 96 1
(+) Ca : cocoa Co : coconuts Cf : coffee R : rubber Pn : peanuts
14

propertie s are included which are now receiving credit under the s cheme, but which were initially operated on private finance. Thus fifteen of the twenty plantations in the survey have been operating on finance from the C redit Board sinc e their inception, i . e . between mid - 19 5 9 and 19 6 1 . A furthe r stratification was made t o s ele ct from among the plantations numbered 12 - 3 8 in Table l, as far as pos sible, those which had been taken up in 1 9 5 9 and which had the refore had more time to undertake development. Only one plantation is in cluded from those which were begun as late as 1 9 6 1.
The planters in the sample were interviewed on the basis of a prepared questionnaire, and for comparative purposes that used in 1964 was e s sentially the same as the original one. ( 1) The number interviewed was originally greater than twenty, but as some planters were unable to supply all the information sought, the sample was reduced accordingly. Two of the initial twenty were unable to supply all the information needed for the follow -up survey in 1964, but they are included in statistics given later in this pape r for the 1962 survey. The plantations in the 19 62 sample repre sent 40% of the total area under European control in the dis trict, and 6 5 % of the total area of plantations which are not unde r c ompany manage ment . Sixty-three per cent of planta tions under individual ownership are represente d .
The que stionnaire included s ections of land use, the pattern of development to the time of survey, and the proposed development over the following three years (i . e . to 1 9 6 5 in the case of the initial interview; to 19 67 in the case of the subs equent interview); c ensus data in a s ection on house hold composition; a section on aspects o f native labour on the plantations , including occupations, length and type o f e m ployment, wages , labour requirements and wo rk organisation; and a final section on inve stment, income and expenditure . It is proposed to discuss the data as sembled during the surveys by reference to and analysis of table s which have been compiled from the questionnaires.
( 1 ) S e e Appendix.
15

Land Use
Table s 2 and 3 set out details of the land use on the twenty plantations for the first and second surveys respectively. The year of occupancy is included again as a guide to the variation in rate of development, although in s eve ral case s factors such as sicknes s have retarded pro gress .
C onsidering the recency of occupation of most of the blocks, a high proportion of the total area had been planted with cocoa by 1 9 62 , although, as will be seen from Table 3 , the pe rcentage increase of land unde r cocoa was comparatively small two years later ( 5 . 2 %). Furthe rmore, the statistics in Tables 2 and 3 are those obtained from the plante rs them selve s ; C redit Board estimate s o f "effective acreage " amount to 42 0 acres less than the total of 4, 2 1 9 acre s of planted cocoa for the eighteen settlers receiving C redit Board as sistance . In other words, what the C redit Board considers to b e fully planted cocoa in 1 9 64 is only 4 1 . 4% of the total area of those eighteen plantations , compared with the 46% repres ented by statistics obtained from the planters . Some reasons for thi s slowing-down o f development i n the last two years will b e offe red late r . Although rapid initial clearing and planting was facilitated for ex -servic e me n by conside rable loan finance, those plantations which began development on private capital did not differ markedly in the early stage s of development .
It is intere sting to note the relatively s mall ac reage unde r othe r commercial c rops in both table s . Few seem to have considered it worthwhile to plant short -term "catch c rops " such as peanuts or sweet potato . There are po ssibly s everal factors involved he re: in the first place, settlers financ ed by the C redit Board were required to plant a m1mmum of 1 5 0 acres within the first two year s ; and s e condly, for these settle rs it was conside red that the loan would be adequate to support them until the major c rop matured, otherwise the practice of planting quick-maturing crops to provide an immediate income might have been more widely adopted in the first years . It is worth pointing out also that one plante r who grew peanuts for this purpos e had difficulty in marketing his crop.
1 6

Table 2
Land use, 20 elantations, 1962
Plantation No. 1 2 3 4 5 6 7 8 9 10 11 12 13 14 15 16 17 18 19 20 % Total Total
Year 1961
Occupation 1956 1960 1960 1959 1959 1960 1959 1959 1958 1960 1959 1959 1956 1959 1955 1960 1959 1955 1959
Acres Area
LAND USE (ACRES)
Forest 275 250 75 36 155 86 125 139 BO 121 235 130 255 460 157 52 173 157 316 136 3413 33.7
Grassland 20 20 - 300 - - - - 17 30 - - 90 372 - - - 6 - 40 B95 B.B
Cocoa 130 300 260 220 130 216 253 23B 196 255 200 240 120 299 lBO 340 150 164 150 154 4195 41. 6
Other Crops* - Co.30 - - - Sp.14 - - - - - Sp.5 B.3 - - Cf.5 - Pn.13 - - 97 0.9
Cf. 9 B. 5 Sp.12 ... R. 1 ...,
Native Gardens 7 40 - 8 - - 4 - 10 2 - 32 15 90 5 35 16 10 274 2. 7
Cleared, not planted 60 - - 5B 12 - B7 1 - - 55 - 20 - 29 24 - 40 3B6 3.8
Shaded, not planted 20 - - 10 43 - - - - - - - 15 15 - 12 - 17 - 132 1. 3
Buildings 2 7 10 2 7 16 4 6 1 7 3 10 2 4 3 B 1 6 1 16 116 1. 1
Access Roads 2 10 5 2 B 6 - B - - 9 5 8 10 3 4 3 4 - 87 0. 9
Unusable BO 15 20 - 100 - 10 13 11 6 - 40 20 90 - 32 16 20 6 44 523 5.2
TOTAL 536 672 430 570 400 450 410 400 400 430 440 440 550 12B0 400 530 390 440 510 440 1011B 100%
*Co. : Coconuts Sp. : Sweet potato Cf. : Coffee B. : Bananas
R. : Rubber Pn.: Peanuts

Table 3
Land use, 20 plantations, 1964
Plantation No. 1 2 3 4 5 6 7 8 9 10 11 12 13 14 15 16 17 18 19 2 0 % Total Total
Year 1961 1956 1960 1960 1959 1959 1960 1959 1959 1958 Occupation
1960 1959 1959 1956 1959 1955 1960 1959 1955 1959 Acres Area
LAND USE (ACRES)
Forest 151 240 235 26 111 66 84 33 80 105 232 140 255 446 138 52 130 140 316 135 3115 30.3
Grassland 20 50 300 - - 17 30 20 96 372 - - 56** - 40 1001 9.7
Cocoa 176 310 260 240 172 288 306 340 196 272 180 275 112 329 200 340 235 203 167 200 4801 46. 8
Other Crops R.30 - R. 5 - - R. 46 B.5 - Cf.5 - - - 106 1. 0 Sp.10
B. 5 co
'.'fative Gardens 5 40 5 11 3 2 10 5 - 30 25 90 4 15 15 5 265 2.6
Cleared, not planted 30 5 56 - 85** - 55** - - - - 231 2.3
Shaded, not planted - - - - - - 20** - - - 20 0. 2
Buildings 2 7 10 2 7 16 4 6 1 7 3 10 2 4 3 8 1 6 2 16 117 1. 1
Access Roads 2 10 5 8 6 12 8 - 9 5 9 14 3 4 4 - 99 1.0
Unusable 80 15 20 2 100 10 6 11 6 40 20 90 32 16 20 6 44 518 5.0 --- --------
TOTAL 436* 672 590* 570 400 450 410 400 400 430 440 535* 550 1280 400 530 390 440 510 440 10273 100%
R. Rubber Sp. Sweet potato B. Beans Cf. Coffee
* These plantations had either extensions to property since 1962, or reductions. Refer Table 2.
** Now under second growth.

The plantings to date of the other long -term crops, rubber, coffe e, and coconuts, have been largely experimental and so far not notably successful, although it is likely that greater diversification will be undertaken when the pre sent cocoa plantings are in full production. On one plantation thirty acres of c oconuts planted several years ago have been retired due to poor soils , and smaller acreage s of rubber and coffee have also proved unsuccessful, either be cause of lack of attention, soil type, or plant variety.
Replies to que stions asked in 1962 about proposed land use over the following three years showed that the twenty farmers planned to plant an additional 1, 140 acres of cocoa, between 5 00 and 6 0 0 acre s of rubber, and a total of another 100 acres or so of various crops such as coc onuts, coffee, sweet potato and sorghum ( the last two in commercial quantities ). Although the three -year period was not up by the time of the second survey, events so far have proved the se predictions to be over-optimi stic and not likely to be realised for some time . In effect, since 19 62 there have been additional plantings of 6 15 acre s of cocoa, and 8 1 acres of rubber; the 1964 statistics show a reversal of the land planted to sweet potato and peanuts and coconuts. Predictions made in 1964 for the next three years were rather more mode st : for the twenty plantations, an additional 7 0 0 acre s of cocoa, 2 8 0 acres of rubber and 30 acre s of coconuts .
All but 3 0 acre s of the 4, 8 0 1 acres planted with cocoa were planted on former forest land . Many of the plantations had no grassland in any cas e, but on three there are significant acreages. The gras sland, mainly Imperata spp . , is more difficult to clear than virgin bush(l) and its fertility is unc ertain . One planter with a large area of gras sland planned to run a s mall herd of cattle but now considers this beyond his means . The carrying capacity of the grasslands has not been determined but it is unlikely to be high; although some pasture improvement would probably be needed the returns from cattle are likely to be more satis factory than thos e which the e fforts o f establishing cocoa would yield on the
( 1 ) It is not necessary to clear forest completely to plant cocoa , but the grasses must be eradicated thoroughly .
19

lmperata -dominated land.
The area listed in the tables as devoted to native gardens is an estimate: 7 0% of the planters interviewed had set aside land on their propertie s which could be cultivated as food gardens by their labourers in their own time, and in some cas e s employers bought food thus grown and i s sued it as part of the food rations; in most cases labourers were expected to supplement their rations from these gardens. The figures given in Tables 2 and 3 represent the area set aside for thi s purpose, rather than the actual area cultivated, as a margin for fallow i s always necessary.
The category Unusable Land is largely gully land, but it is revealing to observe that some planters do not re gard such land as unusable, in spite of the danger of aggravating erosion by clearing the gullie s and attempting to plant the sides. Certainly there can be no absolute definition of un usable land if it is within certain limits of slope, and providing adequate cover crops are established erosion may be mini mis ed, but a difficulty here is that cover crops under the se c onditions of rainfall and temperature often be come weed pe sts and nutrient robbers .
The areas shown under Access Roads refer to roads built inside the property - chains or mile s have been converted to acreage s . The extent of a c c e s s roading varies considerably. The two tables give only an approximate indi cation of this, for a planter who has constructed narrow roads may have twice the length of roads as another with wide roads, although the total acreage will be similar. Also, s ome planters have been able to take advantage of public roads bordering their propertie s and thus to reduce road develop ment within them. The extension of access roads i s re garded as an i mportant aspect of plantation management, and one agricultural officer in the di strkt considers that the maximum area that can be managed effe ctively by one man is strongly influenced by the extent of the internal road system of the plantation . Limited road development means that more time may be spent in movement and supervi s ing labour gangs with cons equent loss of e fficiency .
20

Although not mentioned in the Tables, very little livestock is kept on the plantations investigated. Some ran a few pigs, and mo st kept poultry, usually for plantation use, although in several cas es for the sale of eggs in the township as a minor sideline .
When the first survey was carried out only four plantations had bearing cocoa, although another eight expe cted a first harvest during the 1 9 6 2 - 3 wet season . In fact, only five harve sted cocoa when anticipated, and the harvests were minor . Table 4 s ets out the actual and potential production from the planted cocoa on the twenty plantations . Estimates of yields were based on the following figures, supplied by the Department of Agriculture : 3-4 year old tree s : 0 . 25 lbs . dry beans /acre; 4 - 5 year old trees : 0. 7 5 lbs. ; 5 - 6 year old tree s : 1 lb.; 6-7 year old tre e s : 2 lbs. ; 7-8 year old trees: 3 lbs.
Table 4
Production, actual and potential - 2 0 plantations
Year A ctual Potential (tons, dry beans ) (tons, dry beans )
1 9 58 c . 1 les s than 3 1 9 5 9 4 . 8 1 2 1 9 6 0 2 6 2 7 1 9 6 1 2 7 4 1 1 9 62 3 7 5 8 1 9 63 58.5 1 06 1 9 64 1 2 4 ( est . ) 1 9 2
The figures were de rived by calculating the number of trees per plantation from the s pacing systems . The s pacing system recommended by the Department of Agricul -ture results in 349 tre e s per ac re; 64% of the total ac reage was planted on this s ystem, about 2 8 % was planted on a system giving a density of about 2 2 5 tree s per acre, and the remain ing 8% unde r a variety of spacing systems.
2 1

It is difficult to account for the dis crepancies be tween actual and potential production in thi s Table for the years 1 9 5 9 and 1 9 6 1 , although one reas on may be suggested. The harve st for the first year or so of production is particu larly difficult to predict: some tree s, due to poor planting, lack of attention to shade control or some other husbandry practice may not bear up to expe ctations, although an extra year's growth may rectify this, and much of the 1 9 6 1 crop was from first harve sts . It seems fairly certain that the c onsistently low yields since then have been caus ed in large part by pest infestation, and pos sibly aggravated by dry s easons, espe cially in the 1 9 6 1 -2 rainy season.
The most se rious pest in the district is a cater pillar commonly known as the army worm ( Ti racola plagiata). This caterpillar, which mainly attacks the new leaves and shoots of young trees, retarding growth, spread in un anticipated propo rtions throughout the Popondetta district; its distribution undoubtedly as si sted by the close proximity of the plantations. A rmy worm first appeared in the district early in 1 9 6 0, at a time when it was not known what or how to spray, and early attempts at control proved both costly and time consuming. Be cause previous experience of this pest from other tropical areas sugge sted that the army worm would eventually be suppre s sed by paras ite s and predator s, the Department of Agriculture was at first not particularly conc e rned about eradication measure s, but at the end of 1 9 6 1 , when infe station was becoming serious, a gove rnment entomologist was sent to the district. Howeve r, he was unable to find any parasites or predators, and concluded that they must have been de stroyed by previous sprayings. During 1 9 62 , a variety of control mea sures was unde rtaken, mostly without suc cess. The se included the introduction of Tachinid flies from India (but it was later established that they were already pre sent in the area); the us e of lead -arsenate as a specific against leaf-eating inse cts (but becaus e it was slow to take e ffect, dangerous to handle, and had no special advantage ove r contact ins e cticides its us e was di scontinued); and the introduction of egg parasites from the wasp Trichogranna minutae from the U. S. A. (but although several lar ge intro ductions were made in 1 9 6 3, no wasps had been recovered by mid - 1 9 6 4 and it is feared that they may have been eaten
2 2

by ants). As well, the Department of Agriculture made a close investigation of the effe cts of contact insecticide s, and concluded that spot - spraying ( rather than total spraying) with D . D. T. was the cheape st and most effective means of control. Spot spraying of the "flush ", that is, the new leaf growth, was recommended, as this is most vulnerable to attack, and the fear persi sted that total spraying was destroying natural predators . In mid - 1 9 64, in order to render the control pro gramme more effective, the Department o f A griculture held a three-day re sidential course at the Papuan Agricultural T raining Institute in Popondetta, whi ch was attended by one labourer from each plantation, and it was propos ed to follow thi s up with a field day on other aspects of pest control.
It is hoped that effective biological pest control can be achieved, as sprays are not only expensive< 1 ) but may be quite ineffective if carele s sly applied . So far only a few indigenous parasite s have been isolated, and it is hoped that these will build up. Toads were introduced early in 1 9 64 at the reque st of the District Advisory Council - the se s eemed to be breeding and may be suc c e s s ful. The main problem with e gg parasite s so far s eems to be that the wasp and the army worm cycle s are out of phase and the wasp population is unable to increas e .
In the meantime, the planters themselve s have unde rtaken a variety of "solutions " to the problem, ran g ing from n o action a t all to total spraying, and i n some cases, c rop dusting, ( 2 ) and expe riments with shade con-
( 1 ) The Department o f Agriculture estimated the following costs: DDT: 3/- per acre (application every 4-5 weeks); labour 2/- per acre . Cost is influenced by availability of water, and cartage may increase costs to 8/- per acre. These figures do not include replacement of machinery. Annual cost would be about £400-£500.
(2) The duster is used between 2 a . m. and 6 a. m. to let the dust (5% DDT dust) settle with the cold air during these hours. By this method, not only the cocoa but the shade trees as well can be treated, whereas this is impossible from the ground with hand sprays. The dust is claimed to give a 90% knockdown, and 250 acres can be covered in two nights. Cost is between 1 2 /- and 13/- per ac.
2 3

trol . ( 1 ) Attacks do not appear to have le ssened in seve rity, although it was reported by s eve ral informants that during the dry s easons of 1 9 6 2 and 1 9 6 3 the infe stations were li ghter, and it is also believed that the cycle is lengthening from b etw een four and five weekE1 to between six and seven weeks . In 1 9 62 most of the planters whose properties had been severely affected e stimated that their first harvest · would be a year later than normal as a re sult; by 1 9 64 the maj ority of planters claimed that their normal production had been set back by up to two year s .
Seve ral �hings s e em ce rtain . One i s that the pest is serious, although it appears that some settle rs have used the army worm as a. convenient scapegoat to account for lack of development when othe r factors , including managerial ability, seem mo re likely to be responsible . Se condly, it is surpri sing in this s cientific age and after the long experience of monocultural plantation agriculture in the tropi c s, that some such pest or disease infe station was not antic ipated he re . A fter all, the ecological structure of s ome thousands of acres of land , mostly contiguous, was de stroyed in a ve ry short spac e of time, and in an envi ronment so rich in plant and ins e ct life this ups etting of the ecology could not fail to b e mani fe sted by imbalances of some kind . A new environment was substituted in which some competitors and predators would b e eliminated and c ertain species favoured . Although the particular form of imbalance could s carcely have been predicted, it should have been anticipated that such a s ituation could develop, and any apparent sign of this, such as the army worm build -up, attacked much earlier . ( 2 )
( 1 ) This involved " stumping" all shade trees down to five feet, on the assumption that the shade (Leucaena glauca) harbours the army worm. While this has not been established, there appear to be other advantages in this type of shade control, although the long-range effects remain to be seen. The informant claimed his cocoa grew faster , flowered better , and had a heavy podding, and that caterpillar infestation was absent until the shade trees were of mature height again.
(2) In this connection also , it was observed that since 1 962 there has been an increased spread of the vine Mimortica , which is sun-loving and grows in unshaded areas. It is a problem until the cocoa trees canopy , but may also grow completely over trees and kill them eventually. Eight planters said it was present on their properties in serious quantities , ten considered it not serious so far, and two appeared unaware of its existence.
2 4

And finally, it s e ems that for the ex-servic e men ' s prope rties at least, some rather mo re drastic and uniform control measure s might have been insisted on by the C redit Board . A lot of public money has been inve sted here, and conditions are placed by the C redit Board on many aspects of the use of land and financ e, so that it s carcely s eems an in fringement of personal liberty to have insisted on a programme of pe st control for the se plantations - furthermore, such a programme would undoubtedly have been adopted then as a matter of c ourse by the few privately -owned plantations in the vicinity . In the pres ent circumstanc e s a planter who rigo r ously attends to spraying each infestation i s i n e ffect wasting time and money if his property can be imme diately re -infe sted from adjacent prope rti e s where few, irregular, o r no control measures are undertaken .
Replie s to question s in 1 9 6 2 rega rding proposed land use up to the end of 1 9 6 5 revealed that five of the planta tions expe cted to be fully developed (that is , the maximum area of cocoa will have been planted) by the end of 1 9 63 , a further six by the end of 1 9 6 4 . and all but four by the end of 1 9 65. The re - survey established that five s ettlers had completed c ocoa planting by the end of 1 9 6 3 . and four now expected to complete cocoa planting by the end of 1 9 6 4 There was less ce rtainty about future planting when the s e c ond survey was carried out. Table 5 summarises the programme of land development under cocoa on the twenty plantations, by year of operation . Othe r c rops are not included in the table becaus e planting to date of rubber, coffee , etc . ha s been minor and plans for future planting may or may not be reali s e d . It will be se en that there is c onsiderable variation betw e en the plan tations. In the case of plantations whi ch were be gun on private capital in the mid - 1 9 5 0s, the generally slow e r rate of development was due not s o much to a limitation of capital but to rather mo re modest idea s about plantation operation and management . ( 1 ) By c ontrast, the rate o f development by
( 1 ) Whereas the present target is about 100 acres in the first year, and 50 acres in the second and third years, half this would have been considered adequate ten years ago. Also, new techniques have speeded up development , and labour is now used more efficiently.
2 6

those planters who began with finance from the C redit Board has been influenced by the fact that the Board requires that a minimum of 1 5 0 acres be fully planted within the first two years of occupation. The conc ept of "home maintenance area standard " referred to earlie r ranged from a minimum of 1 5 0 to a maximum of 200 acres, and the Board felt that this area was all that could adequately be handled by one pe rson given the extent of the loan . However, planters ' own ideas of "full development " ( that is, the extent of development the planter wa s prepared to undertake ) vary conside rably, as the following table indicates:
Table 6
Anticipated maximum area of cocoa when plantation fully developed
200 -249 acres 9 plantations 250 -299 I I 2 I I
3 00 - 349 I I 2 I I
3 5 0 - 3 9 9 I I 3 I I
4 0 0 -499 I I 2 I I
4 5 0 - 6 00 I I 2 I I
Thus, less than half the plante rs interviewed are content to re st on le ss than 25 0 acres of cocoa, and five of the plantations whose maximum acreage of cocoa is in this range plan to dive rsify c rop production by planting rubbe r, rather than extending the ac reage under c ocoa, as a form of se curity . Four other planters consider that the maximum of about 200 a c re s of cocoa is adequate to provide a comfortable income and will not carry out furthe r development after that acreage is reached, although the plantations concerned are large enough for additional production . It must b e stre ssed that "full development " does not refer to the productive potential of the property, but to the planter ' s e stimate of the optimum ac reage in terms of his own ne eded income and manage rial capacity . The wide variation in thes e e stimate s may b e attributed t o several factors: in the case of those near the bottom of the range, factors such as siz e of family, age, sicknes s , and other busines s intere sts seem to contribute; at the other extreme the re are men who, by virtue of past experience in handling lar ge numbe rs of men or large bu siness intere sts, are undoubtedly capable of the development they
27

propose; but there are also tho se who, it would se em, may be ove r-optimistic or unrealistic about thei r managerial capacity, or ove r -ambitious for a large income, and who pos sibly will not realis e the targets they have set the ms elve s .
Labour
In relation to native labour, que stions were asked in both surveys about the basi s of employment (whether casual or by agre ement)( 1 ) ; the place of origin of the labourers in both the se categori e s; costs of recruiting agreement labour; length of e mployment of all laboure rs on the plantation at the time of survey; wage s paid to casual laboure rs and to thos e with special occupations such as overseers, drive rs, dome s tics , etc. ; the variations in demand for labour according to the stage of development and throughout the year; the work organisation on each plantation; and labour require ments for various husbandry practices.
The place of origin of labour was asked in orde r to establish whether or not the sudden increase in plantation development in the area as a result of the s cheme had actually meant increased employment oppo rtunity for local village rs, and to gauge plante rs' attitude s towards local as oppo sed to non -local labour. In 1 9 5 9 the District C ommi s sioner for the Northern District e stimated that a labour pool of about 6, OOO ( presumably additional to those already employed) was avail able for local industry in the Distri ct . Tables 7 and 8 set out details of the places of ori gin and the oc cupations of the labour force employed on the sample plantations in 1 9 6 2 and 1 9 64 respe ctively.
The first fact to stand out is that there has been a reduction of between 1 5 % and 1 6% in the total labour force sinc e 1 9 62. One reason for this is that in 1 9 6 2 some pro perties were still engaged in initial clea ring and planting, and
( 1 ) Workers who are employed outside their home sub-districts are required by law to become agreement workers to gain employment (though compliance is not universal) . If employed within the home sub-district, no written agreement is required by law of the terms and conditions of employment, and such workers are referred to as casual workers ; they may be employed on a daily , weekly or monthly basis. With certain exceptions,
(see Native Labour Employment Ordinance 1958, Par. VIII, No. 67) all other categories of employment must be by written agreement. Regulations applying to the employment of agreement labour are contained in the same Ordinance , Part VII. Special conditions apply to the employment of highlanders (living above 3 , SOO feet) in lowland areas.
28

District General Labourers
Popondetta Sub-district 257
Other Nth. District 1 8
t>J CD Milne Bay 2
Central -
Sepik 8
Madang 23
Morobe 89
E. H11nds 1 15
TOTAL 512
Overseers
1 2
-
3
-
3
2
4
1
25
Table 7
Labour empl2)!'.ed on 20 plantations (by place of origin and occupation) 1962
Drivers Carpenters Mechanics
3 2 1
- - -
- 2 -
- 2 -
- - -
- - -
3 - -
- - -
6 6 1
Store men Domestic Other TOTAL Servants
8 1 1 2 296
2 4 3 27
4 - - 1 1
- - - 2
1 3 - 15
1 3 - 29
4 4 - 109
2 4 - 122
22 29 5 606

District General Labourers
Popondetta Sub-district 208
Other Nth. District 2
CJ.) Milne Bay 0 -
Central -
Sepik 1 2
Madang 10
Morobe 62
E. H1lds 139
New Ireland -
TOTAL 433
Overseers
8
-
-
-
3
1
3
5
-
20
Table 8
Labour em2lo.i:::ed on 20 Elantations (by place of origin and occupation) 1964
Drivers Carpenters Mechanics
2 - 1
- - -
1 1 -
- - -
- - -
- 1 -
- - -
- - -
- - -
3 2 1
Store men Domestic Other TOTAL Servants
7 13 5 244
- 2 - 4
- - - 2
- 1 - 1
- 6 - 2 1
- 3 - 15
- 2 - 67
- 3 4 151
- 1 - 1
7 3 1 9 506

these operations require more labour than maintenance operations. But also, by 1 9 64, some planters stated that they simply could not afford to maintain larger numbers of laboure rs and would not be able to do so again until they had had a reasonable harvest. In some cases money had been trans ferred from the labour budget to carry out pest control; in others, mismanagement of funds seems to have led to the neces sity to reduce labour costs.
In both table s it will be seen that almost half the labour force on these plantations came from within the Popon detta sub -district. Similarly, the ratio between the total number of labourers from Papua and the total from New Guinea had not changed significantly from 1 9 6 2 to 1 9 6 4 (New Guineans formed about 44% of the total in 1 9 6 2 ; about 5 0% in 1 9 64). The Eastern Highlands District stands out as a significant source of labour, although only five plante rs employed High land labourers in 1 9 62, and eight in 1 9 64. Digressing fo r a moment, it is inte re sting to note that none of the labour ers from the Eastern Highlands came from the vicinity of the two main townships, Goroka and Kainantu , but rather from more remote pa rts of the District such as Lufa and Chuave, where ec onomic change has been less pronounced. Nearer the towns, a variety of inte re sts now tends to reduce the numb e rs se eking outside employment - the se are firstly the fact that many have been away as agreement laboure rs in the early 1 9 5 0s and one or two terms satisfy their curiosity and desire for wealth and pre stigeO ); and also that more recently the local gove rnment councils and village cash cropping interests tend to keep villa gers locally -based.
It will be further observed that most of the workers drawn from the Eastern Highlands and the Popondetta sub -district are general labourers (about 8 5 % in each table ) that is, unskilled . Howeve r, the Popondetta sub -di strict also supplies the s e plantations with more skilled labourers than
( 1 ) On this subject, see R . F. Salisbury, From Stone to Steel, pp. 1 26-1 32 .
3 1

any other. ( 1)
That pa rt of the labour force which is of local origin is employed on a casual basis, that is, by the week or month rather than on the basis of long -term agreements . An analysis of the employment figures for the plantations shows, however, that the re are a few exceptions to the legal situation . Tables 9 and 10 show that a number of non -local natives are employed on a casual rather than agreement basis . This is largely due to the hiring locally of men who found their own way or paid their own pa ssage into the District, or who have found further employment after leaving or being dismis sed from a previous j ob . Of the plantations inve stigated, twelve employed casual labour only in 19 62 and the othe r eight e m ployed mainly agre ement labour with a few casual laboure rs ; in 19 6 4 the figures were the same, except that the individuals employing agreement labour we re not the same as in 1962 .
Opinions about the efficacy of one form of e m ployment a s against the other varied: most planters who employed casual labour maintained that greater efficiency can be achieved with casual laboure rs be cause, if unsatisfacto ry, they can be readily dismissed and othe rs found to take their place . Dismissal of agreement workers before the two -year term is expired is not so simple, and it is also expensive if they have to be repatriated by air to their home districts . However, one informant who employed casual labour said that he would pre fer to employ highland (agreement) labour but could not afford to put up permanent labour quarters at the moment . Those who express a pre fe rence for agreement labour say that they are able to train and keep a stable work fo rce for about two years and sometimes for longer pe riods, whereas if one is hiring and firing casual labour one has pe rfo rc e constantly to train new men into j obs requiring even a very low level of skill .
It is significant that few of the planters who e m ploye d casual labour employed men from village s near the
( 1 ) Continuous contact with Europeans since the beginning of the century is probably responsible for this, as well as proximity.
32

Table 9
Labour employed on 20 plantations (by place of origin and basis of employment), 1962
Place of Origin
Popondetta sub -district Othe r N1thn District Milne Bay Central Sepik Madang Morobe E. Highlands
TOTAL
Agreement Casual
2
14 37
121
1 74
Table 10
Labour employed on 20 plantations
321
1 1 2
15 15 67
1
432
(by place of origin and basis of employment), 1964
Place of Origin
Popondetta sub-district Other N'thn District Milne Bay Central Sepik Madang Mo robe E • Highlands
New Ireland
TOTAL
Agreement
1
3
1 35
139
Casual
247
2 1
2 1 1 2 6 7 16
1
367
3 3
TOTAL
323
1 1 2
15 29
104 122
606
TOTAL
248
2 1
21 15 67
151 1
506

plantation; the maj ority of casual labourers from the Popon detta sub -district came not from within the Higa turu Council area< 1) but from the Managalas e, s outh of Mt . Lamington, or the c oastal regions around the Opi and Mambare rivers. Al though adjacent village rs are cheape r to hire, in that labour quarte rs do not have to be provided as the men can come daily from the village, it is usually felt that the proximity of families and gardens make s fo r too much irregularity in the work force . (2 )
By 1964, some interesting additional material had eme rged regarding the favoured form of employment . It i s more expensive to employ agreement labour, b ecause fare s must be paid from the point of recruitment to the plantation, plus repatriation fees , agent ' s fees , and ce rtain standard i s sues. Re cruitment costs were obtained from s everal planters, and a breakdown is shown here .
Item Planter A Planter B Plante r c
Govt . recruiting fee £ 8 . 12 . 0 £ 7 . 15 . 0 £ 7 . 10. 0 Air fare to Lae 7 . 5 . 0 7 . 10 . 0 5 . 0 . 0 Boat fare to
Killerton (nr . Pop . ) 1 . 1 0 . 0 1 . 10 . 0 1 . 1 0 . 0 Is sue s ( clothing
blankets, etc . ) 3. 19 . 0 4. 19 . 6 3 . 15 . 0 Return fare 8 . 15 . 0 9 . 0 . 0 5 . 0 . 0 A gent ' s fee 5 . 0 1 . 6 . 0 1 . 0 . 0 Medi cal 2 . 0 . 0 2 . 0 . 0 2 . 0 . 0
Total £ 3 4. 6 . 0 £ 2 8 . 0 . 6 £ 2 5 . 15 . 0
Planter A and planter B received labour from the Kainantu sub -district o f the Eastern Highlands ; planter C ' s labour was
( 1 ) See location map.
(2) Some planters who have hired both categories of labourers stated that there was no discernible difference in efficiency between casual and agreement labourers. In any case , this question would be difficult to check. It is possible that until highlanders have gone through an initial adjustment period to the new food and climate , their efficiency is less than that of coastal people.
34

from the Chimbu sub -district, furthe r west. Some variation in cost is due to air fares : if an air charter can be arranged, fares are c onsiderably cheaper; cost of issues varie s ac cord ing to whether they we re bought at whole sale or retail pric e s . A gent ' s fees (paid in Lae ) will depend on how soon the labourers can complete the j ourney by sea after arrival at Lae .
Regarding wages for agreement labour, the rate s are : first year: 3 9 0/ - per man, of which 1 0 / - cash is paid over monthly and the rest deferred; second year: 455 I - pe r man, with 1 5 / - cash monthly.
Several planters who had hi red agreement labour since 1 9 62 admitted that although it was more expen sive in the long run, in the sho rt term it was not, because wages are largely deferred until the end of the contract. This wa s a vital consideration for some whos e budgets were overdrawn. The hope was, in the se cas e s, that by the time the deferred wage s were due, a c ocoa harvest of reasonable size would make it easier to pay them.
The period for which each labourer had been in employment on the plantation was noted in an attempt to es tablish the stability or otherwise of labour. If instability exists it will be re flected in the figure s for ca sual labour. Tables 1 1 and 12 contain the employment periods for casual labour only as agreement workers are bound to s e rve for two years. The figures sugge st that the turnover of casual labour is not great: in 1 9 6 2 less than one-third, in 1 9 64 about 2 2 %, had been employed for under a year; at the first survey 3 0% had been e mployed on the same prope rty fo r two or more years; by 1 9 6 4 this pe rcentage had increased to 7 0 % . Thus the s econd survey seems to indicate that the casual labour force is becoming inc rea singly stable as plantation routines are established and unsati sfactory worke rs weeded out. These tables seem to suggest ( even though the maj ority of plantations have been operating for only about five years ) that relations between most employers and employees are conducive to long te rm employment .
There is remarkably little variation in numbers of
3 5

Table 1 1
Casual labour emEloyed on 20 Elantations (by length of emEloyment) 1 1962
District of Origin -3 mths. 3-6 6- 1 2 1 -2 2-3 3-4 4-5 5+ n . a . * Total yrs.
Pop. Sub-dist. 1 2 27 23 103 25 14 9 28 53 294 Other Nthn. Dist. 7 2 6 2 1 9 27 Milne Bay 3 2 1 3 2 1 1 Central 1 1 2 Sepik 4 4 1 2 4 15 Madang 1 6 4 4 15 Morobe 4 3 8 1 1 37 1 3 67 E. Highlands 1 1
TOTAL 20 44 40 1 30 72 24 9 28 65 432
Table 1 2
Casual labour emEloyed on 20 Elantations (by leng!h of emEloyment)1 1964
District of Origin - 3 mths. 3 -6 6- 1 2 1-2 2- 3 3-4 4-5 5+ n . a . Total yrs.
Popondetta 15 3 34 23 67 1 2 14 67 8 243 Other Nthn. Dist. 1 1 2 4 Milne Bay 1 1 2 Central 1 1 Sepik 2 3 1 10 2 3 2 1 Madang 2 4 2 4 1 2 Mo robe 1 9 1 3 1 1 1 8 2 1 3 67 E . Highlands 4 7 1 1 3 1 6 N . Ireland 1 1
TOTAL 24 1 9 3 7 30 84 41 43 79 10 367
* Not available
3 6

labourers employed on the plantations as a whole: figures were obtained for monthly totals on each plantation for the period January 1 9 6 1 - June 1 9 6 2 , and June 1 9 6 3 - June 1 9 64, with, in some cases, complete fi gures from January 1 9 6 1 -
June 1 9 6 4 . The average monthly totals have decreased some what since 1 9 6 1 . The average number of labourers per plantation was 3 5 in 1 9 6 1 , just over 3 0 in 1 9 62 , 2 6 in 1 9 6 3, and 2 4 in the first six months of 1 9 6 4 . There was, however, some evidenc e of under-staffing in 1 9 6 4 .
A n important part o f the survey concerned the management of labour . Enquiries were also made in the original survey into labour requirements for various husbandry practices on the plantations, as it was thought that the figures might give some measure of managerial efficiency; for example, if planter A needed 3 0 labourers to carry out a task which could be expe cted to be achieved by 2 0 labourers, then it might be assumed that planter A 's men were not working as well as they were capabl e . The results are contained in Table 1 3 .
Table 1 3
Husbandry practices and labour requirements 1 9 6 2
Operation
Felling bush Stacking and burning Lining Planting shade Planting cocoa:
( i) nursery (ii) stake
Thinning shade and weeding
Pest control Harvesting:
(i ) light (ii ) heavy
Average of labourers/ acre / day
1 8 2 0
4 3
3 2
4 1
1 4
Range
1 3 -2 3 1 0 - 3 0
1 - 7 1 - 1 0
1 - 6 1 -3
2 - 5 t -4
116 -t 2 (not yet available )
3 7

Plante rs ' e sti mates of the number of men required to ca rry out a particular ope ration on an ac re in a day were us ed in an effort to reduce to a common denominator answers which were usually given by example, thus: planter A found that 2 0 men took two days to weed ten acres under cocoa; planter B found that seven men took 2 6 days to prune 1 4 0 acres, etc , Not all the ope rations are carried out i n the same way on each plantation; this is particula rly true of pest control, weeding, and planting methods , Also, few planters were able to supply figures for labour requirements for har ve sting when the first survey was c onducted, and not many more by the time of second survey, so the figures for harve st ing are bas ed on only a quarter of the plantations .
Be cause the answers ranged so widely, the range as well as the ave rage is shown. It is felt that the average figure given in the table does not necessarily represent the optimum labour requi rement for e fficiency in each operation -to achieve this, a time -and - motion study would appear to b e nece ssary . It should also be pointed out that for some ope ra tions, such as the felling, stacking and burning of bush, local contract groups were hired, and planters who used this method felt that contract labour was more effi cient for the se tasks . In pas s ing, it may be mentioned that the introduction of the settlement s cheme does not appear to have led to the eme r gence o f labour contracting entrepreneurs i n the distri ct, al though during 1 9 5 9 and 1 9 6 0 e specially the re was quite a demand for contract labou r . Mention should also be made of a new clearing technique which has been adopted since the fi rst survey: thi s is the so-called "thinned -bush " technique, which involve s the removal of only under -brush and s mall trees ( one planter left standing all tree s with a girth greater than 3 6 inches ), the large r trees thus providing the nec e s sary shade . The me rits of this syste m remain to be finally e stablished, but it is le s s demanding of labour, and cheaper ( from between £ 2 . 1 0 . 0 to £ 6 . 0. 0 per acre, compared with about £ 1 5 . 0 . 0 pe r acre for conventional clearing) .
As an alte rnative measure of labour requirements , the number of labourers employed at the time o f first survey was calculated against hundreds of a c re s of planted cocoa for each plantation , At that stage of the s cheme's ope ration, the
38

measure was not considered reliable for precis e prediction as some plantations were still clearing and planting while others were already harvesting. These figures, which are contained in Table 14, are however considered more realistic than fi gures for 1964 when a number of plantations were under staffed to the detriment of the property. Table 14 lists those properties in the "maintenance " stage (that is, where the c rop was bearing and only maintenance and harvesting were unde rtaken) by the symbol M, for a comparison with the rest of the properties. Those e mployees whose o c cupations have only marginal or no bearing on cocoa production, such as domestics and storemen, are excluded . Some plantations had crops other than cocoa, as pointed out earlier, but these c rops were of limited ac reage and the planters conce rned generally divert labour to them only spas modically, when the cocoa requi res no particular attention . This factor has been ignored.
Table 14
Labourers per 100 ac res of planted cocoa, 19 62 (Twenty plantations )
A c res C ocoa No. labourers ( minus Labourers domestics and storemen) per 100 ac res
13 0 3 6 ( - 1) 3 5 2 7 3 0 0 44( - 3 ) 4 1 14 2 6 0( M) 19( -2 ) 17 6 . 5 2 2 0 2 9 ( -2 ) 2 7 12 13 0 2 2( - 1 ) 2 1 16 2 1 6 3 2 ( - 1) 3 1 14 2 5 3 3 4( - 3 ) 3 1 12 2 3 8 2 5 ( - 3 ) 2 2 9 1 9 6 19( -2 ) 1 7 9 2 5 5 3 3( - 3 ) 3 0 12 2 00(M) 2 8 ( -2 ) 2 6 13 2 4 0 ( M) 3 7( - 7 ) 3 0 13 12 0 2 2 ( -2 ) 2 0 17 2 9 9 4 0( - 3 ) 3 7 12 18 0 2 7( - 3 ) 2 4 1 3 3 4 0( M) 4 7( - 6 ) 4 1 12 15 0 2 7( - 3 ) 2 4 16 164 3 3 ( -2 ) 3 1 19 1 5 0 3 1( -4) 2 7 18 1 5 4 3 0( -2 ) 2 8 18
3 9

Onc e again, the range is wide, and these figures are bas ed on numbers actually e mployed, not on esti mated needs . The two extreme s can be explained due to spe cial circumstances: in the case of the planter employing 6 . 5 men pe r hundred acres, he had, until several months befo re the 1 9 6 2 survey, employed 3 0 agreement worke rs and 1 0 casual worke rs . When the agreement workers were repatriated he took on another ten casual worke rs but did not plan to build his labour force back to full strength again until the wet s eason seve ral months later; while in the case o f the highest extreme, the planter was still in an early stage of development and had a comparatively large labour force engaged in clearing ope ra tions. Table 1 5 s ets out the rank orde r o f labourers employed (per 1 0 0 acres of planted cocoa ) .
Table 1 5
Rank order o f labourers e mployed - per 1 00 acre s cocoa
Labourers per 1 00 acres c ocoa
No . of plantations
6. 5 1 9 2
1 2 5 1 3 3 1 4 2 1 6 2 1 7 1 1 8 2 1 9 1 2 7 1
Ave rage pe r 1 0 0 acre s cocoa 1 3 . 3 labourers
The labour requi rements of plantations in full development are difficult to estimate, as ideas on the pro ductivity and efficiency of labour s ee m to be changing fast. It is probably safe to say that under pre sent conditions a figure in the vicinity of fifteen men per 1 0 0 acres of cocoa is an average requi rement . About 1 9 5 7 , howeve r (before the
40

pres ent scheme was initiated) a mrn1mum requirement was conside red to be one labourer per three acres of cocoa, or 3 3 per 1 00 acres . Rising costs of labour in particular have led to insistence on greater e fficiency and managers have had to devis e means to improve labour output. Other ways in which productivity has been stepped up (and the labour force reduced) are possibly through more rational estate planning and lay out, thus lessening the time lost in movement over the planta tion; and through more efficient work organisation .
The method o f work organisation was investigated in the expe ctation that additional light might be thrown on the is sue of management e fficiency. In 1 9 6 2 , eight of the planters inte rviewed s et their labourers to work on a target basis, that is, the plantation labour force was divide d into gangs of appro priate size , and directed to finish a certain task or "mark " which was usually capable of completion within a working day . The supposition here was that the gang would have the inc en tive of a possible early finish to the day ' s work . The mark set varied according to the task - one planter was in the habit of setting a mark which, in his e stimation, his men could achieve by noon if they worked continuously; most set a mark which had to be completed over a c ertain number of tre e s, one hundred per worker as a rule (or equivalent to betw een one third and one -quarter acres, depending on the spacing system), but up to 2 00 trees pe r worke r in s ome cases . A further eight planters worked their labourers according to s et hours ( 8 hours per day, five days weekly as a rule ) in 1 9 6 2 , and the re maining four set marks oc casionally but basically worked to set hours . In 1 9 64 nine plante rs w e re working labour to set hours, seven to marks, and four used a combination . Two had changed to marks since the first survey and one to s et hours; of the four now using a combination, two previously worked to marks and one to s et hours .
A s with virtually eve ry aspect of plantation man agement, there was a variety of opinions . Some felt that the best results w e re not necessarily achieved by setting marks , be cause in the interest of reaching the mark quickly, the task was often carelessly carried out. One informant said that he was forced to employ local labour for ec onomy's sake, and that on the whole they refus ed to work to set hours, but pre -
4 1

ferred the target system so they could leave early to tend their gardens, and so forth. Although another insisted that the target system was inefficient in that the pace tends to be geared to the slowe st worker in the group, it would seem that the target system was the more productive of the two if the figures in Table 14 are meaningful, i . e . of those who based their work organisation thus, only two exceeded the average number of labourers per 100 acres of cocoa and the three planters with the lowest ratio of men per 100 acres all set mark s . On the other hand it could be argued that an energetic employer would achieve better results from an 8 -hour day by intensive supervision; that labourers who complete a mark in less than eight hours are not being used efficiently, and that greater leisure time is more likely to lead to unre st on the plantation, e specially if, as in the case of many plantations here, the labour force comes from several districts of the Territory and inter-tribal conflicts could result . Obviously, it is a circular argument .
Two additional factors may be mentioned as important in res pect of e fficient use of labour - the development of the internal road system, already dis cus s ed, which enables the planter to make spot che cks on the work being carried out in various parts of the property; and the experience and mana gerial capacity of the native overseers e mployed . Al though the value of native overse ers has been questioned as being unproductive, it seems that they are indispensable if the total labour force is split into s mall groups, and also if both ca sual and agreement workers are employed on the one property. It is usually found that they work better under a man they know and whose language they can understand . In conclusion, then, it appears that under existing c onditions the combination of work organisation by marks, a good internal road system, and efficient and reliable overseers to check on quality will make for the best results in plantation manage ment .
A final aspect of the que stion of labour management involved the collection of personal data from the planters in re spect of age, length of re sidence in Papua -New Guinea, and previous occupations . It was thought that with cro s s -reference to other material, the s e factors might have s ome bearing on
42

management e fficiency. It is felt, however, that while this is undoubtedly true, the data collected are not adequate to be usefully employed in this way, as too many imponde rables are involved; much more detailed investigation of pers onality traits, attitudes and s o forth would have to be unde rtaken to reach conclusions of this nature . The results of this se ction of the interviews are, however, pre sented for their value as facts, in Table 1 6 .
Proces sing and Marketing
Preparation of c ocoa for the market involve s two proces s e s, firstly fe rmenting and then drying of the beans . A fter the se the beans are bagged for export. Although both are relatively simple proc e s s e s involving little capital ex penditure for plant, they are neverthele s s of basic importance : as Hende rson points out "cacao beans develop the characte ris -tie s of the comme rcial cocoa only during the fermenting and drying p roc e s s e s . Correct fermenting and drying are e s s en tial if a high grade product is to b e produced " .< 1 )
At the time of the initial survey, when little of the planted cocoa was of bearing age, most of the planters had not de cided what cours e they would follow with regard to pro c e s sing. Plans were much more definite in 1 9 6 4 . The re are a variety of alternative s open to the settlers . A co coa fe rmentary, ope rated as a limited liability company, was established near Popondetta in 1 9 60 . The majority of the shareholders are Australian (and in Australia) but at least two re sidents of the district are shareholders. Equipment installed in the fermentary was, in July 1 9 6 2 , capable of pro ducing about 1 0 0 tons of dry cocoa per year (i . e . about 2 7 0 tons o f wet beans) and was then handling about 6 0 tons o f dry beans . In mid - 1 9 6 4 it was pro c e s sing about 3 , OOO lbs a week ( equivalent to about 7 0 tons a year) although space exists to install machine ry capable of producing 6 Q O tons of dry beans annually . It will be seen from Table 4 ( p . 2 1 ) that existing plant was barely sufficient to handle 1 9 6 3 ' s c rop, and quite inadequate when it is conside red that the fe rmenta.ry also
( 1 ) Henderson , 1 954: 1 8.
4 3

Table 16
Europeans : 20 sample plantations, 1962
1 . By Age Groups
Males Females
Total
30-34
2
2
35-39
9 6
15
40-44
4 3
7
45-49
1 2
3
2. By Length of Re sidence in Papua-New Guinea
Less than 5 years 5-9 10-14
Males 5 4 Females 9 4
Total 1 4 8
50-54
3 3
6
15-19
7 3
10
55-59
2 2
4
20-24
2 1
3
3 . By Years Employed in Various Occupations since 1946 {males only)
Planter Number 1 2 3 4 5 6 7 8 9 10 1 1 1 2 1 3 14 15
Administration 3 1 1 9 5 5 6
All Departments Australian
Government Departments 4 7
Own Plantation 8 9 Plantation
Manager 9 8 15 14 9 14
Transport 5 14
Commerce 7 Trade (artisan) 5 2 2
Profession 9 5 9
44
60 plus
1
1
1 6 1 7
1 1 3
7
2
Total
20 1 8
38
25 plus
2 1
3
1 8 19
6
7
4
6
20
3
5
4
3

proces s e s cocoa which i s purchased from village rs .
The Credit Board insisted from the outset that each ex -serviceman allow a minimum amount of £ 6 0 0 in his budget of expenditure to provide basic fermenting and drying equipment to handle the initial s mall c rop, and it was expected that finance for extending the capacity of the installation would be de rived later from cocoa income . Although central fe rmentaries would seem more economic of both time and money, and also more likely to command a market reputation eventually, it appears that central fermentaries els ewhere in the Territory have not always been successful and the Board was prepared to sancti on individual fe rmentaries . Later, the C redit Ordinanc e was amended to pe rmit the Board to advance money for the purchase of shares in an "approved producers ' processing organisation ", and twelve of the European settlers, together with a majority of the Papuan settlers, have taken advantage of this amendment to form a company (not a co operative ) which will, its directors hope, begin proce ssing at the end of 1 9 64. Anothe r four settlers are proc essing their own cocoa in a partnership, and a Tolai manage r ope rate s their factory. There i s a second partnership of two, which, unlike the forme r, is processing village - grown cocoa as well; and others are running individual fe rmentarie s .
A n informant connected with one of the c ompanies expressed doubt about the wisdom of small processing units, mainly becaus e it is more difficult to maintain a consistent output in terms of both production and quality of proce ssing . It was claimed that it takes about five years to establish a position on the market whe re the cocoa i s of a standard to as sure forward selling, (obviously an important factor in marketing) and that forward s elling is generally more difficult to achieve from small processing units .
C ocoa is one of the few commercial products of the Territory for whi ch there is no large Australian market, but good overseas market pros pects . New Guinea cocoa is generally regarded as a "flavour c ocoa " for which there is a greater demand in the United Kingdom and Europe . The dark eating chocolate is more popular there . The Australian de mand is largely for mild cocoas for milk chocolate, and any
45

large disposals of Territory cocoa on the Australian market will depend on an increased demand for flavour cocoa . New Guinea cocoa is not well known over seas and must compete with other producers for a market . The fermentary estab lished in Popondetta in 1 9 6 0 s ells all its cocoa outside the Australian market, generally at better price s (it i s able to command a premium of up to £ 20 a ton ove r Ghana price s , whereas N e w Guinea cocoa generally s ells at about the same as Ghana) . The Territory ' s proximity to Australia does not lead to a preference for its cocoa on other score s : for example, frei ght charge s from Europe to Po rt Moresby can be lowe r (on non -confe rence line ships ) than from Australia to Port Mo re sby. In a few years ' time , therefore, when there will be conside rably increased production of cocoa from Papua -New Guinea, growe rs may well have to organise selling campaigns ove rseas or marketing agreements with Australia, much as the coffee producers were re cently obliged to, to dispose of their c rop.
Capital
The final section of the questionnaire related to capital inve stment, income and expenditure . It was hoped to demonstrate here whether or not the amount of the loan, £ 2 5, OOO maximum to the individual, was in fact adequate o r pe rhaps exces sive . It will be recalled that one of the reasons fo r extending credit to ex -servi cemen s o long after the war is taken to be the fact that so many o f the plantations established post-war were in financial difficulty, and that e c onomic de velopment in the Territory was in dan ge r of decelerating . An important cons ideration for the Credit Board would the re fore be to avoid a re currence of this situation, without undue ex penditure of public moneys .
Two surveys of the cocoa industry in Papua - New Guinea were available to the C redit Board, Hende rson ' s pape r ( 1 9 54 ) which contains an e stimate of capitalisation neces sary to develop 1 5 0 acres of cocoa; and the survey conducted by the Australian Bureau of A gricultural Economics in 1 9 5 7 - 8 (Department of Territo ries, 1 9 58 ), with special emphasis on costs and long -te rm pros pects . Both, however, w e re based on estimates rather than actual costs .
4 6

The Henderson report estimated that capital to the extent of £ 2 3, 2 1 7 would be neces sary ove r a four-year period to develop a plantation with 1 5 0 acres of cocoa . The B . A. E. report, basing costs on a 2 00 acre block of sole cocoa< 0, es timated total developmental costs at £ 3 2 , OOO. Hende rson ' s report s eems to b e based on absolute minimum requirements, and the B . A. E. report on optimum requirements. It appears also, from a comparison of the two, that c e rtain items included in the latter report have been omitted from Hende rson ' s budget . Thus h e does not appear to have made provision for internal road development, or allowances for freight charges ; cost of housing in Henderson 's report is e stimated at £ 2 , 2 00, and in the B. A. E. report at £ 3 , OOO (although the latte r sum includes water supply and electric wiring, which is not mentioned in Hende rson ' s budget) . Furthermore, labour costs have risen since Henderson ' s report was published, although for reasons di scussed on page s 4 0 - 4 1 , he may have been assuming a large r labour forc e than is c onside red nec essary now. The two budgets are tabulated in Table 1 7 for comparison.
Table 1 7
Summary of developmental costs for sole cocoa (from the Henderson and B, A, E. reports)
Item
Labour {four years) Living expenses (annual)
for four years House Labour quarters Stores Drier/ fermentary Tools Transport Tractor and trailer Blade terracer Access roads, bridges Rent {four years) Insurance (four years)
Transport costs {four years)
Totals
Henderson report
£ 1 1 , SSO
1 , 000 1 , 800 {plus 400 (furniture) )
7SO 4SO 400 sso
1 , SOO
200 400 800
£22 , 800
B. A, E, report
£1 , SOO 3, SOO 1, SOO
2SO 4, 1SO
2SO 1 , 200 1 , SOO
1SO 300
£ 1 3 , 000
( 1 ) A common practice is to interplant cocoa and coconuts, and the majority of cocoa plantations surveyed by the B. A. E. were interplanted, rather than sole cocoa , plantations.
47

Some comparisons are pos sible between the se two reports and the survey of costs unde rtaken at Popondetta. The latte r did not inve sti gate the ultimate extent of capitalisation proposed for the plantations but only the capitalisation to date . Much of the machinery and most o f the structure s necessary fo r full plantation operation had, howeve r, already been in stalled at the time of first survey. Table 1 8 s ets out the ave rage expenditure on various basic items on the survey plantations, and als o the range between highest and lowest expenditure in each cas e.
Table 1 8
CaE italisation on 20 Elantations
Plantation House Labour Other Vehicle Tools Machinery Fermentary Roads quarters buildings
1 £2SOO £2SO £120 £1 660 £2SO £66 £1370 £3SO 2 6000 1 260 30 1 2SO 40 1 92S 900 700 3 1SOO 900 400 1SOO 300 1060 4 1 SOO 100 1 360 1SO ? s 2600 40S 120 1 700 120 41S 6 3 100 800 270 1 3 1S 2SO 3SO SOO 1 000 7 1 960 6SO 300 1480 2 30 1 30 8 42SO 67S 3SO 1 700 1 20 S 70 690 9 2SOO 1200 10 lSOO 90 160 90
10 2 340 SOO 8SO 3SO 1 820 * ? 100 1 1 sooo 1 3SO 1 300 1 700 100 1 17S 1 2 S lOO 1000 400 1 700 100 1600 * SOO 1 3 3200 660 120 8SO 100 36S 2SO
14 sooo 870 1000 1 100 1 10 3 1 30 * 100 1S 16SO SOO 90 1700 200 140 200 16 2SOO 1 840 3SO 1 700 1 20 24S 920 800 17 3200 240 120 1SSO 1 20 6S 1SO 1 8 101SO 800 4SO 1 1 7S 430 2600 * SOO 140 1 9 1 800 1420 400 1S30 220 1 60 90 20 2S80 SOO 1SO 16SO 200 so 200 1000
Note : Those who are not shown with fe rme ntaries have in -vested in one of the proce s sing companie s . Trade stores are not included in Other Buildings .
x : includes tracto r .
48

Cost of structures and machinery on these planta tions varied from as low as £ 3 , 5 0 0 to over £ 1 6, OOO (although thi s includes a house valued by the owner at £ 1 0, OOO) com pared with the B . A. E. e stimate of £ 1 3 , OOO and Hende rson ' s estimate of about £ 4, OOO. It should be pointed out that although even in 1 9 62 more than half the survey plantations had acreages of cocoa in exc e s s of thos e on which the two reports were based, in fact developmental costs do not in -
. crease in direct proportion to planted area, and that much the same structure s and machinery are needed for 1 00 acres of cocoa as for 500 acres. Of the planters interviewed at Popondetta, the majority had expended about-- £ 5, OOO in machine ry and structures in 1 9 62 , and between £ 5 , 5 00 and £ 6, OOO by 1 9 6 4 (in 1 9 6 2 the co st o f fe rmentary and driers had not generally been met, but was included by 1 9 64 ; Henderson allow ed £ 400 for processing and the B . A. E. report contemplated much more elaborate equipment, costing just ove r £ 4, 000 ).
The two planters in the survey operating on private finan ce had expended £ 6, OOO and £ 4, 5 0 0 respectively on structures and machine ry, which is roughly the amount spent by those receiving the loan; two of the three planters who received c redit from the Board after seve ral years of opera tion on private finance had, however, conside rably exceeded thi s amount: nearly £ 1 2 , OOO in one instance had been devoted to structures and machinery, and just ove r £ 1 0, OOO in the other case . In each case about £ 3, OOO of the se amounts had been expended since conve rting to the C redit Scheme . It w ould appear, there fore, that the amount of c redit extended to those receiving the loan for fixed improvements, plant and equipment has been both reasonable and adequate .
One may well ask, then, why it was neces sary for the Board in 1 9 64 to advance additional loans of £ 2, 5 0 0 to seve ral settle rs, with the expectation that almost every settler in the area who c ommenced development without priva.te cash re sources would also apply for such an additional sum? Dur ing the 1 9 6 4 survey, plante rs were asked whether they were applying for an additional loan, whether they considered the o riginal loan adequate, and i f not, why not. Of those eligible for an extra loan, only two felt that they would not apply for
49

further money. The Credit Board feels that the inadequacy of the original loan was possibly due to a combination of pest attacks and dry seasons, and in one or two instances to below average manage rial efficiency . The plante rs interviewed largely agreed with these reasons, but sugge sted additional facto rs: one was that the £ 2 5 , OOO was probably adequate for a single man (although one of those who says he will not need another loan is married with two children) but that living and educational expenses for men with families would form a considerable additional expense ; several sugge sted that the £ 2 5 , OOO would have been enough if the alloc ations had been more closely supervised; some plante rs who started in 1 9 5 9 said that their expenditure had been heavy i n te rms of lack o f road development ( which they had t o unde rtake the mselve s ), hi gh vehicle maintenanc e costs as a consequence of the poor roads , and the high cost of building materials, e specially timber, which had to be brought in from other parts of the Te rritory (although valuable timbers were standing on all this land, they were destroyed in initial clearing ope rations, whereas with some forethought a sawmill might have been erected in 1 9 5 9 which could not only have provided s ettlers with timb e r from their own blocks, but als o s ome income from sale of timber rights; subs equently a privately -owned sawmill has been e rected, and in 1 9 64 the Fore stry Depart ment was making arrangements for the disposal of remaining timber rights on s ettlers ' block s ). In 1 9 6 2 most planters appeared confident that they would manage on the original loan, but by 19 64 factors whi ch had been only e mb ryonic earlie r had become actual - the cumulative effect of pest infe station for one, and the cumulative effe ct of mis mana ge ment for another .
An original condition of the loan was that the re cipient should " . . . .. reside on and devote his full time to the management of the property . . . . unless the Boa rd in any particular case othe rwise approve s ". Living expens e s were imputed by Hende rson at £ 1 , OOO per year, and in the B. A. E. report at £ 1 , 5 0 0 . The Board allocate s £ 9 5 0 annually for a married man with an allowance of £ 5 0 for each child, and £ 8 00 for a single man . A ctual living expens e s for most planters were in thi s range, but most s ettlers who had children at school in Australia claimed that the education allowances
5 0

were inadequate . ( 1 ) In 1 9 62 a few of the planters interviewed had sources of income other than the loan, although they did not nec e s sarily involve time s pent away from the plantation ( e. g. investment in other plantation interests or other business ventures ). But by 1 9 64 almost every planter had subsidiary sources of income . In some cases the se were from trade store s either on the plantation or in the locality (but registered in the wife ' s name ), or from wive s taking j ob s in store s and gove rnment depa rtments. In other cases they involve c on siderable absences from the property by the planter, although if the Board is satis fied that the re is no apparent neglect involved, it is now prepared to sanction the se activities. In a few cases, however, negligence has been found and the plante rs conce rned orde red to te rminate external activities and to reside full time on the property. The temptation to supplement a dwindling budget by additional source s of inc ome must have been conside rable in the last two years, and the opportunity to do so has increas ed as the size and functions of Popondetta township become greate r; furthermore, the nece s sity to do so appears to have been admitted by the Credit Board in relaxing the c onditions quoted on p . 5 0.
An attempt was made to forecast likely income to the planters surveyed once their propertie s were in full production . This proved somewhat difficult . Hende rson ( 1 9 54 : 1 ) said that "The re has been no carryover ( of the cocoa c rop) from s eason to season for some time, hence , with no backlog, prices respond rapidly to each c rop forecast from the main producing c entre s ". A representative of a cocoa buying firm in Sydney info rmed me in 1 9 6 3 that over the previous five years the price per ton of dry beans had varied from £ Stg 1 5 0 to £ Stg 3 5 0, and that in the period September 1 9 62 to April 1 9 6 3 (by way of example ) the price went from £ Stg 1 6 0 to £ Stg 2 4 0 . Such price fluctuations make pre dictions s omewhat unreal, but he sugge sted that planters in
( 1 ) Provision exists, subject to certain conditions, for European children at school in Australia to receive a bursary amounting to about £300 , for each child, and return fares are paid once a year (about £40) , by the Administration. The adequacy of these allowances depends on the type of school selected by the parents for the child, and in respect of a certain amount of "keeping up with the Joneses1 1operates in a small community such as this.
5 1

Papua -New Guinea might expect a yield of 0 . 5 tons per acre as a fai r ave rage, and that a likely price on which to bas e proj e cted incomes would b e £ A l 7 0 p e r ton . Early i n 1 9 6 5 , however, the Department o f Agriculture in the Territory c on sidered that 0 . 4 tons per ac re, and £ A 1 9 0 pe r ton, were more realistic e stimates of production and price, and the following proj ection s are based on the latter figure s .
On this reckoning, plante rs with 1 5 0 acres of sole cocoa may expect an income when the cocoa is fully bearing of £ 1 1 , 400. Those with 2 0 0 acre s may expect an annual in come eventually of £ 1 5 , OOO plus . Actual incomes to date, from the few plantations which theoretically should be in full bearing by now, so far do not support the above assumptions in the matter of yields, which seem to be in the vicinity o f 0 . 2 5 tons p e r acre, although the price received is equivalent . Those receiving a loan were committed to begin repayments after the fifth year, by which time it was anticipated that income from cocoa would b e sufficient, and to complete re -payment over a period of 2 5 years from the commenc e ment of the loan . Unde r the se circumstance s the annual repayment of principal with interest would amount to almost £ l, 8 0 0 . Howeve r, the Board now considers it unrealistic to expect repayments to commence before the s eventh year: taking into ac count the additional loan of £ 2 , 5 00 and accrued intere st, the amortisation figure is likely to average about £ 2, 3 0 0 annually.
Annual ope rating expenditure includes maintenanc e costs o n buildings, vehicles, machinery and roads; the cost of labour; cost of stores such as s eed, inse cticide and bags, oc casionally fe rtilisers ; land rental; transport and insurance costs; and living expens e s . Data were obtained from all plantations regarding annual expenditure, but as none con sidered thei r properties in full production this data cannot be compared at present with predicted income s .
Labour costs over a twelve - month pe riod amount to an average of £ 3 , OOO, although the range is about £ 1 , 5 0 0 on e ithe r side o f thi s . Although the figure s c ontained in Tables 8, 1 0 and 1 2 are felt to be reliable, labour costs obtained in 1 9 64 are not . They w e re frequently supplied from statements to the Board, and in some cases were falsified so
5 2

that money allocated for labour could be used for othe r pur pose s . The labour costs quoted above are from 1 9 6 2 , when this situation did not apply. At this stage few had heavy maintenance costs on buildings, although annual maintenance on machine ry amounts to perhaps £ 1 5 0 -£ 2 00 average, and vehicle maintenance is high - highe r than it was in 1 9 62 - due to rapid depre ciation . Running and maintenance costs w e re about £ 3 00 annually per individual plante r in 1 9 64; about £ 2 0 0 in 1 9 6 2 .
Land rental is not high initially: between 2 I - and 3 / - per ac re per year, or £ 4 0 to £ 5 0 per plantation per year. However, provision exists to revalue properties after ten years, and at five-yearly inte rvals the reafter . Becaus e as sistance is received for education expenses beyond the primary school level, this item was not conside red in com puting expenditure, even though in many case s expense here was above the allowances .
It wa s hoped that when the re-survey was made some concrete observations would be pos sible on the questions of inc ome and expenditure, but events between the two periods of survey have not permitted thi s . It is c onsidered that until all the survey plantations are at an equivalent stage of de velopment, namely, in full production rather than at varying developmental stage s, complete estimates of developmental costs and comparisons between plantations will be unsatis factory and of neces sity incomplete .
Race Relations
The subj e ct of race relations was not a deliberate part of the survey, but a few comments may be made on this question . Mention may be made he re of one interesting departure in this area from previous land policy, and indeed in most areas where plantations have been developed in the po st-war period. Mr . Hasluck, then the Minister for Terri torie s, said in January 1 9 5 8 (in Wilkes, e d . , 1 9 5 8 : 1 08 ) that :
( The lands policy) has also been designed deliberately to prevent the building up of enclaves of Europeans and s eeks to disperse the Europeans among native
5 3

settlement so that the European may become in fact a neighbour and not a stranger and will be able by hi s example to help in the growth of the agricultural activities of the people .
This has not been strictly adhe red to in Popondetta so far as the ex - servic e men ' s blocks are concerned: although there are now ove r 2 2 0 Papuan settlers in five main concentrations interspe rsed among the European planters, the areas unde r European and Papuan s ettlement are adjacent rather than truly interspers ed, and the entire area of new plantation development is separate from that of village settlement . It was stated by one informant that although strong pre s sure s were exerted from s ome quarters early i n the s cheme ' s oper ation to adopt inte rspersal, many Australian planters pre fe rred the pres ent design of the blocks, and, ironically as it turns out, veiled their reluctance fo r inter - mixing of blocks with talk of more e ffective pest c ontrol and so on .
Another researcher is studying the social conse quence s of the juxtaposition of the two groups of ex - servic e -men, Papuan and European, but s o far as relations between the village rs and the European sector o f the planters is c on c e rned, Mr . Hasluck ' s statement of policy seems to have been ignored . One may, of course, question the value to villagers and Papuan s ettlers of the example from large plantations where, although the c rop produced may be the same, virtually all phases of management are very diffe rent . In the Eastern Hi ghlands during the early 1 9 5 0 s the "neighbour " relationship is reported to have existed, but there was not much evidence of it at the end of the 1 9 5 0s0 > . C ertainly, to judge from the facts relating to employment of labour, relationships between employe rs and employees are fairly stable in the Popondetta district . But attention is drawn to Tables 2 and 3 to the areas shown as standing under fore st . Thi s amounted to 3 3 . 7% of the total area of the survey plantation s in 1 9 6 2 , and had been
( 1 ) However, the situation had changed again by 1 964, and I saw evidence of a number of examples of cooperation, mainly economic. While not doubting the good intentions of the majority of Europeans involved thus , it is also possible that recent political achievements have been contributory.
5 4

reduced to only 3 0 . 2 % by mid - 1 9 6 4 . It seems that it is in the planters ' interests to develop as much of this land as pos sible, not only for the obvious reason of their financial well -being, but also for the less tangible reason that relations between the indigene s and expatriates may be adversely affected if fertile and potentially productive land is left idl e .
There are two aspects of this problem. I n most areas of plantation development to date , land has been taken up amidst a relatively unsophisticated village -dwelling popu lation . The aspi rations of these people are, however, changing fast, as more and more villagers become interested in grow ing cash crops, and are simultaneously hampered by the conditions of land tenure which their traditional s ocial or ganisation has imposed upon them. This is certainly a problem in the Popondetta area, and the recent and proposed legislation relating to individualisation of tenure may well make the problem more acut e . The attitude of local natives to a group of Europeans in their midst, occupying (even though with full legal right) land which they formerly owned but which is not being used might well be an unfavourable c ompound of envy and resentment( 1 ) .
The que stion is further c omplicated in the Popon detta area by the fact that a large group of Papuans, in many cases highly ac culturated, have also been s ettled on cocoa blocks . University staff here found that Papuans in the area, both ex - se rvic emen and villagers (to whom Papuan ex s e rvicemen represent an elite group) consider that the c on ditions under which the two groups of settlers were able to acquire blocks of land and c redit to ope rate them were dis c riminatory against the Papuans . Quite diffe rent concepts were applied in the allocation of land and financ e to the two
( 1 ) In 1962 I had occasion to introduce the president of the Local Government Council in Popondetta to a planter's wife . She said 1 1 1 don't suppose you know me" , and he replied "Oh yes I do: you are sitting on my land" . The implication was that the land was still tribal property , in spite of legal alienation.
5 5

racial groupsO > and if it become s apparent to the Papuan settlers that thes e concepts were unjust, it would be as well if the European planters were able to demonstrate that they had used their land and financial grants to the fullest extent for the c ountry ' s economic welfare .
Some C onclusions
It will have become evident, because the first survey was conducted when most of the plantations involved had only recently begun operation, and the second survey at a time when anticipated developmental goals had not been realised, that this paper can give no more than tentative and preliminary conclusion s .
I t seemed, i n 1 9 6 2 , that for the settlement s cheme the amount of the loan was fully justified for its fulfilment, taking into c onsideration costs and conditions at the time . By 1 9 64 thi s no longer appeared to be the case . For one thing, it appears that the Board s et too fast a pace o f development, pre sumably in the belief that the c redit provided was ample to sustain such a pace, although experience in coc oa - producing areas elsewhere in the T e rrito ry sugge sts that six to s even years to reach production would have been more realistic than the five years initially set by the C redit Board . It would s e em also that closer control of finance, and inspection of the plantations, would have been advisable from the start . Super vision of s oldier settler s cheme s in Australia has been fairly careful, no doubt for good reason, and it seems surprising that it was felt unnecessary to adopt the same practices in Papua -New Guinea . For example, the re is only one officer ( se conded from Lands Department) resident in the Popondetta district (and no resident officers in other plantation a reas) ,
( 1 ) The size of the cocoa blocks allocated to Papuan ex-servicemen was determined by the area of land which the Board considered a biological family could effectively utilise . It was considered that this would amount to about 15 acres of cocoa , although in most instances the blocks are 25-30 acres in size , because areas of grassland, gullies, and other unproductive land were included in the blocks.
No allowance was made in the Papuan settlement areas for additional labour as it seems to have been assumed that Papuans did not have the necessary skills to employ labour (though many have done so in fact) . Most Papuans were granted a maximum loan of £750.
5 6

and this officer ' s directions involved supervi sion of the Papuan blocks in particular; the European blocks being considered to require less attention . Closer supe rvision of the European blocks might have prevented a numbe r of what might be called malpractices : not only the employment of inadequate numbers of labourers and ne glect of pest control, but also exce s se s of zeal for which the loan was not designed, such as the planting of twice the sugge sted ac reage, so that the available money had to be spread too thinly.
It is conceded that thos e provi sions in the Scheme for a c e rtain standard of living for the European settlers are probably indispensable at this stage of the Territory ' s de velopment . The B . A . E . report commented that its members were strongly impres sed at the small number of young men unde rtaking as individuals the development of plantations . It is a fact that, in the face of rising political aspirations on the part of the indigenous people, many Europeans are apprehen sive of their future in the Territory, and that since the late 1 9 5 0 s overseas investors have shown little confidence in the economyO ) . At thi s period, fewe r Europeans are prepared to settle in the Territory than probably at any other time, and there se ems to be an increasing disinclination to "rough it " to the extent that existed pre - wa r . There are relatively few advantage s to life in Papua -New Guinea for thos e who might conte mplate s ettlement, to outweigh the fact that one will be come part of a minority expatriate group . Furthermore, in view of the Te rritory ' s urgent need to achieve economic via bility, c oupled with a pre s ent inadequacy of indigenous mana gerial skill (and an apparent reluctance on the part of the Administration to foster and train indigenous people in thes e techniques ), a solution must still rest heavily upon European enterprise and activity .
In this c onne ction, a c omment may be made about
( 1 ) However, alienation of some thousands of acres of land in the Western Highlands early in 1 964 has produced quite a keen response from prospective developers, and indications of willingness to invest capital for development. But the Highlands have always been a favoured area and in recent years little alienation of land there has occurred. Possibly also the period of indecision about the Territory's political future is drawing to an end, now that the House of Assembly elections have been held.
5 7

the granting of c redit on the condition of war service . A s a gene ralisation, and without ne cessarily reflecting on any of the plante rs in the survey, it s eems that it might have been more advantageous in the long run to make c redit available to younger men for agricultural development ( see Table 1 6 ) . Greater selectivity might also have been exe rcised: the author was informed that all eligible applicants for a loan were ac cepted, with the exception of a few whose pe rsonal financial re source s were deemed adequate to do without the loan . None was rej ected on othe r grounds, although some have subse quently proved to be unsuitable farme rs in Territory c on ditions . In this context, one of the most c ritical requis ite s i s an ability t o manage native labour, and while it i s admitted that this would be difficult to test by a selection committee, neve rthele s s it could have been supervised subsequently.
Although one cannot yet regard the plantation expe riment here as successful, it must be ob se rved that the indirect effects of the venture have in s ome ways been fruit ful . To those who have been re sident in the district since before the war, the progre s s of the area must seem dramatic . C e rtainly it seemed so, on the se cond visit, to one who first vi sited the area in 1 9 62 . In that short space of time the township of Popondetta had almost doubled in s ize, and its amenitie s had greatly inc reased: in 1 9 64 the re was a hotel, many more store s, new bus ine s s e s, new sports facilities , all of which help to make life more attractive and to re move the frontier somewhat : factors which are particularly important for wives and familie s , if not for the planters thems elves . The town ' s status has also been inc reased by the recent e s tabli shment of the Papuan Agricultural T raining Institute, and development in the district is indicated by the improved system of roads and bridge s . This kind of development will continue with the completion of the road link to Kokoda, and the development of a port at Oro Bay, some forty miles by road from Popondetta .
Finally the need for a further survey of thes e plantations i n several years time is stre s s e d . A n appropriate time would be, as suggested above, when the c urrent growing problems have been overcome and the plantations c oncerned have made the transition fro m the developmental to the pro -
5 8

duction stage of ope ration . The hope is expres sed that if a re -survey is possible, some of the company -owned plantations might be included for wider c omparisons, to test the variations in capital, labour input and manage ment against production with those plantations which are individually owned and operated .
5 9

A P P E N D I X
A . N. U, NEW GUINEA RESEARCH UNIT --- POPONDETTA RESEARCH
EUROPEAN SURVEY 1 962
Questionnaires for 1 962 and 1964
I .
1 . OWNERSHIP
Ex-se ivicemen1 s Scheme
Private Ownership ( 1 ) by individual • • • • , • , , • • • •
(2) by company • • • • • , • • , • • ,
2. MANAGEMENT
By Owner . . . . . . . . . . • . . . . . . . . . . . • . . • . • • . . . • • . •
By Manager . . . . . . . • . . . . . • . . . . . . . . . • . . . . • • • . • .
By Owner + Manager , • • , • , , • • • , • • • , , , , , , , , , , , ,
3 . TOTAL AREA PLANTATION
Area under: ( 1 ) Forest • • • • • • • • • • • • • • • • • • • • • • •
(2) Grassland • • • • • • • • • • • • • • • • • • • • •
(3) Cocoa • • • • • • • • • • • • • • • • • • • • • • •
(4) Other crops • • • • • • • • • • • • • • • • • • •
(5) Cleared not planted • • • • • • • , • • • •
(6) Shaded not planted • • , , • • • • • • • •
(7) House , other structures • • • • • • • • •
(8) Unusable (gullies, etc. ) • • • , • • , •
(9) Roads (in chains) • • • • • • • • , • , , • •
4. SOIL TYPES (acres)
6 0
Acres

5. RAINFALL STATISTICS
Year Jan Feb Mar Apr May Jne Jly Aug Sep Oct Nov Dec Total
II. LAND USE
1 . COCOA
Year Ac. cleared Ac. shaded Ac. planted S. M. Ac. bearing Yield (tons)
S. M. - spacing method Area cocoa planted on former forest land: Area cocoa planted on former grassland: Est. area cocoa when plantation fully developed:
2. OTHER TREE CROPS
Year Ac. cleared Trees planted/ Acres planted
Trees bearing/ Acres bearing
3. ANNUAL CROPS (for plantation consumption or sale)
S, M.
Year Crop/Crops Acreage Purpose
6 1
(state year)
Yield (tons)
Production

4. PROPOSED LAND USE 1 963- 1 965
Year Crop or crops Est. acreage/No. trees Other development
1 963
1964
1 965
5 . LIVESTOCK
Type Number
III. HOUSEHOLD COMPOSITION
1 . ADULTS
Age Sex Date Arr. (PNG/Pop)
2 . CHILDREN (under 2 1 )
Languages (E. P. M)
Country birth
Prev. Occ.
Pwpose
Place
Age Sex Country Languages Where Freq. N. G, Where employed birth school vacations
62
Duration
Occupation

IV. NATIVE LABOUR
1 . TOTAL ON PLANTATION:
2. INDENTURED LABOUR
( 1 ) indentured , • • • • • • , • • • • • • • , • • • • • • • •
(2) casual • • • • • • • • • • • • • • • • • • • • • • • • • • •
Place of Origin (Sub-District)
Number Date of Arrival (month , year)
Recruiting cost per capita
3 . CASUAL LABOUR
Place of Origin Number (village)
4. SPECIAL OCCUPATIONS
Where resident (village ; pltn. )
Occupation Place of Origin
Overseer Mechanic Driver Carpenter Domestic
6 3
Occ. Period Employment
Salary
Freq. Emp.
Wages
Period employed

S . LABOUR EMPLOYED, 1 96 1
Month
January February March April May June July August September October November December
Indentured Casual
6 . ESTIMATED MAXIMUM LABOUR REQUIREMENTS
Month: Reason:
7. ESTIMATED MINIMUM LABOUR REQUIREMENTS
Month: Reason:
8, WORK ORGANISATION
(a) Does labour work to 1 1marks?1 1
(b) What marks are set (size of gang ; size of mark) ?
(c) How are overseers selected?
(d) Who supervises casual labour?
(e) How is labour rationed?
64
Plantation operations

V. LABOUR REQUIREMENTS
Clearing Lining Shading Planting Shade Pruning Weeding Harvest Labour Units/
Acre/Day
Pests and Diseases
Type Frequ, of outbreak
Other operations and maintenance
VI. PROPERTY
Item
House (+ furniture) Labour quarters Other structure s
(specify)
Vehicles Tools Machinery Roads Other
Type
Control Cost/Acre
When Purchased/ constructed
6 5
Labour units/acre/day
Original Cost Est. Life

VII. SOURCES OF INCOME
Source
S, s. loan Employment
outside plantation
Trade stores Cocoa Other crops Other
VIII. EXPENDITURE
Item
Maintenance on: ( 1 ) House (2) Labour quarters (3) Other buildings (4) Vehicles and
machinery (5) Roads
Owner /Manager
Ann. Expenditure
6 6
Wife
Item
Labour Stores (seed,
insecticides) Land rental Insurance Transport Living expenses Other
Amount
Ann. Expenditure

A . N, U. NEW GUINEA RESEARCH UNIT --- POPONDETTA RESEARCH 1 964
TOTAL AREA PLANTATION
Area Under: ( 1 ) (2) (3) (4) (5 ) (6) (7) (8) (9)
Forest • • • • • • • • • • • • • • • • • • • • • • • • • • • • • •
Grassland • • • • • • • • • • • • • • • • • • • • • • • • • • • •
Cocoa , . . . . . . . . . . . . . . . . . . , . . . . . . . . . . . Other crops • • • • • • • • • • • • • • • • • • • • • • • • • •
Cleared not planted • • • • • • • • • • • • • • • • • • •
Shaded not planted • • • • • • • • • • • • • • • • • • •
House , other structures • • • • • • • • • • • • • • • •
Unusable (gullies , etc. ) • • • • • • • • • • • • • • •
Roads (in chains)
RAINFALL STATISTICS
Year Jan. Feb. Mar. Apr. May Jn. Jly. Aug.
PROPOSED LAND USE, 1965 - 1 967
Acres
Sep.
Year Crop or Crops Est. acreage/No. trees
1965
1 966
1 967
LIVESTOCK
Type Number
6 7
Oct. Nov. Dec. Total
Other Development
Purpose

II. LAND USE
COCOA
Year Ac. cleared Ac. shaded Ac. planted
S. M. - spacing Area cocoa planted on former forest land: Area cocoa planted on former grassland: Est. area cocoa when plantation fully developed:
OTHER TREE CROPS
Year Ac. cleared Trees planted/ A..£.res_filanted
ANNUAL CROPS (for plantation consumption or sale)
Year Crop/Crops Acreage
6 8
S . M. Ac. bearing
Trees bearing/ Acres beariq
Purpose
- ·-
Yield (tons)
(State year)
S. M. Yield (tons)
Production
-

Total on Plantation:
INDENTURED LABOUR
Place of Origin (Sub-District)
CASUAL LABOUR
Place of Origin
NATIVE LABOUR
( 1 ) Indentured • • • • • • • • • • • • • • • • • • • • • • • • • •
(2) Casual • • • • • • • • • • • • • • • • • • • • • • • • • • • • • •
Number Date of Arrival (month , year)
Where resident Period
Recruiting cost per capita
Freq. (village) Number (village pltn. ) Occ. Employment Employment Wages
SPECIAL OCCUPATIONS
Occupation Place of Origin Salary Period Employed
Overseer
Mechanic
Driver
Carpenter
Domestic
6 9
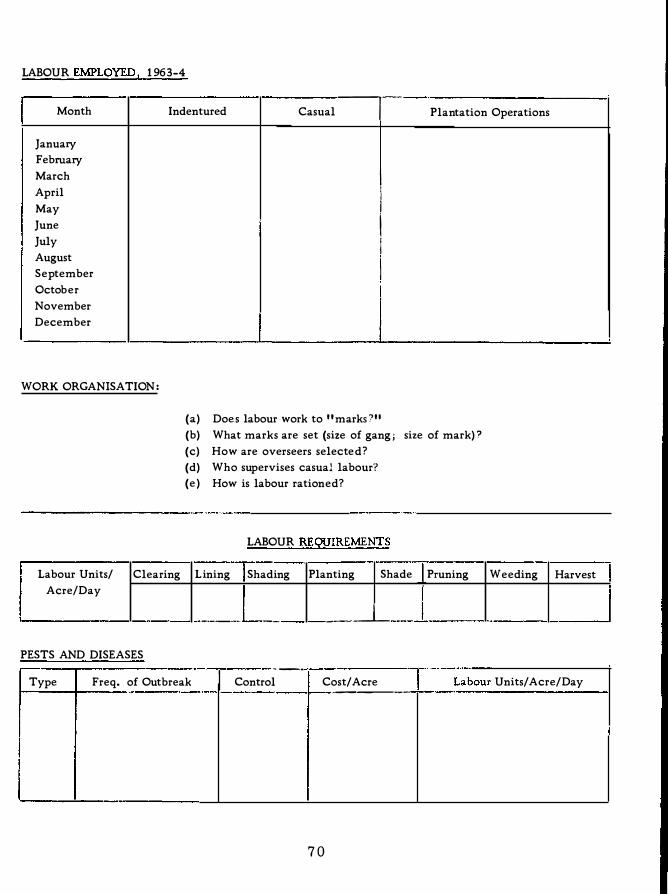
I
I
LABOUR EMPLOYED, 1 963-4
Month Indentured Casual,--Plantation Operations
January February March April May June July August September October November December
WORK ORGANISATION:
I I I
I I l I I
I I
(a) Does labour work to 1 1marks ?1 1 (b) What marks are set (size of gang ; size of mark) ? (c) How are overseers selected? (d) Who supervises casual labour'? ( e ) How is labour rationed?
-------------·- ··-·-·--·
LABOUR REQUIREMENTS
Labour Units/ Clearing Lining Shading Planting Shade J Pruning Acre/Day
I _______ ...__ __ __ _ _J_ ·-
PESTS AND DISEASES
Weeding Harvest
.
-··--,------··· - --- ,.----··--Type Freq. of Outbreak Control Cost/Acre
- --1 I-·-·---· ---_____ T·---�a�:: Units/ Acre/Day
7 0
I

PROPERTY
Item Type When Purchased/
Constructed Original Cost Est. Life
House (+ furniture)
Labour quarters I I I
Other structures ;
! (specify)
Vehicles
Tools
I Machinery
Roads
Other
SOURCES OF INCOME
Source Owner/Manager Wife Amount
S. s. Loan
Employment outside plantation
Trade stores
Cocoa
Other crops
Other
7 1

EXPENDITURE
Item Ann. Expenditure Item Ann. Expenditure I-· --·-
Maintenance on:
( 1 ) House Labour
l (2) Labour Stores (seed, insecticides)
quarters Land rental I (3) Otherbldgs.
I
' Insurance I I

§ 1 st. yea r's planting
Im 2nd.yea r's planti ng
D . 3rd.yea r's pla nting
jjl 4thyear's plantin9 Ill Sth.year:S planti n 9
G rassland
1.. o'? G'o�
">$�
. . . . . . . . . . . . ·
· · · · . . . . .
.
. . . . . . . . . . . 1958 '-' 59' : . . . . . . . . . . .
100 .......... �o- 100 330 � yards
Gardens . . . . . . . . . . . . . . . · · · · · · · . . . . . . . . . . . . . . . . . , . . . . . . . . . . . . . . . . . . . . . . . . . . . . . . . . . . . . . . . . . . . . . . . . . . . . · · · · · · . .
: : : : : : : : : : : : :�) · · · · · · · · · · · · · . . . . . . . . . . . . . ' l2!iif:il /, 1962 - 63� . · · · · · · · · · · · · . . . . . . . . . . . . . . . . . . . . . .. . . . . · · · · · · . . . . . . . Gardens
-.....
· · · · · · · · · · · · · :!'1960 - 1.i �: : : : : : : : : : : :
: 1 gss -ss· : : . . . . . . . . . . . . . · · · · · · · · . . . · · · · · · · ·
· · · · · G' . . . . . . . . . . . . .
�o� .. I . . . . . . . . . . . . . 195 7 - 58 � ����= : � � � � � � �
:.: t--1957 - 58
� � i1 : ::� : : : : : . ll : : : : : : � B. Single . . . . . · . · · · .:..;
� Grassland �auart;m�ITYTT I .....,�
· · · · · · · · · · · G.L _:: · ·
· · · · · · · · · · Fe.rmenta� · : : : : : : : : : : '.:!'.'.. M 9G'-"o�c� ...:! • • : : : r� :%Po "'
Trade ...;;::: ndetta Store -....

§ 1 st. year's plantin9
� 2nd.year's planting
r:-:-1 t..:.:.:J 3rd.year's planting
Forest
100 0 100 200
yard s

148°
8"'35'S. .. -'\_,
' '
'
, - - ' - - ' ' '
·' ,
, '
' ,
,
,
He/n/cote Bvy
148.020' p
0
A c
C E A
,F / c
N
POPONDETTA LOCAT I O N
D I ST R I CT M A P
0 I 2 3 4
m iles
---
5
M;;ain Roads Access Road�
Popondetta
Plantations
Council Boundary � C::2J Privately owne.d • Ex- servicemen's scheme
� Land leilse:d to Papuan1>
