new growth from enterprise systems - harris and davenport
TRANSCRIPT

Jeanne G. Harris and Thomas H. Davenport
New Growth from Enterprise Systems:Achieving High Performance through Distinctive Capabilities

DefinitionsEnterprise systemAn enterprise system is an integratedsoftware package (from vendors such asSAP and Oracle) that addresses most ofan organization's day-to-day transactionaldata-processing needs. Supported by acommon database, individual applicationsare chosen and configured to tailor thesoftware to the requirements of theenterprise. Applications typically include:accounting and finance, business intelli-gence and data warehousing, customerrelationship management, human resour-ces management, manufacturing, procure-ment, product life cycle management,sales and distribution, supplier relationshipmanagement and supply chain manage-ment. Industry-specific modules, such as claims management for the insuranceindustry, help companies take greateradvantage of system capabilities.
High-performance businessHigh-performance businesses substantiallyand consistently outperform their com-petitors over the long-term, and overeconomic and industry cycles and gener-ations of leadership.
Top and low performersFor the purposes of this study, top andlow performers were defined by askingrespondents to assess their standing—ona scale of one to five—in their industry relative to profit, shareholder return andrevenue growth. We found that theseself-reported performance measures werehighly correlated with the organization’scompounded average growth in revenuesand profits. Top performers scored a 14or higher (out of a possible 15 points);13 percent of the sample scored at thislevel. Low performers scored eight orfewer points and represented 16 percentof the sample. We excluded governmentrespondents because government agen-cies could not be evaluated using thesecriteria.
Distinctive capabilitiesDistinctive capabilities are integratedbusiness processes and capabilities thattogether serve customers in ways that aredifferentiated from competitors and thatcreate an organization's formula forbusiness success.
Table of contents2 Overall findings
2 Key findings for top performers
3 Introduction: New growthfrom enterprise systems
4 Enterprise systems and business value
12 Enterprise systems and distinctive capabilities
18 Enterprise systems and analytics
22 Future directions
26 Tending the garden
27 About the research
28 About the authors
28 Acknowledgements
29 Appendix
31 Industry and geographic variation in the survey findings
32 Part I. Cross-industry analysis
44 Part II. Industry snapshots
46 Part III. Geographic variationin industry findings
58 Part IV Regional snapshots

2
Key findings for top performersOrganizations with superior financialperformance:
1. Realize much more value from theirenterprise systems and use them in distinctly different ways.
2. Are more likely to seek (and measureprogress against) tangible benefits suchas reduced costs and increased revenue.
3. Place a stronger emphasis on threecritical factors for driving improved busi-ness value from enterprise systems: inte-grating the organization, optimizing busi-ness processes, and using and analyzingsystem data to improve decision making.
4. Extend their enterprise systemsthroughout their organizations, imple-menting modules across a broad range of business functions.
5. Integrate their organizations more thoroughly than low performers, and are far more likely to have moderate-to-significant integration with the externalsystems of customers and suppliers.
6. Aggressively use information and analytics to improve decision making and business performance.
7. Approach an enterprise system morestrategically than low performers; theyare more likely to view their enterprisesystem as very distinctive from those oftheir competitors.
Overall findings 1. There are clear winners and losers—somecompanies get considerably more valuefrom their enterprise systems than others.
2. To achieve the full value of an enterprisesystem, organizations must focus on inte-grating the organization, optimizing busi-ness processes and using and analyzingsystem data to improve decision making.
3. While organizations have made progressin realizing value from their enterprisesystems, most still have significant oppor-tunities to maximize the value of theirinvestments.
8. Are more likely to extensively tailorstrategic components of their systems tocreate and sustain a competitive advan-tage; they also aggressively simplify andstandardize other areas of their business,permitting few modifications. Top per-formers have fewer enterprise systeminstances than the overall sample.
9. Are more likely to have implemented—or to plan to implement—industry-specificmodules as a way of differentiating theirsystems.
10. Top performers are more than twiceas likely to plan to take advantage of thespeed, flexibility and productivity benefitsof service oriented architecture and Webservices.
4. Organizations that approach an enter-prise system initiative as an element ofan ongoing program rather than a projectwith a specific endpoint, believe they aremore successful.
5. Better decision making is the most-sought benefit and also the one mostlikely to have been realized from the useof an enterprise system.
3
New growth from enterprise systemsOver the past decade, many organizationsplanted expensive seeds in the expectationof growing an entirely new informationtechnology capability. At great cost, theyreplaced a scattered array of technologyapplications with integrated enterprisesystems that were designed to bring awide variety of business benefits. But thehoped-for results did not appear immedi-ately, and critics were quick to label theinvestments as purely infrastructural orthe equivalent of adding a commoditysuch as electricity—in other words, inca-pable of providing any degree of competi-tive advantage.
Today, however, the environment haschanged. Accenture's latest research hasfound that the seeds planted by organiza-tions when they first implemented enter-prise systems are bearing fruit. Enterprisesystems are now helping organizationsachieve high performance. Of course, noteveryone achieves benefits equally. As wefound in our previous study in 2002, someorganizations reap considerably greaterbenefits than others. While most organi-zations received benefits, Accenture’s newstudy discovered that top performers(those who scored highest on three meas-ures of financial performance—profit,shareholder return and revenue growth—relative to their industry) harvested con-siderably greater business value than lowperformers. We found that top performerstook a distinctly different approach toimplementing and leveraging their enter-prise systems. For example, the research
indicates that top performers are morelikely to be using their systems to improvefinancial management, cut costs andincrease revenue.
When implemented and managed prop-erly, enterprise systems lead to higherlevels of financial performance. They arealso making major contributions to organ-izations’ ability to develop and hone dis-tinctive capabilities, a key component ofhigh performance. Enterprise systems mayhave been late bloomers, but their usefor competitive differentiation representsa full flowering of IT value.
These insights arise from a new study oforganizations with enterprise systems con-ducted by the Accenture Institute for HighPerformance Business over a 12-monthperiod in 2005 and 2006. (See “About theResearch.”) Building on insights from arelated survey conducted in 2002, we havediscovered how organizations are usingtheir systems to create new business value,to build the distinctive capabilities thatcan generate competitive advantage andto develop analytics—important tools thatallow executives to make better decisions.When it comes to enterprise systems,organizations reap what they sow.Although some that neglected to properlytend their systems have had some disap-pointing harvests, those organizationsthat invested the time and resources tonurture their systems will enjoy abun-dant benefits.
4
Enterprise systems and business value
4%
7%
12%
17%
17%
22%
24%
24%
33%
41%
46%
53%Better management decision making
Improved financial management
Faster, more accurate transactions
Cost reductionImproved inventory and asset management (reduced inventory, etc.)
Ease of expansion/growth and increased flexibility
Cycle time reduction
Headcount reduction
Improved customer service and retention
Competitive advantage through distinctive capabilities
Fewer physical resources (trucks, warehouses, etc.) and improved logistics
Increased revenue
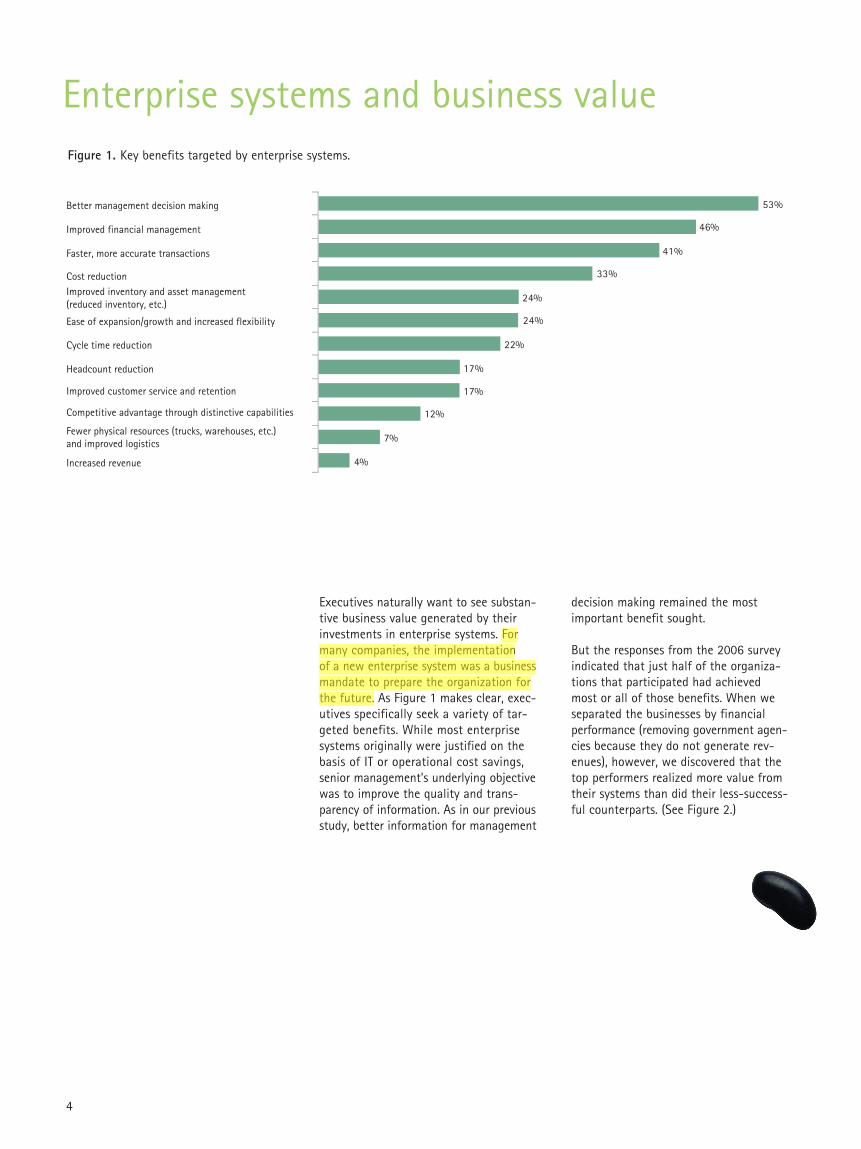
Figure 1. Key benefits targeted by enterprise systems.
Executives naturally want to see substan-tive business value generated by theirinvestments in enterprise systems. Formany companies, the implementation of a new enterprise system was a businessmandate to prepare the organization forthe future. As Figure 1 makes clear, exec-utives specifically seek a variety of tar-geted benefits. While most enterprisesystems originally were justified on thebasis of IT or operational cost savings,senior management's underlying objectivewas to improve the quality and trans-parency of information. As in our previousstudy, better information for management
decision making remained the mostimportant benefit sought.
But the responses from the 2006 surveyindicated that just half of the organiza-tions that participated had achievedmost or all of those benefits. When we separated the businesses by financialperformance (removing government agen-cies because they do not generate rev-enues), however, we discovered that thetop performers realized more value fromtheir systems than did their less-success-ful counterparts. (See Figure 2.)
5
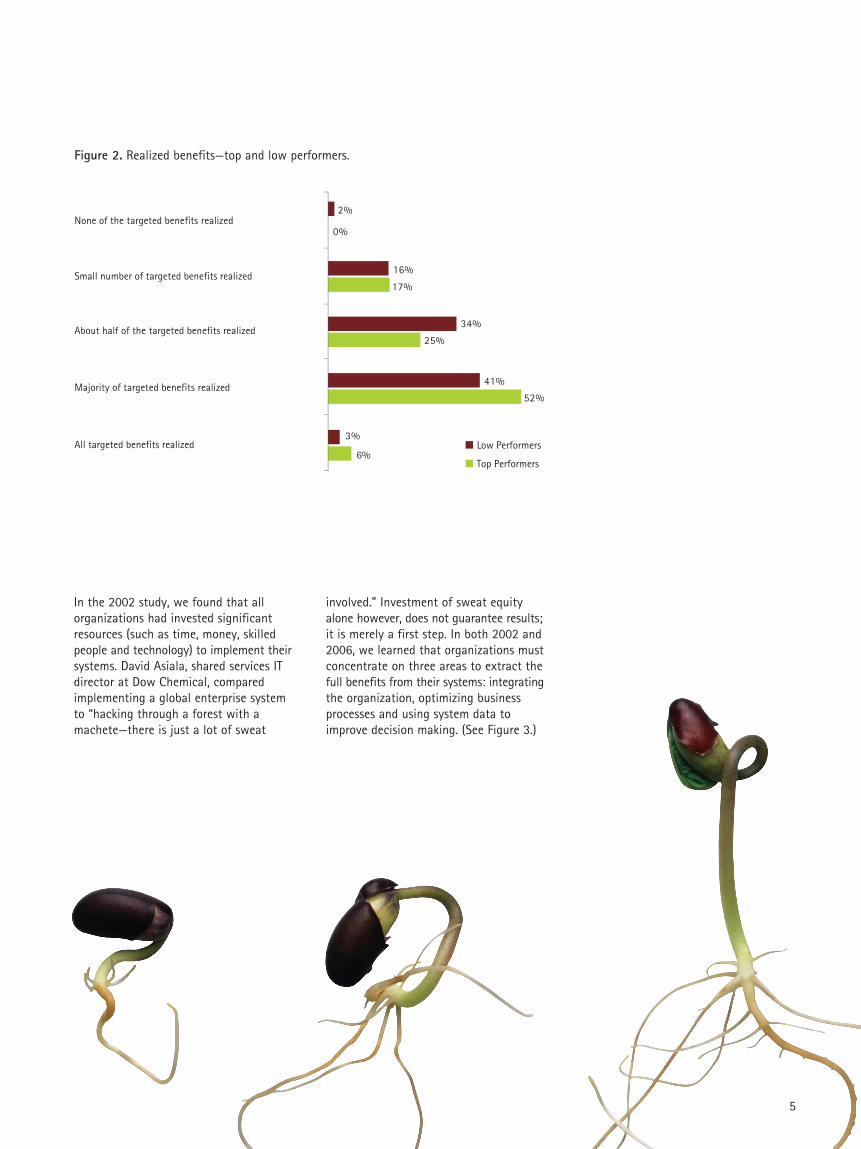
In the 2002 study, we found that allorganizations had invested significantresources (such as time, money, skilledpeople and technology) to implement theirsystems. David Asiala, shared services ITdirector at Dow Chemical, comparedimplementing a global enterprise systemto “hacking through a forest with amachete—there is just a lot of sweat
6%
52%
25%
17%
0%
3%
41%
34%
16%
2%
Top Performers
Low Performers
None of the targeted benefits realized
Small number of targeted benefits realized
About half of the targeted benefits realized
Majority of targeted benefits realized
All targeted benefits realized
Figure 2. Realized benefits—top and low performers.
involved.” Investment of sweat equityalone however, does not guarantee results;it is merely a first step. In both 2002 and2006, we learned that organizations mustconcentrate on three areas to extract thefull benefits from their systems: integratingthe organization, optimizing businessprocesses and using system data toimprove decision making. (See Figure 3.)

6
Prerequisites Value drivers
Integrate
Benefits realizedOptimize
Analyze
Invest in enterprise systems
Implement extensively
Experience using enterprise systems
Figure 3. Key factors driving realization of enterprise systems value.
7
Results from Accenture’s new surveyrevealed that financially successfulorganizations are more likely than thosewith poor financial performance to engagein practices that contribute to businessvalue. In contrast to low performers, topperformers are also more likely to imple-ment their systems widely throughout theentire organization. They also are morelikely to use enterprise systems to inte-grate the organization, optimize processes,and use data and analytics to help improvedecision making. Top performers are alsomore likely to get the most out of thesevalue drivers by consolidating (havingfewer instances of the same type of systemthroughout the organization), by regularlymeasuring the benefits, and by establish-ing clear metrics and accountability.
According to the executives we inter-viewed, a critical aspect of success is sen-ior management’s commitment to a majorbusiness change program—not just atechnical implementation. “Unless you’vegot that absolute top-down commitment,don’t waste your time,” commented KenGreatbatch, chief financial officer of AZElectronic Materials.
Focusing on business performance fromthe outset made it easier to achieveresults. As Robin Dargue, chief informationofficer at Diageo, the global spirits man-ufacturer observed, “It’s critical your solu-tion is focused on delivering business per-formance and what the organization needsto operate. Many fall into the trap ofimplementing enterprise systems as an ITproject. We work very hard to ensure anynew enterprise system initiative is tied tobusiness outcomes such as an acquisition/disposal or strategic business program.”
Executives whose companies chose tostandardize their systems and processesglobally acknowledged that there were
initial challenges. “It [implementing anenterprise system] was the hardestapproach because it really went againstcorporate culture,” acknowledged oneconsumer products executive. At ShellExploration and Production InternationalDV, executives had a greater appetite foradditional change and standardizationonce they began to derive tangible bene-fits from a single, global platform. Shell’ssolution manager David Lee explained,“Once we had a global organization withglobal processes, our scope changed. We now have a mandate to standardizeand create commonality throughout theorganization.”
Executives who put the standardizationeffort front and center reported that theirorganizations enjoyed major cost savingsalong with greater transparency andflexibility. They also avoided the mainte-nance and costs they would have incurredif they had had to consolidate their sys-tems after the fact. Several organizationsnoted that their enterprise system accel-erated the integration of new acquisitions.
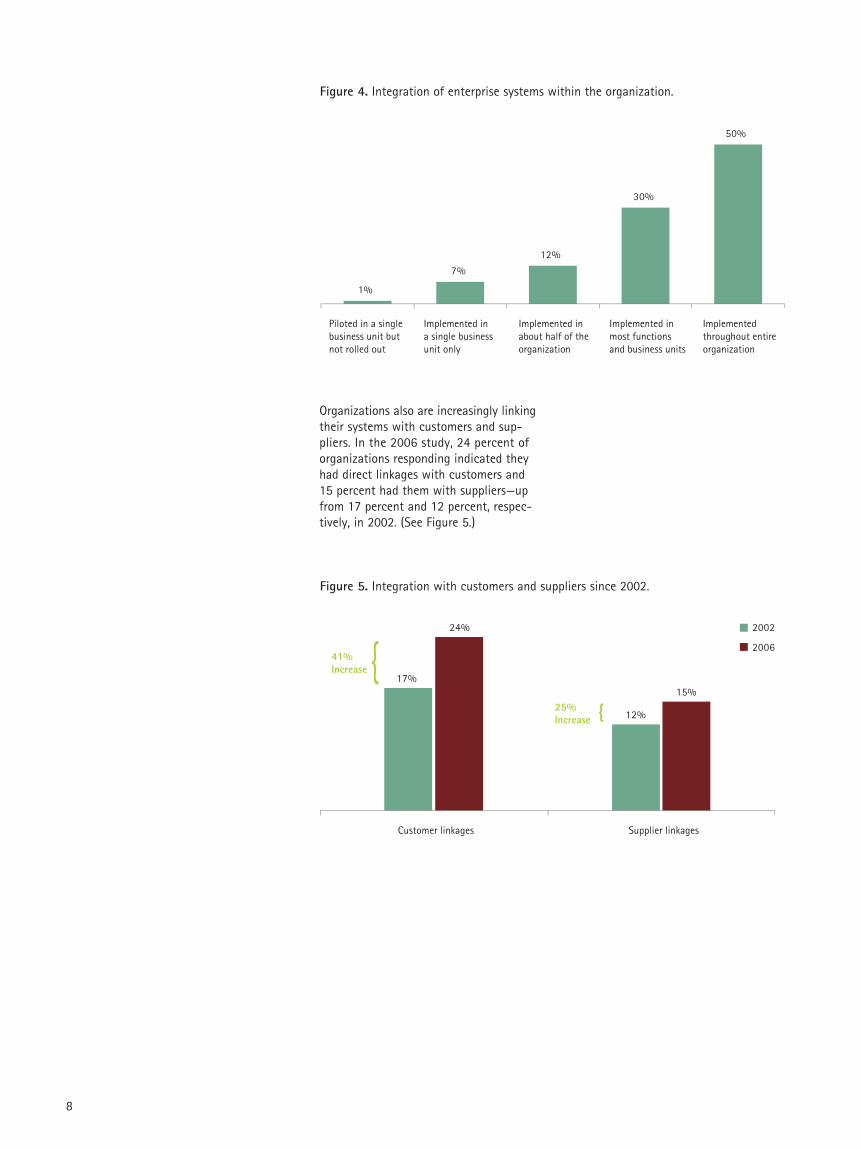
Many organizations are making signifi-cant advances in the way they managethe key value drivers. (See Figure 4.) Onintegration, for example, the number oforganizations with a broadly integratedenterprise system is up from 18 percentin 2002 to 24 percent in 2006. The per-centage of organizations saying thatthey have implemented their enterprisesystems throughout all or most businessunits and functions has risen from 69percent to 80 percent—further evidenceof integration.
Among top performers, 37 percent had asingle global instance of an enterprisesystem and had fully integrated internalapplications; for low performers, the figurewas 25 percent.
“We work very hard to make sure any new enterprise systems initiative is tied to amajor business event such as an acquisition or strategic program.”
8
1%
7%
12%
30%
50%
Piloted in a single business unit but not rolled out
Implemented in a single business unit only
Implemented in about half of the organization
Implemented in most functions and business units
Implemented throughout entire organization
Figure 4. Integration of enterprise systems within the organization.
Customer linkages Supplier linkages
17%
41%Increase
25%Increase 12%
24%
15%
2002
2006{{
Figure 5. Integration with customers and suppliers since 2002.
Organizations also are increasingly linkingtheir systems with customers and sup-pliers. In the 2006 study, 24 percent oforganizations responding indicated theyhad direct linkages with customers and15 percent had them with suppliers—upfrom 17 percent and 12 percent, respec-tively, in 2002. (See Figure 5.)
9
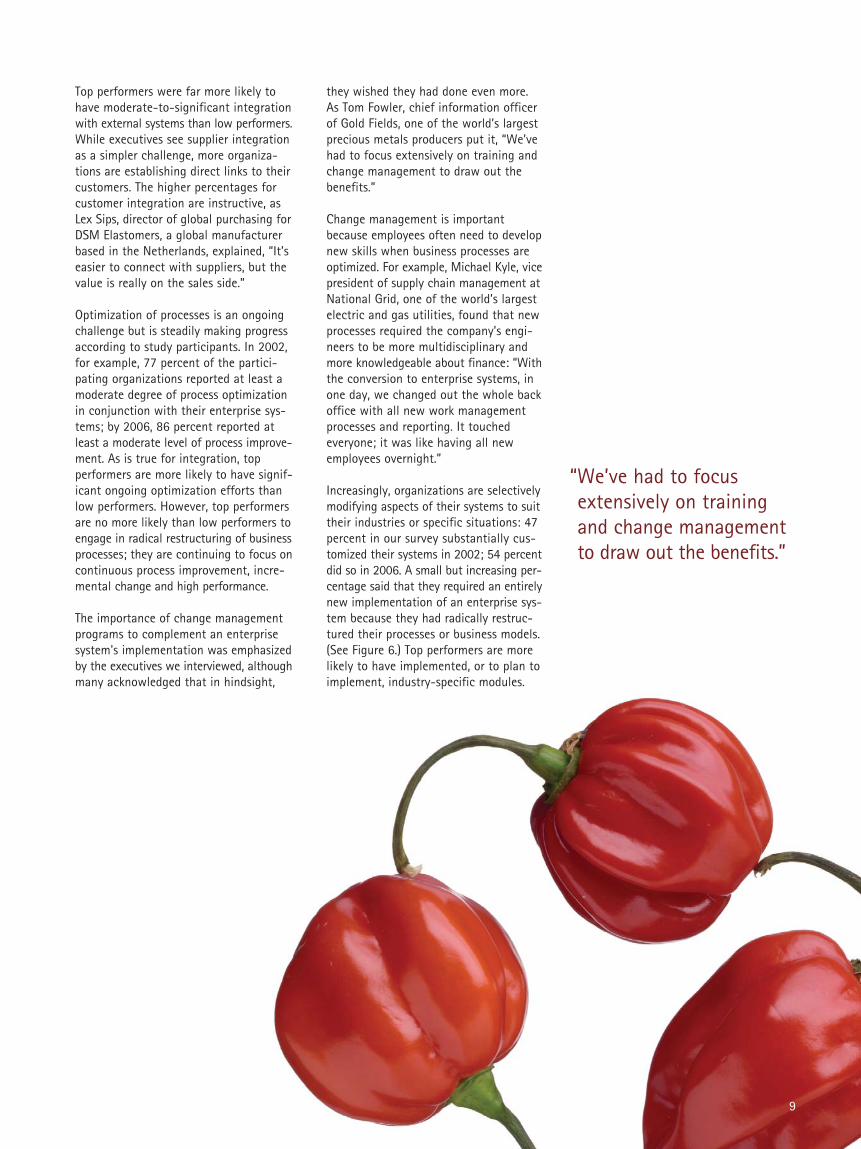
they wished they had done even more.As Tom Fowler, chief information officerof Gold Fields, one of the world’s largestprecious metals producers put it, “We’vehad to focus extensively on training andchange management to draw out thebenefits.”
Change management is importantbecause employees often need to developnew skills when business processes areoptimized. For example, Michael Kyle, vicepresident of supply chain management atNational Grid, one of the world’s largestelectric and gas utilities, found that newprocesses required the company’s engi-neers to be more multidisciplinary andmore knowledgeable about finance: “Withthe conversion to enterprise systems, inone day, we changed out the whole backoffice with all new work managementprocesses and reporting. It touchedeveryone; it was like having all newemployees overnight.”
Increasingly, organizations are selectivelymodifying aspects of their systems to suittheir industries or specific situations: 47percent in our survey substantially cus-tomized their systems in 2002; 54 percentdid so in 2006. A small but increasing per-centage said that they required an entirelynew implementation of an enterprise sys-tem because they had radically restruc-tured their processes or business models.(See Figure 6.) Top performers are morelikely to have implemented, or to plan toimplement, industry-specific modules.
Top performers were far more likely tohave moderate-to-significant integrationwith external systems than low performers.While executives see supplier integrationas a simpler challenge, more organiza-tions are establishing direct links to their customers. The higher percentages forcustomer integration are instructive, asLex Sips, director of global purchasing forDSM Elastomers, a global manufacturerbased in the Netherlands, explained, “It’seasier to connect with suppliers, but thevalue is really on the sales side.”
Optimization of processes is an ongoingchallenge but is steadily making progressaccording to study participants. In 2002,for example, 77 percent of the partici-pating organizations reported at least amoderate degree of process optimizationin conjunction with their enterprise sys-tems; by 2006, 86 percent reported atleast a moderate level of process improve-ment. As is true for integration, top performers are more likely to have signif-icant ongoing optimization efforts thanlow performers. However, top performersare no more likely than low performers toengage in radical restructuring of businessprocesses; they are continuing to focus oncontinuous process improvement, incre-mental change and high performance.
The importance of change managementprograms to complement an enterprisesystem's implementation was emphasizedby the executives we interviewed, althoughmany acknowledged that in hindsight,
“We’ve had to focusextensively on trainingand change managementto draw out the benefits.”
10
1%
13%
45%
37%
4%
No effort to optimize processes
Some limited adap- tation of businessprocesses to match enterprise system software capabilities
Moderate amount of adaptation and optimization of business processes
Significant ongoing optimization efforts, requiring fundamen- tal business process change and modifi- cation to enterprise systems
Radical restructuring of business processes and business model required a new implementation of enterprise systems
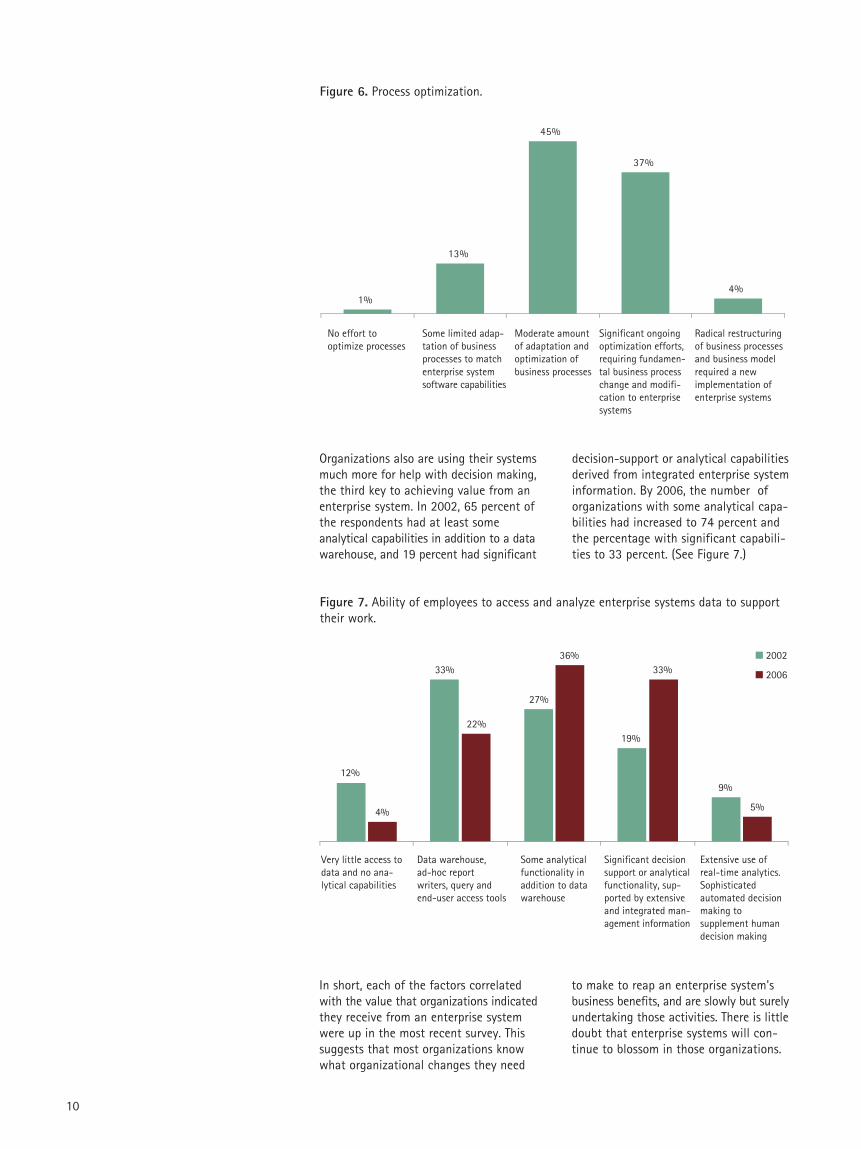
Figure 6. Process optimization.
Very little access to data and no ana-lytical capabilities
Data warehouse, ad-hoc report writers, query and end-user access tools
Some analytical functionality in addition to data warehouse
Significant decision support or analytical functionality, sup- ported by extensive and integrated man- agement information
Extensive use of real-time analytics. Sophisticated automated decisionmaking to supplement human decision making
12%
33%
27%
19%
9%
4%
22%
36%33%
5%
2002
2006
Figure 7. Ability of employees to access and analyze enterprise systems data to support their work.
Organizations also are using their systemsmuch more for help with decision making,the third key to achieving value from anenterprise system. In 2002, 65 percent ofthe respondents had at least some analytical capabilities in addition to a datawarehouse, and 19 percent had significant
In short, each of the factors correlatedwith the value that organizations indicatedthey receive from an enterprise systemwere up in the most recent survey. Thissuggests that most organizations knowwhat organizational changes they need
decision-support or analytical capabilitiesderived from integrated enterprise systeminformation. By 2006, the number oforganizations with some analytical capa-bilities had increased to 74 percent andthe percentage with significant capabili-ties to 33 percent. (See Figure 7.)
to make to reap an enterprise system'sbusiness benefits, and are slowly but surelyundertaking those activities. There is littledoubt that enterprise systems will con-tinue to blossom in those organizations.

11
12
Enterprise systems and distinctive capabilities Accenture's continuing research on howorganizations achieve high performancefound that one of the three essentialbuilding blocks is an ability to create dis-tinctive capabilities—the ongoing activitiesand processes that are differentiated fromcompetitors and that create an organiza-tion’s formula for business success. Frominterviews with senior executives welearned that some organizations are begin-ning to use enterprise systems to supportnot just undifferentiated processes andcapabilities, but also distinctive capabili-ties and business models.
The 2006 survey results revealed, in fact,that the stereotype of commoditizedenterprise systems applications is nowobsolete. What was once derided asgeneric IT is today contributing to com-petitive advantage and high performance.As noted in Figure 1, while only 12 percentof executives set gaining a “competitiveadvantage through distinctive capabilities”as a major objective initially, 53 percentnow credit their enterprise systems withcontributing to their organizations' dis-tinctive capabilities either substantiallyor to a very large extent. (See Figure 8.)

13
14
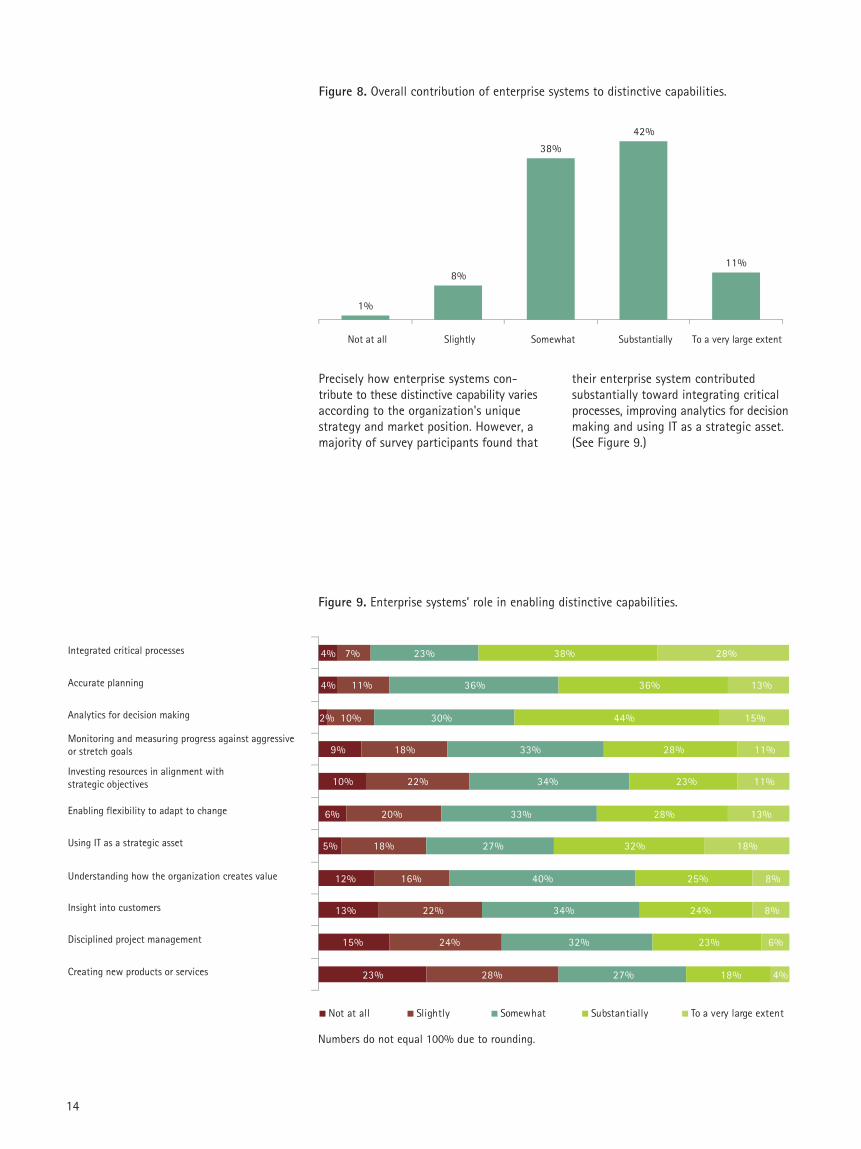
1%
8%
38%
42%
11%
Not at all Slightly Somewhat Substantially To a very large extent
Figure 8. Overall contribution of enterprise systems to distinctive capabilities.
Precisely how enterprise systems con-tribute to these distinctive capability variesaccording to the organization's uniquestrategy and market position. However, amajority of survey participants found that
Figure 9. Enterprise systems’ role in enabling distinctive capabilities.
Integrated critical processes
Not at all Slightly Somewhat Substantially To a very large extent
Accurate planning
Analytics for decision making
Investing resources in alignment with strategic objectives
Enabling flexibility to adapt to change
Using IT as a strategic asset
Understanding how the organization creates value
Insight into customers
Disciplined project management
Creating new products or services
Monitoring and measuring progress against aggressive or stretch goals
23%
15%
13%
12%
5%
6%
10%
9%
2%
4%
4%
28%
24%
22%
16%
18%
20%
22%
18%
10%
11%
7%
27%
32%
34%
40%
27%
33%
34%
33%
30%
36%
23%
18%
23%
24%
25%
32%
28%
23%
28%
44%
36%
38%
4%
6%
8%
8%
18%
13%
11%
11%
15%
13%
28%
their enterprise system contributed substantially toward integrating criticalprocesses, improving analytics for decisionmaking and using IT as a strategic asset.(See Figure 9.)
Numbers do not equal 100% due to rounding.
15
At Anglo Coal, a subsidiary of AngloAmerican, a global natural resourcescompany, its enterprise system was inte-grated to manage maintenance processesand to generate detailed information oncosts that helped the company executeits strategy as a low-cost producer.According to the company’s chief infor-mation officer Richard Weber, the strat-egy could not have been implementedeffectively without an enterprise system.DSM Elastomers' Lex Sips also creditedthe company's enterprise system forenabling its strategy of growth throughacquisition, saying, “The strategy couldnot have been executed without rapidintegration of acquired firms into a com-mon system platform.”
As we found in our first study in 2002,many organizations selectively customizetheir enterprise systems to enhance theirdistinctive capabilities. Top performersalso are twice as likely to view their enter-prise system as very distinctive from thoseof their competitors.
Top performers are careful to selectivelytailor their systems only when they willfurther enhance their distinctive capabili-ties. For example, CLP Power has one ofthe most complete and tightly integratedenterprise system implementations in itsindustry. The company prides itself onbeing highly disciplined and operationallyefficient. Director of IT Joe Locandro wasemphatic that “We won’t take a shotgunapproach.” Instead, CLP Power veryselectively tailors its systems to achievespecific strategic business objectives andleaves non-strategic processes to genericenterprise system support.
Similarly, the formula for business successfor data-storage giant EMC Corporationis outstanding product quality and cus-tomer service. One executive noted thatanything affecting these distinctivecapabilities receives close attention fromtop management. As Tony Pagliarulo, vicepresident of global IT at EMC, explained,“We only customize our systems when itwill significantly enhance our distinctivecapabilities. Where we have customized,
it's been fairly extensive. For example, togive the best possible customer service,we customized our enterprise systems toallow our products to “phone home” ifthere's a problem. Customer service repsare notified automatically and can takequick action to resolve issues.”
While top performers may selectively cus-tomize strategic applications to furthertheir distinctive capabilities, they contin-ually standardize and simplify everythingelse. Lex Sips of DSM Elastomers appliedthis principle to successfully move 30percent of the company’s European salesvolume to its e-business channel in oneyear. “We have a standard, corporate wideERP configuration, with very limited datacustomization and one standard process.Our enterprise system needs to be stan-dardized, foolproof and simple becauseonly then will customers use it. We simplyopt not to pursue certain business oppor-tunities or customers as a deliberate busi-ness decision. If non-strategic capabilitiesrequire too much complexity, we refer ourcustomers to third parties.”
Diageo’s CIO, Robin Dargue, shares hispassion for standardization and simplifi-cation: “By driving simplicity throughstandardization, eliminating legacy systemsand having common business processes,we can deliver consistent data and a sin-gle version of the truth.”
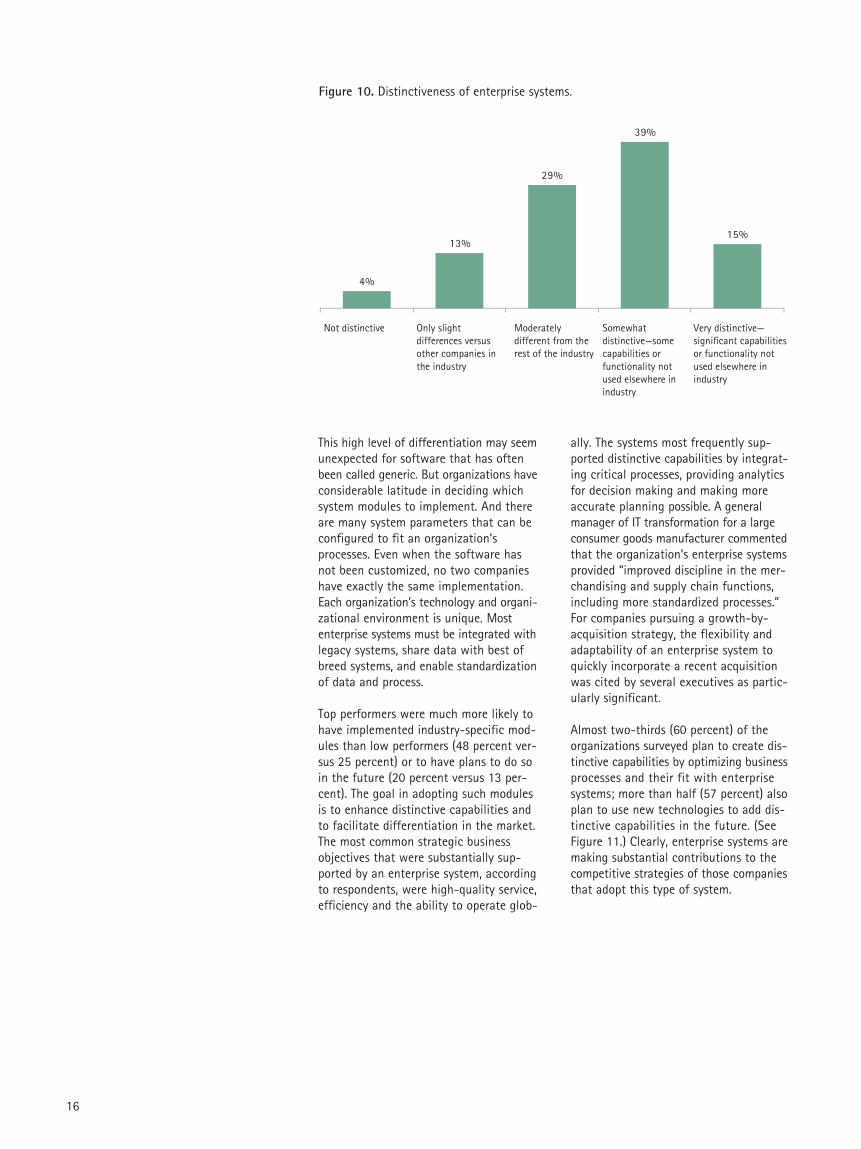
The contribution of enterprise systems to distinctive capabilities was furtheremphasized in other responses to the2006 survey. A vast majority—83 percent—of the respondents indicated that theircompany’s enterprise system was either moderately or very distinctive from thosein the rest of their industry. (See Figure10.) This is particularly true for the topperformers in our study, who were twiceas likely as low performers to view theirsystem as very distinctive from that oftheir competitors (21 percent versus 10percent). Distinctiveness came in manyforms, such as an ability to manage costsat the global level, integration through-out all global operations and visibility tothe production floor.
“The strategy could nothave been executed without rapid integrationof acquired firms into a common system platform.”
16
4%
13%
29%
39%
15%
Not distinctive Only slight differences versus other companies in the industry
Moderately different from the rest of the industry
Somewhat distinctive—some capabilities or functionality not used elsewhere in industry
Very distinctive—significant capabilities or functionality not used elsewhere in industry
Figure 10. Distinctiveness of enterprise systems.
This high level of differentiation may seemunexpected for software that has oftenbeen called generic. But organizations haveconsiderable latitude in deciding whichsystem modules to implement. And thereare many system parameters that can beconfigured to fit an organization’sprocesses. Even when the software hasnot been customized, no two companieshave exactly the same implementation.Each organization’s technology and organi-zational environment is unique. Mostenterprise systems must be integrated withlegacy systems, share data with best ofbreed systems, and enable standardizationof data and process.
Top performers were much more likely tohave implemented industry-specific mod-ules than low performers (48 percent ver-sus 25 percent) or to have plans to do soin the future (20 percent versus 13 per-cent). The goal in adopting such modulesis to enhance distinctive capabilities andto facilitate differentiation in the market.The most common strategic businessobjectives that were substantially sup-ported by an enterprise system, accordingto respondents, were high-quality service,efficiency and the ability to operate glob-
ally. The systems most frequently sup-ported distinctive capabilities by integrat-ing critical processes, providing analyticsfor decision making and making moreaccurate planning possible. A generalmanager of IT transformation for a largeconsumer goods manufacturer commentedthat the organization’s enterprise systemsprovided “improved discipline in the mer-chandising and supply chain functions,including more standardized processes.”For companies pursuing a growth-by-acquisition strategy, the flexibility andadaptability of an enterprise system toquickly incorporate a recent acquisitionwas cited by several executives as partic-ularly significant.
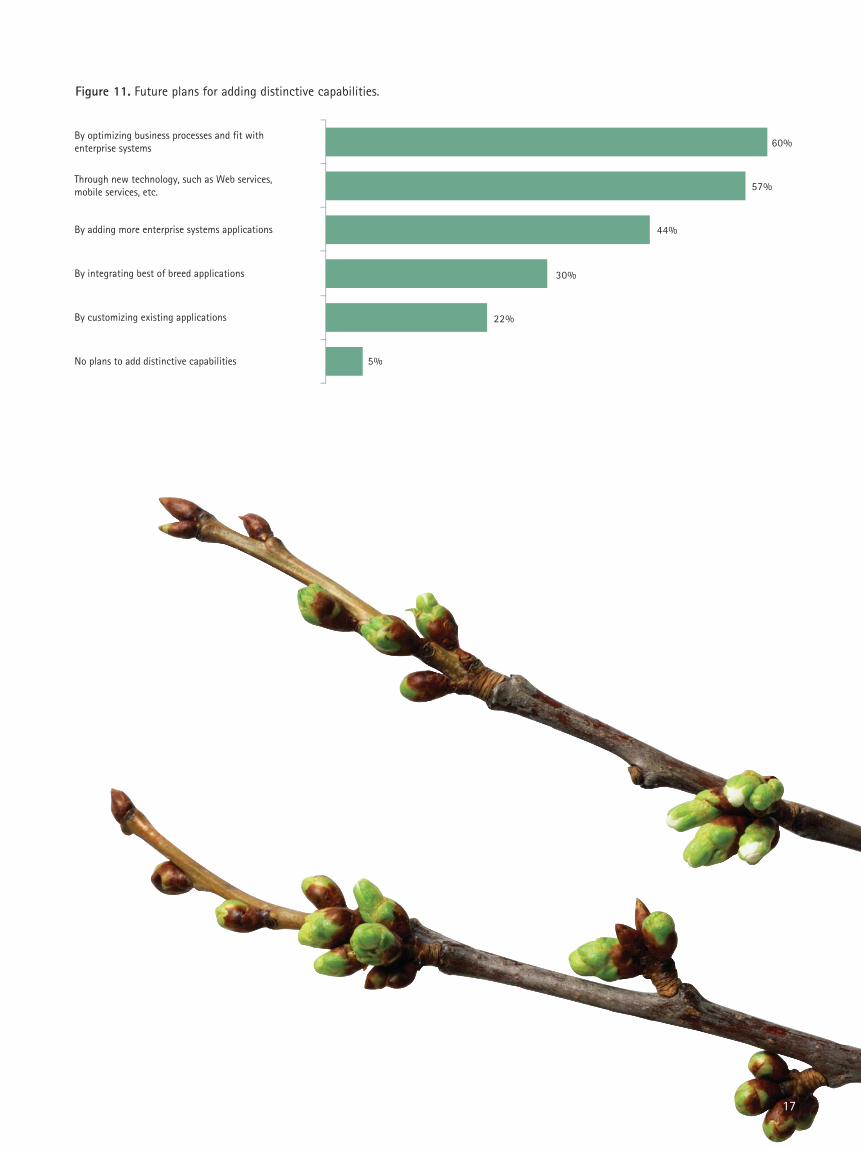
Almost two-thirds (60 percent) of theorganizations surveyed plan to create dis-tinctive capabilities by optimizing businessprocesses and their fit with enterprisesystems; more than half (57 percent) alsoplan to use new technologies to add dis-tinctive capabilities in the future. (SeeFigure 11.) Clearly, enterprise systems aremaking substantial contributions to thecompetitive strategies of those companiesthat adopt this type of system.
17
Figure 11. Future plans for adding distinctive capabilities.
5%
22%
30%
44%
57%
60%By optimizing business processes and fit withenterprise systems
Through new technology, such as Web services,mobile services, etc.
By adding more enterprise systems applications
By integrating best of breed applications
By customizing existing applications
No plans to add distinctive capabilities
18
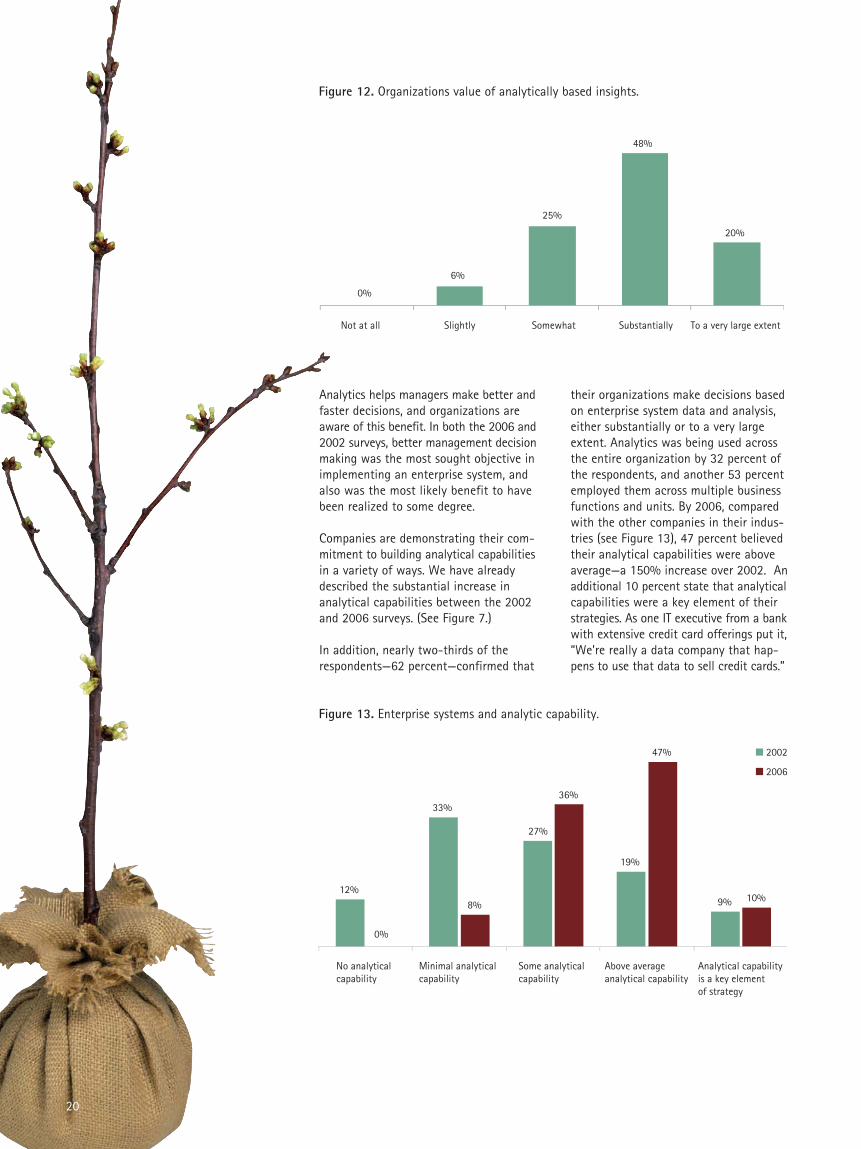
Enterprise systems and analytics Increasingly, organizations are becominginterested in using enterprise system datafor detailed analytics on their businesses.(See Figure 12.) Now that many companieshave implemented an enterprise system,they naturally are thinking about how touse the data they generate to managetheir businesses differently. That transitionis not immediate, however, as the vicepresident of a global technology companyexplained:
“Once we completed the implementation,people suddenly were exposed to a hugeamount of information they never hadbefore. That is when they began to payattention to the completeness and qualityof the information. Once our system hadbeen live for a year, we started getting a lot of people leveraging our data ware-house and asking a lot of questions.”

19
20
Not at all Slightly Somewhat Substantially To a very large extent
0%
6%
25%
48%
20%
Figure 12. Organizations value of analytically based insights.
Analytics helps managers make better andfaster decisions, and organizations areaware of this benefit. In both the 2006 and2002 surveys, better management decisionmaking was the most sought objective inimplementing an enterprise system, andalso was the most likely benefit to havebeen realized to some degree.
Companies are demonstrating their com-mitment to building analytical capabilitiesin a variety of ways. We have alreadydescribed the substantial increase inanalytical capabilities between the 2002and 2006 surveys. (See Figure 7.)
In addition, nearly two-thirds of therespondents—62 percent—confirmed that
their organizations make decisions basedon enterprise system data and analysis,either substantially or to a very largeextent. Analytics was being used acrossthe entire organization by 32 percent ofthe respondents, and another 53 percentemployed them across multiple businessfunctions and units. By 2006, comparedwith the other companies in their indus-tries (see Figure 13), 47 percent believedtheir analytical capabilities were aboveaverage—a 150% increase over 2002. Anadditional 10 percent state that analyticalcapabilities were a key element of theirstrategies. As one IT executive from a bankwith extensive credit card offerings put it,“We’re really a data company that hap-pens to use that data to sell credit cards.”
No analytical capability
Minimal analyticalcapability
Some analytical capability
Above average analytical capability
Analytical capability is a key element of strategy
12%
33%
27%
19%
9%
0%
8%
36%
47%
10%
2002
2006
Figure 13. Enterprise systems and analytic capability.
21
Having the best possible analytics soft-ware remains a priority for many—46 per-cent of the 2006 respondents. However,managers today are less likely than theywere in the past to assume that analyticsand business intelligence capabilities areprimarily a matter of having the right soft-ware and hardware technologies. Whenasked what factors drive success withanalytics, they were about equally likelyto attribute it to data, technology, andthe organization and processes of theircompanies. One CIO from the naturalresources extraction industry noted thatanalytical skills have been a primary focusin his company: “We’ve had a strong focuson training and developing people in theuse of information and analytics. Most ofour managers are analytically oriented, andthat helps a lot. Virtually all of our man-agers use our enterprise systems data andanalytics to help them make decisions.”
In terms of future plans, 29 percent planto implement business intelligence anddata warehouse capabilities over the nexttwo years (65 percent already have thosecapabilities). That is among the highestpercentages for any planned technologyimplementation in the survey.
In a variety of ways, high performance isassociated with more extensive andsophisticated use of analytical capabilities.One of strongest and most consistent dif-ferences between low and top perform-ers is in their analytical orientations. Forexample, 23 percent of low performersindicated they had significant decision-support or real-time analytical capabilitiesversus 65 percent of top performers. Only8 percent of low performers valued ana-lytical insights to a very large extent
versus 36 percent of top performers. One-third of the low performers had aboveaverage analytical capability within theirindustries, but 77 percent of top perform-ers did—and within these groups, 15 per-cent of the top performers indicated thathaving analytical capability was a key ele-ment of strategy, versus 3 percent for thelow performers. Low performers also wereless likely to have business intelligence ordata warehousing modules installed aspart of their enterprise systems, were lesslikely to make decisions substantially basedon enterprise system data and analysis,and were less likely to use analytics acrosstheir entire organizations.
While it is impossible to say definitivelythat extensive use of analytics and stronganalytical capabilities are causal factorsin creating high performance, the breadthand consistency of the associationsdescribed above would certainly suggestthe wisdom of an investment in analyticsfor any organization seeking to improveperformance.
Overall, there is little ambiguity in thefindings on the role of analytics withinenterprise systems. Better managementdecision making continues to be the most highly valued objective. The use of analytics with enterprise systems anddata is growing, both across and withinorganizations. Companies realize theimportance of analytical technologies, butthey are also focused on improving dataquality and on building organizational andprocess capabilities. Most strikingly, topperformers are much more likely to useand to value analytics in a wide varietyof ways than low performers.
“Virtually all of our managers use our enterprise systems dataand analytics to helpthem make decisions.”
22
Future directionsThe organizations in our survey are con-tinuing to expand their use of enterprisesystems. Top performers are more likelythan other organizations to have imple-mented modules in every category. Byimplementing enterprise systems broadlyand deeply, top performers realize bene-fits in more parts of their businesses.More importantly, extending enterprisesystem capabilities gives top performersmore complete and consistent information,thereby helping managers across the enterprise make better decisions.
Financially successful organizations ap-proach their systems as part of an ongoingprogram rather than as a project with a
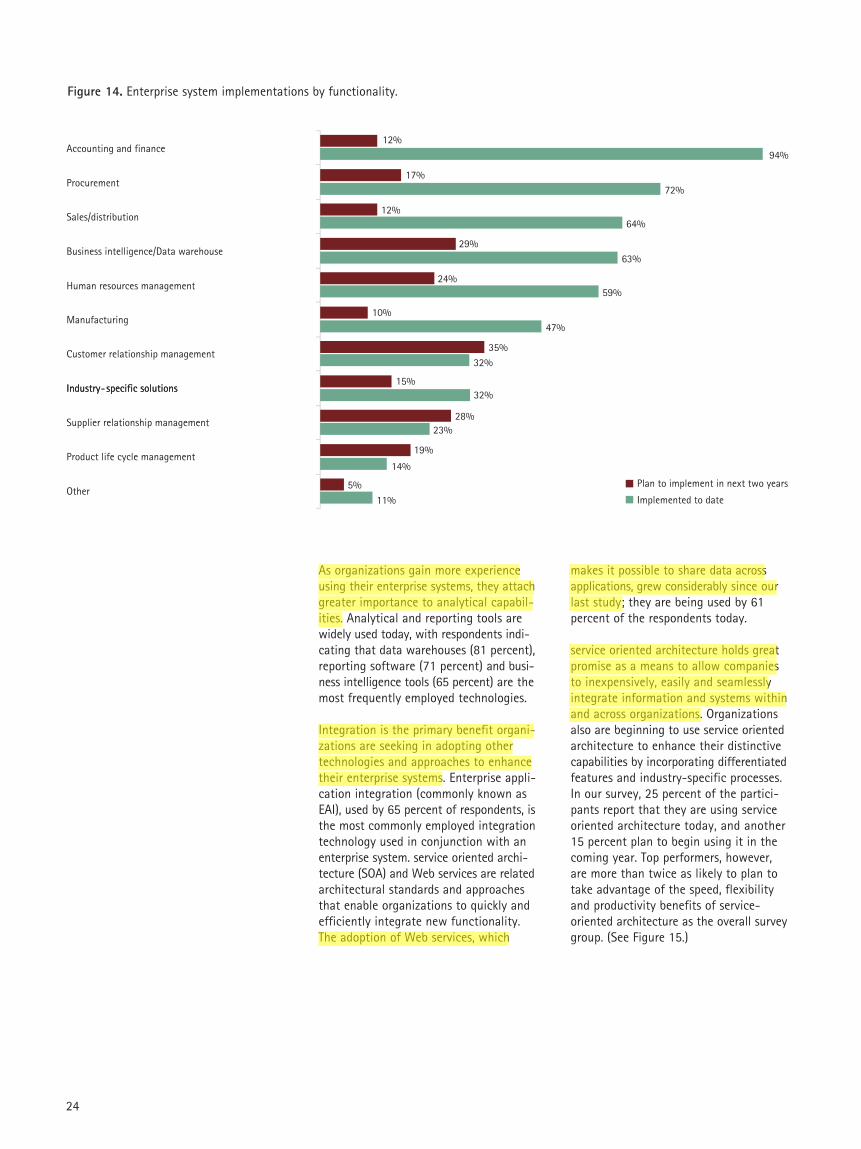
specified end point. Accenture’s 2006survey revealed that most organizationsplan to add more system functionalityover the next two years. (See Figure 14.)Interest is highest in expanding capabili-ties to build customer relationships, man-age the supply chain and enhance ana-lytical capabilities. As noted earlier, topperformers are more likely either to haveimplemented industry-specific modulesalready or to plan to implement them inthe next two years. However, most organi-zations in our study have not yet begunto implement industry-specific modulesand have no plans to do so, at least inthe next two years.

23
24
Figure 14. Enterprise system implementations by functionality.
11%
14%
23%
32%
32%
47%
59%
63%
64%
72%
94%
5%
19%
28%
15%
35%
10%
24%
29%
12%
17%
12%
Implemented to date
Plan to implement in next two years
Accounting and finance
Procurement
Sales/distribution
Business intelligence/Data warehouse
Human resources management
Manufacturing
Customer relationship management
Industry-specific solutions
Supplier relationship management
Product life cycle management
Other
Industry-specific solutions
As organizations gain more experienceusing their enterprise systems, they attachgreater importance to analytical capabil-ities. Analytical and reporting tools arewidely used today, with respondents indi-cating that data warehouses (81 percent),reporting software (71 percent) and busi-ness intelligence tools (65 percent) are themost frequently employed technologies.
Integration is the primary benefit organi-zations are seeking in adopting othertechnologies and approaches to enhancetheir enterprise systems. Enterprise appli-cation integration (commonly known asEAI), used by 65 percent of respondents, isthe most commonly employed integrationtechnology used in conjunction with anenterprise system. service oriented archi-tecture (SOA) and Web services are relatedarchitectural standards and approachesthat enable organizations to quickly andefficiently integrate new functionality.The adoption of Web services, which
makes it possible to share data acrossapplications, grew considerably since ourlast study; they are being used by 61percent of the respondents today.
service oriented architecture holds greatpromise as a means to allow companiesto inexpensively, easily and seamlesslyintegrate information and systems withinand across organizations. Organizationsalso are beginning to use service orientedarchitecture to enhance their distinctivecapabilities by incorporating differentiatedfeatures and industry-specific processes.In our survey, 25 percent of the partici-pants report that they are using serviceoriented architecture today, and another15 percent plan to begin using it in thecoming year. Top performers, however,are more than twice as likely to plan totake advantage of the speed, flexibilityand productivity benefits of service-oriented architecture as the overall surveygroup. (See Figure 15.)
25
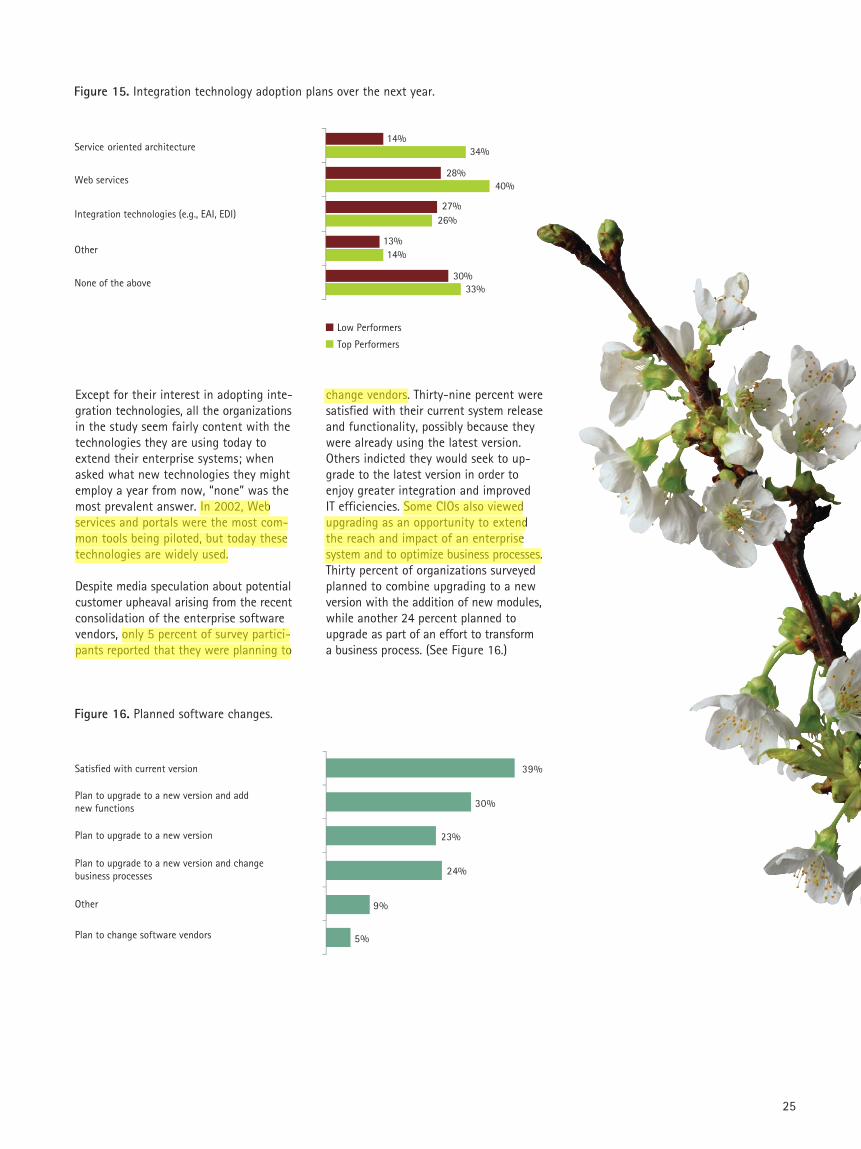
Figure 15. Integration technology adoption plans over the next year.
Except for their interest in adopting inte-gration technologies, all the organizationsin the study seem fairly content with thetechnologies they are using today toextend their enterprise systems; whenasked what new technologies they mightemploy a year from now, “none” was themost prevalent answer. In 2002, Webservices and portals were the most com-mon tools being piloted, but today thesetechnologies are widely used.
Despite media speculation about potentialcustomer upheaval arising from the recentconsolidation of the enterprise softwarevendors, only 5 percent of survey partici-pants reported that they were planning to
change vendors. Thirty-nine percent weresatisfied with their current system releaseand functionality, possibly because theywere already using the latest version.Others indicted they would seek to up-grade to the latest version in order toenjoy greater integration and improved IT efficiencies. Some CIOs also viewedupgrading as an opportunity to extendthe reach and impact of an enterprisesystem and to optimize business processes.Thirty percent of organizations surveyedplanned to combine upgrading to a newversion with the addition of new modules,while another 24 percent planned toupgrade as part of an effort to transform a business process. (See Figure 16.)
Figure 16. Planned software changes.
5%
9%
23%
24%
30%
39%Satisfied with current version
Plan to upgrade to a new version and add new functions
Plan to upgrade to a new version
Plan to upgrade to a new version and change business processes
Other
Plan to change software vendors
Low Performers
Top Performers
Service oriented architecture
Web services
Integration technologies (e.g., EAI, EDI)
Other
None of the above 33%
14%
26%
40%
34%
30%
13%
27%
28%
14%

26
Tending the gardenWhile the process of replacing old appli-cations with an enterprise system was adifficult one for many organizations, theirefforts are now bearing fruit. Many companies today show continued progresstoward achieving targeted benefits, inte-grating their organizations, optimizing keyprocesses and using better, more com-prehensive data to make fact-baseddecisions. These benefits are also yieldinga new crop of benefits in the form ofdistinctive capabilities that lead, in turn,to competitive advantage and high per-formance.
Like any garden, an enterprise systemrequires ongoing care. Sometimes wateringand fertilizing are called for; at othertimes, weeding and pruning are needed.Some pioneering companies patientlytended their systems and are enjoyingthe fruits of their labors, and today moreand more organizations are joining them.For those that planted seeds and werethen surprised when nothing sproutedimmediately, their steadfast gardening isnow being rewarded. Fortunately, springis never really that far away.
27
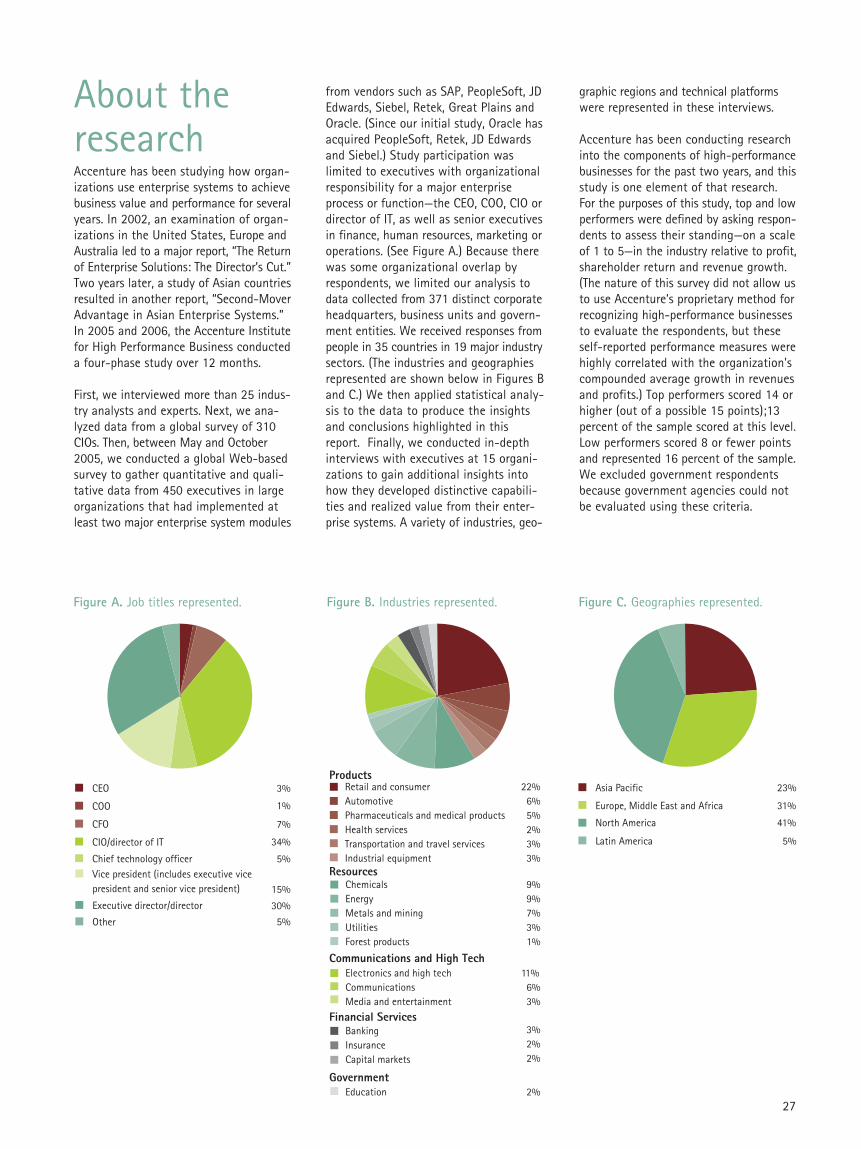
About theresearchAccenture has been studying how organ-izations use enterprise systems to achievebusiness value and performance for severalyears. In 2002, an examination of organ-izations in the United States, Europe andAustralia led to a major report, “The Returnof Enterprise Solutions: The Director’s Cut.”Two years later, a study of Asian countriesresulted in another report, “Second-MoverAdvantage in Asian Enterprise Systems.”In 2005 and 2006, the Accenture Institutefor High Performance Business conducteda four-phase study over 12 months.
First, we interviewed more than 25 indus-try analysts and experts. Next, we ana-lyzed data from a global survey of 310CIOs. Then, between May and October2005, we conducted a global Web-basedsurvey to gather quantitative and quali-tative data from 450 executives in largeorganizations that had implemented atleast two major enterprise system modules
from vendors such as SAP, PeopleSoft, JDEdwards, Siebel, Retek, Great Plains andOracle. (Since our initial study, Oracle hasacquired PeopleSoft, Retek, JD Edwardsand Siebel.) Study participation was limited to executives with organizationalresponsibility for a major enterpriseprocess or function—the CEO, COO, CIO ordirector of IT, as well as senior executivesin finance, human resources, marketing oroperations. (See Figure A.) Because therewas some organizational overlap byrespondents, we limited our analysis todata collected from 371 distinct corporateheadquarters, business units and govern-ment entities. We received responses frompeople in 35 countries in 19 major industrysectors. (The industries and geographiesrepresented are shown below in Figures Band C.) We then applied statistical analy-sis to the data to produce the insightsand conclusions highlighted in thisreport. Finally, we conducted in-depthinterviews with executives at 15 organi-zations to gain additional insights intohow they developed distinctive capabili-ties and realized value from their enter-prise systems. A variety of industries, geo-
graphic regions and technical platformswere represented in these interviews.
Accenture has been conducting researchinto the components of high-performancebusinesses for the past two years, and thisstudy is one element of that research.For the purposes of this study, top and lowperformers were defined by asking respon-dents to assess their standing—on a scaleof 1 to 5—in the industry relative to profit,shareholder return and revenue growth.(The nature of this survey did not allow usto use Accenture’s proprietary method forrecognizing high-performance businessesto evaluate the respondents, but theseself-reported performance measures werehighly correlated with the organization'scompounded average growth in revenuesand profits.) Top performers scored 14 orhigher (out of a possible 15 points);13percent of the sample scored at this level.Low performers scored 8 or fewer pointsand represented 16 percent of the sample.We excluded government respondentsbecause government agencies could notbe evaluated using these criteria.
CEO 3%
1%
7%
34%
5%
15%
30%
5%
COO
CFO
CIO/director of IT
Executive director/director
Other
Chief technology officerVice president (includes executive vice president and senior vice president)
ProductsRetail and consumerAutomotivePharmaceuticals and medical productsHealth servicesTransportation and travel servicesIndustrial equipment
22%6%5%2%3%3%
ResourcesChemicalsEnergyMetals and miningUtilitiesForest products
9%9%7%3%1%
11%6%3%
3%2%2%
2%
Communications and High TechElectronics and high techCommunicationsMedia and entertainment
Financial Services
Government
BankingInsuranceCapital markets
Education
Asia Pacific
North America
Latin America
23%
31%Europe, Middle East and Africa
41%
5%
Figure A. Job titles represented. Figure B. Industries represented. Figure C. Geographies represented.
28
Jeanne G. Harris is an executive researchfellow and director of research at theAccenture Institute for High PerformanceBusiness. Ms. Harris has conductedresearch and published articles in the areasof improving managerial performance, theeconomics of IT innovation, knowledgemanagement, business intelligence, build-ing analytical capabilities, customer rela-tionship management, customer-centricstrategies, mobile personalization andrealizing value from enterprise solutions.Ms. Harris previously led Accenture’sbusiness intelligence, performance man-agement, knowledge management anddata warehousing consulting practices.She has worked extensively with clientsin many different industries seeking toimprove the managerial information,decision-making, analytical and knowledgemanagement capabilities of their organi-zations. Ms. Harris can be reached inChicago, Illinois, at +1 312 693 7633 or via e-mail at [email protected].
Thomas H. Davenport is a fellow with theAccenture Institute for High PerformanceBusiness and holds the President's Chairin Information Technology and Manage-ment at Babson College. He is a widelypublished author and acclaimed speakeron the topics of information and knowl-edge management, reengineering, enter-prise systems, and electronic business andmarkets. He has a Ph.D. from HarvardUniversity in organizational behavior andhas taught at Harvard Business School,the University of Chicago, Dartmouth'sTuck School of Business and the Universityof Texas at Austin. Before joining BabsonCollege, he was the executive director ofthe Accenture Institute for High Perfor-mance Business. Dr. Davenport has co-authored or edited 10 books and haswritten hundreds of articles. He can bereached in Wellesley, Massachusetts, at+1 781 239 4485 or via email [email protected].
About the authors
The authors wish to thank the seniorexecutives of Accenture and the AccentureInstitute for High Performance Businessfor their support of this research project,especially Jim Hayes, David Hill, PatrickPuechbroussou, Terri Strauss and the manyother Accenture senior executives whohave significant, first-hand enterprisesolutions experience with their clients.
We would like to thank the more than 450executives who generously gave their timeto participate in the research study. Weespecially wish to express our appreciationand provide recognition for the extensivecontributions of Dr. Christine M. A. Lentz,research associate at Babson College,throughout the study and in particular,the statistical data analysis. We wish toacknowledge Liana Lo Conte andChristina LaPointe of Auctorus for their
online survey and data collection support.We also want to express our thanks toour Accenture marketing colleagues fortheir help in the development and realiza-tion of this report, including Mark Jones,Katy Ahern, Heather Roberts, Alex Brokingand Eileen Moynihan. Finally, we wish tothank Masha Chausovsky for her creativedesign solutions.
If you would like to discuss this report,please contact Jeanne Harris, executiveresearch fellow, Accenture Institute forHigh Performance Business at +1 312 693 7633 or via e-mail [email protected].
To obtain additional copies of the report,please contact Mark Jones via e-mail [email protected].
Acknowledgements

29
Appendix

30
31
Industry and geographic variation in the survey findingsBy Jeanne G. Harris and Christine M.A. Lentz
The Accenture Institute for High Performance Business surveyed371 senior executives who were knowledgeable about the currentand planned enterprise system initiatives in their organizations.Survey respondents had an average of five modules currentlyinstalled and planned to add two more in the next two years.Fifty-five percent of organizations and business units included in the study have revenues or operating budgets greater thanUS$10 billion.
Industry specific results are highlighted in Part I and Part II. The geographic variation in the survey findings is found in Part III and Part IV.

32
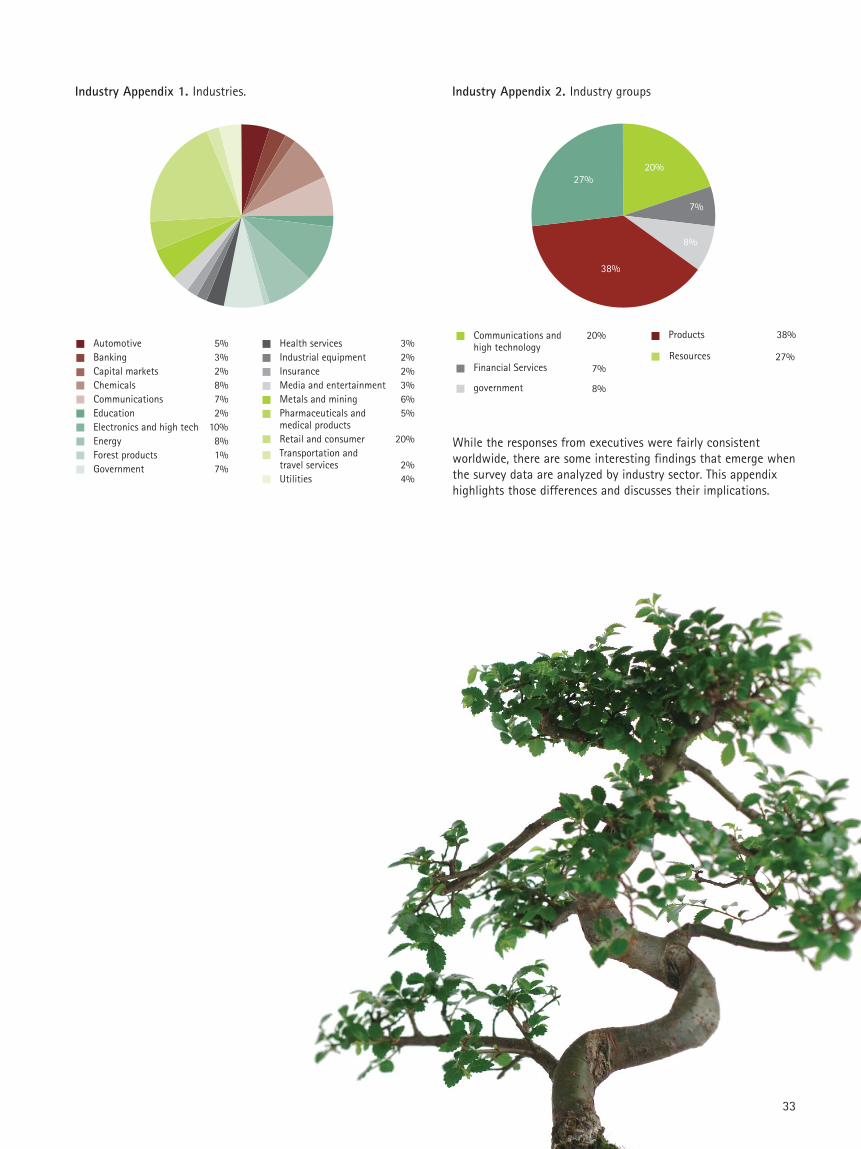
Part I. Cross-industry analysisNineteen industries were represented in the sample. (See IndustryAppendix 1.) For simplicity of data interpretation, five industrygroupings were created: communications and high technology,financial services, government, products and resources. The samplebreakdown by industry grouping is shown in Industry Appendix 2.
33
Industry Appendix 1. Industries.
AutomotiveBankingCapital marketsChemicalsCommunicationsEducationElectronics and high techEnergyForest productsGovernment
5%3%2%8%7%2%
10%8%1%7%
Health servicesIndustrial equipmentInsuranceMedia and entertainmentMetals and miningPharmaceuticals and medical productsRetail and consumerTransportation and travel servicesUtilities
3%2%2%3%6%5%
20%
2%4%
Industry Appendix 2. Industry groups
20%
7%
8%
38%
27%
Communications andhigh technology
Financial Services
Products
7%
government 8%
38%20%
Resources 27%
While the responses from executives were fairly consistentworldwide, there are some interesting findings that emerge whenthe survey data are analyzed by industry sector. This appendixhighlights those differences and discusses their implications.
34
None of the targeted benefits realized
Small number of targeted benefits realized
About half of the targeted benefits realized
Majority of targeted benefits realized
All targeted benefits realized
1%
15%
28%
48%
7%
0%
13%
50%
38%
0%
0%
13%
28%
59%
0%
0%
16%
34%
48%
3%
0%
16%
36%
41%
7%
1%
14%
35%
47%
6%
16%
8%
11%
11%
4%
5%
8%
13%
6%
3%
12%
4%
23%
7%
8%
17%
0%
5%
4%
19%
1%
1%
11%
4%
21%
8%
6%
11%
0%
7%
10%
19%
6%
0%0%
9%
2%
17%
7%
8%
15%
2%
6%
5%
16%
9%
11%
4%
17%
9%
6%
14%
3%
6%
3%
13%
11%
1%
12%
5%
19%
8%
8%
14%
3%
6%
6%
16%
7%
2%
11%
4%
Better management decision making
Cycle time reduction
Ease of expansion/growth and increased flexibility
Faster, more accurate transactions
Fewer physical resources (trucks, warehouses, etc.) and improved logistics
Headcount reduction
Improved customer service and retention
Improved financial management
Improved inventory and assetmanagement (reduced inventory, etc.)
Increased revenue
Cost reduction
Competitive advantage through distinctive capabilities
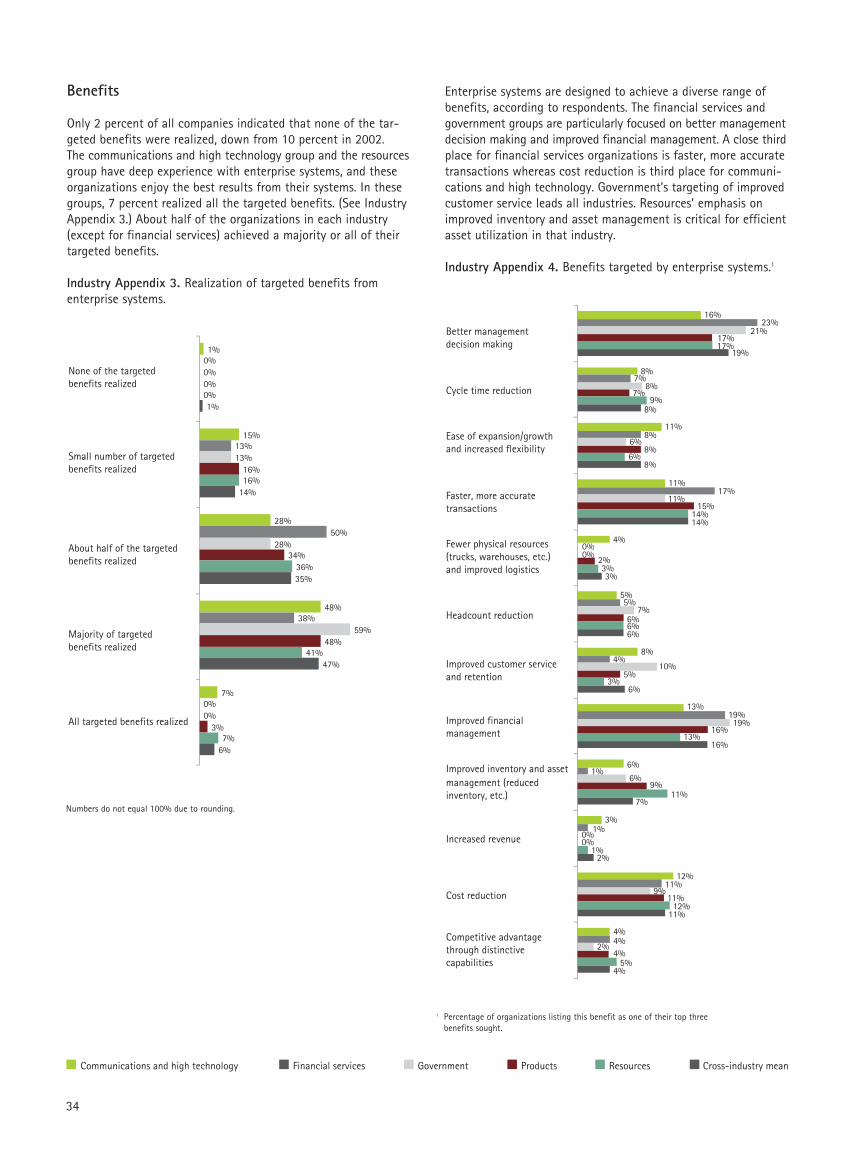
Benefits
Only 2 percent of all companies indicated that none of the tar-geted benefits were realized, down from 10 percent in 2002. The communications and high technology group and the resourcesgroup have deep experience with enterprise systems, and theseorganizations enjoy the best results from their systems. In thesegroups, 7 percent realized all the targeted benefits. (See IndustryAppendix 3.) About half of the organizations in each industry(except for financial services) achieved a majority or all of theirtargeted benefits.
Industry Appendix 3. Realization of targeted benefits fromenterprise systems.
Enterprise systems are designed to achieve a diverse range ofbenefits, according to respondents. The financial services andgovernment groups are particularly focused on better managementdecision making and improved financial management. A close thirdplace for financial services organizations is faster, more accuratetransactions whereas cost reduction is third place for communi-cations and high technology. Government’s targeting of improvedcustomer service leads all industries. Resources’ emphasis onimproved inventory and asset management is critical for efficientasset utilization in that industry.
Industry Appendix 4. Benefits targeted by enterprise systems.1
1 Percentage of organizations listing this benefit as one of their top three benefits sought.
Communications and high technology Financial services Government Products Resources Cross-industry mean
Numbers do not equal 100% due to rounding.
35
Communications and high technology Financial services Government Products Resources Cross-industry mean
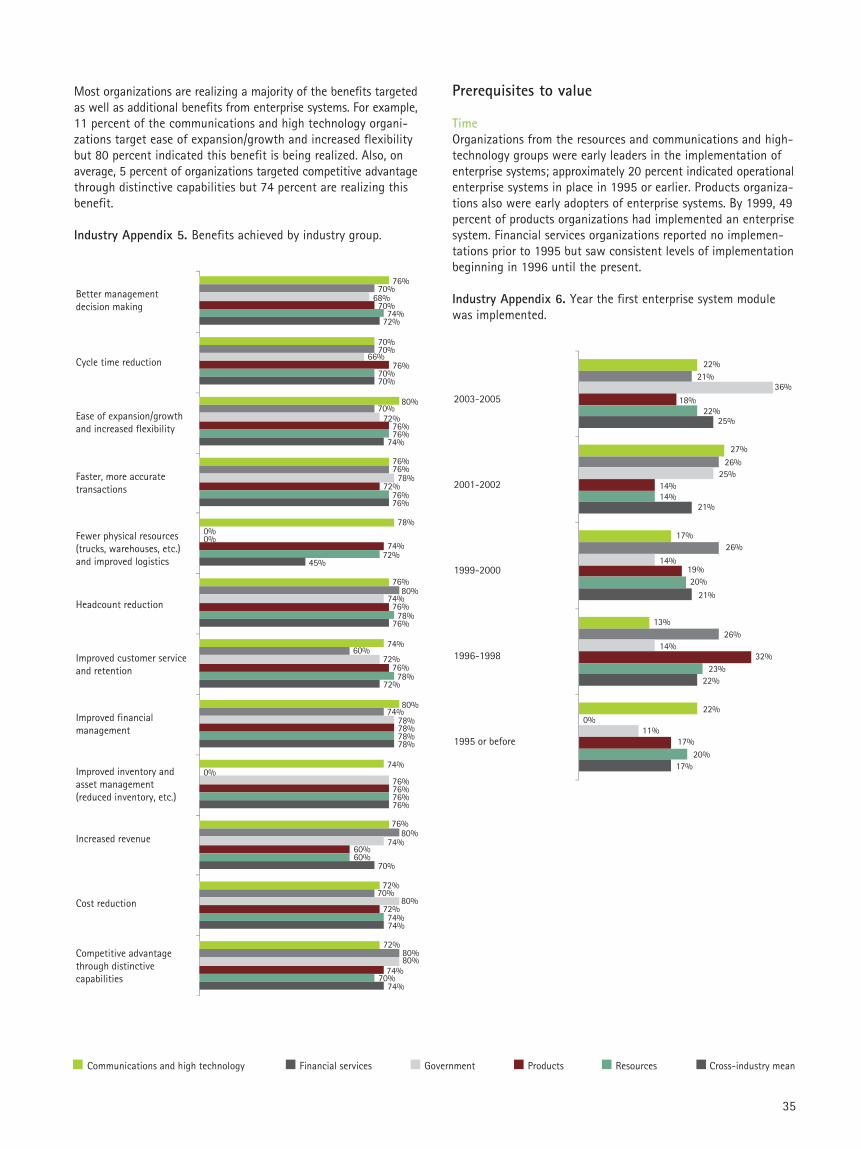
Most organizations are realizing a majority of the benefits targetedas well as additional benefits from enterprise systems. For example,11 percent of the communications and high technology organi-zations target ease of expansion/growth and increased flexibilitybut 80 percent indicated this benefit is being realized. Also, onaverage, 5 percent of organizations targeted competitive advantagethrough distinctive capabilities but 74 percent are realizing thisbenefit.
Industry Appendix 5. Benefits achieved by industry group.
Prerequisites to value
TimeOrganizations from the resources and communications and high-technology groups were early leaders in the implementation ofenterprise systems; approximately 20 percent indicated operationalenterprise systems in place in 1995 or earlier. Products organiza-tions also were early adopters of enterprise systems. By 1999, 49percent of products organizations had implemented an enterprisesystem. Financial services organizations reported no implemen-tations prior to 1995 but saw consistent levels of implementationbeginning in 1996 until the present.
Industry Appendix 6. Year the first enterprise system modulewas implemented.
Cycle time reduction
Better management decision making
Ease of expansion/growth and increased flexibility
Faster, more accurate transactions
Fewer physical resources (trucks, warehouses, etc.) and improved logistics
Headcount reduction
Improved customer service and retention
Improved financial management
Improved inventory and asset management (reduced inventory, etc.)
Increased revenue
Cost reduction
Competitive advantage through distinctive capabilities
76%
70%
80%
76%
78%
76%
74%
80%
74%
76%
72%
72%
70%
70%
70%
76%
0%
80%
60%
74%
0%
80%
70%
80%
68%
66%
72%
78%
0%
74%
72%
78%
76%
74%
80%
80%
70%
76%
76%
72%
74%
76%
76%
78%
76%
60%
72%
74%
74%
70%
76%
76%
72%
78%
78%
78%
76%
60%
74%
70%
72%
70%
74%
76%
45%
76%
72%
78%
76%
70%
74%
74%
22%
27%
17%
13%
22%
21%
26%
26%
26%
36%
25%
14%
14%
11%0%
18%
14%
19%
32%
17%
22%
14%
20%
23%
20%
25%
21%
21%
22%
17%
2003-2005
2001-2002
1999-2000
1996-1998
1995 or before
36
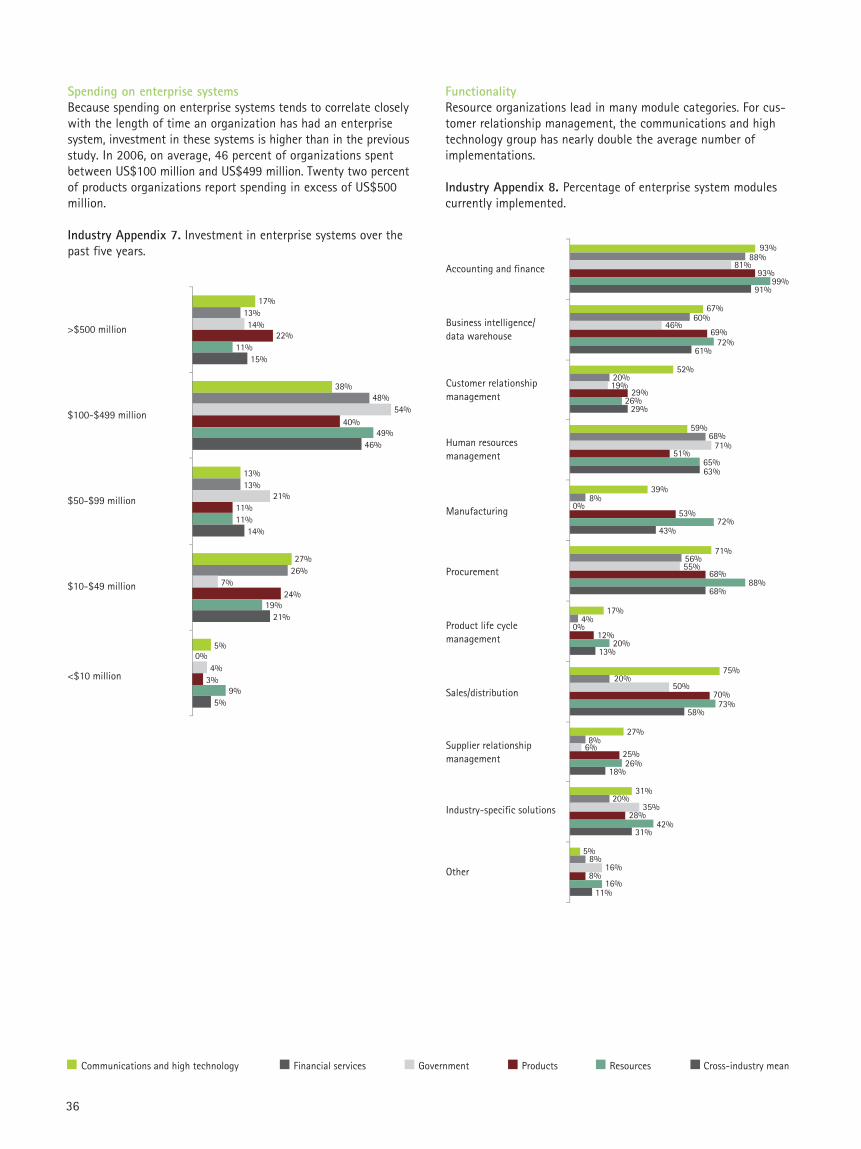
Spending on enterprise systemsBecause spending on enterprise systems tends to correlate closelywith the length of time an organization has had an enterprisesystem, investment in these systems is higher than in the previousstudy. In 2006, on average, 46 percent of organizations spentbetween US$100 million and US$499 million. Twenty two percentof products organizations report spending in excess of US$500million.
Industry Appendix 7. Investment in enterprise systems over thepast five years.
17%
38%
13%
27%
5%0%
13%
48%
13%
26%
14%
54%
21%
7%
4%
22%
40%
11%
24%
3%
11%
49%
11%
19%
9%
15%
46%
14%
21%
5%
>$500 million
$100-$499 million
$50-$99 million
$10-$49 million
<$10 million
FunctionalityResource organizations lead in many module categories. For cus-tomer relationship management, the communications and hightechnology group has nearly double the average number ofimplementations.
Industry Appendix 8. Percentage of enterprise system modulescurrently implemented.
93%
67%
52%
59%
39%
71%
17%
75%
27%
31%
5%
88%
60%
20%
68%
8%
56%
4%
20%
8%
20%
8%
81%
46%
19%
71%
55%
0%
0%
50%
6%
35%
16%
93%
69%
29%
51%
53%
68%
12%
70%
25%
28%
8%
99%
72%
26%
65%
72%
88%
20%
73%
26%
42%
16%
91%
61%
29%
63%
43%
68%
13%
58%
18%
31%
11%
Accounting and finance
Business intelligence/data warehouse
Customer relationshipmanagement
Human resources management
Manufacturing
Procurement
Product life cyclemanagement
Sales/distribution
Supplier relationshipmanagement
Industry-specific solutions
Other
Communications and high technology Financial services Government Products Resources Cross-industry mean
37
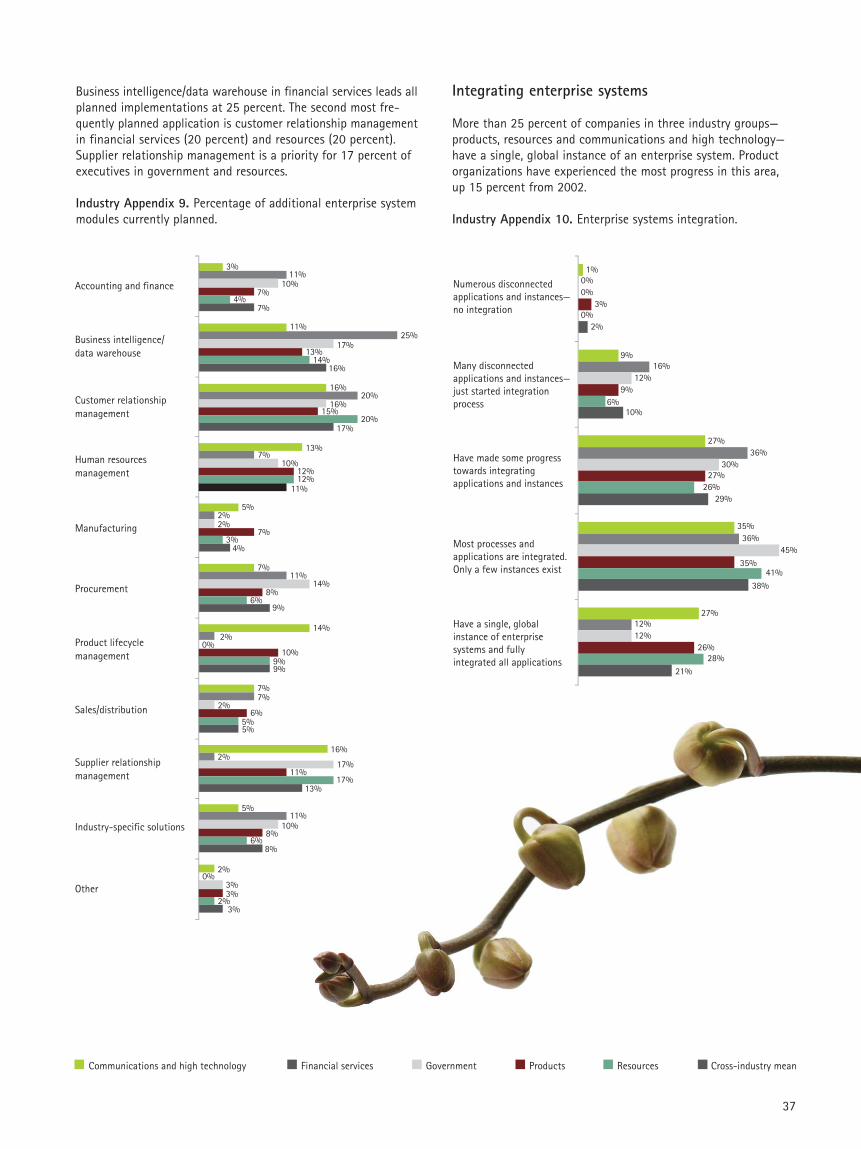
Business intelligence/data warehouse in financial services leads allplanned implementations at 25 percent. The second most fre-quently planned application is customer relationship managementin financial services (20 percent) and resources (20 percent).Supplier relationship management is a priority for 17 percent ofexecutives in government and resources.
Industry Appendix 9. Percentage of additional enterprise systemmodules currently planned.
Integrating enterprise systems
More than 25 percent of companies in three industry groups—products, resources and communications and high technology—have a single, global instance of an enterprise system. Productorganizations have experienced the most progress in this area, up 15 percent from 2002.
Industry Appendix 10. Enterprise systems integration.
Accounting and finance
Business intelligence/data warehouse
Customer relationshipmanagement
Human resources management
Manufacturing
Procurement
Product lifecyclemanagement
Sales/distribution
Supplier relationshipmanagement
Industry-specific solutions
Other
3%
11%
16%
13%
5%
7%
14%
7%
16%
5%
2%
11%
25%
20%
7%
2%
11%
2%
7%
2%
11%
0%
10%
17%
16%
10%
2%
14%
0%
2%
17%
10%
3%
7%
13%
15%
12%
7%
8%
10%
6%
11%
8%
3%
4%
14%
20%
12%
3%
6%
9%
5%
17%
6%
2%
7%
16%
17%
11%
4%
9%
9%
5%
13%
8%
3%
Numerous disconnectedapplications and instances—no integration
Many disconnected applications and instances—just started integration process
Have made some progresstowards integrating applications and instances
Most processes and applications are integrated. Only a few instances exist
Have a single, global instance of enterprise systems and fully integrated all applications
1%
9%
27%
35%
27%
0%
16%
36%
36%
12%
0%
12%
30%
45%
12%
3%
9%
27%
35%
26%
0%
6%
26%
41%
28%
2%
10%
29%
38%
21%
Communications and high technology Financial services Government Products Resources Cross-industry mean
38
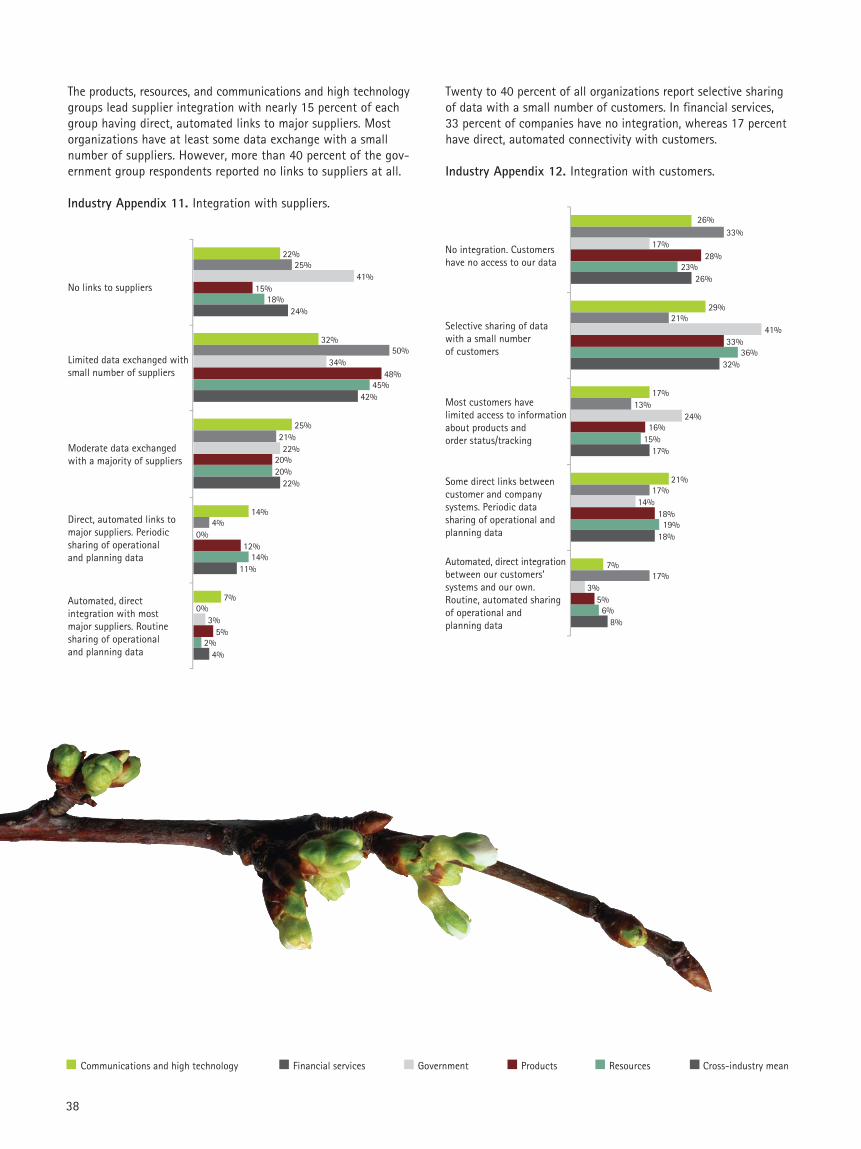
The products, resources, and communications and high technologygroups lead supplier integration with nearly 15 percent of eachgroup having direct, automated links to major suppliers. Mostorganizations have at least some data exchange with a smallnumber of suppliers. However, more than 40 percent of the gov-ernment group respondents reported no links to suppliers at all.
Industry Appendix 11. Integration with suppliers.
No links to suppliers
Limited data exchanged with small number of suppliers
Moderate data exchanged with a majority of suppliers
Direct, automated links to major suppliers. Periodic sharing of operational and planning data
Automated, direct integration with most major suppliers. Routine sharing of operational and planning data
22%
32%
25%
14%
7%
25%
50%
21%
4%
0%
41%
34%
22%
0%
3%
15%
48%
20%
12%
5%
18%
45%
20%
14%
2%
24%
42%
22%
11%
4%
Twenty to 40 percent of all organizations report selective sharingof data with a small number of customers. In financial services,33 percent of companies have no integration, whereas 17 percenthave direct, automated connectivity with customers.
Industry Appendix 12. Integration with customers.
No integration. Customers have no access to our data
Selective sharing of data with a small number of customers
Most customers have limited access to information about products and order status/tracking
Some direct links between customer and company systems. Periodic data sharing of operational and planning data
Automated, direct integration between our customers’ systems and our own. Routine, automated sharing of operational and planning data
26%
29%
17%
21%
7%
33%
21%
13%
17%
17%
17%
41%
24%
14%
3%
28%
33%
16%
18%
5%
23%
36%
15%
19%
6%
26%
32%
17%
18%
8%
Communications and high technology Financial services Government Products Resources Cross-industry mean
39
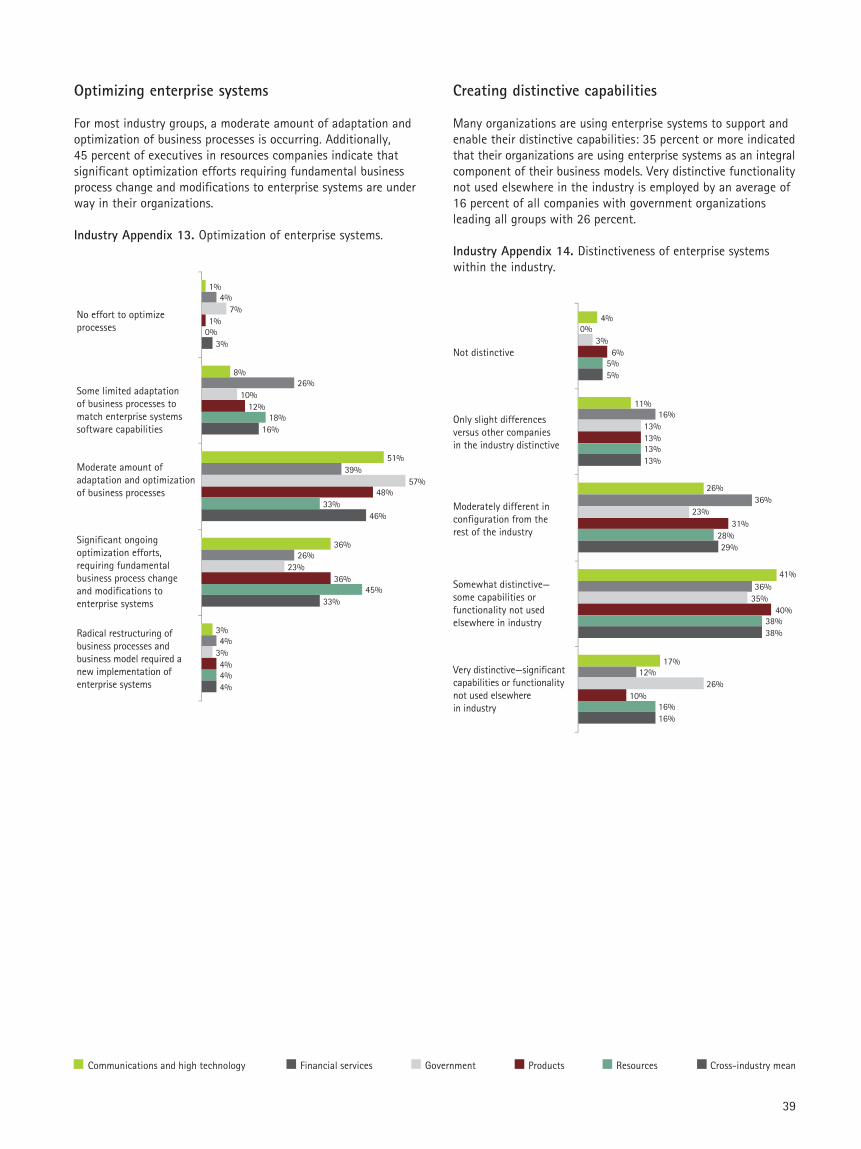
Optimizing enterprise systems
For most industry groups, a moderate amount of adaptation andoptimization of business processes is occurring. Additionally, 45 percent of executives in resources companies indicate thatsignificant optimization efforts requiring fundamental businessprocess change and modifications to enterprise systems are underway in their organizations.
Industry Appendix 13. Optimization of enterprise systems.
No effort to optimize processes
Some limited adaptation of business processes to match enterprise systems software capabilities
Moderate amount of adaptation and optimization of business processes
Significant ongoing optimization efforts, requiring fundamental business process change and modifications to enterprise systems
Radical restructuring of business processes and business model required a new implementation of enterprise systems
1%
8%
51%
36%
3%
4%
26%
39%
26%
4%
7%
10%
57%
23%
3%
1%
12%
48%
36%
4%
0%
18%
33%
45%
4%
3%
16%
46%
33%
4%
Creating distinctive capabilities
Many organizations are using enterprise systems to support andenable their distinctive capabilities: 35 percent or more indicatedthat their organizations are using enterprise systems as an integralcomponent of their business models. Very distinctive functionalitynot used elsewhere in the industry is employed by an average of16 percent of all companies with government organizationsleading all groups with 26 percent.
Industry Appendix 14. Distinctiveness of enterprise systemswithin the industry.
Not distinctive
Only slight differences versus other companies in the industry distinctive
Moderately different in configuration from the rest of the industry
Somewhat distinctive— some capabilities or functionality not used elsewhere in industry
Very distinctive—significant capabilities or functionality not used elsewhere in industry
4%
11%
26%
41%
17%
0%
16%
36%
36%
12%
3%
13%
23%
35%
26%
6%
13%
31%
40%
10%
5%
13%
28%
38%
16%
5%
13%
29%
38%
16%
Communications and high technology Financial services Government Products Resources Cross-industry mean
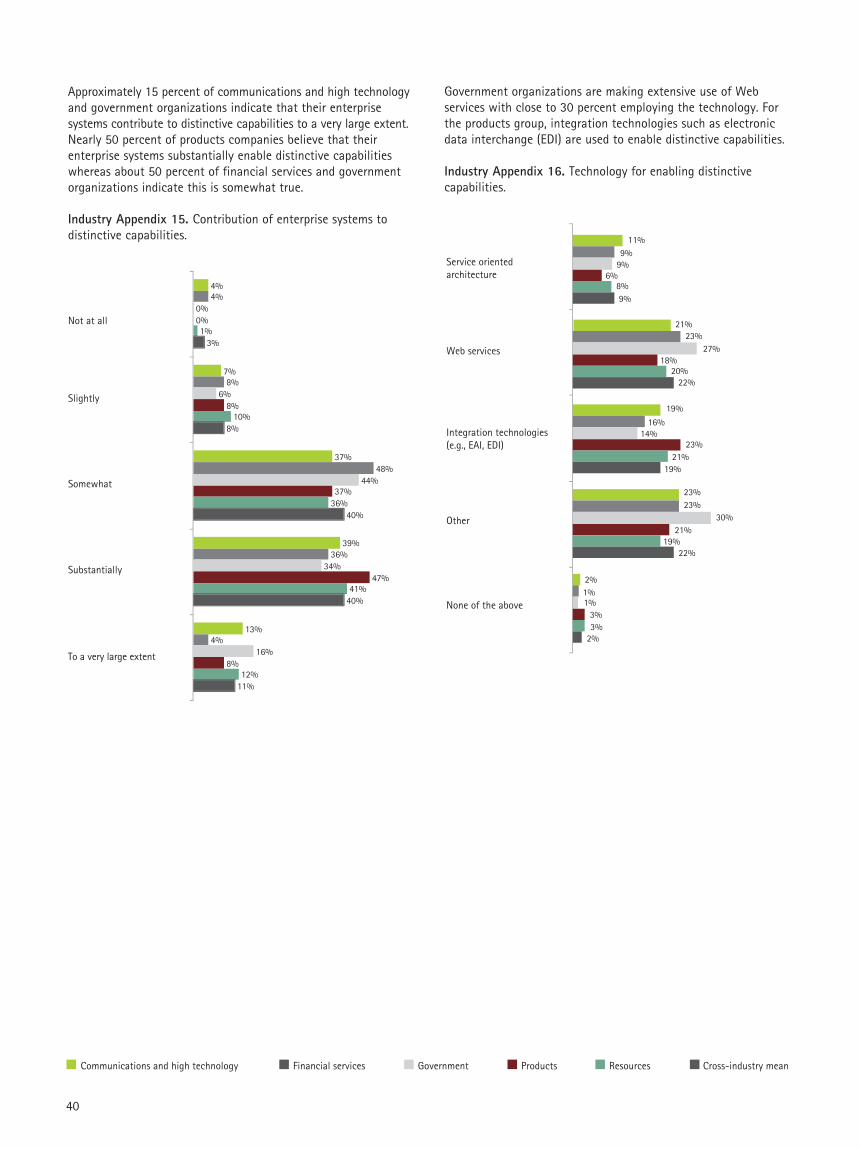
40
Approximately 15 percent of communications and high technologyand government organizations indicate that their enterprise systems contribute to distinctive capabilities to a very large extent.Nearly 50 percent of products companies believe that theirenterprise systems substantially enable distinctive capabilitieswhereas about 50 percent of financial services and governmentorganizations indicate this is somewhat true.
Industry Appendix 15. Contribution of enterprise systems todistinctive capabilities.
Not at all
Slightly
Somewhat
Substantially
To a very large extent
4%
7%
37%
39%
13%
4%
8%
48%
36%
4%
0%
6%
44%
34%
16%
0%
8%
37%
47%
8%
1%
10%
36%
41%
12%
3%
8%
40%
40%
11%
Government organizations are making extensive use of Webservices with close to 30 percent employing the technology. Forthe products group, integration technologies such as electronicdata interchange (EDI) are used to enable distinctive capabilities.
Industry Appendix 16. Technology for enabling distinctive capabilities.
Service oriented architecture
Web services
Integration technologies (e.g., EAI, EDI)
Other
None of the above
11%
21%
19%
23%
2%
9%
23%
16%
23%
1%
9%
27%
14%
30%
1%
6%
18%
23%
21%
3%
8%
20%
21%
19%
3%
22%
19%
22%
2%
9%
Communications and high technology Financial services Government Products Resources Cross-industry mean
41
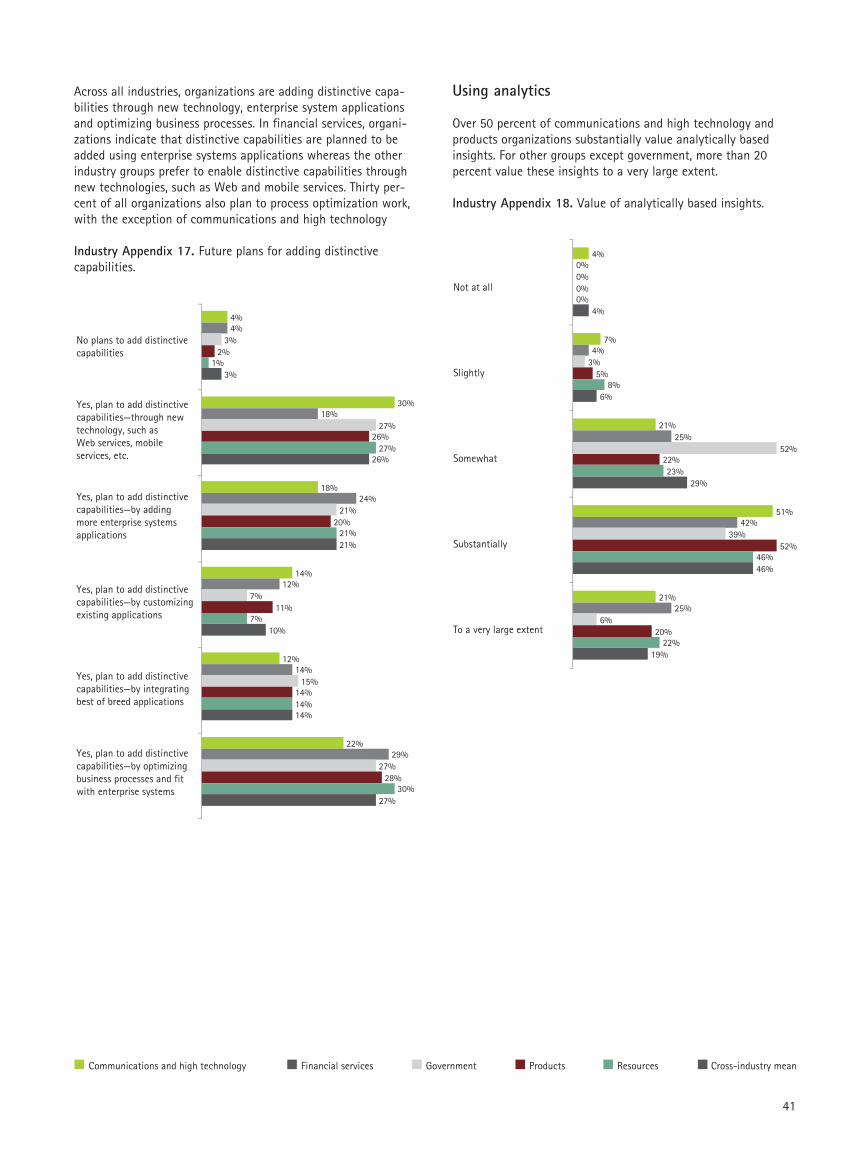
Across all industries, organizations are adding distinctive capa-bilities through new technology, enterprise system applicationsand optimizing business processes. In financial services, organi-zations indicate that distinctive capabilities are planned to beadded using enterprise systems applications whereas the otherindustry groups prefer to enable distinctive capabilities throughnew technologies, such as Web and mobile services. Thirty per-cent of all organizations also plan to process optimization work,with the exception of communications and high technology
Industry Appendix 17. Future plans for adding distinctive capabilities.
No plans to add distinctivecapabilities
Yes, plan to add distinctivecapabilities—through new technology, such as Web services, mobile services, etc.
Yes, plan to add distinctive capabilities—by adding more enterprise systems applications
Yes, plan to add distinctive capabilities—by customizing existing applications
Yes, plan to add distinctive capabilities—by integrating best of breed applications
Yes, plan to add distinctive capabilities—by optimizing business processes and fit with enterprise systems
4%
30%
18%
14%
12%
22%
4%
18%
24%
12%
14%
29%
3%
27%
21%
7%
15%
27%
2%
26%
20%
11%
14%
28%
1%
27%
21%
7%
14%
30%
3%
26%
21%
10%
14%
27%
Using analytics
Over 50 percent of communications and high technology andproducts organizations substantially value analytically basedinsights. For other groups except government, more than 20 percent value these insights to a very large extent.
Industry Appendix 18. Value of analytically based insights.
Not at all
Slightly
Somewhat
Substantially
To a very large extent
4%
7%
21%
51%
21%
0%
4%
25%
42%
25%
0%
3%
52%
39%
6%
0%
5%
22%
52%
20%
0%
8%
23%
46%
22%
4%
6%
29%
46%
19%
Communications and high technology Financial services Government Products Resources Cross-industry mean
42
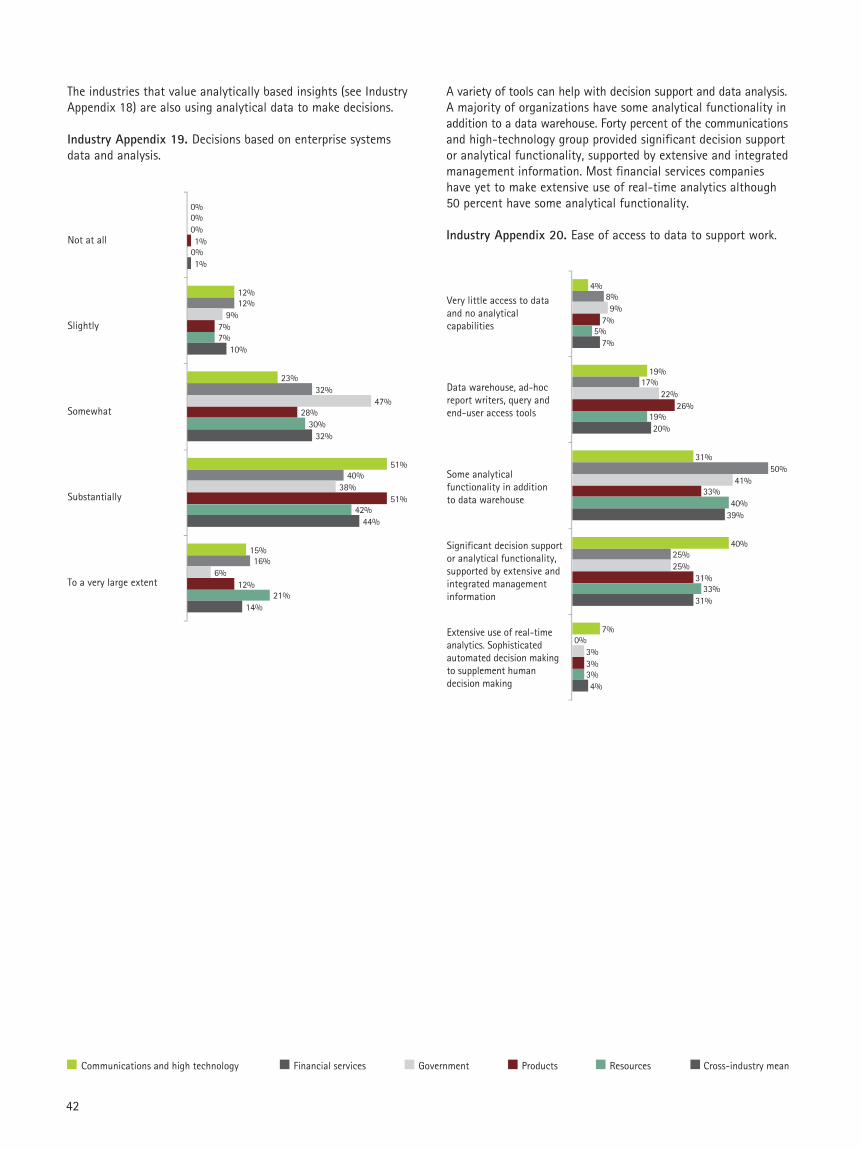
The industries that value analytically based insights (see IndustryAppendix 18) are also using analytical data to make decisions.
Industry Appendix 19. Decisions based on enterprise systemsdata and analysis.
Not at all
Slightly
Somewhat
Substantially
To a very large extent
0%
12%
23%
51%
15%
0%
12%
32%
40%
16%
0%
9%
47%
38%
6%
1%
7%
28%
51%
12%
0%
7%
30%
42%
21%
1%
10%
32%
44%
14%
A variety of tools can help with decision support and data analysis.A majority of organizations have some analytical functionality inaddition to a data warehouse. Forty percent of the communicationsand high-technology group provided significant decision supportor analytical functionality, supported by extensive and integratedmanagement information. Most financial services companieshave yet to make extensive use of real-time analytics although50 percent have some analytical functionality.
Industry Appendix 20. Ease of access to data to support work.
Very little access to data and no analytical capabilities
Data warehouse, ad-hoc report writers, query and end-user access tools
Some analytical functionality in addition to data warehouse
Significant decision support or analytical functionality, supported by extensive and integrated management information
Extensive use of real-time analytics. Sophisticated automated decision making to supplement human decision making
4%
19%
31%
40%
7%
8%
17%
50%
25%
0%
9%
22%
41%
25%
3%
7%
26%
33%
31%
3%
5%
19%
40%
33%
3%
7%
20%
39%
31%
4%
Communications and high technology Financial services Government Products Resources Cross-industry mean
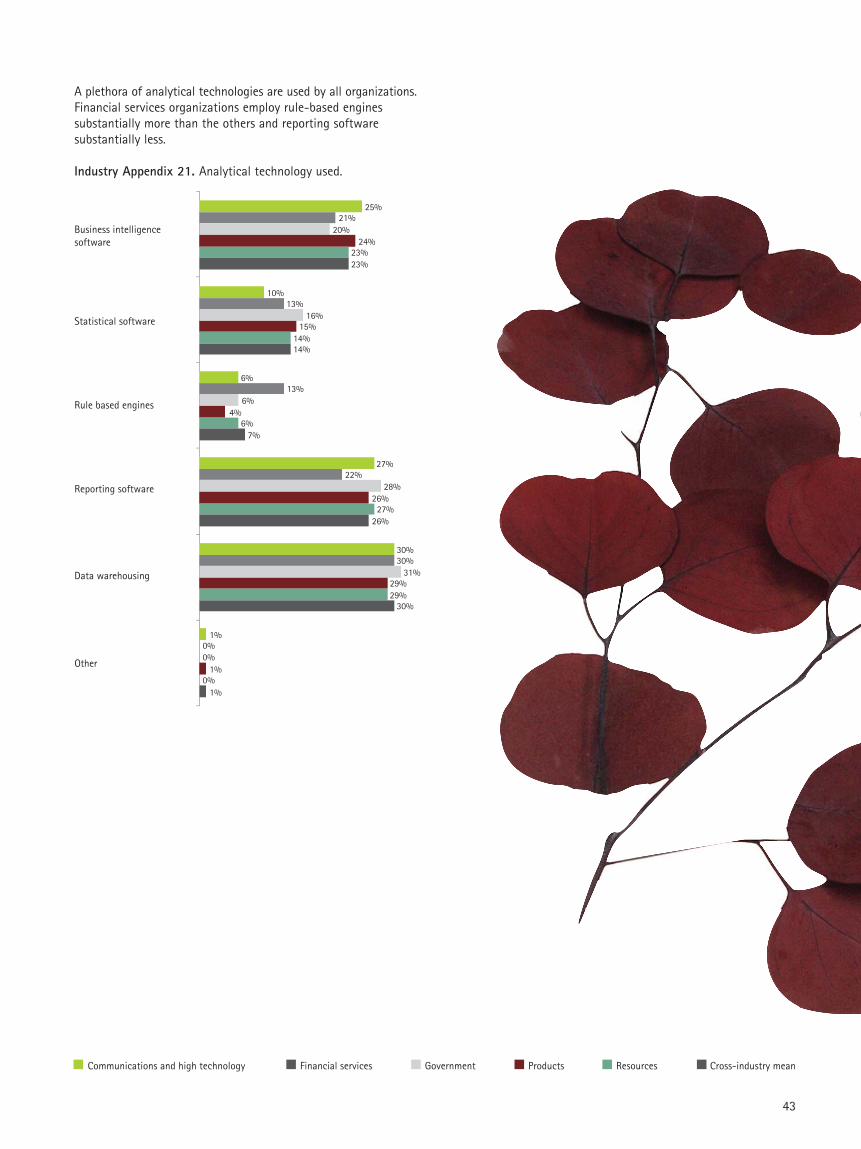
Statistical software
Business intelligence software
Rule based engines
Reporting software
Data warehousing
Other
25%
10%
6%
27%
30%
1%
21%
13%
13%
22%
30%
0%0%
20%
16%
6%
28%
31%
1%
24%
15%
4%
26%
29%
1%
23%
14%
6%
27%
29%
0%
23%
14%
7%
26%
30%
43
Communications and high technology Financial services Government Products Resources Cross-industry mean
A plethora of analytical technologies are used by all organizations.Financial services organizations employ rule-based engines substantially more than the others and reporting software substantially less.
Industry Appendix 21. Analytical technology used.

44
Part II. Industry snapshotsProducts
One hundred and thirty-eight executives in the products industrysector indicated that their organizations realized the same topthree benefits as the entire sample—better decision making,improved financial performance and faster, more accurate trans-actions. Forty-nine percent had implemented as least two modulesof enterprise systems by 1999 and 22 percent spend in excess ofUS$500 million on enterprise systems that support all aspects ofthe business. To support and enable integration, about a quarterof product companies employ integration technologies and approxi-mately 20 percent have at least some direct links to customers andsuppliers allowing for periodic, as well as automated, direct datasharing. Leading all industry groups, 47 percent of productcompanies believe that their enterprise systems substantiallycontribute to their organizations' distinctive capabilities. Analyticsis an important component of this advantage as over 50 percentof products' executives indicated that decisions are based onenterprise systems' data and analysis.
45
Resources
One hundred resources executives responded to the survey and 7 percent of these organizations indicated that all targeted bene-fits had been realized. Early adoption may be partly responsibleas 20 percent of resources companies had implemented at leasttwo enterprise systems modules in 1995 or before. Resourcesorganizations have extensive module implementation, leading allgroups in six of the 10 module categories. About 20 percent areplanning to add customer and supplier relationship managementin the next two years. Integration is an important driver of success,according to resources executives. Nearly 70 percent indicatedthat most processes and applications are integrated, 14 percenthave direct, automated links to suppliers, and nearly 20 percenthave some direct connectivity to customers. Optimization isanother critical component as 45 percent of executives report sig-nificant, ongoing process improvement efforts that require fun-damental business change. Distinctive capabilities will be addedthrough these process optimization efforts which enable betterfit between the organization and the enterprise systems. Resourcescompanies both value analytically based insights and use theenterprise systems’ data in decision making (20 percent indicatethey do so to a very large extent).
Communications and high-technology
Seventy-five communications and high-technology executivesparticipated in this study and nearly 50 percent of these organi-zations indicated that a majority of targeted benefits have beenrealized. Realized benefits came in the areas of improved decisionmaking and financial management after years of work as 35 percent of communications and high technology companies hadimplemented enterprise systems by 1999. A broad portfolio ofmodules is supporting operations and distinctive capabilities atcommunications and high-technology companies. Communicationsand high-technology organizations lead the other groups in theimplementation of customer relationship management, supplierrelationship management and sales/distribution modules as wellas the planned implementation of product lifecycle and humanresources management. Integration is quite high at communica-tions and high-technology organizations with 27 percent havinga single global instance of enterprise systems and nearly 7 percentindicating automated, direct exchange of data with most majorsuppliers. When compared with others in the industry, 17 percentof communications and high technology executives describe theirenterprise systems as “very distinctive” and 13 percent indicatethese systems contribute “to a very large extent” to distinctivecapabilities. Analytics are highly valued by the communications andhigh technology group as 51 percent indicate they substantiallyvalue analytically based insights. Leading all industry groups bynearly a factor of two, communications and high-technologyexecutives indicate that their organizations are making extensiveuse of analytics.
Financial services
Twenty-six financial services company executives participated inthis study and, as a group, they are relatively late adopters ofenterprise systems. There were no implementations prior to 1995and 26 percent prior to 1999. Targeted benefits are being realizedbut to a smaller extent than some of the other industries. Moduleimplementation is most extensive in accounting and finance,human resource management and business intelligence/datawarehouse. Plans for additional module implementation in thenext two years include: business intelligence/data warehouse (25 percent) and customer relationship management (20 percent).Financial services organizations are less likely to have a single,global instance of enterprise systems but 36 percent indicate thatmost processes and applications are integrated. Integration withsuppliers is low, but automated, direct linkage with customersleads all industry groups at 17 percent. Enterprise systems arecontributing to distinctive capabilities somewhat and future plansinclude augmenting this capability through optimizing businessprocesses and adding more enterprise system applications. Seventy-five percent of financial services organizations indicate that eithersome analytical functionality exists in addition to data warehouseor that significant decision support or analytical functionality issustained by extensive and integrated management information.
Government
Government and public-sector organizations (32 participated) havetargeted the same benefits as other organizations: better decisionmaking, improved financial management, and faster, more accuratetransactions. Realization of these benefits is a bit more elusiveparticularly for faster, more accurate transactions. Time is likely afactor as no government organization surveyed had implementedtwo enterprise systems modules prior to 1995 and only 36 percentimplemented systems in the last two years. Nevertheless, thebreadth of modules currently implemented was extensive. Plansfor additional module implementation in the next two yearsincluded: business intelligence/data warehouse (25 percent) andsupplier relationship management (18 percent). On average, government organizations spent the most on enterprise systemswith 54 percent indicating expenditures of US$100 million-US$499 million over the past five years. Integration in governmentorganizations is low as 41 percent report no links to suppliers and17 percent have no links to customers. Some limited adaptationof business processes is being done to match enterprise systemsoftware capabilities to the organization’s processes. Distinctivecapabilities are being somewhat supported by enterprise systems.Future plans include continuing work on process optimizationand adding enterprise system modules. The value of analytics issignificantly lower than in other organizations (6 percent versusan average of 19 percent) as is their use of analytics (6 percentversus an average of 14 percent).

46
Part III. Geographic variation in industry findings
We surveyed 371 executives from large organizations representinga wide range of industries (see Industry Appendix 1) and the publicsector in 35 countries. Geographic Appendix 1 lists these countriesand groups them into five geographic regions: Asia Pacific, Europe,Middle East and Africa, North America and Latin America. Whileexecutives worldwide were fairly consistent in their perspectives,a few significant variations emerged. This section of the appendixsummarizes some of the key differences found.
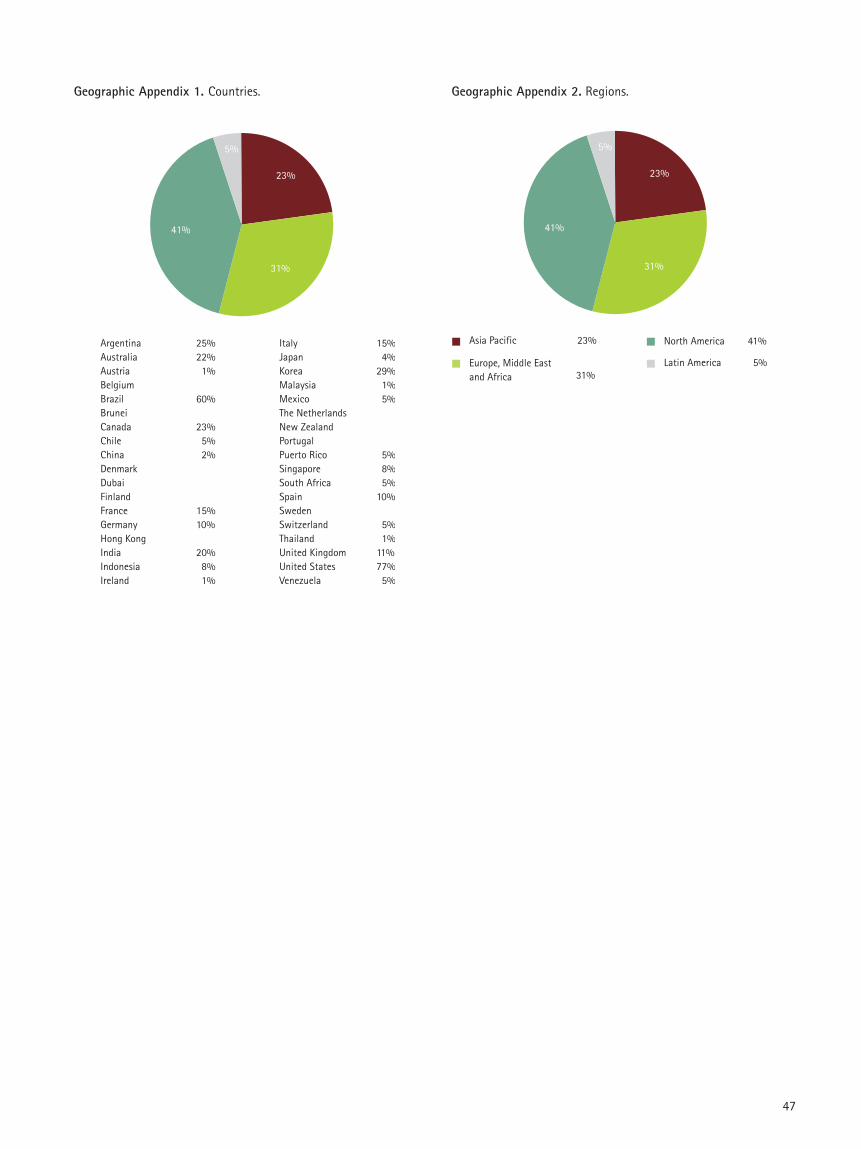
47
ArgentinaAustraliaAustriaBelgiumBrazilBruneiCanadaChileChinaDenmarkDubaiFinlandFranceGermanyHong KongIndiaIndonesiaIreland
25%22%1%
60%
23%5%2%
15%10%
20%8%1%
ItalyJapanKoreaMalaysiaMexicoThe NetherlandsNew ZealandPortugalPuerto RicoSingaporeSouth AfricaSpainSwedenSwitzerlandThailandUnited KingdomUnited StatesVenezuela
15%4%
29%1%5%
5%8%5%
10%
5%1%
11%77%5%
23%
31%
41%
5%
Geographic Appendix 1. Countries.
North America
Latin America
Asia Pacific
5%
23% 41%
Europe, Middle East and Africa 31%
23%
31%
41%
5%
Geographic Appendix 2. Regions.
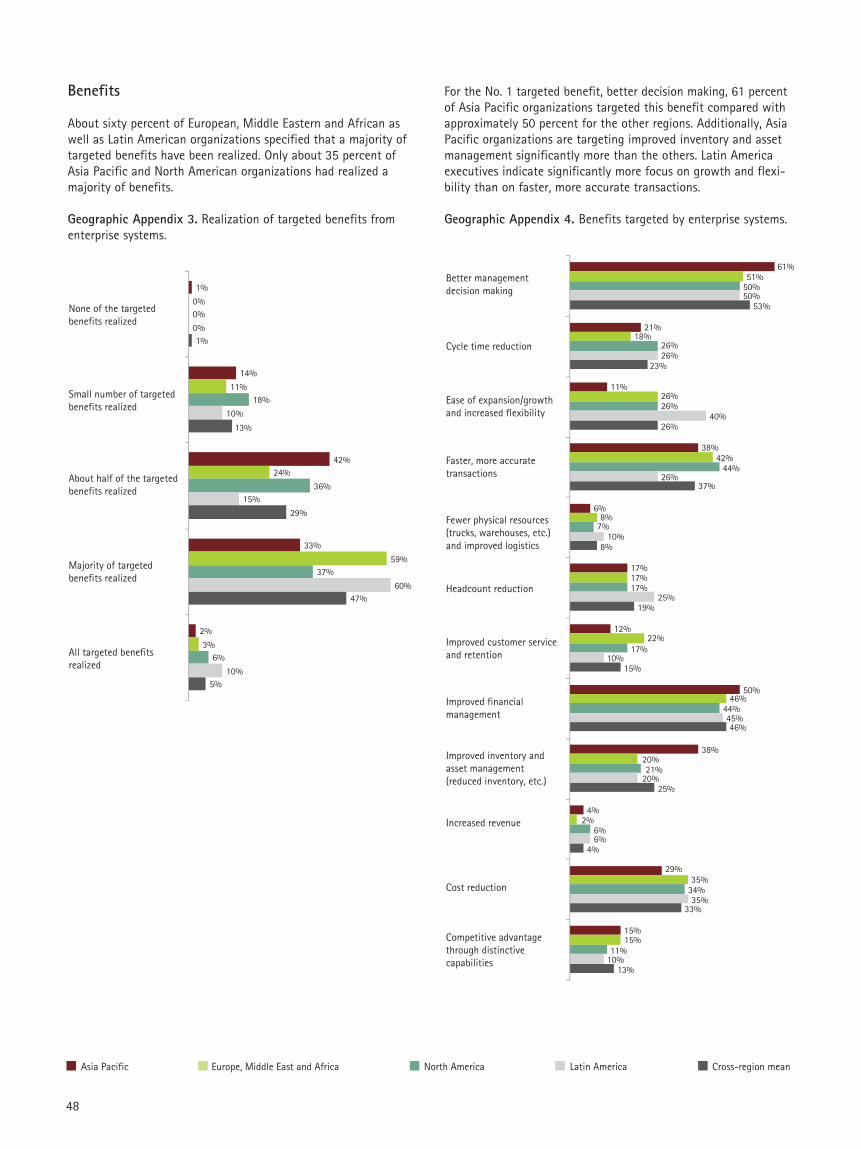
48
For the No. 1 targeted benefit, better decision making, 61 percentof Asia Pacific organizations targeted this benefit compared withapproximately 50 percent for the other regions. Additionally, AsiaPacific organizations are targeting improved inventory and assetmanagement significantly more than the others. Latin Americaexecutives indicate significantly more focus on growth and flexi-bility than on faster, more accurate transactions.
Geographic Appendix 4. Benefits targeted by enterprise systems.
Cycle time reduction
Better management decision making
Ease of expansion/growth and increased flexibility
Faster, more accurate transactions
Fewer physical resources (trucks, warehouses, etc.) and improved logistics
Headcount reduction
Improved customer service and retention
Improved financial management
Improved inventory and asset management (reduced inventory, etc.)
Increased revenue
Cost reduction
Competitive advantage through distinctive capabilities
61%
21%
11%
38%
6%
17%
12%
50%
38%
4%
29%
15%
51%
18%
26%
42%
8%
17%
22%
46%
20%
2%
35%
15%
50%
26%
26%
44%
7%
17%
17%
44%
21%
6%
34%
11%
50%
26%
40%
26%
10%
25%
10%
45%
20%
6%
35%
10%
53%
23%
26%
37%
8%
19%
15%
46%
25%
4%
33%
13%
Asia Pacific Europe, Middle East and Africa North America Latin America Cross-region mean
Benefits
About sixty percent of European, Middle Eastern and African aswell as Latin American organizations specified that a majority oftargeted benefits have been realized. Only about 35 percent ofAsia Pacific and North American organizations had realized amajority of benefits.
Geographic Appendix 3. Realization of targeted benefits from enterprise systems.
None of the targeted benefits realized
Small number of targeted benefits realized
About half of the targeted benefits realized
Majority of targeted benefits realized
All targeted benefits realized
1%
14%
42%
33%
2%
0%
11%
24%
59%
3%
0%
18%
36%
37%
6%
0%
10%
15%
60%
10%
1%
13%
29%
47%
5%
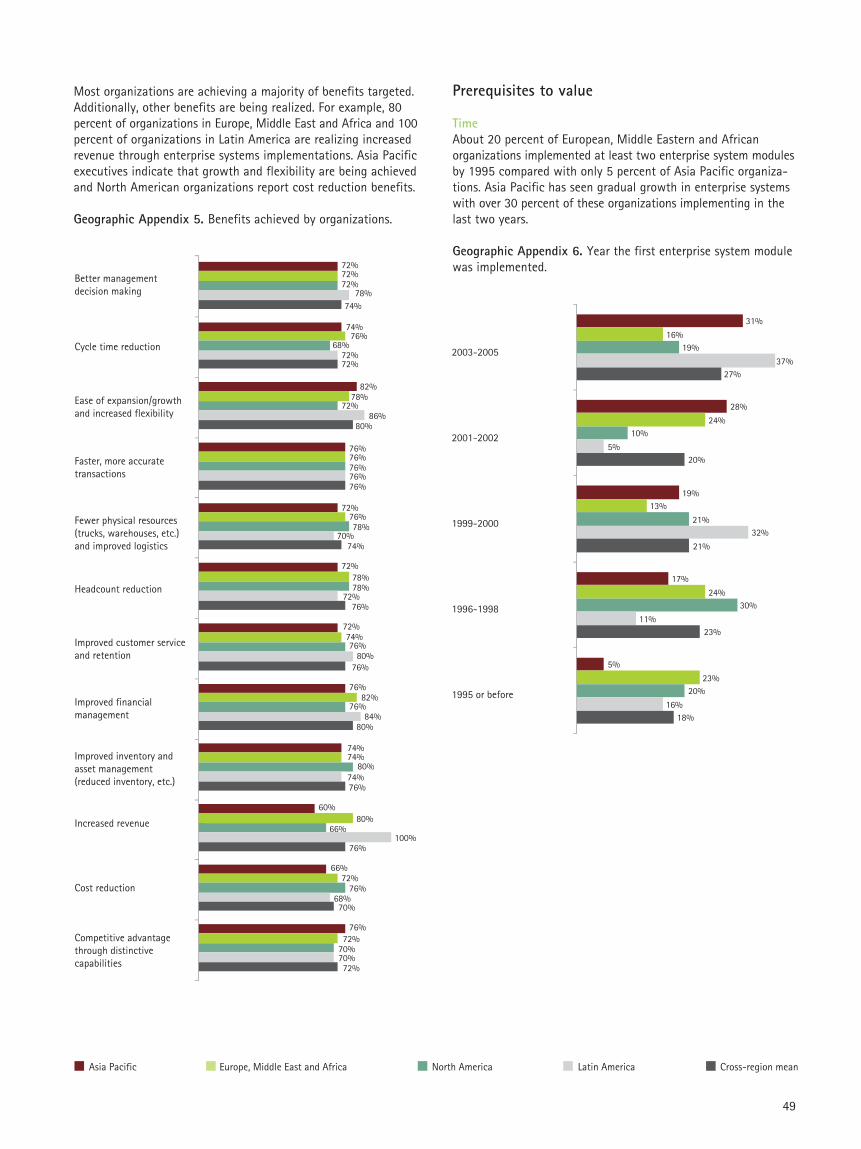
49
Most organizations are achieving a majority of benefits targeted.Additionally, other benefits are being realized. For example, 80percent of organizations in Europe, Middle East and Africa and 100percent of organizations in Latin America are realizing increasedrevenue through enterprise systems implementations. Asia Pacificexecutives indicate that growth and flexibility are being achievedand North American organizations report cost reduction benefits.
Geographic Appendix 5. Benefits achieved by organizations.
Cycle time reduction
Better management decision making
Ease of expansion/growth and increased flexibility
Faster, more accurate transactions
Fewer physical resources (trucks, warehouses, etc.) and improved logistics
Headcount reduction
Improved customer service and retention
Improved financial management
Improved inventory and asset management (reduced inventory, etc.)
Increased revenue
Cost reduction
Competitive advantage through distinctive capabilities
72%
74%
82%
76%
72%
72%
72%
76%
74%
60%
66%
76%
72%
76%
78%
76%
76%
78%
74%
82%
74%
80%
72%
72%
72%
68%
72%
76%
78%
78%
76%
76%
80%
66%
76%
70%
78%
72%
86%
76%
70%
72%
80%
84%
74%
100%
68%
70%
74%
72%
80%
76%
74%
76%
76%
80%
76%
76%
70%
72%
Prerequisites to value
TimeAbout 20 percent of European, Middle Eastern and Africanorganizations implemented at least two enterprise system modulesby 1995 compared with only 5 percent of Asia Pacific organiza-tions. Asia Pacific has seen gradual growth in enterprise systemswith over 30 percent of these organizations implementing in thelast two years.
Geographic Appendix 6. Year the first enterprise system modulewas implemented.
2003-2005
2001-2002
1999-2000
1996-1998
1995 or before
31%
28%
19%
17%
5%
16%
24%
13%
24%
23%
19%
10%
21%
30%
20%
37%
5%
32%
11%
16%
27%
20%
21%
23%
18%
Asia Pacific Europe, Middle East and Africa North America Latin America Cross-region mean
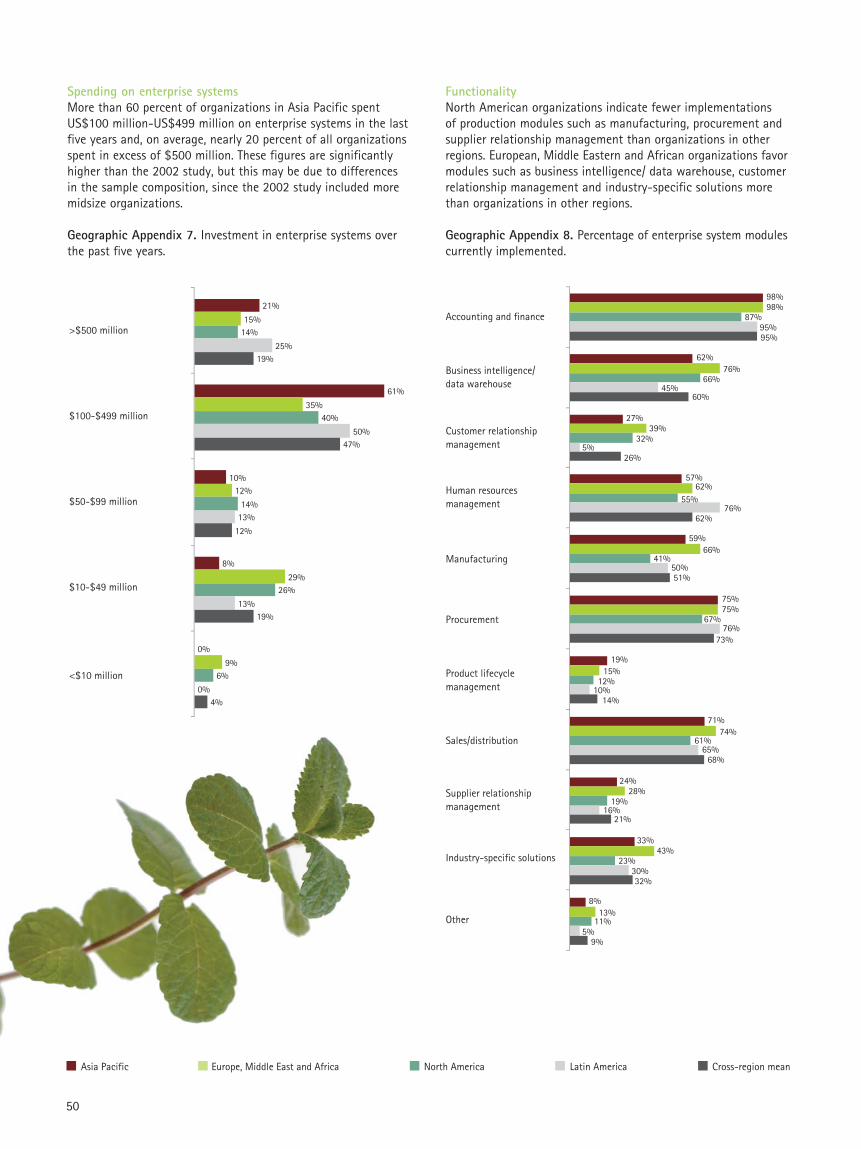
50
FunctionalityNorth American organizations indicate fewer implementations of production modules such as manufacturing, procurement andsupplier relationship management than organizations in otherregions. European, Middle Eastern and African organizations favormodules such as business intelligence/ data warehouse, customerrelationship management and industry-specific solutions morethan organizations in other regions.
Geographic Appendix 8. Percentage of enterprise system modulescurrently implemented.
Accounting and finance
Business intelligence/data warehouse
Customer relationshipmanagement
Human resources management
Manufacturing
Procurement
Product lifecyclemanagement
Sales/distribution
Supplier relationshipmanagement
Industry-specific solutions
Other
98%
62%
27%
57%
59%
75%
19%
71%
24%
33%
8%
98%
76%
39%
62%
66%
75%
15%
74%
28%
43%
13%
87%
66%
32%
55%
41%
67%
12%
61%
19%
23%
11%
95%
45%
5%
76%
50%
76%
10%
65%
16%
30%
5%
95%
60%
26%
62%
51%
73%
14%
68%
21%
32%
9%
Asia Pacific Europe, Middle East and Africa North America Latin America Cross-region mean
Spending on enterprise systemsMore than 60 percent of organizations in Asia Pacific spentUS$100 million-US$499 million on enterprise systems in the lastfive years and, on average, nearly 20 percent of all organizationsspent in excess of $500 million. These figures are significantlyhigher than the 2002 study, but this may be due to differencesin the sample composition, since the 2002 study included moremidsize organizations.
Geographic Appendix 7. Investment in enterprise systems overthe past five years.
>$500 million
$100-$499 million
$50-$99 million
$10-$49 million
<$10 million
21%
61%
10%
8%
0%
15%
35%
12%
29%
9%
14%
40%
14%
26%
6%
25%
50%
13%
13%
0%
19%
47%
12%
19%
4%
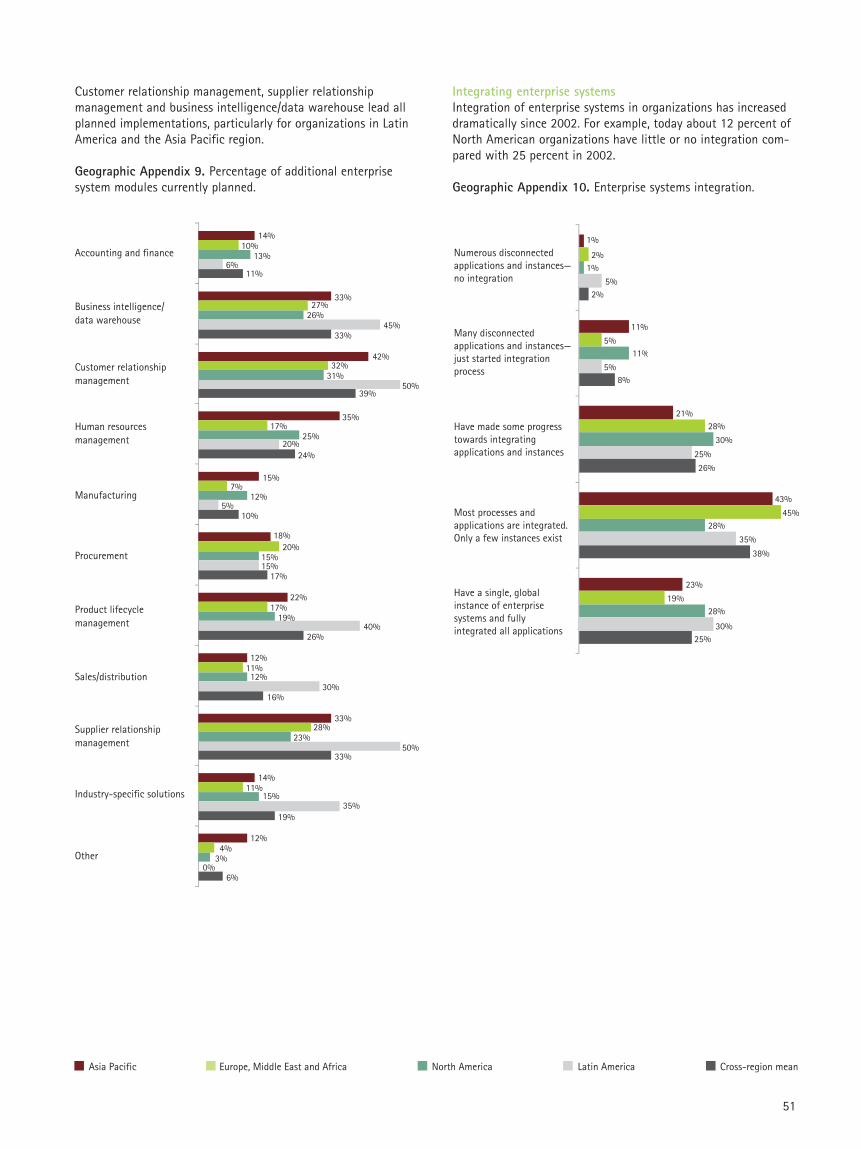
51
Customer relationship management, supplier relationship management and business intelligence/data warehouse lead allplanned implementations, particularly for organizations in LatinAmerica and the Asia Pacific region.
Geographic Appendix 9. Percentage of additional enterprisesystem modules currently planned.
Accounting and finance
Business intelligence/data warehouse
Customer relationshipmanagement
Human resources management
Manufacturing
Procurement
Product lifecyclemanagement
Sales/distribution
Supplier relationshipmanagement
Industry-specific solutions
Other
14%
33%
42%
35%
15%
18%
22%
12%
33%
14%
12%
10%
27%
32%
17%
7%
20%
17%
11%
28%
11%
4%
13%
26%
31%
25%
12%
15%
19%
12%
23%
15%
3%
6%
45%
50%
20%
5%
15%
40%
30%
50%
35%
0%
11%
33%
39%
24%
10%
17%
26%
16%
33%
19%
6%
Integrating enterprise systemsIntegration of enterprise systems in organizations has increaseddramatically since 2002. For example, today about 12 percent ofNorth American organizations have little or no integration com-pared with 25 percent in 2002.
Geographic Appendix 10. Enterprise systems integration.
Numerous disconnectedapplications and instances—no integration
Many disconnected applications and instances—just started integration process
Have made some progresstowards integrating applications and instances
Most processes and applications are integrated. Only a few instances exist
Have a single, global instance of enterprise systems and fully integrated all applications
1%
11%
21%
43%
23%
2%
5%
28%
45%
19%
1%
11%
30%
28%
28%
5%
5%
25%
35%
30%
2%
8%
26%
38%
25%
Asia Pacific Europe, Middle East and Africa North America Latin America Cross-region mean
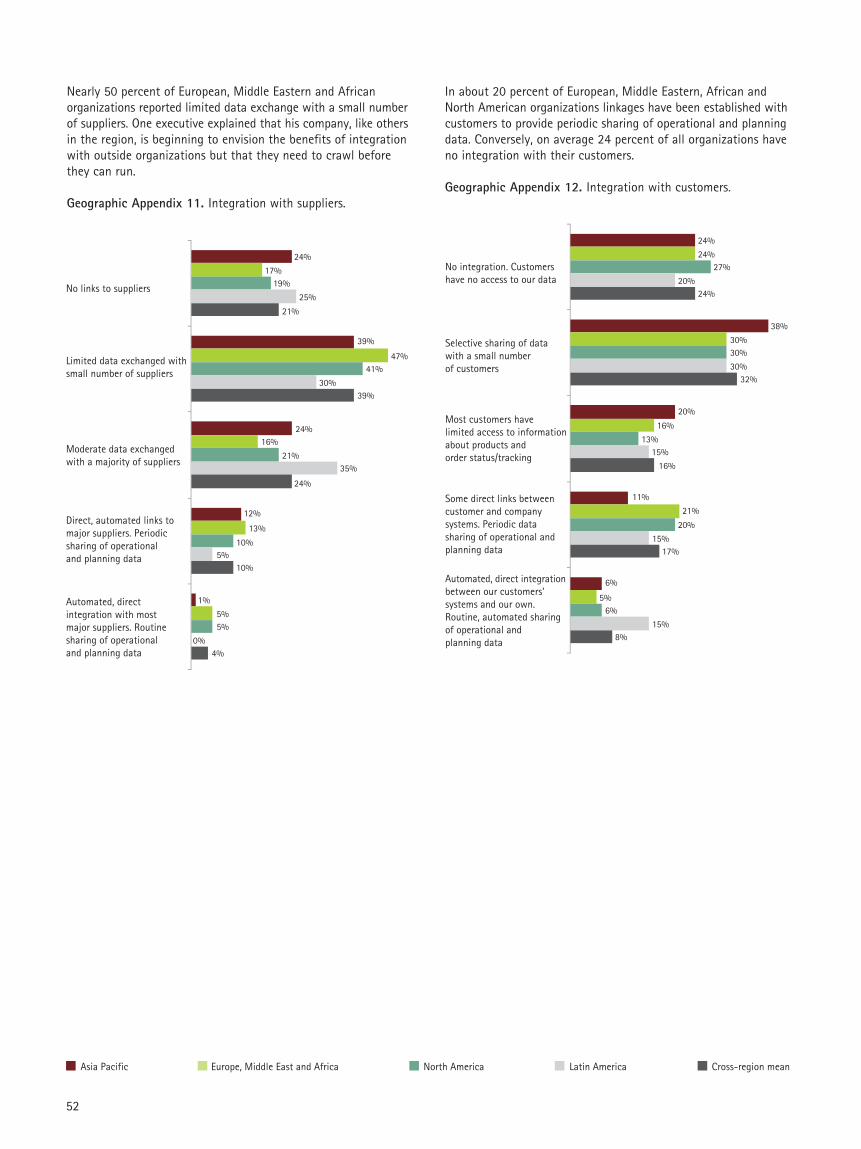
52
In about 20 percent of European, Middle Eastern, African andNorth American organizations linkages have been established withcustomers to provide periodic sharing of operational and planningdata. Conversely, on average 24 percent of all organizations haveno integration with their customers.
Geographic Appendix 12. Integration with customers.
No integration. Customers have no access to our data
Selective sharing of data with a small number of customers
Most customers have limited access to information about products and order status/tracking
Some direct links between customer and company systems. Periodic data sharing of operational and planning data
Automated, direct integration between our customers’ systems and our own. Routine, automated sharing of operational and planning data
24%
38%
20%
11%
6%
24%
30%
16%
21%
5%
27%
30%
13%
20%
6%
20%
30%
15%
15%
15%
24%
32%
16%
17%
8%
Asia Pacific Europe, Middle East and Africa North America Latin America Cross-region mean
Nearly 50 percent of European, Middle Eastern and Africanorganizations reported limited data exchange with a small numberof suppliers. One executive explained that his company, like othersin the region, is beginning to envision the benefits of integrationwith outside organizations but that they need to crawl beforethey can run.
Geographic Appendix 11. Integration with suppliers.
No links to suppliers
Limited data exchanged with small number of suppliers
Moderate data exchanged with a majority of suppliers
Direct, automated links to major suppliers. Periodic sharing of operational and planning data
Automated, direct integration with most major suppliers. Routine sharing of operational and planning data
24%
39%
24%
12%
1%
17%
47%
16%
13%
5%
19%
41%
21%
10%
5%
25%
30%
35%
5%
0%
21%
39%
24%
10%
4%
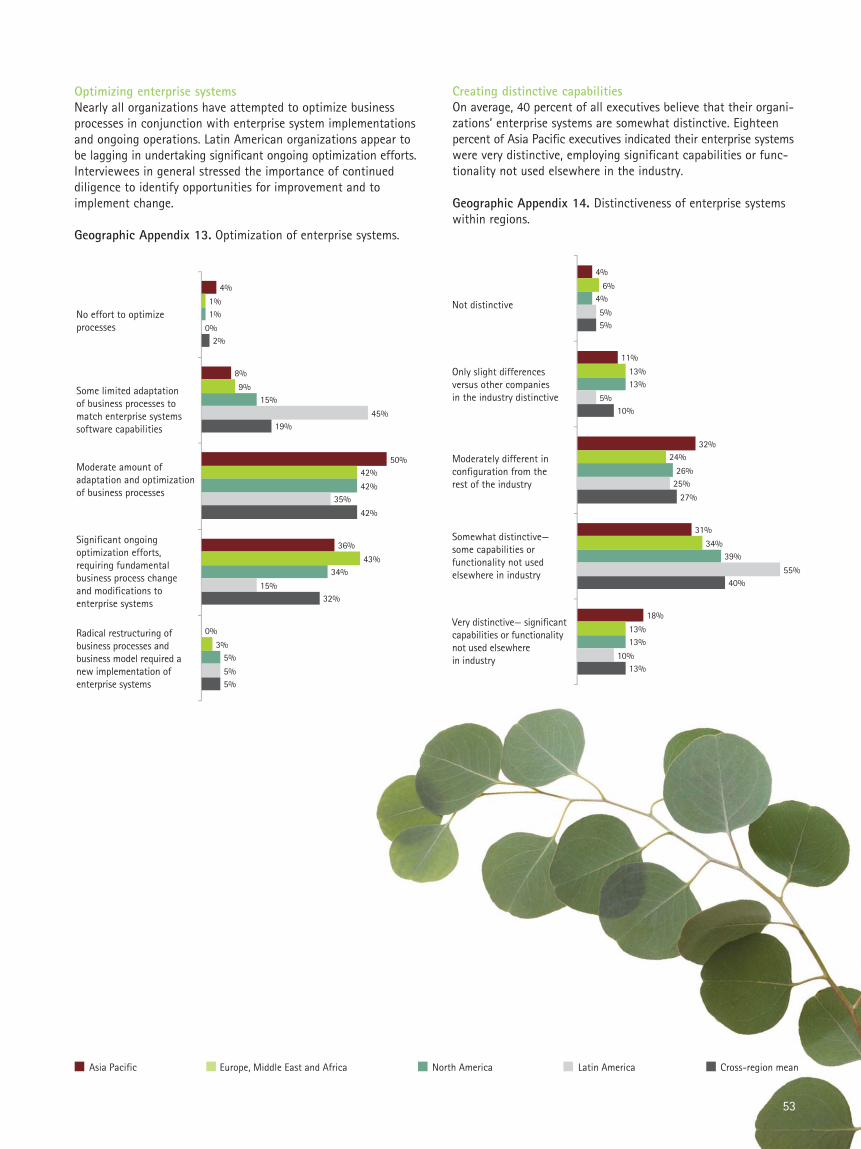
53
Optimizing enterprise systemsNearly all organizations have attempted to optimize businessprocesses in conjunction with enterprise system implementationsand ongoing operations. Latin American organizations appear tobe lagging in undertaking significant ongoing optimization efforts.Interviewees in general stressed the importance of continueddiligence to identify opportunities for improvement and toimplement change.
Geographic Appendix 13. Optimization of enterprise systems.
No effort to optimize processes
Some limited adaptation of business processes to match enterprise systems software capabilities
Moderate amount of adaptation and optimization of business processes
Significant ongoing optimization efforts, requiring fundamental business process change and modifications to enterprise systems
Radical restructuring of business processes and business model required a new implementation of enterprise systems
4%
8%
50%
36%
0%
1%
9%
42%
43%
3%
1%
15%
42%
34%
5%
0%
45%
35%
15%
5%
2%
19%
42%
32%
5%
Creating distinctive capabilitiesOn average, 40 percent of all executives believe that their organi-zations’ enterprise systems are somewhat distinctive. Eighteenpercent of Asia Pacific executives indicated their enterprise systemswere very distinctive, employing significant capabilities or func-tionality not used elsewhere in the industry.
Geographic Appendix 14. Distinctiveness of enterprise systemswithin regions.
Not distinctive
Only slight differences versus other companies in the industry distinctive
Moderately different in configuration from the rest of the industry
Somewhat distinctive— some capabilities or functionality not used elsewhere in industry
Very distinctive— significant capabilities or functionality not used elsewhere in industry
4%
11%
32%
31%
18%
6%
13%
24%
34%
13%
4%
13%
26%
39%
13%
5%
5%
25%
55%
10%
5%
10%
27%
40%
13%
Asia Pacific Europe, Middle East and Africa North America Latin America Cross-region mean
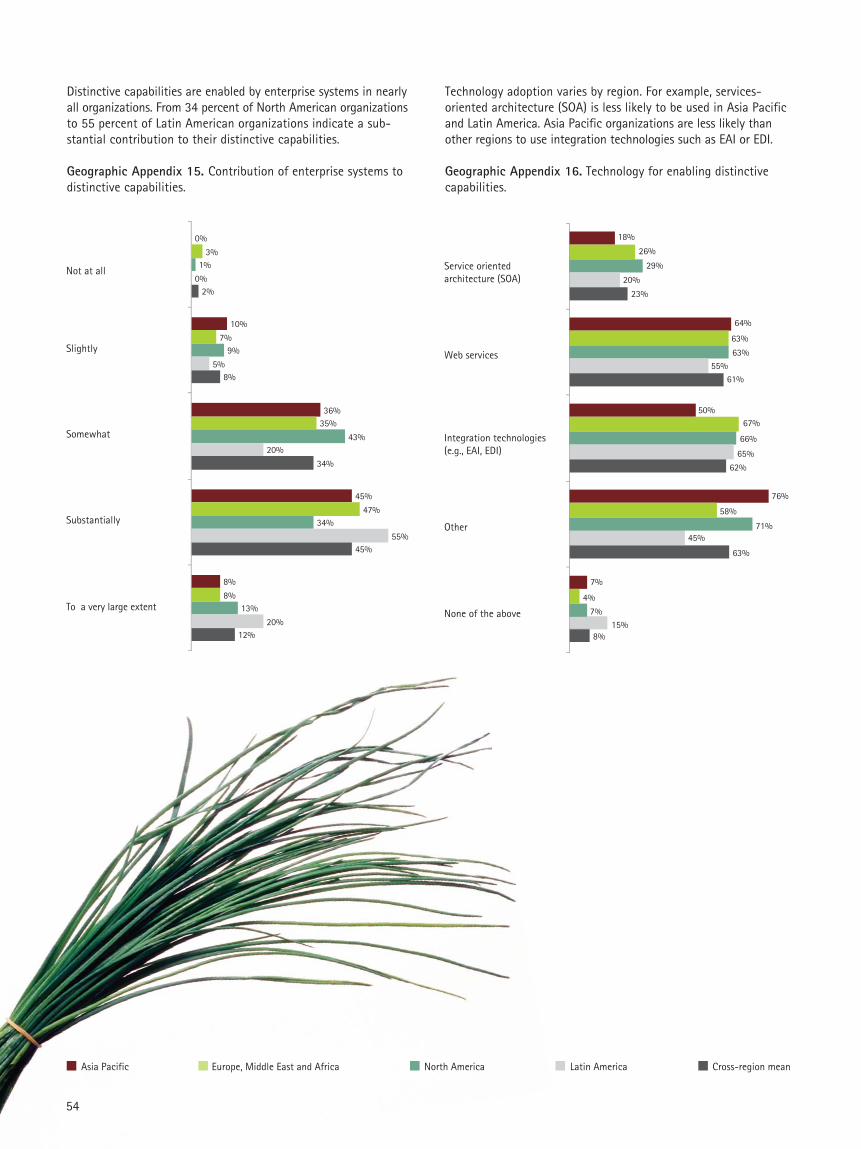
54
Technology adoption varies by region. For example, services-oriented architecture (SOA) is less likely to be used in Asia Pacificand Latin America. Asia Pacific organizations are less likely thanother regions to use integration technologies such as EAI or EDI.
Geographic Appendix 16. Technology for enabling distinctivecapabilities.
Service oriented architecture (SOA)
Web services
Integration technologies (e.g., EAI, EDI)
Other
None of the above
18%
64%
50%
76%
7%
26%
63%
67%
58%
4%
29%
63%
66%
71%
7%
20%
55%
65%
45%
15%
23%
61%
62%
63%
8%
Asia Pacific Europe, Middle East and Africa North America Latin America Cross-region mean
Distinctive capabilities are enabled by enterprise systems in nearlyall organizations. From 34 percent of North American organizationsto 55 percent of Latin American organizations indicate a sub-stantial contribution to their distinctive capabilities.
Geographic Appendix 15. Contribution of enterprise systems todistinctive capabilities.
Not at all
Slightly
Somewhat
Substantially
To a very large extent
0%
10%
36%
45%
8%
3%
7%
35%
47%
8%
1%
9%
43%
34%
13%
0%
5%
20%
55%
20%
2%
8%
34%
45%
12%
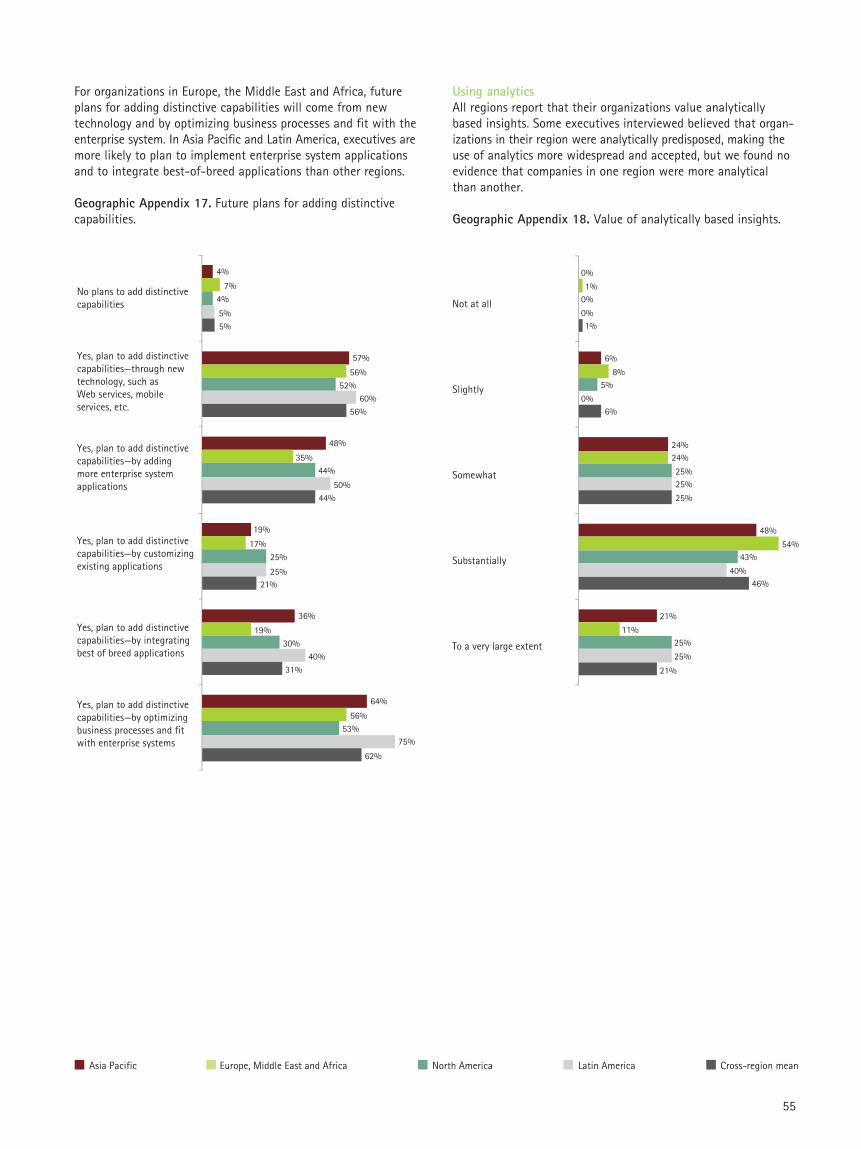
55
For organizations in Europe, the Middle East and Africa, futureplans for adding distinctive capabilities will come from newtechnology and by optimizing business processes and fit with theenterprise system. In Asia Pacific and Latin America, executives aremore likely to plan to implement enterprise system applicationsand to integrate best-of-breed applications than other regions.
Geographic Appendix 17. Future plans for adding distinctivecapabilities.
No plans to add distinctivecapabilities
Yes, plan to add distinctivecapabilities—through new technology, such as Web services, mobile services, etc.
Yes, plan to add distinctive capabilities—by adding more enterprise system applications
Yes, plan to add distinctive capabilities—by customizing existing applications
Yes, plan to add distinctive capabilities—by integrating best of breed applications
Yes, plan to add distinctive capabilities—by optimizing business processes and fit with enterprise systems
4%
57%
48%
19%
36%
64%
7%
56%
35%
17%
19%
56%
4%
52%
44%
25%
30%
53%
5%
60%
50%
25%
40%
75%
5%
56%
44%
21%
31%
62%
Using analyticsAll regions report that their organizations value analyticallybased insights. Some executives interviewed believed that organ-izations in their region were analytically predisposed, making theuse of analytics more widespread and accepted, but we found noevidence that companies in one region were more analyticalthan another.
Geographic Appendix 18. Value of analytically based insights.
Not at all
Slightly
Somewhat
Substantially
To a very large extent
0%
6%
24%
48%
21%
1%
8%
24%
54%
11%
0%
5%
25%
43%
25%
0%
0%
25%
40%
25%
1%
6%
25%
46%
21%
Asia Pacific Europe, Middle East and Africa North America Latin America Cross-region mean
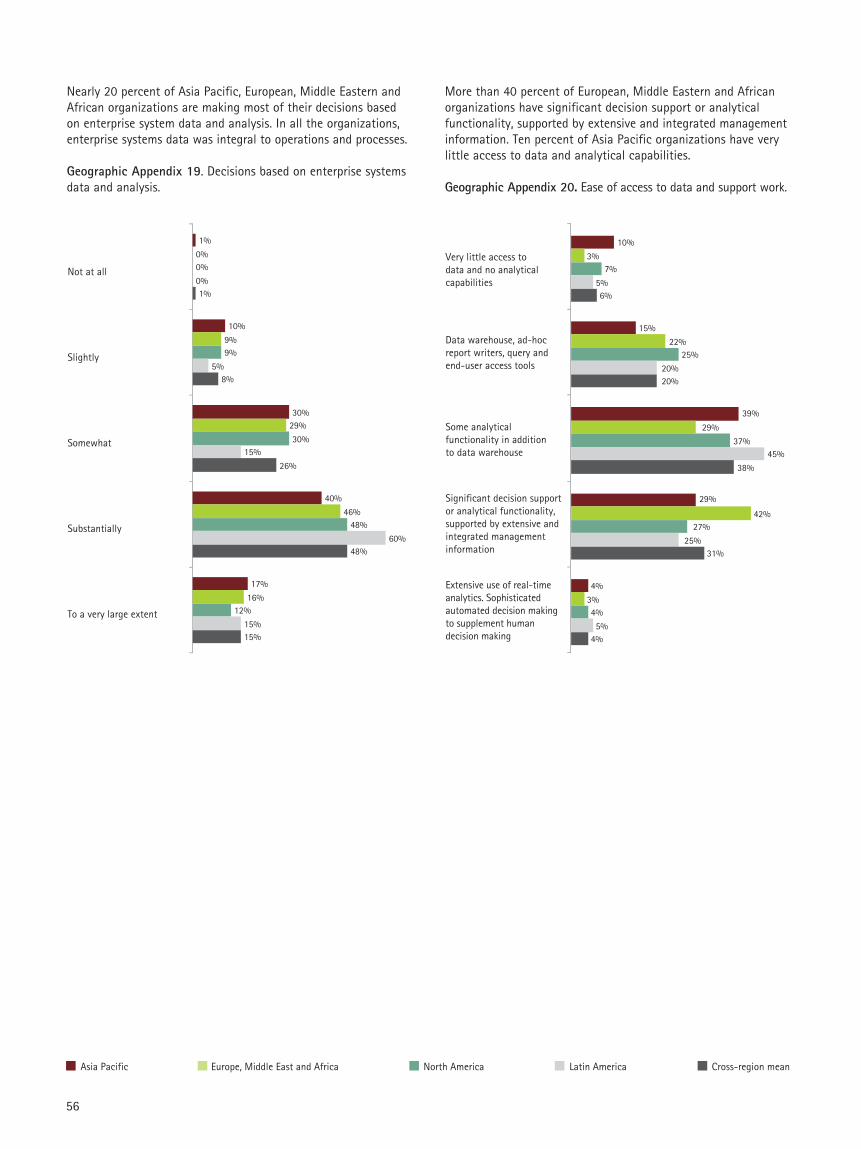
56
More than 40 percent of European, Middle Eastern and Africanorganizations have significant decision support or analyticalfunctionality, supported by extensive and integrated managementinformation. Ten percent of Asia Pacific organizations have verylittle access to data and analytical capabilities.
Geographic Appendix 20. Ease of access to data and support work.
Very little access to data and no analyticalcapabilities
Data warehouse, ad-hoc report writers, query and end-user access tools
Some analyticalfunctionality in addition to data warehouse
Significant decision support or analytical functionality, supported by extensive and integrated management information
Extensive use of real-time analytics. Sophisticated automated decision making to supplement human decision making
10%
15%
39%
29%
4%
3%
22%
29%
42%
3%
7%
25%
37%
27%
4%
5%
20%
45%
25%
5%
6%
20%
38%
31%
4%
Asia Pacific Europe, Middle East and Africa North America Latin America Cross-region mean
Nearly 20 percent of Asia Pacific, European, Middle Eastern andAfrican organizations are making most of their decisions basedon enterprise system data and analysis. In all the organizations, enterprise systems data was integral to operations and processes.
Geographic Appendix 19. Decisions based on enterprise systemsdata and analysis.
Not at all
Slightly
Somewhat
Substantially
To a very large extent
1%
10%
30%
40%
17%
0%
9%
29%
46%
16%
0%
9%
30%
48%
12%
0%
5%
15%
60%
15%
1%
8%
26%
48%
15%
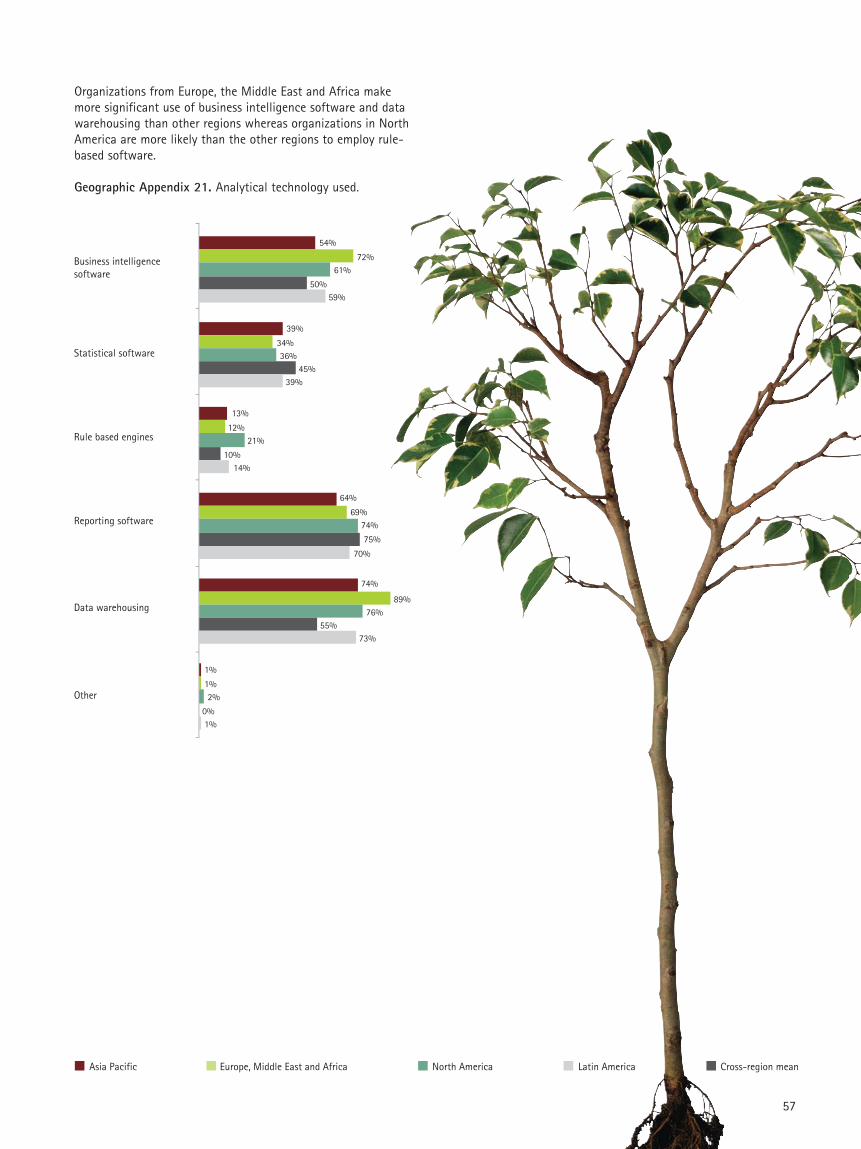
57
Organizations from Europe, the Middle East and Africa makemore significant use of business intelligence software and datawarehousing than other regions whereas organizations in NorthAmerica are more likely than the other regions to employ rule-based software.
Geographic Appendix 21. Analytical technology used.
Statistical software
Business intelligence software
Rule based engines
Reporting software
Data warehousing
Other
54%
39%
13%
64%
74%
1%
72%
34%
12%
69%
89%
1%
61%
36%
21%
74%
76%
2%
50%
45%
10%
75%
55%
0%
59%
39%
14%
70%
73%
1%
Asia Pacific Europe, Middle East and Africa North America Latin America Cross-region mean
58
Part IV. Regional snapshots
Asia Pacific
Eighty-four executives from 12 countries provided their insightsthrough the Web survey and 33 percent indicate that a majorityof the targeted benefits have been realized from enterprise systems. Sixty one percent of organizations in the Asia Pacificregion indicated that better decision making was the mostimportant objective. However, benefits such as ease of expansion/growth and use of fewer physical resources were also achieved.More than 60 percent of executives indicated their organizationalspending on enterprise systems over the last five years wasbetween $US100 million-$US499 million and most processes andapplications are integrated. Limited data exchange with suppliersand selective data sharing with customers is under way as is amoderate amount of process optimization. Forty-five percent ofAsia Pacific executives believe their enterprise systems contributeto their organizations' distinctive capabilities and 40 percentindicate that their organizations' decisions are based on enterprisesystems data and analysis.
Europe, Middle East and Africa
One hundred and one executives from 16 countries participated inthis study from this region. Nearly 60 percent indicate that amajority of the targeted benefits have been realized from enter-prise systems. About 50 percent of organizations in this regionindicated that better decision making was the most importantobjective. However, benefits such as increased revenue andheadcount reduction were also achieved. A full range of modulesis implemented throughout the region and plans include customerrelationship management, supplier relationship management andbusiness intelligence/data warehouse. Most processes and appli-cations are integrated and 47 percent report limited data exchangewith a small number of suppliers. More than 40 percent oforganizations in this region are undergoing significant businessprocess change. Enterprise systems are substantially supportingdistinctive capabilities in nearly 50 percent of the organizations.Analytics is valued and being used as 46 percent of executivesindicates that their organization substantially bases its decisionson enterprise system data and analysis.
North America
One hundred and twenty-eight executives from the United Statesand Canada participated in this study. North American organiza-tions are achieving benefits from enterprise systems such asimproved financial management, faster, more accurate transac-tions, and improved inventory and asset management. Nearly 30percent of North American organizations report having a singleglobal instance of enterprise systems with applications integrated.Twenty percent of organizations have some direct links withcustomers and 10 percent report direct, automated links to majorsuppliers. Process optimization efforts, requiring fundamentalbusiness change, are occurring in about 34 percent of NorthAmerican organizations. This work is also focused on enablingdistinctive capabilities as 53 percent of executives indicate thatprocess change and fit with enterprise systems will add to theirdistinctive capabilities. Analytics is valued and being used as 48percent of North American executives report that enterprise sys-tems data are used for making decisions.
Latin America
Nineteen executives from five countries responded to the surveyfrom Latin America. The primary benefits realized were greaterflexibility for growth, improved financial management and betterdecision making. Latin American organizations are implementinga full range of enterprise systems applications including humanresource management and are planning many more applicationsas 37 percent of implementations occurred in the last two years.Latin American companies reported significantly more dataexchange with suppliers than other regions and much less processoptimization. Fifty-five percent of Latin American organizationsindicate that their enterprise systems contribute to their distinctivecapabilities. In 45 percent of organizations, some analyticalcapability is available in addition to a data warehouse.

59


Copyright © 2006 AccentureAll rights reserved.
Accenture, its logo, and High Performance Deliveredare trademarks of Accenture.
About Accenture
Accenture is a global management con-sulting, technology services and outsourc-ing company. Committed to deliveringinnovation, Accenture collaborates withits clients to help them become high-performance businesses and governments.With deep industry and business processexpertise, broad global resources and aproven track record, Accenture can mobi-lize the right people, skills and technologiesto help clients improve their performance.With more than 129,000 people in 48countries, the company generated netrevenues of US$15.55 billion for the fiscalyear ended August 31, 2005. Its homepage is www.accenture.com.
About the AccentureInstitute for HighPerformance BusinessThe Accenture Institute for High Perfor-mance Business creates strategic insightsinto key management issues through ori-ginal research and analysis. Its manage-ment researchers combine world-classreputations with Accenture’s extensiveconsulting, technology, and outsourcingexperience to conduct innovative researchand analysis into how organizationsbecome and remain high-performancebusinesses. Its home page is www.accenture.com/institute and may becontacted at [email protected].