new century maths 11 mathematics general preliminary ... · pdf file1 new century maths 11...
TRANSCRIPT

1
New Century Maths 11 Mathematics General
Preliminary course (Pathway 2)
Worked Solutions
Chapter 1
SkillCheck
1 a sector graph b stem-and-leaf plot c line graph d divided bar graph
3 a 20 b 5 c 500
4 a 38
b 3 1100 37 %8 2× =
5 a !"#°
!"#°= !
!"
b !!"×100 = 35%
6 !"!!"!
= 24.5
Exercise 1-01
1 a 13.4% b 13% 8% 5%− = = 5% (to the nearest whole number)
c 10.8% of 35 650 10.8 35650100
= ×
3850≈ d 100% – 13.4% = 86.6%
86.6% of 42 320 86.6 42320100
= ×
36650≈ e The percentage of people drinking at a risky
level will be higher.
2 a 14
b labour
c 15% of 13.50
15 13.501002.025$2.03
= ×
=
≈
d 5% $285=
2851%5
=
100% 57 100= ×
$5700=
e 15% of 360 o
15 36010054
= ×
=
o
o
f 20% of $5300
20 5300100$1060
= ×
=
3 a The bar measures 120 mm.
20 1120 6
=
b
42 100 35%120
× =
c

2
45 100 37.5% ( )120
suspicious× =
d
7 275 16 fires
120× ≈
4 a male
b 25–34
c 32%
d 8% of 14 205 = 1136.4 1136≈ e 65–74
f decreases
5 13.7 – 8.9 = 4.8 h. So, B.
6 a Yes
b underweight
c Minimum BMI = 17.5
d 2
78BMI 26.061.73
= =
It would be suggested that Jake needs to lose weight. e 16 to 25
f Answers will vary.
7 a 1 mm
b number of rain days
c 23 mm; 4
d October; 24.5 mm
e July; 6
f April (lowest rainfall)
g 9
8 9% 2475=
24751%9
=
00% 275 100= × 27 500= So, A. 9 a share prices over 6 days
b 25c
c $4.55
d Tuesday
e It fell, then rose.
f Thursday; lowest price.
g NCM Bank
10 a 17
b East; 25 on Thursday
c Monday; first working day
d Wednesday; 23 – 17 = 6
e Saturday; no industry
Exercise 1-02
1 a The vertical axis starts at $1.50 so increases in share price appear steeper than they actually are.
2 a Because the 2010 picture is double the length and double the width, it is actually four times the size of the 2008 picture instead of two times the size.

3
3 a a company’s sales
b The new director has made sales go down.
c sales figures and months
4 a The $800 note is double the length and double the width of the $400 note and this makes it four times the size of the $400 note instead of two times the size.
5 a By starting the scale on the vertical axis at 53.
c The Labor votes are not overwhelmingly higher. They are just 8 more. 6 a The picture for ‘$100 of oil today’ is actually
about 13
the size of the picture for ‘10 years ago’.
b
$100 of oil today $100 of oil 10 years ago
7 a 7 hours b The hours scale does not begin at 0. c Most of the day is spent at school or sleeping. d
Exercise 1-03
1 a C b Q c C d Q e Q f C
g C h C i Q j Q k Q l C
2 Categorical (words, symbols);
Quantitative (quantities, numbers)
3 a N b O c O d N e N f O
g O h N
4 a C b C c C d C e D f C
g D h C
5 a HSC subjects
b size of hot chips at a fast food store
c number of children in a family
d heights of boys in Year 11
6 a quantitative b categorical
c continuous d nominal
7 B
Exercise 1-04
1 a C b F c D d H e E
f I g A h G i B
2 a Commonwealth Scientific and Industrial Research Organisation

4
b Road Traffic Authority
c United Nations Children’s Fund
d Government Insurance Office
e Bureau of Meteorology
f Australian Securities Exchange
g Australian Security Intelligence Organisation
h World Health Organisation
i National Rugby League
3–4 Teacher to check.
5 a stage 5
b stage 1
c stage 4
d stage 2
6 Teacher to check.
7 a bank account details, amount of transaction, time and date
b personal details, email address, interests and preferences
c your location, time and date of message
d amount of spending, your location
e your location and speed, time and date of driving
f type of book/video borrowed, time and date, your location
8 theft of identity; money stolen from accounts
Exercise 1-05
1 a C b S c S d C e S f S g C h S
2 2016, 2021
3 Teacher to check reasons.
a systematic b random c stratified
d random e random f random
g random h random
4 Total = 4851
female3347 2004851
= ×
137.99...138
=
≈ 5 Total = 830 960
260450West 600830960
= ×
188.05...188
=
≈
6 Total = 38
5Teachers 838
= ×
1.05...1
=
≈ So, B.
7a Not all teens read magazines.
b Only those diners interested/volunteering to complete the survey are sampled.
c Need to select more students and not only those who arrive early.
d Need to sample workers as well, not only management who may have a biased view.
e People at a premiere are not the usual moviegoers.
f It is restricted to one radio station.
8a systematic sample
b shoppers in 1 store only; only females or males
Exercise 1-06
1 a

5
b data is discrete (not continuous)
c 3
d 6; 1 student
e Total = 2 + 1 = 3
3 100% 7.5%4× =
2 a shows parts of the whole amount
b 235000home loan 360 106800000
= × ≈o o
96000new car 360 43800 000
= × ≈o o
144000home reno 360 65800000
= × ≈o o
125 000travel 360 56800 000
= × ≈o o
200000savings 360 90800 000
= × =o o
c saved it
d 144000 9800 000 50
=
e 96 000 100% 12%800 000
× =
3 a 3460 855 4140 4215 2300 14 970+ + + + =
b sector; divided bar; column
c Draw a bar 6 cm long (could choose any length)
3460ABC 6 1.414 970
= × ≈ cm
855SBS 6 0.314 970
= × ≈ cm
4140Seven 6 1.714 970
= × ≈ cm
4215Nine 6 1.714 970
= × ≈ cm
2300Ten 6 0.914 970
= × ≈ cm
d 3460 100% 23%14970
× ≈
e Seven and Nine 4140 4215= + = 8355 Yes, this is more than half of 14 970.

6
f No, since the survey only included Sydney
households.
4 a 7 5 11 21 15 9 4 72+ + + + + + =
b column graph; discrete data
c 7 100% 9.7%12× ≈
d Total ‘no more than 3’ = 7 5 11 21 44+ + + = 44 1172 18
∴ =
5 D
6 a Total 20 35 7 10 3 12 6 93= + + + + + + =
Draw a bar 7.2 cm long (could choose any length)
UK 20 7.2 1.5 cm93
= × ≈
NZ 35 7.2 2.7 cm93
= × ≈
Mid East 7 7.2 0.5 cm93
= × ≈
India 10 7.2 0.8 cm93
= × ≈
Africa = 3 7.2 0.2 cm93× ≈
6Other 7.2 0.593
= × ≈ cm
b UK and NZ = 20 + 35 = 55 which is more than half of the 93 ∴ True
c 12 493 31
=
d 7 100% 8%93× ≈
e 10.75% of 93
10.75 931009.97510
= ×
=
≈ ∴ India
b 2003
c 2006
d home theft
e home thefts rose from 2001 to 2003, then declined steadily.
f Decreased; table and graph show a steady decline.
Exercise 1-07

7
3 a 6 14 28 11 8 3 70 people+ + + + + =
6 a none
b 7 3 4 1 2 5 6 3 2 4 6 43+ + + + + + + + + + =
c 7 100% 16.3%43× ≈

8
d No, since the last column only tells those who made more than 30 calls.
Exercise 1-08
2 a 10
b mode = most frequent = 7
c 12; a student with big feet
d 4 210 5
=
5 a 30
b
15 100% 50%30× =
c around 6–10
d Mostly good results but 3 quite low scores

9
b
5 100% 25%20× =
b
26 100% 87%30× ≈
c 28; raining day and few customers 8 a 36
b 91 seconds
c
10 100% 28%36× ≈
b 10
c 110, heart is beating quickly
d 4 people had a heart rate less than 60 beats per minute
10 a $975 000
b 50
c $385 000
b 24
c i 11.6 s ii 18.7 s
d 12 100% 50%24× =
e 524
Exercise 1-09
1 a 41 Co
b 5.00 a.m.; 37.5 Co
c 8
d 7.00 a.m. and 9.00 a.m.
e 7.00 a.m., 42 37.5 4.5 C− = o
f temperature dropped 2 Co then increased 2 Co
2 a B
b April and December
c July
d Miami
e 27 12 15 C− = o

10
b 60 at 3.00 a.m.
c She was sleeping.
d from 6.00 p.m. to 9.00 p.m.
e No, only possible to know the actual readings.
4 a about 70 mm; September
b about 70 mm; October
c Sydney
d Melbourne
e March and June are about the same.
b 5
c June
d 1400; May
e Bill; he sells more plants.
6 a i sector graph; divided bar graph
ii dot plots; stem-and leaf plots
iii frequency histogram and polygon
iv line graphs; radar chart
b stem-and-leaf plot
c radar chart
d columns graph, line graph, frequency histogram, frequency polygon
Sample HSC problem
a A
b Select some fans from each teams home
ground.
c 23% of 360
23 36010082.883
= ×
=
≈ o d
4500 100% 15%3000
× =
∴ players’ salaries e Doesn’t show exact values; it is difficult to
compare similar values.
Revision
1 a 1477
b rectum
c 6
d prostate = 5950
Next 3 cancers 2024 1853 1477 5354= + + =
∴ True

11
e These cancers do not represent parts of a whole.
b sector graph, divided bar graph
3 a Q b C c C d Q e Q f C
4 b N c O f N
5 a QD c QC d QC e QD
6 Teacher to check.
7 Stage 4: Summarising and displaying data.
8 Systematic, for example, take every 10th bottle and test
9 a The sample may not necessarily take students from each Year into account.
b Total = 114 120 114 128 105 96+ + + + + = 677 Number of yr 10 students
128 506779.453...9
= ×
=
≈
11 a 3 8 32 28 17 5 93+ + + + + =
b 30 : 360 1293× ≈o o
81 3: 360 3193
− × ≈o o
324 10 : 360 12493
− × ≈o o
281 1 20 : 360 10893
− × ≈o o
17 21 30 : 360 6693
− × ≈o o
5 31 : 360 1993
+ × ≈o o
c 12o
d 32 100% 34.4%93× =
e 11 or more countries = 28 17 5 50+ + = , which is more than half of 93
∴ True f The data is not continuous; the class intervals
are not equal in size.
d 60–<70
e 8 140 5
=
12
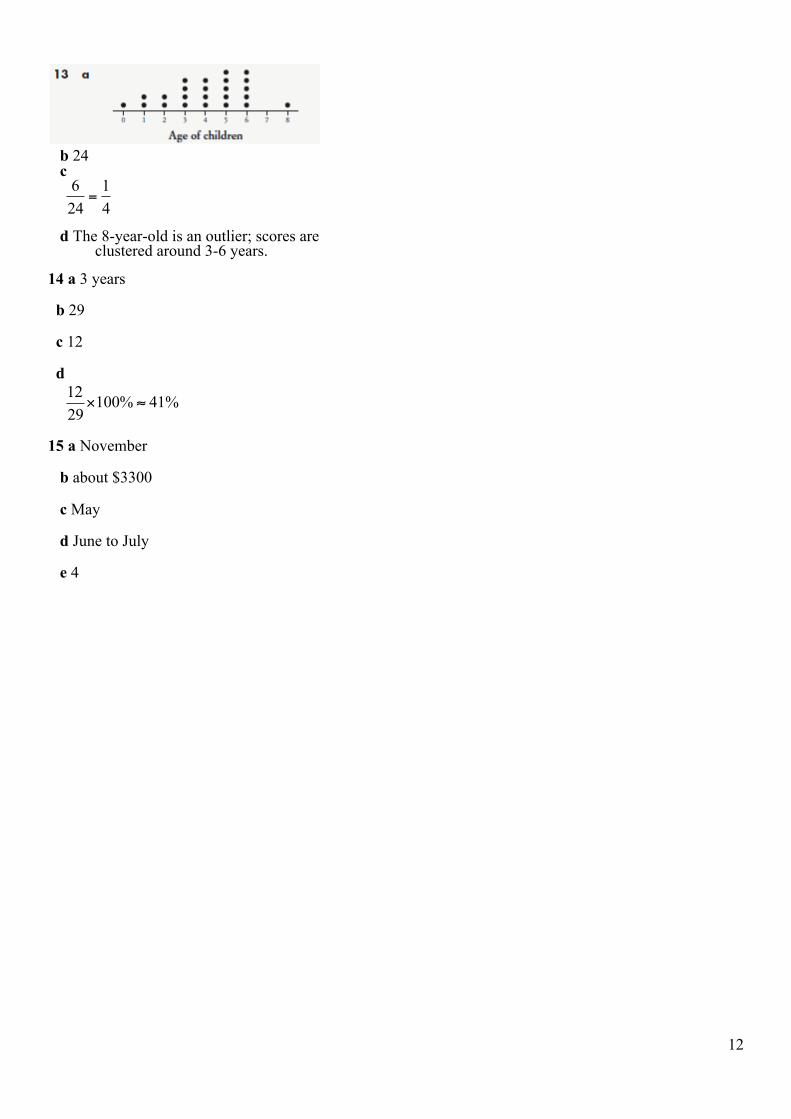
b 24 c
6 124 4
=
d The 8-year-old is an outlier; scores are clustered around 3-6 years.
14 a 3 years
b 29
c 12
d
12 100% 41%29× ≈
15 a November
b about $3300
c May
d June to July
e 4