new advances in measurement
DESCRIPTION
New Advances in Measurement. Ronald D. Rogge. TOPICS. RELATIONSHIP QUALITY T1 : IRT Optimization Study 1 T2 : Responsiveness to Change Studies 2-5 T3 : Bi-Dimensional View Studies 6-7 T4 : Implicit Measures Studies 8-11 ATTENTION T5 : Screening for Error Variance Studies 12-16. - PowerPoint PPT PresentationTRANSCRIPT

New Advances in Measurement
Ronald D. Rogge
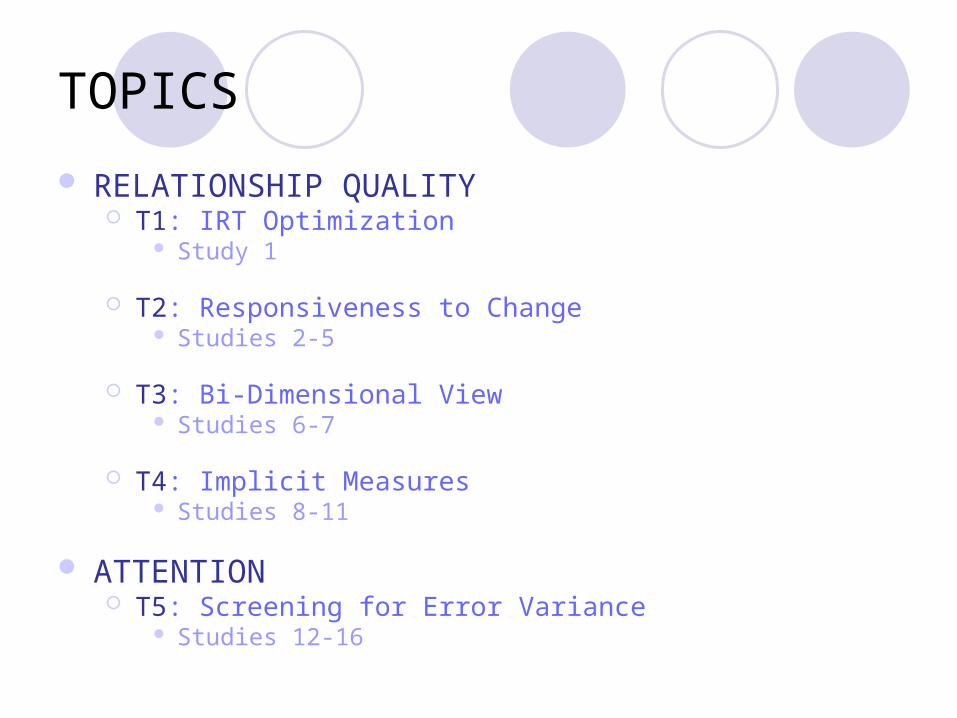
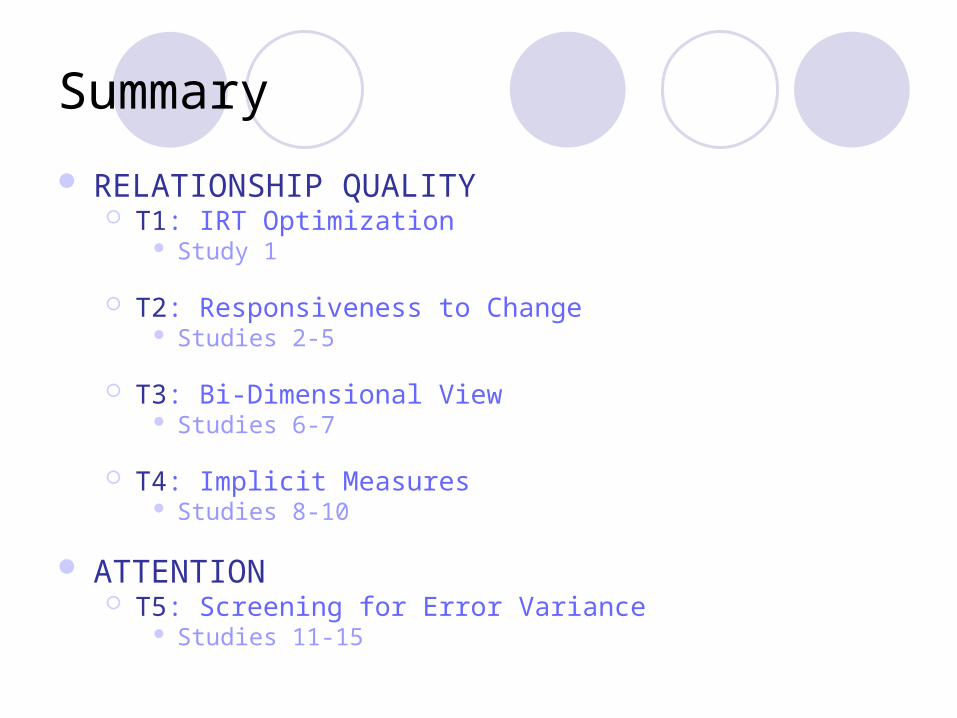
TOPICS
RELATIONSHIP QUALITY T1: IRT Optimization
Study 1
T2: Responsiveness to Change Studies 2-5
T3: Bi-Dimensional View Studies 6-7
T4: Implicit Measures Studies 8-11
ATTENTION T5: Screening for Error Variance
Studies 12-16

Acknowledgements
Couples Satisfaction Index Janette Funk, Mike Maniaci, Maria Saavedra, Soonhee
Lee
Positive-Negative Relationship Quality Frank Fincham, Richard Mattson, Matt Johnson
C.A.R.E. Program Tom Bradbury, Rebecca Cobb, Matt Johnson, Erika
Lawrence, Lisa Story, Lexi Rothman
Implicit Assessment Soonhee Lee, Harry Reis
Attention / Effort Mike Maniaci, Janette Funk, Soonhee Lee, Maria
Saavedra

Relationship Quality
Relationship satisfactionSelf-report scales (DAS, MAT, QMI)30-50 years of research (over 4K studies)Excellent correlational validity
Level of noise?Responsive to change over time?Are these the “best” items?

TOPIC 1: IRT Optimization
Large sample method N at least 1,000 in smallest group
Large item pool Unidimensional Non-redundant
Used by ETS SAT, GRE, MCAT, LSAT
Quality of each item Information Noise
Advantages Over correlations Over small sample methods

IRT Approach
Latent scores () for each subject Like GRE scores Assessing relationship satisfaction
Parameters for each item Response curves Higher ’s higher responses?
Item Responsiveness How informative? Where informative?
Creates information profiles For individual items For sets of items

Study 1 - Measures
141 satisfaction items: DAS, MAT, RAS, KMS, QMI, SMD 71 additional items
7 anchor scales: Neuroticism (EPQ-N) Conflict / Communication (MCI, CPQ, IAI) Stress (PSS) Sexual Chemistry (Eros) Instability (MSI)
2 validity scales: Inconsistency (PAI) Infrequency (PAI)

Study 1 - Sample
5,315 online respondents After removing:
• Incomplete or invalid responses• Multivariate outliers
26yo (10yrs) 83% Female 76% Caucasian 26% High school ed. or lower $27K average income
24% married, 16% engaged, 60% dating

Evaluating Previous Scales
IRT results
Simultaneous analysis
66 items of existing scales
Some very informative items
Many poor items
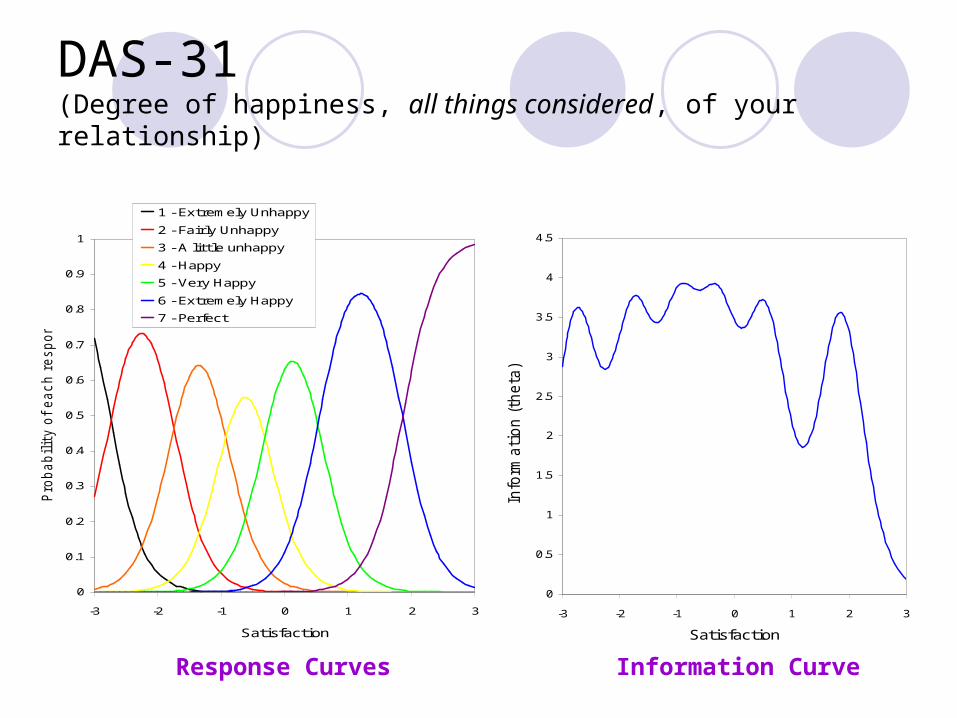
DAS-31 (Degree of happiness, all things considered, of your relationship)
0
0.1
0.2
0.3
0.4
0.5
0.6
0.7
0.8
0.9
1
-3 -2 -1 0 1 2 3
Satisfaction
Pro
babilit
y o
f each r
esponse .
1 - Extremely Unhappy
2 - Fairly Unhappy
3 - A little unhappy
4 - Happy
5 - Very Happy
6 - Extremely Happy
7 - Perfect
0
0.5
1
1.5
2
2.5
3
3.5
4
4.5
-3 -2 -1 0 1 2 3
Satisfaction
Info
rmati
on (th
eta
) .
Response Curves Information Curve

DAS/MAT 5Agreement on: FRIENDS
0
0.1
0.2
0.3
0.4
0.5
0.6
0.7
0.8
0.9
1
-3 -2 -1 0 1 2 3
Satisfaction
Pro
babilit
y o
f each r
esponse . 1 - Always Disagree
2 - Almost Always Disagree
3 - Frequently Disagree
4 - Occasionally Disagree
5 - Almost Always Agree
6 - Always Agree
0
0.5
1
1.5
2
2.5
3
3.5
4
4.5
-3 -2 -1 0 1 2 3
Satisfaction
Info
rmati
on (th
eta
) .
Response Curves Information Curve

MAT 12In leisure time, do you (and does your mate) prefer to be “on the go” or to stay at home?
0
0.1
0.2
0.3
0.4
0.5
0.6
0.7
0.8
0.9
1
-3 -2 -1 0 1 2 3
Satisfaction
Pro
babilit
y o
f each r
esponse . 1 - Mismatch
2 - Both on-the-go
3 - Both stay-at-home
0
0.5
1
1.5
2
2.5
3
3.5
4
4.5
-3 -2 -1 0 1 2 3
Satisfaction
Info
rmati
on (th
eta
) .
Response Curves Information Curve
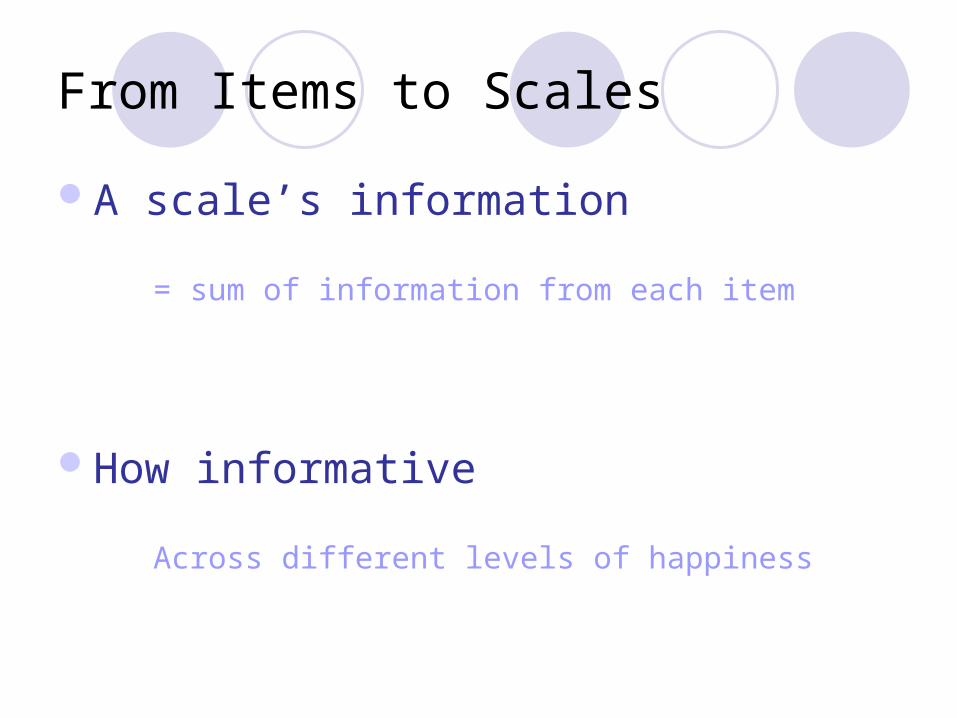
From Items to Scales
A scale’s information
= sum of information from each item
How informative
Across different levels of happiness
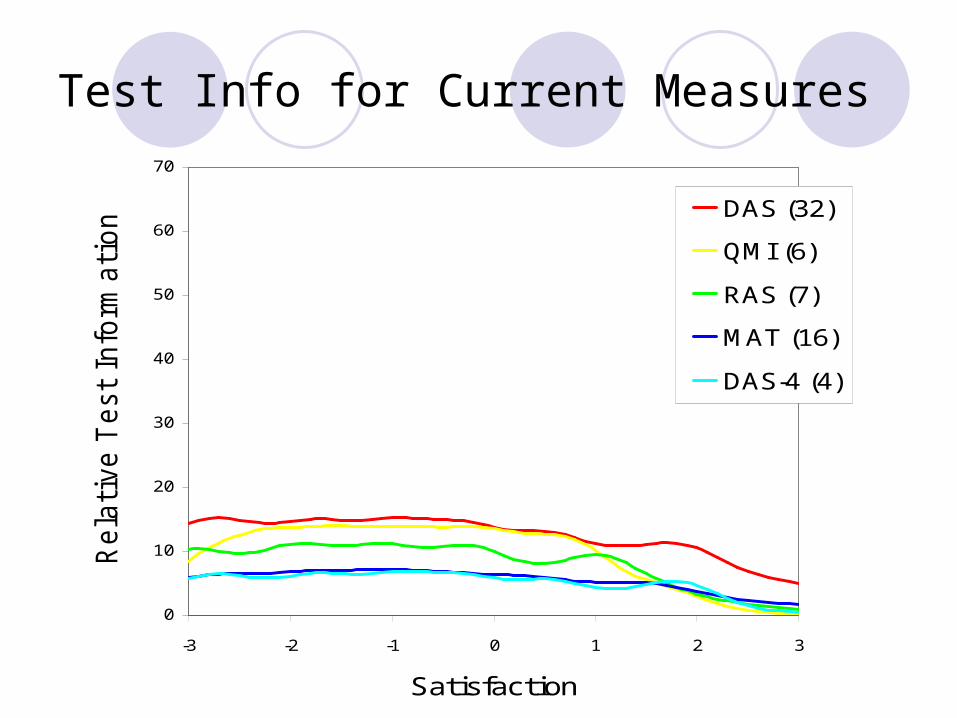
Test Info for Current Measures
0
10
20
30
40
50
60
70
-3 -2 -1 0 1 2 3
Satisfaction
Rela
tive T
est
Info
rmati
on .
DAS (32)
QMI (6)
RAS (7)
MAT (16)
DAS-4 (4)

Analysis of Existing Measures
Many uninformative itemsParticularly for DAS and MAT noise / error
Modest test informationFor all scalesNotably poor for MAT and DAS
Room for improvement

Creating the CSI
141 item pool
Screen for contaminating items
Screen for redundant items
IRT on remaining 66 items
Select 32 most effective

Test Info for CSI Scales
0
10
20
30
40
50
60
70
-3 -2 -1 0 1 2 3
Satisfaction
Info
rma
tio
n
.
CSI-32
CSI-16
DAS (32)
MAT (16)
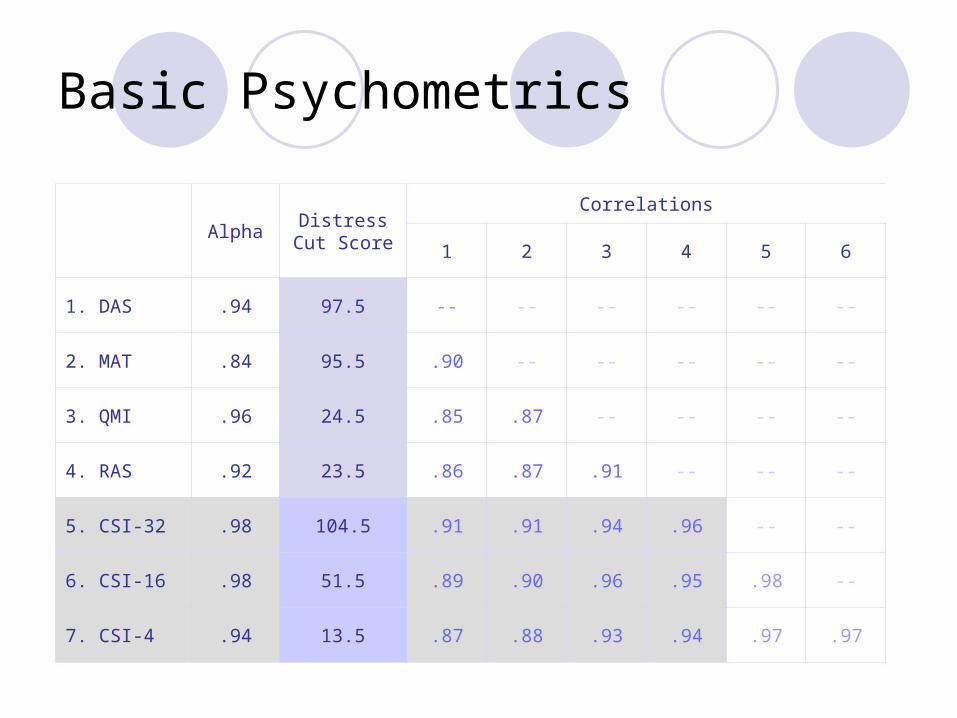
Basic Psychometrics
AlphaDistress
Cut Score
Correlations
1 2 3 4 5 6
1. DAS .94 97.5 -- -- -- -- -- --
2. MAT .84 95.5 .90 -- -- -- -- --
3. QMI .96 24.5 .85 .87 -- -- -- --
4. RAS .92 23.5 .86 .87 .91 -- -- --
5. CSI-32 .98 104.5 .91 .91 .94 .96 -- --
6. CSI-16 .98 51.5 .89 .90 .96 .95 .98 --
7. CSI-4 .94 13.5 .87 .88 .93 .94 .97 .97
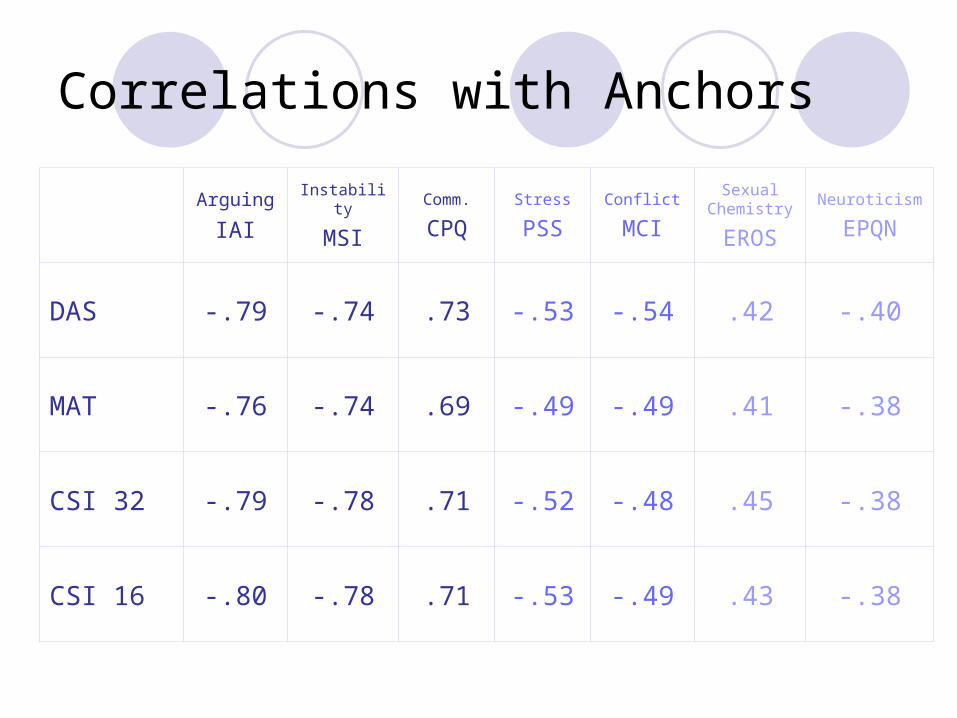
Correlations with Anchors
Arguing
IAI
Instability
MSIComm.
CPQStress
PSSConflict
MCI
Sexual Chemistry
EROS
Neuroticism
EPQN
DAS -.79 -.74 .73 -.53 -.54 .42 -.40
MAT -.76 -.74 .69 -.49 -.49 .41 -.38
CSI 32 -.79 -.78 .71 -.52 -.48 .45 -.38
CSI 16 -.80 -.78 .71 -.53 -.49 .43 -.38

What have we gained?
Identical correlational results Strong convergent validity Strong discriminant validity Strong construct validity Measuring same thing
Higher information…
Should have Lower Noise Higher Precision Greater Power

Satisfaction Groups
IRT satisfaction estimates For each subject Based on MAT, DAS, & CSI items
(equivalent of GRE scores)
Created satisfaction groups N = 265 HIGHLY similar SAT within each group
MAT, DAS & CSI scores also similar?
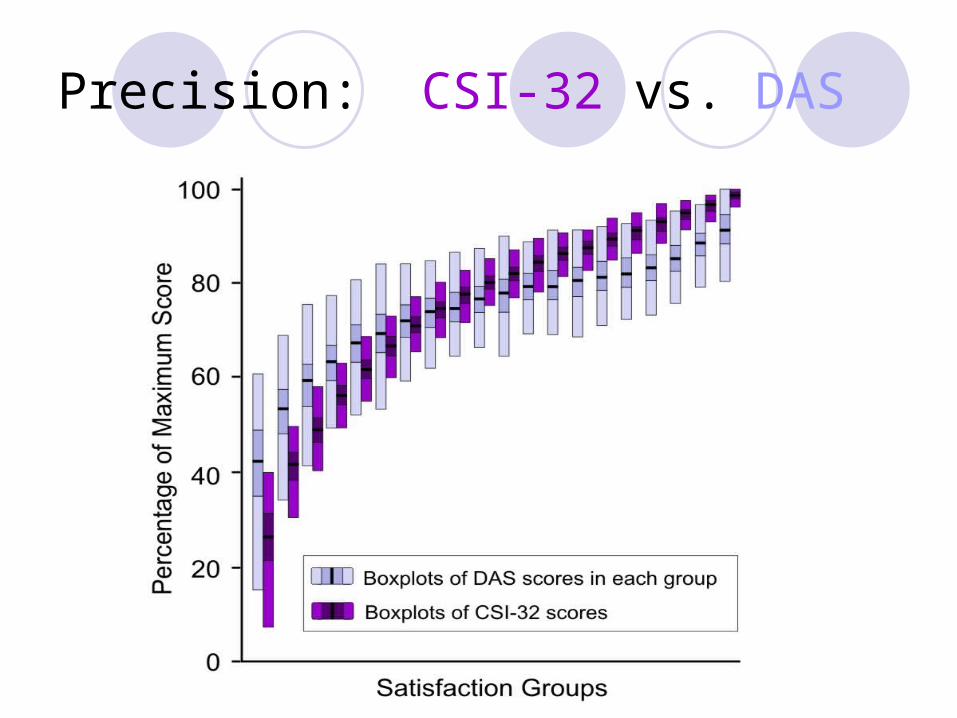
Precision: CSI-32 vs. DAS

Effect Size
Ability to detect difference Between groups Pre – Post
Effect Size = M1 – M2 .
pooled SD
Difference in SD units
Power for detecting ’s in SAT groups

Power: CSI-32 vs. DAS
0
0.5
1
1.5
2
2.5
Effe
ct S
izes
(C
ohen
's d
)
.
2 3 4 5 6 7 8 9 10 11 12 13 14 15 16 17 18 19 20
Adjacent Satisfaction Group Contrasts
DAS
CSI(32)

STUDY 1 - Conclusions
CROSS-SECTIONALLYCSI assess same constructHigher precision Higher power
NEXT STEPLongitudinal analysisResponsiveness to change over time

TOPIC 2: Responsiveness
Detecting change Assumption Longitudinal
External Criteria Treatment effect Clinician Interviewer Global report
SERM (Sdiff) Noise over time Estimating
Two main applications Individual change Clinically distinct groups

Studies 2 through 4
Study 2 267 online respondents
1 & 2wk follow ups 468 change scores
Study 3 156 online respondents
1, 2, 3, 4, 6 & 12mo follow ups 455 change scores
Study 4 545 online respondents
1, 2, 3, 4, 6, 9 & 12mo follow ups 1,552 change scores

Studies 2-4: Measures
Relationship satisfaction scales:DAS-32MAT-15CSI-32
CSI-16*CSI-4*
3 global relationship change itemsChange since last assessment

Individual Change
How many points of change needed? (to show significant change)
SERM in “No Change”
RCI (Jacobson & Truax, 1991) MDC95 (Stratford et al., 1996)
MDC95 (SD units) = 1.96*SERM . SD
PRESENTING Meta-Analytic Summary Standardized Units

Reliable Individual Change
.0
.1
.2
.3
.4
.5
.6
.7
.8
SD
's t
o S
how
Sig
Change
CSI-32 CSI-16 CSI-4 DAS-32 MAT-15
AB
CC
C

Detecting Change
Individual Change IRT optimizationLonger scales
Distinct Groups Can scales distinguish?
Mild deteriorationNo changeMild improvement

Perceived Change
MuchWORSE
SomewhatWORSE
A littleWORSE
Stayed the SAME
A little BETTER
Somewhat BETTER
Much BETTER
-3 -2 -1 0 +1 +2 +3
How much have these changed? Overall happiness in the relationship Feeling close and connected Stability of the relationship
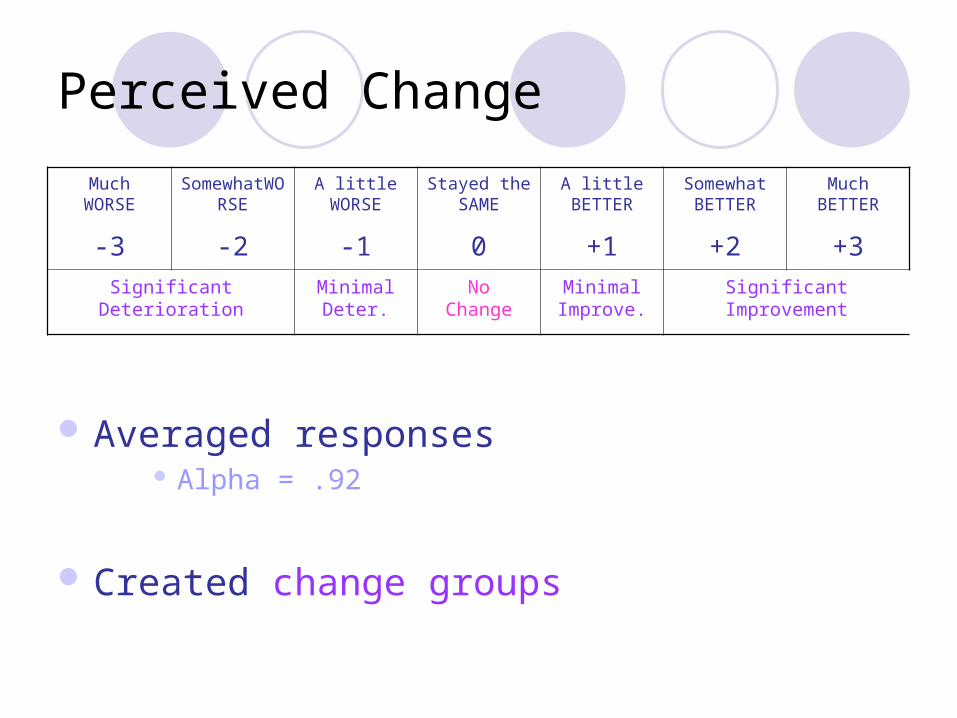
Perceived Change
MuchWORSE
SomewhatWORSE
A littleWORSE
Stayed the SAME
A little BETTER
Somewhat BETTER
Much BETTER
-3 -2 -1 0 +1 +2 +3Significant
DeteriorationMinimalDeter.
NoChange
MinimalImprove.
SignificantImprovement
Averaged responses Alpha = .92
Created change groups

Distinct Change Groups
-25
-20
-15
-10
-5
0
5
10
15
20
Self-Reported Global Change
Ave
rag
e C
ha
ng
e S
core
s
.
Minimal Deterioration
NoChange
MinimalImprovement
SignificantImprovement
DAS-32 Change Scores (with confidence intervals)
CSI-32 Change Scores

Quantifying Group-Level Responsiveness
MCID (Guyatt, Walter & Norman, 1987)
Noise over time (SERM)
Effect Sizes:
(Avg Change)IMPROVE – (Avg Change)NO CHANGE
SERM
(Avg Change)DETERIORATE – (Avg Change)NO CHANGE
SERM

Analytic Strategy
Improving method Multi-wave data Global change continuous Moderation
HLM PV: Global change score Moderators:
• Gender• T0 Satisfaction
DV: Change scores on scales (n = 2475) Change scores ≈ 1pt global change
MCID effect sizes
Meta-Analytic Summary

Responsiveness in Dissatisfied (1SD below M)
-2.0
-1.5
-1.0
-0.5
0.0
0.5
1.0
1.5
Eff
ect
Siz
e t
o D
ete
ct
1 P
oin
t of
Avera
ge G
lobal C
hange
Mild Deterioration Mild Improvement
CSI-32
CSI-16
CSI-4
DAS
MATA A
B
CD
A B
C C C

Responsiveness in Satisfied (1SD above M)
-3.5
-3.0
-2.5
-2.0
-1.5
-1.0
-0.5
0.0
0.5
Eff
ect
Siz
e t
o D
ete
ct
1 P
oin
t
of
Avera
ge G
lobal C
hange
Mild Deterioration Mild Improvement
CSI-32
CSI-16
CSI-4
DAS
MATA B
C
E
D
A A B B B
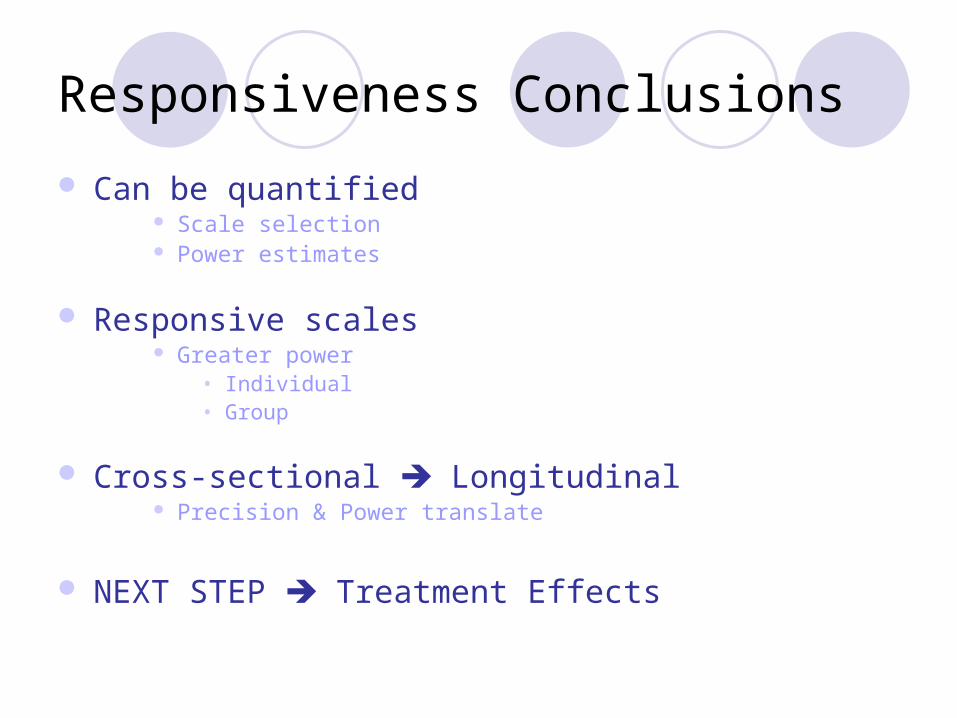
Responsiveness Conclusions
Can be quantified Scale selection Power estimates
Responsive scales Greater power
• Individual• Group
Cross-sectional Longitudinal Precision & Power translate
NEXT STEP Treatment Effects

Topic 3: Bi-Dimensional View
Uni-Dimensional viewPositive feelings opposite negative feelings
Bi-Dimensional viewPos/Neg independent
Moderately “dissatisfied”• Ambivalent• Indifferent
Uni-Dimensional obscuring?

Background Fincham & Linfield (1997)
PN-QIMSTwo 3-item scales
• Qualities of spouse• Feelings toward spouse• Feelings about marriage
Considering only (pos/neg)Separated in survey
CFA in 123 couples
Unique information

Study 5
Mattson et al. (under review)
New pos-neg scale 7 SMD items of CSI Pos / neg separately
Large online sample Ambivalent Indifferent
Positive Items Negative Items
InterestingEnjoyableFriendlyHopeful
SturdyGoodFull
BoringMiserable
LonelyDiscouraging
FragileBad
Empty

Study 5 - Sample
1656 online respondents Demographics
28yo (7yrs) 94% Female 87% Caucasian 30k income 5% ≤ high school
Romantic relationships 38% married (6.5yrs) 19% engaged (3.6yrs) 41% dating – exclusive (2.4yrs)

Ambivalence vs. Indifference
Median Splits
Positives
High Low
NegativesLow Satisfied Indifferent
High Ambivalent Distressed

Ambivalence vs. Indifference
Median Splits
Positives
High Low
NegativesLow Satisfied Indifferent
High Ambivalent Distressed
Uni-Dimensional Satisfaction
12
14
16
18
20
Dissatisfied Indifferent Ambivalent Satisfied
CS
I-4 M
ean
s

Negative Conflict
0
20
40
60
80
Dissatisfied Indifferent Ambivalent Satisfied
MC
I-C
on
flic
t

Negative Affect
8
9
10
11
12
13
Dissatisfied Indifferent Ambivalent Satisfied
EP
Q-N

Study 6 IRT Optimized Positive & Negative Scales
Item Pools 20 positive items 20 negative items
Large sample UG respondents
Analyses EFA Redundancy IRT
Precision / Power / Validity
Study 6 - Sample
1,814 undergrad respondents Demographics
19yo (2yrs) 77% Female 72% Caucasian Together 2.6yrs 26% dissatisfied
Close relationships 54% romantic partners 38% friends 5% family members 3% roommates
Romantic relationships 76% dating – exclusive 21% dating – non-exclusive

Positive-Negative Relationship Qualities New PN-RQ scales
Best 4 & 8 items by IRT
Positive Items Negative Items
Enjoyable*PleasantStrongAlive
FunFull*
ExcitingEnergizing
Bad*Empty*
Miserable*Lifeless
Discouraging*Unpleasant
WeakDull

PN-RQ Correlations
CSI-4 Pos-RQ Neg-RQ
CSI-4 1
Pos-RQ .68 1
Neg-RQ -.55 -.47 1

Information Provided
0
5
10
15
20
25
30
35
-3 -2 -1 0 1 2 3
Satisfaction (standardized)
Info
rma
tio
n P
rovid
ed
POS-SMD
POS-RQ (IRT)

NEG: Information Provided
0
5
10
15
20
25
30
35
40
45
50
-3 -2 -1 0 1 2 3
Satisfaction (standardized)
Info
rma
tio
n P
rovid
ed
NEG-SMD
NEG-RQ (IRT)

Power: Positive-Quality Groups
0
0.5
1
1.5
2
2.5
Eff
ec
t S
ize
s
2 3 4 5 6 7 8 9 10
Adjacent Pos-Qual Group Contrasts
POS-RQ
CSI-4

Power: Negative-Quality Groups
-0.5
0
0.5
1
1.5
2
2.5
Eff
ect
Siz
es
2 3 4 5 6 7 8 9 10
Adjacent Neg-Qual Group Contrasts
NEG-RQinvCSI-4

Uni-Dimensional Satisfaction
12
13
14
15
16
17
18
19
20
Dissatisfied Indifferent Ambivalent Satisfied
CS
I-4 M
ean
s

Negative Conflict
3
4
5
6
7
Dissatisfied Indifferent Ambivalent Satisfied
Neg
ati
ve C
on
flic
t
Forgivingness
24
26
28
30
32
34
36
Dissatisfied Indifferent Ambivalent Satisfied
Fo
rgiv
en
ess

PN-RQ
Power from OptimizationMore precise
Unique InformationAmbivalent vs. Indifferent
NEXT: Responsiveness

Study 7
PREP Psycho-educational workshop Speaker-Listener Technique
CARE Psycho-educational workshop Acceptance based techniques (IBCT)
Awareness Self-guided Semi-strutured
No Treatment

Study 7
173 Newlywed couples Engaged or married <6mo Screened for severe discord (MAT below 85)
Demographics AGE 29 Caucasian H: 58% W: 54% Latino/a H: 17% W: 23% Asian Am H: 9% W: 11% African Am H: 5% W: 5%
Assessed MAT, PN-QIMS 6 points over 3yrs

Slope-Intercept HLM Results
MATDrops over time for Men
Negative Qualitiesns
Positive QualitiesDrops only in No Treatment*TX: Sig better slopes in Men
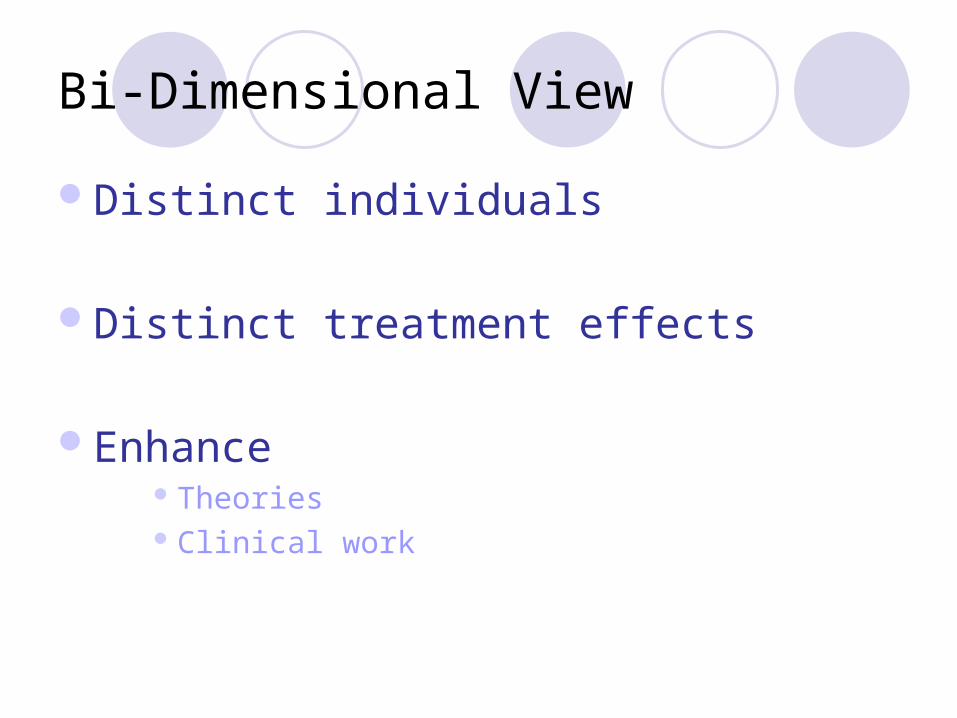
Bi-Dimensional View
Distinct individuals
Distinct treatment effects
EnhanceTheoriesClinical work

Topic 4: Implicit Assessment
Limitations of Self-Report Insight Biases
Limitations of Observational Coding Costly Evaluation apprehension Not all constructs observable
Implicit assessment Indirect Inexpensive Unique insights

Previous Work
Me/Not-Me task Aron, Aron, Tudor, & Nelson (1991), Aron & Fraley (1999), Slotter & Gardner (2009)
Rxn Time on EvaluationsFincham, Garnier, Gano-Phillips, & Osborne (1995)
Partner-focused IAT Zayas & Shoda (2005)Banse & Kowalick (2007)Scinta & Gable (2007)
Self-focused IATDewitt, de Houwer, & Buysse (2008)
Sequential priming taskScinta & Gable (2007)

Go/No-Go Association Task
Partner-GNAT Sort three types of words
• Good• Bad• Partner
Presented• One at a time• In random order
Spacebar for targets

GNAT Stimuli
Partner words First name Nick name Pet name / Distinguishing characteristic
Good Words Bad Words
Studies 8 & 10
PeaceGift
Vacation
DeathAccidentTragedy
Study 9AcceptingSharing
Understanding
AttackingNagging
Criticizing

GNAT Procedure
Procedure Obtain partner stimuli
Sorting task• 16 practice trials: good as target• 16 practice trials: bad as target
• 70 trials: partner + good as targets• 70 trials: partner + bad as targets
Complete counterbalancing
CriticalTrials

GNAT
Fast task (600msec) Accuracy D’ index
Proposed High performance on P-good
Strong positive implicit attitude
High performance on P-bad Strong negative implicit attitude

Study 8 122 online respondents
39% married (for 3.3yrs) 13% engaged (together for 2.7yrs) 58% dating (for 2.4yrs)
79% Caucasian 87% Female 43% provided follow-up data 8 ended their relationships
Study 9 100 online respondents
10% married (for 3.6yrs) 12% engaged (together for 3.2yrs) 77% dating (for 1.8yrs)
77% Caucasian 86% Female 63% provided follow-up data 11 ended their relationships
Studies 8 & 9: Samples

Method Variance
P-good and P-bad r = .45 Shared method variance
Ability Effort Attention Comfort with computers
Enter as pairs Simultaneous PVs Partial correlations Shared variance dropped
Examine interaction Pos & Neg attitudes might interact

Study 8: Correlations
Initial Self Reports
Relationship Satisfaction
Negative Conflict
Neuroticism
Partner-Good .14 -.05 .00
Partner-Bad -.21* .12 .03

Discrete-time hazard modeling in HGLM
LEVEL 1: Prob(Breakup) = P log[ P/(1-P) ] = 0 + 1(time) + e
LEVEL 2: 0 = 00 1 = 10 + 11(relationship satisfaction)
+ 12 (hostile conflict) + 13 (neuroticism) + 14 (partner-good) + 15 (partner-bad) + 16 (partner-good X partner-bad) + r1
Self-Report Controls
Partner-GNAT
Performance
Studies 8 & 9: Analytic Strategy

Study 8: Prediction of Relationship Breakup over 1 year
B SE p Odds Ratio
Intercept
Intercept1 -4.14* 0.36 .001 0.02
Predicting Breakups over 1 Year
Intercept2 2.21 0.51 .001 9.12
Relationship Satisfaction -0.05† 0.03 .065 0.95
Neuroticism 0.10 0.10 .342 1.10
Hostile Conflict -0.07 0.07 .317 0.93
Partner with Good (d´) -1.75* 0.55 .002 0.17
Partner with Bad (d´) 0.38 0.93 .685 1.46
P-Good X P-Bad -1.67* 0.83 .048 0.19
NOTE: B = unstandardized beta; SE = standard error. † p < .10; * p < .05

0
10
20
30
40
50
60
70
80
90
Low partner-bad High partner-bad
Per
cen
t o
f B
reak
up
Low partner-good
High partner-good
A)
Study 8: Probabilities of Breakup

Study 9: Correlations
Initial Self Reports
Relationship Satisfaction
Negative Conflict
Neuroticism
Partner-Good .06 -.13 .00
Partner-Bad -.03 .07 .03
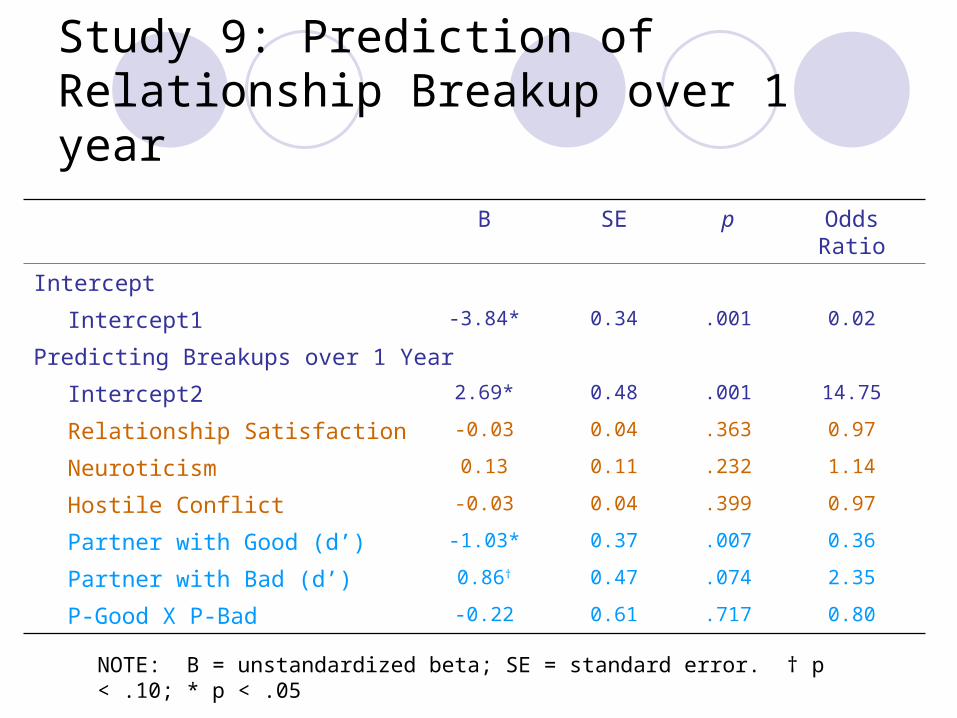
Study 9: Prediction of Relationship Breakup over 1 year
B SE p Odds Ratio
Intercept
Intercept1 -3.84* 0.34 .001 0.02
Predicting Breakups over 1 Year
Intercept2 2.69* 0.48 .001 14.75
Relationship Satisfaction -0.03 0.04 .363 0.97
Neuroticism 0.13 0.11 .232 1.14
Hostile Conflict -0.03 0.04 .399 0.97
Partner with Good (d’) -1.03* 0.37 .007 0.36
Partner with Bad (d’) 0.86† 0.47 .074 2.35
P-Good X P-Bad -0.22 0.61 .717 0.80
NOTE: B = unstandardized beta; SE = standard error. † p < .10; * p < .05
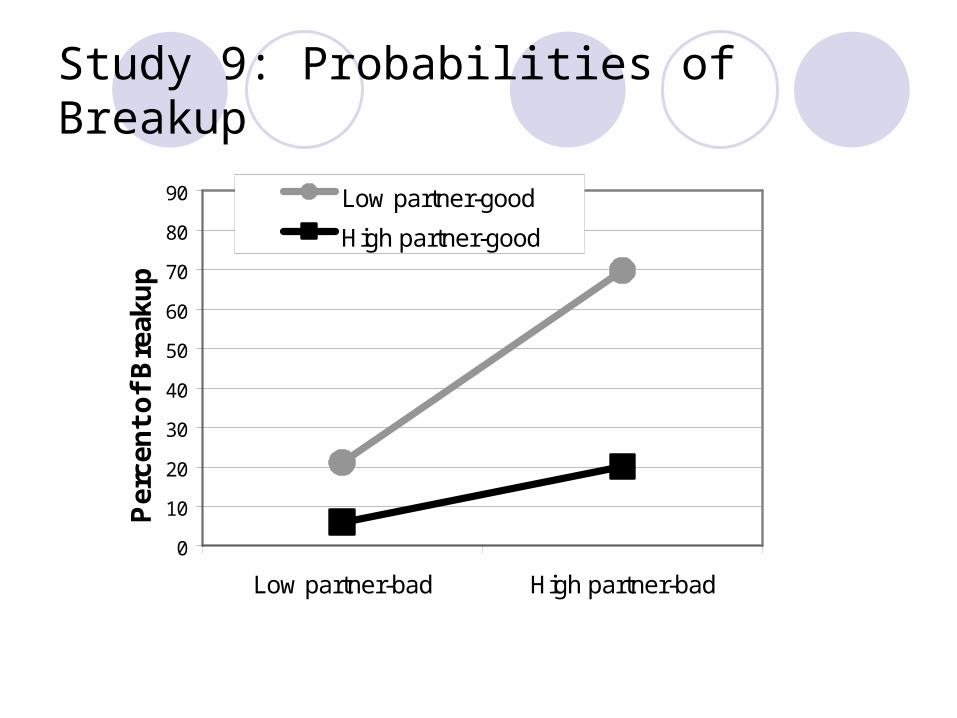
0
10
20
30
40
50
60
70
80
90
Low partner-bad High partner-bad
Per
cen
t o
f B
reak
up
Low partner-good
High partner-good
B)
Study 9: Probabilities of Breakup

Studies 8 & 9: Summary
Partner-GNAT Predicts Breakup over 1yr
After controlling for SR scales Possible interaction
Suggests Partner-GNAT provides unique information
P’s unable to report P’s unwilling to report
Next Step: Mechanism of action
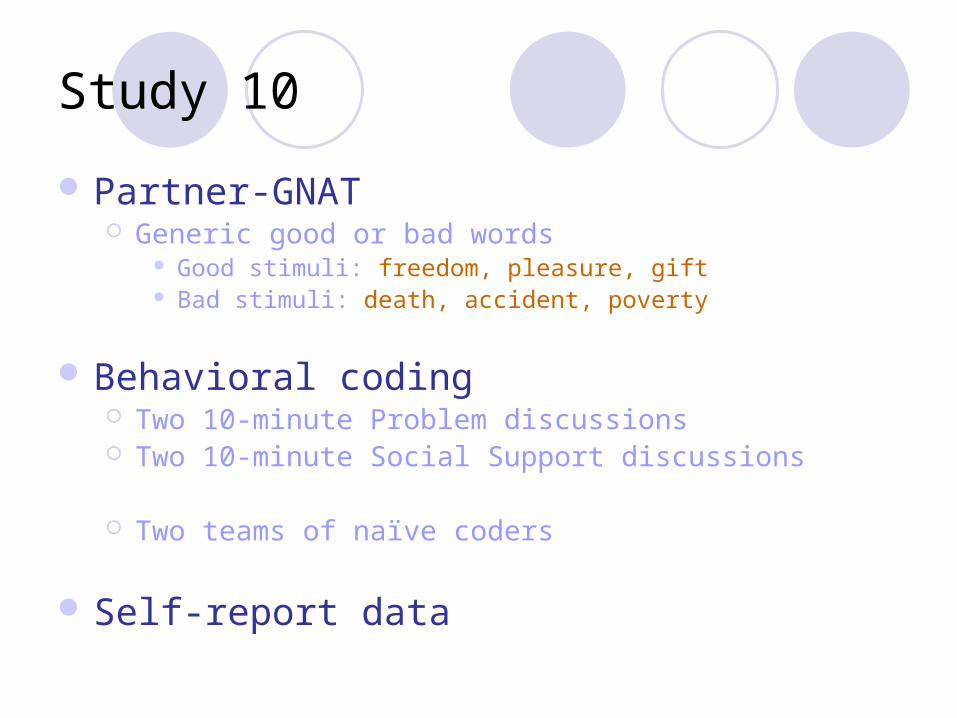
Study 10
Partner-GNAT Generic good or bad words
Good stimuli: freedom, pleasure, gift Bad stimuli: death, accident, poverty
Behavioral coding Two 10-minute Problem discussions Two 10-minute Social Support discussions
Two teams of naïve coders
Self-report data

Coding Process
Two separate teams (5 and 7 coders) Weekly meetings
Spouses coded in separate passes 30sec intervals Global codes
Counterbalancing Order of couples Order of spouses (within each interaction) Order of topics (H vs. W)
Rated 15-18 dimensions
All coders coded all tapes Codes averaged within coders & interactions Codes averaged across coders Created composite codes

Composite Codes
Support Behavior/AffectEmotional SupportNegative Behavior
Conflict Behavior/AffectEmpathic ListeningAffectionNegative Behavior

Study 10: Sample
57 couples 48% engaged to be married (in 4.8mo) 52% married (for 3.7mo)
Relationships Together 3.3yrs Highly satisfied (avg. CSI = 141) 81% premarital cohabitation 93% living together at T0 14% had children at T0
Demographics Age 28yo 91% Caucasian 53k joint income 9% ≤ HS education

Study 10: Analytic Strategy
Actor-Partner Interdependence Modeling in HLM
Modeling trajectories over timeTwo level model
• Level 1 – Individual differences GNAT indices Coded behavior Initial self-report
• Level 2 – Dyadic variables Relationship length Number of children

-0.5
-0.4
-0.3
-0.2
-0.1
0
0.1
0.2
0.3
0.4
0.5
Female Low Part-Good Female High Part-Good
Mal
e E
mo
tio
nal
Su
pp
ort
Female Low Part-Bad
Female High Part-Bad
A)
Male Emotional Support(during support interaction)

-0.5
-0.4
-0.3
-0.2
-0.1
0
0.1
0.2
0.3
0.4
0.5
Female Low Part-Good Female High Part-Good
Mal
e N
egat
ive
Su
pp
ort
Female Low Part-Bad
Female High Part-Bad
B)
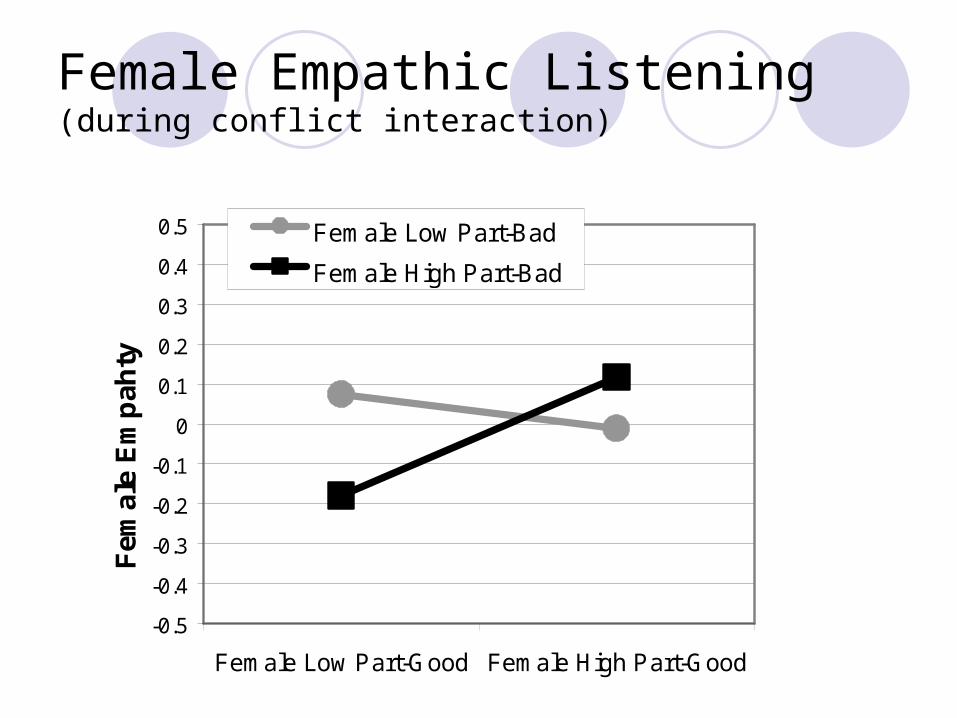
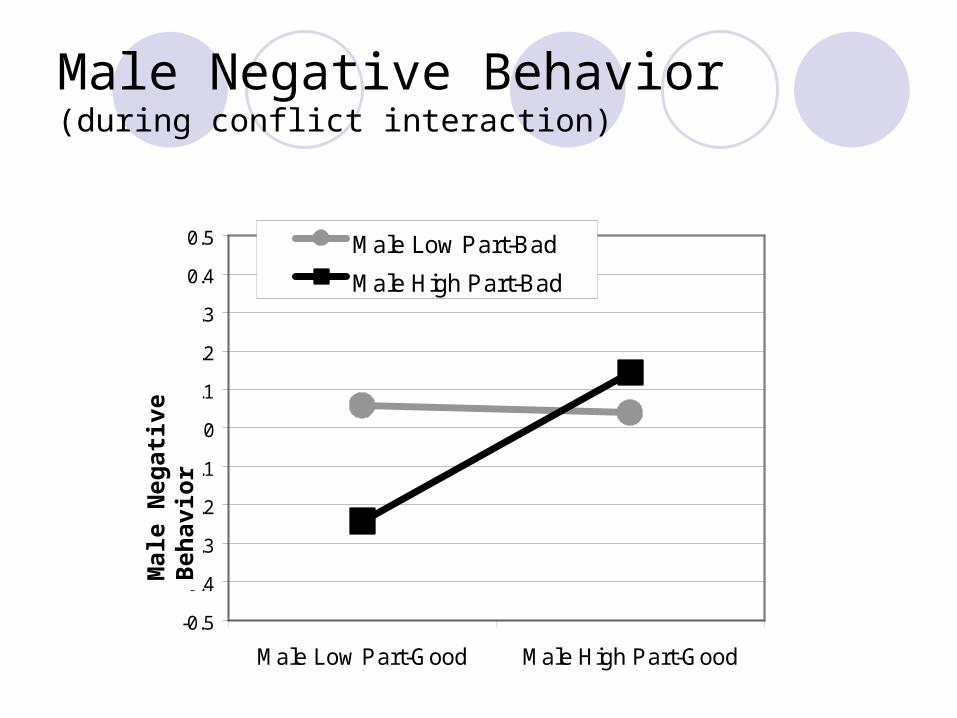
Male Negative Behavior (during support interaction)
-0.5
-0.4
-0.3
-0.2
-0.1
0
0.1
0.2
0.3
0.4
0.5
Female Low Part-Good Female High Part-Good
Fem
ale
Em
pah
ty
Female Low Part-Bad
Female High Part-Bad
C)
Female Empathic Listening(during conflict interaction)

-0.5
-0.4
-0.3
-0.2
-0.1
0
0.1
0.2
0.3
0.4
0.5
Female Low Part-Good Female High Part-Good
Fem
ale
Ple
asan
tnes
s
Female Low Part-Bad
Female High Part-Bad
E)
Female Affection(during conflict interaction)
Fem
ale
Aff
ecti
on
-0.5
-0.4
-0.3
-0.2
-0.1
0
0.1
0.2
0.3
0.4
0.5
Male Low Part-Good Male High Part-Good
Mal
e H
ost
ilit
y
Male Low Part-Bad
Male High Part-Bad
D)
Male Negative Behavior(during conflict interaction)
Mal
e N
egat
ive
Beh
avio
r

Study 10: Summary
Partner-GNATLinked to own behaviorLinked to partner’s behaviorAcross domains
Might shape each other
Tailoring GNAT Implicit assessment of attachment?

Self Report Attachment Scales
ECR-RAttachment Anxiety
“I worry a lot about my relationship”Attachment Avoidance
“I find it difficult to allow myself to depend on romantic partners”
Difficult to disentangle • Attachment• Preoccupied / Dismissive Behaviors
Requires insight / honesty

Study 11
Standard Battery of SR scales
Implicit Attachment Partner-GNAT* Self-GNAT* *New Valence Categories
• Relationally Worthy• Relationally Worthless
Hypotheses• Partner-GNAT* internal working model of others• Self-GNAT* internal working model of self

GNAT Stimuli Partner words
First name Nick name Pet name /
characteristic
Self words First name Last name Nick name /
characteristic
Relationally Worthy
Relationally Worthless
Valence Stimuli
LovedLiked
AgreeableAcceptedCherished
ValuedAdored
InferiorRejected
DisagreeablePathetic
UnwantedAbandonedInsignificant

Study 11: Sample
Recruitment underway
First 48 couples 79% committed dating relationships (1.6yrs) 4% engaged (2.9yrs) 17% married (4.5yrs)
Relationships Quite satisfied (CSI-16 = 70) Dissatisfied
• 6% of married• 9% of dating
Demographics Age 24yo 76% Caucasian 37k joint income 9% ≤ HS education

Study 11: Correlations
Initial Self Reports
Relationship Satisfaction
Attachment Anxiety
Attachment Avoidance
Partner-Good .27* .01 -.23†
Partner-Bad -.14 .06 .17

Study 11: Correlations
Initial Self Reports
Relationship Satisfaction
Attachment Anxiety
Attachment Avoidance
Self-Good .04 .07 .03
Self-Bad .01 -.08 -.03
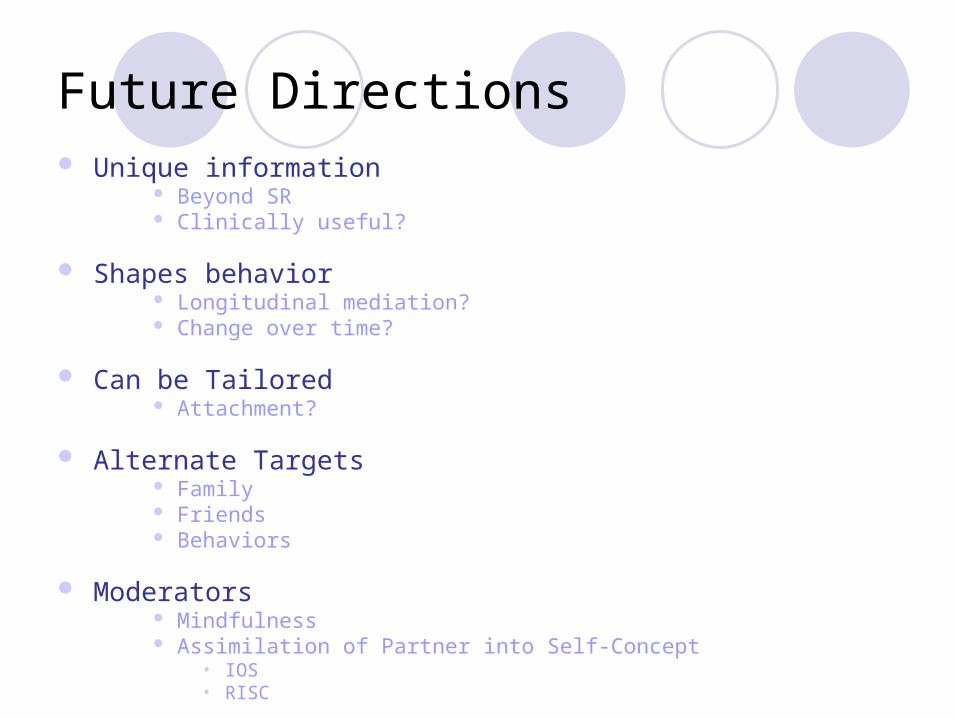
Future Directions Unique information
Beyond SR Clinically useful?
Shapes behavior Longitudinal mediation? Change over time?
Can be Tailored Attachment?
Alternate Targets Family Friends Behaviors
Moderators Mindfulness Assimilation of Partner into Self-Concept
• IOS• RISC

Topic 5: Attention / Effort
Inattention Adds error / noise Reduces power
Quantifying Large Clinical Inventories (e.g., PAI)
• Infrequency• Inconsistency
Experimental Research• Instruction reading (IMC; Oppenheimer, 2009)
Survey Research• Unknown

Study 12
Quantifying Inattention
Behavioral Measures• 7 directed responses• 20 pronoun task• 2min video
Self-Report• Inattentive• Patterned• Rushed• Instruction skipping

Study 12 - Sample
575 online respondents 54% Mturk.com 13% online forums 33% UG psychology students
Demographics 29yo (12yrs) 70% Female 77% Caucasian 21% ≤ High School 30% ≤ $30k / year

Behavioral Inattention
0
10
20
30
40
50
60
% S
how
ing I
natt
enti
on
Mistakes onDirected Q's
Not WatchingFull Video
Mistakes onPronouns
Any Errors
>50% Errors

Self-Reported Inattention
0
10
20
30
40
50
60
70
80
90
% S
how
ing I
natt
enti
on
Inattentive Patterned Rushed SkippingInstructions
Ever
>50% of the time
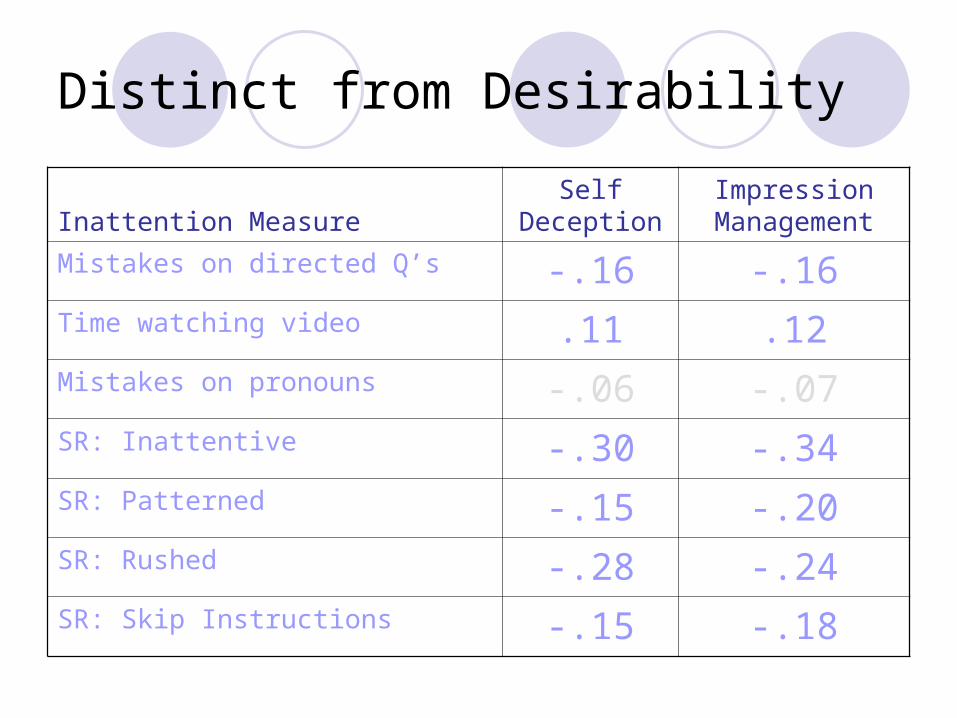
Distinct from Desirability
Inattention MeasureSelf
DeceptionImpression
Management
Mistakes on directed Q’s -.16 -.16Time watching video .11 .12Mistakes on pronouns -.06 -.07SR: Inattentive -.30 -.34SR: Patterned -.15 -.20SR: Rushed -.28 -.24SR: Skip Instructions -.15 -.18

Screening for Inattention
Developing ARS Item pool
• Infrequent items• Inconsistent pairs
3 large online samples
Ability to discriminate• P responses• Random data• Random responders

Studies 13 through 15
Study 13 1195 online respondents
85% female 77% Caucasian 26yo (SD = 8.4)
Study 14 1878 online respondents
91% female 85% Caucasian 28yo (SD = 7.1)
Study 15 547 online respondents
74% female 72% Caucasian 20yo (SD = 1.3)

Final ARS scales
Two scales11 infrequency items
• I enjoy the music of Marlene Sandersfield• I look forward to my time off
11 inconsistency item pairs• I am an active person• I have an active lifestyle
Agreement with PAIStudy 14
• Continuous: r’s = .64 and .83• Categorical: kappa = .72

Ability to Detect Inattention
0
0.1
0.2
0.3
0.4
0.5
0.6
0.7
0.8
0.9
1
Pro
port
ions
Random Data Random Responders
ARS Hit Rate
ARS False Positives
PAI Hit Rate
PAI False Positives

Convergent Validity
Study 12 indices
ARS inattentive respondents Higher on inattention indices?
Behavioral MarkersSelf-Report
Comparable regression results?

ARS Inattentive P’s
Index EffectCohen’s
DDirected Q’s 3 more mistakes / 7 -1.43**
Video Watching 40 seconds less / 120 .95**
Pronouns 7 more mistakes / 20 -1.01**
SR Inattentive 1.0 pts higher / 6 -.91**
SR Patterned 1.3 pts higher / 7 -1.11**
SR Rushed 0.7 pts higher / 7 -.60**
SR Skipping Instructions 0.8 pts higher / 7 -.53**

ARS Inattentive P’s
Robins et al. (2001) Big 5 Self Esteem R2 = .34** 3 sig coeffs
Attentive P’s N = 621 R2 = .41** 3 sig coeffs
Inattentive P’s N = 55 R2 = .08 ns no sig coeffs
.00
.05
.10
.15
.20
.25
.30
.35
.40
.45
Vari
ance P
redic
ted in D
V
Ronbins Attentive Inattentive
ns

ARS Convergent Validity
ARS inattentive respondents
Higher inattention Behavioral MarkersSelf-Report
Adding noiseLowering power

Study 16
Reading instructions?
ARS vs. IMC Oppenheimer (2009) IMC: Instructional Manipulation Check
Single paragraph / item Eliminates 20-40% of P’s
Enhances power• Paragraph manipulations
Sports ticket Can of pop
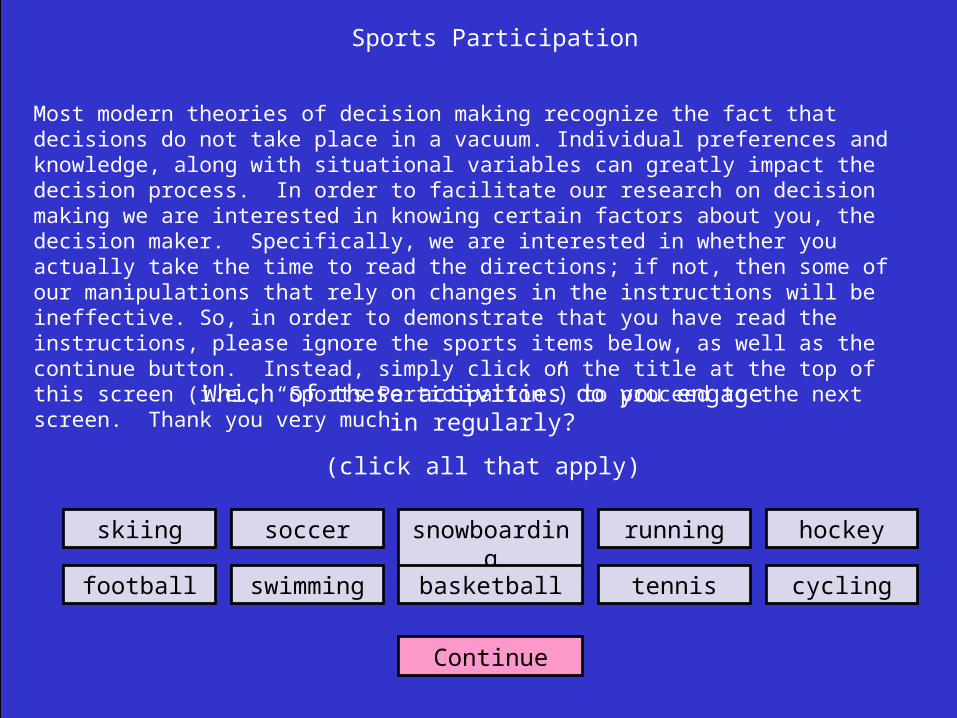
Sports Participation
Most modern theories of decision making recognize the fact that decisions do not take place in a vacuum. Individual preferences and knowledge, along with situational variables can greatly impact the decision process. In order to facilitate our research on decision making we are interested in knowing certain factors about you, the decision maker. Specifically, we are interested in whether you actually take the time to read the directions; if not, then some of our manipulations that rely on changes in the instructions will be ineffective. So, in order to demonstrate that you have read the instructions, please ignore the sports items below, as well as the continue button. Instead, simply click on the title at the top of this screen (i.e., “Sports Participation”) to proceed to the next screen. Thank you very much.
Which of these activities do you engage in regularly?
(click all that apply)
skiing soccer snowboarding running hockey
football swimming basketball tennis cycling
Continue

Study 16 - Sample
652 online respondents 60% Mturk.com 40% UG psychology students
Demographics 28yo (11.5yrs) 70% Female 74% Caucasian 27% ≤ High School 30% ≤ $30k / year

ARS – IMC Agreement
Kappa = .16IMC
TotalOK Exclude
ARSOK 435 138 91%
Exclude 24 30 9%
Total 73% 27% 627

Inattention Indices
0
0.2
0.4
0.6
0.8
1
1.2
Cohen's
D b
etw
een G
roups
Directed Q's
Mistakes on Pronouns
SR Patterned
SR Inatte
ntive
SR Rushed
Video Watching
SR Skip Instru
ctions
ARS Effect Sizes
IMC Effect Sizes

Sunk Cost Task (Thaler, 1985)Imagine that your favorite football team is playing an important game that you
[have paid handsomely for.] [have received from a friend.]
However, on the day of the game, it happens to be freezing cold. What do you do?
0
0.1
0.2
0.3
0.4
0.5
Ma
nip
ula
tio
n E
ffe
ct
ARS IMC
Full Sample
Screened - Good
Screened - Bad
ns

Soda Pricing Task (Thaler, 1985)You are on the beach on a hot day. For the last hour you have been thinking about how much you would enjoy an ice cold can of soda. Your companion needs to make a phone call and offers to bring back a soda from the only nearby place where drinks are sold, which happens to be a
[run-down grocery store.] [fancy resort.]Your companion asks how much you are willing to pay for the soda and will only buy it if it is below the price you state. How much are you willing to pay?
0
0.1
0.2
0.3
0.4
0.5
0.6
0.7
Man
ipu
lati
on
Eff
ect
ARS IMC
Full Sample
Screened - Good
Screened - Bad
ns
ns

Inattention Summary
Inattention Skipping instructions
As high as 20-40%
Skimming items5-10%
ARS effectively screensEnhances power
Summary
RELATIONSHIP QUALITY T1: IRT Optimization
Study 1
T2: Responsiveness to Change Studies 2-5
T3: Bi-Dimensional View Studies 6-7
T4: Implicit Measures Studies 8-10
ATTENTION T5: Screening for Error Variance
Studies 11-15

Limitations
Online samples
Largely female
Largely Caucasian
Lacking behavioral criteria

Thank You.
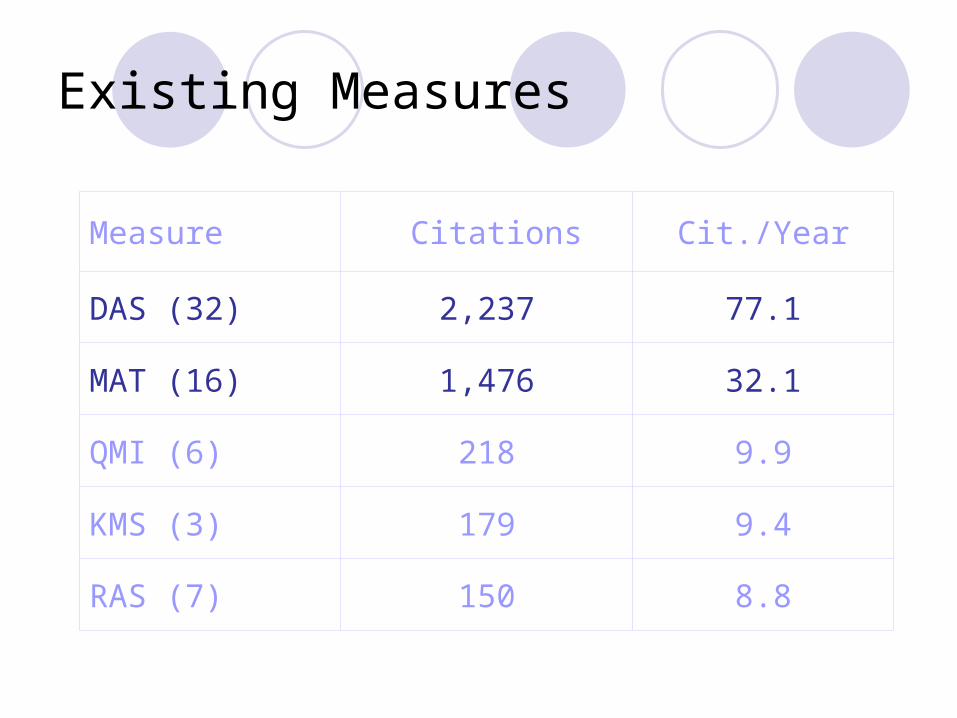
Existing Measures
Measure Citations Cit./Year
DAS (32) 2,237 77.1
MAT (16) 1,476 32.1
QMI (6) 218 9.9
KMS (3) 179 9.4
RAS (7) 150 8.8

Criterion Validity
DAS Distress groups Current gold-standard
DAS score < 97.5 1027 DAS distressed P’s
ROC’s to identify CSI cut scores Identified CSI distressed P’s
91% agreement w/ DAS

Precision: CSI-16 vs. MAT

Power: CSI-16 vs. MAT
0
0.5
1
1.5
2
2.5
Effec
t S
izes
(C
ohen
's d
) .
2 3 4 5 6 7 8 9 10 11 12 13 14 15 16 17 18 19 20
Adjacent Satisfaction Group Contrasts
MAT
CSI(16)

Studies 2-4: Demographics
SAMPLE N = 2,056 initial respondents N = 968 (47%) respondents with longitudinal data
AGE M = 27.7yo (9.3yrs)
GENDER 71% Female 29% Male
RACE 83% Caucasian 5% Asian 4% African American 4% Latino
SES 10% High school diploma or less 25K avg yearly income

Studies 2-4: Relationships
Relationship Types 37% Married: 7.9 yrs (7.9 yrs) 13% Engaged: 3.2 yrs (2.4 yrs) 50% Dating: 1.8 yrs (1.9 yrs)
Relationship Satisfaction (MAT) Married: 108 (32) Engaged: 122 (24) Dating: 116 (24)
Dissatisfied Respondents 24% (n = 487)

Study 2 - Sample
N=596 initial respondents
27yo (SD = 10yrs) 77% Female 84% Caucasian 8% ≤ High school 22K income 30% married, 14% engaged, 55% dating 16% dissatisfied
372 provided email (62%) 267 completed follow ups (71%)
NS differences on Length of relationship Relationship satisfaction Age Education Gender
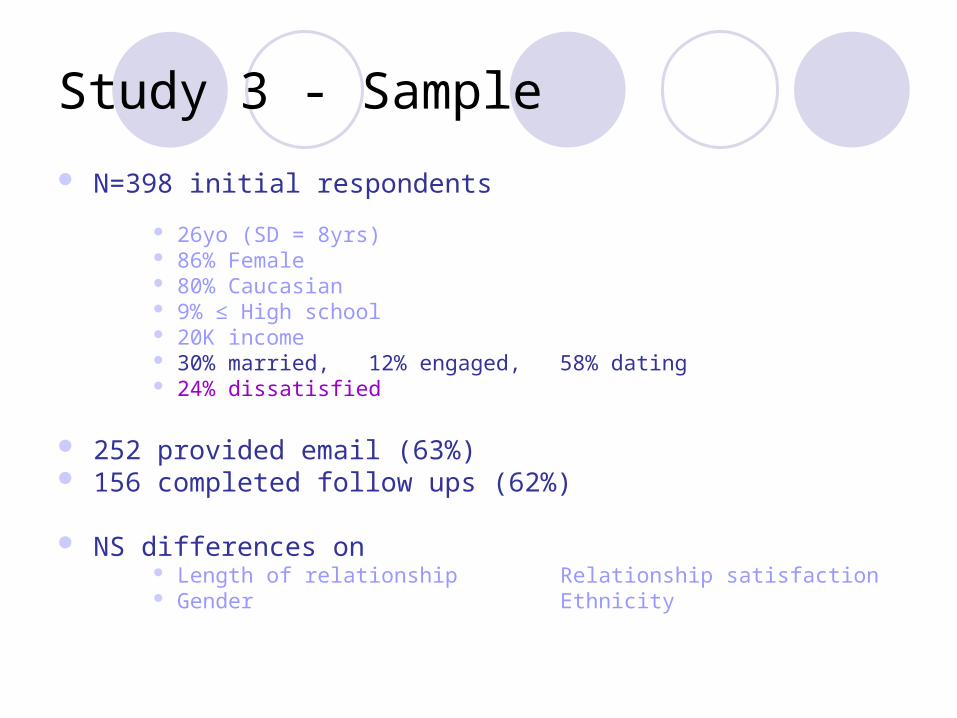
Study 3 - Sample
N=398 initial respondents
26yo (SD = 8yrs) 86% Female 80% Caucasian 9% ≤ High school 20K income 30% married, 12% engaged, 58% dating 24% dissatisfied
252 provided email (63%) 156 completed follow ups (62%)
NS differences on Length of relationship Relationship satisfaction Gender Ethnicity
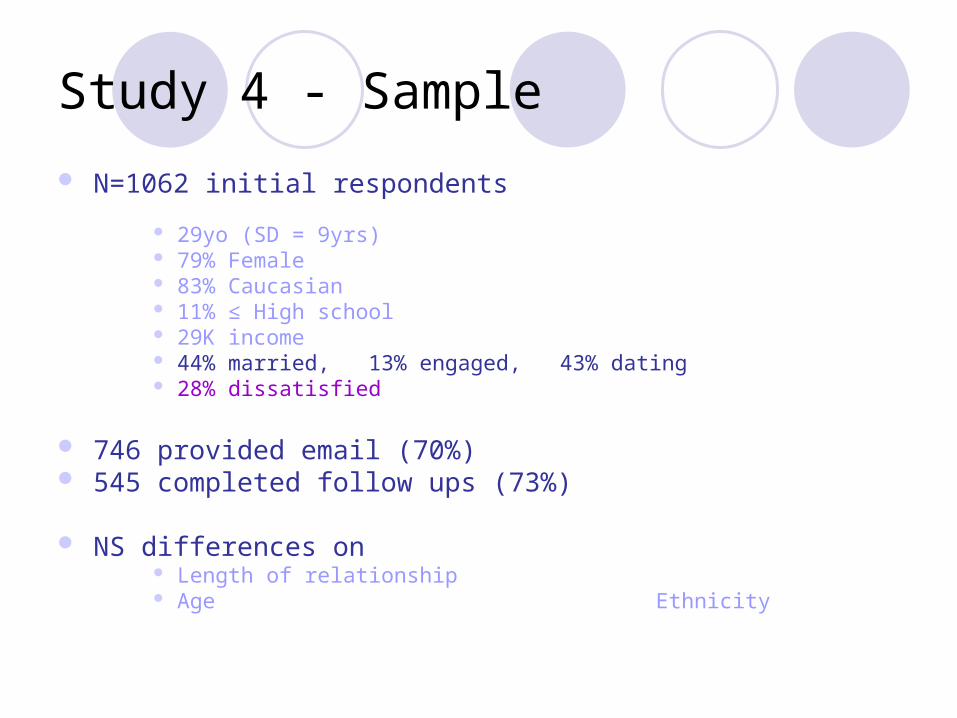
Study 4 - Sample
N=1062 initial respondents
29yo (SD = 9yrs) 79% Female 83% Caucasian 11% ≤ High school 29K income 44% married, 13% engaged, 43% dating 28% dissatisfied
746 provided email (70%) 545 completed follow ups (73%)
NS differences on Length of relationship Age Ethnicity

RCI and MDC95 Equations
RCI SERM = √2*SD2(1 – rxx)
SERM = √2*MSE
RCI = (x2 – x1) / SERM
If RCI > 1.96 Sig individual change
MDC95 Solve RCI eq for (x2 – x1)
MDC95 = 1.96*SERM

Estimating Noise &Reliable Individual Change
Guyatt, Walter & Norman (1987); Jacobson & Truax (1991)
NOISE = SEM(Standard Error
of Repeated Measurement)
= 2*MSE(MSE = Mean Squared Error from a Repeated Measures ANOVA on the T0, F1, & F2 scores of ‘No Change’ individuals)
RELIABLE CHANGE
=Signal
Noise=
x
SEM= 1.98
x = Minimal Detectable Change (MDC95)(smallest change in scores needed in an individual to suggest reliable change)

Reliable Individual Change
Range SERM MCD95 SD units
CSI-32 0-161 8.0 15.7 .49 SD’s
DAS 0-151 5.8 11.4 .65 SD’s
CSI-16 0-81 4.8 9.4 .55 SD’s
MAT 0-158 10.7 21.0 .76 SD’s
CSI-4 0-21 1.6 2.8 .70 SD’s

Estimating Powerfor Detecting Perceived Change
Guyatt, Walter & Norman (1987)
POWER(Effect size)
=Signal
Noise=
Sensitivity to Perceived Change
(difference in avg change scores between adjacent perceived change groups)
SEM(Standard Error of
Repeated Measurement)

Sensitivity to Perceived ChangeCSI-16 vs. MAT
-15
-10
-5
0
5
10
15
Self-Reported Global Change Over 1-Week
Ave
rage
Cha
nge
Sco
res
.
Minimal Deterioration
NoChange
MinimalImprovement
SignificantImprovement
MAT Change Scores
CSI-16 Change Scores

Responsiveness Model
Level 1 – repeated assessmentsX2 – X1 = 0 + 1*(global change) +
2*(deterioration) + e
Level 2 – individuals0 = 00
1 = 10 + 11*(T0 rel sat) + 12*(male) + r1
2 = 20 + 21*(T0 rel sat)

Differences by Gender
Scales showed slightly smaller effect sizes in men
-0.5
-0.4
-0.3
-0.2
-0.1
0
0.1
Re
du
ctio
n in
Effe
ct S
ize
s
CSI-32 CSI-16 CSI-4 DAS MAT
* *
**

Study 5 Responsiveness to Mild Intervention
Reissman, Aron, & Bergen (1993) Pos. activities over 10wks Fun/Exciting Enhanced satisfaction
158 randomly assigned to: Control Fun / Exciting Activities Feedback
2wk follow up 25 Fun / Exciting behaviors Satisfaction
Scales CSI-32 DAS-32 MAT-15 QMI SMD RAS KMS PN-
RQ

Fun/Exciting Activities Feedback Background
There is a large body of research supporting the importance of fun in relationships.
Unfortunately, many couples slowly forget to make time to do fun things together the longer they are together.
Request
As part of this study, we would like you and your partner to make an effort to have more fun with each other over the next 2 weeks.
Specifically, we would like you to try to do some fun activities that get you out of the house and/or out of your normal routines.
These activities should be fun and exciting for both of you.
These activities should also involve things that you can do together (like going to dinner) rather than more solitary activities (like reading).

Fun/Exciting Activities Feedback
Based on your responses, here is a list of activities you rated as most fun and exciting:
Fun activity How fun/exciting you rated it
How often you currently do it
Engaging in intimate sexual activity Extremely 7x in 2 weeks
Going to a movie Extremely 1x in 2 weeks
Playing sports Extremely 2x in 2 weeks
Going camping Very 0x in 2 weeks
Spending time with friends Very 6x in 2 weeks
Going on a hike Very 3x in 2 weeks
Going on a picnic Very 0x in 2 weeks
Attending community events (e.g., festivals) Very 0x in 2 weeks
Going to the beach or lake Very 1x in 2 weeks
Going to a restaurant Somewhat 4x in 2 weeks

Study 5 - Sample
158 initial respondents (first 3 ½ days of recruitment)
30yo (SD = 11yrs) 74% Female 83% Caucasian 18% ≤ High school 53K income 39% married, 10% engaged, 51% dating 18% dissatisfied
xxx completed follow ups (73%)
NS differences on Length of relationship Age Ethnicity

PREPPrevention and Relationship Enhancement Program
14 hour workshop over 4 sessions One weekend day Three weeknights
Communication Skill Focus Speaker-Listener Technique Problem-Solving skills Time Outs Building Positive Behaviors
Goals prevent conflict escalation (improve resolution) enhance/protect positive aspects of relationship
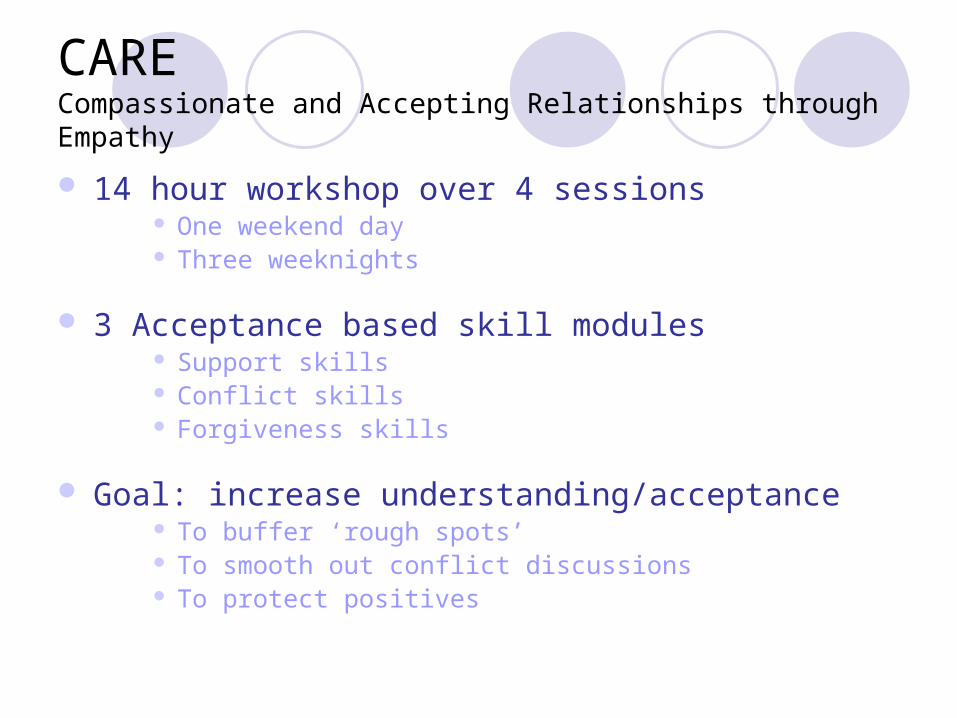
CARECompassionate and Accepting Relationships through Empathy
14 hour workshop over 4 sessions One weekend day Three weeknights
3 Acceptance based skill modules Support skills Conflict skills Forgiveness skills
Goal: increase understanding/acceptance To buffer ‘rough spots’ To smooth out conflict discussions To protect positives

Awareness Condition
“Movie” TreatmentList of relationship-focused moviesWatched 5 movies together40 min guided discussion after eachFirst movie in a group setting (at UCLA)
Yoked Control GroupEquivalent time togetherEquivalent time discussing relationshipNo active psycho-educational component
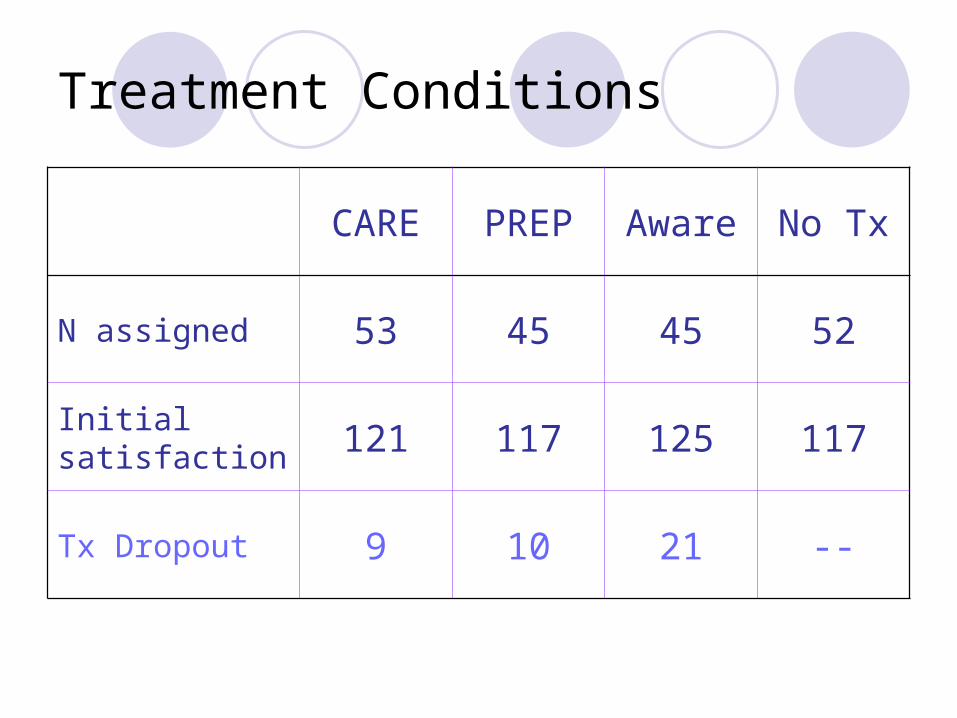
Treatment Conditions
CARE PREP Aware No Tx
N assigned 53 45 45 52
Initial satisfaction 121 117 125 117
Tx Dropout 9 10 21 --

Hypotheses
All treatment conditions would show better marital quality than no tx
CARE and PREP would show better marital quality than the minimal tx
CARE would demonstrate comparable tx effects to PREP

Longitudinal Assessments
T0 – 1-2 months prior to workshop
T1 – start of workshop
T2 – 6 months after workshop
T3 – 1 year
T4 – 2 years
T5 – 3 years

Previous Work Me/Not-Me task
Implicit Closeness 3mo shift in SR closenessAron, Aron, Tudor, & Nelson (1991), Aron & Fraley (1999), Slotter & Gardner (2009)
Rxn Time on Evaluations High Accessibility Stronger effects among SR scales
Fincham, Garnier, Gano-Phillips, & Osborne (1995)
Partner-focused IAT Pos Implicit Atttitude Secure attachment (& lower attch avoidance)
Zayas & Shoda (2005) Pos Implicit Attitude Criterion validity (separating groups)
Banse & Kowalick (2007) Pos Implicit Attitude Current relationship satisfaction
Scinta & Gable (2007)
Self-focused IAT Implicit Relational Worthiness lower attachment anxiety & preoccupation Implicit Relational Anxiety preoccupied attachment
Dewitt, de Houwer, & Buysse (2008)
Sequential priming task Neg Implicit Attitude 3mo shift in SR satisfaction
Scinta & Gable (2007)

Composite Codes Support Behavior/Affect
Emotional Support• Understanding Reassuring• Responsive Relieving blame
Negative Behavior• Frustration Hostility• Disagreeing Blaming• Tension
Conflict Behavior/Affect Empathic Listening
• Tuned into P’s feelings Supportive• Validating Interested / Curious
Affection• Warm / Affectionate Humorous / Playful
Negative Behavior• Hostile Frustrated• Angry Blaming

Actor-Partner modeling in HLMLEVEL 1: Relationship Behavior = + 1(male X own satisfaction) + 2(male X spouse’s satisfaction) + 3(female X own satisfaction) + 4(female X spouse’s satisfaction)
+ similar sets of APIM terms for hostile conflict & neuroticism
+ 13(male X own partner-good) + 14(male X spouse’s partner-good) + 15(female X own partner-good) + 16(female X spouse’s partner-good)
+ 17(male X own partner-bad) + 18(male X spouse’s partner-bad) + 19(female X own partner-bad) + 20(female X spouse’s partner-bad)
+ APIM terms for interactions between partner-good and partner bad + eLEVEL 2: 1 = 10
2 = 20
3 = 30 + 31(rel length) + 32(# of kids) + r3
4 = 40
(similar equations for remaining lvl2 effects)
Self-Report Controls
Partner-GNAT
Performance
Study 10: Analytic Strategy
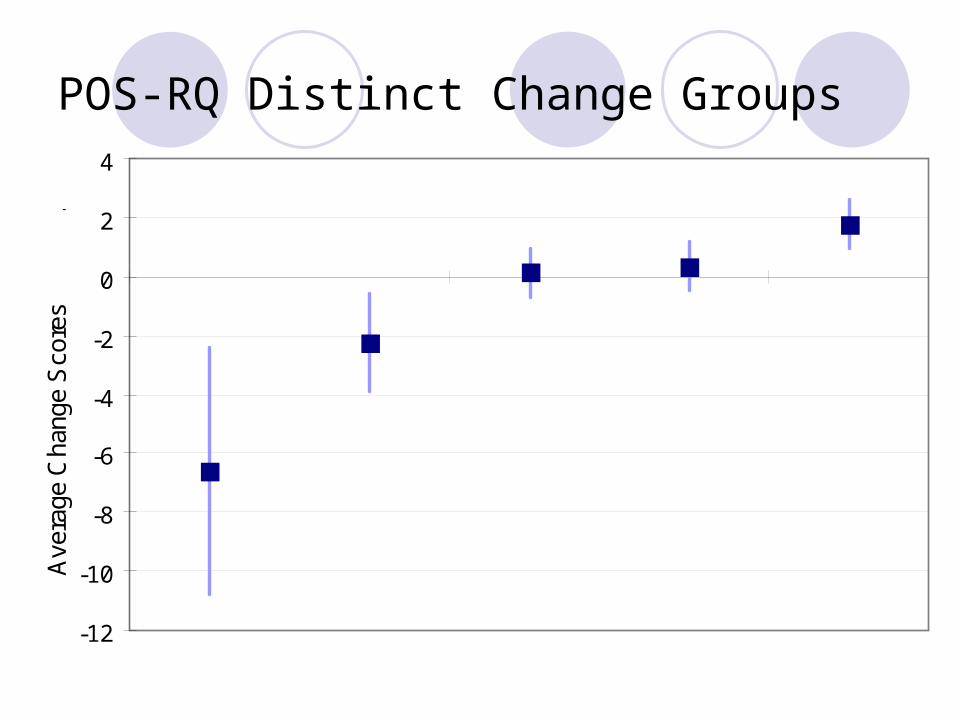
POS-RQ Distinct Change Groups
-12
-10
-8
-6
-4
-2
0
2
4
Ave
rage
Cha
nge
Sco
res
.
Mild Deterioration
NoChange
MildImprovement
SubstantialImprovement
SubstantialDeterioration

NEG-RQ Distinct Change Groups
-2
0
2
4
6
8
10
12
14
16
Ave
rage
Cha
nge
Sco
res
.
Mild Deterioration
NoChange
MildImprovement
SubstantialImprovement
SubstantialDeterioration
POS-RQ Distinct Change Groups
-12
-10
-8
-6
-4
-2
0
2
4
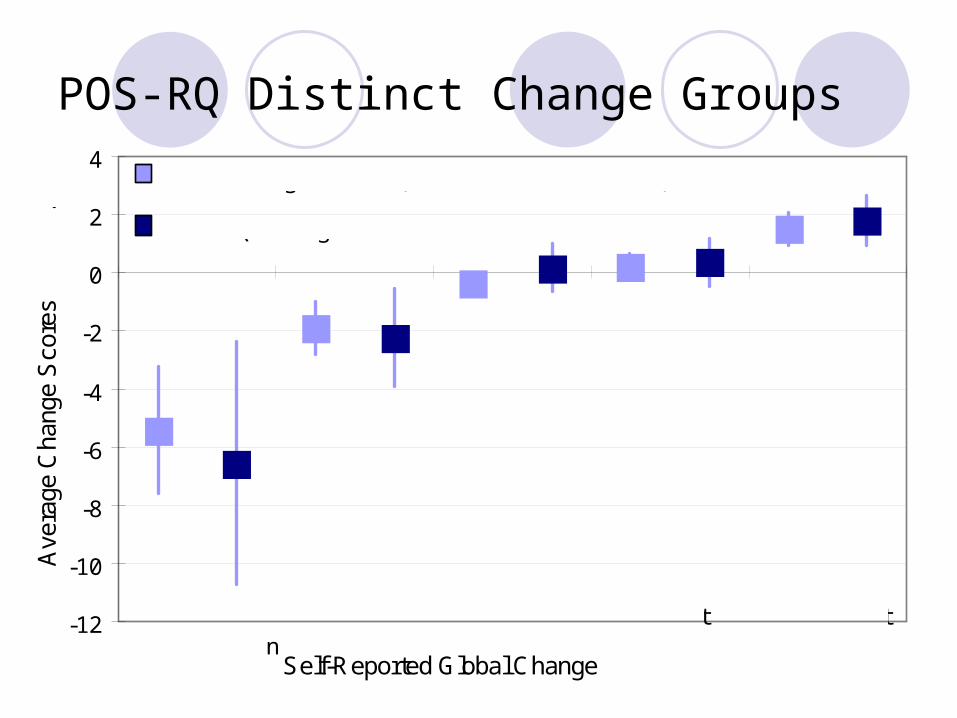
Self-Reported Global Change
Ave
rage
Cha
nge
Sco
res
.
Minimal Deterioratio
n
NoChange
MinimalImprovement
SignificantImprovement
CSI-4 Change Scores (with confidence intervals)
POS-RQ Change