neutron resonances in 133cs
TRANSCRIPT
Ann. nucl. Energy, Vol. 17, No. 10, pp. 569-577, 1990 0306-4549/90 $3.00+0.00 Printed in Great Britain. All rights reserved Copyright © 1990 Pergamon Press pie
NEUTRON RESONANCES IN 133Cs
Y. NAKAJIMA, M. OHKUBO, M. SUGIMOTO, M. MIZUMOTO and Y. KAWARASAKI
Department of Physics, Japan Atomic Energy Research Institute, Tokai-mura, lbaraki-ken 319- I 1, Japan
(Received 21 May 1990)
Abstract--Neutron capture and neutron transmission measurements on 133Cs were made to obtain neutron resonance parameters. Neutron capture areas up to 2 keV and neutron widths up to 5.9 keV for each resonance were derived. Below 100 eV five neutron radiative capture widths were obtained from the shape analysis of the transmission data. The following average s-wave resonance parameters were obtained : So = (0.77 __+ 0.09) x I0- 4,/3 = 22.4__+ 1.5 eV, ['~ = 119 +__ 3 meV. The distribution of the level spacings is consistent with the two-population Wigner distribution predicted theoretically. The statistic A3 is in good agreement with the value which Dyson and Mehta derived by using the orthogonal ensemble.
l. INTRODUCTION
Cesium neutron cross sections are of importance to the estimation of fission product poison effects in the fission reactors and the establishment of reliable burnup monitors of fast reactor fuels.
The accumulation of fission products resulting from the fuel irradiation decreases the reactivity of the fis- sion reactors. Their resolved resonance parameters are requested for the calculation of cross sections in the resonance region to predict the effect of the fission products to the characteristics of the fission reactors. The ~33Cs is one of the significant fission products in all kinds of the fission reactors and its cross sections are important to the calculation of the reactivity (Rowlands, 1975 ; Kikuchi et al., 1981 ; Takano et al., 1988).
The isotope ~34Cs is a burnup monitor of reactor fuels. It is produced by not only the nuclear fission of the fuels but also the capture reaction of the fission product 133Cs. In order to calculate the accurate burnup ratio it is necessary to know the accurate capture cross sections of 133Cs.
The most extensive experiments on the ~33Cs resolved resonance parameters are neutron trans- mission measurement below 3.5 keV by Garg et al. (1965) and neutron capture measurement between 2.6 keV and 6 keV by Macklin (1982). There have been many measurements below 1.1 keV (Landon and Sailor, 1954; Harvey et al., 1955 ; Jung and Priesmyer, 1969; Thomas et al., 1972 ; Riehs and Thomas, 1974; Hockenbury et al., 1977 ; Anufriev et al., 1977 ; Popov et al., 1981) and neutron widths in this energy region seem to be reliable. Between 1.1 and 2.6 keV only
Garg et al. data are available. Between 2.6 and 3.5 keV Garg et al. data and Macklin data are available. Macklin derived the neutron widths for three large resonances in this energy region. His values are about 1.5 times larger than those obtained by Garg et al. Only Macklin dat a are available between 3.5 and 6 keV.
The present experiment is an attempt to obtain the reliable resonance parameters up to 5.9 keV. Neutron capture data up to 2 keV and neutron transmission data up to 5.9 keV were measured using the neutron time-of-flight facility of the Japan Atomic Energy Research Institute linac.
2. EXPERIMENTS
2.1. Capture measurements
The capture measurements were carried out on the 52 m flight path of the Japan Atomic Energy Research Institute (JAERI) linac neutron time-of-flight facility (Takekoshi et al., 1975). The experimental arrange- ment used in these measurements was quite the same as that described in a previous paper (Nakajima et al., 1983). The JAERI electron linac was used to produce bursts of pulsed neutrons. The linac was operated at an energy of 140 MeV with a peak current of 1 A, a beam pulse width of 80 ns and a repetition rate of 150 pps.
Prompt y-rays from the 133Cs (n,~) reaction were detected with a 35001 liquid scintillation detector. The neutrons were measured with an 11.1 cm dia x 0.635 cm thick 6Li-giass scintillation counter placed about 4 m downstream from sample position. A sample of
569

570 Y. NAKAJIMA et al.
high-purity (99.99%) Cs2CO3, encapsulated in a 0.1 mm thick A1 case was irradiated at the center of the capture detector. The diameter and thickness of the sample were 6 cm and 0.00587 atoms/barn for 133Cs, respectively. The distance between a neutron pro- ducing target and the sample is 51.94 m. A time analyzer of 8192 channels was used to measure neu- tron flight time. The channel width of the analyzer was 100 ns.
Three kinds of data (capture events, incident neu- tron flux and the neutron flux transmitted through the sample) were measured as a function of the neu- tron flight time cyclically every 5 min to reduce sys- tematic errors. The incident neutron flux was moni- tored with an additional 6Li-glass detector located at another 47 m detector station. For background determination, an 8 mm thick metallic Na was kept placed in the neutron beam throughout the experi- ment. The measurements were controlled by an on- line mini-computer.
2.2. Transmission measurements
Neutron transmission measurements were carried out at the same facility as that used in the capture measurements, but with the different flight paths. The linac was operated at an energy of 140 meV, a beam current of 4 A and a beam width of 20 ns. As a sample, 2.90 g of Cs2CO 3 (99.5%) was encapsulated in a 4 cm dia AI case. The thickness of the sample was 0.00792 atoms/barn for ~33Cs. This sample was proven to be pure enough for the present measurements, because there was no trace of the resonances of the impurities in the measured transmission data below 6 keV. The measurements were made at two stages according to the neutron energy.
The measurements of the low energy region (below 1.15 keV) were made at a 47 m station and the experi- mental conditions were the following: the geometry of the measurements has been described in detail else- where (Ohkubo et al., 1984). The linac was operated at the repetition rate of 300 pps. The neutrons were detected by a 3.8 cm dia x 1.27 cm thick 6Li glass scintillation detector located 47.38 m from the neu- tron-producing target. The measurements were made for incident neutron flux (sample out), neutron flux transmitted through the sample (sample in) and neu- tron flux transmitted at a black resonance filter (for background determination). The sample was placed about 1.5 m upstream from the neutron detector. A time analyzer of 4096 channels was used to measure the neutron flight time. The channel widths of the analyzer were 31.25, 62.5 and 250 ns for the energy regions below 50 eV, between 50 and 450 eV, and
between 450 and 1150 eV, respectively. The incident neutron flux was monitored with a 3 mm thick 6Li glass detector of transmission type, which was located upstream from the sample and 45.98 m from the neu- tron-producing target.
The measurements of the high-energy region (between 1.15 and 5.9 keV) were made at a 190 m station and the experimental conditions were the fol- lowing: the experimental arrangement has been described in detail elsewhere (Tsubone et al., 1987; Nakajima et al., 1990). The linac was operated at the repetition rate of 150 pps. The neutrons were detected by five sets of 12.5 cm dia × 1.25 cm thick 6Li-glass detectors placed at a station located 191.59 m from the neutron-producing target. The measurements were made for incident neutron flux (sample out), neutron flux transmitting through a sample (sample in) and neutron flux transmitting through a I cm thick Bi plate (for background determination). The sample was placed at a 100 m mid-way station. The time analyzer of 16,384 channels was used to measure the neutron flight time. The channel width of the analyzer was 25 ns. The incident neutron flux was monitored with the same detector as that used in the capture measurements.
3. ANALYSIS OF DATA
3.1. Capture data
The data process was quite the same as that described in previous papers (Nakajima et al., 1983, 1989). To obtain capture yield (i.e. capture probability of neutrons by the sample) as a function of neutron energy, correction was made for dead time losses and background. The background for the neutron flux transmitted through the sample was determined from the counts at the black resonances at 47.8 eV of ~ 33Cs and 2.8 keV of 23Na. Then the background was con- verted to that of the open-beam spectrum by using the ratio of the monitor counts for each spectrum. The background of the capture spectrum was obtained from the counts in off-resonance regions of ~33Cs and at the black resonance of 23Na (2.8 keV).
The energy dependent neutron detection efficiency and its covariance were calculated with a Monte-Carlo method by ELIS (Sugimoto and Mizumoto, 1982) using the evaluated cross section data of 6Li in ENDF/B-V (1979 ; 1981 ) and of the other constituents of the 6Li-glass detector in JENDL-2 (Nakagawa, 1984), The detection efficiency of the capture detector was assumed to be time-independent. The ratio of the efficiencies between the capture detector and the neutron flux detector was determined with a saturated resonance method. For this purpose the t33Cs res-
Neutron resonances in 133Cs 571
Neutron Energy (eV) 49.0 48.5 48.0 47.5 47.0 46.5
i i i i i I
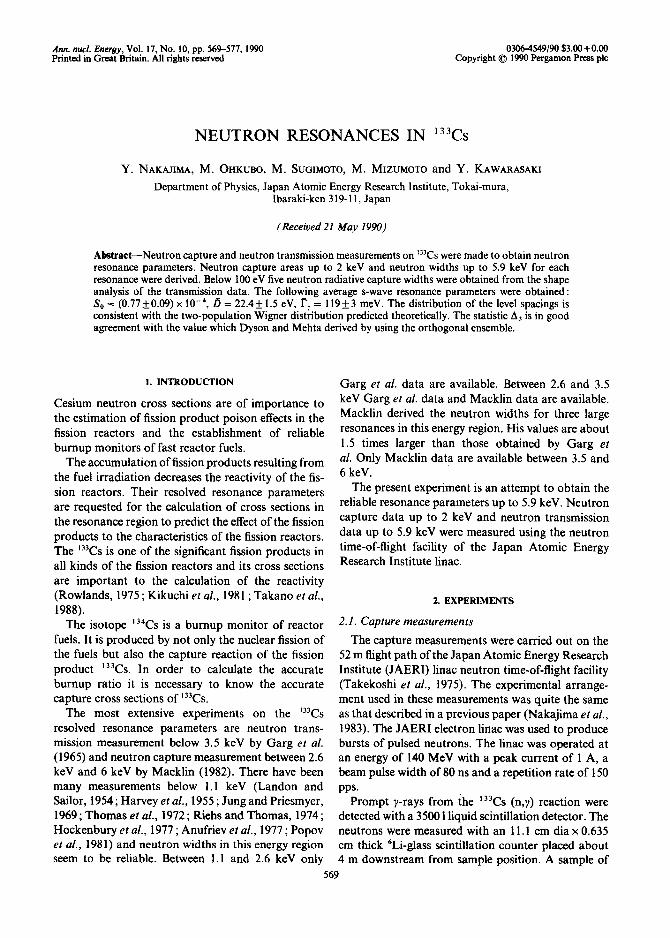
l~Cs ( n ) ) 1.2 E, "= 47.8 eV 1.0 Fn = 21.6meV
~ F 7 = 1064 meV ~ o 8 ~ -:,~ = 3
~ .0 .6 o
0.4
02 • .~" "~m 0.0 ~ i
540O 545O 55OO 5550
Channel Number Fig. I. Comparison of measured and calculated capture
yields vs neutron energy relevant to 47.8 eV resonance.
onance at 47.8 eV was chosen. (1) The initial values of the resonance parameters for this resonance were employed from the BNL-325, 3rd Edn (Mughabghab and Garber, 1973). (2) The saturated peak values were calculated with the computer code TACASI (Fr6hner, 1966) for the resonance parameters determined in the previous process. (3) The capture yield was calculated over the whole measured energy range with the value determined in (2). (4) From area analyses of the cap- ture data and of the transmission data, the new res- onance parameters of this level were obtained. To obtain the consistent resonance parameters of this level, processes (2-4) were repeated until the res- onance parameters obtained in (4) were in good agree- ment with the values used in (2). The following res- onance parameters of this resonance have been obtained as the final values; F, = 21.6 meV, Fy = 106.4 meV. The spin of this resonance has been deter- mined to be J = 3 (Thomas et al., 1972; Riehs and Thomas, 1974).
In Fig. 1, the resonance shape calculated with the
30
r.E ZO
.s::
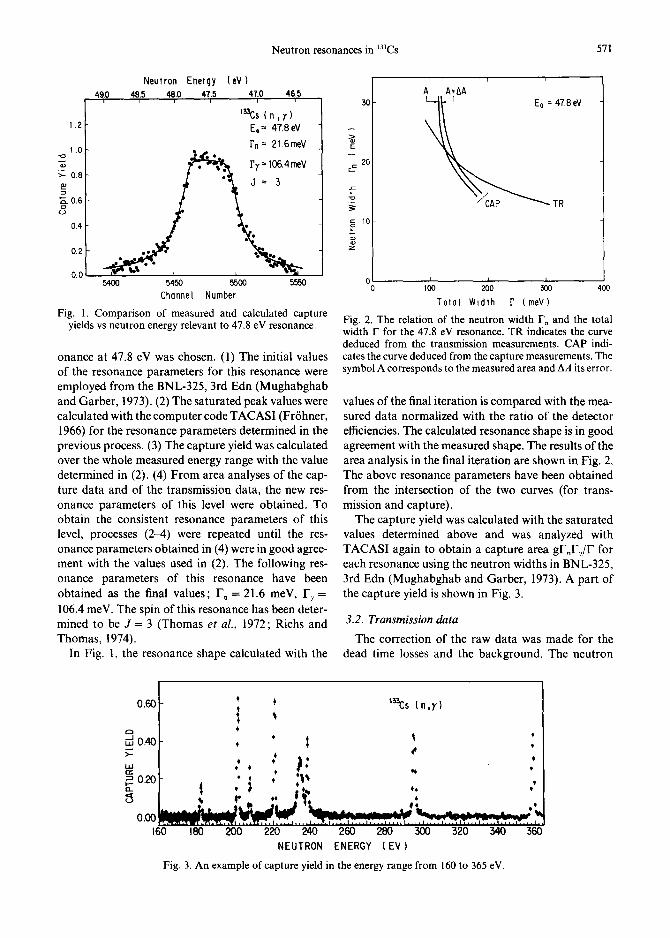
A A+AA
~ ~ E ° = c A P ~ 4 T ?R.8 eV
I I I
1 0 0 200 300
T o t a l W i d t h r ( r n e V )
400
Fig. 2. The relation of the neutron width F. and the total width F for the 47.8 eV resonance. TR indicates the curve deduced from the transmission measurements. CAP indi- cates the curve deduced from the capture measurements. The symbol A corresponds to the measured area and AA its error.
values of the final iteration is compared with the mea- sured data normalized with the ratio of the detector efficiencies. The calculated resonance shape is in good agreement with the measured shape. The results of the area analysis in the final iteration are shown in Fig. 2, The above resonance parameters have been obtained from the intersection of the two curves (for trans- mission and capture).
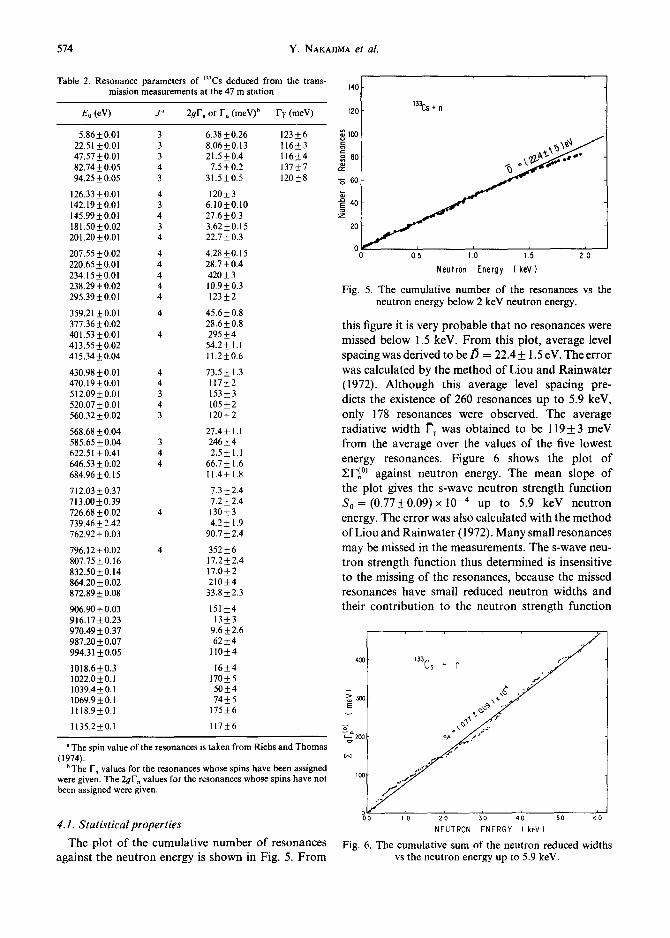
The capture yield was calculated with the saturated values determined above and was analyzed with TACASI again to obtain a capture area gF,FT/F for each resonance using the neutron widths in BNL-325, 3rd Edn (Mughabghab and Garber, 1973). A part of the capture yield is shown in Fig. 3.
3.2. Transmission data
The correction of the raw data was made for the dead time losses and the background. The neutron
0.60
J, 040 >-
IL l I:E
~ 0.20
0.00 160 180 200 220 240 260 280 300 320 340
NEUTRON ENERGY {EV) Fig. 3. An example of capture yield in the energy range from 160 to 365 eV.
,t
4
. I J e $
4 q' • ,It"
. . ~ l t ~ l ~ . q ~ l l ~ , ..~. ,~w,.. ....................................... :.-~'..~, ,,r:..; .-.:-.--r.~._.,. ~ . .... 36O

572 Y. NAKAJIMA et aL
transmission has been calculated from these corrected data.
For the measurements at the 47 m station, the back- ground for the neutron spectrum transmitted through the black resonance sample was determined by inter- polating or extrapolating the counts at the black res- onances at 132 eV (59Co), 330 and 2300 eV (55Mn) and 18 eV (186W). This background was converted to those of the open-beam spectrum and the sample-in spectrum by normalizing with the monitor counts.
For the measurements at the 190 m station, the background was estimated from the counts at the black resonances of 23Na (2.8 keV) and of 2°9Bi (0.8, 2.3, 5.1 and 12.1 keV).
The transmission data were analyzed with the shape analysis code SlOB (de Saussure e t al . , 1978) based on the Breit-Wigner multi-level formula to obtain the resonance parameters. Examples of the shape analysis with SlOB are shown in Figs 4a~l.
4. RESULTS
The values for A s = yF,F~/F deduced from the cap- ture data for 76 levels up to 2 keV are listed in Table 1 along with the values for yF, and J used in the present analysis. The values of yFn and J were taken from BNL-325, 3rd Edn (Mughabghab and Garber, 1973).
The neutron energy and the neutron widths are listed in Tables 2 and 3 for 51 levels up to 1.15 keV deduced from the measurements at the 47 m station and for 136 levels between 1.15 and 5.9 keV de- duced from the measurements at the 190 m stations, respectively.
Table 1. Resonance parameters of mCs deduced from the capture measurements
Eo(eV) j a #F, (meV) Ay(meV) AA?(meV)
47.60 3 (9.5) 7.9 0.4 82.70 4 (4.5) 3.8 0.2 94.14 3 (9.5) 8.1 0.4
126.28 4 (55.0) 27.1 1. I 142.15 3 (3.3) 2.5 0.12
145.97 4 (14.5) 11.4 0.5 181.47 3 (1.21) 1.3 0.07 201.17 4 (15.5) 10.5 0.5 207.47 4 (1.45) 2.0 0.1 220.65 4 (12.0) 10.3 0.5
234.83 4 (215.0) 45.0 1.9 238.22 4 (6.9) 5.8 0.3 295.11 4 (50.0) 24. I 1.1 359.00 4 (21.0) 14.6 0.7 377.24 3 (9.33) 7.8 0.4
401.36 4 (130.0) 33.2 1.5 413.41 ~ (31.5) 23.4 1.1 430.73 4 (32.0) 20.5 1.0 470.15 4 (51.0) 24.3 I. 1
continued
Table l--continued.
E0 (eV) J" #F. (meV) Ay (meV) AA7 (meV)
511.83 3 (62.5) 21.5 1.0 519.94 4 (53.6) 27.0 1.3 560.01 3 (39.1) 20.5 1.0 568.58 (9.54) 12.4 0.6 585.56 3 (84.7) 27.2 1.3 622.72 4 (0.5) 1.4 0.3
646.12 4 (25.4) 19.0 0.9 684.50 (I.31) 3.1 0.3 711.51 (1.60) 5.3 0.4 726.40 4 (59.3) 27.8 1.3 739.07 (0.54) 1.7 0.4
762.64 (38.7) 21.3 1. I 796.24 4 (152.3) 35.6 1.8 807.74 (5.7) 5.8 0.5 820.11 (0.86) 1.6 0.3 832.76 (2.9) 3.9 0.4
863.92 (91.1 ) 32.0 I. 5 872.54 (9.75) 12,1 0.7 906.45 (52.7) 27,7 1.3 915.23 (2.4) 4,8 1.4 970.73 (3.1) 4,6 0.5
987.05 (18.8) 16,3 0.9 993.69 (39.4) 24,6 1.2
1021.81 h (87.7) 35.4 1.8 1038.62 (19.3) 15.8 1.0 1069.52 (26.2) 18.9 1. I
I 118.69 (100.3) 39.6 1.9 I 134.79 (57.3) 27.1 1.4 1156.47 (I 1.9) 12.7 1.0 1176.64 (34.3) 22.3 1.3 1187.46 (10.3) 12.4 0.9
1240.39 (116.2) 26.3 1.6 1249.75 (21.2) 15.6 1.1 1268.80 (178.0) 40.0 2.0 1280.92 (89.4) 26.4 1.5 1323.47 (80.0) 33.4 1.8
1331.20 (72.9) 33.0 1.9 1390.00 (I 8.6) 12.9 1.1 1423.73 (71.6) 36.0 2.0 1454.24 (I 02.9) 29.6 1.9 1464.65 (6.1) 4.3 1.0
1482.74 (2.7) 5.8 1.1 1526.25 (42.9) 29.8 1.9 1532.62 (8.6) 12.5 1.2 1545.50 (19.7) 17.8 1.4 1595.21 ( 199.6) 52 3
1615.77 (60.3) 25.0 1.7 1665.32 (44.9) 26. I 1.8 1683.57 (205. I ) 51 4 1705.86 (61.9) 30 3 1736.29 (25.0) 16 1.6
1762.28 (62.9) 30 3 1809.85 (17.0) 13.7 1.4 1851.58 ~ (24.0) 29 3 1901.37 (2.2) 9.1 1.6 1914.68 (6.6) 9.3 1.8
1954.39 (44.2) 35 3
"The spin value of the resonances is taken t¥om Riehs and Thomas (1974).
b These resonances are doublets. This resonance is a triplet.
The neutron widths given in the parentheses are taken from BNL-325, 3rd edn.

(ol
(b)
I .00
_ 0.
80
to 0.80
to
0.40
O
f_
e---
0.20
0.00
II
Il
il
ll
l
,,
ll
,
lI
Il
Il
l
,I
,,
lt
ll
ll
Il
ll
"75
80
85
90
95
100
105
(c)
Ne
utr
on
E
ne
rgy
(e
V)
.;
I t
0.20
I
0,00
I I
I I
i I
I I
I I
l I
I I
I I
I I
I i
I I
I I
, I
I I
I I
I I
I I
;
85
0
90
0
95
0
10
00
1
05
0
11
00
1
15
0
Neu
tron
E
nerg
y (
eV
)
1.0
0
0.80
C 0
0.60
E c 0.40
o
0.2
0
0.0
0
, I
I I
I I
I '
I ....
I I
I '
I I
I I
I ~
0 ....
I .
..
.
I I
I t
470
480
490
500
520
530
Neutron
Energy
( eV
)
i .00
0.8
0
E
0 °_
0.60
O0
E
O-4
0 0 L
0.20
0 I
0 0
(d) i
~ J
~ i
i i
[ i
i i
i I
i I
I I
I I
I I
I I
I I
I I
I I
I I
I I
I I
I I
I I
I I
E I
I ~
I I
I I
I I
4150
42
00
4250
43
00
4350
44
00
4450
45
00
4550
46
00
Neu
tron
E
nerg
y (e
V)
Fig
. 4.
An
ex
amp
le o
f th
e sh
ape
anal
ysi
s o
f th
e tr
ansm
issi
on
dat
a w
ith
SIO
B i
n t
he
ener
gy
ran
ge:
(a
) 71
10
8 eV
; (b
) 4
62
-53
8 e
V;
(c)
81
0-I
170
eV
; an
d
(d)
41
20
-46
40
eV
.
574 Y. NAKAJIMA et al.
Table 2. Resonance parameters of mCs deduced from the trans- mission measurements at the 47 m station
E0 (eV) J" 2#F. or F, (meV) b Fy (meV)
5.86_+0.01 3 6.38-t-0.26 22.51 _+0.01 3 8.06+0.13 47.57_+0.01 3 21.5_+0.4 82.74 -+ 0.05 4 7.5 -+ 0.2 94.25_+0.05 3 31.5_+0.5
126.33-+0.01 4 120+3 142.19-+0.01 3 6.10+0.10 145.99 _+ 0.01 4 27.6 _+ 0.3 181.50_+0.02 3 3.62___0.15 201.20+0.01 4 22.7+0.3
207.55+0.02 4 4.28+0.15 220.65 -+ 0.01 4 28.7 -+ 0.4 234.15-+0.01 4 420_+3 238.29_+0.02 4 10.9+0.3 295.39-+0.01 4 123_+2
359.21 -+ 0.01 4 45.6_+0.8 377.36_+ 0.02 28.6_+ 0.8 401.53+0.01 4 295-+4 413.55-+0.02 54.2_+ 1.1 415.34_+0.04 11.2+0.6
430.98-+0.01 4 73.5_+ 1.3 470.19+0.01 4 117+2 512.09_+0.01 3 153_+3 520.07_+0.01 4 105+2 560.32 + 0.02 3 120 -+ 2
568.68_+0.04 27.4+ 1.1 585.65 + 0.04 3 246 -+ 4 622.51 -+0.41 4 2.5-+ 1.1 646.53 _+ 0.02 4 66.7 _+ 1.6 684.96-+0.15 11.4-+ 1.8
712.03 + 0.37 7.3 -+ 2.4 713.00+0.39 7.2-+2.4 726.68 + 0.02 4 130 + 3 739.46 _+ 2.42 4.2 _+ 1.9 762.92 -+ 0.03 90.7 + 2.4
796.12_+0.02 4 352+6 807.75-+0.16 17.2-+2.4 832.50-t-0.14 17.0_+2 864.20+0.02 210_+4 872.89 + 0.08 33.8 + 2.3
906.90+0.03 151 _+4 916.17-+0.23 13_+3 970.49 -+ 0.37 9.6 + 2.6 987.20 _+ 0.07 62 + 4 994.31 _+0.05 110-+4
1018.6-+0.3 16-+4 1022.0+0.1 170+5 1039.4_+0.1 50_+4 1069,9-+0.1 74-+5 1118,9_+0.1 175_+6
1135,2_+0.1 117_+6
123_+6 116_+3 116_+4 137_+7 120_+8
"The spin value of the resonances is taken from Riehs and Thomas (1974).
h The F, values for the resonances whose spins have been assigned were given. The 2gF, values for the resonances whose spins have not been assigned were given.
4.1. Statist ical properties
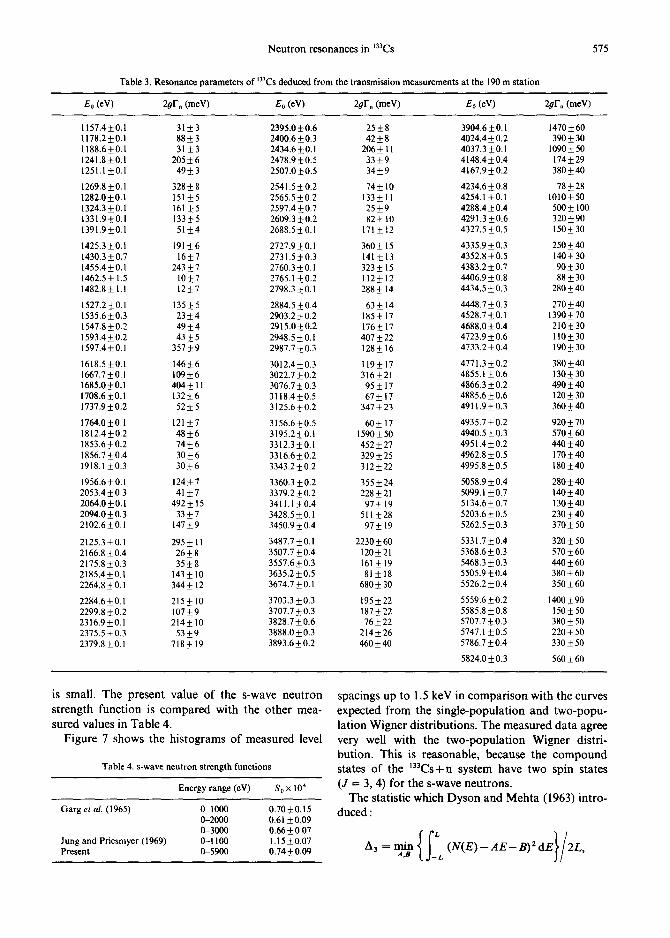
T h e p lo t o f t he c u m u l a t i v e n u m b e r o f r e s o n a n c e s
a g a i n s t t he n e u t r o n e n e r g y is s h o w n in Fig. 5. F r o m
140
120
I(X)
o 80
"~ 60
20
133Cs + n
0 0.5 1.0 I.'5 2'.0
Neutron Energy (keV)
Fig. 5. The cumulative number of the resonances vs the neutron energy below 2 keV neutron energy.
this f igure it is very p r o b a b l e t h a t n o r e s o n a n c e s were
m i s s e d be low 1.5 keV. F r o m th i s p lot , ave r age level
s p a c i n g was de r ived to b e / ) = 22,4 -I- 1.5 eV. T h e e r r o r
was ca l cu l a t ed by the m e t h o d o f L i o u a n d R a i n w a t e r
(1972). A l t h o u g h th i s a v e r a g e level s p a c i n g pre-
d ic ts the ex i s t ence o f 260 r e s o n a n c e s u p to 5.9 keV,
on ly 178 r e s o n a n c e s were obse rved . T h e ave rage
rad ia t ive w i d t h i~r was o b t a i n e d to be 1 1 9 + 3 m e V
f r o m the a v e r a g e ove r the va lues o f the five lowes t
ene rgy r e s o n a n c e s . F i g u r e 6 s h o w s the p lo t o f
EFt, °) a g a i n s t n e u t r o n energy . T h e m e a n s lope o f
the p lo t g ives the s -wave n e u t r o n s t r e n g t h f u n c t i o n
S o = ( 0 . 7 7 + 0 . 0 9 ) x 10 - " u p to 5.9 keV n e u t r o n
energy . T h e e r ro r was a lso ca l cu l a t ed wi th the m e t h o d
o f L i o u a n d R a i n w a t e r (1972). M a n y sma l l r e s o n a n c e s
m a y be m i s s e d in the m e a s u r e m e n t s . T h e s -wave n e u -
t r o n s t r e n g t h f u n c t i o n t h u s d e t e r m i n e d is insens i t ive
to the m i s s i n g o f the r e s o n a n c e s , b e c a u s e the m i s s e d
r e s o n a n c e s h a v e sma l l r e d u c e d n e u t r o n w i d t h s a n d
the i r c o n t r i b u t i o n to the n e u t r o n s t r e n g t h f u n c t i o n
400 '33Cs + n
;300 ~ " '
e \ .j.r
Ioo ..i,~
%~ , o ~ o 31o ,~ ~'o ~'o NEUTRON ENERGY (keY)
Fig. 6. The cumulative sum of the neutron reduced widths vs the neutron energy up to 5.9 keV.
N e u t r o n resonances in '33Cs
Table 3. Resonance parameters of '3~Cs deduced from the transmission measurements at the 190 m station
575
Eo (eV) 2gF. (meV) Eo (eV) 2gr. (meV) Eo (eV) 2gr. (meV)
1157.4+0.1 31+3 2395.0+_0.6 25+8 3904.6 +0.1 1470_+60 1178.2_0.1 88__.3 2400.6_+0.3 42_+8 4024.4_+0.2 390_+30 1188.6___0.1 31 -+3 2434.6+0.1 206-+ I I 4037.3-+0.1 1090-+50 1241.8-+0.1 205+_6 2478.9-+0.5 33-+9 4148.4_+0.4 174-+ 29 1251.1 4-_0.1 49+_3 2507.0-+0.5 34-+9 4167.9-+0.2 380+_40
1269.8_+0.1 328+_8 2541.5-+0.2 74-+ 10 4234.6+_0.8 78-+28 1282.0_+0.1 151 +5 2565.5-+0.2 133 -+ ll 4254.1 -+0.1 1010_+ 50 1324.3 +0.1 161 _+5 2597.4+_0.7 25-+9 4288.4-+0.4 500_+ 100 1331.9_+0.1 133_+5 2609.3_+0.2 82_+10 4291.3_+0.6 320_+90 1391.9_+0.1 51 +4 2688.5 + 0.1 171 _+ 12 4327.5_+0.5 150_+ 30
1425.3_+0.1 191 _+6 2727.9_+ 0.1 360_+ 15 4335.9_+0.3 250_+40 1430.3 _+0.7 16_+7 2731.5_+0.3 141 _+ 13 4352.8_+0.5 140_+30 1455.4_+ 0.1 243_+7 2760.3_+ 0.1 323_+ 15 4383.2+_0.7 90_+30 1462.5 _+ 1.5 10 _+ 7 2765.1 _+ 0.2 I 12 _+ 12 4406.9 _+ 0.8 88 _+ 30 1482.8_+ I.I 12_+7 2798.3 _+0.1 288_+ 14 4434.5+_0.3 280+40
1527.2-+0.1 135-+5 2884.5-+0.4 63-+14 4448.7_+0.3 270_+40 1535.6_+0.3 23_+4 2903.2_+0.2 185_+ 17 4528.7_+0.1 1390+_70 1547.8-+0.2 49+__4 2915.0_+0.2 176_+ 17 4688.0-+0.4 210-+30 1593.4 -+ 0.2 43 +_ 5 2948.5 _+ 0. I 407 _+ 22 4723.9 +_ 0.6 110 -+ 30 1597.4-+0.1 357_+9 2987.7_+0.3 128_+16 4733.2_+0.4 190_+30
1618.5 _+0.1 146_+6 3012.4_+0.3 119_+ 17 4771.3+_0.2 380_+40 1667.7_+0.1 109+_6 3022.7_+0.2 316_+21 4855.1 _+0.6 130_+30 1685.0_+0.1 404_+ I1 3076.7+_0.3 95_+ 17 4866.3_+0.2 490_+40 1708.6+0.1 132+_6 3118.4-+0.5 67+_ 17 4885.6+0.6 120-+30 1737.9-+0.2 52_+5 3125.6_+0.2 347_+23 4911.9_+0.3 360_+40
1764.0_+0.1 121 _+7 3156.6_+0.5 60_+ 17 4935.7_+0.2 920_+70 1812.4_+0.2 48+_6 3195.2_+0.1 1590_+50 4940.5_+0.3 570_+60 1853.6_+0.2 74_+6 3312.3+0.1 452_+27 4951.4_+0.2 440_+40 1856.7_+0.4 30-+6 3316.6+_0.2 329-+25 4962.8-+0.5 170_+40 1918,1 +0.3 30-+6 3343.2-+0.2 312-+22 4995.8_+0.5 180_+40
1956,6 -+ 0.1 124 -+ 7 3360.3 -+ 0.2 355 _+ 24 5058.9 _+ 0.4 280 _+ 40 2053,4 _+ 0.3 41 _+ 7 3379.2 _+ 0.2 228 _+ 21 5099. I _+ 0.7 140 _+ 40 2064.0_+0.1 492_+ 15 3411.1 _+0.4 97_+ 19 5134.6_+0.7 130+-40 2094.0_+0.3 33_+7 3428.5_+0.1 511 _+28 5203.6_+0.5 230_+40 2102.6_+0.1 147_+9 3450.9_+0.4 97_+ 19 5262.5_+0.3 370_+50
2125.3_+0,1 295_+ 11 3487.7_+0.1 2230_+60 5331.7_+0.4 320_+50 2166.8_+0,4 26_+8 3507.7_+0.4 120_+21 5368.6_+0.3 570_+60 2175.8_+0.3 35_+8 3557.6_+0.3 161 + 19 5468.3_+0.3 440_+60 2185.4_+0.1 143 _+ 10 3635.2_+0.5 81 + 18 5505.9+_0.4 380_+60 2264.8_+0.1 344_+ 12 3674.7_+0.1 680_+30 5526.2_+0.4 350+_60
2284.6-+0.1 215-+ 10 3703.3-+0.3 195-+22 5559.6+_0.2 1400-+90 2299.8 -+ 0.2 107 -t-_ 9 3707.7 + 0.3 187 -+ 22 5585.8 _+ 0.8 150 _+ 50 2316.9+_0.1 214_+10 3828.7+_0.6 76-+22 5707.7_+0.3 380_+50 2375.5-+0.3 53-+9 3888.0-+0.3 214-+26 5747.1 _+0.5 220_+50 2379.8_+0.1 718_+ 19 3893.6_+0.2 460_+40 5786.7_+0.4 330_+50
5824.0 4- 0.3 560 _+ 60
is small. The present value of the s-wave neutron strength function is compared with the other mea- sured values in Table 4.
Figure 7 shows the histograms of measured level
Table 4. s-wave neutron strength functions
Energy range (eV) So x 104
Garg et al. (1965) O-1000 0.70+0.15 0-2000 0.61 + 0.09 0-3000 0.66+0.07
Jung and Priesmyer (I 969) 0-1100 I. 15 +_ 0.07 Present 0-5900 0.74 _+ 0.09
spacings up to 1.5 keV in comparison with the curves expected from the single-population and two-popu- lation Wigner distributions. The measured data agree very well with the two-population Wigner distri- bution. This is reasonable, because the compound states of the '33Cs+n system have two spin states (J = 3, 4) for the s-wave neutrons.
The statistic which Dyson and Mehta (1963) intro- duced :

576 Y. NAKAJIMA et al.
2 0 I J ~ t ~ t ~
| mCs + n
z~ 15 I'[ - - TWO poptJIotion Wigner disl.
% o15 ,o ,i~ 2'0 -?'5- 3~0 3'~ O/5
Fig. 7. Comparison of the measured level spacing dis- tribution and the single- and two-population Wigner dis-
tributions.
is a measure of the long-range correlation of the level spacings, where 2L indicates the range o f the observed energy interval with the origin of the energy in the
center, N(E) is the number of levels having energy between 0 and E, and A and B are chosen so that the straight-line y = A E + B gives the minimum value of
A3. Dyson and Mehta (1963) have shown that A 3 = ( l /n 2) (In n--0.0687) and var (A3) = (0.11) 2 for
an or thogonal ensemble, where n is the number of the
measured resonances. Table 5 shows the comparison of the measured values o f A3 with those of the Dyson and Mehta theory and of the uncorrelated (random)
Wigner distribution. The experimental value supports the Dyson and Mehta theory.
The distribution of the measured neutron reduced widths is compared with the Por t e r -Thomas dis- tribution in Fig. 8. Above (qF:.) ~/2 = 1.3 (meV) ~/2 the
~ I I I l l I l i t
50
~ 4 0
m 3 0 o
z~O
IO
O. 0.6 L2 1.8 2.4 3.0 3.6 4.2 4.8
( meV iv2
Fig. 8. Comparison of the distribution of the measured reduced neutron widths and the Porter-Thomas distribution.
Table 5. Dyson-Mehta statistics A 3
A~
Theory (Dyson-Mehta) 0.69-+ 0.22 Uncorrelated Wigner 1.27 _+ 0.76 Experimental" 0.77
Em.~ = 1.5 keV. No. of resonances = 66.
measured data are in good agreement with the Po r t e r - Thomas distribution. Below 1.3 (meV)~/2 the agree-
ment is not good, because many small resonances have been missed.
4.2. Comparison with other data
Garg et al. gave an s-wave neutron strength func- tion smaller than the present value as shown in Table
Table 6. Comparison of the present resonance parameters with those of Macklin (I 982)
Present Macklin (I 982)
E~ (eV) 2#F° (meV) E,~ (eV) 29F. (meV)" Fy (meV)
2688.5 171 + 12 2688 (124) 121 -+4 2727.9 360 __+ 15 2728 h 842 __+ 16 177 -+ 4 2731.5 141__+13 2760.3 323__+15 2759 (630) 113_+2 2798.3 288_+ 14 2797 (274) 135_+3
2903.2 185_+17 2902 (194) 83+2 2915.0 176-+17 2913 (146) 164_+5 2948.5 407 _+ 22 2947 (304) I 15 _+ 2 3022.7 316_+21 3022 (264) 128_+2 3125.6 347_____23 3125 (334) 99_+2
3195.2 1590____.50 3194 1490-+28 209-+3 3312.3 452__+27 3311 (748) 134-+3 3343.2 312__+22 3342 (214) 132-+3 3360.3 355-+24 3359 (266) 112_+2 3379.2 228_+21 3378 (104) 168+8
3428.5 511 _+28 3428 (350) 122_+3 3487.7 2230_+60 3487 2340_+106 94_+3 3507.7 120_+21 3506 (118) 153-+9 3703.3 195_+22 3703 h 2840__+86 182_+6 3707.7 187 _+ 22
3958 1362_+ 54 77 + 3 4234.6 78_+28 4233 1934_+78 115_+4 4288.4 500_+100 4289 b 3820+122 180+5 4291.3 320_+90 4448.7 270_+40 4449 1864_+56 123_+3
4528.7 1390_+70 4527 1694_+40 206-+4 4771.3 380-+40 4770 1050-+32 104_+3 4885.6 120_+30 4885 1166_+76 59_+4 4935.7 920_+ 70 4936 b 2500 + 76 207 _+ 6 4940.5 570 _+ 60
5099.1 140+40 5098 1046+62 65_+4 5134.6 130_+40 5134 1076_+56 98-+5 5368.6 570-+60 5366 1318_+76 113_+6 5786.7 330-+50 5787 2360-+84 176+6
"Values in parentheses were taken from earlier transmission data (Garg et al., 1965).
bThese resonances are possibly doublets from the present data.
Neutron resonances in 133Cs 577
4, consequently the neutron widths of the present measurements are systematically larger than those of Garg et al. (1965).
The resonance parameters of the present experi- ment are compared with the Macklin (1982) data in the overlap energy region in Table 6. Macklin derived both the neutron and capture widths for 16 resonances in this energy region. Four of these resonances have been proved to be doublets by the present measure- ments. The neutron widths deduced by Macklin are 2 ~ 10 times larger for the doublets than the present results, while the present results differ at most twice from the Garg et al. data in this energy region. Too large capture widths of them by Macklin are due to the doublets.
Acknowledgements--The authors wish to express their grati- tude to Mr T. Shoji for his technical assistance and to the operation crew of the JAERI linac for supplying stable beam.
REFERENCES
Anufriev V. A. et al. (1977) At. Energi. 43, 201. Dyson F. J. and Mehta M. L. (1963) J. math. Phys. 4, 701. ENDF/B-V (1979, 1981) Evaluated Neutron Data File,
ENDF/B, Version V, National Nuclear Data Center, BNL, Upton, New York.
Fr6hner F. H. (1966) Report GA-6906. Garg J. B., Rainwater J. and Havens W. W. Jr (1965) Phys.
Rev. 137, B547.
Harvey J. A. et al. (1955) Phys. Rev. 99, 10. Hockenbury R. W. et al. (1977) Report ERDA-NDC-9,
p. 242. Jung H. H. and Priesmyer H. G. (1969) Atomkernenergie 14,
271. Kikuchi Y. et al. (1981) Report JAERI 1268. Landon H. H. and Sailor V. L. (1954) Phys. Rev. 93, 1030. Liou H. I. and Rainwater J. (1972) Phys. Rev. C6, 435. Macklin R. L. (1982) Nucl. Sci. Enyng 81,418. Mughabghab S. F. and Garber D. I. (1973) BNL-325, 3rd
Edn, Vol. 1. Nakagawa T. (1984) Report JAERI-M 84-103. Nakajima Y. et al. (1983) J. nucl. Sci. Technol. 20, 183. Nakajima Y. et al. (1989) Ann. nucl. Energy 16, 589. Nakajima Y. et al. (1990) Ann. nucl. Energy 17, 95. Ohkubo M., Mizumoto M. and Kawarasaki Y. (1984) J.
nucl. Sci. Technol. 21,254. Popov A. B. et al. (1981) Report JINR-P3-81-721. Riehs P. and Thomas B. W. (1974) Proc 2ndlnt. Syrup. on
Neutron Capture Gamma-Ray Spectroscopy and Related Topics, Petten, The Netherlands, p. 300.
Rowlands J. L. (1978) Proc. Int. Conf. on Neutron Phys. and Nucl. Data for Reactors and other Applied Purposes, Harwell, U.K., p. 7. OECD Nuclear Energy Agency.
de Saussure G., Olsen D. K. and Perez R. B. (1978) Report ORNL-TM 6286.
Sugimoto M. and Mizumoto M. (1982) Report JAERI-M 82-193. In Japanese.
Takano H. et al. (1988) Nucl. Technol. 80, 250. Takekoshi H. et al. (1975) Report JAERI 1238. In Japanese. Thomas B. W. et al. (1972) AERE-PR/NP 18, 23. Tsubone I., Nakajima Y. and Kanda Y. (1987) J. nucl. Sci.
Technol. 24, 975.