neuronal correlates of amblyopia in the visual cortex of...
TRANSCRIPT
Neuronal Correlates of Amblyopia in the Visual Cortex of MacaqueMonkeys with Experimental Strabismus and Anisometropia
Lynne Kiorpes,1 Daniel C. Kiper,2 Lawrence P. O’Keefe,1 James R. Cavanaugh,1 and J. Anthony Movshon2
1Center for Neural Science and 2Howard Hughes Medical Institute, New York University, New York, New York 10003
Amblyopia is a developmental disorder of pattern vision. Aftersurgical creation of esotropic strabismus in the first weeks oflife or after wearing 210 diopter contact lenses in one eye tosimulate anisometropia during the first months of life, ma-caques often develop amblyopia. We studied the responseproperties of visual cortex neurons in six amblyopic macaques;three monkeys were anisometropic, and three were strabismic.
In all monkeys, cortical binocularity was reduced. In ani-sometropes, the amblyopic eye influenced a relatively smallproportion of cortical neurons; in strabismics, the influence ofthe two eyes was more nearly equal. The severity of amblyopiawas related to the relative strength of the input of the amblyopiceye to the cortex only for the more seriously affectedamblyopes.
Measurements of the spatial frequency tuning and contrastsensitivity of cortical neurons showed few differences betweenthe eyes for the three less severe amblyopes (two strabismicand one anisometropic). In the three more severely affected
animals (one strabismic and two anisometropic), the optimalspatial frequency and spatial resolution of cortical neuronsdriven by the amblyopic eye were substantially and significantlylower than for neurons driven by the nonamblyopic eye. Therewere no reliable differences in neuronal contrast sensitivitybetween the eyes. A sample of neurons recorded from cortexrepresenting the peripheral visual field showed no interoculardifferences, suggesting that the effects of amblyopia were morepronounced in portions of the cortex subserving foveal vision.
Qualitatively, abnormalities in both the eye dominance andspatial properties of visual cortex neurons were related on acase-by-case basis to the depth of amblyopia. Quantitativeanalysis suggests, however, that these abnormalities alone donot explain the full range of visual deficits in amblyopia. Studiesof extrastriate cortical areas may uncover further abnormalitiesthat explain these deficits.
Key words: visual development; visual cortex; amblyopia;anisometropia; strabismus; macaque monkeys
Visual function in adulthood depends on an individual’s visualexperience in infancy. The work of Wiesel and Hubel (1963,1965) established that the first stage of visual processing affectedby visual experience is in the primary visual cortex, and a largebody of subsequent work has shown that various forms of anom-alous visual experience modify the development of the functionalproperties and architecture of cortical neurons (for review, seeMovshon and Van Sluyters, 1981; Movshon and Kiorpes, 1990). Itis no surprise that changes in visual cortical function are associ-ated with changes in visual performance assessed in behavioraltasks (for review, see Kiorpes and Movshon, 1990).
Following Wiesel and Hubel, most work on the effect of visualexperience on development has concentrated on the effects ofcomplete or partial deprivation of visual input, which leads tomore or less wholesale loss of effective inputs from the deprivedeye to neurons in the visual cortex. Such deprivation is rare in
humans, who more commonly experience abnormal early visionas a result of either strabismus (a misalignment of the visual axesthat prevents concordant stimulation of binocularly correspond-ing points in the two retinas) or anisometropia (a difference inrefractive state between the eyes that leads one retinal imagealways to be blurred). These two conditions are strongly associ-ated with the development of amblyopia, a reduction in visualacuity without an obvious organic cause. Amblyopia is character-ized by a constellation of deficits in spatial vision, as indexed byvisual acuity, spatial contrast sensitivity, and other tasks (forreview, see Von Noorden, 1980; Levi and Carkeet, 1993). Somereports on humans suggest that anisometropia and strabismuslead to different forms of amblyopia, although this is by no meansa universal finding (Hess et al., 1978; Levi and Klein, 1982;McKee et al., 1992; Movshon et al., 1996). In recent years, we andothers have studied the characteristics of amblyopia in macaquemonkeys raised with artificially created forms of strabismus andanisometropia. Psychophysical studies show that the amblyopiathat follows this rearing closely resembles the condition describedin humans (Harwerth et al., 1983; Smith et al., 1985; Kiorpes etal., 1987; 1989; Kiorpes and Movshon, 1996).
The neural basis of amblyopia has been less thoroughly ex-plored. Changes in the degree of binocular interaction have beendocumented in amblyopic monkeys (e.g., Movshon et al., 1987;Crawford et al., 1996; Smith et al., 1997), but it seems unlikelythat changes in binocular interaction alone can explain the ab-normalities of amblyopic vision. There is also a substantial, al-though inconsistent, literature on developmental visual abnor-malities in cats, but this literature is of uncertain value for
Received March 18, 1998; revised June 3, 1998; accepted June 5, 1998.This research was supported by National Institutes of Health Grants EY05864,
EY02017, and RR00166, and by an investigatorship to J.A.M. from the HowardHughes Medical Institute. D.C.K. was supported in part by a fellowship from theFonds National Suisse pour la Recherche. Michael Hawken and Chao Tang partic-ipated in some of these experiments. We thank Suzanne Fenstemaker, JasmineAllen Siegel, Michael Gorman, and Patricia Adler for their assistance, and Drs.Howard Eggers and Melvin Carlson for their expert strabismus surgery.
Correspondence should be addressed to Lynne Kiorpes, Center for NeuralScience, New York University, 4 Washington Place, Room 809, New York, NY10003.
Dr. Kiper’s present address: Institut de Biologie Cellulaire et Morphologie,Faculte de Medecine, Universite de Lausanne, CH-1015 Lausanne, SwitzerlandCopyright © 1998 Society for Neuroscience 0270-6474/98/186411-14$05.00/0
The Journal of Neuroscience, August 15, 1998, 18(16):6411–6424
understanding amblyopia, because it is not clear that cats developthe condition as primates do (for review, see Movshon andKiorpes, 1990; Daw, 1995).
We have shown previously that the amblyopia that follows oneparticular form of abnormal early experience, unilateral blurcreated by atropine instillation, is associated with a pattern ofphysiological and anatomical changes in visual cortex quitedifferent from that seen following monocular deprivation. Insteadof a wholesale loss of input, we found changes in the functionand architecture of the visual cortex that were more subtle,suggesting a selective rearrangement, but not a complete loss, ofeffective inputs from the amblyopic eye (Hendrickson et al., 1987;Movshon et al., 1987).
The interpretation of these results is complicated, becauseunilateral atropine instillation is a relatively uncontrolled tech-nique for modifying early visual experience. We have thereforeraised and studied two new groups of experimentally amblyopicmonkeys. To simulate strabismus, we misaligned the visual axesby surgical modification of the extraocular muscles. To simulateanisometropia, we used extended-wear contact lenses with differ-ent powers in the two eyes. Just as humans vary in their responseto early visual abnormalities, so do monkeys. In this paper, wereport the effects of these two rearing regimens in a selectedgroup of animals in whom the rearing created a relatively modestvisual loss in the amblyopic eye. Our results show that thisamblyopia is usually associated with deleterious changes in thespatial properties of neurons driven by the amblyopic eye in thevisual cortex, and in some cases, also with a loss of effective inputsfrom the amblyopic eye. These changes are associated, on ananimal-by-animal basis, with the depth of amblyopia. We did notobserve distinctively different results in neuronal properties orvisual behavior between the strabismic and anisometropic ani-mals. Quantitatively, the changes in cortical neuron properties aresmaller than those seen behaviorally, suggesting that the neuralbasis of amblyopia begins, but does not end, in the primary visualcortex.
In addition to previous publications of some of the behav-ioral data (specifically noted below), a brief report of some ofthese physiological results has appeared previously (Kiorpesand Movshon, 1996).
MATERIALS AND METHODSSubjects. Six amblyopic pig-tailed macaques, Macaca nemestrina, wereused in this study. They were hand-raised from infancy in our primatenursery or in the nursery of the Washington Regional Primate Center,where they were born. Three monkeys were raised with unilateral es-otropia, and three were raised with unilateral defocus. These six animalswere selected for this study from larger groups of strabismic and aniso-metropic animals on the basis of their degree of amblyopia. Data fromthree other strabismic monkeys that belong to another study (Fenste-maker et al., 1997) are briefly presented in Figure 3. Control data wereobtained from eight monkeys raised normally. Care of the animals wasprovided in accordance with established approved protocols, which con-form to the NIH Guide for the Care and Use of Laboratory Animals.Experimental histories for the monkeys are presented in Table 1, inwhich onset age corresponds to the age at which the experimentalcondition was begun. Refractive data from some of these animals havebeen presented elsewhere (Kiorpes et al., 1989; Kiorpes and Wallman,1995).
Experimental strabismus. Esotropia was induced by transection of thelateral rectus muscle and resection of the medial rectus muscle of the lefteye. The medial rectus was, in addition, advanced to the limbus. Surgerywas performed under ketamine–hydrochloride sedation using sterilesurgical techniques. The resulting esotropia was typically moderate,ranging from 10 to 25 prism diopters estimated by the Hirschbergmethod from photographs; this method is accurate to 5 prism diopters(see Kiorpes et al., 1989).
Experimental anisometropia. Anisometropia was simulated by insertinga 210 diopter extended-wear soft contact lens in the right eye andinserting a zero-power lens in the left (Kiorpes et al., 1993). The monkeywore the lenses beginning 10–25 d after birth for 7–10 months. The statusand condition of the lenses were checked frequently through each day;missing lenses were infrequent and were replaced immediately. Thelenses were routinely changed and cleaned weekly. Regular ophthalmicexaminations were performed to ensure the health of the eyes. Eyealignment was evaluated casually by inspection daily and by the Hirsch-berg method twice during rearing. No strabismus was obvious during therearing period in any of the lens-reared animals; however, we would nothave detected a tropia or phoria of ,5 prism diopters. One animal(monkey LF) developed a large exotropia following the rearing period.
Behavioral testingThe animals were trained to perform an operant two-alternative forced-choice discrimination task. Our training and testing procedures usedhave been detailed previously (Williams et al., 1981; Kiorpes, 1992a;Kiorpes et al., 1993). The animals were placed in a testing cage fromwhich they viewed the stimuli and responded by pulling one of two grabbars located within their reach. The monkeys were rewarded with 0.25 ccof apple juice for correct discriminations; errors were followed by a
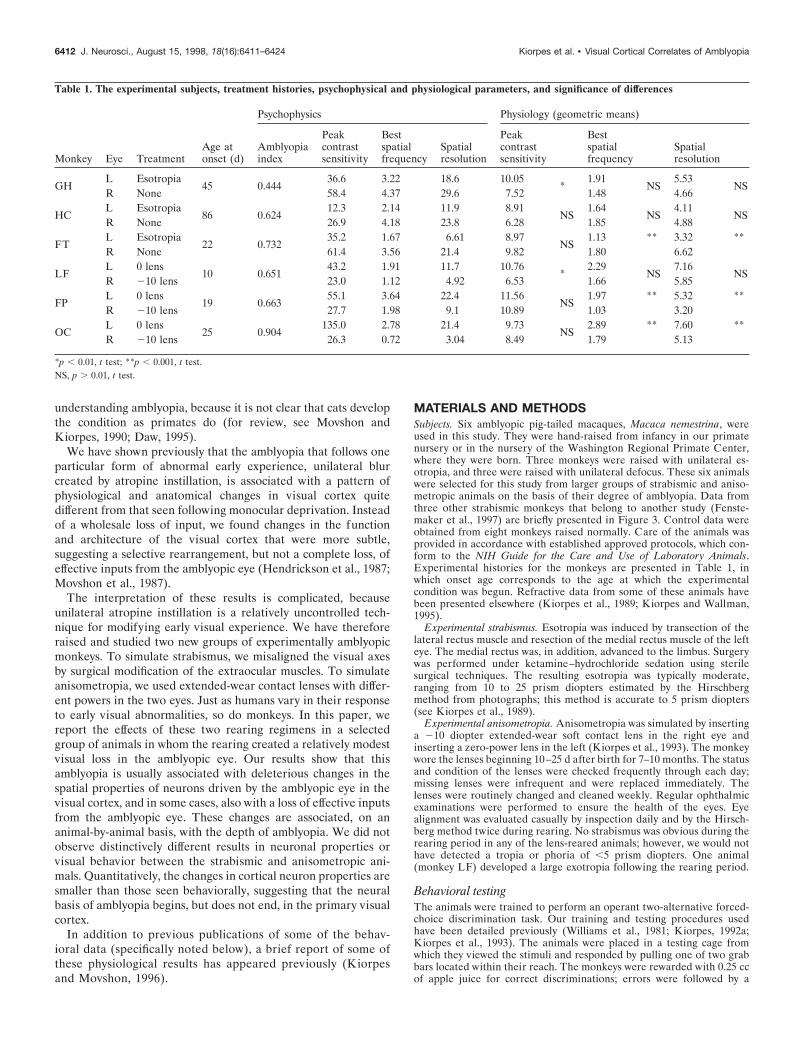
Table 1. The experimental subjects, treatment histories, psychophysical and physiological parameters, and significance of differences
Monkey Eye TreatmentAge atonset (d)
Psychophysics Physiology (geometric means)
Amblyopiaindex
Peakcontrastsensitivity
Bestspatialfrequency
Spatialresolution
Peakcontrastsensitivity
Bestspatialfrequency
Spatialresolution
GHL Esotropia
45 0.44436.6 3.22 18.6 10.05
*1.91
NS5.53
NSR None 58.4 4.37 29.6 7.52 1.48 4.66
HCL Esotropia
86 0.62412.3 2.14 11.9 8.91
NS1.64
NS4.11
NSR None 26.9 4.18 23.8 6.28 1.85 4.88
FTL Esotropia
22 0.73235.2 1.67 6.61 8.97
NS1.13 ** 3.32 **
R None 61.4 3.56 21.4 9.82 1.80 6.62
LFL 0 lens
10 0.65143.2 1.91 11.7 10.76
*2.29
NS7.16
NSR 210 lens 23.0 1.12 4.92 6.53 1.66 5.85
FPL 0 lens
19 0.66355.1 3.64 22.4 11.56
NS1.97 ** 5.32 **
R 210 lens 27.7 1.98 9.1 10.89 1.03 3.20
OCL 0 lens
25 0.904135.0 2.78 21.4 9.73
NS2.89 ** 7.60 **
R 210 lens 26.3 0.72 3.04 8.49 1.79 5.13
*p , 0.01, t test; **p , 0.001, t test.NS, p . 0.01, t test.
6412 J. Neurosci., August 15, 1998, 18(16):6411–6424 Kiorpes et al. • Visual Cortical Correlates of Amblyopia

time-out period, usually 5–10 sec in duration, that was signaled by a tone.Each eye was tested independently for each animal. Optical correctionwas provided as needed based on behaviorally established best refraction(Kiorpes and Boothe, 1984). The animals were all visually mature at thetime the measurements reported in this paper were made; age at testranged from 1 to 7 years. We began operant visual assessments between6 months and 1 year; in some cases, testing on a variety of visual spatialtasks detailed elsewhere continued for many years thereafter (for addi-tional behavioral data, see Kiorpes et al., 1989, 1993; Kiper, 1994; Kiperand Kiorpes, 1994; Kiper et al., 1995).
To measure spatial contrast sensitivity, sinusoidal gratings were gen-erated under computer control on one of two types of display systems.One system consisted of a pair of Joyce Electronics DM-2 displays (whitephosphor) controlled by a PDP-11 computer. The luminance of thedisplays was 250 cd/m 2. Each screen was visible through a circularaperture that subtended 6–12° depending on the viewing distance, whichranged from 0.9 to 1.8 m depending on the animal’s visual acuity. Theother system consisted of a Mitsubishi Diamondscan HL6605 (meanluminance, 60 cd/m 2) controlled by a personal computer with a Vistagraphics board (True Vision, Inc.). The monitor screen subtended 12–40°depending on the viewing distance, which ranged from 0.5 to 2 m. Thestimuli in this case were patches of sinusoidal grating vignetted by atwo-dimensional spatial Gaussian (s value, 0.75°, except for very lowspatial frequencies in which s was increased to keep at least three gratingcycles visible).
The animal’s task was to discriminate the grating from a homogeneousfield matched in space-average luminance; the stimuli were displayedsteadily for as long as the animal wished on any given trial. For mostcontrast sensitivity functions, five contrast values for each of four to sixspatial frequencies were presented in pseudorandom order. Each con-trast sensitivity estimate is based on at least 40 trials per stimuluscondition. Threshold was defined as the contrast-supporting discrimina-tion by the subject at the 75% correct level. Threshold values and SEs ofestimate were obtained by probit analysis of the log transformed data sets(Finney, 1971) using a maximum likelihood fitting technique.
Electrophysiological recordingSurg ical preparation and maintenance. Animals were prepared for acute
single-unit recording using methods we have described in detail else-where (Levitt et al., 1994); age at recording ranged from 8 to 11 years.They were premedicated with atropine (0.25 mg) and acepromazine(0.05 mg/kg) or diazepam (Valium; 0.5 mg/kg). After induction ofanesthesia with intramuscular injections of ketamine HCl (Vetalar;10–30 mg/kg), cannulas were inserted into the trachea and the saphe-nous veins, the animal’s head was fixed in a stereotaxic frame, andsurgery was completed under intravenous anesthesia with sufentanilcitrate (Sufenta; 4–8 mg/kg/hr). Infusion of the surgical anestheticcontinued throughout the recordings.
To minimize eye movements during recording, paralysis was main-tained with an infusion of pancuronium bromide (Pavulon; 0.1 mg/kg/hr) or vecuronium bromide (Norcuron; 0.1 mg/kg/hr) in lactated Ring-er’s solution with dextrose (5–20 ml/hr). Animals were artificiallyventilated with room air or a mixture of 50–70% N2O in O2. Peak-expired CO2 was maintained near 4% by adjusting the tidal volume ofthe ventilator. Rectal temperature was kept near 37°C with a thermostat-ically controlled heating pad. Animals received daily injections of abroad-spectrum antibiotic (Bicillin; 300,000 units) to prevent infection, aswell as dexamethasone (Decadron; 0.5 mg/kg) to prevent cerebraledema. Electrocardiogram, EEG, autonomic signs, and rectal tempera-ture were monitored continuously to ensure the adequacy of anesthesiaand the soundness of the animal’s physiological condition.
Physiolog ical optics. The pupils were dilated and accommodation wasparalyzed with topical atropine, and the corneas were protected with 12diopter gas-permeable hard contact lenses. When necessary, supplemen-tary lenses were chosen by direct ophthalmoscopy to make the retinasconjugate with the display screen. The power of the lenses was thenadjusted as necessary to optimize the visual responses of recorded units.At least once a day, the locations of the foveas were recorded using areversible ophthalmoscope.
Recording. Tungsten-in-glass microelectrodes (Merrill and Ainsworth,1972) were introduced vertically by a hydraulic microdrive into theprimary visual cortex through a small craniotomy and durotomy. Elec-trodes were angled tangentially to the cortical surface to sample fromseveral eye-dominance columns. Most recordings were made from thefoveal portion of V1. In one animal, additional recordings were made
from portions of V1 representing the peripheral visual field 15–25° fromthe fovea. In a second animal, additional recordings were made fromfoveal portions of V2. After the electrode was in place in the cortex, theexposed dura was covered with warm agar. Action potentials were con-ventionally amplified, displayed, and played over an audiomonitor.
To provide reasonably even and unbiased sampling of the distributionof cortical neuron properties, we used methods adapted from those ofStryker and Sherk (1975). After recording a neuron, we moved theelectrode at least 50 mm before accepting another unit for analysis. If wefailed to isolate a unit within 100 mm of the previous recording site, werecorded the properties of the unresolved multiunit background activity;this was necessary at between 5% and 10% of the recording sites in eachexperiment.
Characterization of receptive fields. We initially mapped receptive fieldsby hand on a tangent screen using black and white geometric targets. Wedrew the location and size of the minimum response fields of the neuronand determined its selectivity for the orientation, direction of motion,and size of stimuli. Ocular dominance was assessed qualitatively usingthe seven-point scale of Hubel and Wiesel (1962). Units were classified asocular dominance group 4 if we could not distinguish any differencebetween the responses to stimulation of the two eyes. They were classi-fied as groups 3 or 5 if they responded well to both eyes but with adiscernible preference for the contralateral or ipsilateral eye, respec-tively, classified as groups 2 or 6 if they responded predominantly to thecontralateral or ipsilateral eye with a weak response to the other eye, andclassified as groups 1 or 7 if they responded only to the contralateral oripsilateral eye.
We then used a mirror to place the receptive field of the preferred eyeon the face of a display monitor (Barco 7351 or Nanao T560i; frame rate,107 Hz) that subtended 10° at the animal’s eye; for some stronglybinocular units, we studied the two eyes separately. Achromatic sinusoi-dal gratings with a mean luminance between 40 and 80 cd/m 2 weregenerated on this display by a computer. For most neurons, we deter-mined neuronal selectivity for the orientation, direction, spatial fre-quency, temporal frequency, and contrast of continuously presenteddrifting gratings by adjusting these parameters while listening to thedischarge over the audiomonitor. This gave estimates of the preferredorientation and direction, the bandwidth of orientation selectivity, thepreferred and high-cutoff spatial frequency, and the preferred and high-cutoff temporal frequency; we also estimated contrast threshold usingtargets optimized for the other parameters. For approximately one-fifthof the neurons, we also assessed these tuning parameters quantitativelyusing methods described elsewhere (Levitt et al., 1994).
Reconstruction of recording sites. During recording, small electrolyticlesions were produced at locations of interest along the electrode tracksby passing DC current (2 mA for 2–5 sec, tip negative) through theelectrode. At the end of the experiment, the animals were killed with anoverdose of Nembutal and perfused through the heart with 2 l of 0.1 MPBS, followed by 2 l of a solution containing 4% paraformaldehyde in 0.1M PBS. The first liter of the fixative contained 4% sucrose, and the secondliter had 12% sucrose added. Blocks containing the region of interestwere stored overnight in the cold in a post-fix solution of 4% parafor-maldehyde plus 30% sucrose, after which 40-mm-thick sections were cuton a freezing microtome. Sections were stained for Nissl substance withcresyl violet. In most cases, we were able to reconstruct the course of theelectrode penetration with sufficient confidence to assign the recordedunits to either the supragranular, granular, or infragranular layers of thecortex.
RESULTSPsychophysical observationsFigure 1 shows spatial contrast sensitivity functions for a normalmonkey (Fig. 1A) and for the six experimental monkeys (Fig.1B,C). The data for each eye are well described by the double-exponential function
Sv 5 avbe2cv
in which v is spatial frequency, Sv is contrast sensitivity, and a, b,and c are fitted parameters. In the normal monkey, contrastsensitivity was very similar in the two eyes. In the amblyopicmonkeys, both contrast sensitivity (the peak height of the func-
Kiorpes et al. • Visual Cortical Correlates of Amblyopia J. Neurosci., August 15, 1998, 18(16):6411–6424 6413
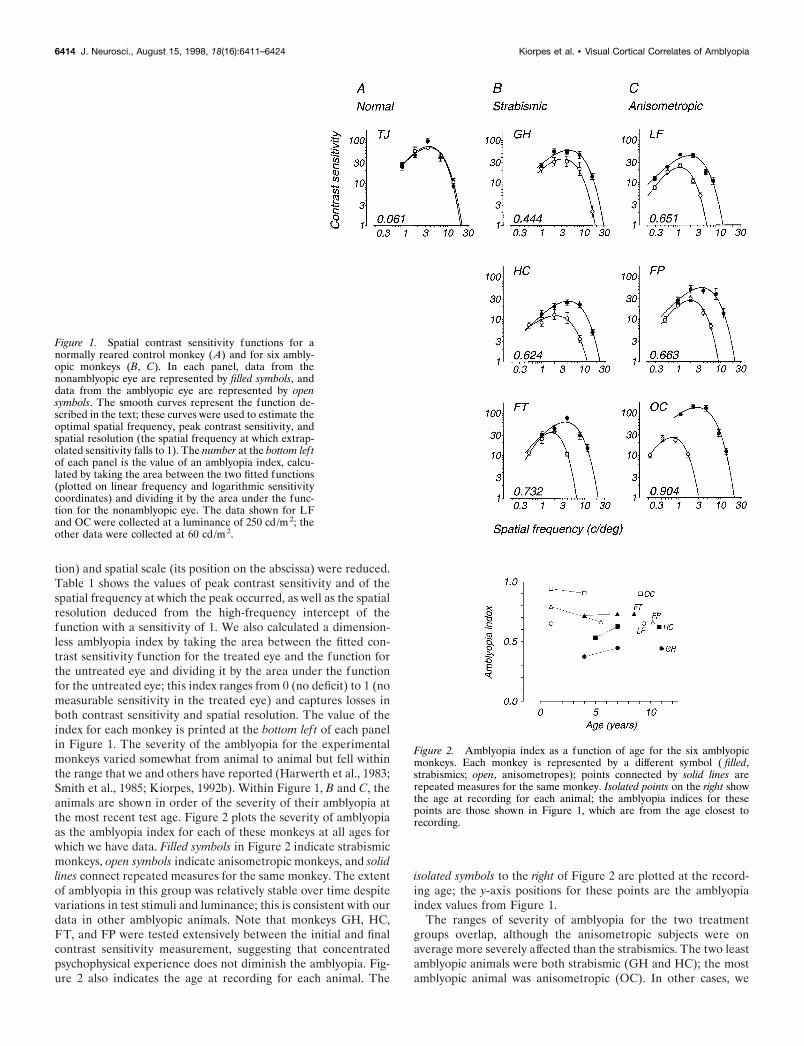
tion) and spatial scale (its position on the abscissa) were reduced.Table 1 shows the values of peak contrast sensitivity and of thespatial frequency at which the peak occurred, as well as the spatialresolution deduced from the high-frequency intercept of thefunction with a sensitivity of 1. We also calculated a dimension-less amblyopia index by taking the area between the fitted con-trast sensitivity function for the treated eye and the function forthe untreated eye and dividing it by the area under the functionfor the untreated eye; this index ranges from 0 (no deficit) to 1 (nomeasurable sensitivity in the treated eye) and captures losses inboth contrast sensitivity and spatial resolution. The value of theindex for each monkey is printed at the bottom lef t of each panelin Figure 1. The severity of the amblyopia for the experimentalmonkeys varied somewhat from animal to animal but fell withinthe range that we and others have reported (Harwerth et al., 1983;Smith et al., 1985; Kiorpes, 1992b). Within Figure 1, B and C, theanimals are shown in order of the severity of their amblyopia atthe most recent test age. Figure 2 plots the severity of amblyopiaas the amblyopia index for each of these monkeys at all ages forwhich we have data. Filled symbols in Figure 2 indicate strabismicmonkeys, open symbols indicate anisometropic monkeys, and solidlines connect repeated measures for the same monkey. The extentof amblyopia in this group was relatively stable over time despitevariations in test stimuli and luminance; this is consistent with ourdata in other amblyopic animals. Note that monkeys GH, HC,FT, and FP were tested extensively between the initial and finalcontrast sensitivity measurement, suggesting that concentratedpsychophysical experience does not diminish the amblyopia. Fig-ure 2 also indicates the age at recording for each animal. The
isolated symbols to the right of Figure 2 are plotted at the record-ing age; the y-axis positions for these points are the amblyopiaindex values from Figure 1.
The ranges of severity of amblyopia for the two treatmentgroups overlap, although the anisometropic subjects were onaverage more severely affected than the strabismics. The two leastamblyopic animals were both strabismic (GH and HC); the mostamblyopic animal was anisometropic (OC). In other cases, we
Figure 2. Amblyopia index as a function of age for the six amblyopicmonkeys. Each monkey is represented by a different symbol ( filled,strabismics; open, anisometropes); points connected by solid lines arerepeated measures for the same monkey. Isolated points on the right showthe age at recording for each animal; the amblyopia indices for thesepoints are those shown in Figure 1, which are from the age closest torecording.
Figure 1. Spatial contrast sensitivity functions for anormally reared control monkey (A) and for six ambly-opic monkeys (B, C). In each panel, data from thenonamblyopic eye are represented by filled symbols, anddata from the amblyopic eye are represented by opensymbols. The smooth curves represent the function de-scribed in the text; these curves were used to estimate theoptimal spatial frequency, peak contrast sensitivity, andspatial resolution (the spatial frequency at which extrap-olated sensitivity falls to 1). The number at the bottom lef tof each panel is the value of an amblyopia index, calcu-lated by taking the area between the two fitted functions(plotted on linear frequency and logarithmic sensitivitycoordinates) and dividing it by the area under the func-tion for the nonamblyopic eye. The data shown for LFand OC were collected at a luminance of 250 cd/m 2; theother data were collected at 60 cd/m 2.
6414 J. Neurosci., August 15, 1998, 18(16):6411–6424 Kiorpes et al. • Visual Cortical Correlates of Amblyopia
have observed a wide range of severity in the amblyopia thatdevelops following strabismus or anisometropia, so these data donot represent the full range of effects seen (Kiorpes, 1992b;Kiorpes et al., 1993). Because of this wide variation in response tosimilar rearing treatments, we elected to include in this study onlythose animals showing a reliable amblyopic deficit that was not soprofound that the animals were unable to perform all of ourroutine psychophysical tasks. We have briefly reported elsewhereon some cortical data from a group of more severely affectedstrabismic animals (Fenstemaker et al., 1997); the relevant por-tions of this data set will be discussed briefly below.
Neurophysiological observationsWe studied the responses of 751 isolated neurons and 46 multi-unit sites in the six experimental monkeys. In the strabismicanimals, we made recordings in both hemispheres of each animal;in the anisometropic animals, we recorded only in the hemispherecontralateral to the treated eye. Because there were no importantdifferences between data obtained from the two hemispheres, wehave pooled the results.
In general, cortical activity was brisk and reliable, with mostunits responding well and exhibiting approximately normal de-grees of stimulus selectivity. The majority of our recordings weremade from the supragranular layers of the cortex, but we did notnotice any particular tendency for units in any layer to be differentin their response to strabismus or anisometropia.
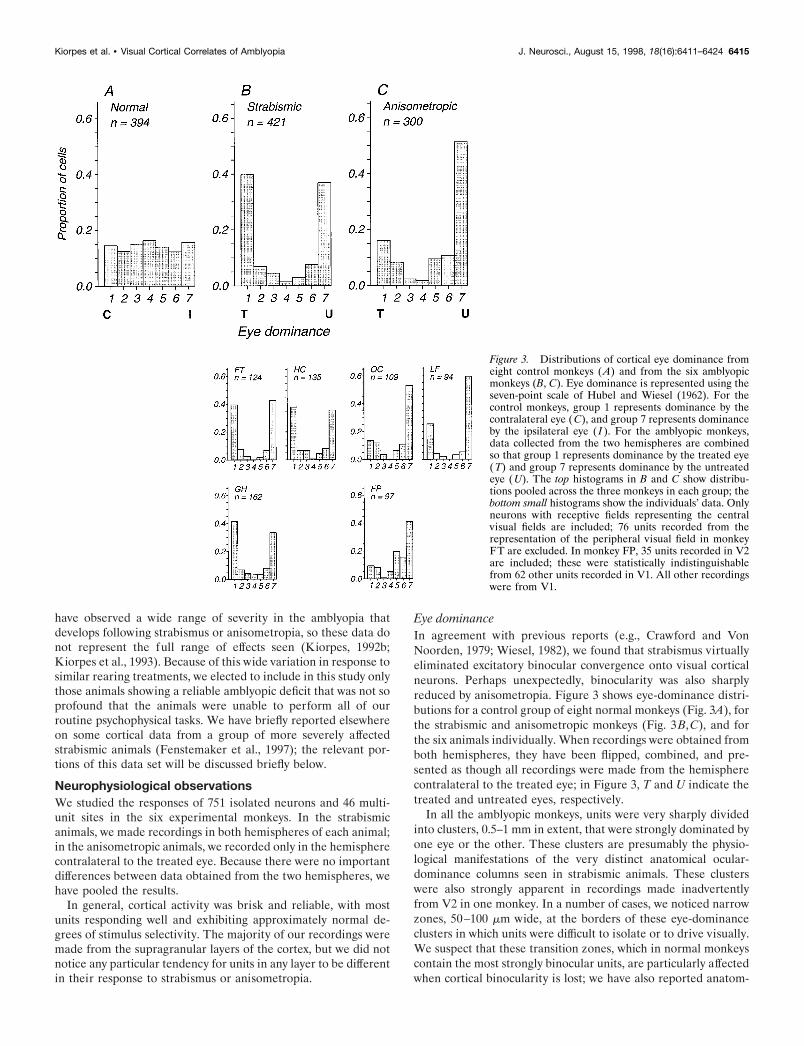
Eye dominanceIn agreement with previous reports (e.g., Crawford and VonNoorden, 1979; Wiesel, 1982), we found that strabismus virtuallyeliminated excitatory binocular convergence onto visual corticalneurons. Perhaps unexpectedly, binocularity was also sharplyreduced by anisometropia. Figure 3 shows eye-dominance distri-butions for a control group of eight normal monkeys (Fig. 3A), forthe strabismic and anisometropic monkeys (Fig. 3B,C), and forthe six animals individually. When recordings were obtained fromboth hemispheres, they have been flipped, combined, and pre-sented as though all recordings were made from the hemispherecontralateral to the treated eye; in Figure 3, T and U indicate thetreated and untreated eyes, respectively.
In all the amblyopic monkeys, units were very sharply dividedinto clusters, 0.5–1 mm in extent, that were strongly dominated byone eye or the other. These clusters are presumably the physio-logical manifestations of the very distinct anatomical ocular-dominance columns seen in strabismic animals. These clusterswere also strongly apparent in recordings made inadvertentlyfrom V2 in one monkey. In a number of cases, we noticed narrowzones, 50–100 mm wide, at the borders of these eye-dominanceclusters in which units were difficult to isolate or to drive visually.We suspect that these transition zones, which in normal monkeyscontain the most strongly binocular units, are particularly affectedwhen cortical binocularity is lost; we have also reported anatom-
Figure 3. Distributions of cortical eye dominance fromeight control monkeys (A) and from the six amblyopicmonkeys (B, C). Eye dominance is represented using theseven-point scale of Hubel and Wiesel (1962). For thecontrol monkeys, group 1 represents dominance by thecontralateral eye (C), and group 7 represents dominanceby the ipsilateral eye ( I ). For the amblyopic monkeys,data collected from the two hemispheres are combinedso that group 1 represents dominance by the treated eye(T) and group 7 represents dominance by the untreatedeye (U). The top histograms in B and C show distribu-tions pooled across the three monkeys in each group; thebottom small histograms show the individuals’ data. Onlyneurons with receptive fields representing the centralvisual fields are included; 76 units recorded from therepresentation of the peripheral visual field in monkeyFT are excluded. In monkey FP, 35 units recorded in V2are included; these were statistically indistinguishablefrom 62 other units recorded in V1. All other recordingswere from V1.
Kiorpes et al. • Visual Cortical Correlates of Amblyopia J. Neurosci., August 15, 1998, 18(16):6411–6424 6415
ical evidence for abnormalities in the border regions of ocular-dominance columns in strabismic monkeys (Fenstemaker et al.,1994, 1997).
In normal monkeys, our results on the overall distribution ofeye dominance are in general agreement with previous reports(e.g., Hubel and Wiesel, 1968), although in our hands binocularneurons were somewhat more common. Most neurons (70%)were binocularly activated, and 85% responded to some degree tostimulation of one eye or the other.
In all of the amblyopic monkeys, cortical binocularity wassharply reduced. The proportion of binocularly activated units inthe three strabismic monkeys ranged from 18 to 27%; in theanisometropes, the range was from 15 to 50%. It is noteworthythat the anisometropic monkey with the smallest number ofbinocularly activated units (LF) had developed an exotropic stra-bismus after the end of the lens-rearing period.
In the three strabismic monkeys, eye dominance was approxi-mately evenly balanced, with the amblyopic eye dominating be-tween 49 and 54% of the units. In the three anisometropes, theamblyopic eye dominated a smaller fraction of neurons (21–32%),suggesting that this eye had suffered a competitive disadvantagein its effectiveness in driving cortical neurons. The lack of aneye-dominance shift in the strabismics was characteristic only ofthis group of relatively mild strabismic amblyopes. Other strabis-mics with more profound amblyopia often show eye-dominanceshifts as great or greater than those seen in this group of ani-sometropes (see below) (Eggers et al., 1984). Conversely, somemonkeys, found to be amblyopic after being raised with unilateralinstillation of atropine in an earlier simulation of anisometropia,did not show the eye-dominance shift evident in this group ofanisometropes (Movshon et al., 1987).
Perhaps a more informative indicator of the change in thecortical representation of the amblyopic eye is the proportion ofunits that responded at all to stimulation of that eye. In normalmonkeys, 84% of units responded to stimulation of the contralat-eral eye.
In the three strabismic monkeys, the fraction of units respond-ing to the treated eye ranged from 57 to 67%. In the threeanisometropes, this fraction was between 40 and 59%. Thus, inboth groups of amblyopes, the combination of reduced binocularinteraction and shifted-eye dominance substantially reduced therepresentation of the input of the amblyopic eye across thecortical neuron population.
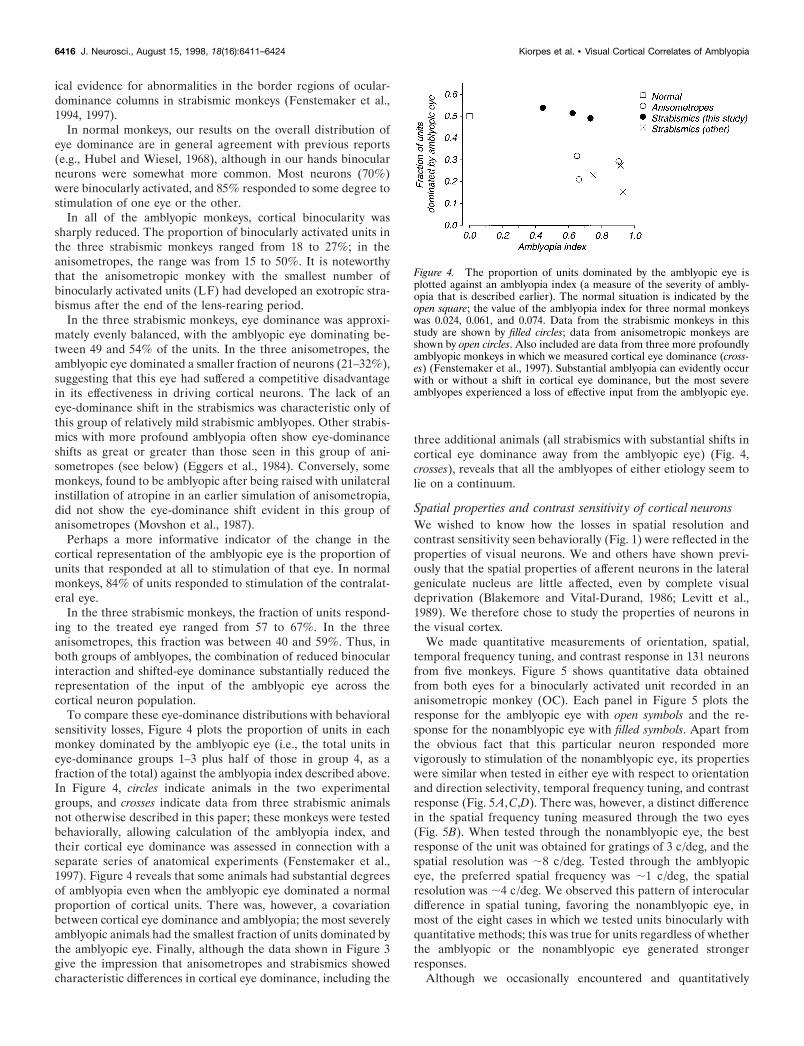
To compare these eye-dominance distributions with behavioralsensitivity losses, Figure 4 plots the proportion of units in eachmonkey dominated by the amblyopic eye (i.e., the total units ineye-dominance groups 1–3 plus half of those in group 4, as afraction of the total) against the amblyopia index described above.In Figure 4, circles indicate animals in the two experimentalgroups, and crosses indicate data from three strabismic animalsnot otherwise described in this paper; these monkeys were testedbehaviorally, allowing calculation of the amblyopia index, andtheir cortical eye dominance was assessed in connection with aseparate series of anatomical experiments (Fenstemaker et al.,1997). Figure 4 reveals that some animals had substantial degreesof amblyopia even when the amblyopic eye dominated a normalproportion of cortical units. There was, however, a covariationbetween cortical eye dominance and amblyopia; the most severelyamblyopic animals had the smallest fraction of units dominated bythe amblyopic eye. Finally, although the data shown in Figure 3give the impression that anisometropes and strabismics showedcharacteristic differences in cortical eye dominance, including the
three additional animals (all strabismics with substantial shifts incortical eye dominance away from the amblyopic eye) (Fig. 4,crosses), reveals that all the amblyopes of either etiology seem tolie on a continuum.
Spatial properties and contrast sensitivity of cortical neuronsWe wished to know how the losses in spatial resolution andcontrast sensitivity seen behaviorally (Fig. 1) were reflected in theproperties of visual neurons. We and others have shown previ-ously that the spatial properties of afferent neurons in the lateralgeniculate nucleus are little affected, even by complete visualdeprivation (Blakemore and Vital-Durand, 1986; Levitt et al.,1989). We therefore chose to study the properties of neurons inthe visual cortex.
We made quantitative measurements of orientation, spatial,temporal frequency tuning, and contrast response in 131 neuronsfrom five monkeys. Figure 5 shows quantitative data obtainedfrom both eyes for a binocularly activated unit recorded in ananisometropic monkey (OC). Each panel in Figure 5 plots theresponse for the amblyopic eye with open symbols and the re-sponse for the nonamblyopic eye with filled symbols. Apart fromthe obvious fact that this particular neuron responded morevigorously to stimulation of the nonamblyopic eye, its propertieswere similar when tested in either eye with respect to orientationand direction selectivity, temporal frequency tuning, and contrastresponse (Fig. 5A,C,D). There was, however, a distinct differencein the spatial frequency tuning measured through the two eyes(Fig. 5B). When tested through the nonamblyopic eye, the bestresponse of the unit was obtained for gratings of 3 c/deg, and thespatial resolution was ;8 c/deg. Tested through the amblyopiceye, the preferred spatial frequency was ;1 c/deg, the spatialresolution was ;4 c/deg. We observed this pattern of interoculardifference in spatial tuning, favoring the nonamblyopic eye, inmost of the eight cases in which we tested units binocularly withquantitative methods; this was true for units regardless of whetherthe amblyopic or the nonamblyopic eye generated strongerresponses.
Although we occasionally encountered and quantitatively
Figure 4. The proportion of units dominated by the amblyopic eye isplotted against an amblyopia index (a measure of the severity of ambly-opia that is described earlier). The normal situation is indicated by theopen square; the value of the amblyopia index for three normal monkeyswas 0.024, 0.061, and 0.074. Data from the strabismic monkeys in thisstudy are shown by filled circles; data from anisometropic monkeys areshown by open circles. Also included are data from three more profoundlyamblyopic monkeys in which we measured cortical eye dominance (cross-es) (Fenstemaker et al., 1997). Substantial amblyopia can evidently occurwith or without a shift in cortical eye dominance, but the most severeamblyopes experienced a loss of effective input from the amblyopic eye.
6416 J. Neurosci., August 15, 1998, 18(16):6411–6424 Kiorpes et al. • Visual Cortical Correlates of Amblyopia

tested binocularly driven units like the one shown in Figure 5,most of our data came from units that strongly preferred one eyeor the other (Fig. 3). Our main conclusions are therefore based onpopulation comparisons rather than cases like the one in Figure 5.Quantitative tests of such populations did not reveal decisivedifferences between the amblyopic and nonamblyopic eyes withrespect to response magnitude, orientation, direction, spatial ortemporal tuning, or contrast response. Because our quantitativedata came from a relatively small subpopulation of the recordedneurons, this is not particularly surprising. In fact, our mainrationale for collecting quantitative data was to provide indepen-dent verification of the accuracy of measurements made withqualitative techniques.
For all 797 recording sites (isolated neurons and multiunitsites), we made qualitative assessments by listening to the unitresponse over the audiomonitor while we adjusted the parametersof the grating being displayed. From this qualitative assessment,we established orientation preference and selectivity, optimalspatial frequency and spatial resolution, optimal temporal fre-quency, and threshold contrast for an optimal grating; we alsorated the responsiveness of the cells. For the 131 cases testedquantitatively, we were able to compare the two sets of measure-ments. In general, the validations were excellent. For the keyparameters of optimal orientation and direction, optimal spatialfrequency, optimal temporal frequency, and contrast threshold,the correlations between qualitative and quantitative measureswere between 0.54 and 0.96; in no case was the slope of therelationship between measures significantly different from 1. Forspatial frequency, temporal frequency, and contrast measures, thedifference between qualitative and quantitative measures rarelyexceeded a factor of 2 and was typically much less. We observedthe lowest correlation when comparing contrast thresholds judgedby ear with those established using a quantitative statistical tech-nique (Tolhurst et al., 1983; Levitt et al., 1994); we also found this
judgment to be the most difficult to make reliably, as well as to bethe one on which multiple qualitative observers had the mostdifficulty agreeing.
Using the qualitative data, we compared the properties of unitsdriven by the two eyes. In most respects, the populations did notdiffer significantly. Units driven by the amblyopic and nonambly-opic eyes were indistinguishable in all six animals with respect totheir responsiveness to optimal visual stimuli, frequency anddegree of their orientation and direction selectivity, and theirpreference for temporal frequency. Because amblyopia is a dis-order of spatial vision, we suspected that comparisons of thespatial tuning properties of neurons in the two eyes might be moreinformative.
Figures 6 and 7 summarize our data on the spatial frequencytuning and contrast sensitivity of units from the strabismic andanisometropic monkeys. In Figures 6–8, data in red relate to theamblyopic eye, and data in green relate to the nonamblyopic eye.The data in these figures are presented in the same order as theywere in Figure 1, so that the least severe amblyope in each groupis at the top and the most severe is at the bottom. The scatter-grams in Figures 6A, 7A, and 8A display the locations of thepeaks of the spatial frequency tuning for all units; note that theaxes are isomorphic to those used for the behavioral data inFigure 1. The distributions in Figures 6B, 7B, and 8B showfrequency histograms for each of the parameters shown, as well asfor spatial resolution. It is evident that the spatial and sensitivityproperties of neurons in all monkeys are quite widely dispersed,with all parameters showing at least a 10-fold range of variation;this is not different from previous reports in normal monkeys(e.g., DeValois et al., 1982) and from our own unpublishedobservations.
Within this variation, however, it is possible to discern intero-cular differences that seem to be related to each animal’s depth ofamblyopia. Strabismic monkeys GH and HC (Fig. 6) and aniso
Figure 5. Data from a complex cell recorded in ananisometropic monkey (OC). For this binocularly acti-vated unit, quantitative data were measured with stimu-lation of each eye. Data taken through the amblyopic eyeare shown by open symbols, and data taken from thenonamblyopic eye are shown by filled symbols. A, Orien-tation and direction selectivity measured with high-contrast drifting gratings whose orientation was orthog-onal to the direction plotted; the spatial and temporalfrequencies were optimal for the eye being tested. B,Spatial frequency tuning measured with high-contrastgratings of optimal orientation, direction, and temporalfrequency. C, Temporal frequency tuning measured withhigh-contrast gratings of optimal orientation and spatialfrequency. D, Contrast response measured with gratingsof optimal orientation and spatial and temporal fre-quency. Error bars indicate SE of the mean spike countper stimulus cycle. Dashed lines indicate spontaneousactivity.
Kiorpes et al. • Visual Cortical Correlates of Amblyopia J. Neurosci., August 15, 1998, 18(16):6411–6424 6417
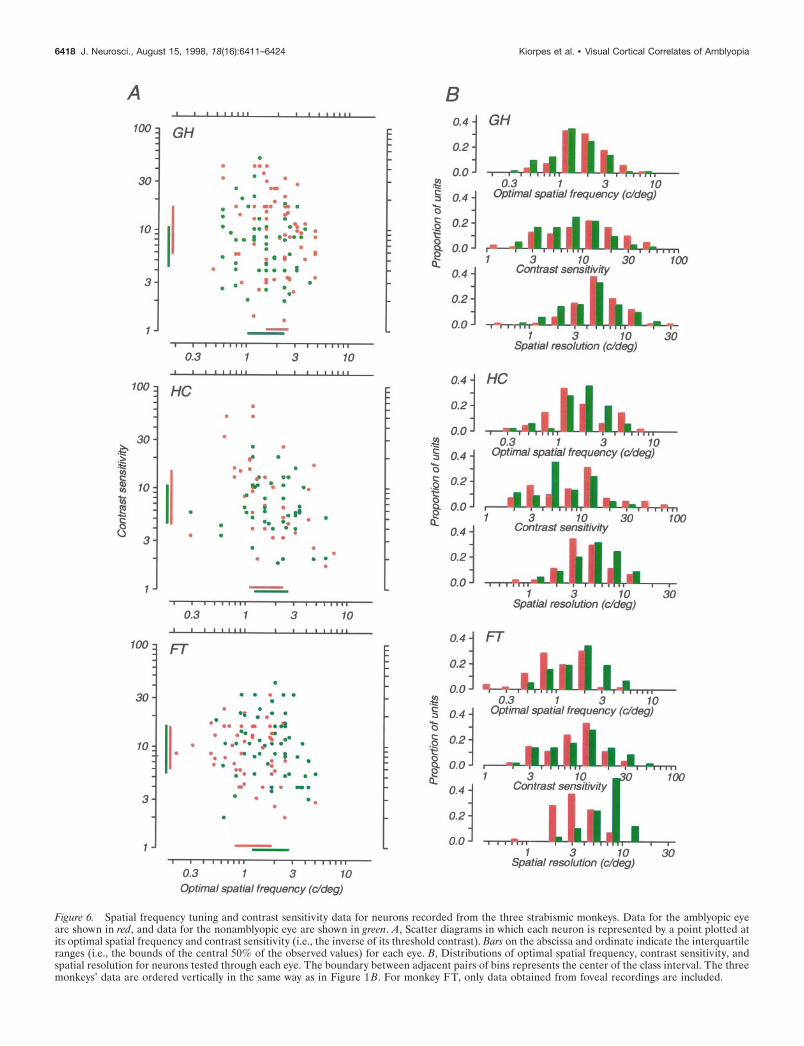
Figure 6. Spatial frequency tuning and contrast sensitivity data for neurons recorded from the three strabismic monkeys. Data for the amblyopic eyeare shown in red, and data for the nonamblyopic eye are shown in green. A, Scatter diagrams in which each neuron is represented by a point plotted atits optimal spatial frequency and contrast sensitivity (i.e., the inverse of its threshold contrast). Bars on the abscissa and ordinate indicate the interquartileranges (i.e., the bounds of the central 50% of the observed values) for each eye. B, Distributions of optimal spatial frequency, contrast sensitivity, andspatial resolution for neurons tested through each eye. The boundary between adjacent pairs of bins represents the center of the class interval. The threemonkeys’ data are ordered vertically in the same way as in Figure 1B. For monkey FT, only data obtained from foveal recordings are included.
6418 J. Neurosci., August 15, 1998, 18(16):6411–6424 Kiorpes et al. • Visual Cortical Correlates of Amblyopia
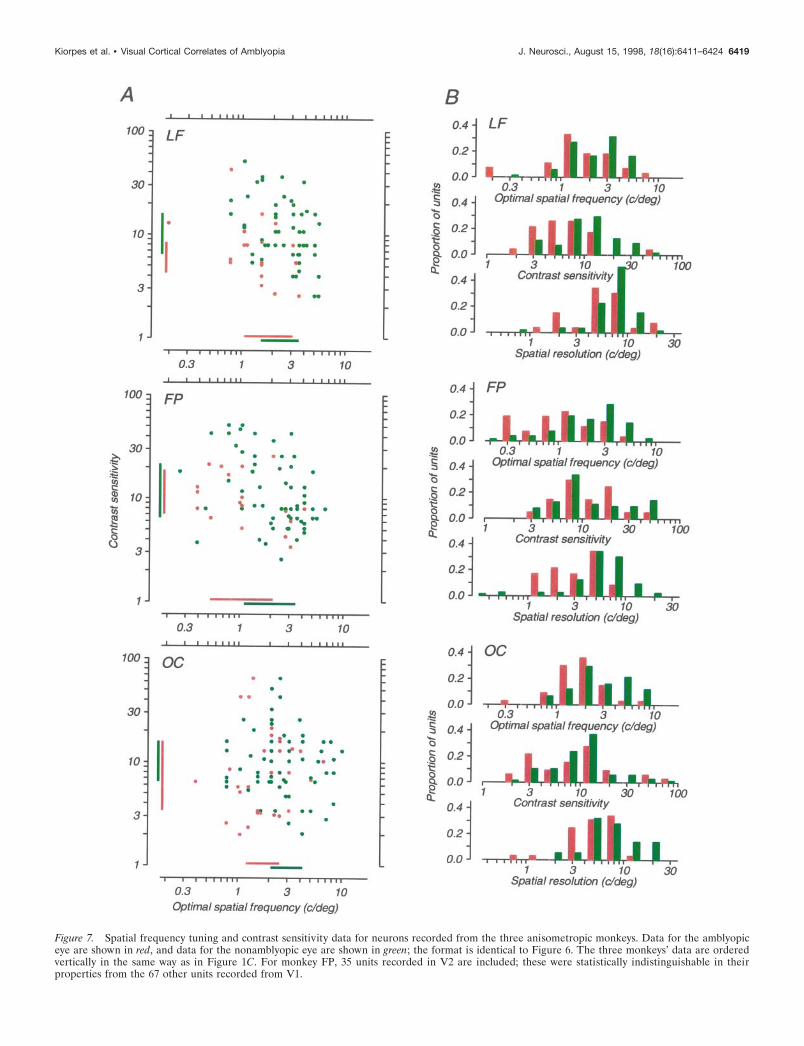
Figure 7. Spatial frequency tuning and contrast sensitivity data for neurons recorded from the three anisometropic monkeys. Data for the amblyopiceye are shown in red, and data for the nonamblyopic eye are shown in green; the format is identical to Figure 6. The three monkeys’ data are orderedvertically in the same way as in Figure 1C. For monkey FP, 35 units recorded in V2 are included; these were statistically indistinguishable in theirproperties from the 67 other units recorded from V1.
Kiorpes et al. • Visual Cortical Correlates of Amblyopia J. Neurosci., August 15, 1998, 18(16):6411–6424 6419

metropic monkey LF (Fig. 7) whose amblyopias were the mostmodest, showed only subtle interocular differences for any of thereported measures. For monkey GH, only the interocular differ-ence in contrast sensitivity achieved statistical significance (t test;p , 0.01), and this difference was in the “wrong” direction, withunits in the amblyopic eye being more sensitive. For monkey HC,none of the interocular differences was significant. For monkeyLF, the interocular difference in contrast sensitivity was signifi-cant (t test; p , 0.01) and in the “correct” direction, with theamblyopic eye showing lower sensitivity. But the differences inoptimal spatial frequency and resolution were not significant.
Consider now the three most severely amblyopic cases: strabis-mic monkey FT (Fig. 6) and anisometropic monkeys FP and OC(Fig. 7). In all three of these cases, the interocular differences inboth spatial resolution and optimal spatial frequency were large,robust (t test; p , 0.001 in all cases), and in the directionexpected; the spatial performance of the amblyopic eye wasinferior to that of the nonamblyopic eye. Curiously, in none ofthese cases was the interocular difference in contrast sensitivitysignificant.
In humans, strabismic amblyopia is primarily a deficit of centralvision (Sireteanu et al., 1981; Hess and Pointer, 1985). We havealso found this to be true in some, but not all, monkey amblyopes(L. Kiorpes and D.C. Kiper, unpublished observations). To ex-plore the neural basis of this variation with visual field location,we studied the properties of 76 units from the representation ofthe peripheral visual field in FT, the most severely affected of ourthree strabismic amblyopes. The receptive fields of the neuronswere located in the inferior quadrant, between 16 and 23° fromthe fovea. Data from this peripheral sample are shown in Figure8, using the same format as in Figures 6 and 7. This monkey’sfoveal data showed clear interocular differences in spatial resolu-tion and optimum frequency (Fig. 6), but the data from theperiphery show no interocular difference; none of the three pairsof distributions in Figure 8B differs significantly.
To compare the physiological data presented in Figures 6 and
7 with the behavioral measurements in Figure 1, in Figure 9 weplot the amblyopia index against a measure of the interoculardifference in three spatial properties for each of the experimentalmonkeys. As in Figure 4, filled circles represent data from stra-bismics and open circles represent data from anisometropes. Theordinate in each panel is the ratio of the geometric mean valuesof the distributions shown in Figures 6B and 7B, with the valuefor the amblyopic eye in the denominator. In accordance with theimpression derived from Figures 6 and 7, there was a reasonablyclear relationship between the amblyopia index and the interocu-lar ratios of spatial resolution and optimal frequency (Fig. 9, toptwo panels). There was, however, no clear relationship betweenthe interocular ratios of contrast sensitivity and the depth of ananimal’s amblyopia (Fig. 9, bottom panel).
The analysis in Figure 9 suggests a correlation between phys-iological measures of spatial vision and the depth of an animal’samblyopia. Figure 10 poses the question of whether this relation-ship is quantitatively precise. The ratio of the geometric means ofthe physiological measures is plotted again on the ordinate ofeach panel in Figure 10; the abscissa now shows the interocularratio of the homologous psychophysical measure derived from thecurves fitted to the spatial contrast sensitivity data in Figure 1. Ifthe interocular differences in physiological properties docu-mented in Figures 6 and 7 represented a perfect quantitativecorrelate of the behavioral changes shown in Figure 1, then theseratios should be exactly proportional, and the data for the sixanimals should lie along a diagonal of unit slope. It is evidentinstead that for both of the spatial measures (Fig. 10, top twopanels), the physiological ratios were related to, but consistentlysmaller than, the psychophysical ratios; the bottom panel in Figure10 reveals no clear relationship between interocular ratios ofcontrast sensitivity determined psychophysically and physiologi-cally. For spatial resolution and peak contrast sensitivity (Fig. 10,top and bottom panels), all six animals showed a smaller ratio ofphysiological than psychophysical values; this difference is signif-icant in each case (binomial sign test, p 5 0.016). The comparison
Figure 8. Diagrams in the format of Figure 6 and 7 representing data from units recorded in strabismic monkey FT from the representation of theperipheral visual field in V1. The receptive fields of these units were located in the lower visual quadrant, between 16 and 23° from the fovea.
6420 J. Neurosci., August 15, 1998, 18(16):6411–6424 Kiorpes et al. • Visual Cortical Correlates of Amblyopia
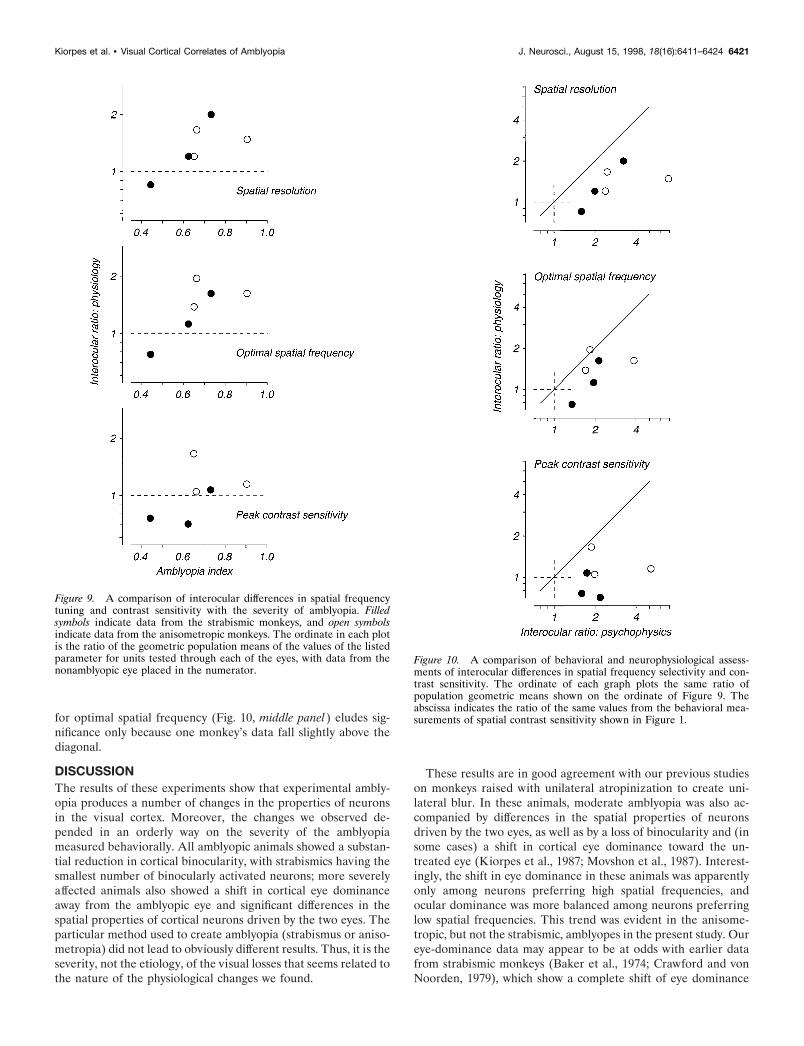
for optimal spatial frequency (Fig. 10, middle panel) eludes sig-nificance only because one monkey’s data fall slightly above thediagonal.
DISCUSSIONThe results of these experiments show that experimental ambly-opia produces a number of changes in the properties of neuronsin the visual cortex. Moreover, the changes we observed de-pended in an orderly way on the severity of the amblyopiameasured behaviorally. All amblyopic animals showed a substan-tial reduction in cortical binocularity, with strabismics having thesmallest number of binocularly activated neurons; more severelyaffected animals also showed a shift in cortical eye dominanceaway from the amblyopic eye and significant differences in thespatial properties of cortical neurons driven by the two eyes. Theparticular method used to create amblyopia (strabismus or aniso-metropia) did not lead to obviously different results. Thus, it is theseverity, not the etiology, of the visual losses that seems related tothe nature of the physiological changes we found.
These results are in good agreement with our previous studieson monkeys raised with unilateral atropinization to create uni-lateral blur. In these animals, moderate amblyopia was also ac-companied by differences in the spatial properties of neuronsdriven by the two eyes, as well as by a loss of binocularity and (insome cases) a shift in cortical eye dominance toward the un-treated eye (Kiorpes et al., 1987; Movshon et al., 1987). Interest-ingly, the shift in eye dominance in these animals was apparentlyonly among neurons preferring high spatial frequencies, andocular dominance was more balanced among neurons preferringlow spatial frequencies. This trend was evident in the anisome-tropic, but not the strabismic, amblyopes in the present study. Oureye-dominance data may appear to be at odds with earlier datafrom strabismic monkeys (Baker et al., 1974; Crawford and vonNoorden, 1979), which show a complete shift of eye dominance
Figure 9. A comparison of interocular differences in spatial frequencytuning and contrast sensitivity with the severity of amblyopia. Filledsymbols indicate data from the strabismic monkeys, and open symbolsindicate data from the anisometropic monkeys. The ordinate in each plotis the ratio of the geometric population means of the values of the listedparameter for units tested through each of the eyes, with data from thenonamblyopic eye placed in the numerator.
Figure 10. A comparison of behavioral and neurophysiological assess-ments of interocular differences in spatial frequency selectivity and con-trast sensitivity. The ordinate of each graph plots the same ratio ofpopulation geometric means shown on the ordinate of Figure 9. Theabscissa indicates the ratio of the same values from the behavioral mea-surements of spatial contrast sensitivity shown in Figure 1.
Kiorpes et al. • Visual Cortical Correlates of Amblyopia J. Neurosci., August 15, 1998, 18(16):6411–6424 6421
away from the deviating eye. However, the monkeys in thosestudies had very poor acuity in their deviating eye, which wascomparable with acuity in monocularly deprived animals in mostcases. Their results represent the extreme of the continuum andare thus not out of line with the results presented here (Fig. 4).
The literature on human amblyopia suggests that strabismicand anisometropic amblyopes differ in their visual capacities.Anisometropic amblyopes appear to show contrast sensitivitydeficits over a wide range of visual field locations, whereas thedeficits of the strabismic amblyopes are confined to the centralvisual field (Hess et al., 1980; Sireteanu et al., 1981; Hess andPointer, 1985; but see Sireteanu and Fronius, 1990). Furthermore,strabismic amblyopes have been reported to have severe deficitsin positional acuity, whereas the deficits of anisometropic am-blyopes are comparatively mild (Levi and Klein, 1982; Hess andHolliday, 1992; but see McKee et al., 1992; Kiorpes and Movshon,1996). We have not, however, been able to discern consistentdifferences between these two types of amblyopia in monkeys(Kiorpes et al., 1993; Kiorpes and Movshon, 1996). Our mainconcern in this paper is with spatial resolution and contrastsensitivity; behaviorally, we find a wholly overlapping range ofcontrast sensitivity deficits among our anisometropic and strabis-mic amblyopes. Thus, it is not surprising that we find similarphysiological deficits in spatial resolution and contrast sensitivityin these two populations.
Of course, there may be differences between strabismic andanisometropic amblyopia that are not reflected in the kinds ofmeasurements we made in this study. It is, however, important tonote that the classification of human amblyopes is typically basedon the presence of strabismus or anisometropia at the time ofclinical evaluation or psychophysical testing, whereas our classifi-cation is based on the particular visual abnormality that wecreated in early life. The difference is important because bothstrabismus and anisometropia can develop in amblyopes after theend of the critical period. For example, anisometropic monkeyLF in this study became strabismic after the period of lens-rearing had ended, and strabismic monkey FT became mildlyanisometropic (1.0 diopter) after an extended period of amblyo-pia (Kiorpes and Wallman, 1995). These monkeys might all havebeen classified as strabismic and anisometropic had they first beenstudied in maturity. However, within the limits of our measure-ments, we are confident that none of these monkeys was bothstrabismic and anisometropic during the first postnatal year,which represents the primary period of spatial visual develop-ment in monkeys (Kiorpes, 1992a; Boothe et al., 1989).
Mechanisms of developmental abnormalityin amblyopiaIt is widely believed that cortical neurons respond adaptively tothe visual environment during early development, in the sensethat activity-dependent mechanisms of plasticity act to bring theselectivity of cortical neuron responses into a rough match withthe visual input received in early life (see Daw, 1995; Katz andShatz, 1996). In accordance with this idea, some of the physio-logical manifestations of amblyopia seem to be clearly related tothe factors that created the condition. For example, it is intuitivelyreasonable for strabismic animals to lose binocularity; strabismusabolishes correlated visual experience at corresponding locationsin the two eyes, and it has long been accepted that this decorre-lation could change cortical binocular interaction by any of severalactivity-dependent mechanisms (e.g., Hubel and Wiesel, 1965). It
is also relatively easy to understand how persistent retinal imageblur in one eye might represent a form of visual deprivation forneurons that respond to high spatial frequencies, because effectiveretinal image contrast is sharply reduced at those frequencies. Byanalogy with the response of the visual system to more severeforms of deprivation (Wiesel and Hubel, 1965), the reduction ineffective stimulation might prevent the development of high-frequency neurons. This could happen either because these neu-rons were in effect monocularly deprived and adaptively selectedtheir inputs from the untreated eye, or because the lack ofstimulation prevented them from developing their full spatialresolving power, sensitivity, and selectivity. Our data do not allowus to distinguish between these two possibilities.
On the other hand, some of the cortical changes in amblyopiaseem quite puzzling. There is no obvious reason why neuronsdriven by the amblyopic eye in some strabismic amblyopes shouldhave degraded spatial properties. These neurons should havebeen exposed to reasonably clear retinal images throughout earlydevelopment and would therefore appear to have no reason to failto develop normal spatial properties. It is also unclear why aniso-metropic animals should show such a stark reduction in corticalbinocularity. The alignment of the eyes was not discernibly af-fected by the contact lenses and was well enough preserved duringrearing that corresponding retinal points should have receivedcorrelated visual inputs, at least at low spatial frequencies, pro-viding binocular stimulation. Yet the proportion of binocularlydriven units was similar among neurons preferring low and highspatial frequencies for both strabismic and anisometropic mon-keys; this is consistent with our previous results of amblyopiafollowing unilateral atropinization (Movshon et al., 1987). How-ever, it should be noted that our tests would not have detected theresidual binocular interactions demonstrated by simultaneousbinocular stimulation in strabismic and anisometropic monkeysby Smith et al. (1997).
The physiological basis for amblyopia?Our goal is to understand the biological basis of amblyopia.Because amblyopia is a disorder of spatial vision, we concen-trated our efforts on measuring and comparing the spatial prop-erties of cortical neurons driven by the two eyes. In the moreseverely affected amblyopes, we found clear interocular differ-ences in spatial resolution that could, in principle, explain thevisual deficit in amblyopes (Fig. 9). Yet quantitative analysisshows that this effect is probably an incomplete explanation of thedeficits shown behaviorally. Figure 10 compares the interoculardifferences in behavioral and physiological measures of optimalspatial frequency, spatial resolution, and contrast sensitivity. Ifthe physiological differences were to account for the whole of theamblyopic loss, these differences should have been equal. Instead,in nearly all cases, the magnitude of the physiological differenceswas less than those found behaviorally. This is clearly manifestedin the fact that many cortical neurons driven through the ambly-opic eyes of the more severely affected monkeys responded tospatial frequencies that the animals could not see. For example, acomparison of Figure 1 with Figures 6 and 7 shows that inmonkeys FT, FP, and OC, we recorded significant numbers ofneurons driven by the amblyopic eye whose spatial resolutionexceeded the animal’s spatial resolution; we almost never encoun-tered such neurons driven by the nonamblyopic eye.
It is also notable that we failed to detect reliable differences inthe contrast sensitivity of neurons driven by the two eyes despite
6422 J. Neurosci., August 15, 1998, 18(16):6411–6424 Kiorpes et al. • Visual Cortical Correlates of Amblyopia
the substantial differences in contrast sensitivity measured behav-iorally (compare Fig. 1 with Figs. 6 and 7). As noted in Results, itis conceivable that our measurements of contrast sensitivity werenot sufficiently precise to detect a subtle difference between thetwo eyes. Although we measured no difference in the absoluteresponsiveness of neurons driven by the two eyes, it is alsopossible that the interocular differences in behavioral contrastsensitivity are explained by the reduced number of neuronsdriven by the amblyopic eye.
Together, these considerations suggest that the changes wehave observed represent only a partial explanation of the visuallosses in amblyopia and that some additional factors must beinvolved. Although it has been suggested that abnormalities in thepattern of correlated firing among striate cortical neurons drivenby the amblyopic eye might cause amblyopia (Roelfsema et al.,1994), it seems equally reasonable to suppose that some aspects ofamblyopia reflect changes in the properties of cortical neurons atprocessing stages beyond the primary visual cortex. For example,amblyopes may show abnormalities in long-range feature-linkingtasks that seem unlikely to be subserved by striate cortical neu-rons alone (Hess et al., 1997; but see Levi and Sharma, 1998). Afull explanation of the amblyopic deficit should therefore be castin terms of a cascade of deficits in several processing areas of thecerebral cortex. The effects we have observed in striate cortexrepresent only the first stage of that cascade.
REFERENCESBaker FH, Grigg P, von Noorden GK (1974) Effects of visual depriva-
tion and strabismus on the response of neurons in the visual cortex ofthe monkey, including studies of striate and prestriate cortex in thenormal animal. Brain Res 66:185–208.
Blakemore C, Vital-Durand F (1986) Effects of visual deprivation of thedevelopment of the monkey’s lateral geniculate nucleus. J Physiol(Lond) 380:493–511.
Boothe RG, Kiorpes L, Williams RA, Teller DY (1989) Operant mea-surements of contrast sensitivity in infant macaque monkeys duringnormal development. Vision Res 28:387–396.
Crawford ML, Harwerth RS, Chino YM, Smith EL (1996) Binocularityin prism-reared monkeys. Eye 10:161–166.
Crawford MLJ, von Noorden GK (1979) The effects of short-term ex-perimental strabismus on the visual system in Macaca mulatta. InvestOphthalmol Vis Sci 18:496–505.
Daw NW (1995) Visual development. New York: Plenum.DeValois RL, Albrecht DG, Thorell LG (1982) Spatial frequency selec-
tivity of cells in macaque visual cortex. Vision Res 22:545–559.Eggers HM, Gizzi MS, Movshon JA (1984) Spatial properties of striate
cortical neurons in esotropic macaques. Invest Ophthalmol Vis Sci25:S278.
Fenstemaker SB, Aoki C, Kiorpes L, Movshon JA (1994) Chemoarchi-tectonic alterations in primary visual cortex of strabismic monkeys. SocNeurosci Abstr 320:626.
Fenstemaker SB, George KH, Kiorpes L, Movshon JA (1997) Tangen-tial organization of eye dominance in area V1 of macaques withstrabismic amblyopia. Soc Neurosci Abstr 323:2363.
Finney DJ (1971) Probit analysis. Cambridge, England: Cambridge UP.Harwerth RS, Smith EL, Boltz RL, Crawford MLJ, von Noorden GK
(1983) Behavioral studies on the effect of abnormal early visual expe-rience: spatial modulation sensitivity. Vision Res 23:1501–1510.
Hendrickson AE, Movshon JA, Eggers HM, Gizzi MS, Boothe RG,Kiorpes L (1987) Effects of early unilateral blur on the macaque’svisual system. II. Anatomical observations. J Neurosci 7:1327–1339.
Hess RF, Holliday IE (1992) The spatial localization deficit in amblyo-pia. Vision Res 32:1319–1339.
Hess RF, Pointer JS (1985) Differences in the neural basis of humanamblyopias: the distribution of the anomaly across the visual field.Vision Res 25:1577–1594.
Hess RF, Campbell FW, Greenhalgh T (1978) On the nature of theneural abnormality in human amblyopia: neural aberrations and neuralsensitivity loss. Pflugers Arch 377:201–207.
Hess RF, Campbell FW, Zimmern R (1980) Differences in the neuralbasis of human amblyopias: the effect of mean luminance. Vision Res20:295–305.
Hess RF, McIlhagga W, Field DJ (1997) Contour integration in strabis-mic amblyopia: the sufficiency of an explanation based on positionuncertainty. Vision Res 37:3145–3161.
Hubel DH, Wiesel TN (1962) Receptive fields, binocular interaction,and functional architecture in the cat’s visual cortex. J Physiol (Lond)160:106–154.
Hubel DH, Wiesel TN (1965) Binocular interaction in striate cortex ofkittens reared with artificial squint. J Neurophysiol 28:1041–1059.
Hubel DH, Wiesel TN (1968) Receptive fields and functional architec-ture of monkey striate cortex. J Physiol (Lond) 195:215–243.
Katz LC, Shatz CJ (1996) Synaptic activity and the construction ofcortical circuits. Science 274:1133–1138.
Kiorpes L (1992a) Development of vernier acuity and grating acuity innormally reared monkeys. Vis Neurosci 9:243–251.
Kiorpes L (1992b) Effect of strabismus on the development of vernieracuity and grating acuity in monkeys. Vis Neurosci 9:253–259.
Kiorpes L, Boothe RG (1984) Accommodative range in amblyopic mon-keys. Vision Res 24:1829–1834.
Kiorpes L, Movshon JA (1990) Behavioral analysis of visual develop-ment. In: Development of sensory systems in mammals (Coleman JR,ed), pp 125–154. New York: Wiley.
Kiorpes L, Movshon JA (1996) Amblyopia: a developmental disorder ofthe central visual pathways. Cold Spring Harb Symp Quant Biol61:39–48.
Kiorpes L, Wallman J (1995) Does experimentally induced amblyopiacause hyperopia in monkeys? Vision Res 35:1289–1297.
Kiorpes L, Boothe RG, Hendrickson AE, Movshon JA, Eggers HM,Gizzi MS (1987) Effects of early unilateral blur on the macaque’svisual system. I. Behavioral observations. J Neurosci 7:1318–1326.
Kiorpes L, Carlson MR, Alfi D (1989) Development of visual acuity inexperimentally strabismic monkeys. Clin Vision Sci 4:95–106.
Kiorpes L, Kiper DC, Movshon JA (1993) Contrast sensitivity and ver-nier acuity in amblyopic monkeys. Vision Res 33:2301–2311.
Kiper DC (1994) Spatial phase discrimination in monkeys with experi-mental strabismus. Vision Res 34:437–447.
Kiper DC, Kiorpes L (1994) Suprathreshold contrast sensitivity in ex-perimentally strabismic monkeys. Vision Res 34:1575–1583.
Kiper DC, Gegenfurtner KR, Kiorpes L (1995) Spatial frequency chan-nels in experimentally strabismic monkeys revealed by oblique masking.Vision Res 35:2737–2742.
Levi DM, Carkeet A (1993) Amblyopia: a consequence of abnormalvisual development. In: Early visual development: normal and abnor-mal (Simons K, ed), pp 391–408. New York: Oxford UP.
Levi DM, Klein SA (1982) Hyperacuity and amblyopia. Nature298:268–270.
Levi DM, Sharma V (1998) Integration of local orientation in strabismicamblyopia. Vision Res 38:775–781.
Levitt JB, Movshon JA, Sherman SM, Spear PD (1989) Effects of mon-ocular deprivation on macaque LGN. Invest Ophthalmol Vis Sci30:S296.
Levitt JB, Kiper DC, Movshon JA (1994) Receptive fields and func-tional architecture of macaque V2. J Neurophysiol 71:2517–2542.
McKee SP, Schor CM, Steinman SB, Wilson N, Koch GG, Davis SM,Hsu-Winges C, Day SH, Chan CL, Movshon JA, Flom MC, Levi DM,Flynn JT (1992) The classification of amblyopia on the basis of visualand oculomotor performance. Trans Am Ophthalmol Soc 90:123–148.
Merrill EG, Ainsworth A (1972) Glass-coated platinum-plated micro-electrodes. Med Biol Eng 10:662–671.
Movshon JA, Kiorpes L (1990) The role of experience in visual devel-opment. In: Development of sensory systems in mammals (ColemanJR, ed), pp 155–202. New York: Wiley.
Movshon JA, Van Sluyters RC (1981) Visual neural development. AnnuRev Psychol 32:477–522.
Movshon JA, Eggers HM, Gizzi MS, Hendrickson A, Kiorpes L, BootheRG (1987) Effects of early unilateral blur on the macaque’s visualsystem: III. Physiological observations. J Neurosci 7:1340–1351.
Movshon JA, McKee SP, Levi DM (1996) Visual acuity in a largepopulation of normal, strabismic, and anisometropic observers. InvestOphthalmol Vis Sci 37:S670.
Roelfsema PR, Konig P, Engel AK, Sireteanu R, Singer W (1994)Reduced synchronization in the visual cortex of cats with strabismicamblyopia. Eur J Neurosci 6:1645–1655.
Kiorpes et al. • Visual Cortical Correlates of Amblyopia J. Neurosci., August 15, 1998, 18(16):6411–6424 6423
Sireteanu R, Fronius M (1990) Human amblyopia: structure of the visualfield. Exp Brain Res 79:603–614.
Sireteanu R, Fronius M, Singer W (1981) Binocular interaction in theperipheral visual field of humans with strabismic and anisometropicamblyopia. Vision Res 21:1065–1074.
Smith EL, Harwerth RS, Crawford MLJ (1985) Spatial contrast sensi-tivity deficits in monkeys produced by optically induced anisometropia.Invest Ophthalmol Vis Sci 26:330–342.
Smith EL, Chino YM, Ni J, Cheng H, Crawford MLJ, Harwerth RS(1997) Residual binocular interactions in the striate cortex of monkeysreared with abnormal binocular vision. J Neurophysiol 78:1353–1362.
Stryker MP, Sherk H (1975) Modification of cortical orientation selec-tivity in the cat by restricted visual experience: a reexamination. Sci-ence 190:904–906.
Tolhurst DJ, Movshon JA, Dean AF (1983) The statistical reliability of
signals in single neurons in cat and monkey visual cortex. Vision Res23:775–785.
Von Noorden GK (1980) Burian—Von Noorden’s binocular vision andocular motility. St Louis: Mosby.
Wiesel TN (1982) Postnatal development of the visual cortex and theinfluence of environment. Nature 299:583–591.
Wiesel TN, Hubel DH (1963) Single-cell responses in striate cortex ofkittens deprived of vision in one eye. J Neurophysiol 26:1003–1017.
Wiesel TN, Hubel DH (1965) Comparison of the effects of unilateraland bilateral eye closure on cortical unit responses in kittens. J Neuro-physiol 28:1029–1040.
Williams RA, Boothe RG, Kiorpes L, Teller DY (1981) Oblique effectsin normally reared monkeys (Macaca nemestrina): meridional variationsin contrast sensitivity measured with operant techniques. Vision Res21:1253–1266.
6424 J. Neurosci., August 15, 1998, 18(16):6411–6424 Kiorpes et al. • Visual Cortical Correlates of Amblyopia