neuroanatomical database of normal japanese brains
TRANSCRIPT

2003 Special issue
Neuroanatomical database of normal Japanese brains
Kazunori Satoa, Yasuyuki Takia, Hiroshi Fukudaa,b, Ryuta Kawashimab,c,*
aIDAC, Tohoku University, 4-1 Seiryocho, Aobaku Sendai 980-8575, JapanbAoba Brain Imaging Research Center, TAO, Sendai 980-8575, Japan
cNICHe, Tohoku University, 4-1 Seiryocho, Aramakiaza Aoba, Aobaku, Sendai 980-8579, Japan
Received 21 October 2002; revised 3 June 2003; accepted 3 June 2003
Abstract
To develop a high-resolution in vivo human neuroanatomy database for Japanese brains, a data set on 1547 normal subjects between the
ages of 16 and 79 years has been collected. First, we determined individual reference brains of normal Japanese for each age and gender
group. We found there exists cross-generational changes in brain shape, that is, the young generation has a shorter and wider brain than the
older generation. Second, we determined the effect of aging on the volume of gray matter and white matter by voxel based morphometry. A
significant negative correlation between the gray matter volume and age was observed. We assume that this kind of database is quite useful to
investigators who are engaged in basic neuroscience, clinical diagnostics and evaluation of neuropsychiatric disorders in patients.
q 2003 Elsevier Ltd. All rights reserved.
Keywords: Magnetic resonance imaging; Human; Brain; Database; Reference brain; Age related changes; Gray matter; White matter
1. Introduction
The shape of the cerebral hemispheres is not determined
by accidental phenomena, but is sculpted by complex
interactions between numerous genetic and environmental
processes during life. For example, neurogenesis, migration,
myelination, and development of connectivity are major
events influencing gyrification and hemispheric shape
during fetal and early postnatal periods (Van Essen,
1996). In the previous neuroimaging investigations, there
are several anatomical studies of gyral pattern and its
intersubject variability (Evans, Collins, & Holmes, 1996; Le
Goualher et al., 2000; Royackkers, Desvignes, Fawal, &
Ravenu, 1999; Zilles et al., 1997). In addition, there exists a
few studies that assess brain shape using deformation based
morphometry using relatively small number of subjects
(Ashburner et al., 1998; Gaser, Nenadic, Buchsbaum,
Hazlett, & Buchsbaum, 2001).
There is no doubt that quantitative results from a large
data set of normal brain imaging could be used to estimate
and eliminate the effects of group differences in behavioral
measures on the dependent anatomic measures. For
example, although using a relatively small number of
samples, Leonard et al. (1999) showed the relationship
between structural abnormalities and schizophrenia, and
Zilles, Kawashima, Dabringhaus, Fukuda, and Schormann
(2001) showed inter-ethnic differences in hemispheric shape
using three-dimensional measurements of brain anatomy by
magnetic resonance imaging (MRI). Identifying and con-
trolling relevant variables that correlate with brain anatomy
would be an essential element in establishing the credibility
of derived, quantitative MRI measures that cannot be
validated by simply having an experienced radiologist
inspect a scan using his or her own internalized database of
experience to define normality. However, to our knowledge,
there exists no comprehensive database that can be used for
the complete, individual subjects, neuroimaging data sets
for the human brain anatomy in an interactive, efficient and
simple manner. It is obvious that such a system would
increase the value of both clinical and research funds spent
on these important and costly studies.
Therefore, the primary neuroinformatics purpose of this
study was to develop a high-resolution in vivo human
neuroanatomy database for Japanese brains. To use this
database, we selected an individual reference (standard)
brain of each age group and each gender group, which
has the least deviation in brain shape with respect to
0893-6080/$ - see front matter q 2003 Elsevier Ltd. All rights reserved.
doi:10.1016/j.neunet.2003.06.004
Neural Networks 16 (2003) 1301–1310
www.elsevier.com/locate/neunet
* Corresponding author. Address: NICHe, Tohoku University,
Aramakiaza Aoba, Aobaku, Sendai 980-8571, Japan. Tel./fax: þ81-22-
217-4088.
E-mail address: [email protected] (R. Kawashima).

the database and then evaluated age-related structural
changes of cerebral hemispheres.
2. Methods
2.1. Development of anatomical brain imaging data
Samples. The subjects were Japanese volunteers
recruited by the Aoba Brain Imaging Research Center,
Sendai, Japan. All were normal and right-handed. The group
consisted of 772 men (age range: 16–79 years) and 775
women (age range: 18–79 years) (Table 1). Data from
subjects who had a history or symptoms of a central nervous
system disease of any kind or brain injury were excluded
from the database. Each subject was interviewed by medical
doctors of the Institute of Development, Aging and Cancer
(IDAC), Tohoku University. Written informed consent was
obtained from each subject after a full explanation of the
purpose and procedures of the study according to the
declaration of Helsinki, 1991, prior to MRI. Approval for
these experiments was obtained from the Institutional
Review Board of the IDAC, Tohoku University.
Imaging. Three different images of the brain were
obtained from each subject using the same 0.5 T MR
scanner (Signa contour, GE-Yokogawa Medical Systems,
Tokyo). Protocols of MRI are summarized in Table 2. Prior
to further computational procedures, all MR images were
filmed in a conventional format and inspected by experi-
enced radiologists in IDAC. Subjects with any abnorma-
lities including brain tumor, infarction, arachnoid cyst, and
normal variations (e.g. mega cisterna magna, and cavum
septum pellucidum) were excluded from this study. Data
from subjects with multiple and extensive lesions in the
white matter were also excluded from the database.
Data processing. All MRIs were transferred to the
Montreal Neurological Institute and were processed auto-
matically in Silicon Graphics workstations as follows. First,
intensity nonuniformity in MRI data was corrected by the
nonparametric nonuniform intensity normalization method
(Sled, Zijdenbos, & Evans, 1998). Next, MRIs were
transformed into the Talairach stereotactic space (Talairach
& Tournoux, 1988) using nine linear parameters, namely
three scaling, three rotations, and three translations (Collins,
Neelin, Peters, & Evans, 1994). In this process, we used an
average brain derived from 305 normal brains for
the standardization procedure (Collins et al., 1994). Then,
tissues were classified with an artificial neural network
classifier (Evans, Frank, Antel, & Miler, 1997). This method
involved classifying each pixel according to its combination
of intensities from each image type. In this study, the
cerebellum and the brain stem were automatically excluded
from MR images using the same masks (Collins et al.,
1998). Following these processes, the MRI maps of the
binary gray matter, white matter and CSF masks were
obtained.
Data Storage. The database consists of three com-
ponents, that is, the raw image data set (i.e. 3D
multispectral MRI structural studies of an individual
subject), the processed image data set, and the associated
text data set. All image data sections are a stack of
images in both ANALYZE and MINC formats. In order
to protect subject confidentiality, patient information was
stripped from all data. Text data provide information on
each subject, e.g. subject ID, experimental protocol ID,
age, gender, health status, assessments (e.g. handedness),
and medication status. Information that can identify an
individual subject, e.g. name, contact address, and
birthday, is stored in the hidden layer of the database,
where only an administrator can access.
2.2. Selection for individual reference brain
Subjects. In this analysis, subjects in the database were
divided into 10 groups according to age and sex; that is, the
groups with members in their decade of age for each gender.
To reduce the calculation time, every 50 subjects were
selected arbitrarily from each group and used for the
analysis.
Image processing. Image data processing was performed
on raw T1-weighted images of each age–sex group. Tissues
other than those of the brain were removed from
T1-weighted images of brains of all the subjects by the
automatic brain extraction method using erosion-dilation
treatment (Miura et al., 2002). One brain was selected as a
template brain and all the other brains in the group were
spatially normalized to this template brain with 12-
parameter-affine-transformation of Automated Image
Registration (AIR) 5 (Woods, Grafton, Holmes, Cherry, &
Mazziotta, 1998). The mean value of cost functions
(standard deviation of ratio images) for each transformation
to this template was calculated. Then, another subject’s
brain was selected as the next template brain, and the same
process was executed. All the brains in the group were used
Table 1
Number of subjects in each age group
Age
,19 20–29 30–39 40–49 50–59 60–69 70 ,
Male 51 179 117 131 158 135 31
Female 9 120 112 159 224 131 20
Table 2
MRI protocols
Protocol TR
(ms)
TE
(ms)
FA Matrix Size
(mm)
T1-weighted SPGR 40 7 30 256 £ 256 £ 124 1 £ 1 £ 1.5
T2-weighted SE 2860 15 – 256 £ 256 £ 63 1 £ 1 £ 3
Proton density SE 2860 120 – 256 £ 256 £ 63 1 £ 1 £ 3
K. Sato et al. / Neural Networks 16 (2003) 1301–13101302

as the template brain and the means of cost functions were
calculated. Hereby, we obtained 50 means of cost functions
in one group. Fig. 1 shows an example of the means of cost
functions for the group of females in their seventh decade. A
brain that yields a minimum mean of cost functions was
selected as the reference subject in the group. Finally, all
selected brains were spatially normalized to the Talairach
space using a 7-parameter global rescaling model which
keeps the shape of each brain.
In the next step, all the brains in a group were spa-
tially transformed to the selected reference brain, and
the transformation matrices were obtained. From these
matrices, the transformation matrices, which define the
average size and shape of the brains in the group, were
calculated with AIR. Using this transformation, the brain of
the reference subject was transformed to the average shape
and size in this group. The transformed brain was
determined as the reference (standard) brain of this age–
sex group.
2.3. Evaluation of age-related structural changes of brain
In this analysis, brain MRIs of 350 males (mean (SD)
age, 45.5 (15.6) years; age range, 16–79 years) and 410
females (mean (SD) age, 47.5 (13.4) years; age range,
19–78 years) were analyzed. Statistical analysis of the local
volume change of the gray matter and white matter was
carried out by statistical parametric mapping (SPM)
(SPM99, Wellcome Department of Cognitive Neurology,
London, UK) (Friston et al., 1995) in Matlab (Math Works,
Natick, MA, USA). The stereotactically normalized gray
matter and white matter binary images were smoothed using
a 20-mm full-width at half-maximum isotropic Gaussian
kernel. Smoothing made the data more normally distributed
(Ashburner & Friston, 2000). The voxel values in the
resulting smoothed gray or white matter images were
referred to as the gray or white matter concentration. To
investigate regionally the specific effects of age on the
imaging data, simple regression analysis was performed.
The voxel value was used as a dependent variable and age
was used as an independent variable. For the correction of
multiple comparisons, height threshold was corrected and
Fig. 1. An example showing cost functions of 50 subjects (Female: aged
60–69). The subject numbers are sorted with respect to cost. The subject
with minimum mean, indicated with an arrow was selected as a standard
subject in this group.
Fig. 2. Examples of trans-axial slices of female reference brains. The left side of the image shows the left hemisphere of the brain.
K. Sato et al. / Neural Networks 16 (2003) 1301–1310 1303

p , 0:05 was considered significant. The results of SPM
image analysis were superimposed on structural images on
horizontal slices, which were the average images of all male
or female subjects’ normalized T1-weighted images, to
facilitate correlation with anatomy.
3. Results
3.1. Selection for individual reference brain
Figs. 2 and 3 show examples of trans axial sections of
generated Japanese reference brain for each age group of
females and males, respectively. Figs. 4 and 5 represent a 3D
view of these reference brains of female and male,
respectively. The ratio of maximum width (right–left) to
maximum length (anterior–posterior) of the reference brains
was 0.867 in second-decade-females, 0.828 in sixth-decade-
females, 0.860 in second-decade-males, and 0.831 in sixth-
decade-males. Both in male and in female, a younger
reference brain had a higher ratio than an older reference
brain, which means that young brains are shorter and wider
than older brains. In each group, the left hemisphere was
larger than the right hemisphere. All the data of normal
Japanese reference brains will be presented on our web site
(http://www.idac.tohoku.ac.jp/JHBP/).
3.2. Evaluation of age-related structural changes of brain
The cross-sectional analysis of the correlation between
gray matter volume and age showed a significant
negative correlation between the gray matter volume
and age in both female ðR2 ¼ 0:38; p , 0:001Þ and male
ðR2 ¼ 0:58; p , 0:001Þ (Fig. 6), while the volume of the
white matter did not show significant change with age
in female ðR2 ¼ 0:02; p ¼ 0:702Þ and male ðR2 ¼
0:02; p ¼ 0:748Þ (Fig. 7). As for the correlation between
gray matter volume and age, the slope of regression
line of male is significantly steeper than that of female
ðp , 0:05Þ:
The local gray matter concentration of almost all cerebral
cortices and the basal ganglia showed a significant negative
correlation with age (Fig. 8). In particular, strong corre-
lations were found between age and the local gray matter
concentration of the left superior temporal gyrus and the left
precentral gyrus in female, and that of the bilateral superior
temporal gyri in male.
The bilateral periventricular regions of lateral ventri-
culus and the third ventricle showed significant negative
correlations with age in both genders (Fig. 9). In particular,
strong correlations of white matter concentration with age
were found in bilateral lateral periventricular regions, the
left corpus callosum in female, and in bilateral lateral
periventricular regions and the left fasciculus occipito-
frontalis in male.
The bilateral white matter of subcortical regions showed
significant positive correlations with age in each gender
(Fig. 10). In particular, strong correlation with age was
found in the white matter of the right cuneus, white matter
of the light superior temporal gyrus, and the left fornix in
female, and in the white matter of the left cuneus, and
bilateral external capsule in male.
Fig. 3. Examples of trans-axial slices of male reference brains. The left side of the image shows the left hemisphere of the brain.
K. Sato et al. / Neural Networks 16 (2003) 1301–13101304
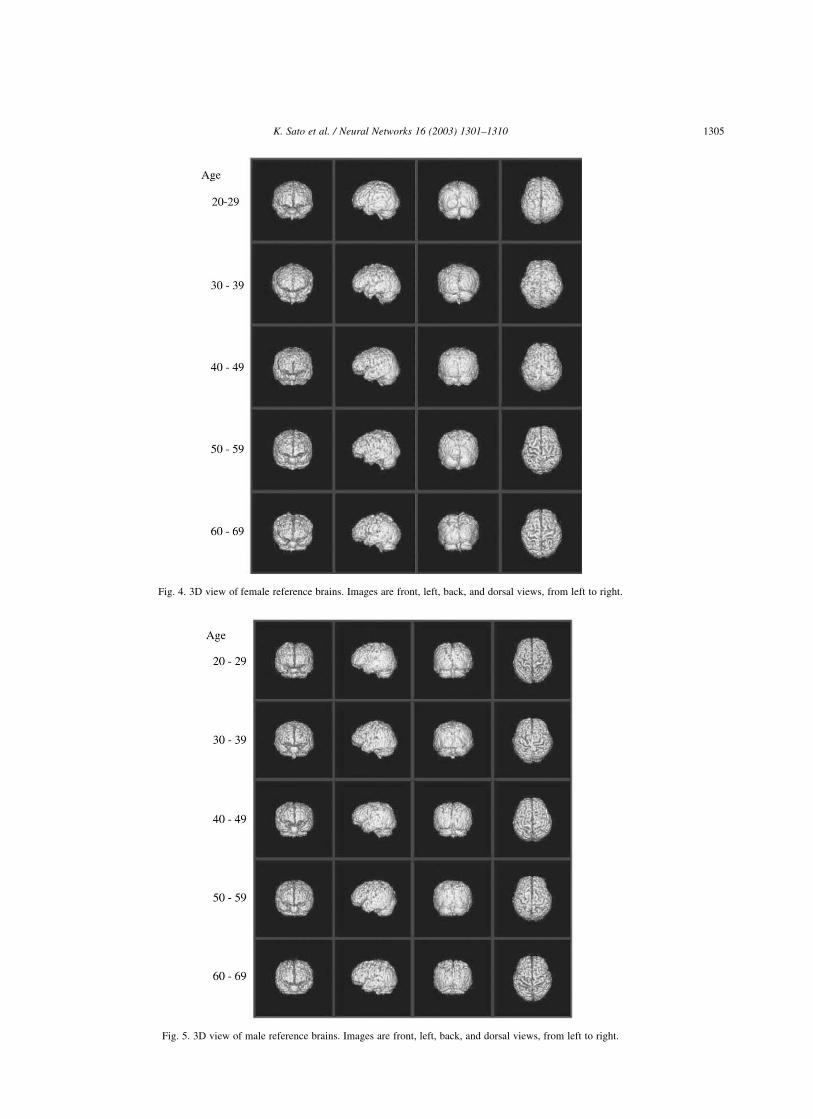
Fig. 4. 3D view of female reference brains. Images are front, left, back, and dorsal views, from left to right.
Fig. 5. 3D view of male reference brains. Images are front, left, back, and dorsal views, from left to right.
K. Sato et al. / Neural Networks 16 (2003) 1301–1310 1305

4. Discussion
4.1. Brain imaging database
To our knowledge, this is the first report describing the
anatomical brain image database of normal Japanese. Our
system has been designed not only for the storage but also
for the sharing of raw anatomical MRI data. There is no
doubt that an electronic data sharing system has become an
important tool in many scientific research fields. It is true
that sharing raw data with the scientific community
increases the value of the data and provides current
knowledge. Although, it is also true that there are several
problems in raw data sharing (Koslow, 2002). The most
problematic issue regarding the distribution of a raw
structural MRI data set is the potential for compromising
a subject’s confidentiality, since the experimental subject’s
face could be reconstructed from the raw data sets. We,
therefore, have made our decision to alter or eliminate facial
structures from the data set prior to distribution of raw
image data.
Several approaches can be used in the development of
databases to accommodate the diversity of data types and
structures required to adequately represent brain structure
and function. Fox and colleagues have developed one of the
first human brain imaging databases, named BrainMap
database (http://www.brainmapdbj.org), which was
Fig. 6. Correlation between gray matter volume and aging in female and
male. Vertical and horizontal axes represent volume of gray matter in mm3
and age of subject, respectively. Dots and bars indicate mean and standard
deviation of gray matter volume of each decade subjects, respectively.Fig. 7. Correlation between white matter volume and aging in female and
male. Vertical and horizontal axes represent volume of white matter in mm3
and age of subject, respectively. Dots and bars indicate mean and standard
deviation of white matter volume of each decade subjects, respectively.
K. Sato et al. / Neural Networks 16 (2003) 1301–13101306

designed to provide an indexing system that maps both
context and content as a multidimensional space for the
functional brain-imaging literature (Fox & Lancaster, 1994;
Fox, Mikiten, Davis, & Lancaster, 1994). Usually, the
image data are excluded and only boundary information is
retained. An International Consortium for Brain Mapping
(ICBM) has been developing a 4D probabilistic atlas and
reference system for the human brain (Mazziotta et al.,
2001). They have collected anatomical brain images of
more than 7000 subjects between the ages of 18 and 90
years from seven countries, and stored these data sets in
a digital brain image library (http://www.loni.ucla.edu/
ICBM/). Our Japanese brain database project has joined in
this project since 1999. In the ICBM project, data on each
subject includes detailed demographic, clinical, behavioral,
and imaging information. In addition, DNA samples have
been collected from 5800 subjects for genotyping, and a
component of the program uses postmortem tissues to
determine the probabilistic distribution of microscopic cyto-
and chemoarchitectural regions in the human brain. The
fMRI Data Center of Dartmouth College has been
developing a functional imaging database (Van Horn et al.,
Fig. 8. Color-coded SPM indicating areas showing significantly negative correlation between local gray matter and age. The right side of the image represents
the left side of the brain. Color scales indicate t-score. The numbers at bottom left in the slices, that is 28, 7, 22 and 37, indicate z-coordinate labels in Talairach
stereotactic space (Talairach & Tournoux, 1988).
Fig. 9. Color-coded SPM indicating areas showing significantly negative correlation between local white matter and age. Other details are the same as Fig. 7.
K. Sato et al. / Neural Networks 16 (2003) 1301–1310 1307

2001). They are collecting raw functional imaging data from
peer-reviewed publications, and put these raw data into a
database that will allow for the mining of highly
heterogeneous and voluminous functional MRI data
(http://www.fmridc.org/).
4.2. Selection for individual reference brain
To our knowledge, this is the first report showing
individual reference brains of normal Japanese for each age
and gender group. Our reference brains, that deviate least
from the others in terms of mean square intensity,
characterized the average shape of the brain of each
group. It is interesting and important to note that, although
we could not perform statistical analysis, we found a clear
tendency of cross-generational changes in brain shape.
These kinds of variability in brain shape between individ-
uals, gender, as well as ethnic groups have been reported
previously (Zilles et al., 1997, 2001). The biological
significance of this tendency shown in our data is as yet
unclear. However, since the shape of the brain is sculptured
by complex interactions between numerous genetically and
environmentally influenced processes in life (Zilles et al.,
2001), we assume that significant environmental changes
may have occurred during the past 50 years in Japan.
Recently, functional imaging study has become the
major focus of neuroscience research, and it provides much
knowledge on functional organization of the human brain.
These functional imaging data are usually mapped to a
spatial reference system (Talairach & Tournoux, 1988), that
is, an individual reference brain selected as the anatomically
least-deviating specimen from a large sample of brains
(Roland et al., 1994), or a mean brain constructed by
averaging individual brains (Evans et al., 1996), in order to
match individual size and shape of the brain. For this
purpose, many different linear and nonlinear procedures
have been proposed for normalizing an individual brain in a
standard size and shape. Although, the brain size can be
easily normalized by linear transformations, normalization
of the brain shape is difficult even when nonlinear
procedures are used. Our results can provide useful criteria
for the evaluation of spatial standard reference systems.
Because the shape of the brain differs between Japanese and
European (Zilles et al., 2001), as well as between young and
older subjects, a reference system for each age group of each
race might be necessary for functional imaging studies.
4.3. Evaluation of age-related structural changes of brain
There was a significant negative correlation between the
gray matter volume and age in each gender, while the
volume of the white matter did not show significant change
with age in each gender. Our results indicate that the essence
of brain atrophy with aging is the volume reduction of the
gray matter. This finding is consistent with a previous study
that showed morphometrical change of the normal Euro-
pean adult brain with aging (Good et al., 2001).
The gray matter concentration of almost all cerebral
cortices and basal ganglia showed significant negative
correlations with age. From several previous studies, normal
age-related loss of gray matter volume has been attributed to
decreased perfusion (Melamed, Lavy, Bentin, Cooper, &
Rinot, 1980; Meyer et al., 1999; Takeda, Matsuzawa, &
Matsui, 1988), neuronal shrinkage and/or loss with
decreased cortical synaptic densities (Anderson, Hubbard,
Coghill, & Slidders, 1983; Masliah, Mallory, Hansen,
DeTeresa, & Terry, 1993; Terry, DeTeresa, & Hansen,
1987), which are probably related to neuronal apoptosis
Fig. 10. Color-coded SPM indicating areas showing significantly positive correlation between local white matter and age. Other details are the same as Fig. 7.
K. Sato et al. / Neural Networks 16 (2003) 1301–13101308

(Bredesen, 1995; Charriaut-Marlangue et al., 1996).
Recently, Van Laere et al. (2001) showed that the left
superior temporal gyrus showed significant negative
correlation between perfusion and aging. Their results are
in line with our results that the gray matter concentration of
the left superior temporal gyrus showed most significant
negative correlation with age. Their results combined with
results of this study suggest that the strong negative
correlation between the gray matter concentration of left
superior temporal gyrus and age may be due to decreased
perfusion.
The factors that influence the volume change of white
matter are the loss of axons associated with the loss of
neurons, loss of myelin, and decrease in the numbers of glial
cells. Previous studies using autopsied normal human brains
showed that approximately 10% of all neocortical neurons
are lost over the life span in both genders (Pakkenberg &
Gundersen, 1997), and that the total volume of myelinated
fibers in elderly subjects was lower than that in young
subjects (Tang, Nyengaard, Pakkenberg, & Gundersen,
1997). On the other hand, a parallel process of capillary
network and swelling of perivascular spaces may increase
the white matter volume (Meier-Ruge, Ulrich, Bruhlmann,
& Meier, 1992). There was a substantial increase in glial
population in the paracortical white matter of the visual
cortex of older subjects compared with younger subjects
(Devaney & Johnson, 1980). In our results, there was no
significant correlation between the white matter volume and
age, while a significant local change of white matter
concentration with aging was observed; concentration of the
entire periventricular white matter showed significant
negative correlation with age, while the entire subcortical
white matter showed significant positive correlation with
age. These phenomena cannot be explained by loss of
axons, loss of myelin, or decrease in the numbers of glial
cells. From our results, we consider that white matter was
moved to lateral region due to atrophy of gray matter with
aging. We consider that local change of white matter
concentration is affected by that of gray matter concen-
tration. A study supports our hypothesis in that study,
correlations between structural change and the degree of
Alzheimer disease progression in patients was analyzed
(Janke et al., 2001). As the disease progressed, atrophy of
the gray matter was observed, otherwise the most prominent
structural change of the white matter was not atrophy or
volume growth, but volume movement.
Acknowledgements
We thank Drs Alan Evans, Alex Zijdenbos, Peter Neelin
and Jason Lerch at Montreal Neurological Institute, McGill
University, for image data processing, Drs Ryoi Goto,
Shuichi Ono, Shigeo Kinomura, Manabu Nakagawa,
Motoaki Sugiura, and Jobu Watanabe at IDAC, Tohoku
University for data collection and analyses of image data,
and Drs Kazuhito Shida and Yoshiyuki Kawazoe at IMR,
Tohoku University for development of the database system.
This research is supported by grants from the Telecommu-
nications Advancement Organization of Japan, as well as
the National Institute of Mental Health, the National
Institute of Neurological Disorders and Stroke, the National
Institute on Drug Abuse, and the National Cancer Institute
of USA.
References
Anderson, J. M., Hubbard, B. M., Coghill, G. R., & Slidders, W. (1983).
The effect of advanced old age on the neurone content of the cerebral
cortex. Observations with an automatic image analyser point counting
method. Journal of Neuroogical Science, 58, 235–246.
Ashburner, J., & Friston, K. J. (2000). Voxel-based morphometry—the
methods. Neuroimage, 11, 805–821.
Ashburner, J., Hutton, C., Frackowiak, R., Johnsrude, I., Price, C., &
Friston, K. (1998). Identifying global anatomical differences: defor-
mation-based morphometry. Human Brain Mapping, 6, 348–357.
Bredesen, D. E. (1995). Neural apoptosis. Annals of Neurology, 38,
839–851.
Charriaut-Marlangue, C., Margaill, I., Represa, A., Popovici, T., Plotkine,
M., & Ben-Ari, Y. (1996). Apoptosis and necrosis after reversible focal
ischemia: an in situ DNA fragmentation analysis. Jounal of Cerebral
Blood Flow and Metabolism, 16, 186–194.
Collins, D. L., Neelin, P., Peters, T. M., & Evans, A. C. (1994). Automatic
3D intersubject registration of MR volumetric data in standardized
Talairach space. Jounal of Computer Assisted Tomography, 18,
192–205.
Collins, D. L., Zijdenbos, A. P., Kollokian, V., Sled, J. G., Kabani, N. J.,
Holmes, C. J., & Evans, A. C. (1998). Design and construction of a
realistic digital brain phantom. IEEE Transactions on Medical Imaging,
17, 463–468.
Devaney, K. O., & Johnson, H. A. (1980). Neuron loss in the aging visual
cortex of man. Jounal of Gerontology, 35, 836–841.
Evans, A. C., Collins, D. L., & Holmes, C. J. (1996). Computational
approaches to quantifying human neuroanatomical variability. In A. W.
Toga, & J. C. Mazziotta (Eds.), Brain mapping. The methods (pp.
343–361). San Diego: Academic Press.
Evans, A. C., Frank, J. A., Antel, J., & Miller, D. H. (1997). The role of MRI
in clinical trials of multiple sclerosis: comparison of image processing
techniques. Annals of Neurology, 41, 125–132.
Fox, P. T., & Lancaster, J. L. (1994). Neuroscience on the net. Science, 266,
994–996.
Fox, P. T., Mikiten, S., Davis, G., & Lancaster, J. (1994). Brain map: a
database of human functional brain mapping. In R. W. Thatcher, M.
Hallett, T. Zeffiro, E. R. John, & M. Huerta (Eds.), Functional
neuroimaging (pp. 95–105). San Diego: Academic Press.
Friston, K.J., Holmes, A.P., Worsley, K.J., Poline, J.-P., Frith, C.D., &
Frackowiak, R.S.J. (1995). Statistical parametric maps in functional
imaging: A general linear approach. Human Brain Mapping, 2,
189–210.
Gaser, C., Nenadic, I., Buchsbaum, B. R., Hazlett, E. A., & Buchsbaum,
M. S. (2001). Deformation-based morphometry and its relation to
conventional volumetry of brain lateral ventricles in MRI. Neuroimage,
13, 1140–1145.
Good, C. D., Johnsrude, I. S., Ashburner, J., Henson, R. N. A., Friston,
K. J., & Frackowiak, R. S. J. (2001). A voxel-based morphometric
study of ageing in 465 normal adult human brains. Neuroimage, 14,
21–36.
Janke, A. L., Zubicaray, G. D., Rose, S. E., Griffin, M., Chalk, J. B., &
Galloway, G. J. (2001). 4D deformation modeling of cortical disease
K. Sato et al. / Neural Networks 16 (2003) 1301–1310 1309

progression in Alzheimer’s dementia. Magnetic Resonance Medicine,
46, 661–666.
Koslow, S. H. (2002). Sharing primary data; a threat or asset to discovery?
Nature Neuroscience, 3, 311–313.
Le Goualher, G., Argenti, A. M., Duyme, M., Baare, W. F., Hulshoff, P. H.
E., Boomsma, D. I., Zouaoui, A., Barillot, C., & Evans, A. C. (2000).
Statistical sulcal shape comparisons: application to the detection of
genetic encoding of the central sulcus. Neuroimage, 11, 564–574.
Leonard, C. M., Kuldau, J. M., Breier, J. I., Zuffante, P. A., Gautier, E. R.,
Heron, D.-C., Lavery, E. M., Packing, J., Williams, S. A., & DeBose,
C. A. (1999). Cumulative effect of anatomical risk factors for
schizophrenia: an MRI study. Biological Psychiatry, 46, 374–382.
Masliah, E., Mallory, M., Hansen, L., DeTeresa, R., & Terry, R. D. (1993).
Quantitative synaptic alterations in the human neocortex during normal
aging. Neurology, 43, 192–197.
Mazziotta, J., Toga, A., Evans, A., Fox, P., Lancaster, J., Zilles, K., Woods,
R., Paus, T., Simpson, G., Pike, B., Holmes, C., Collins, L., Thompson,
P., MacDonald, D., Iacoboni, M., Parsons, L., Narr, K., Kabani, N., Le
Goualher, G., Boomsma, D., Cannon, T., Kawashima, R., & Mazoyer,
B. (2001). A probabilistic atlas and reference system for the human
brain: International consortium for brain mapping (ICBM). Philoso-
phical Transactions of the Royal Society of London. Series B, Biological
Sciences B, 356, 1293–1322.
Meier-Ruge, W., Ulrich, J., Bruhlmann, M., & Meier, E. (1992). Age-
related white matter atrophy in the human brain. Annals of New York
Academy of Science, 673, 260–269.
Melamed, E., Lavy, S., Bentin, S., Cooper, G., & Rinot, Y. (1980).
Reduction in regional cerebral blood flow during normal aging in man.
Stroke, 11, 31–35.
Meyer, J. S., Rauch, G. M., Crawford, K., Rauch, R. A., Konno, S., Akiyama,
H., Terayama, Y., & Haque, A. (1999). Risk factors accelerating cerebral
degenerative changes, cognitive decline and dementia. International
Journal of Geriatric Psychiatry, 14, 1050–1061.
Miura, N., Taneda, A., Shida, K., Kawashima, R., Kawazoe, Y., Fukuda,
H., & Shimizu, T. (2002). BREED: automatic brain tissue extraction
method from 3D MRI T1-weighted data. Journal of Computer Assisted
Tomography, 26, 927–931.
Pakkenberg, B., & Gundersen, H. J. (1997). Neocortical neuron number in
humans: effect of sex and age. Jounal of Comparative Neurology, 384,
312–320.
Roland, P. E., Graufelds, C. J., Wehlin, J., Ingelman, L., Andersson, M.,
Ledberg, A., Pedersen, J., Akerman, D., Debringhaus, A., & Zilles, K.
(1994). Human brain atlas: for high-resolution functional and
anatomical mapping. Human Brain Mapping, 1, 173–184.
Royackkers, N., Desvignes, M., Fawal, H., & Ravenu, M. (1999). Detection
and statistical analysis of human cortical sulci. Neuroimage, 10, 625–641.
Sled, J. G., Zijdenbos, A. P., & Evans, A. C. (1998). A nonparametric
method for automatic correction of intensity nonuniformity in MRI
data. IEEE Transactions on Medical Imaging, 17, 87–97.
Takeda, S., Matsuzawa, T., & Matsui, H. (1988). Age-related changes in
regional cerebral blood flow and brain volume in healthy subjects.
Jounal of American Geriatric Society, 36, 293–297.
Talairach, J., & Tournoux, P. (1988). Co-planar stereotaxic atlas of the
human brain: 3-dimensional approach system: an approach to cerebral
imaging. Stuttgart: Georg Thieme Verlag.
Tang, Y., Nyengaard, J. R., Pakkenberg, B., & Gundersen, H. J. (1997).
Age-induced white matter changes in the human brain: a stereological
investigation. Neurobiology of Aging, 18, 609–615.
Terry, R. D., DeTeresa, R., & Hansen, L. A. (1987). Neocortical cell counts
in normal human adult aging. Annals of Neurology, 21, 530–539.
Van Essen, D. C. (1996). Pulling strings to build a better brain: a hypothesis
for why, where and how the cerebral cortex is folded. Neuroimage, 3/3/
2, s299.
Van Horn, J. D., Grethe, J. S., Kostelec, P., Woodward, J. B., Aslam, J.,
Rus, D., Rockmore, D., & Gazzaniga, M. S. (2001). The Functional
Magnetic Resonance Imaging Data Center (fMRIDC): the challenges
and rewards of large-scale databasing of neuroimaging studies.
Philosophical Transactions of the Royal Society of London. Series B,
Biological Sciences B, 356, 1323–1339.
Van Laere, K., Versijpt, J., Audenaert, K., Koole, M., Goethals, I., Achten,
E., & Dierckx, R. (2001). 99mTc-ECD brain perfusion SPET:
variability, asymmetry and effects of age and gender in healthy adults.
European Jounal of Nuclearl Medicine, 28, 873–881.
Woods, R. P., Grafton, S. T., Holmes, C. J., Cherry, S. R., & Mazziotta, J. C.
(1998). Automated image registration: I. General methods and
intrasubject, intramodality validation. Jounal of Computer Assisted
Tomography, 22, 139–152.
Zilles, K., Kawashima, R., Dabringhaus, A., Fukuda, H., & Schormann, T.
(2001). Hemispheric shape of European and Japanese brains: 3-D MRI
analysis of intersubject variability, ethnical, and gender differences.
Neuroimage, 13, 262–271.
Zilles, K., Schleicher, A., Langemann, C., Amunts, K., Morosan, P.,
Palomero-Gallagher, N., Schormann, T., Mohlberg, H., Burgel, U.,
Steinmetz, H., Schlaug, G., & Roland, P. E. (1997). Quantitative
analysis of sulci in the human cerebral cortex: development, regional
heterogeneity, gender difference, asymmetry, intersubject variability,
and cortical architecture. Human Brain Mapping, 5, 218–221.
K. Sato et al. / Neural Networks 16 (2003) 1301–13101310