network project on organic farming - … project on organic farming (npof) is operating in 12 states...
TRANSCRIPT


NETWORK PROJECT ON ORGANIC FARMINGProject Directorate for Farming Systems Research
(Indian Council of Agricultural Research)Modipuram, Meerut – 250 110, India
Annual Report2012-13

Network Project on Organic Farming
Annual Report 2012-13ii
Correct citation : Network project on organic farming. Annual Report 2012-13,Project Directorate for Farming Systems Research (ICAR), Modipuram,Meerut- 250 110, pp. 130.
© Reserved with PDFSR, Modipuram
Compilation & Editing : Dr. B. GangwarDr. Kamta PrasadDr. N. RavisankarDr. Vipin Kumar
Data processing : Dr. N. RavisankarMr. K. P. SinghDr. Vipin Kumar
Type set : Coordination Unit
Published by : Project Director,Project Directorate for Farming Systems Research,Modipuram, Meerut- 250 110, India
Important Notes:
● This compilation is a joint contribution of all the scientists involved in Network Project onOrganic Farming (NPOF) at 13 centres and PDFSR, Modipuram (report writing, compilation,editing and printing).
● The report is based on experimental data generated during kharif, rabi and summer seasonsof 2011-12. The other details are relevant up to 31 March 2013.
● The report includes both processed and semi-processed data, generated in differentexperiments under NPOF. As such no material/ data should be reproduced in any form withoutprior written permission of the Project Director, Project Directorate for Farming SystemsResearch and due credit to the concerned scientist (s).
Printed at: Yugantar Prakashan (P) Ltd., WH-23, Mayapuri, New Delhi-110064
Network Project on Organic Farming
Annual Report 2012-13 iii
ACKNOWLEDGEMENT
Network Project on Organic Farming (NPOF) is operating in 12 states with 13 co-operating centres. Itake this opportunity to record my sincere thanks to Dr S. Ayyappan, Secretary, Department of AgriculturalResearch and Education and Director General, Indian Council of Agricultural Research, New Delhi foroffering critical comments and guidance during reviews. I extend my gratitude to Dr. A.K. Sikka, DeputyDirector General (Natural Resource Management) for his ideas and efforts throughout the year for thedevelopment of the Directorate and Network Project on Organic Farming (NPOF) in particular. The time totime guidance received from Dr B. Mohankumar, Assistant Director General (Agronomy and Agroforestry)is appreciable. Scientific inputs received from Quinquennial Review Team (QRT), Research AdvisoryCommittee (RAC) and Institute Management Committee (IMC) are thankfully acknowledged as thoseinputs provided immense help in taking new initiatives, shaping and improvement of the programme overthe period of time.
I am highly thankful to each and every one of the scientists and research fellows involved in the projectat 13 centres for taking the pain to conduct the field experiments, lab analysis and generating data. Thesincere efforts put forth by Dr. N. Ravisankar, Principal Scientist deserves appreciation for drafting andediting of the report. Thanks and appreciations are also due to Dr. Kamta Prasad, Programme Facilitator(Co-ordination Unit) for extending the cooperation in preparation of report. I extend my appreciation to Mr.K. P. Singh and Dr Vipin Kumar, Assistant Chief Technical Officer for their cooperation in compilation ofthe data, and its statistical analysis.
The contributions of all the other scientific, technical, administrative and skilled supporting staff eitherdirectly or indirectly at various levels during preparation of this report are also acknowledged. I am sure;the significant findings obtained from the experiments will go in a long way in preparation of policy guidelines.
(B. GANGWAR)Project Director


Network Project on Organic Farming
Annual Report 2012-13 v
CONTENTS
lkjka’k/ABSTRACT vii-viv
1. INTRODUCTION 1
2. OBJECTIVES AND METHODOLOGY 2
3. LOCATIONS 3
4. SOIL AND CLIMATE 4
5. MANPOWER 6
6. BUDGET 6
7. RESEARCH RESULTS 7
7.1 Evaluation of organic, inorganic and IM production system 77.2 Evaluation of various sources of organic inputs 457.3 Pest and disease management under organic farming 937.4 Weed management under organic farming 102
8. PUBLICATIONS AND HUMAN RESOURCE DEVELOPMENT 121
8.1 List of publications 1218.2 Human Resource Development 1228.3 Human Resource Development in organic farming (farmers) at Bhopal 1238.4 Human Resource Development in organic farming (technical) for students at Bhopal 123
9. APPENDIX 124
Details of crops and varieties used in experiment at various locations 124
10. ANNEXURES 127
Contact address of centers 127ACRONYMS 129


Network Project on Organic Farming
Annual Report 2012-13 vii
lkjka’kd`f"k iz.kkyh vuqla/kku ifj;kstuk funs’kky; esa tSfod [ksrh esa vuqla/kku gsrq usVodZ izkstsDV dh ’kq:vkr 2004&05esa dh x;h FkhA bl gsrq iwjs ns’k esa 12 izns’kksa esa fLFkr 13 dsUnzksa ij vuqla/kku fd;k tk jgk gS] rFkk d`0iz0vuq0ifj0funs’kky; leUo;u dsUnz dk dk;Z dj jgk gSA foxr vkB o"kksZ esa tSfod [ksrh ifj;kstuk esa dbZ egRoiw.kZ ’kks/k dk;Zgq, gSA o"kZ 2012&13 dh izeq[k ’kks/k miyfC/k;ksa dk lkjka’k fuEuor~ gSA
tSfod] jklk;fud vkSj ,dh—r izca/ku mRiknu iz.kkfy;kas dk lkis{k ewY;kadu
● ctkSjk esa ,dh—r izca/ku }kjk VekVj dh mYys[kuh; iSnkokj 4120 fdxzk@gSŒ ntZ dh xbZA blds vuqlj.k esadkcZfud i)fr ds rgr mit 3700 fdxzk@gSŒ ikbZ xbZA QwyxksHkh lerqY; mit lHkh esa ,dh—r izca/ku ds rgrvf/kd ntZ dh xbZA eDdk&yglqu iz.kkyh dh lerqY; mit 37701 fdxzk@gSŒ lcls vf/kd ntZ dh xbZA
● vdkcZfud iSdst dh rqyuk esa tSfod i)fr ds v/khu Hkksiky esa vf/kd mit ntZ dh xbZ tksfd 21-1] 10] 21-4] 60 vkSj 26-6% o`f) Øe’k% lsk;kchu] xsgw¡] ljlksa] puk vkSj vylh esa gksuk ik;k x;kA lks;kchu&puk vkSjlks;kchu&xsg¡w iz.kkyh vU; iz.kkyh;ks dh rqyuk esa csgrj gksuh ik;h x;hA
● dkyhdV esa vdkcZfud i)fr ds rgr vnjd ds izdUn dh vf/kd mit ntZ dh xbZ tcfd gYnh vkSj dkyhfepZ us ,dh—r izca/ku i)fr ds v/khu csgrj inZ’ku fd;kA vnjd dh mit esa Øe’k% vdkcZfud dh rqyukesa tSfod vkSj ,dh—r iSdst ds rgr 39-3 vkSj 21-8% deh ikbZ xbZA
● dks;EcVwj esa ewY;kadu dh xbZ lHkh Qlyksa us ,dh—r izca/ku ds v/khu vPNk izn’kZu fd;k] fepZ vkSj cSxau dksNksM+dj ftUgksaus vdkcZfud i)fr ds rgr vPNh mit ntZ dhA ,dh—r dh rqyuk es tSfod iSdst ds v/khumit esa fxjkoV Øe’k% lwjteq[kh] eDdk] cSxu] vkSj dikl ds fy;s 17-2] 18-1] 16-8 vkSj 12-7% gksuk i;k x;kAfofHkUu iz.kkyh;ksa esa dikl&eDdk&ewax ¼19260 fdxzk@gSŒ½ dikl cjkcj mit csgrj ikbZ xbZA
● vdkcZfud dh rqyuk esa tSfod iSdst ds lkFk mit es of) 36-9] 42-8] 46-5] 42] 27-2] 21-7] 51-9] vkSj 24-7% Øe’k%eDdk puk] eVj] eawxQyh] Tokj] vkyw lks;kchu vkSj xsgw¡ ds fy;s vf/kd gksuk ik;k x;k FkkA /kkjokM+ esaewaxQyh&lsk;kchu vkSj dikl$eVj iz.kkyh esa lcls vf/kd led{k mit Øe’k% 2896 vkSj 2430 fdxzk@gSŒ ntZdh xbZA
● tcyiqj esa tSfod vkSj ,dh—r iSdst ds lkFk cklerh pkoy esa mit dh deh Øe’k% 10-5 vkSj 5-3% gksuk ik;kx;kA cklerh pkoy leeqY; mit Øe’k% cklerh pkoy&lcth eVj&Tokj vkSj cklerh pkoy&xsgw¡&ewaxiz.kkyh esa 7074 vkSj 6656 fdxzk@gSŒ ds lkFk vU; iz.kkyh;ks dh rqyuk esa vf/kd ntZ dh xbZA
● djtV esa [kjhQ ds ekSle eas /kku dh iSnkokj lcls vf/kd vdkcZfud i)fr ds rgr ntZ dh xbZ ftlds ckn,dh—r izca/ku ds v/khu iSnkokj gqbZA ;gk¡ ij vdkcZfud dh rqyuk esa tSfod vkSj ,dh—r i)fr ds vUrZxriSnkokj esa Øe’k% 25-3 vkSj 14-9% dh fxjkoV ntZ dh xbZA pkoy&eawxQyh vkSj pkoy&Msyhdkl ¼lse gjhQyh½iz.kkyh lerqY; mit esa nwljksa ls csgrj gksuk ikbZ x;hA
● yqf/k;kuk esa puk] xsgw¡ vkSj xzh"e ewax dh mit ,dh—r i)fr ds rgr vf/kd mit ntZ dhA vdkcZfud dhrqyuk esa tSfod ds v/khu [kjhQ ds nkSjku eDdk vkSj gYnh esa 100 izfr’kr ls vf/kd o`f) ns[kh xbZA jch esacklerh pkoy dh mit esa dsoy 3-3% dh o`f) ntZ gqbZ tcfd eDdk esa 46-7% dh o`f) ntZ dh xbZA tSfodi)fr ds v/khu vdkcZfud dh rqyuk esa vkyw vkSj I;kt dh iSnkokj es Øe’k% 28-9 vkSj 40% dh o`f) ns[kh xbZA/kku lerqY; mit ds leca/k eas gYnh I;kt ¼7781 fdxzk@gSŒ½ vkSj cklerh /kku&xsgw¡&xzh"e ewax ¼5814fdxzk@gSŒ½ vU; iz.kkfy;ksa dh rqyuk esa csgrj ikbZ x;hA
● eksnhiqje esa foHkUu Qlyksa ds chp esa] cklerh /kku HkwVs ds fy;s] eDdk] ewax us tSfod iSdst ds rgr vf/kd mitntZ dh tcfd nkuks ds fy;s eDdk] vkyw] fHkUMh] tksa] ljlksa vkSj ewyh dh vis{kkd`r vf/kd mit ,dhd`r iSdstds rgr ntZ dh xbZA xsgw¡ dh mit esa 15% rd dh o`f) tSfod ds v/khu ikbZ xbZ tcfd 21% rd dh o`f)

Network Project on Organic Farming
Annual Report 2012-13viii
,dhd`r i)fr ds v/khu g¨uk ik;k x;k FkkA vdkcZfud dh rqyuk esa tSfod ds v/khu cklerh pkoy dh mites 20-3% dh o`f) ntZ dh x;hA eDdk&vkyw&fHk.Mh iz.kkyh us /kku lerqY; mit 29037 fdxzk@gSŒ vis{kkd`rvf/kd mit ntZ dh FkhA
● iaruxj eas [kjhQ ds nkSjku tSfod iSdst ds rgr cklerh pkoy dh mit eas 18-3% dh o`f) gqbZ FkhA ljlksadh mit ,dhd`r i)fr ds rgr 1992 fdxzk@gSŒ ntZ dh xbZ FkhA lCth eVj vkSj elwj us tSfod iSdst dsv/khu Øe’k% 6272 vkSj 1702 fdxzk@gSŒ ds lkFk csgrj iznZ’ku fd;k] mlds ckn ,dhd`r i)fr ds rgr Øe’k%5860 vkSj 1697 fdxzk@gSŒ dh mit ntZ dh FkhA cklerh /kku&lCtheVj&<Sapk dks NksM+dj vU; lHkh iz.kkfy;ksaeas tSfod i)fr ds vUrZxr vf/kd cklerh /kku lerqY; mit izkIr dh FkhA
● jk;iqj esa [kjhQ esa lks;kchu dh vkSlr iSnkokj ,dh—r i)fr ds v/khu 1223 fdxzk@gSŒ vis{kkd`r vf/kd ikbZxbZ blds ckn tSfod i)fr ¼1081 fdxzk@gSŒ½ rFkk vdkcZfud izca/ku i)fr ¼1064 fdxzk@gSŒ½ dk LFkku FkkAjk;iqj esa ftu vU; Qlyksa dk ewY;kadu fd;k x;k] muesa tSfod izca/ku ds v/khu cjlhe dh vf/kd iSnkokj ntZdh xbZ tcfd bZloxksy vkSj I;kt dh iSnkokj vdkcZfud i)fr ds v/khu vis{kkd`r vf/kd izkIr dh xbZA dqlqedh iSnkokj ,dh—r iSdst ds v/khu csgrj ikbZ xbZA lks;kchu lerqY; mit ds vUrZxr lks;kchu&cjlhe iz.kkyhus ,dh—r iSdst ds rgr vPNk izn’kZu fd;k tcfd lks;kchu&I;kt us vdkcZfud i)fr ds v/khu mPp lerqY;mit ntZ dh FkhA
● jk¡ph esa [kjhQ /kku dh tSfod i)fr ds v/khu vkSlru mit 4028 fdxzk@gSŒ izkIr dh xbZ tks fd ,dhd`rizca/ku ds rgr gqbZ iSnkokj dh rqyuk es 6-7% vf/kd rFkk vdkcZfud iSdt ds rgr iSnk dh xbZ mit ls15-8% vf/kd FkhA vdkcZfud dh rqyuk es tSfod ds v/khu 27-8 vkSj 6% vis{kkd`r vf/kd o`f) Øe’k% vkyw vkSjI;kt es ntZ dh FkhA /kku&vkyw iz.kkyh }kjk 12707 fdxzk0@gSŒ /kku lerqY; iSnkokj dj csgrj iznZ’ku gksukik;k x;k FkkA
● mfe;e esa jch ds nkSjku ,dhd`r izca/ku i)fr ds v/khu cksbZ xbZ xktj] vkyw] ÝSpachu vkSj VekVj tSlh lfCt;ksadh csgrj iSnkokj ntZ dh xbZ tks vdkcZfud dh rqyuk esa Øe’k% 69-9] 19-4] 28-4 vkSj 15-4% vf/kd FkhA vU;dh rqyuk esa /kku&QSpachu iz.kkyh us 19092 fdxzk@gSŒ dh nj ls mPp /kku cjkcj mit ntZ dh tcfd/kku&xktj us tSfod i)fr ds rgr mPp lerqY; mit izkIr dhA
iks"kd rRoksa gsrw fofHkUu tSfod lzksrks dk ewY;kadu
● ctkSjk esa xkscj dh [kkn$ck;ksMk;usfed$ipaxO; ds iz;ksx ls /kfu;k vkSj QwyxksHkh dh mit Øe’k% 5643 vkSj11150 fdxzk@gSŒ vf/kdre mit ntZ dhA eVj dh mPp mit xkscj dh [kkn$ck;ksMk;usfed$ipaxO; vdsysds lkFk ikbZ xbZ tks xkscj dh [kkn$ck;ksMk;usfed$ipaxO; dh rqyuk esa 96% vf/kd FkhA VekVj }kjk vf/kdremit jkWdQkLQsV le`) xkscj dh [kkn $oehZ dEiksjV ¼1%1½ ds iz;ksx }kjk ntZ dh xbZ Fkh tks xkscj dh[kkn$ck;ksMk;usfed vdsys dh rqyuk eas 25% vf/kd gksuk ik;k FkkA
● lks;kchu&xsgw¡ vkSj eDdk&puk iz.kkyh dh mit esa mYys[kuh; o`f) tSfod [kkn vdsys dh rqyuk esack;ksMk;usfed vkSj ipaxO; ds iz;ksx ds dkj.k ikbZ xbZ FkhA gk¡ykfd tSfod [kkn $ipaxO;$ck;ksMk;usfed dsla;qDr iz;ksx ls lHkh Qlyksa esa vf/kd mit ntZ dh xbZ rFkk tSfod [kkn vdsys dh rqyuk es 17] 411] 393 vkSj273 fdxzk@gSŒ vf/kd mit Hkksiky eas Øe’k% lks;kchu] xsgw¡] eDdk vkSj puk esa ntZ dh xbZA
● dkyhdV esa vnjd ds izdUn dh mYys[kuh; vf/kdre mit 7100 fdxzk@gSŒ xkscj dh [kkn$ipaxO;$jkWdQkLQsVds lkFk izkIr dh xbZ tks fd iw.kZ fu;U=.k i)fr ls 69-1% vf/kd gSA gYnh ds izdUn dh mYys[kuh; mit xkscjdh [kkn$uhe[kyh$2 oehZ dEiksLV$ipaxO;$ ck;ksMkusfed$jkWdQkLQsV ds lkFk 12150 fdxzk@gSŒ izkIr dhblds ckn mit xkscj dh [kkn $ck;ksMk;usfed$ipaxO;$jkWdQkLQsV ds lkFk 11800 fdxzk@gSŒ ns[kh xbZA
● dks;EcVwj esa xkscj dh [kkn$v[kk| [kyh$izR;sd vk/kk u=tu dh nj ij$ipaxO; ds ek/;e ls iks"kd rRoksadk iz;ksx djus ij dikl ¼1501½ eDdk ¼3569 fdxzk@gSŒ½] fepZ ¼4841 fdxzk@gSŒ½ vkSj lqjteq[kh ¼1369fdxzk@gSŒ½ vis{kkd‘r vf/kd iSnkokj nsus okyk ik;k x;kA ;gka ij lHkh Qlyksa ds fy;s xkscj dh [kkn$v[kk|[kyh izR;sd u=tu ds fy;s vk/kh nj ij vdsys esa cjkcjh ij FkhA

Network Project on Organic Farming
Annual Report 2012-13 ix
● /kkjokM esa mit esa le`) dEiksLV oehZ dEiksLV$gjh iÙkh;ks dh [kkn$ck;ksMk;usfed$ipaxO; Lizs djus ijfu;U;.k ds eqdkcys ewxaQyh] Tokj] eDdk vkSj puk es 50-7] 38-5] 69-3 vkSj 42-9% Øe’k% mit esa o`f) gksukik;k x;k FkkA fepZ ds leac/k esa le`) dEiksLV ¼Ã lh½$oehZ dEiksLV$gjh ifr;ks dh [kkn$ck;ksMk;usfed Lizs12 xzke izfr gSDsVs;j dh nj ls 741 fdxzk vis{kkd`r vf/kd mit gksuk ik;k x;k tcfd I;kt ds dUn dh mitbZ-lh-$oehZ dEiksLV$ gjh ifr;ks dh [kkn$ck;ksMk;usfed ds rgr vf/kd FkhA
● tcyiqj esa oehZ dEiksLV$xkscj dh [kkn$v[kk| [kyh izR;sd ,d frgkbZ u=tu$ipaxO; ds mi;ksx ls vukt dh vf/kdre iSnkokj ¼cklerh pkoy] xsgw¡ vkSj cjlhe cht Øe’k% 3743] 3700 vkSj 232 fdxzk-@gSŒ½ gqbZA foHkUu iz.kkfy;ksa dseè; cklerh pkoy dh mit] cklerh /kku&cjlhe ds lkFk ¼3325 fdxzk@gSŒ½ vf/kd gksuk ik;k x;k bldh rqyukes cklerh /kku&M;wje xsgw¡&gjh [kkn ds lkFk vukt dk mit 3280 fdxzk@gSŒ gksuh ik;h x;hA
● djtV esa /kku&yky dn~nw vkSj /kku&ddMh iz.kkyh us xkscj dh [kkn$/kku dk Hkwlk$ykbfjlhfM;k iÙkh;kizR;sd ,d frgkbZ u=tu dh nj ls mi;ksx djus ij [kjhQ es vf/kd mit ntZ dh xbZ vkSj jch esa xkscj dh[kkn$uhe [kyh$oehZ dEiksLV izR;sd ,d frgkbZ dh nj ls ds lkFk&lkFk ipaxO; fNMdkWo dk iz;ksx djus ij/kku vkSj yky dn~nw rFkk /kku vkSj ddMh dh mit Øe’k% 3565] 13094 fdxzk@gSŒ vkSj 3735] o 11649fdxzk@gSŒ ntZ dh xbZ FkhA
● yqf/k;kuk esa xkscj dh [kkn$ipaxO;$ck;ksMk;usfed i)fr dk iz;ksx djus ij eDdk ds nkus dh vis{kkd`rvf/kdre mit 5877 fdxzk@gSŒ ntZ dh xbZ tcfd xsgw¡ esa mPp mit 3300 fdxzk@gSŒ xkscj dh [kkn$ck;ksMk;usfedds iz;ksx djus ij izkIr gqbZA ipaxO; ds lkFk xkscj dh [kkn feykus vFkok ck;ksMk;usfed i)fr;ksa dh rqyukesa xehZ;ksa esa ewax dh vf/kd iSnkokj djus ds fy;s dsoy xkscj dh [kkn i;kZIr FkhA
● irauxj esa xkscj dh [kkn$oehZ dEiksDV$,ulh$bZlh ds mi;ksx dh rqyuk esa xkscj dh [kkn $oehZdEiksLV$,ulh$bZlh izR;sd ,d pkSFkkbZ dh nj ls $ck;ksMk;usfed$ipaxO; ds mi;ksx ls cklerh /kku dhiSnkokj esa 180 fdxzk@gSŒ vis{kkd`r o`f) ikbZ xbZA lCth eVj esa 8955 fdxzk-@gSŒ dh mYys[kuh; mit xkscjdh [kkn$oehZ dEiksLV $,u lh $bZ lh izR;sd dh nj ls$ck;ksMk;usfed$ipaxO; ds lkFk ntZ dh xbZ FkhA
● jk;iqj esa ;|fi /kku dh vf/kdrere mit ¼4256 fdxzk-@gSŒ½ vkSj puk ¼1375 fdxzk@gSaŒ½ ck;ksMk;usfed$le)dEiksLV$xk; dh xkscj dh [kkn ¼lhMh,e½$v[kk| [kyh izR;sd ,d frgkbZ ds u=tu dh nj ls$ipaxO; dsiz;ksx djus ij ntZ dh xbZ Fkh rFkkfi bZlh$lhMh ,e$,ubZvkslh izR;sd ds ,d frgkbZ u=tu dh nj ls$ipaxO;vkSj bZlh$ lhMh,e$,ubZvkslh izR;sd ds ,d frgkbZ u=tu dh nj ls vdsys /kku&puk iz.kkyh esa nksuksa Qlyksads fy;s iSnkokj cjkcjh ij ntZ gqà FkhA
● jkWph esa dspqvk ckn [kkn fdjat [kyh$ck;ksMk;usfed fofufeZr inkFkZ$ipaxO; ds lkFk lHkh Qlyksa dh vf/kdiSnkokj tSls /kku] xsgw¡ vkSj vkyw Øe’k% 4270] 2332 vkSj 6967 fdxzk@gSŒ ntZ dh xbZA
● xkscj dh [kkn$dspqvk [kkn$ipaxO; ds mi;ksx ls vukt vkSj gjh xqYyh ds fy;s eDdk ¼Øe’k% 3677 vkSj 713fdxzk@gSŒ½ vkSj QSpachu ¼1240 fdxzk@gSŒ½ dh vf/kd iSnkokj ntZ dh xbZA fdUrq xkscj dh [kkn$oehZ dEiksLVvdsys iz;ksx djus ij mit cjkcjh ij FkhA
tSfod [ksrh es dhV vkSj jksx izca/ku
● ctkSjk% VekVj esa Qy Nsnd vkSj Qy lM+u dk izdksi fyisy ¼cslsyl Fkqzutsufll 1-0 fdyksxzke izfr gSDVs;jdh nj ls iz;ksx djus ij fu;U=.k dh rqyuk esa de Fkk [kjhQ es VekVj dh vf/kd mit ¼10597 fdxzk@gSŒ½fyisy ¼Fkqzutsufll mitkfr dqjlrkfd] 1-0 fdxzk@gSŒ ds iz;ksx ls fl) gqbZ Fkh rFkk Msjsd ¼,e- ,tsMk vkdZ2-5% ,Doa;l yhQ ,DlVªDV ¼,,ybZ½$dkjoh ¼jk;ysflusfj;k½ 2-5% dh nj ls , ,y bZ$xksew= ¼3%½ ds fo’ks"kbykt ds :i es QyNsnd 1-65% o vU; dkjd 18-2% de ?kVuk gksuk ik;k x;k FkkA ftl dkj.k QyNsnd]QylM+u o vU; dkjd ds lkFk Hkh mit esa deh ugha ntZ gks ikbZ FkhA
● dkyhdV esa vnjd vUr% ikni thok.kq ¼thbZ ch 18 vkSj vkbZvkbZ,lvkj 6] 8] 13] 51] 151 vkSj ihch 21 vkSjih1 ,vkj 6 dYpj½ vkSj vnjd jkbtkscSDVhfj;k ds lkFk iw.kZ fu;U=.k dh rqyuk esa cuk Nsnd dk izdksi deFkk blls dkyhdV esa 68-2] 64-6 vkSj 59-2% dh Øe’k% izdksi esa deh ns[kh xbZA
Network Project on Organic Farming
Annual Report 2012-13x
● eksnhiqje esa xzh"e tqrkbZ vkSj gjh [kkn vuqipkfjr Hkw[k.Mksa dh rqyuk esa mu Hkw[k.Mksa esa ftuesa xzh"e tqrkbZ vkSjgjh [kkn ’kkfey dh xbZ Fkh esa cklerh /kku Øe’k% 3450 vkSj 3860 fdxzk@gSŒ] puk 963 vkSj 1297 fdxzk@gSŒrFkk ljlksa 712 vkSj 977 fdxzk@gSŒ dh vis{kkd`r vf/kd iSnkokj ntZ dh xbZA
● mfe;e ls eDdk dh vkjfEHkd voLFkk esa Msjhlkse 3 feyh-@yhVj$10% dh nj ls ipaxO; vkSj 3% dh nj lsxksew= ds mi;ksx ls eksuksysIVk ¼0-47%½ ekbyks lsjl ¼0-93%½ vkSj yhQ QksYMj ¼0-40%½ ds de ekeys ik;s x;stcfd ,fiyspuk ¼0-20%½ dh ?kVuk,s ipaxO; 3% dh nj ls $ykWuVkuk 10%$oehZ ok’k 10% ds mi;ksa ls degksuh ikbZ xbZA lks;kchu jLV es ipaxO; 3% dh nj ls$ykuVkuk 10% dh nj ls $oehZ ok’k 10% dh nj dsmi;ksx djus ij 29-7% ds Lrj rd fu;f=r gksuk ik;k x;k FkkA
tSfod [ksrh ds v/khu [kjirokj fu;U=.k
● dks;EcVwj esa pkoy vkSj mM+n nksuksa esa [kjirokj eqDr fLFkfr esa vis{kkd`r vf/kd iSnkokj ¼Øe’k% 4213 vkSj 863fdxzk@gSŒ½ ntZ dh xbZ blds ckn nks gkFk fujkbZ$[kjirokj dh 3&4 iÙkh dh voLFkk ij ,sfDo;l iÙkh lRrds Lizs ds l;ksatu }kjk ml [k.M esa rqyuk esa] tgka [kjirokj fu;af=r ugha dh xbZ Fkh esa pkoy vkSj mM+n dhiSnkokj es 88 vkSj 163% dh o`f) ntZ dh xbZA
● /kkjokM esa dsfl;k vkSj izkslksfil twyh¶yksjk dk ,fDo;l fNMdkWo [kjirokj mxus ds ckn ¼i¨LV bejtsUl½ vkSjiwoZ mxus ¼izh bejtsUl½ ikjFksfu;e vuqi;¨x ds r©j ij vf/kd izHkkoh ik;k x;k FkkA ,fDo;l iÙkh ds lRr dktyh; fNM+dko iwoZ mxus ¼izh bejtsUl½ dh rqyuk esa i¨LV bejtsUl ij vf/kd izHkkoh FkkA
● tcyiqj esa [kjirokj eqDr fLFkfr esa /kku ¼4584 fdxzk@gSŒ½ vkSj xsgw¡ ¼4351 fdxzk@gSŒ½ dh vis{kkd`r vf/kdiSnkokj ntZ dh xbZA blds ckn nks fujkbZ gkFk ls [kjirokj dh $ 3&4 iÙkh dh voLFkk ij fNMdko ds la;kstuls /kku vkSj xsgw¡ dh Øe’k% 108 vkSj 181% vf/kd vukt dh mit tgka [kjirokj fu;af=r ugha fd;k x;k Fkkdh rqyuk esa ntZ dh FkhA
● yqf/k;kuk esa vf/kd /kuRo jksi.k$25&30 fnu jksi.k mijkUr gkFk dh fujkbZ ls [kjirokj ds dqy ’kq"dotu¼8-1 xzke@oxZ ehVj½ es vf/kdre deh ntZ dh xbZ tks 25&30 fnu o 40&45 fnu cqvkbZ mijkUr rFkk oxZjksi.k$ohMj ds lkFk cjkcjh ij FkkA
● iaruxj esa rhuksa iz.kkyh;ksa esa 25&30 fnu jksi.k ckn ,d fxjkbZ gkFk }kjk [kjhQ esa rFkk nks fujkbZ 25&30 fnuvkSj 40&45 jksi.k ckn djus ij /kkl vkSj izr`.k dh fxurh esa jch ds nkSjku mys[kuh; deh ik;h x;hA Qlyiz.kkfy;ks ds ml ikj] dqy /kkl vkSj izr`.k rFkk pkSMh iÙkh okys [krirokj es 90-6 vkSj 77-2% dh deh Øe’k%,d fujkbZ gkFk }kjk [kjhQ es vkSj nks fujkbZ gkFk }kjk jch es djus ij ik;h x;h FkhA
● jk;iqj esa dqy [kjirokj dh fxurh esa 68 izfr’kr dh deh oxZ jksi.k o dksuksohMj ds iz;ksx ls ns[kh xbZ tcfdljlksa es nks fujkbZ gkFk }kjk 25&30 vkSj 40&45 fnu jksikbZ ds ckn djus ij 85% dh deh ikbZ xbZ Fkh A
● jkWph esa nksuksa iz.kkyh;ksa esa [kjirokj ds ’kq"dotu esa mYys[kuh; deh nks fujkbZ gkFk ls 25 vkSj 40 fnujksiM@cqvkbZ ds ckn djus ij rFkk ,fDo;e iRrh ds lRr ds fNM+dko ds lkFk ntZ dh xbZA ,d vkSlr ds rkSjij [kjirokj jfgr dh rqyuk esa /kku esa 87-2% xsgw¡ esa 77-7% vkSj vylh esa 83-5% dh deh ikbZ xbZA vdsys,fDc;l iRrh ds lÙk ds fNM+dko ls /kku] xsgw¡ vkSj vylh esa Øe’k% 34-8] 42-6 vkSj 51-1% rd dh deh ntZdh xbZA
● eDdk ¼gjs HkwÍs okyh½ vkSj ljlksa dh vf/kdre mit] rkts ;wiSVkasfj;e ,eczksfl;k 10 Vu@gSŒ dh nj ls¼Hkwl;kstu ds ckn½ ds lkFk izkIr dh FkhA blds ckn ysUVkuk ds ,fDo;l iÙkh ds lRr ds vkSj ikbZu iztkfr ds[kjirokj dh 3&4 iÙkh dh voLFkk ij Lizs djus ds lkFk dh mfe;e eas rkts ;wiSVksfjne@,czksfl;k dks iyokjusls [kjirokj eqDr vkSj [kjirokj fu;f=r dh rqyuk es Øe’k% eDdk esa 19-4% vkSj 29-8% vkSj ljlks esa 39-5vkSj 66-8% dh o`f) ikbZ xbZ FkhA

Network Project on Organic Farming
Annual Report 2012-13 xi
ABSTRACTNetwork Project on Organic Farming (NPOF) started in 2004-05 with 13 co-operating centres covering 12states. The salient research achievements during the year are presented below:
Evaluation of organic, inorganic and Integrated Management (IM) production system
● Tomato recorded higher yield under integrated (4120 kg ha-1) followed by organic (3700 kg ha-1). Interms of cauliflower equivalent yield, all the systems registered higher yield under integrated package.Among the systems evaluated, maize-garlic registered significantly higher equivalent yield of 37701kg ha-1 at Bajaura.
● Soybean, wheat, mustard, chickpea and linseed recorded significantly higher yield with organic packagecompared to inorganic and the yield increase was found to be 21.1, 10, 21.4, 60 and 26.6% respectively.Among the systems, soybean chickpea (1916 kg ha-1) and soybean-wheat (1830 kg ha-1) was found tobe better than other systems at Bhopal.
● At Calicut, Ginger recorded higher rhizome yield under inorganic package while turmeric and blackpepper performed better under integrated package. The yield reduction in ginger was found to be39.3% and 21.8% under organic and integrated package compared to inorganic respectively.
● At Coimbatore, all the crops evaluated performed better under integrated package except chilli andbrinjal which recorded higher yield under inorganic package. The drop in yield under organic packageover integrated was found to be 17.2, 18.1, 16.8 and 12.7% for sunflower, maize, brinjal and cottonrespectively. Among the systems, cotton-maize-green gram was found to be better (19260 kg ha-1).
● The yield increase with organic was found to be 36.9, 42.8, 46.5, 42.0, 27.2, 21.7, 51.9 and 24.7% formaize, chickpea, pea, groundnut, sorghum, potato, soybean and wheat respectively over inorganic.Groundnut-sorghum and cotton+pea registered higher maize equivalent yield (2896 and 2340 kg ha-1
respectively) at Dharwad.
● At Jabalpur, the reduction of yield in basmati rice with organic and integrated package was found to be10.5 and 5.3% respectively. Basmati rice-vegetable pea-sorghum and basmati rice-wheat-green gramrecorded higher basmati rice equivalent yield of 7074 and 6656 kg ha-1 respectively than other systems.
● Kharif rice registered significantly higher yield under inorganic followed by integrated package. Yielddrop observed with organic and integrated package was found to be 25.3 and 14.9% respectively.Rice-groundnut and rice-delichous bean (for green pod) was found to be better than others at Karjatin term of rice equivalent yield.
● Gram, wheat and summer moong registered higher yield under integrated package at Ludhiana.More than 100% increase in yield under organic over inorganic was observed in cotton and turmericduring kharif. Basmati rice recorded only 3.3% increase whereas maize recorded 46.7%. In rabi, anincrease in yield of onion and potato by 28.9 and 40% under organic over inorganic package wasobserved. In term of basmati rice equivalent yield, turmeric-onion (7781 kg ha-1) and basmati rice-wheat summer moong (5814 kg ha-1) was found to be better than other systems.
● Among the various crops in the systems at Modipuram, basmati rice, maize for cob and green gramrecorded higher yield under organic system while maize for grain, potato, okra, barley, mustard andradish have recorded higher yield under integrated package. Wheat registered increase in yield to thetune of 15% with organic package while, the increase was found to be 21% under integrated. Basmati

Network Project on Organic Farming
Annual Report 2012-13xii
rice recorded 20.3% higher yield under organic compared to inorganic package. Maize-potato-okrasystem recorded higher basmati rice equivalent yield of 29037 kg ha-1.
● At Pantnagar, the yield increase of basmati rice during kharif under organic package over inorganicwas 18.3%. Brassica napus recorded higher yield (1992 kg ha-1) under integrated package. Vegetablepea and lentil performed better (6272 and 1702 kg ha-1) under organic followed by integrated (5864 and1697 kg ha-1). In term of basmati rice equivalent yield, all the systems recorded higher yield underorganic except basmati rice-vegetable pea-sesbania system. Basmati rice-lentil-sesbania (GM)recorded higher basmati rice equivalent yield (8898 kg ha-1) among the systems.
● Mean yield of soybean in kharif was found to be higher under integrated package (1223 kg ha-1) followedby organic (1081 kg ha-1) and inorganic (1064 kg ha-1). Among the other crops evaluated, berseemregistered higher yield under organic package while isabgol and onion registered higher yield underinorganic package. Safflower performed better under integrated package. In term of soybean equivalentyield, soybean-berseem was found to be better under integrated while soybean-onion recorded higherequivalent yield under inorganic package at Raipur.
● Rice recorded higher mean grain yield of 4028 kg ha-1 during kharif under organic package which is6.7% higher than integrated package and 15.8% higher than inorganic. Potato and linseed recorded27.8 and 6% increase in yield under organic over inorganic package. Rice-potato was found to bebetter in term of rice equivalent yield (12707 kg ha-1) at Ranchi.
● All the vegetables crops like, carrot, potato, frenchbean and tomato recorded 69.9, 19.4, 24.8 and15.4% higher yield with integrated over inorganic package, Among the systems, rice-frenchbean systemsrecorded higher rice equivalent yield (19092 kg ha-1) while rice-carrot system recorded higher yieldunder organic package at Umiam.
Evaluation of source of nutrients for organic package
● At Bajaura, application of FYM+biodynamic+panchgavya recorded higher yield of coriander (5463 kgha-1) and cauliflower (11150 kg ha-1). The higher yield of pea was observed with FYM+BD alone, itsincrease over FYM+BD+Panchagvya was 96 %. Tomato recorded higher yield under rock phosphateenriched FYM+VC (1:1) application and the increase over FYM+BD alone was found to be 25%.
● The yield increase due to biodynamic and panchgavya practice over organic manure alone was foundto be significant in soybean-wheat and maize-chickpea systems. However, combined application ofOM+PG+BD registered higher yield in all crops and the yield increase over organic manure alone wasfound to be 17, 411, 393 and 273 kg ha-1 in soybean, wheat, maize and chickpea respectively atBhopal.
● At Calicut, significantly higher rhizome yield of ginger (7100 kg ha-1) was observed with FYM+PG+RPwhich is 69.1% higher than absolute control.. Significantly higher rhizome yield of turmeric was observedwith FYM+NC+2VC+PG+BD+RP (12150 kg ha-1) followed by FYM+BD+PG+RP (11800 kg ha-1).
● Application of nutrient through FYM+NEOC @ ½ N each+ panchgavya gave higher yield of cotton(1501 kg ha-1), maize (3569 kgha-1), chillies (4841 kg ha-1) and sunflower (1369 kg ha-1) which was onpar with FYM + NEOC @ ½ N each alone for all the crops at Coimbatore.
● The yield increase in EC+VC+GLM+biodynamic+Panchgavya spray was found to be 50.7, 38.5, 69.3and 42.9% in groundnut, sorghum, maize and chickpea respectively over control. In case of chilli,EC+VC+GLM+biodynamic spray @ 12g ha-1 registered higher yield of 741 kg ha-1 while in onion higherbulb yield was obtained with EC+VC+GLM+biodynamic (741kg ha-1) at Dharwad.

Network Project on Organic Farming
Annual Report 2012-13 xiii
● Application of nutrients through VC+FYM+NEOF @ 1/3 N each+Panchgavya recorded higher grainyield (3743, 3700 and 232 kg of basmati rice, wheat and berseem seed ha-1) followed by VC + FYM +NEOF @ 1/3 N each. Among the systems, grain yield of basmati rice obtained with basmati rice-berseem was found to be higher (3325 kg ha-1) compared to basmati rice-duram wheat-green manure(3280 kg ha-1) at Jabalpur.
● At Karjat, rice-red pumpkin and rice-cucumber systems have recorded higher yield with application ofFYM+rice straw+ lyricidia leaves @ 1/3rd each of N during kharif and FYM + neem cake + vermicompost@ 1/3 each of N during rabi along with spray of Panchgavya (3565, 13094 kg ha-1 of rice-red pumpkinand 3735, 11649 kg ha-1 of rice-cucumber respectively).
● At Ludhiana, application of FYM+panchgavya+biodynamic packages recorded higher grain yield ofmaize (5877 kg ha-1), while in wheat FYM+BD recorded higher yield (3300 kg ha-1). Application of FYMalone was sufficient in summer moong to realize higher yield compared to combining FYM with PG orbiodynamic practices.
● Application of FYM+VC+NC+EC @ ¼ N each +BD+Panchgavya recorded an increase in yield to thetune of 180 kg ha-1 in basmati rice compared to application of FYM+VC+NC+EC alone. Significantlyhigher yield of 8955 kg ha-1 in vegetable pea was recorded with FYM+VC+NC+EC @ ¼ Neach+BD+Panchagavya at Pantnagar.
● At Raipur, though application of biodynamic practice + EC + CDM + NEOC @ 1/3 N each + PGrecorded higher yield of rice (4256 kg ha-1) and chickpea (1375 kg ha-1), it was at par with applicationof + EC + CDM + NEOC @ 1/3 N each + PG and EC + CDM + NEOC @ 1/3 N each alone in both thecrops of rice-chickpea system.
● At Ranchi, all the crops recorded higher yield with Vermicompost+KC+biodynamic preparation +PG(4270, 2332 and 6967 kg ha-1 in rice, wheat potato respectively).
● Application of FYM+VC+PG recorded numerically higher yield in maize for grain and green cobs (713kg ha-1) and frenchbean (1240 kg ha-1) respectively but the same was on par with application of FYM+VCalone at Umiam.
Pest and disease management under organic farming
● Infestation of fruit borer and fruit rot in tomato was lower in application of lipel (Bacillus thuringiensissub sp. kurstaki) @ 1 kg ha-1. Compared to control, higher tomato yield of 10597 kg ha-1 was realizedwith application of Lipel (Bacillus thuringiensis sub sp. kurstaki) @ 1 kg/ha in Kharif and Darek (M.azedarach (2.5% ALE) + karvi (Roylea cinerea) @ 2.5% aqueous leaf extract+cow urine (3%) as thisparticular treatment recorded lower incidence of all (fruit borer: 1.63%, other factors 18.2%) and yieldloss due to fruit borer, fruit rot and other factors were also less at Bajaura.
● Shoot borer infestation in ginger was lower with ginger endophytic bacteria (GEB 18 and IISR 6,51,853, Pb21 and P1AR6 cultures) and ginger rhizobacteria (GRB 58) compared to absolute control.The reduction in infestation was observed to be 68.2, 64.6 and 59.2% respectively at Calicut.
● At Modipuram, summer ploughing and green manure incorporated plots recorded higher grain yieldof basmati rice (3450 and 3860 kg ha-1respectively) chick pea (963 and 1297 kg ha-1 ) and mustard(772 and 977 kg ha-1) compared to untreated plots of summers ploughing and green manure.
● Application of derisom (3 ml/l) +panchagavya @ 10% and cow urine 3% recorded lower incidence ofmonolapta (0.47%), mylloceros (0.93%) and leaf folder (0.40%) in early stage of maize while epilechnaincidence (0.20%) was found to be reduced through application of panchagavya @ 3%+ lantana 10%

Network Project on Organic Farming
Annual Report 2012-13xiv
+vermi wash 10%. Soybean rust was found to be controlled to the level of 29.7% with the applicationof panchagavya @ 3% +lantana @ 10% +vermiwash @ 10% at Umiam.
Weed management under organic farming
● At Coimbatore, in both rice and blackgram higher yield (4213 and 863 kg ha-1 respectively) recordedunder weed free condition followed by combination of two hand weeding+spray of aqueous leaf extractat 3-4 leaf stage of weeds which recorded 88 and 163% increase in yield of rice and blackgram overun-weeded control.
● Aqueous spray of cassia and prosopis juliflora as post emergent was found to be more effective thanpre or post emergence application of parthenium. Post emergence spray of aqueous leaf extract wasfound to be better than pre emergence application at Dharwad
● At Jabalpur weed free recorded higher grain yield of rice (4584 kg ha-1) and wheat (4351 kg ha-1)followed by combination of two hand weeding + spray at 3-4 leaf stage of weeds which recorded 108and 181% higher grain yield of rice and wheat respectively compared to Unwedded check
● High density planting + hand weeding at 25-30 DAT recorded maximum reduction of total dry weight ofweeds (8.1 gm-2) which was on par with hand weeding at 25-30 DAT and 45-50 DAT and squareplanting + weeder in rice at Ludhiana.
● Grasses and sedges count during kharif and broad leaved weeds count during rabi was found to besignificantly lower in all the three systems with one hand weeding at 25-30 DAT during kharif and 2hand weeding at 25-30 and 45-50 DAS during rabi. Across the cropping systems, the reduction of totalgrasses & sedges and broad leaved weeds was found to be 90.6 and 77.2 % respectively due to 1hand weeding during kharif and 2 hands weeding during rabi at Pantnagar.
● Maximum reduction in total weed count was observed with use of conoweeder with square planting in68% in rice while in mustard it was found 85% with 2 hand weeding at 25-30 and 45-50 at Raipur.
● At Ranchi two hand hoeing at 25 and 40 DAS/DAT with use of aqueous leaf extract registeredsignificantly lower weed dry weight in both the system. (On an average reduction of 87.2% in rice,77.7% in wheat and 83.5% in linseed compared to unweeded control). Spray of aqueous leaf extractalone recorded reduction in yield to the tune of 34.8%, 42.6% and 51.1% in rice, wheat and linseedrespectively.
● In both maize (green cobs) and mustard, mulching with fresh eupatorium ambrosia @ 10 t ha-1 (afterearthing up) recorded higher yield followed by aqueous leaf extract spray of lantana and pine spp. at 3-4 leaf stage of weed. The increase in yield under mulching with fresh Eupatorium/Ambrosia was foundto be 19.4 and 29.8% in maize and 39.5 and 66.8% in mustard over weed free and weedy checksrespectively at Umiam.

Network Project on Organic Farming
Annual Report 2012-13 1
1. INTRODUCTION
Organic agriculture is a production system, which avoids or largely excludes the use of syntheticcompounded fertilizers, pesticides, growth regulators and livestock feed additives. To the maximumextent possible, organic farming system relies on crop rotations, crop residues, animal manures, legumes,green manures, off-farm organic wastes and aspects of biological pest control to maintain soil productivityand tilth, to supply plant nutrients and to control insects, weeds and other pests.
Organic farming systems offer some solutions to the problems, currently besetting the agriculturalsector of industrialized/ green revolution countries. The broader aims of organic farming are; sustainabilityof natural resource, minimizing cost of cultivation, providing healthy food, augmentation of farm profitsand improving soil health. Although, in the market place to provide clarity on the organic claim the organicagriculture requires certification, but broadly speaking, any system using the methods of organic agricultureand being based on four basic principles – the principle of health, the principle of ecology, the principle offairness, and the principle of care; may be classified as organic agriculture.
Presently, organic agriculture is practiced in 162 countries and 37 m ha of land are managed organicallyby 1.8 million farm households. The global sales of organic food and drink reached 62.9 billion US dollorsin 2011. The regions with the largest areas of organically managed agricultural land are Oceania (12.1million hectares of 33 percent of the global organic farmland), Europe (10.6 million hectares or 29 percentof the global organic farmland) and Latin America (6.8 million hectares or 23 percent). On a global level,the organic agricultural land area increased by three percent compared with 2010. The countries with themost organic agricultural land are Australia (12 million hectares), Argentina (3.8 million hectares) and theUnited States (1.9 million hectares). The highest shares of organic agricultural land are in the FalklandIslands (35.9 percent), Liechtenstein (29.3 percent) and Austria (19.7 percent). The countries with thehighest numbers of producers are India, Uganda and Mexico. India has traditionally been a country oforganic agriculture, but the growth of modern scientific, input intensive agriculture has pushed it to wall.But with the increasing awareness about the safety and quality of foods, long term sustainability of thesystem and accumulating evidences of being equally productive, the organic farming has emerged as analternative system of farming which not only addresses the quality and sustainability concerns, but alsoensures a profitable livelihood option. Emerging from 42,000 ha under certified organic farming during2003-04, the organic agriculture has grown almost 29 fold during the last 5 years. By March 2010 India,has brought more than 4.54 million ha area under organic certification process. Out of this cultivated areaaccounts for 1.18 million ha while remaining 3.36 million ha is wild forest harvest collection area.
In order to develop a package of practices for organic farming including plant protection in a systemmode, a Network Project on Organic Farming (NPOF) was initiated during 2004-05 by Indian Council ofAgricultural Research (ICAR), New Delhi with Project Directorate for Farming Systems Research (PDFSR)as lead centre. In order to bring out the packages comprising of nutrient, pest and disease managementin various crops and cropping systems, four experiments were conducted during the year at 13 locations(refer front cover). The objectives along with significant findings of all the experiments are presented in thesubsequent sections.

Network Project on Organic Farming
Annual Report 2012-132
2. OBJECTIVES AND METHODOLOGY
Objectives
●●●●● To study productivity, profitability, sustainability, quality and input-use-efficiencies of different cropsand cropping systems under organic farming in different agro-ecological regions
●●●●● To develop efficient crop and soil management options for organic farming
●●●●● To develop need-based cost-effective new techniques for farm-waste recycling
Methodology
The experiments in the project have been designed mainly to evaluate the relative performance oflocation-specific, important cropping systems under organic and conventional (chemical) farming, andassess agronomic efficiency of different organic inputs, especially organic manures and bio-agents.Cropping systems, which are under evaluation, involve cereal crops (mainly basmati rice, durum andaestivum wheats, sorghum and maize), pulses and oilseeds (chickpea, lentil, green gram, soybean,mustard, and groundnut), spices (black pepper, ginger, turmeric, chillies, onion, and garlic), fruits (papaya,and mango), vegetables (potato, okra, baby corn, cowpea, pea, tomato, and cauliflower), cotton, foddercrops (sorghum, maize, pearl millet, oat, cow pea and berseem), and medicinal plants (Isabgol andmentha). The details of varieties used in the experimentation at each centre is given in appendix. During2011-12, following four experiments were undertaken at different centers:
I. Evaluation of different production system in various cropping systems on soil health, crop productivity,quality and profitability
II. Management of soil fertility using various organic inputs in prominent cropping systems
III. Pest and disease management in cropping system under organic farming
IV. Weed management in cropping system under organic farming
The treatment details of each experiment at various locations are presented in chapter 7 at respectivetables. General guidelines and standards for organic production, as suggested under National Standardsfor Organic Production (NSOP), formed as the basis for raising the experimental crops in the project. Acompact block of land has been earmarked at each of the cooperating centres for experimental purpose,as far as possible. The plot identified was in general, free from hazards of erosion, sediments, chemicalpollutants and contaminants. Shelterbelts have been developed by planting multi-purpose trees/shrubsetc. such as Subabul, Sesbania spp. etc. around the field. The individual centre has been advised toselect organic sources of nutrients depending upon the local availability and also in suitable combination(s)to fulfill the entire requirement of nitrogen and 80-90% requirement of phosphorus and potassium for eachcropping system. Cooperating centers have also been advised that each centre should select only thosecrops for organic farming research in which effective organic (non-chemical) measures are available forplant protection to avoid failure of crops at later stages. Bulky manure were prepared within the premisesof cooperating centres under the project itself or under any other project going on at university/institute/centre in order to ensure proper quality of inputs. Inputs related to plant protection, bio-fertilizers etc areprocured from reliable sources only. Adequate care has also been taken by the centres that seeds purchasedfrom outside are not treated with any chemical seed dresser.

Network Project on Organic Farming
Annual Report 2012-13 3
3. LOCATION
Multi-location experiments were conducted during 2011-12 at 13 research centers of SAUs/ ICARInstitutes. The details of centres are given below in the order of results presented in the chapter 7.
Sl. No. State Name of SAU/ICAR institute Location of centre
1. Uttar Pradesh Project Directorate for Farming ModipuramSystems Research, Modipuram,Meerut -250 110
2. Madhya Pradesh Jawaharlal Nehru Krishi Viswa JabalpurVidyalaya, Jabalpur-482 004
3. Tamil Nadu Tamil Nadu Agricultural CoimbatoreUniversity, Coimbatore – 641 003
4. Chhattisgarh Indira Gandhi Krishi RaipurVishwavidyalaya, Raipur-492 012
5. Kerala Indian Institute of Spices CalicutResearch, P.B. No. 1701,Marikunnu PO, Calicut – 673 012
6. Karnataka University of Agricultural DharwadSciences, Yettinagudda Campus,Krishinagar, Dharwad-580 005
7. Maharashtra Dr. Balasaheb Sawant Konkan KarjatKrishi Vidypeeth, RARS,Karjat, Dist. Raigad – 410 201
8. Punjab Punjab Agricultural University, LudhianaLudhiana-141 004
9. Himachal Pradesh CSK HPKVV, Hill Agri. Res. & BajauraExtn. Centre, Bajaura-175 125
10. Madhya Pradesh Indian Institute of Soil Science, BhopalNabi Bagh, Berasia Road,Bhopal – 462 038
11. Uttarakhand G.B.P.University of Agriculture Pantnagarand Technology, Pantnagar,Udham Singh Nagar – 263 145
12. Jharkand Birsa Agricultural University, RanchiKanke, Ranchi – 834 006
13. Meghalaya ICAR Research Complex for UmiamNEH Region, Umiam – 737 102
Network Project on Organic Farming
Annual Report 2012-134
4. SOIL AND CLIMATE
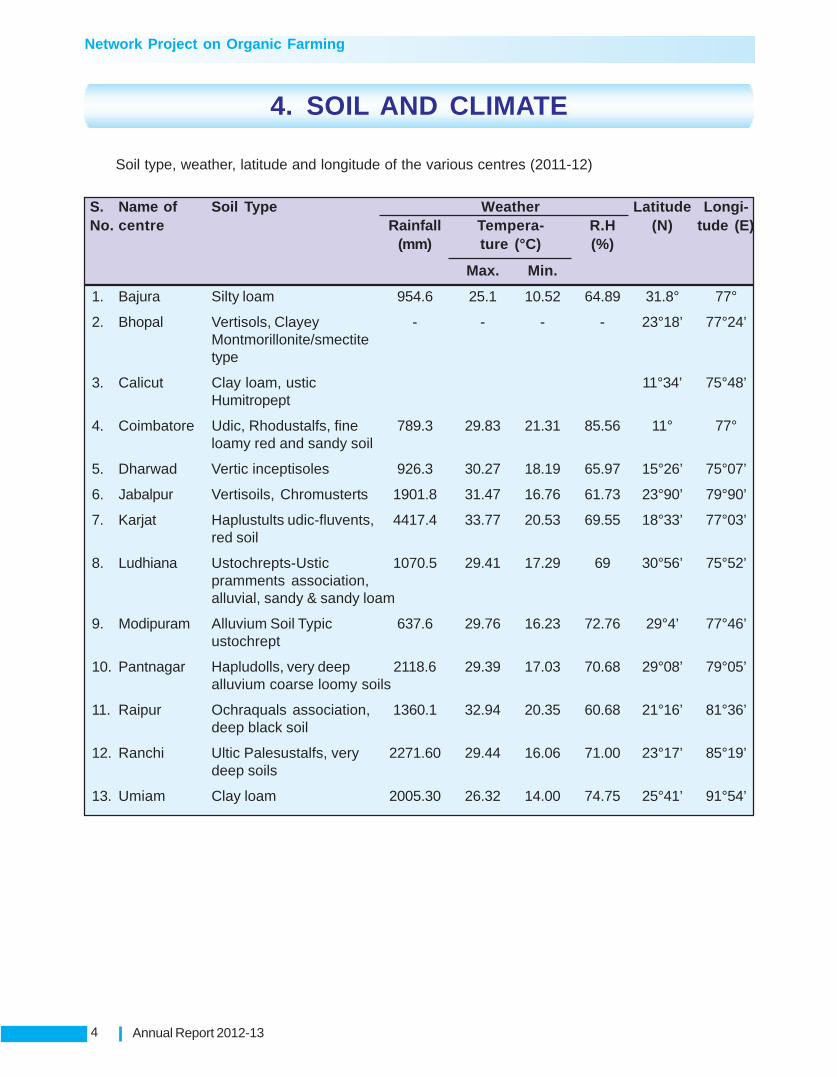
Soil type, weather, latitude and longitude of the various centres (2011-12)
S. Name of Soil Type Weather Latitude Longi-No. centre Rainfall Tempera- R.H (N) tude (E)
(mm) ture (°C) (%)
Max. Min.
1. Bajura Silty loam 954.6 25.1 10.52 64.89 31.8° 77°
2. Bhopal Vertisols, Clayey - - - - 23°18’ 77°24’Montmorillonite/smectitetype
3. Calicut Clay loam, ustic 11°34’ 75°48’Humitropept
4. Coimbatore Udic, Rhodustalfs, fine 789.3 29.83 21.31 85.56 11° 77°loamy red and sandy soil
5. Dharwad Vertic inceptisoles 926.3 30.27 18.19 65.97 15°26’ 75°07’
6. Jabalpur Vertisoils, Chromusterts 1901.8 31.47 16.76 61.73 23°90’ 79°90’
7. Karjat Haplustults udic-fluvents, 4417.4 33.77 20.53 69.55 18°33’ 77°03’red soil
8. Ludhiana Ustochrepts-Ustic 1070.5 29.41 17.29 69 30°56’ 75°52’pramments association,alluvial, sandy & sandy loam
9. Modipuram Alluvium Soil Typic 637.6 29.76 16.23 72.76 29°4’ 77°46’ustochrept
10. Pantnagar Hapludolls, very deep 2118.6 29.39 17.03 70.68 29°08’ 79°05’alluvium coarse loomy soils
11. Raipur Ochraquals association, 1360.1 32.94 20.35 60.68 21°16’ 81°36’deep black soil
12. Ranchi Ultic Palesustalfs, very 2271.60 29.44 16.06 71.00 23°17’ 85°19’deep soils
13. Umiam Clay loam 2005.30 26.32 14.00 74.75 25°41’ 91°54’

Network Project on Organic Farming
Annual Report 2012-13 5
Initial nutrient status of soil
S.No. Centre OC % N P K S Fe Zn(kg/ha) (kg/ha) (kg/ha) (ppm) (ppm) (ppm)
Experiment 1
1. Bajaura - - - - - - -
2. Bhopal 0.36 130.43 7.06 370.27 2.99 Kg/ha 4.88 0.40
3. Calicut 2.00 120ppm 6.80ppm 164ppm - 46.0 0.54
4. Coimbatore 0.60 269 17.9 690 - 29.6 kg/ha 4.5 kg/ha
5. Dharwad 0.41 250 23 330 20.0 Kg/ha 7.5 mg/kg 0.8 mg/kg
6. Jabalpur 0.7 264 12.6 282 9.8 mg/kg 2.37mg/kg 0.32mg/kg
7. Karjat 1.14 230 20 327
8. Ludhiana - - - - - - -
9. Modipuram - - - - - - -
10. Pantnagar 0.65 238 16.7 156 29.3 Kg/ha 30.24 0.84
11. Raipur 0.64 237 13 274 - - -
12. Ranchi 0.38 - - - - - -
13. Umiam 1.32 185.61 10.36 165.10 - - -
Experiment 2
1. Bajaura - - - - - - -
2. Bhopal - - - - - - -
3. Calicut 2.00 120ppm 6.80ppm 164ppm - 46.0 0.54
4. Coimbatore 0.68 258 22.9 698.3 - 31.63 kg/ha 3.59 kg/ha
5. Dharwad 0.41 250 23 330 20.0 Kg/ha 7.5 mg/kg 0.8 mg/kg
6. Jabalpur 0.68 263 12.6 296 9.6 mg/kg 2.39mg/kg 0.35mg/kg
7. Karjat 1.16 194 15 346
8. Ludhiana - - - - - - -
9. Modipuram - - - - - - -
10. Pantnagar 0.65 238 16.7 156 29.3 Kg/ha
11. Raipur 0.61 248 16.2 252 - - -
12. Ranchi 0.46
13. Umiam 1.8 255.61 9.19 232.1 - - -
Experiment 3
1. Calicut 2.00 120ppm 6.80ppm 164ppm - 46.0 0.54
2. Karjat 0.85 220 23 379 - -
3. Umiam 2.4 232.1 230.6 - - -
Experiment 4
1. Coimbatore 0.48 258 15.2 568 - 23.2 kg/ha 5.20 kg/ha
2. Jabalpur 0.62 259 12.5 265 8.9 mg/kg 2.55mg/kg 0.39mg/kg
3. Pantnagar 0.65 238 16.7 156 29.3 Kg/ha - -
4. Raipur 0.66 220 16.2 260 - - -
5. Umiam - - - - - - -

Network Project on Organic Farming
Annual Report 2012-136
6. BUDGET
A total budget of NPOF was released to 13 centers during 2011-12. The centre wise allocation fundsare given below.
(` in lakhs)
S. No. Centre Recurring Non TSP Total
Contractual Travelling Recurring Recurring Componentservices allowances contingency
1. Bajaura 2.50 0.20 2.42 3.00 6.00 14.12
2. Bhopal 2.50 0.15 2.42 0.00 6.00 11.07
3. Calicut 4.50 0.20 4.42 3.00 0.00 12.12
4. Coimbatore 3.50 0.20 3.42 3.00 0.00 10.12
5. Dharwad 2.50 0.15 2.42 0.00 5.00 10.07
6. Jabalpur 2.50 0.20 2.42 0.00 7.00 12.12
7. Karjat 2.50 0.15 2.42 0.00 5.00 10.07
8. Ludhiana 2.50 0.15 3.42 3.00 0.00 9.07
9. Modipuram 5.08 0.29 4.30 3.00 0.00 12.67
10. Pantnagar 2.50 0.20 2.42 0.00 8.00 13.12
11. Raipur 2.50 0.15 2.42 3.00 3.00 11.07
12. Ranchi 2.50 0.15 2.42 0.00 3.00 8.07
13. Umiam 2.50 0.20 2.82 3.00 7.00 15.52
Total 38.08 2.39 37.74 21.00 50.00 149.21
5. MANPOWER
No regular post in any category have been provided and the responsibility was assigned to a Scientist,nominated as Principal Investigator of NPOF by the parent institute/university ( Names and contactaddresses of PIs are given in annexure I). The Scientist of related discipline were also involved in theresearch programme by the respective institution. For technical support, two senior fellows (as contractualstaff) have been provided at each centre.

Network Project on Organic Farming
Annual Report 2012-13 7
7. RESEARCH RESULTS
7.1 Evaluation of organic, inorganic and integratedpackages for crops and cropping systems
Title of the experiment: Evaluation of management packages for cropping systems and its influenceon soil health and crop productivity.
Objectives
The experiment was conducted at all the 13 locations with the following objectives.
• To study the impact of organic, inorganic and integrated management packages on crop productivityand soil health.
• To study the impact of various packages on soil microbial population and economics.
Year of start: The experiment was originally planned during 2004-05. However, the year of start variedwith the centres depending upon the establishment of infrastructure for conducting the experiments. Allthe centres started the experiment during 2004-05 except in Modipuram and Umiam where it was startedduring 2005-06. The cropping system adopted remained almost same for all the years in each centresexcept Ludhiana where the cropping system was changed during 2008-09 in one set of experiments asLudhiana centre evaluated two set of cropping systems.
Treatments: The experiment was conducted in split plot design as un-replicated trial. However, Raipur,Calicut, Karjat, Ludhiana (II set), Bhopal, Pantnagar and Umiam centres have conducted the experimentwith three replications.
Three crop management packages viz., organic, inorganic and integrated were assigned to mainplots which were common to all the centres, while the centre specific cropping systems were assignedto sub plots. The number of cropping systems ranged from 3 (Coimbatore and Calicut) to as high as 5(Ludhiana and Dharwad) in various centres. The details of cropping systems are given in Table1 alongwith experimental results. Nutrient package for the organic and integrated management packages wereformulated based on recommended nitrogen dose of each system.
Locations: The experiment was conducted in five eco-systems as mentioned below. These locationsrepresent the different ecological regions of Agro-ecological zone.
Eco-system Centre (state)
Arid Dharwad (Karnataka)Ludhiana (Punjab)
Semi-Arid Coimbatore (Tamil Nadu)
Sub-Arid Modipuram (Uttar Pradesh)Raipur (Chattisgarh)Bhopal (Madhya Pradesh)Jabalpur (Madhya Pradesh)Pantnagar (Uttarakhand)Ranchi (Jharkhand)
Humid Bajaura (Himachal Pradesh)Umiam (Meghalaya)
Coastal Calicut (Kerala)
Karjat (Maharashtra)

Network Project on Organic Farming
Annual Report 2012-138
The details of inputs used for organic nutrient management and their nutrient content at variouslocations are given below.
Source of nutrient inputs and their NPK content at various locations
Centre Nutrient Sources NPK contents (%) on dry weight basis (%)
N (%) P (%) K (%)Bajaura
Vermicompost 1.72 0.26 1.31FYM 2.25 0.28 2.11Urea 46.00 - -SSP - 16.00 -MOP - - 58.00Rockphosphate - 34.00 -
BhopalCalicut
Farm Yard Manure 0.67 0.17 0.64Neem cake 1.67 0.19 1.70Ash - 0.23 7.0Vermicompost 0.79 0.20 0.58Green leaf manure 2.62 0.09 0.62Rajphos - 18.5 -Urea 46 - -MOP 58
CoimbatoreFYM 0.51 0.20 0.50Vermi compost 0.50 0.40 0.98Neem cake 3.25 0.60 1.10
DharwadEnriched compost 0.6 0.55 .52Vermicompost 1.0 0.69 0.28Gliricidia 0.5 0.32 1.15FYM 0.5 0.27 0.41
JabalpurKarjat
F.Y.M. 0.50 0.25 0.50Neem cake 5.20 1.00 1.40Vermicompost 2.00 1.00 1.50Glyricidia green leaves 2.74 0.50 1.15Paddy straw 1.20 0.16 1.14
LudhianaModipuramPantnagarRaipur
Enriched compost 0.35 0.70 0.85Cow dung manure 0.55 0.45 0.80Non Edible Oil Cakes (NEOC) 4.5 0.70 1.60Rock phosphate 23GM 2.25 0.40 1.50
RanchiFYM 0.5 0.3 0.5VC 1.2 0.45 1.4KC 4.0 1.0 1.0Urea 46 - -SSP - 16 -MOP - - 60
UmiamF.Y.M. 1.01 0.56 1.00Vermicompost 1.52 0.62 1.01Rock phosphate - 16.0 -Tephrosia spp 3.31 0.44 1.46

Network Project on Organic Farming
Annual Report 2012-13 9
Results
The parameter wise result of 2011-12 for each centre are presented and discussed.
Grain and straw yield (Table 1-2 and Fig. 1)Bajaura: The general performance of cauliflower, frenchbean and maize was found to be better underintegrated followed by organic package. Tomato recorded higher yield under integrated (4120 kg ha-1)followed by organic (3700 kg ha-1). Tomato recorded yield increase of more than 1.5 times with organicpackage, but under integrated package it was observed more than 1.8 times over inorganic. Maize andgarlic registered 43.7% and 36.7% higher yield under integrated package over inorganic. Straw yield alsoregistered similar trend. In term of cauliflower equivalent yield, all the systems registered higher yieldunder integrated package. Among the systems evaluated, maize-garlic was found to be better as itregistered significantly higher yield of 37701 kg ha-1.
Bhopal: In kharif, soybean recorded 21.1 and 15.4% higher grains yield under organic over inorganicand integrated respectively. In rabi, wheat, mustard, chickpea and linseed recorded significantly higheryield with organic package compared to inorganic and the yield increase was found to be 10, 21.4, 60and 26.6% respectively. Organic package resulted in significantly higher soybean equivalent yield in allthe systems followed by integrated package. Among the systems, soybean chickpea (1916 kg ha-1) andsoybean-wheat (1830 kg ha-1) was found to be better than other systems
Ginger under integrated management at Calicut Ginger under organic management with PGPRinoculation at Calicut
Calicut: Ginger recorded higher rhizome yield under inorganic package while turmeric and black pepperperformed better under integrated package. The yield reduction in ginger was found to be 39.3% and
Monitoring of NPOF experiment at Bhopal by Director, IIFS,Bhopal
Performance of chickpea crop under organicmanagement at Bhopal

Network Project on Organic Farming
Annual Report 2012-1310
Tab
le 1
. In
flu
ence
of
org
anic
, in
org
anic
an
d in
teg
rate
d p
acka
ges
on
yie
ld a
nd
eq
uiv
alen
t yi
eld
(kg
/ha)
of
cro
ps
Gra
in y
ield
Equ
ival
ent y
ield
Cro
pp
ing
sys
tem
/pac
kag
eO
rgan
icIn
org
anic
Inte
gra
ted
Kh
arif
Rab
iS
um
mer
Kh
arif
Rab
iS
um
mer
Kh
arif
Rab
iS
um
mer
Org
anic
Ino
rgan
icIn
teg
rate
dM
ean
Baj
aura
Cau
liflo
wer
-pea
-tom
ato
75
70
10
18
53
70
07
28
76
17
31
45
71
62
118
71
64
12
02
14
55
14
91
72
90
47
21
80
6
Fre
nchb
ean-
caul
iflow
er-f
renc
h be
an2
09
59
66
77
19
111
01
12
49
36
21
41
59
81
50
95
90
55
22
09
62
14
60
28
14
52
39
00
Cau
liflo
wer
-pea
-cau
liflo
wer
72
13
10
18
51
81
37
16
84
16
73
58
16
06
21
05
74
13
74
19
211
116
93
28
01
01
96
38
Mai
ze-g
arlic
56
54
10
83
84
76
11
22
00
68
45
16
68
03
16
18
34
30
94
71
76
37
70
1
Mea
n2
35
95
20
59
53
30
95
Bho
pal
Soy
bean
-whe
at3
81
31
36
-2
95
28
51
-3
113
01
6-
19
50
17
21
18
20
18
30
Soy
bean
-mus
tard
35
51
02
2-
27
28
42
-2
38
96
7-
13
29
10
74
115
811
87
Soy
bean
-chi
ckpe
a3
25
20
98
-2
75
13
11-
27
21
84
2-
22
73
14
93
19
83
19
16
Soy
bean
-lin
seed
24
91
08
0-
24
08
53
-3
14
90
0-
15
18
12
43
13
72
13
77
Mea
n1
76
71
38
31
58
3
Kh
arif
Rab
i
SE
m±
CD
SE
m±
CD
Inpu
t6.
7526
.533
.61
32
Cro
pp
ing
11.3
33.6
35.6
10
6
Cro
ppin
g X
Inp
ut2
058
.161
.71
83
Inpu
t X
Cro
ppin
g18
.356
.663
.12
05
Cal
icu
t
Gin
ger
59
46
97
92
76
54
59
33
68
60
75
90
67
94
Tur
mer
ic8
95
08
97
51
03
50
88
25
89
00
10
39
09
37
2
Bla
ck p
eppe
r 7
75
43
89
75
77
54
38
97
57
29
Kh
arif
Rab
i
SE
m±
CD
SE
m±
CD
Inpu
t1
04
31
6
Cro
pp
ing
86.3
24
7
Cro
ppin
g X
Inp
ut1
50
42
8
Inpu
t X
Cro
ppin
g1
60
47
1

Network Project on Organic Farming
Annual Report 2012-13 11
Gra
in y
ield
Equ
ival
ent y
ield
Cro
pp
ing
sys
tem
/pac
kag
eO
rgan
icIn
org
anic
Inte
gra
ted
Kh
arif
Rab
iS
um
mer
Kh
arif
Rab
iS
um
mer
Kh
arif
Rab
iS
um
mer
Org
anic
Ino
rgan
icIn
teg
rate
dM
ean
Co
imb
ato
re
Cot
ton-
mai
ze-g
reen
man
ure
15
15
41
44
15
58
47
33
17
23
50
60
-1
53
28
20
49
02
19
63
19
26
0
Ch
illie
s-su
nflo
we
r-g
ree
n m
an
ure
38
12
16
02
43
70
17
30
40
86
18
95
-5
73
46
44
66
36
06
18
0
Bri
njal
-sun
flow
er-g
reen
man
ure
93
78
13
95
12
82
31
63
011
27
21
72
5-
111
22
14
86
11
34
28
13
13
7
Mea
n1
07
28
13
93
21
39
17
Dh
arw
ad
Mai
ze-c
hick
pea
47
00
96
43
43
36
97
42
93
81
7-
73
99
53
85
16
45
48
10
Cot
ton+
[ea
14
75
86
71
35
7-
27
27
17
22
25
72
23
40
(278
2)(1
899)
(269
9)
Gro
un
dn
ut-
sorg
hu
m3
68
311
78
25
93
92
63
41
811
15-
40
76
29
02
28
42
32
73
Pot
ato-
chic
kpea
51
23
113
74
211
77
44
50
28
44
-8
30
76
37
81
71
65
46
7
Soy
bean
-whe
at3
22
711
37
21
25
91
22
53
41
08
7-
38
47
26
47
17
20
27
38
Mea
n5
27
13
80
22
09
9
Jab
alp
ur
Bas
mat
i ri
ce-D
.whe
at-g
reen
man
ure
35
25
34
53
-4
02
04
21
9-
37
12
38
55
-6
28
77
12
96
55
36
65
6
Ba
sma
ti ri
ce-c
hic
kpe
a-s
esa
me
m3
35
81
27
52
29
36
41
13
95
311
35
10
12
94
26
85
02
85
96
85
63
65
54
4
Ba
sma
ti ri
ce-b
ers
ee
m3
25
62
10
-3
59
02
50
-3
41
02
30
-4
09
64
90
64
62
14
54
1
Bas
mat
i ri
ce-v
eg.p
ea-s
orgh
um3
15
83
87
34
38
27
36
00
44
19
47
85
83
42
54
21
94
45
72
62
44
76
89
72
88
70
74
Mea
n5
41
46
42
36
02
4
Kar
jat
Ric
e-gr
ound
nut
34
12
25
84
42
43
28
37
36
13
28
07
93
96
10
54
69
85
19
93
1
Ric
e-m
aize
(sw
eet
corn
for
cob
)2
21
79
61
33
31
91
75
21
28
41
14
70
84
54
47
79
66
60
06
31
4
Ric
e-m
ust
ard
27
04
86
33
55
91
06
62
71
51
07
64
61
25
92
95
10
75
21
6
Ric
e-do
licho
s be
an (
for
gree
n2
78
04
95
03
74
65
52
93
47
75
28
77
73
09
27
58
76
48
59
0po
d ve
geta
ble)
Mea
n6
57
18
38
77
58
1

Network Project on Organic Farming
Annual Report 2012-1312
Gra
in y
ield
Equ
ival
ent y
ield
Cro
pp
ing
sys
tem
/pac
kag
eO
rgan
icIn
org
anic
Inte
gra
ted
Kh
arif
Rab
iS
um
mer
Kh
arif
Rab
iS
um
mer
Kh
arif
Rab
iS
um
mer
Org
anic
Ino
rgan
icIn
teg
rate
dM
ean
Kh
arif
Rab
i
SE
m±
CD
SE
m±
CD
Inpu
t1
07
31
29
12
65
Cro
pp
ing
12
33
60
10
53
07
Cro
ppin
g X
Inp
utN
SN
SN
SN
S
Inpu
t X
Cro
ppin
g2
14
NS
18
25
31
Lu
dh
ian
a I
Cot
ton-
gram
(D)
15
70
15
40
-6
80
14
60
-11
70
15
20
-3
116
21
45
26
95
26
52
Mai
ze(P
P)-
gram
(K)
24
20
13
50
-1
66
01
50
0-
22
00
16
00
-1
811
17
03
19
46
18
20
Ba
sma
ti ri
ce-w
he
at-
sum
me
r m
oo
ng
31
60
40
50
10
40
30
60
46
20
112
02
81
04
84
011
20
57
35
59
35
57
71
58
14
Tur
mer
ic-o
nion
28
65
01
80
50
-1
09
50
14
00
0-
20
25
01
70
40
-1
00
07
53
46
79
91
77
81
Mai
ze-p
otat
o-su
mm
er m
oong
58
10
20
44
011
60
39
60
14
60
011
.44
93
01
95
00
10
50
64
91
48
74
59
55
57
73
Mea
n5
43
24
00
14
87
2
Lu
dh
ian
a II
So
rgh
um
-be
rse
em
35
15
06
43
50
-2
86
50
53
67
5-
33
85
06
05
00
-
Mai
ze-b
erse
em-b
ajra
38
30
06
54
25
34
60
04
01
50
54
77
53
30
00
38
35
06
30
75
36
10
0
Mai
ze-b
erse
em-m
aize
+co
wpe
a3
79
00
66
67
54
25
50
40
05
05
63
75
37
70
03
75
50
61
40
03
49
50
So
rgh
um
+g
ua
r-o
ats
-co
wp
ea
45
40
04
37
75
31
50
03
82
50
48
50
02
62
75
42
50
04
47
50
28
52
5
Kh
arif
Rab
iS
um
mer
SE
m±
CD
SE
m±
CD
SE
m±
CD
Inpu
t11
90
NS
60
22
08
31
79
7N
.S.
Cro
pp
ing
96
82
80
61
37
73
99
51
45
24
31
4
Cro
ppin
g X
Inp
ut1
67
54
86
12
38
56
92
03
112
N.S
.
Inpu
t X
Cro
ppin
g1
87
65
86
52
15
16
33
62
72
8N
.S.

Network Project on Organic Farming
Annual Report 2012-13 13
Gra
in y
ield
Equ
ival
ent y
ield
Cro
pp
ing
sys
tem
/pac
kag
eO
rgan
icIn
org
anic
Inte
gra
ted
Kh
arif
Rab
iS
um
mer
Kh
arif
Rab
iS
um
mer
Kh
arif
Rab
iS
um
mer
Org
anic
Ino
rgan
icIn
teg
rate
dM
ean
Mo
dip
ura
m
Bas
mat
i ric
e-w
heat
-ses
bani
a G
M3
56
04
07
02
96
03
54
03
35
04
28
07
67
07
67
06
53
07
29
0
Ric
e-ba
rley
+m
usta
rd-g
reen
gra
m4
26
02
56
58
71
38
60
23
56
69
44
18
02
79
08
55
92
50
93
30
81
00
88
93
(385
)(3
38)
(412
)
Mai
ze (
cob)
-pot
ato-
okra
48
60
21
30
02
74
00
44
30
18
60
02
17
00
47
60
21
80
02
80
00
30
62
03
02
90
26
20
02
90
37
Mai
ze -
mus
tard
+ra
dish
-Ses
bani
a G
M9
06
06
94
83
30
58
99
62
07
44
85
80
91
70
76
10
84
53
(14
20
0)
(12
20
0)
(15
30
0)
Mea
n1
40
30
14
115
12
110
Pan
tnag
ar
Bas
mat
i ri
ce-w
heat
-ses
bani
a3
57
14
10
32
95
04
36
33
24
54
39
85
81
85
33
95
65
35
60
4(g
reen
man
urin
g)
Bas
mat
i ri
ce-l
entil
-ses
bani
a4
03
81
70
23
33
71
57
23
88
51
69
79
54
88
10
99
03
68
89
8(g
reen
man
urin
g)
Bas
mat
i ric
e-ve
geta
ble
pea-
38
73
62
72
33
54
56
19
37
10
58
64
53
06
55
29
59
80
56
05
Ses
bani
a (g
reen
man
urin
g)
Bas
mat
i ri
ce-b
rass
ica
napu
s-3
37
31
77
72
911
18
64
31
58
19
92
49
38
45
53
49
12
48
01
sesb
ania
(gr
een
man
urin
g)
Mea
n6
40
35
88
36
39
5
Kh
arif
Rab
i
SE
m±
CD
SE
m±
CD
Inpu
t54
.52
14
79.2
NS
Cro
pp
ing
38.4
114
115
34
3
Cro
ppin
g X
Inp
ut66
.5N
S2
00
NS
Inpu
t X
Cro
ppin
g79
.2N
S1
90
NS
Rai
pur
So
ybe
an
-be
rse
em
111
83
66
19
1111
32
52
41
31
43
54
52
118
29
91
31
20
61
43
12
31
30
87
6
Soy
bean
-Isa
bgol
110
62
79
10
76
33
51
20
63
12
17
71
20
73
21
33
19
92
Soy
bean
-oni
on1
03
81
32
62
10
36
16
38
111
89
15
64
311
64
81
74
17
16
83
21
52
99
Soy
bean
-saf
flow
er1
06
21
20
41
03
41
23
311
85
14
51
19
28
21
44
24
91
21
88
Mea
n3
34
12
38
21
04
114
5

Network Project on Organic Farming
Annual Report 2012-1314
Gra
in y
ield
Equ
ival
ent y
ield
Cro
pp
ing
sys
tem
/pac
kag
eO
rgan
icIn
org
anic
Inte
gra
ted
Kh
arif
Rab
iS
um
mer
Kh
arif
Rab
iS
um
mer
Kh
arif
Rab
iS
um
mer
Org
anic
Ino
rgan
icIn
teg
rate
dM
ean
Kh
arif
Rab
i
SE
m±
CD
SE
m±
CD
Inpu
t20
.87
25
20
NS
Cro
pp
ing
17.6
51
66
51
92
9
Cro
ppin
g X
Inp
ut30
.4N
S11
51
NS
Inpu
t X
Cro
ppin
g33
.6N
S1
22
5N
S
Ran
chi
Ric
e -
whe
at4
12
01
95
03
53
02
41
03
82
02
22
06
15
16
04
06
13
36
10
8
Ric
e -
pota
to4
29
01
93
00
37
20
15
10
03
96
01
79
00
13
94
011
27
01
29
10
12
70
7
Ric
e -
linse
ed3
98
07
95
33
50
75
03
74
07
66
48
94
42
25
46
34
45
84
Ric
e -
lent
il3
72
06
49
33
10
71
33
58
07
35
50
72
47
95
5111
49
93
Mea
n7
51
46
58
37
19
7
Um
iam
Ric
e -c
arro
t3
24
311
96
73
17
16
85
13
29
411
63
89
22
76
97
79
75
98
65
4
Ric
e -p
otat
o3
05
81
45
12
32
51
12
32
63
29
01
47
20
78
47
77
71
86
88
81
02
Ric
e-fr
ench
bean
33
43
94
28
33
56
78
03
35
02
97
35
18
66
41
74
44
21
07
91
90
62
Ric
e-to
mat
o3
12
01
31
36
32
59
117
09
34
04
13
51
41
23
15
12
36
61
39
15
12
86
5
Mea
n1
20
13
111
40
13
36
0
Kh
arif
Rab
i
SE
m±
CD
SE
m±
CD
Inpu
t1
40
NS
23
19
05
Cro
pp
ing
90.5
NS
17
85
30
Cro
ppin
g X
Inp
ut1
57
NS
30
99
19
Inpu
t X
Cro
ppin
g1
95
NS
35
411
93
( )
Fig
ures
in
pare
nthe
sis
are
yiel
d of
int
er c
rops

Network Project on Organic Farming
Annual Report 2012-13 15

Network Project on Organic Farming
Annual Report 2012-1316
Fig. 1. Performance of various systems under different production systems based on system equivalent yield
21.8% under organic and integrated package compared toinorganic respectively. The yield drop with organic was found tobe 13.5% over integrated package in turmeric. Black pepperregistered higher yield under integrated (975 kg ha-1) followed byorganic (775 kg ha-1) and inorganic (438 kg ha-1).
Coimbatore: All the crops evaluated performed better underintegrated package except chilli and brinjal which recorded higheryield under inorganic package. The additional yield obtained withinorganic package was found to be 558 and 3445 kg ha-1
compared to organic package respectively. The yield differencePerformance of cotton crop underorganic condition at Coimbatore

Network Project on Organic Farming
Annual Report 2012-13 17
Table 2. Influence of organic, inorganic and integrated packages on straw yield (kg/ha) of crops
Cropping systems/package Organic Inorganic IM
Kharif Rabi Summer Kharif Rabi Summer Kharif Rabi Summer
Bajaura
Cauliflower-pea-tomato 6270 5930 8650
French bean-cauliflower- 950 5430 430 7320 760 9760french bean
Cauliflower-pea-cauliflower 6050 6230 10270
Maize-garlic 7820 8650 10200
Coimbatore
Cotton-maize-green manure 4956 5318 5774
Chillies-sunflower-green manure 3984 3817 4090
Brinjal-sunflower-green manure 3319 3457 3863
Dharwad
Maize-chickpea 1204 1070 1291
Cotton+pea
Groundnut-sorghum 5706 3959 5512
Potato-chickpea 1402 1123 1387
Soybean-wheat 2301 2007 1855
Jabalpur
Basmati rice-D. wheat-GM 6419 6034 6812 7236 5824 6991
Basmati rice-chickpea- 5473 1785 5571 2093 5076 1877sesamum
Basmati rice-berseem 5770 35621 5174 37811 5866 36299
Basmati rice-veg.pea-sorghum 5573 5670 5582
Karjat
Rice-groundnut 4145 3186 4769 4335 4227 3824
Rice-maize (sweet corn for cob) 3010 4409 3347 7149 2825 6400
Rice-mustard 3032 887 3828 1627 2934 1129
Rice-dolichos bean (for green 3254 3875 4189 4394 4069 4159pod vegetable)
Kharif Rabi
SEm± CD SEm± CD
Input 67.9 199 161 468
Cropping 78.5 229 185 540
Cropping X Input NS NS
Input X Cropping 137 NS 320 NS
Ludhiana I
Cotton-gram(D) 11860 9360 10340
Maize(PP)-gram(K) 10280 7800 9630

Network Project on Organic Farming
Annual Report 2012-1318
Basmati rice-wheat-summer moong 8090 6690 7110
Turmeric-onion 7070 2420 5660
Maize-potato-summer moong 10740 7290 9380
Modipuram
Basmati rice-wheat-sesbania (GM) 6610 6450 4830 6110 5960 6900
Rice-barley+mustard-GG 6950 4088 2673 5790 3969 2344 6540 4099 2563(1420) (1310) (1480)
Maize cob-potato-okra 6710 3865 6370 3286 7140 4142
Maize -mustard+radish- 11330 2691 10330 2385 11760 2783sesbania (GM)
Pantnagar
Basmati rice-wheat-sesbania 5178 5031 5124 3726 5476 4784(green manure)
Basmati rice-lentil-sesbania 5630 3266 5473 4857 5590 0.00(green manure)
Basmati rice-vegetable pea- 5850 4691 4831 6166 5023 0.00sesbania (green manure)
Basmati rice-Brassica napus- 5581 5041 5225 3669 4801 0.00sesbania (green manure)
Kharif Rabi
SEm± CD SEm± CD
Input 110 NS 193 759
Cropping 62.8 187 125 370
Cropping X Input 109 323 216 641
Input X Cropping 145 511 269 932
Raipur
Soybean-berseem 2371 2208 2799
Soybean-isabgol 2342 2181 2766
Soybean-onion 2165 1981 2493
Soybean-safflower 2229 2167 2664
Kharif
SEm± CD
Input 37.0 128
Cropping 49.0 142
Cropping X Input 84.9 NS
Input X Cropping 82.0 NS
Ranchi
Rice-wheat 5990 3140 5470 3780 5610 3530
Rice-potato 6250 3642 5550 2786 5790 3365
Cropping systems/package Organic Inorganic IM
Kharif Rabi Summer Kharif Rabi Summer Kharif Rabi Summer

Network Project on Organic Farming
Annual Report 2012-13 19
Cropping systems/package Organic Inorganic IM
Kharif Rabi Summer Kharif Rabi Summer Kharif Rabi Summer
Rice-linseed 5650 1530 5210 1435 5580 1487
Rice-lentil 5480 1863 5100 2068 5310 2109
Umiam
Rice-carrot
Rice-potato 5161 4641 5322
Rice-frenchbean 1631 1487 1594
Rice-tomato 1367 1212 1431
Rabi
SEm± CD
Input 63.6 NS
Cropping 73.6 218
Cropping X Input 127 NS
Input X Cropping 127 NS
( ) Figures in parenthesis are straw yield of inter crops
between integrated and organic package was found to be 274 and 1894 kg ha-1. The drop in yield underorganic package over integrated was found to be 17.2, 18.1, 16.8 and 12.7% for sunflower, maize, brinjaland cotton respectively. All the systems recorded higher cotton equivalent yield under integrated packageeven after applying premium price of organic produce. Among the systems, cotton-maize-greengramwas found to be better (19260 kg ha-1).
Dharwad: All the crops evaluated in five systems recorded higher yield with organic package. The yieldincrease over inorganic was found to be 36.9, 42.8, 46.5, 42, 27.2, 21.7, 51.9 and 24.7% for maize,chickpea, pea, groundnut, sorghum, potato, soybean and wheat respectively. Integrated package wasthe next best for all the crops. Straw yield also exhibited similar trend. All the systems recorded highermaize equivalent yield with organic package. Among the systems ground-sorghum and cotton+pearegistered higher maize equivalent yield (2896 and 2340 kg ha-1 respectively) than other systems.
Jabalpur: Basmati rice, chickpea, sesamum, berseem, vegetable pea and sorghum recorded higheryield under inorganic package. The yield reduction observed in basmati rice with organic and integratedpackage was found to be 10.5 and 5.3% while, the reduction was much higher for wheat (18.2 and 8.6%respectively). The yield reduction of 12.4, 8.6, 26.4, 16, and 8.4% was found in vegetable pea, chickpea,sesamum, berseem and sorghum with organic package compared to inorganic. Straw yield of basmatirice and wheat have also exhibited similar trend. In term of basmati rice equivalent yield, all the systemsrecorded higher yield under inorganic package. Among the systems, basmati rice-vegetable pea-sorghumand basmati rice-wheat-greengram recorded higher equivalent yield of 7074 and 6656 kg ha-1 respectivelythan other systems.
Karjat: Rice during kharif registered significantly higher yield under inorganic followed by integratedpackage. The mean yield drop observed with organic and integrated package was found to be 25.3 and14.9% respectively over inorganic. During rabi, it was observed that all the crops (groundnut, maize forcob, mustard and dolichos bean) have recorded significantly higher yield under inorganic package. Theyield drop of groundnut, maize, mustard and dolichous bean was found to be 8.9, 45.1, 19 and 10.5%

Network Project on Organic Farming
Annual Report 2012-1320
respectively with organic over inorganic package. Straw yield also recorded similar trend. All the systemsregistered higher rice equivalent under organic package and among the systems, rice-groundnut andrice-delichous bean (for green pod) was found to be better than other systems.
Ludhiana: Two set of experiments were conducted by including various combinations of crops in thesystem mode. In the first experiment, all the crops except gram, wheat and summer moong recordedhigher yield under organic package. Gram, wheat and summer moong registered higher yield underintegrated package. More than 100% increase in yield under organic over inorganic was observed in cottonand turmeric during kharif. Basmati rice recorded only 3.3% increase whereas maize recorded 46.7%.In rabi, the results revealed that an increase in yield of onion and potato by 28.9 and 40% under organicover inorganic package while gram yield drop was found to be 10%. Similarly, in summer moong, it wasfound that 7.1% drop in yield under organic package. Straw yield also exhibited similar trend. In the secondset of experiment, the different management package did not significantly influence on the yield of cropsduring kharif and summer seasons implying suitability of organic management package especially forsorghum, maize, pearlmillet and cowpea. In rabi, berseem recorded higher yield under organic package(65483 kg ha-1) while oats performed better under inorganic package (48500 kgha-1). The yield drop inoats due to organic package was found to be 9.7%. In term of basmati rice equivalent yield, turmeric-onion (7781 kg ha-1) and basmati rice-wheat summer moong (5814 kg ha-1) was found to be better thanother systems. Maize-potato summer moong, turmeric-onion and cotton-gram was found to be betterperformance with organic package.
Modipuram: The response of different crops in the systems varied for the type of input packages adopted.Among the various crops in the systems, basmati rice, maize for cob and greengram recorded higheryield under organic system while maize for grain, potato, okra, barley, mustard and radish have recorded
Monitoring of NPOF experiment at Ludhiana by ProjectDirector and National PI
Performance of wheat + chickpea system under organicmanagement at Ludhiana
Basmati rice under organic management at Modipuram Maize under organic management at Modipuram

Network Project on Organic Farming
Annual Report 2012-13 21
higher yield under integrated package. Wheat registered increase in yield to the tune of 15.0% with organicpackage while, the increase was found to be 21% under integrated. In case of basmati rice, it was observedthat 20.3% higher yield under organic system compared to inorganic package, whereas in rice, the yieldwas increased 10.4 and 8.3% under organic and integrated package, respectively. Straw yield also exhibitedthe similar trend. Among the various systems, maize-potato-okra recorded higher basmati rice equivalentyield of 29037 kg ha-1. Organic and inorganic package resulted in on par basmati rice equivalent yield inall the systems except maize (cob)-mustard+raddish-sesbania GM.
Organic basmati rice (PB-1) under NPOF at Pantnagar
Pantnagar: Significantly higher mean yield ofbasmati rice during kharif was observed withorganic package as it recorded higher mean grainyield of 3714 kg ha-1 followed by integrated package3499 kg ha-1. The yield increase under organic was18.3% over inorganic package. Among rabi crops,wheat recorded numerically higher yield underintegrated package (4398 kg ha-1) but, the same wasat par with inorganic (4363 kg ha-1). Brassica napusrecorded higher yield (1992 kg ha-1) under integratedfollowed by inorganic package. Vegetable pea andlentil produced better performance (6272 and 1702kg ha-1) under organic followed by integrated (5864and 1697 kg ha-1). The straw yield of both kharif and rabi crops have resulted in similar trend. In term ofbasmati rice equivalent yield, all the systems recorded higher yield under organic except basmati rice-vagetable pea-sesbania system. Among the systems, basmati rice-lentil sesbania (GM) recorded higherbasmati rice equivalent yield (8898 kg ha-1)
Raipur: Mean yield of soybean in kharif was found to be higher under integrated package (1223 kg ha-1)followed by organic (1081 kg ha-1) and inorganic (1064 kg ha-1). Among the other crops evaluated, berseemregistered higher yield under organic package, isabgol and onion registered higher yield under inorganicpackage, while safflower performed better under integrated package. The drop in yield of onion with organicpackage was found to be 2381 kg ha-1 compared to integrated package. All the nutrient managementpackages registered significant yield difference in kharif and non-significant difference in rabi seasons.Straw yield of soybean and sunflower also revealed the same trend. In term of soybean equivalent yield,soybean-berseem was found to be better, while inorganic package was found to be better for all systemsexcept soybean-onion which recorded higher yield under in organic package.
Ranchi: Rice recorded higher mean grain yield of 4028 kg ha-1 during kharif under organic package whichis 6.7% higher than integrated package and 15.8% higher than inorganic. In rabi, it was observed thatwheat recorded around 460 kg ha-1 lesser yield with organic compared to inorganic package. Thoughlentil recorded numerically higher yield under integrated (735 kg ha-1), the yield difference betweenintegrated and organic package was found to be only 86 kg ha-1. Potato and linseed recorded 27.8 and6% increase in yield under organic over inorganic package.Similar trend was also obtained for straw yield of all thecrops. Rice-potato system was found to be better in termof rice equivalent yield (12707 kg ha-1) and all the systemsperformed better with organic package due to the higherpremium price received for organic practice.
Umiam: Rice grown during kharif recorded numericallyhigher mean grain yield of 3373 kg ha-1 with inorganicpackage followed by integrated 3259 kg ha-1. All thevegetables like carrot, potato, frenchbean and tomatogrown during rabi performed better under integrated Organic farming experiments in Raised and
sunken beds at Umiam

Network Project on Organic Farming
Annual Report 2012-1322
package. Yield obtained with organic was at par with integrated package. Among the vegetable crops,carrot potato, frenchbean and tomato have recorded 69.9, 19.4, 24.8 and 15.4% higher yield with integratedover inorganic package. Residue yield of vegetables have also given same trend. Among the systems,rice-frenchbean systems recorded higher rice equivalent yield (19092 kg ha-1) while rice-carrot systemrecorded higher yield under organic package. All other systems recorded higher rice equivalent yield underintegrated package.
Soil physical and available nutrient status (Table 3-5 and Fig. 2)
Except Jabalpur, Ranchi and Umiam all the centres have reported soil parameters
Bajaura: Organic carbon, soil available N, P, K and all the micronutrients were estimated. An increase ofmore than two times in organic carbon was observed with organic and integrated package over inorganic.Variation of only 0.07% was observed among different vegetable based systems. Availability of residualN, P, K was higher with inorganic (220, 94.7, 185 kg ha-1 respectively) irrespective of cropping systems.Cauliflower-pea-tomato system recorded lower soil available N (190 kg ha-1), P (79.3 kg ha-1) and K (169kg ha-1) among the various cropping systems. All micro nutrients were higher with organic (28.0, 12.3,9.40 and 75.0 ppm of Mn, Zn, Cu and Fe respectively) package irrespective of cropping systems. Mnand Fe availability was found higher at the end of cauliflower-pea-cauliflower system. Zn recorded higherin frenchbean-cauliflower-frenchbean system while Cu were higher under maize-garlic system.
Bhopal: Physical and chemical characteristics of soil in terms of electrical conductivity and pH wereestimated and no significant variation was found either by nutrient management practices or croppingsystems. Electrical conductivity was higher with organic package (0.24 ds/m) compared to inorganic(0.20 ds/m). Marginal improvement in available N (5.1%) and residual P more than 2 times was observedwith organic over inorganic package. The residual soil available N (258 kg ha-1) and P (79 kg ha-1) wasfound to be better in soybean-chickpea system while K was found to be higher in soybean-wheat system(709 kg ha-1).
Calicut: Soil organic carbon, available N, P and K along with micronutrient such as Mn, Zn, Cu and Fewere estimated for turmeric, ginger and black pepper. Irrespective of crops, significant improvement wasobserved in pH and organic carbon with organic package (9.2 and 17.4%) compared to inorganic inputuse. Black pepper recorded significantly higher soil organic carbon content (2.31%) than ginger (1.61%)and turmeric (1.26%). Significant difference in available N, P and K was observed among various typesof input packages. Availability of residual N, P and K was found to be higher with integrated package193.0, 29.3 and 243.0 kg ha-1 respectively. Black pepper recorded significantly higher residual soil N andP while K was in turmeric. Except Mn, all the other micronutrients such as Zn, Cu Fe were higher underintegrated package. Among the crops, ginger recorded higher availability of Cu (15.4 ppm) and Fe (50.1ppm) while turmeric and black pepper recorded higher Mn (16.4 ppm) and Zn (2.34 ppm) respectively.
Coimbatore: Residual organic carbon, available soil N, P and K was estimated for all the three croppingsystems under three management practice. Irrespective of the cropping systems, organic and integratedpackage resulted in 7.8 and 10.9% improvement in organic carbon compared to inorganic package. Cotton-maize-green manure system recorded higher organic carbon (0.70%) compared to all other systems.As expected, the residual available NPK was found to be higher with organic package (242, 20.7, 662 kgNPK ha-1). Chillies-sunflower-green manure recorded higher available N and P (249 and 20.6 kg ha-1
respectively) while Cotton-maize-green manure systems left 678 kg ha-1 of soil available K at the end ofcropping cycle.

Network Project on Organic Farming
Annual Report 2012-13 23
Tab
le 3
. In
flu
ence
of
org
anic
, in
org
anic
an
d in
teg
rate
d p
acka
ge
on
so
il b
ulk
den
sity
, ele
ctri
cal c
on
du
ctiv
ity,
pH
an
d o
rgan
ic c
arb
on
at
the
end
of
cro
pp
ing
cycl
e
Cro
pp
ing
sys
tem
s/p
acka
ge
Bu
lk d
ensi
ty (
g/c
c)E
lect
rica
l co
nd
uct
ivit
y (d
S/m
)pH
Org
anic
car
bo
n (
%)
Org
Inor
gIM
Mea
nO
rgIn
org
IMM
ean
Org
Inor
gIM
Mea
nO
rgIn
org
IMM
ean
Baj
aura
Cau
liflo
wer
-pea
-tom
ato
5.30
5.50
5.40
5.40
1.10
0.45
0.96
0.84
Fre
nch
bean
-cau
liflo
wer
-fre
nch
bean
5.40
5.60
5.40
5.47
1.03
0.46
0.98
0.82
Cau
liflo
wer
-pea
-cau
liflo
wer
5.30
5.60
5.40
5.43
1.04
0.40
0.92
0.79
Mai
ze-g
arlic
5.40
5.60
5.30
5.43
1.00
0.42
0.90
0.77
Mea
n5.
355.
585.
381.
040.
430.
94
Bho
pal
Soy
bean
-whe
at0.
210.
270.
220.
238.
037.
938.
007.
99
Soy
bean
-mus
tard
0.23
0.27
0.36
0.29
7.77
7.73
7.77
7.76
Soy
bean
-chi
ckpe
a0.
300.
250.
270.
277.
707.
737.
707.
71
Soy
bean
-lin
seed
0.24
0.20
.022
0.15
7.93
8.03
8.03
8.00
Mea
n0.
250.
250.
227.
867.
867.
88
CD
(P
=0.
05)
SE
m±
CD
SE
m±
CD
Pac
kage
0.02
NS
0.03
NS
Cro
pp
ing
0.02
NS
0.03
0.08
Cro
ppin
g X
Pac
kage
0.04
NS
0.04
NS
Pac
kage
X C
ropp
ing
0.04
NS
0.05
NS
Cal
icu
t
Gin
ger
5.23
4.77
5.18
5.06
1.51
1.69
1.64
1.61
Tur
mer
ic5.
574.
514.
884.
991.
401.
121.
251.
26
Bla
ck P
eppe
r 6.
276.
356.
156.
292.
762.
012.
152.
31
Mea
n5.
695.
215.
401.
891.
611.
68
CD
(P
=0.
05)
SE
m±
CD
SE
m±
CD
Pac
kage
0.04
0.10
0.04
0.10
Cro
pp
ing
0.02
0.07
0.04
0.10

Network Project on Organic Farming
Annual Report 2012-1324
Cro
ppin
g X
Pac
kage
0.04
0.11
0.06
0.17
Pac
kage
X C
ropp
ing
0.04
0.13
0.06
0.17
Co
imb
ato
re
Cot
ton-
mai
ze -
gree
n m
anur
e0.
710.
650.
740.
70
Ch
illie
s-su
nflo
we
r-g
ree
n m
an
ure
0.71
0.63
0.70
0.68
Bri
njal
-sun
flow
er-g
reen
man
ure
0.66
0.64
0.68
0.66
Mea
n0.
690.
640.
71
Dh
arw
ad
Mai
ze-c
hick
pea
1.21
1.33
1.24
1.26
0.17
0.21
0.17
0.18
7.24
7.39
7.23
7.29
0.63
0.51
0.57
0.57
Cot
ton+
pea
1.20
1.32
1.23
1.25
0.18
0.20
0.19
0.19
7.25
7.41
7.25
7.30
0.63
0.51
0.56
0.57
Gro
un
dn
ut-
sorg
hu
m1.
201.
311.
241.
250.
180.
210.
190.
197.
217.
357.
297.
280.
650.
500.
600.
58
Pot
ato-
chic
kpea
1.20
1.31
1.23
1.25
0.20
0.21
0.18
0.20
7.16
7.29
7.19
7.21
0.65
0.50
0.60
0.58
Soy
bean
-whe
at1.
191.
291.
221.
230.
190.
190.
200.
197.
237.
377.
297.
300.
640.
510.
560.
57
Mea
n1.
201.
311.
230.
180.
200.
197.
227.
367.
250.
640.
510.
58
Kar
jat
Ric
e-gr
ound
nut
0.42
0.45
0.47
0.45
6.77
6.75
6.71
6.74
1.53
1.29
1.34
1.39
Ric
e-m
aize
(sw
eet
corn
for
cob
)0.
450.
450.
470.
466.
736.
696.
686.
701.
401.
081.
261.
25
Ric
e-m
ust
ard
0.41
0.46
0.45
0.44
6.72
6.73
6.70
6.72
1.51
1.14
1.29
1.31
Ric
e-do
licho
s be
an (
for
gree
n0.
460.
000.
430.
306.
716.
706.
736.
711.
401.
141.
291.
28po
d ve
geta
ble)
Mea
n0.
440.
340.
466.
736.
726.
711.
461.
161.
30
CD
(P
=0.
05)
SE
m±
CD
SE
m±
CD
SE
m±
CD
Pac
kage
0.01
0.03
0.03
NS
0.02
0.07
Cro
pp
ing
0.01
0.04
0.03
NS
0.03
0.08
Cro
ppin
g X
Pac
kage
0.02
0.07
0.04
NS
NS
Pac
kage
X C
ropp
ing
0.02
0.07
0.04
NS
0.05
NS
Cro
pp
ing
sys
tem
s/p
acka
ge
Bu
lk d
ensi
ty (
g/c
c)E
lect
rica
l co
nd
uct
ivit
y (d
S/m
)pH
Org
anic
car
bo
n (
%)
Org
Inor
gIM
Mea
nO
rgIn
org
IMM
ean
Org
Inor
gIM
Mea
nO
rgIn
org
IMM
ean

Network Project on Organic Farming
Annual Report 2012-13 25
Lu
dh
ian
a II
So
rgh
um
-be
rse
em
0.29
0.28
0.26
0.28
7.47
7.50
7.43
7.47
0.56
0.46
0.55
0.52
Mai
ze-b
erse
em-b
ajra
0.27
0.26
0.28
0.27
7.50
7.53
7.55
7.53
0.57
0.45
0.54
0.52
Mai
ze-b
erse
em-m
aize
+co
wpe
a0.
330.
310.
280.
317.
547.
647.
517.
560.
590.
460.
570.
54
Sor
ghum
+gu
ar-o
ats-
cow
pea
0.30
0.32
0.28
0.30
7.58
7.43
7.52
7.51
0.60
0.54
0.57
0.57
Mea
n0.
300.
290.
287.
527.
537.
500.
580.
480.
56
CD
(P
=0.
05)
SE
m±
CD
SE
m±
CD
Pac
kage
0.01
NS
0.01
0.03
Cro
pp
ing
0.02
0.06
0.01
0.03
Cro
ppin
g X
Pac
kage
0.04
0.10
0.02
NS
Pac
kage
X C
ropp
ing
0.04
1.10
0.02
NS
Mo
dip
ura
m
Bas
mat
i ri
ce-w
heat
-ses
bani
a G
M0.
170.
140.
160.
167.
807.
987.
897.
890.
680.
380.
570.
54
Ric
e-ba
rley
+m
usta
rd-G
G0.
100.
070.
080.
087.
807.
967.
887.
880.
480.
290.
380.
38
Mai
ze c
ob-p
otat
o-O
kra
0.17
0.15
0.17
0.16
7.75
7.93
7.74
7.81
0.74
0.37
0.69
0.60
Mai
ze -
mus
tard
+ra
dish
-ses
bani
a G
M0.
200.
150.
180.
187.
787.
967.
817.
850.
670.
420.
700.
60
Mea
n0.
160.
130.
157.
787.
967.
830.
640.
370.
59
Pan
tnag
ar
Bas
mat
i ri
ce-w
heat
-Ses
bani
a0.
960.
820.
940.
91(g
reen
man
urin
g)0.
93
Bas
mat
i ri
ce-l
entil
-ses
bani
a1.
010.
820.
970.
92(g
reen
man
urin
g)
Bas
mat
i ri
ce-v
eget
able
pea
-ses
bani
a0.
980.
840.
930.
90(g
reen
man
urin
g)
Bas
mat
i ri
ce-b
rass
ica
napu
s-0.
950.
850.
91se
sban
ia (
gree
n m
anur
ing)
Mea
n0.
980.
830.
94
Cro
pp
ing
sys
tem
s/p
acka
ge
Bu
lk d
ensi
ty (
g/c
c)E
lect
rica
l co
nd
uct
ivit
y (d
S/m
)pH
Org
anic
car
bo
n (
%)
Org
Inor
gIM
Mea
nO
rgIn
org
IMM
ean
Org
Inor
gIM
Mea
nO
rgIn
org
IMM
ean

Network Project on Organic Farming
Annual Report 2012-1326
CD
(P
=0.
05)
SE
m±
CD
Pac
kage
0.01
0.03
Cro
pp
ing
0.01
NS
Cro
ppin
g X
Pac
kage
0.01
NS
Pac
kage
X C
ropp
ing
0.01
NS
Rai
pur
Soy
bean
-ber
seem
1.29
1.32
1.28
1.30
0.71
0.62
0.64
0.66
Soy
bean
-isa
bgol
1.29
1.32
1.28
1.30
0.70
0.64
0.68
0.67
Soy
bean
-oni
on1.
291.
351.
301.
310.
690.
640.
660.
66
Soy
bean
-saf
flow
er1.
321.
361.
331.
340.
700.
630.
670.
67
Mea
n1.
301.
341.
30.7
00.
630.
66
CD
(P
=0.
05)
SE
m±
CD
SE
m±
CD
Pac
kage
0.01
0.02
0.01
0.03
Cro
pp
ing
0.01
0.02
0.01
NS
Cro
ppin
g X
Pac
kage
0.01
NS
0.01
NS
Pac
kage
X C
ropp
ing
0.01
NS
0.01
NS
Org
= O
rgan
ic,
Inor
g =
In
orga
nic,
IM
= I
nteg
rate
d
Cro
pp
ing
sys
tem
s/p
acka
ge
Bu
lk d
ensi
ty (
g/c
c)E
lect
rica
l co
nd
uct
ivit
y (d
S/m
)pH
Org
anic
car
bo
n (
%)
Org
Inor
gIM
Mea
nO
rgIn
org
IMM
ean
Org
Inor
gIM
Mea
nO
rgIn
org
IMM
ean

Network Project on Organic Farming
Annual Report 2012-13 27

Network Project on Organic Farming
Annual Report 2012-1328
Fig. 2. Influence of management practices and cropping systems on organic carbon content during 2011-12
Dharwad: Lower bulk density (1.20 g/cc), EC (0.18 ds/m) and pH (7.22) were recorded under organicpackage compared to inorganic and integrated. No significant variation in these parameters was observedamong different cropping systems. A significantly higher increase (25.5%) in organic carbon content wasobserved with organic package followed by integrated (13.7%) compared to inorganic. Variation in organiccarbon among various cropping systems was found to be only 0.01%. The improvement in residualavailable N (9.3%) P (35.9%) K (47.9%) was found to be higher with organic package over inorganic.Cotton + pea recorded higher residual N of 278 kg ha-1 while P was higher in groundnut-sorghum. AvailableK was found to be higher with potato-chickpea system. The variation in residual N, P, and K amongdifferent cropping systems was found to be 10.0, 1.3 and 24.0 kg ha-1 respectively. Higher residualavailability of Mn, Zn, Cu and Fe were observed under organic package compared to inorganic andintegrated. Not much variation in availability of micronutrient was observed among different croppingsystems.
Karjat: Significant variation in EC and OC of soil was observed in different cropping as well as inputpackage. Significantly higher EC was observed in integrated package followed by organic packagescompared to inorganic. Soil organic carbon was higher under organic (1.46%) followed by integrated(1.30%) and inorganic (1.16%) packages. Both rice-groundnut and rice-mustard owing to their higherdrop of dry matter to the soil recorded higher organic carbon (1.39 and 1.31% respectively) compared toother systems. Significant variation in soil available N and P was observed among different input packagesas well as in different cropping systems. Organic packages registered significantly higher residual N andP (252 and 28.2 kg ha-1 respectively). Rice-groundnut and rice-dolichos bean (for green pod vegetable)recorded significantly higher available N (256 and 254 kg ha-1 respectively) and P (28.3 and 27.7 kg ha-
1 respectively) compared to other systems.
Ludhiana: Soil EC, pH, OC, available N, P and K was estimated for second set of experiment. Thoughthere was not much variation in EC and pH was observed, soil organic carbon was found to increase by
Inorganic Organic
Comparative growth of cotton at 30 days after sowing atLudhiana
Organic turmeric crop at Ludhiana

Network Project on Organic Farming
Annual Report 2012-13 29
Table 4. Influence of organic, inorganic and integrated package on soil available nitrogen, phosphorus andpotassium at the end of cropping cycle
Cropping/Input system N (kg ha-1) P (kg ha-1) K (kg ha-1)
Org Inorg IM Mean Org Inorg IM Mean Org Inorg IM Mean
Bajaura
Cauliflower-pea-tomato 175 205 191 190 63.5 95.0 79.4 79.3 155 180 173 169
French bean-cauliflower-french bean 160 221 207 196 74.7 98.5 86.6 86.6 166 187 177 176
Cauliflower-pea-cauliflower 207 220 206 211 75.6 94.5 84.2 84.8 167 187 175 176
Maize-garlic 189 234 209 211 72.1 90.7 83.1 82.0 158 184 175 173
Mean 183 220 203 71.5 94.7 83.3 161.5 185 175
Bhopal
Soybean-wheat 280 228 226 245 111 36.9 78.9 76 705 717 704 709
Soybean-mustard 238 236 243 239 100 36.0 81.5 73 680 697 685 687
Soybean-chickpea 251 261 263 258 106 37.4 92.4 79 725 635 683 681
Soybean-linseed 222 217 205 215 58.4 29.9 67.0 52 632 723 689 681
Mean 248 236 234 94 35 80 686 693 690
CD (P=0.05) SEm± CD SEm± CD SEm± CD
Package 3.13 NS 3.80 14.9 15.8 NS
Cropping 3.68 10.9 5.70 16.9 17.6 NS
Cropping X Package 6.36 18.9 9.90 NS 30.6 NS
Package X Cropping 6.34 20.3 9.34 NS 30.8 NS
Calicut
Ginger 126 124 131 127 6.38 20.0 10.9 12.4 149 198 200 182
Turmeric 136 118 132 129 1.42 28.2 43.2 24.3 237 284 252 258
Black pepper 264 269 317 283 35.8 29.7 33.7 33.1 221 228 278 242
Mean 175 170 193 14.5 26.0 29.3 202 237 243
CD (P=0.05) SEm± CD SEm± CD SEm± CD
Package 3.04 9.23 0.59 1.77 5.57 16.6
Cropping 2.82 8.06 0.89 2.55 7.46 21.4
Cropping X Package 4.89 14.0 1.55 4.42 12.7 36.4
Package X Cropping 5.02 14.7 1.39 4.02 11.7 34.1
Coimbatore
Cotton-maize-green manure 247 242 230 240 19.8 18.2 17.6 18.5 680 672 682 678
Chillies-sunflower-green manure 252 246 248 249 21.4 20.6 19.7 20.6 668 642 638 649
Brinjal-sunflower-green manure 228 212 209 216 21.0 19.8 18.2 19.7 639 616 624 626
Mean 242 233 229 20.7 19.5 18.5 662 643 648
Dharwad
Maize-chickpea 269 267 286 274 32.5 25.2 28.8 28.8 392 267 356 338
Cotton+pea 292 256 286 278 33.2 22.7 27.9 27.9 363 256 331 317
Groundnut-sorghum 282 267 280 276 34.2 24.1 29.4 29.2 373 267 360 333
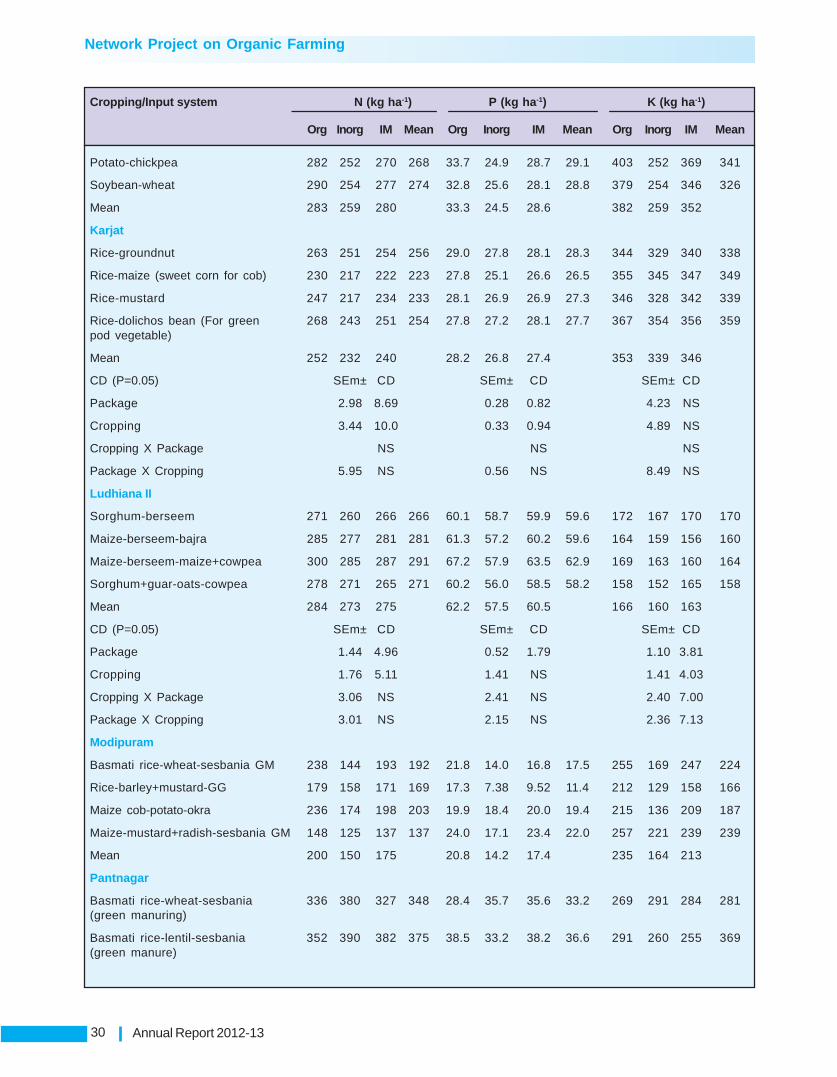
Network Project on Organic Farming
Annual Report 2012-1330
Cropping/Input system N (kg ha-1) P (kg ha-1) K (kg ha-1)
Org Inorg IM Mean Org Inorg IM Mean Org Inorg IM Mean
Potato-chickpea 282 252 270 268 33.7 24.9 28.7 29.1 403 252 369 341
Soybean-wheat 290 254 277 274 32.8 25.6 28.1 28.8 379 254 346 326
Mean 283 259 280 33.3 24.5 28.6 382 259 352
Karjat
Rice-groundnut 263 251 254 256 29.0 27.8 28.1 28.3 344 329 340 338
Rice-maize (sweet corn for cob) 230 217 222 223 27.8 25.1 26.6 26.5 355 345 347 349
Rice-mustard 247 217 234 233 28.1 26.9 26.9 27.3 346 328 342 339
Rice-dolichos bean (For green 268 243 251 254 27.8 27.2 28.1 27.7 367 354 356 359pod vegetable)
Mean 252 232 240 28.2 26.8 27.4 353 339 346
CD (P=0.05) SEm± CD SEm± CD SEm± CD
Package 2.98 8.69 0.28 0.82 4.23 NS
Cropping 3.44 10.0 0.33 0.94 4.89 NS
Cropping X Package NS NS NS
Package X Cropping 5.95 NS 0.56 NS 8.49 NS
Ludhiana II
Sorghum-berseem 271 260 266 266 60.1 58.7 59.9 59.6 172 167 170 170
Maize-berseem-bajra 285 277 281 281 61.3 57.2 60.2 59.6 164 159 156 160
Maize-berseem-maize+cowpea 300 285 287 291 67.2 57.9 63.5 62.9 169 163 160 164
Sorghum+guar-oats-cowpea 278 271 265 271 60.2 56.0 58.5 58.2 158 152 165 158
Mean 284 273 275 62.2 57.5 60.5 166 160 163
CD (P=0.05) SEm± CD SEm± CD SEm± CD
Package 1.44 4.96 0.52 1.79 1.10 3.81
Cropping 1.76 5.11 1.41 NS 1.41 4.03
Cropping X Package 3.06 NS 2.41 NS 2.40 7.00
Package X Cropping 3.01 NS 2.15 NS 2.36 7.13
Modipuram
Basmati rice-wheat-sesbania GM 238 144 193 192 21.8 14.0 16.8 17.5 255 169 247 224
Rice-barley+mustard-GG 179 158 171 169 17.3 7.38 9.52 11.4 212 129 158 166
Maize cob-potato-okra 236 174 198 203 19.9 18.4 20.0 19.4 215 136 209 187
Maize-mustard+radish-sesbania GM 148 125 137 137 24.0 17.1 23.4 22.0 257 221 239 239
Mean 200 150 175 20.8 14.2 17.4 235 164 213
Pantnagar
Basmati rice-wheat-sesbania 336 380 327 348 28.4 35.7 35.6 33.2 269 291 284 281(green manuring)
Basmati rice-lentil-sesbania 352 390 382 375 38.5 33.2 38.2 36.6 291 260 255 369(green manure)

Network Project on Organic Farming
Annual Report 2012-13 31
Cropping/Input system N (kg ha-1) P (kg ha-1) K (kg ha-1)
Org Inorg IM Mean Org Inorg IM Mean Org Inorg IM Mean
Basmati rice-vegetable pea-sesbania 357 384 387 376 38.7 32.4 30.8 34.0 270 284 269 274(green manure)
Basmati rice-brassica napus- 349 330 353 344 29.3 35.9 34.3 33.2 250 265 250 255sesbania (green manure)
Mean 349 371 262 33.7 34.3 34.7 270 275 265
CD (P=0.05) SEm± CD SEm± CD SEm± CD
Package 3.05 12.0 0.92 NS 3.28 NS
Cropping 4.59 13.6 0.95 NS 3.06 9.10
Cropping X Package 7.92 23.6 1.65 4.92 5.30 15.8
Package X Cropping 7.57 23.6 1.70 5.54 5.65 18.6
Raipur
Soybean-berseem 252 269 265 262 12.9 14.6 13.9 13.8 248 255 255 253
Soybean-isabgol 248 269 256 258 12.3 13.0 15.0 13.4 251 261 258 257
Soybean-onion 261 278 274 271 14.3 17.7 14.5 15.5 250 281 270 267
Soybean-safflower 252 278 260 263 15.5 16.3 15.7 15.8 246 281 281 269
Mean 253 274 264 13.8 15.4 14.8 249 270 266
CD (P=0.05) SEm± CD Sem± CD SEm± CD
Package 3.40 11.8 0.28 0.98 3.39 11.7
Cropping 5.39 NS 0.49 1.41 4.24 12.3
Cropping X Package 9.34 NS 0.85 NS 7.36 NS
Package X Cropping 8.77 NS 0.79 NS 7.21 NS
Ranchi
Rice-wheat 273 240 260 258 55.6 57.5 53.0 55.4 215 159 178 184
Rice-potato 292 251 268 270 59.3 60.3 54.0 57.9 230 162 190 194
Rice-linseed 288 238 256 261 54.1 55.3 53.0 54.1 225 154 180 186
Rice-lentil 289 241 266 265 49.6 54.3 52.0 52.0 218 150 176 181
Mean 286 243 263 54.7 56.9 53.0 222 156 181

Network Project on Organic Farming
Annual Report 2012-1332
Tab
le 5
. In
flu
ence
of
org
anic
, in
org
anic
an
d in
teg
rate
d p
acka
ge
on
so
il m
icro
nu
trie
nts
at
the
end
of
cro
pp
ing
cyc
le
Cro
pp
ing
sys
tem
/Pac
kag
eM
n (
pp
m)
Zn
(p
pm
)C
u (
pp
m)
Fe
(pp
m)
Org
Inor
gIM
Mea
nO
rgIn
org
IMM
ean
Org
Inor
gIM
Mea
nO
rgIn
org
IMM
ean
Baj
aura
Cau
liflo
wer
-pea
-tom
ato
27.3
11.2
23.0
20.5
11.5
0.80
7.80
6.70
8.50
0.82
6.20
5.17
79.4
26.5
48.0
51.3
Fre
nch
bean
-cau
liflo
wer
-fre
nch
bean
25.5
10.2
22.9
19.5
15.0
0.84
10.2
8.68
9.00
0.90
7.30
5.73
72.2
21.2
55.6
49.7
Cau
liflo
wer
-pea
-cau
liflo
wer
30.0
9.30
26.6
22.0
11.8
0.97
10.4
7.72
10.0
0.80
8.50
6.43
81.3
22.5
56.0
53.3
Mai
ze-g
arlic
29.1
11.0
24.9
21.7
10.8
0.78
10.0
7.19
10.1
0.80
9.80
6.90
66.9
20.4
56.7
48.0
Mea
n28
.010
.424
.412
.30.
859.
609.
400.
837.
9575
.022
.754
.1
Cal
icu
t
Gin
ger
4.14
9.13
7.80
7.02
1.28
0.94
1.35
1.19
15.5
14.5
16.1
15.4
51.3
50.5
48.5
50.1
Tur
mer
ic12
.117
.519
.716
.41.
261.
341.
341.
311.
902.
572.
462.
3148
.549
.751
.349
.8
Bla
ckpe
pper
13.0
19.2
10.5
14.2
2.41
2.30
2.30
2.34
7.96
6.83
8.23
7.67
30.3
26.7
31.8
29.6
Mea
n9.
7515
.312
.71.
651.
531.
668.
457.
978.
9343
.442
.343
.9
Dh
arw
ad
Mai
ze-c
hick
pea
11.3
8.73
11.2
10.4
0.94
0.69
0.79
0.81
1.67
1.26
1.53
1.49
8.96
7.96
9.15
8.69
Cot
ton+
pea
12.1
9.18
11.0
10.8
/0.
820.
710.
750.
761.
611.
311.
491.
479.
177.
658.
438.
42
Gro
un
dn
ut-
sorg
hu
m11
.69.
0711
.210
.60.
920.
780.
880.
861.
421.
341.
571.
449.
127.
598.
638.
45
Pot
ato-
chic
kpea
12.4
9.19
10.7
10.8
1.03
0.79
0.84
0.89
1.72
1.39
1.69
1.60
8.61
8.01
8.31
8.31
Soy
bean
-whe
at11
.710
.110
.810
.90.
890.
830.
910.
881.
631.
371.
441.
489.
087.
828.
068.
32
Mea
n11
.89.
2511
.00.
920.
760.
831.
611.
331.
548.
997.
818.
52
Pan
tnag
ar
Ba
sma
ti ri
ce-w
he
at-
sesb
an
ia11
.18
.83
8.05
9.33
0.69
0.66
0.59
0.65
1.38
1.01
1.03
1.14
28.7
20.0
23.6
24.1
(gre
en m
anur
e)
Ba
sma
ti ri
ce–
len
til–
sesb
an
ia11
.77.
897.
899.
160.
730.
600.
640.
661.
591.
171.
271.
3426
.322
.124
.024
.1(g
reen
man
ure)
Bas
mat
i ric
e-ve
geta
ble
pea-
11.8
6.36
7.79
8.65
0.52
0.61
0.64
0.59
1.57
0.95
1.40
1.31
27.0
20.0
23.3
23.4
sesb
ania
(gr
een
man
ure)
Bas
mat
i ri
ce-b
rass
ica
napu
s-9.
316.
218.
578.
030.
750.
660.
680.
701.
480.
680.
750.
9725
.023
.623
.224
.0se
sban
ia (
gree
n m
anur
e)
Mea
n11
.07.
328.
080.
670.
630.
641.
510.
951.
1127
.021
.423
.5
CD
(P
=0.
05)
SE
m±
CD
SE
m±
CD
SE
m±
CD
SE
m±
CD
Pac
kage
0.42
1.67
0.01
NS
0.03
0.12
0.34
1.34
Cro
pp
ing
0.25
0.75
0.02
0.07
0.05
0.14
0.57
NS
Cro
ppin
g X
Pac
kage
0.44
1.30
0.04
NS
0.08
0.25
1.00
2.95
Pac
kage
X C
ropp
ing
0.57
2.01
0.04
NS
0.08
0.24
0.93
2.87

Network Project on Organic Farming
Annual Report 2012-13 33
22.8% under organic compared to inorganic package. Sorghum+guar-oats-cowpea registered higher OCof 0.57% compared to other systems. Available N, P and K was observed to be higher with organic inputsystem.. Among the cropping systems, maize-berseem-maize+cowpea recorded significantly higherresidual N (291 kg ha-1) and P (62.9 kg ha-1) while K was significantly higher under sorghum-berseem(170kg ha-1) system.
Modipuram: Soil EC, PH, OC, available N, P and K were estimated during the year. The result revealsthat not much variation in EC and PH among various management practice and cropping systems.However, the soil quality under inorganic package deteriorated as it is evidenced through reduction inorganic carbon by 73% under inorganic over organic package. Among the different cropping systems,maize for cob-potato-okra and maize-mustard+radish-sesbania (greenmanure) systems recorded higherorganic carbon (0.60%). At the end of cropping cycle, it was observed that, the available N, P and Kwere higher with organic package followed by integrated. The residual soil P and K was higher in maize-mustard+radish-greengram (22.0 and 239 kg ha-1) system while N was higher in maize cob-potato-okrasystem (203 kg ha-1).
Evaluation of nutrient inputs for Basmati rice atModipuram
Evaluation of maize + cowpea system under organicmanagement at Modipuram
Pantnagar: Soil OC was found to be 16.9 and 13.2% higher with organic and integrated over inorganicpackage. Among the various cropping systems, basmati rice-lentil-sesbania (green manure) systemresulted in higher OC (0.93%) followed by basmati rice-vegetable pea-sesbania (green manure) 0.92%.Available N, at the end of cropping cycle was significantly influenced by both input and cropping systempackages. Drop in residual N was observed to the level of 5.9% with organic over inorganic while P andK were observed statistically non-significant.Significantly higher available N was recorded withbasmati rice-vegetable pea–sesbania (greenmanure) system (376 kg ha-1). Basmati rice-lentil-sesbania (green manure) recorded higher residualK (369 kg ha-1) compared to other systems. AvailableP did not differ significantly among the system.Available Mn, Cu and Fe were significantly influencedby different input packages. Residual Mn, and Cuwas found to increase by > 50% with organic overinorganic package while in Fe, the increase wasobserved to be 26.2% only. Among the varioussystems, Basmati rice-lentil-sesbania (greenmanure) registered significantly higher residualavailability of Cu in soil while Basmati rice-wheat- Sesbania green manuring in organic field at Pantnagar

Network Project on Organic Farming
Annual Report 2012-1334
Table 6. Influence of methods of organic, inorganic and integrated on soil microbial count (x104 CFU/g) at the end ofcropping cycle
Cropping system/ Fungi Bacteria Actinomycetespackage
Org Inorg Integ Mean Org Inorg Integ Mean Org Inorg Integ Mean
Dharwad
Maize-chickpea 8.0 5.0 11.0 8.0 12.0 6.0 8.0 8.7 46.0 18.0 16.0 26.7
Cotton+pea 7.0 8.0 11.0 8.7 8.0 8.0 6.0 7.3 53.0 5.0 52.0 36.7
Groundnut-sorghum 7.0 5.0 4.0 5.3 9.0 5.0 19.0 11.0 73.0 45.0 47.0 55.0
Potato-chickpea 23.0 10.0 4.0 12.3 4.0 8.0 3.0 5.0 86.0 70.0 49.0 68.3
Soybean-wheat 4.0 9.0 6.0 6.3 6.0 10.0 4.0 6.7 73.0 24.0 31.0 42.7
Mean 9.8 7.4 7.2 7.8 7.4 8.0 66.2 32.4 39.0
sesbania (green manure) recorded higher Mn. Basmati rice-brassica napus-sesbania (green manure)recorded higher Zn. Availability of Fe did not differ significantly among the cropping systems.
Raipur: Soil bulk density, organic carbon, available N, P and K were estimated at the end of croppingcycle. The soil bulk density was observed significantly lower with organic (1.30 g/cc) over inorganic (1.34g/cc). Considerably higher bulk density of 1.34 g/cc was observed with soybean-safflower system. Around11.1% higher organic carbon was observed under organic than inorganic package. No significant variationin residual organic carbon was observed among different cropping system. Significantly lower availableN, P and K was observed under organic package compared to inorganic irrespective of cropping systems.Though available N did not differ significantly among systems, soybean-safflower systems resulted inhigher residual P (15.7 kg ha-1) and K (269 kg ha-1). The reverse trend of lower.
Ranchi: Available N, P and K were estimated at the end of cropping cycle. The available N and K werehigher with organic package followed by integrated while P was higher under inorganic package. Rice-potato system recorded higher residual soil N, P and K (270, 57.9 and 194 kg ha-1).
Soil microbial count (Table 6)
Soil microbial count was estimated at Dharwad only. The increase in fungi and actinomyceteswas found to be 32.4% and >100% with organic over inorganic package while higher bacteria’s populationwas recorded with integrated (8.1%). Considerably higher count of fungi (92.3x10⁴ CFU/g) andactinomycetes (68.3x10⁴CFU/g) was observed with potato-chickpea systems while ground nut-soybeanrecorded higher bacteria count (11x104 CFU/g).
Economics (Table 7)
Bajaura: Gross return was significantly higher (60.7%) with integrated followed by organic (43.2%) overinorganic package. Due to the lower cost of cultivation under these treatments, the increase in net returnswas 132 and 177% higher with organic and integrated over inorganic package. Higher B: C ratio of 1.79was recorded with integrated system. All the systems registered higher B: C ratio with integrated packageand among the systems, maize-garlic recorded higher B: C ratio of 3.60.
Coimbatore: An increase in cost of cultivation due to organic and integrated package was observed (20.6and 8.0% respectively). Further, the gross return was less by 15.2% with organic over inorganic packages.Consequence of this reduced net return (34.4 and 4.6%) was observed with organic and integratedpackage respectively. Among the systems, brinjal-sunflower-green manure recorded higher net return ofRs. 1,00,546 ha-1 but higher BC ratio of 1.80was recorded with cotton-maize-green manure system. Allthe system performed better with inorganic in terms of economics.

Network Project on Organic Farming
Annual Report 2012-13 35
Tab
le 7
. In
flu
ence
of
org
anic
, in
org
anic
an
d i
nte
gra
ted
pac
kag
e o
n e
con
om
ics
of
dif
fere
nt
cro
ps a
nd
cro
pp
ing
sys
tem
Cro
pp
ing
sys
tem
/pac
kag
eG
ross
ret
urn
s (R
s. h
a-1)
Co
st o
f cu
ltiv
atio
n (
Rs.
ha-1
)N
et r
etu
rns
(Rs.
ha-1
)B
:C r
atio
Org
Ino
rgIM
Mea
nO
rgIn
org
IMM
ean
Org
Ino
rgIM
Mea
nO
rgIn
org
IMM
ean
Baj
aura
Cau
liflo
wer
-pea
-tom
ato
2681
8814
9170
2904
7023
5943
1426
0814
7977
1452
8514
5290
1255
8011
9314
5185
9065
30.
880.
011.
000.
63
Fre
nch
bean
-cau
liflo
wer
-fre
nch
bean
2761
9421
4595
2814
5025
7413
1469
9315
4826
1540
9215
1970
1292
0159
769
1273
5810
5443
0.87
0.39
0.83
0.70
Cau
liflo
wer
-pea
-cau
liflo
wer
2401
3811
6930
2801
0021
2389
1375
9114
5061
1438
4114
2164
1025
47-2
8131
1362
5970
225
0.75
-0.1
90.
950.
50
Mai
ze-g
arlic
3952
2834
3088
4717
6040
3359
8609
089
292
8769
187
691
3091
3825
3796
3840
6931
5668
3.59
2.84
4.38
3.60
Mea
n29
4937
2059
4633
0945
1283
2113
4289
1327
2716
6617
7165
719
8218
1.52
0.76
1.79
Co
imb
ato
re
Cot
ton-
mai
ze -g
reen
man
ure
1061
8411
4383
1245
8011
5049
4625
937
158
4136
641
594
5992
577
225
8321
473
455
1.30
2.08
2.01
1.80
Chi
llies
-sun
flow
er-g
reen
man
ure
9380
410
4340
1058
8210
1342
5587
046
953
5056
351
129
3793
457
387
5531
950
213
0.68
1.22
1.09
1.00
Brin
jal-s
unflo
wer
-gre
en m
anur
e13
5630
1771
3016
4470
1590
7764
409
5398
457
200
5853
171
221
1231
4610
7270
1005
461.
112.
281.
881.
75
Mea
n11
1873
1319
5113
1644
5551
346
032
4971
056
360
8591
981
934
1.03
1.86
1.66
Dh
arw
ad
Mai
ze-c
hick
pea
6929
953
872
6151
961
563
3051
720
908
2436
625
264
3878
232
964
3715
436
300
2.29
2.49
2.52
2.43
Cot
ton+
pea
1081
1667
523
1015
6392
401
3042
526
939
2918
228
849
7769
140
584
7238
163
552
4.06
2.78
3.83
3.56
Gro
undn
ut-s
orgh
um13
7584
9908
612
8203
1216
2430
021
2753
728
460
2867
310
7563
7154
999
743
9295
24.
123.
284.
063.
82
Pot
ato-
chic
kpea
8306
371
646
6864
374
451
4607
736
448
4032
140
949
3698
627
341
2832
230
883
2.13
2.00
2.02
2.05
Soy
bean
-whe
at80
455
5527
665
898
6721
029
994
2091
827
901
2627
150
461
3435
837
997
4093
92.
432.
442.
192.
35
Mea
n95
703
6948
185
165
3340
726
550
3004
662
297
4135
955
119
3.01
2.60
2.92
Jab
alp
ur
Bas
mat
i ric
e-D
.whe
at-g
reen
man
ure
1571
8513
5446
1244
9813
9043
6272
965
910
5854
462
394
9445
669
536
6595
476
649
2.51
2.06
2.13
2.23
Bas
mat
i ric
e-ch
ickp
ea-s
easm
um12
5703
1133
8410
7080
1153
8961
816
6301
858
728
6118
763
887
5036
648
352
5420
22.
031.
801.
821.
88
Bas
mat
i ric
e-be
rsee
m14
5145
1385
8313
1349
1383
5963
699
6394
160
234
6262
581
446
7464
271
115
7573
42.
282.
172.
182.
21
Bas
mat
i ric
e-ve
g.pe
a-so
rghu
m15
6105
1463
9113
8465
1469
8765
096
6567
964
062
6494
691
009
8071
274
404
8204
22.
402.
232.
162.
26
Mea
n14
6035
1334
5112
5348
6333
564
637
6039
282
700
6881
464
956
2.31
2.07
2.07
Mo
dip
ura
m
Bas
mat
i ric
e-w
heat
-ses
bani
a (G
M)
1412
0810
0493
1213
7512
1025
6010
829
494
4465
144
751
8110
070
999
7672
476
274
1.35
2.41
1.72
1.82
Ric
e-ba
rley+
mus
tard
-gre
en g
ram
1497
7410
9839
1251
3312
8249
7225
536
364
5408
554
235
7751
973
475
7104
774
014
1.07
2.02
1.31
1.47

Network Project on Organic Farming
Annual Report 2012-1336
Cro
pp
ing
sys
tem
/pac
kag
eG
ross
ret
urn
s (R
s. h
a-1)
Co
st o
f cu
ltiv
atio
n (
Rs.
ha-1
)N
et r
etu
rns
(Rs.
ha-1
)B
:C r
atio
Org
Ino
rgIM
Mea
nO
rgIn
org
IMM
ean
Org
Ino
rgIM
Mea
nO
rgIn
org
IMM
ean
Mai
ze -p
otat
o-ok
ra41
9205
2934
0433
8982
3505
3011
9962
7149
295
503
9565
229
9243
2219
1124
3479
2548
782.
493.
102.
552.
72
Mai
ze c
ob-m
usta
rd+r
adis
h-S
esba
nia
GM
1297
8195
664
1152
5111
3565
4254
022
907
3257
432
674
8724
172
757
8267
780
892
2.05
3.18
2.54
2.59
Mea
n20
9992
1498
5017
5185
7371
640
064
5670
313
6276
1097
8611
8482
1.74
2.68
2.03
Pan
tnag
ar
Bas
mat
i ric
e-w
heat
-ses
bani
a16
2736
1222
4813
0745
1385
7658
368
5019
453
365
5397
610
4368
7205
477
380
8460
02.
792.
432.
452.
56(g
reen
man
ure)
Bas
mat
i ric
e-le
ntil-
sesb
ania
2536
1217
3100
1926
3420
6449
5217
545
306
4409
647
192
2014
3712
7794
1485
3815
9256
4.86
3.82
4.37
4.35
(gre
en m
anur
e)
Bas
mat
i ric
e-ve
geta
ble
pea-
1555
7610
6563
1156
0512
5915
5365
549
016
5875
853
810
1019
2157
547
5684
772
105
2.90
2.17
1.97
2.35
sesb
ania
(gr
een
man
ure)
Bas
mat
i ric
e-br
assi
ca n
apus
-13
9733
1006
4910
7949
1161
1054
875
4992
447
495
5076
584
858
5072
560
454
6534
62.
552.
022.
272.
28se
sban
ia (
gree
n m
anur
e)
Mea
n17
7914
1256
4013
6733
5476
848
610
5092
912
3146
7703
085
805
3.27
2.61
2.76
Rai
pu
r
Soy
bean
-ber
seem
7651
056
955
6434
465
936
3978
234
181
3554
536
503
3672
822
774
2879
929
434
1.01
0.70
0.83
0.85
Soy
bean
-isab
gol
6532
057
173
5770
560
066
4549
935
627
3723
139
452
1982
121
546
2047
420
614
0.44
0.62
0.55
0.54
Soy
bean
-oni
on12
8008
1210
6712
0008
1230
2860
271
4992
053
250
5448
067
737
7114
766
758
6854
70.
951.
181.
061.
06
Soy
bean
-saf
flow
er74
345
5974
769
613
6790
248
180
3685
839
173
4140
426
165
2288
930
440
2649
80.
530.
620.
760.
64
Mea
n86
046
7373
677
918
4843
339
147
4130
037
613
3458
936
618
0.73
0.78
0.80
Ran
chi
Ric
e -
Whe
at11
7031
6394
967
494
8282
558
090
3496
446
527
4652
758
941
5791
138
371
5174
11.
151.
791.
121.
35
Ric
e - P
otat
o22
4725
1463
4016
6500
1791
8886
630
6378
175
205
7520
513
8095
8255
991
295
1039
831.
771.
811.
461.
68
Ric
e -
Lins
eed
8792
276
717
6706
177
233
4018
125
057
3261
932
619
6397
846
208
4891
153
032
0.94
1.24
0.84
1.01
Ric
e -
Lent
il99
096
7601
779
677
8493
038
251
2609
832
174
3217
460
846
4991
947
503
5275
61.
511.
841.
491.
61
Mea
n13
2194
9075
695
183
5578
837
475
4663
180
465
5914
956
520
1.34
1.67
1.23

Network Project on Organic Farming
Annual Report 2012-13 37
Dharwad: Organic input package resulted in 37.7% increase in gross returns over inorganic whileintegrated recorded increase to the level of 22.6%. The same trend was also reflected in cost of cultivationas organic package resulted in 25.8% increased cost while integrated recorded 13.2%. Considerablyhigher (50.6%) net return with organic was recorded whereas integrated recorded 33.3% increase overinorganic. B: C ratio was found to be higher with organic input (3.01). Among the cropping systems,groundnut-sorghum recorded higher B: C ratio of 3.82. The same system and cotton+pea recorded higherB: C ratio with organic package while for maize-chickpea, integrated was found to be more effective.Cotton+pea and ground-sorghum systems registered higher B:C ratio of 4.06 and 4.12 respectively withorganic package.
Jabalpur: Organic nutrient input recorded 9.4% increase in gross returns, 2% reduction in cost ofcultivation and 20.2% increase in net returns. The B: C ratio was also higher (2.31) compared to inorganicand integrated packages. Among the cropping systems, basmati rice-vegetable pea-sorghum registeredhigher gross return (Rs. 1,46,987 ha-1), net returns (Rs. 82042 ha-1) and B: C ratio (2.26). Invariably, allthe system recorded higher net returns and B: C ratio with organic management.
Modipuram: Organic and integrated package increased the gross returns by 40.1% and 16.9% overinorganic irrespective of cropping systems. Though the cost of cultivation was higher under organic (84%)and integrated (41.5%), considerably higher net returns was recorded with organic (24.1%) and integrated(8%) over inorganic mainly due to premium price. Among the different systems, maize for cob-potato-okra recorded higher gross returns (Rs. 3,50,530 ha-1), net returns (Rs. 2,54,878 ha-1) and B: C ratio(2.72). Higher B: C ratio of 2.68 was observed under inorganic management due to lower cost ofcultivation.
Pantnagar: Increase in gross returns with organic and integrated was found to be 41.6 and 8.8% overinorganic package. Cost of cultivation, net return and B: C ratio also followed the same trend with organicpackage recording Rs. 54786 ha-1, Rs. 123146 ha-1 and 3.27 followed by integrated Rs. 50929 ha-1, Rs.85805 ha-1 and 2.76 respectively. Among the systems, basmati rice-lentil-sesbania (green manure) resultedin higher B: C ratio of 4.35. All the systems recorded higher BC ratio under organic package.
Raipur: The cost of cultivation with organic and integrated package was found to increase by 23.7 and5.5% over inorganic. Net returns increased only 8.7% with organic and 5.9% with integrated package.Though higher gross return of 16.7% and 5.7% was observed with organic and integrated, owing to highercost of cultivation, marginal difference was observed in B: C ratio between integrated and inorganicpackage (0.78). Soybean-onion system recorded higher gross returns of Rs. 1,23,028 ha-1, cost ofcultivation (Rs. 54, 480 ha-1), net returns (Rs. 68547 ha-1)and B: C ratio (1.06). B: C ratio of soybean-berseem was found to be higher (1.01) with organic while soybean-onian recorded higher (1.18) underinorganic package.
Ranchi: Organic and integrated package recorded increase in gross returns by 45.7 and 4.9% respectivelyover inorganic. The cost of cultivation also found to be 48.9 and 24.4% higher with these packagesrespectively. Owing to higher gross returns, an increase in net return by 36% was recorded with organicwhile under integrated, net returns dropped by 4.4%. Inorganic package recorded higher B: C ratio of1.67 followed by organic (1.34). Among the systems, rice-potato recorded higher B: C ratio (1.68) whilerice-linseed recorded lowest (1.01).
Nutrient uptake (Table 8 to 12)
Six centres estimated uptake of nutrient for all the crops evaluated under different management practices.
Bajaura: Crops like cauliflower, pea, french bean and maize have recorded higher N uptake underintegrated whereas, tomato and garlic have took higher N under organic package. Higher P uptake ofpea (0.66%), tomato (0.22%), french bean (0.38%), cauliflower (0.42%) and garlic (0.39%) was observedwith organic package. K uptake was also found to be better under organic package for almost all thecrops grown in the system during kharif and rabi while in summer, integrated package recorded higher

Network Project on Organic Farming
Annual Report 2012-1338
K. Fe uptake was higher either under organic or integrated package. Among the different crops, higheruptake of 445 g ha-1 was observed with cauliflower. Cu and Mn uptake also followed the similar trend forvarious vegetable crops grown in the sequence while Zn was recorded higher with french bean.
Dharwad: N, P and K uptake in all the crops were found to be higher under organic package exceptmaize. Crops like Groundnut (207 kg ha-1), potato (134 kg ha-1), soybean (257 kg ha-1) and chickpea(102 kg ha-1) have recorded higher N uptake under organic management. P and K also followed the similartrend for various crops grown in the sequence. Maize crop uptake was found to be better under inorganicmanagement.
Ludhiana: In the second set of experiment in involving fodder crops, uptake of nutrients were assessedduring kharif only. The uptake of N increased by 34.4% in sorghum, 17.1% in maize and 31.3% insorghum+gaur under organic over inorganic package. The result reveals that uptake of P was found tobe better under organic for sorghum (27.3 kg ha-1) and sorghum+guar (38.7 kgha-1). K uptake was alsoobserved in the same trend with sorghum+gaur recording higher uptake of 110 kg ha-1 K under organicpackage.
Organic Basmati rice crop at Ludhiana Organic cotton crop at Ludhiana
Pantnagar:. Higher N uptake in basmati rice was observed with integrated (77.2 kg ha-1) followed byorganic (75.2 kg ha-1) over organic (70.6 kg ha-1) package. N uptake of basmati rice was significantlyinfluenced by cropping system. Around 23% higher P uptake with organic package compared to inorganicwas observed for basmati rice. K uptake by basmati rice was significantly higher (69.1 kg ha-1) with organicpackage.
Raipur: Significant difference in N uptake during kharif due to various management packages wasobserved. Among the different crops, uptake was higher in soybean under integrated (96.3 kgha-1) followedby berseem (82.4 kg ha-1). P uptake was highly influenced by management practice especially forsoybean. Integrated recorded higher uptake of P (17.9 kg ha-1) followed by inorganic (14.6 kg ha-1). Similartrend was observed for K uptake also. Although K uptake rate remained non significant during rabi. Soybeanin kharif recorded higher K uptake (53.2 kg ha-1) under integrated package.
Ranchi: Rice recorded N uptake of 103.5 kg ha-1 with organic followed by integrated (95.7 kg ha-1) andinorganic (87.2 kg ha-1). N uptake of potato and was found to be higher (63.4 kg ha-1) with organic whilewheat was higher with inorganic. P uptake of rice was also higher under organic package (21.0 kg ha-1)followed by integrated (18.2 kg ha-1). Potato recorded higher P uptake (47.2 kg ha-1) with organic. Like Nand P, K uptake also registered similar trend in rice with organic (72.4 kg ha-1) package recorded higheruptake followed by integrated (66.9 kg ha-1). Higher K uptake in wheat, lentil and linseed was observedwith inorganic while K uptake of potato was found to better under organic (211.2 kg ha-1).

Network Project on Organic Farming
Annual Report 2012-13 39
Table 8. Influence of organic, inorganic and integrated on N uptake (kg ha-1) of crops
Cropping systems/ Organic Inorganic Integrated
package
Kharif Rabi Summer Kharif Rabi Summer Kharif Rabi Summer
Bajaura
Cauliflower-pea-tomato 0.75 1.68 0.78 0.74 1.62 0.75 0.80 1.90 0.74
French bean-cauliflower- 1.56 0.88 1.25 1.42 0.64 1.29 1.66 0.75 1.35french bean
Cauliflower-pea-cauliflower 0.85 1.65 0.80 0.80 1.58 0.77 0.88 1.94 0.86
Maize-garlic 0.60 0.65 0.55 0.56 0.62 0.58
Dharwad
Maize-chickpea 206.0 78.0 234.0 58.8 217.0 73.8
Cotton+Pea 24.5 83.1 21.9 61.7 19.7 74.4
Groundnut-Sorghum 207.0 92.3 178.0 66.2 192.0 65.3
Potato-chickpea 134.0 102.0 127.0 90.4 116 106.0
Soybean-wheat 257.0 72.5 203.0 43.9 236.0 57.1
Ludhiana II
Sorghum-berseem 105.5 78.5 95.8
Maize-berseem-bajra 66.1 56.5 65.3
Maize-berseem- 67.5 57.9 66.8maize+cowpea
Sorghum+guar- 123.6 94.1 112.5oats-cowpea
Kharif
CD (P=0.05) SEm± CD
Input 2.84 9.81
Cropping 3.57 10.4
Cropping X Input 6.19 NS
Input X Cropping 6.06 NS
Pantnagar
Basmati rice-wheat- 68.6 72.3 76.9sesbania (green manure)
Basmati rice-lentil- 79.1 76.1 89.9sesbania (green manure)
Basmati rice-vegetable 74.1 66.6 69.2pea-sesbania (greenmanure)
Basmati rice-Brassica 79.1 67.3 72.7napus-sesbania(green manure)
Kharif
CD (P=0.05) SEm± CD
Input 1.56 NS

Network Project on Organic Farming
Annual Report 2012-1340
Cropping 1.20 6.05
Cropping X Input 2.07 6.16
Input X Cropping 2.36 7.99
Raipur
Soybean-berseem 86.6 81.2 86.3 77.6 102.4 82.4
Soybean-isabgol 85.9 6.11 83.5 8.63 95.9 7.46
Soybean-onion 80.3 23.2 79.6 30.0 92.8 28.0
Soybean-safflower 81.8 38.5 81.1 41.5 94.3 47.2
Kharif Rabi
CD (P=0.05) SEm± CD SEm± CD
Input 1.32 4.54 1.29 NS
Cropping 1.36 3.93 1.89 5.49
Cropping X Input 2.35 NS 3.27 NS
Input X Cropping 2.42 NS 3.12 NS
Ranchi
Rice - wheat 105.4 50.1 88.6 64.4 96.8 58.0
Rice - potato 113.1 63.4 94.4 52.8 102.5 62.7
Rice - linseed 101.6 44.8 83.8 43.6 93.6 44.6
Rice - lentil 93.8 37.6 82.0 44.0 90.0 43.3
Cropping systems/ Organic Inorganic Integrated
package
Kharif Rabi Summer Kharif Rabi Summer Kharif Rabi Summer
Table 9. Influence of inorganic, inorganic and integrated on P uptake (kg ha-1) of crops
Cropping systems/ Organic Inorganic Integrated
package
Kharif Rabi Summer Kharif Rabi Summer Kharif Rabi Summer
Bajaura
Cauliflower-pea-tomato 0.38 0.66 0.22 0.35 0.42 0.18 0.38 0.57 0.20
French bean-cauliflower- 0.38 0.40 0.33 0.32 0.28 0.30 0.34 0.36 0.32french bean
Cauliflower-pea-cauliflower 0.40 0.58 0.50 0.32 0.45 0.40 0.35 0.55 0.48
Maize-garlic 0.30 0.39 0.23 0.30 0.28 0.35
Dharwad
Maize-chickpea 26.3 23.4 28.5 18.7 24.1 21.2
Cotton+pea 2.90 10.2 2.10 9.10 2.40 9.30
Groundnut-sorghum 20.1 19.1 17.7 11.6 19.1 17.3
Potato-chickpea 18.4 22.8 21.8 19.5 16.3 21.9
Soybean-wheat 20.8 25.5 12.4 20.2 19.7 24.0

Network Project on Organic Farming
Annual Report 2012-13 41
Ludhiana II
Sorghum-berseem 27.3 21.1 25.4
Maize-berseem-bajra 21.0 24.2 24.8
Maize-berseem- 25.8 25.3 28.9maize+cowpea
Sorghum+guar- 38.7 24.9 35.3oats-cowpea
Kharif
CD (P=0.05) SEm± CD
Package 1.81 NS
Cropping 2.08 6.04
Cropping X Package 3.60 NS
Package X Cropping 3.61 NS
Pantnagar
Basmati rice-wheat- 14.3 10.9 12.2sesbania (green manure)
Basmati rice-lentil- 13.0 11.0 13.0sesbania (greenmanure)
Basmati rice-vegetable 12.5 11.5 11.7pea-sesbania (greenmanure)
Basmati rice-brassica 14.3 10.5 11.9napus-sesbania(green manure)
Kharif
CD (P=0.05) SEm± CD
Package 0.33 1.29
Cropping 0.57 NS
Cropping X Package 0.99 NS
Package X Cropping 0.92 NS
Raipur
Soybean-berseem 14.0 11.5 15.1 11.0 19.0 11.5
Soybean-isabgol 13.7 0.67 14.8 1.08 17.9 0.88
Soybean-onion 13.2 7.61 13.6 11.4 17.1 9.05
Soybean-safflower 13.2 9.92 15.0 10.7 17.8 12.4
Kharif Rabi
CD (P=0.05) SEm± CD SEm± CD
Package 0.35 1.20 0.42 NS
Cropping systems/ Organic Inorganic Integrated
package
Kharif Rabi Summer Kharif Rabi Summer Kharif Rabi Summer

Network Project on Organic Farming
Annual Report 2012-1342
Cropping systems/ Organic Inorganic Integrated
package
Kharif Rabi Summer Kharif Rabi Summer Kharif Rabi Summer
Cropping 0.30 0.89 0.74 2.13
Cropping X Package 0.53 NS 1.27 NS
Package X Cropping 0.58 NS 1.18 NS
Ranchi
Rice - wheat 21.0 8.33 16.2 11.6 18.2 10.0
Rice - potato 23.3 47.2 17.8 40.6 19.8 46.2
Rice - linseed 20.1 2.56 15.5 2.76 17.9 2.63
Rice - lentil 19.4 5.80 14.9 7.61 16.8 7.00
Table 10. Influence of inorganic, inorganic and integrated on K uptake (kg ha-1) of crops
Cropping systems/ Organic Inorganic Integrated
package
Kharif Rabi Summer Kharif Rabi Summer Kharif Rabi Summer
Bajaura
Cauliflower-pea-tomato 0.68 0.79 0.62 0.61 0.60 0.59 0.65 0.70 0.66
French bean-cauliflower- 0.85 0.74 0.72 0.77 0.60 0.69 0.83 0.68 0.73french bean
Cauliflower-pea-cauliflower 0.70 0.80 0.53 0.62 0.65 0.48 0.67 0.70 0.56
Maize-garlic 0.70 0.65 0.62 0.58 0.66 0.60
Dharwad
Maize-chickpea 158 97.4 179 71.1 168 75.1
Cotton+pea 20.3 91.2 12.9 60.4 19.5 82.9
Groundnut-sorghum 71.6 72.6 56.2 48.4 58.5 61.3
Potato-chickpea 115 116 90.2 91.9 104 102
Soybean-wheat 113 69.3 98.1 30.5 106 35.6
Ludhiana II
Sorghum-berseem 95.9 73.9 90.5
Maize-berseem-bajra 64.1 56.1 61.4
Maize-berseem- 60.7 60.1 63.0maize+cowpea
Sorghum+guar-oats- 110 86.0 106cowpea
Kharif
CD (P=0.05) SEm± CD
Input 3.76 NS
Cropping 3.57 10.4
Cropping X Input 6.18 NS
Input X Cropping 6.53 NS

Network Project on Organic Farming
Annual Report 2012-13 43
Pantnagar
Basmati rice-wheat- 73.7 54.8 75.8sesbania (green manure)
Basmati rice-lentil- 70.3 55.3 66.3sesbania (green manure)
Basmati rice-vegetable 66.3 58.9 62.3pea-sesbania (greenmanure)
Basmati rice-brassica 65.9 63.5 60.9napus-sesbania(green manure)
Kharif
CD (P=0.05) SEm± CD
Input 2.02 7.95
Cropping 2.10 NS
Cropping X Input 3.64 NS
Input X Cropping 3.75 NS
Raipur
Soybean-berseem 44.6 83.5 44.2 79.1 57.8 84.9
Soybean-isabgol 43.8 2.26 43.8 3.02 53.6 2.60
Soybean-onion 41.3 11.4 40.3 15.9 48.8 14.3
Soybean-safflower 41.7 11.6 43.5 12.3 52.6 14.0
Kharif Rabi
CD (P=0.05) SEm± CD SEm± CD
Input 0.59 2.04 1.12 NS
Cropping 0.88 2.54 1.81 5.25
Cropping X Input 1.51 NS 2.93 NS
Input X Cropping 1.44 NS 3.13 NS
Ranchi
Rice-wheat 73.8 30.2 64.0 37.7 67.5 33.9
Rice-potato 79.3 211 66.3 165.6 71.0 197.6
Rice-linseed 68.9 21.7 60.5 24.8 66.3 21.1
Rice-lentil 67.4 21.9 59.8 26.7 62.6 25.5
Cropping systems/ Organic Inorganic Integrated
package
Kharif Rabi Summer Kharif Rabi Summer Kharif Rabi Summer
Quality of organic produces (Table 12)
Only protein content was estimated for all the crops in kharif and rabi at Dharwad. The result revealedthat though numerically higher protein content was observed under inorganic package, but it was on parwith organic and integrated. Among the crops, groundnut recorded higher protein (19.3%) under inorganicpackage while chickpea recorded higher protein with integrated (20.4%).

Network Project on Organic Farming
Annual Report 2012-1344
Table 11. Influence of inorganic, inorganic and integrated on Fe, Cu, Mn and Zn uptake (g ha-1)of crops at Bajura
Cropping systems/ Organic Inorganic Integrated
package
Kharif Rabi Summer Kharif Rabi Summer Kharif Rabi Summer
Fe
Cauliflower-pea-tomato 422.5 388.6 272.5 355.2 352.4 222.5 406.4 370.8 235.0
French bean-cauliflower- 409.8 413.5 418.0 283.0 352.2 375.0 356.8 388.4 390.4french bean
Cauliflower-pea- 445.4 386.5 260.0 310.3 363.4 215.5 413.1 375.2 226.7cauliflower
Maize-garlic 405.6 298.0 284.5 270.5 375.0 283.2
Cu
Cauliflower-pea-tomato 35.6 25.4 27.0 10.0 20.2 10.2 31.2 24.5 22.0
French bean-cauliflower- 26.3 28.1 18.0 12.8 12.5 10.0 25.0 25.3 17.4french bean
Cauliflower-pea- 28.0 28.9 20.4 10.4 10.7 9.0 26.6 22.0 22.2cauliflower
Maize-garlic 26.1 29.4 12.5 12.5 26.0 24.1
Mn
Cauliflower-pea-tomato 88.2 65.0 62.7 50.5 50.6 42.5 84.8 60.5 60.3
French bean-cauliflower- 69.2 72.3 63.2 36.2 45.1 32.5 58.7 66.5 47.8french bean
Cauliflower-pea- 78.5 62.3 60.0 50.2 51.0 32.9 72.7 58.2 48.2cauliflower
Maize-garlic 42.6 75.0 28.5 57.8 35.3 66.7
Zn
Cauliflower-pea-tomato 38.2 35.5 38.5 10.6 24.8 24.0 25.4 32.0 32.7
French bean- 52.5 30.4 45.2 18.5 12.5 28.5 38.2 25.5 35.1cauliflower-french bean
Cauliflower-pea- 40.2 36.2 40.5 11.3 20.0 20.7 31.7 31.5 33.6cauliflower
Maize-garlic 35.6 38.8 10.0 20.3 30.5 32.6
Table 12. Influence of organic, inorganic and integrated package on Protein (%) content at Dharwad
Cropping systems/ Organic Inorganic INM Mean
package
Kharif Rabi Kharif Rabi Kharif Rabi Kharif Rabi
Maize-chickpea 9.6 20.6 13.2 20.3 10.4 21.5 11.1 20.8
Cotton+pea 3.1 7.1 3.0 6.4 2.5 7.0 2.9 6.8
Groundnut-sorghum 18.7 8.4 20.7 9.0 18.5 6.4 19.3 7.9
Potato-chickpea 8.7 18.5 9.5 20.2 8.7 20.4 9.0 19.7
Soybean-wheat 13.3 11.3 12.9 10.0 12.6 10.9 12.9 10.7
Mean 10.7 13.2 11.9 13.2 10.5 13.2

Network Project on Organic Farming
Annual Report 2012-13 45
7.2 Evaluation of source of nutrient for organic packagein different cropping system
Title of the experiment: Management of soil fertility using organic inputs in prominent cropping systems.
Objectives:
• To study the impact of various on and off farm produces of organic sources on nutrient supplyingcapacity, soil health and crop yield.
• To optimize the use of organic resources for improving their efficiency and quality of produce.
• Economic analysis of various nutrient management options in cropping systems.
Treatment: There are no common treatments for all the centres as cropping system and source fornutrients are varying from location to locations. The details of treatments are given in Table 13 along withexperimental results.
Year of start: 2004-05 with few centres modifying cropping system during 2007-08 and 2008-09.
Locations: All the 13 centres in different ecosystem as mentioned in section 7.1 have conducted theexperiments.
Results
Grain and straw yield (Table 13)
Bajaura: Two systems namely coriander-pea-tomato and cauliflower-pea-cauliflower were evaluated withdifferent organic sources. During kharif application of FYM fb biodynamic fb panchgavya recorded higheryield of coriander (5463 kg ha-1) and cauliflower (11150 kg ha-1). Significantly lower yield was observedwith FYM fb biodynamics and rock phosphate enriched FYM + VC (1:1) in coriander and cauliflowerrespectively. Though, the higher yield of pea was observed with FYM fb BD alone, its increase over FYMfb BD fb Panchagvya was 96 %. Tomato recorded higher yield under rock phosphate enriched FYM +VC (1:1) application and the increase over FYM fb BD alone was found to be 25%.
Bhopal: The yield increase due to biodynamic and panchgavya practice over organic manure alone wasfound to be significant in soybean-wheat and maize-chickpea systems. However, combined applicationof OM+PG + BD registered higher yield in all crops and the yield increase over organic manure alonewas found to be 17, 411, 393 and 273 kg ha-1 in soybean, wheat, maize and chickpea respectively.Application of biodynamic packages alone recorded only marginal increase in yield of all the crops overcontrol.
Calicut: Six treatments comprising of five different combinations of nutrient sources along with absolutecontrol were evaluated in ginger and turmeric crops. In case of ginger, significantly higher rhizome yieldof 7100 kg ha-1 was observed with FYM+PG+RP which is 69.1% higher than absolute control. The nextbest combination FYM+biodynamic packages+Panchgavya+RP) recorded 6925 kg ha-1. Significantlyhigher rhizome yield of turmeric was observed with FYM+NC+2VC+PG+BD+RP (12150 kg ha-1) followedby FYM+BD+PG+RP (11800 kg ha-1) and FYM+BD +RP (11550 kg ha-1).

Network Project on Organic Farming
Annual Report 2012-1346
Coimbatore: Two systems namely cotton-maize-green manure and chillies-sunflower-green manure wereevaluated with five different combinations of nutrient sources. In both the systems, it was observed thatapplication of nutrient through FYM+NEOC @ ½ N each+ panchgavya was found to give higher yield ofcotton (1501 kg ha-1), maize (3569 kgha-1), chillies (4841 kg ha-1) and sunflower (1369 kg ha-1) whichwas on par with FYM + NEOC @ ½ N each alone for all the crops. The yield reduction due to applicationof either biodynamic packages alone or biodynamic with panchagavya was found to be 16 to 40% invarious crops compared to combined application of organic inputs (FYM + NEOC) with panchgavya alone.Lowest yield in all the crops were observed with application of either biodynamic packages or panchagavyaalone.
Dharwad: Three systems namely groundnut-sorghum, maize-chickpea and chilli + onion were testedwith six different combinations of organic inputs along with control. In all the cropping systems, performanceof EC + VC + GLM + biodynamic spray @ 12g ha-1 with panchagavya spray was found to be better, butit is on par with EC + VC + GLM + panchagavya spray or EC + VC + GLM+ biodynamic spray @ 12g ha-
1 in most of the crops. Spray of panchagavya alone recorded lower yield in all the crops compared toEC+ VC + GLM. The yield increase in EC + VC + GLM + biodynamic + Panchgavya spray was found tobe 50.7, 38.5, 69.3 and 42.9% in groundnut, sorghum, maize and chickpea respectively over control. Incase of chilli, EC+ VC + GLM + biodynamic spray @ 12g ha-1 registered higher yield of 741 kg ha-1 whilein onion higher bulb yield was obtained with EC + VC + GLM + biodynamic (741kg ha-1) compared toother treatments. Straw yield of all the crops have also followed the similar trend.
Jabalpur: Two cropping systems namely basmati rice- duram wheat-green manure and basmati rice-berseem were evaluated with five different combinations of nutrient sources. In both the cropping systems,application of nutrients through VC + FYM + NEOC @ 1/3 N each + Panchgavya recorded higher grainyield (3743, 3700 and 232 kg of basmati rice, wheat and berseem seed ha-1) followed by VC + FYM +NEOC @ 1/3 N each. Biodynamic and panchgavya packages recorded lower yield than that of combinationof organic nutrient inputs. Among the systems, grain yield of basmati rice obtained with basmati rice-berseem was found to be higher (3325 kg ha-1) compared to basmati rice-duram wheat-green manure(3280 kg ha-1). Though significant difference in straw yield was noticed among the different nutrientsources, VC + FYM + NEOF @ 1/3 N each recorded higher straw yield in basmati rice compared tobiodynamic packages.
Karjat: Rice-red pumpkin and rice-cucumber systems have recorded higher yield with application of FYM+ rice straw + glyricidia leaves @ 1/3rd each of N during kharif and FYM + neem cake + vermicompost@ 1/3 each of N during rabi along with spray of Panchgavya (3565, 13094 kg ha-1 of rice-red pumpkinand 3735, 11649 kg ha-1 of rice-cucumber respectively). It was at par with application of nutrients through
Monitoring of experiment by Project Director at Calicut Blackpepper under organic management at Calicut

Network Project on Organic Farming
Annual Report 2012-13 47
Table 13. Influence of source of nutrients on grain and straw yield of crops
Cropping system Source of nutrient Grain Yield (kg/ha) Straw Yield (kg/ha)
Kharif Rabi Summer Kharif Rabi Summer
Bajaura
Coriander-pea- Rock phosphate enriched 5067 3307 5784tomato FYM + VC (1:1)
FYM fb BD 4228 3827 4637
Rock phosphate enriched 4802 4427 4282FYM + VC (1:1) fb Panchagvya
FYM fb BD fb Panchagvya 5463 4123 2600
Control 696 1215 1256
Control with Panchagavya 817 1552 1411
Mean 3512 3075 3328
Cauliflower-pea- Rock phosphate enriched 8724 4210 7774cauliflower FYM + VC (1:1)
FYM fb BD 10037 4904 6424
Rock phosphate enriched 10535 3611 5562FYM + VC (1:1) fb Panchagvya
FYM fb BD fb Panchagvya 11150 2509 5913
Control 1363 1137 1447
Control with Panchagavya 1788 1536 1841
Mean 7266 2985 4827
Kharif Rabi Summer(GY) (GY) (GY)
CD (P=0.05) SEm± CD SEm± CD SEm± CD
Cropping 157 949 39 235 54 331
Source 123 364 121 358 141 415
Cropping X Source 175 514 172 506 199 587
Source X Cropping 223 999 162 505 190 608
Bhopal
Soybean-wheat OM 359 2607
BD 310 2389
OM+PG 374 2864
OM+BD 371 2824
OM+PG+BD 376 3018
Control 302 2009
Mean 349 2619
Maize-chickpea OM 3912 1669
BD 2775 1603
OM+PG 4298 1928
OM+BD 4206 1717
OM+PG+BD 4305 1942

Network Project on Organic Farming
Annual Report 2012-1348
Cropping system Source of nutrient Grain Yield (kg/ha) Straw Yield (kg/ha)
Kharif Rabi Summer Kharif Rabi Summer
Control 2486 1597
Mean 3663 1743
Kharif Rabi(GY) (GY)
CD (P=0.05) SEm± CD SEm± CD
Cropping 36.7 163.9 68.9 15.4
Source 37.9 109.5 277.9 96.2
Cropping X Source 89.8 185.4 37.7 NS
Source X Cropping 61.2 211.4 125.1 NS
Calicut
Ginger FYM+BD+PG+RP 6925
FYM+PG+RP 7100
FYM+BD+RP 3800
FYM+NC+2VC+PG+BD+RP 3350
FYM+NC+2VC+RP 3800
Absolute control 4200
Mean 4863
Turmeric FYM+BD+PG+RP 11800
FYM+PG+RP 11800
FYM+BD+RP 11550
FYM+NC+2VC+PG+BD+RP 12150
FYM+NC+2VC+RP 9750
Absolute control 11100
Mean 11358
Kharif
CD (P=0.05) SEm± CD
Cropping 255 1146
Source 434 1251
Cropping X Source 614 1769
Source X Cropping 616 1944
Coimbatore
Cotton-maize- FYM + NEOC* (1/2+1/2) 1448 3422 5766green manure
Panchagavya alone 886 2506 5348
FYM+NEOC*(1/2+1/2)+ 1501 3569 6285Panchagavya
Biodynamic Practices 958 2895 5269
BiodynamicPractices+ 1085 3090 5692Panchagavya

Network Project on Organic Farming
Annual Report 2012-13 49
Cropping system Source of nutrient Grain Yield (kg/ha) Straw Yield (kg/ha)
Kharif Rabi Summer Kharif Rabi Summer
Mean 1176 3096 5672
Chillies-sunflower- FYM + NEOC* (1/2+1/2) 4806 1262 2814green manure Panchagavya alone 3777 1025 2295
FYM+NEOC*(1/2+1/2)+ 4841 1369 3034Panchagavya
Biodynamic Practices 3580 1130 2508
BiodynamicPractices+ 4059 1229 2721Panchagavya
Mean 4213 1203 2674
Kharif Rabi(GY) (GY)
CD (P=0.05) SEm± CD SEm± CD SEm± CD
Cropping 5.2 31.3 71.6 434 24.0 145
Source 123.4 369 96.5 289 144.7 432
Cropping X Source 174.5 NS 136.9 NS 204.3 NS
Source X Cropping 156.0 NS 141.8 NS 184.4 NS
Dharwad
Groundnut-sorghum EC+VC+GLM 3618 1820 3305 11843
Panchagavya spray 3001 1420 2783 10990
EC+VC+GLM + 3980 1883 3479 10700Panchagavya spray
EC+VC+GLM+ 3926 1700 3504 11013Biodynamic spray @5g/ac
EC+VC+GLM+ Biodynamic 4299 1914 3678 10802spray @5g/ac+ Panchagavyaspray
FYM+VC+GLM 3573 1759 3127 11344
Control 2853 1382 2521 9700
Mean 3607 1697 3200 10913
Maize-chickpea EC+VC+GLM 5236 1337 6218 1172
Panchagavya spray 4360 1145 4938 1062
EC+VC+GLM + 5781 1366 6723 1263Panchagavya spray
EC+VC+GLM+ Biodynamic 5631 1253 6285 1131spray @5g/ac
EC+VC+GLM+ Biodynamic 6015 1380 6487 1144spray @5g/ac+Panchagavya spray
FYM+VC+GLM 5067 1130 5544 1120
Control 3552 966 4298 931
Mean 5092 1225 5785 1118

Network Project on Organic Farming
Annual Report 2012-1350
Cropping system Source of nutrient Grain Yield (kg/ha) Straw Yield (kg/ha)
Kharif Rabi Summer Kharif Rabi Summer
Chilli+onion EC+VC+GLM 649
Panchagavya spray 435
EC+VC+GLM + 707Panchagavya spray
EC+VC+GLM+ Biodynamic 702spray @5g/ac
EC+VC+GLM+ Biodynamic 741spray @5g/ac+ Panchagavyaspray
FYM+VC+GLM 579
Control 264
Mean 582
Kharif Rabi Kharif Rabi(GY) (GY) (SY) (GSY)
CD (P=0.05) SEm± CD SEm± CD SEm± CD SEm± CD
Cropping 119.1 467 33.5 204 139.0 845 114.9 696
Source 120.6 346 56.0 163 167.4 486 183.7 535
Cropping X Source 209.2 599 79.4 NS 236.2 NS 266.7 932
Source X Cropping 227.7 717 80.9 NS 259.6 NS 259.6 756
Jabalpur
Basmati rice - VC+FYM+NEOF 3601 3403 6307 5941D.wheat-green @1/3 N eachmanure Panchgavya alone 3034 2545 6251 5619
VC+FYM+NEOF@1/3N 3669 3700 6396 6811each +Panchgavya
Biodynamic practices 2802 2496 6189 5749
Biodynamic practices+ 3294 2725 6282 6047 Panchgavya
Mean 3280 2974 6285 6033
Basmati rice - VC+FYM+NEOF 3625 235 3520 31033berseem @1/3 N each
Panchgavya alone 3050 226 6350 29944
VC+FYM+NEOF @1/3N 3786 232 6573 31925each +Panchgavya
Biodynamic practices 2894 218 6297 29814
Biodynamic practices+ 3269 229 6449 30083Panchgavya
Mean 3325 228 5838 30560
Kharif Rabi Kharif Rabi(GY) (GY) (SY) (GSY)
CD (P=0.05) SEm± CD SEm± CD SEm± CD SEm± CD
Cropping 152.5 NS 1.0 5.89 0.13 0.76 867 5258

Network Project on Organic Farming
Annual Report 2012-13 51
Cropping system Source of nutrient Grain Yield (kg/ha) Straw Yield (kg/ha)
Kharif Rabi Summer Kharif Rabi Summer
Source 67.2 201 1.9 5.56 0.12 0.35 816 NS
Cropping X Source 95.0 NS 2.5 7.87 0.17 0.50 1154 NS
Source X Cropping 174.5 NS 2.6 8.75 0.19 0.83 1348 NS
Karjat
Rice- red pumpkin Kh. FYM + rice straw + 3478 12561 4042 4367glyricidia leaves @1/3rd
N each Rb. FYM +NC +VC - @1/3rd N each
Panchagavya alone 2734 6096 3226 3548
Kh. FYM + rice straw + 3565 13094 4207 4528glyricidia leaves @1/3rd Neach Rb. FYM +NC +VC -@1/3rd N each + Panchagavya
Biodynamic practices 2698 5502 3164 3692
Panchagavya + Biodynamic 2946 6269 3490 3862practices
Mean 3084 8704 3626 3999
Rice- cucumber Kh. FYM + rice straw + 3565 11357 4313 2212glyricidia leaves @1/3rd Neach Rb. FYM +NC +VC -@1/3rd N each
Panchagavya alone 2851 4143 3434 2042
Kh. FYM + rice straw + 3735 11649 4447 2328glyricidia leaves @1/3rd Neach Rb. FYM +NC +VC -@1/3rd N each + Panchagavya
Biodynamic practices 2778 4033 3421 1700
Panchagavya + Biodynamic 3076 4439 3660 2170practices
Mean 3201 7124 3855 2090
Kharif Rabi Kharif Rabi(GY) (GY) (SY) (GSY)
CD (P=0.05) SEm± CD SEm± CD SEm± CD SEm± CD
Cropping 29 NS 104 630 43 NS 131 795
Source 80 239 321 961 94 282 226 NS
Cropping X Source 113 NS 455 NS 133 NS 318 NS
Source X Cropping 105 NS 420 NS 127 NS 313 NS
Ludhiana
Maize-wheat+ B.rice Other cropsgram-summer-moong GM FYM 5860 3173 11500 4160
GM+PG FYM+PG 5710 3100 11653 3917
GM+BD BD 3610 2013 7500 2743

Network Project on Organic Farming
Annual Report 2012-1352
Cropping system Source of nutrient Grain Yield (kg/ha) Straw Yield (kg/ha)
Kharif Rabi Summer Kharif Rabi Summer
GM+BD+FYM FYM+BD 5803 3300 11613 3927
GM+PG+BD FYM+PG+BD 5877 3280 11297 4060
Control Control 1270 993 3093 3250
Mean 4988 2643 9443 3676
Basmati rice- wheat- GM FYM 3640 3533 5397 4417green manure
GM+PG FYM+PG 3623 3580 5523 4387
GM+BD BD 3627 1900 5197 3257
GM+BD+FYM FYM+BD 3728 3402 5697 4597
GM+PG+BD FYM+PG+BD 3753 3540 5370 4433
Control Control 2433 1467 3487 2050
Mean 3467 1467 5112 3857
Kharif Rabi Kharif Rabi(GY) (GY) (SY) (GSY)
CD P=0.05) SEm± CD SEm± CD SEm± CD SEm± CD
Cropping 44.8 272 43.1 262 1325 NS 32 NS
Source 121.3 357 154.6 455 814 2395 179 526
Cropping X Source 171.6 505 219.1 NS 1152 3387 253 744
Source X Cropping 163.1 518 204.3 NS 1691 8217 233 700
Pantnagar
Basmati rice- FYM+VC+NC+EC (1/4+ 4649 1731 5951chickpea-sesbania 1/4+1/4+1/4)(green manure)
Biodynamic (BD) 3644 1244 4913
FYM+VC+NC+EC (1/4+ 4637 1966 58071/4+1/4+1/4)+Panchgavya
FYM+VC+NC+EC 1/4+1/4+ 4637 1778 56441/4+1/4)+BD
FYM+VC+NC+EC (1/4+ 4829 2003 56511/4+1/4+1/4)+BD+Panchgavya
T6=Control 3882 1098 5024
Mean 4380 1637 5499
Basmati rice- FYM+VC+NC+EC 3968 8724 8107 5213 4901vegetable pea- (1/4+1/4+1/4+1/4)maize+moong(moong residuesincorporation)
Biodynamic (BD) 2893 5887 5833 3791 3518
FYM+VC+NC+EC (1/4+ 4241 7729 8300 5184 54701/4+1/4+1/4)+Panchgavya
FYM+VC+NC+EC 1/4+1/4+ 4091 7809 8357 5372 53821/4+1/4)+BD

Network Project on Organic Farming
Annual Report 2012-13 53
Cropping system Source of nutrient Grain Yield (kg/ha) Straw Yield (kg/ha)
Kharif Rabi Summer Kharif Rabi Summer
FYM+VC+NC+EC (1/4+1/4+ 4281 8955 8520 5381 55661/4+1/4)+BD+Panchgavya
T6=Control 2821 4816 4930 3780 3236
Mean 3716 7320 8107 4787 4679
Kharif Rabi Summer Kharif Rabi
CD (P=0.05) SEm± CD SEm± CD SEm± CD SEm± CD SEm± CD
Cropping 80 488.6 148.6 904.4 138.8 844.8
Source 98 288.2 125.3 369.6 202.9 639.3136.6 403.1 322 1015
Cropping X Source 138 NS 177.2 522.8 193.2 NS
Source X Cropping 150 NS 219.7 963.3 224.5 NS
Raipur
Rice-chickpea EC+CDM+NEOC 3813 1271 5746 3050@ 1/3 N each
Bio dynamic practice 2263 796 3653 1896
EC+CDM+NEOC@1/3N 4156 1146 5861 2573each+Panchagavya
EC+CDM+NEOC @ 1/3 N 3825 1052 6021 2458each + Bio dynamic practice
Biodynamicpractice+ EC+ 4256 1375 6195 3031CDM+NEOC@1/3Neach+Panchagavya
Mean
Rice-mustard+ EC+CDM+NEOC @ 1/3 N 3704 840 5405 2813lentil (alternate row) each
Bio dynamic practice 2119 650 3191 2131
EC+CDM+NEOC@1/3N 3862 873 5477 2687each+Panchagavya
EC+CDM+NEOC @ 1/3 N 3802 865 5765 2636each + Bio dynamic practice
Biodynamicpractice+ EC+ 4154 940 5975 2804CDM+NEOC@1/3Neach+Panchagavya
Mean
Kharif Rabi Kharif Rabi(GY) (GY) (SY) (GSY)
CD (P=0.05) SEm± CD SEm± CD SEm± CD SEm± CD SEm± CD
Cropping 61.9 NS 22.3 136 107 NS 36 NS
Source 61.8 185 44.7 134 72 216 95 285
Cropping X Source 87.7 NS 63.1 NS 102 NS 134 NS
Source X Cropping 99.7 NS 60.7 NS 141 NS 125 NS

Network Project on Organic Farming
Annual Report 2012-1354
Cropping system Source of nutrient Grain Yield (kg/ha) Straw Yield (kg/ha)
Kharif Rabi Summer Kharif Rabi Summer
Ranchi
Rice-wheat 50% VC+50% KC 3763 1923 5540 3304
BD Preparation (CPP, 2150 1033 3443 1907BD500 & 501)
VC + K.C+Panchagavaya 3867 2070 5803 3451
VC + K.C+ BD Prepartion 4003 2203 6003 3601
:VC + K.C+ BD Prepartion+ 4203 2332 6307 3742Panchagavya
Mean
Rice-potato 50% VC+50% KC 3890 16400 5833 2853
BD Preparation (CPP, 2217 6867 3507 1267BD500 & 501)
VC + K.C+Panchagavaya 3953 16600 6090 2921
VC + K.C+ BD Prepartion 4090 16733 6297 3030
VC + K.C+ BD Prepartion + 4270 16967 6577 3201Panchagavya
Mean
Kharif Rabi Kharif Rabi(GY) (GY) (SY) (GSY)
CD (P=0.05) SEm± CD SEm± CD SEm± CD SEm± CD
Cropping 205 NS 225 969 247 NS 120 517
Source 246 521 370 784 336 713 253 535
Cropping X Source 348 NS 523 1108 476 NS 357 NS
Source X Cropping 372 NS 519 1314 492 NS 341 NS
Umium 2A
Maize+soybean FYM+VC 3575 363 8260(GM)-toria
Panchagavya(PG) 810 91.3 2139
FYM+VC+PG 3677 467 8517
Biodynamic Formulation 915 111 2416(BD-501)
BD -501 +PG 1063 220 2535
Control 441 11.3 1398
Mean
Maize (green FYM+VC 651 1165 5848 832cob)+soybean
(GM)-frenchbean Panchagavya(PG) 167 480 1661 197(green pod) FYM+VC+PG 713 1240 6116 943
Biodynamic Formulation 174 488 1420 211(BD-501)
BD -501 +PG 197 496 1903 218

Network Project on Organic Farming
Annual Report 2012-13 55
Cropping system Source of nutrient Grain Yield (kg/ha) Straw Yield (kg/ha)
Kharif Rabi Summer Kharif Rabi Summer
Control 109 97.8 631 103
Mean 335 661 2930 832
Kharif Rabi Kharif Rabi(GY) (GY) (SY) (GSY)
CD (P=0.05) SEm± CD SEm± CD SEm± CD SEm± CD
Cropping 35 211 8.6 52.2 170.4 1038 51.6 162.6
Source 93 273 18.5 54.7 149.9 443
Cropping X Source 131 385 26.2 84.0 212.1 626
Source X Cropping 124 397 25.4 77.3 258.1 1114
Umium 2B
Maize+soybean- FYM 5306 16212 10895 2049tomato
VC 4838 14886 9468 1696
FYM+VC 5513 15607 11053 1919
Control 2137 2393 4804 819
Mean 4449 12275 9055 1621
Maize+soybean- FYM 5468 16708 10662 2373potato
VC 5287 17038 9495 2532
FYM+VC 5571 16794 11121 2403
Control 2259 4214 4689 900
Mean 4646 13689 8992 2052
Maize+soybean- FYM 5642 17047 11065 4457frenchbean
VC 5484 16182 9659 4038
FYM+VC 5687 18075 11438 4691
Control 2377 5359 5261 1531
Mean 4798 14166 9356 3679
Kharif Rabi Kharif Rabi(GY) (GY) (SY) (GSY)
CD (P=0.05) SEm± CD SEm± CD SEm± CD SEm± CD
Cropping 167.9 NS 370.4 1454 375.6 NS 118.3 464.4
Source 206.0 612.1 298.7 888 332.8 988.7 66.9 198.7
Cropping X Source 356.8 NS 517.4 NS 576.4 NS 115.8 344.1
Source X Cropping 351.6 NS 581.4 NS 624.7 NS 155.1 547.0

Network Project on Organic Farming
Annual Report 2012-1356
FYM, rice straw and glyricidia leaves during kharif and FYM + neem cake and vermicompost during rabi.Application of either panchgavya alone or Biodynamic packages or its combination registered significantlylower yield in all the crops. The reduction in yield was found to be 17.5, 52.1 and 61.9% in rice, red pumpkinand cucumber with combination of Panchgavya + biodynamic packages compared to organic sources+ panchgavya.
Visit of departmental team of PAU to NPOF experimentsat Ludhiana
Ludhiana: Two systems namely maize-wheat+gram-summer moong and basmati rice-wheat-green manure was evaluated with differentorganic sources and biodynamic packages.Application of FYM + panchgavya + biodynamicpackages recorded higher grain yield of maize (5877kg ha-1), while in wheat FYM + BD recorded higheryield (3300 kg ha-1). In case of basmati rice, exceptcontrol, all the organic sources viz., green manurealone or its combination with FYM, biodynamicpackages or panchagavya recorded statistically atpar yield. Wheat yield was significantly lower inbiodynamic packages (1900 kg ha-1) alone andcontrol (1467 kg ha-1) compared to application ofFYM alone or with biodynamic and Panchgavya packages. The yield increase due to biodynamic andpanchgavya packages were not significant compared to FYM alone.
Pantnagar: Application of FYM + VC + NC + EC @ ¼ N each + BD + Panchgavya recorded an increasein yield to the tune of 180 kg ha-1 in basmati rice compared to application of FYM + VC + NC + EC alone.However in case of chickpea, it was observed that all the treatments except biodynamic packages aloneor control was at par. Significantly higher yield of 8955 kg ha-1 in vegetable pea was recorded with FYM+ VC +NC + EC @ ¼ N each + BD+Panchagavya compared to other treatments. Residue yield of thecrops also responded similarly as that of economic yield.
Raipur: Two systems namely rice-chickpea and rice-mustard + lentil (alternate row) were evaluated withfive combinations of nutrient sources. Though application of biodynamic package + EC + CDM + NEOC@ 1/3 N each + panchagavya recorded higher yield of rice (4256 kg ha-1) and chickpea (1375 kg ha-1),it was at par with application of + EC + CDM + NEOC @ 1/3 N each + panchagavya and EC + CDM +NEOC @ 1/3 N each alone in both the crops of rice-chickpea system. Similar trend was also observedwith rice-mustard + lentil (alternate row system). Biodynamic practice + EC + CDM + NEOC @ 1/3 Neach +panchagavya recorded higher yield of 940 kg ha-1. Lowest yield in all the crops was observedunder biodynamic package alone.
Ranchi: Two systems namely rice-wheat and rice-potato were evaluated for its response to organic inputsin the form of vermicompost, biodynamic preparation, cow pat pit and panchgavya in various combinations.All the crops recorded higher yield with vermicompost + KC + biodynamic peparration + panchagavya(4270, 2332 and 16967 kg ha-1 in rice, wheat and potato respectively) which was at par with withoutpanchagavya in the same treatment. Lowest yield was obtained in all the crops under biodynamicpreparation (CPP, BD 500 and 501) alone. The yield increase due to application of panchagavya andbiodynamic preparation over and above, the vermicompost + KC @ ½ N each was found to be veryminimum in rice and wheat (2.20 and 7.60 % with panchagavya and 5.7 and 14.6% with biodynamicpreparations in rice and wheat respectively). However, the contribution of panchagavya and biodynamicpreparation over and above VC + KC was found to be numerically higher value in potato. The residuesyield of all the crops have also recorded similar trend as that of economic yield.

Network Project on Organic Farming
Annual Report 2012-13 57
Umiam: The experiments were conducted with different combinations of cropping systems and organicinputs. In the first experiment, two systems namely maize + soybean (green manure)–toria and maize(green cob) + soybean (green manure)–frenchbean (green pod) were evaluated with biodynamic andpanchgavya packages apart from vermicompost and FYM. Application of FYM + VC + panchagavyarecorded numerically higher yield in maize for grain and green cobs (3677 and 713 kg ha-1 respectivelyand frenchbean (1240 kg ha-1) but the same was on par with application of FYM + VC alone. Applicationof biodynamic preparation or panchagavya alone or its combination resulted in significantly lower yield inall the crops evaluated. In the other experiment, tomato, potato and frenchbean were evaluated assucceeding crop after maize + soybean with FYM and vermicompost. The response of maize was foundto be better with application of FYM + VC @ ½ N each as it recorded significantly higher grain yieldcompared to VC alone. In case of vegetable crops, differential response was observed. Though, higheryield of tomato was observed with FYM alone, its increase over FYM+ VC was only 4 %. Potato recordedhigher yield under vermicompost application and the increase over FYM alone was found to be 2 %. Incase of frenchbean, combined application of FYM + VC resulted in 6% increase in yield over FYM alone.The yield of residues also performed in similar manner.
Carrot produced under organic management practice atUmiam
Potato under organic management in raised and sunkenbed at Umiam
Physical and chemical properties along with microbial count in soil (Table 14, 15)
Bajaura: Soil pH did not vary among various nutrient sources. Soil organic carbon was found to be higherwith application of rock phosphate enriched FYM + VC (1:1) in coriander-pea-tomato (0.86%) andCauliflower-pea-cauliflower (0.85%) system. The increase of OC in coriander-pea-tomato was found tobe 72% over control. Higher available N, P and K was also observed under rock phosphate enrichedFYM + VC (1:1) in the same system. In both the systems, residual availability of Mn, Zn, Cu and Fe wasfound to be significantly higher with rock phosphate enriched FYM+VC @ ½ N each compared toapplication of same with panchagavya or biodynamic preparation and FYM. On an average the increasein availability of micronutrients was found to be more than 50% in both the systems compared to control.
Bhopal: Soil pH, EC, OC, available N, P and K were estimated and results reveals that different sourcesof nutrients did not significantly influenced the EC, organic carbon, available N, P and K. However soybean-wheat system, application of organic manures alone recorded higher organic carbon (1.15%). Soybean-wheat system recorded significantly higher available N in the soil (266 kg ha-1) with the application oforganic manure+panchagavya along with biodynamic package. Among the two systems also, nosignificant change in EC, P and available K was observed.

Network Project on Organic Farming
Annual Report 2012-1358
Tab
le 1
4. In
flu
ence
of
sou
rce
of
nu
trie
nts
on
so
il p
hys
ical
an
d c
hem
ical
pro
per
ties
of
soils
at
the
end
of
cro
pp
ing
cyc
le
Cro
pp
ing
sys
tem
So
urc
e o
f n
utr
ien
tB
D (
g/c
c)pH
EC
(dS
/m)
OC
(%)
N (
kg h
a-1)
P (
kg h
a-1)
K (
kg h
a-1)
Baj
aura
Cor
iand
er-p
ea-t
omat
oR
ock
phos
phat
e en
rich
ed5.
330.
861
90
68.1
18
7F
YM
+ V
C (
1:1)
FY
M fb
BD
5.43
0.85
18
065
.81
83
Roc
k ph
osph
ate
enri
ched
5.30
0.84
17
064
.51
78
FY
M +
VC
(1:
1) fb
Pan
chag
vya
FY
M fb
BD
fb P
anch
agvy
a5.
370.
851
78
65.1
18
4
Con
trol
5.23
0.50
119
32.4
13
8
Con
trol
with
Pan
chag
avya
5.20
0.51
12
035
.21
39
Mea
n5.
310.
741
60
55.2
16
8
Cau
liflo
wer
-pea
-R
ock
phos
phat
e en
rich
ed5.
370.
851
85
69.2
19
6ca
ulifl
ower
FY
M +
VC
(1:
1)
FY
M fb
BD
5.37
0.84
17
965
.91
94
Roc
k ph
osph
ate
enric
hed
FY
M +
5.33
0.83
17
165
.21
77
VC
(1:
1) f
b P
anch
agvy
a
FY
M fb
BD
fb P
anch
agvy
a5.
330.
831
79
66.7
17
6
Con
trol
5.27
0.49
111
32.7
13
2
Con
trol
with
Pan
chag
avya
5.13
0.48
114
34.9
13
5
Mea
n5.
300.
721
57
55.8
16
8
CD
(P
=0.
05)
SE
m±
CD
SE
m±
CD
SE
m±
CD
SE
m±
CD
SE
m±
CD
Cro
pp
ing
0.02
6N
S0.
01N
S1.
13N
S0.
40N
S1.
10N
S
Sou
rce
0.02
30.
069
0.01
0.03
1.70
3.49
0.86
1.79
1.20
3.08
Cro
ppin
g X
Sou
rce
0.03
3N
S0.
02N
S2.
364.
931.
21N
S2.
094.
36
Sou
rce
X C
ropp
ing
0.04
0N
S0.
02N
S2.
446.
241.
18N
S2.
205.
80
Bho
pal
Soy
bean
-whe
atO
M8.
130.
221.
152
36
15
37
91
BD
8.17
0.21
0.73
20
167
.38
16
OM
+PG
8.10
0.21
0.79
20
797
.78
45
OM
+BD
8.10
0.21
1.08
25
311
98
37

Network Project on Organic Farming
Annual Report 2012-13 59
OM
+PG
+BD
8.10
0.23
1.11
26
61
46
87
5
Con
trol
8.10
0.26
1.09
23
61
52
81
9
Mea
n8.
120.
220.
992
33
12
38
31
Mai
ze-c
hick
pea
OM
8.13
0.25
0.87
22
01
09
81
6
BD
8.20
0.20
0.57
17
849
.37
87
OM
+PG
7.93
0.26
1.03
23
61
42
76
4
OM
+BD
8.03
0.22
0.74
21
359
.77
60
OM
+PG
+BD
8.10
0.19
0.73
19
257
.37
91
Con
trol
8.00
0.25
0.64
17
835
.77
29
Mea
n8.
070.
230.
762
03
75.5
77
5
CD
(P
-0.0
5)S
Em
±C
DS
Em
±C
DS
Em
±C
DS
Em
±C
DS
Em
±C
DS
Em
±C
D
Cro
pp
ing
0.01
40.
083
0.00
2N
S0.
020.
085.
5523
.911
.6N
S18
.7N
S
Sou
rce
0.02
90.
085
0.01
4N
S0.
13N
S20
.6N
S25
.5N
S47
.2N
S
Cro
ppin
g X
Sou
rce
0.04
1N
S0.
019
NS
0.18
NS
29.1
NS
36.1
NS
66.7
NS
Sou
rce
X C
ropp
ing
0.04
0N
S0.
018
NS
0.17
NS
27.2
NS
34.9
NS
63.7
NS
Cal
icu
t
Gin
ger
FY
M+B
D+P
G+R
P5.
401.
771
28
6.00
1.23
FY
M+P
G+R
P5.
531.
471
29
6.00
12
5
FY
M+B
D+R
P5.
231.
431
33
3.50
14
7
FY
M+N
C+2
VC
+PG
+BD
+RP
5.52
1.67
13
07.
831
66
FY
M+N
C+2
VC
+RP
5.27
2.07
13
011
.71
39
Abs
olut
e co
ntro
l5.
371.
211
21
4.17
13
8
Mea
n5.
391.
601
29
6.53
119
Tur
mer
icF
YM
+BD
+PG
+RP
5.28
1.17
12
16.
331
87
FY
M+P
G+R
P5.
491.
171
22
4.50
17
4
FY
M+B
D+R
P5.
691.
161
24
7.03
23
9
FY
M+N
C+2
VC
+PG
+BD
+RP
5.67
1.12
12
44.
672
26
FY
M+N
C+2
VC
+RP
5.56
1.10
12
45.
001
56
Cro
pp
ing
sys
tem
So
urc
e o
f n
utr
ien
tB
D (
g/c
c)pH
EC
(dS
/m)
OC
(%)
N (
kg h
a-1)
P (
kg h
a-1)
K (
kg h
a-1)

Network Project on Organic Farming
Annual Report 2012-1360
Abs
olut
e co
ntro
l5.
571.
171
03
3.17
13
9
Mea
n5.
541.
151
20
5.12
18
7
CD
(P
-0.0
5)S
Em
±C
DS
Em
±C
DS
Em
±C
DS
Em
±C
DS
Em
±C
D
Cro
pp
ing
0.05
NS
0.04
0.11
0.71
2.26
0.57
NS
5.59
17.8
Sou
rce
0.10
NS
0.07
0.15
2.06
4.20
0.80
1.64
12.2
24.9
Cro
ppin
g X
Sou
rce
0.14
NS
0.10
0.21
2.91
NS
1.13
2.31
17.2
35.2
Sou
rce
X C
ropp
ing
0.13
NS
0.10
0.22
2.75
NS
1.18
2.73
16.7
36.2
Co
imb
ato
re
Cot
ton-
mai
ze-
FY
M+
NE
OC
(1/
2+1/
2)0.
742
49
20.8
74
8gr
een
man
ure
Pan
chag
avya
alo
ne0.
682
21
20.0
72
1
FY
M+N
EO
C(1
/2+1
/2)+
0.74
23
619
.67
58
Pan
chag
avya
Bio
dyna
mic
Pra
ctic
es0.
662
34
19.2
71
2
Bio
dyna
mic
pra
ctic
es+
0.69
23
219
.07
28
Pan
chag
avya
Mea
n0.
702
34
19.7
73
3
Ch
illie
s-su
nflo
we
r-F
YM
+ N
EO
C (
1/2+
1/2)
0.70
24
820
.86
44
gree
n m
anur
e
Pan
chag
avya
alo
ne0.
662
25
18.0
63
2
FY
M+
NE
OC
(1/
2+1/
2)+
0.70
24
421
.06
48
Pan
chag
avya
Bio
dyna
mic
Pra
ctic
es0.
642
12
18.0
62
2
Bio
dyna
mic
Pra
ctic
es+
0.63
21
816
.96
13
Pan
chag
avya
Mea
n0.
672
29
18.9
63
2
CD
(P
-0.0
5)S
Em
±C
DS
Em
±C
DS
Em
±C
DS
Em
±C
D
CD
(P
=0.
05)
SE
m±
CD
SE
m±
CD
SE
m±
CD
SE
m±
CD
Cro
pp
ing
0.00
0.02
3.87
NS
0.66
NS
0.64
2.77
Sou
rce
0.01
0.02
4.47
9.48
0.58
1.22
4.01
8.50
Cro
pp
ing
sys
tem
So
urc
e o
f n
utr
ien
tB
D (
g/c
c)pH
EC
(dS
/m)
OC
(%)
N (
kg h
a-1)
P (
kg h
a-1)
K (
kg h
a-1)

Network Project on Organic Farming
Annual Report 2012-13 61
Cro
ppin
g X
Sou
rce
0.02
NS
6.32
13.4
0.82
1.73
5.67
12.0
Sou
rce
X C
ropp
ing
0.01
NS
6.85
19.3
0.98
3.06
5.11
11.0
Dh
arw
ad
Gro
un
dn
ut-
sorg
hu
mE
C+V
C+G
LM1.
217.
200.
210.
652
80
32.7
37
9
Pan
chag
avya
spr
ay1.
217.
250.
200.
632
67
31.8
36
7
EC
+V
C+
GLM
+ P
anch
agav
ya1.
187.
170.
190.
692
84
33.6
38
2sp
ray
EC
+V
C+
GLM
+ B
iody
nam
ic1.
207.
220.
190.
622
62
31.6
36
1sp
ray
@5g
/ac
EC
+V
C+
GLM
+ B
iody
nam
ic1.
217.
210.
200.
632
68
31.8
36
5sp
ray
@5g
/ac+
Pan
chag
avya
spra
y
FYM
+VC
+GLM
1.20
7.29
0.21
0.65
27
130
.13
69
Con
trol
1.30
7.36
0.15
0.57
25
424
.83
23
Mea
n1.
227.
240.
190.
632
69
31.0
36
4
Mai
ze-c
hick
pea
EC
+VC
+GLM
1.19
7.19
0.19
0.66
28
632
.73
79
Pan
chag
avya
spr
ay1.
207.
240.
200.
642
71
31.4
36
4
EC
+V
C+
GLM
+ P
anch
agav
ya1.
197.
180.
210.
692
87
31.6
37
9sp
ray
EC
+V
C+
GLM
+ B
iody
nam
ic1.
217.
270.
190.
622
69
30.8
36
2sp
ray
@5g
/ac
EC
+V
C+
GLM
+ B
iody
nam
ic1.
207.
290.
170.
652
72
32.7
36
6sp
ray
@5g
/ac+
Pan
chag
avya
spra
y
FYM
+VC
+GLM
1.20
7.38
0.21
0.64
28
131
.93
68
Con
trol
1.32
7.32
0.14
0.49
25
323
.43
24
Mea
n1.
227.
270.
190.
632
74
31.0
36
3
Ch
illi+
on
ion
EC
+VC
+GLM
1.20
7.23
0.19
0.68
27
932
.63
79
Pan
chag
avya
spr
ay1.
207.
260.
190.
622
65
30.9
36
3
Cro
pp
ing
sys
tem
So
urc
e o
f n
utr
ien
tB
D (
g/c
c)pH
EC
(dS
/m)
OC
(%)
N (
kg h
a-1)
P (
kg h
a-1)
K (
kg h
a-1)

Network Project on Organic Farming
Annual Report 2012-1362
EC
+V
C+
GLM
+ P
anch
agav
ya1.
217.
240.
220.
692
81
32.7
37
9sp
ray
EC
+V
C+
GLM
+ B
iody
nam
ic1.
227.
230.
180.
602
62
29.8
36
3sp
ray
@5g
/ac
EC
+V
C+
GLM
+ B
iody
nam
ic1.
217.
290.
210.
632
70
30.2
36
8sp
ray
@5g
/ac+
Pan
chag
avya
spra
y
FYM
+VC
+GLM
1.22
7.25
0.22
0.64
27
031
.43
70
Con
trol
1.32
7.42
0.17
0.49
24
621
.93
37
Mea
n1.
237.
270.
200.
622
68
30.0
36
6
SE
m±
CD
SE
m±
CD
SE
m±
CD
SE
m±
CD
SE
m±
CD
SE
m±
CD
SE
m±
CD
Cro
pp
ing
0.01
NS
0.04
1N
S0.
005
NS
0.01
NS
2.51
NS
0.44
NS
3.27
NS
Sou
rce
0.02
0.04
0.03
30.
096
0.00
80.
022
0.01
0.03
2.99
6.06
0.56
1.14
4.47
9.07
Cro
ppin
g X
Sou
rce
0.03
NS
0.05
8N
S0.
013
NS
0.02
NS
5.18
NS
0.98
NS
7.74
NS
Sou
rce
X C
ropp
ing
0.03
NS
0.06
8N
S0.
013
NS
0.02
NS
5.41
NS
1.01
NS
7.88
NS
Kar
jat
Ric
e- r
ed p
umpk
inK
h. F
YM
+ r
ice
stra
w +
6.77
0.41
1.40
26
318
.43
66
glyr
icid
ia l
eave
s /p
lot
@1/
3rd N
eac
h R
b.F
YM
+N
C +
VC
plo
t-1
-@
1/3rd
N e
ach
Pan
chag
avya
alo
ne6.
710.
381.
332
38
17.5
34
5
Kh.
FY
M +
ric
e st
raw
+6.
800.
401.
452
72
19.7
37
0gl
yric
idia
lea
ves
/plo
t@
1/3rd
N e
ach
Rb.
FY
M +
NC
+V
C p
lot-
1 -
@1/
3rd N
eac
h +
Pan
chag
avya
Bio
dyna
mic
pra
ctic
es6.
670.
351.
292
34
17.2
34
4
Pan
chag
avya
+ B
iody
nam
ic6.
730.
401.
332
38
17.8
34
9pr
actic
es
Mea
n6.
740.
39
Cro
pp
ing
sys
tem
So
urc
e o
f n
utr
ien
tB
D (
g/c
c)pH
EC
(dS
/m)
OC
(%)
N (
kg h
a-1)
P (
kg h
a-1)
K (
kg h
a-1)

Network Project on Organic Farming
Annual Report 2012-13 63
Ric
e- c
ucum
ber
Kh.
FY
M +
ric
e st
raw
+6.
810.
411.
432
68
23.7
39
0gl
yric
idia
lea
ves
/plo
t@
1/3rd
N e
ach
Rb.
FY
M +
NC
+V
C p
lot-
1 -
@1/
3rd N
eac
h
Pan
chag
avya
alo
ne6.
720.
391.
322
38
22.2
35
8
Kh.
FY
M +
ric
e st
raw
+6.
820.
431.
452
76
25.0
39
6gl
yric
idia
lea
ves
/plo
t@
1/3rd
N e
ach
Rb.
FY
M+
NC
+V
C p
lot-
1 -
@1/
3rd N
eac
h +
Pan
chag
avya
Bio
dyna
mic
pra
ctic
es6.
690.
391.
342
38
22.2
35
9
Pan
chag
avya
+ B
iody
nam
ic6.
750.
381.
372
51
23.1
36
2pr
actic
es
Mea
n6.
760.
40
CD
(P
-0.0
5)S
Em
±C
DS
Em
±C
DS
Em
±C
DS
Em
±C
DS
Em
±C
DS
Em
±C
D
Cro
pp
ing
0.01
6N
S0.
007
NS
0.02
NS
7.66
NS
0.17
0.75
4.24
18.3
Sou
rce
0.02
90.
090.
016
NS
0.03
0.07
10.0
21.3
0.39
0.83
2.11
4.48
Cro
ppin
g X
Sou
rce
0.04
1N
S0.
022
NS
0.05
NS
14.2
NS
0.55
NS
2.99
6.33
Sou
rce
X C
ropp
ing
0.04
0N
S0.
021
NS
0.05
NS
14.9
NS
0.52
NS
5.01
18.5
Ludh
iana
Mai
ze-w
heat
+gr
am-
Bas
mat
i R
ice
Oth
er c
rops
sum
me
r m
oo
ng
GM
FYM
7.56
0.25
0.62
34
665
.51
89
GM
+PG
FYM
+PG
7.53
0.25
0.61
35
363
.31
82
GM
+BD
BD
7.55
0.25
0.54
33
255
.61
63
GM
+BD
+FY
MFY
M+B
D7.
580.
220.
613
58
61.4
18
0
GM
+PG
+BD
FY
M+P
G+B
D7.
600.
250.
613
45
65.1
18
4
Con
trol
Con
trol
7.57
0.21
0.39
25
539
.81
01
Mea
n7.
560.
24
Cro
pp
ing
sys
tem
So
urc
e o
f n
utr
ien
tB
D (
g/c
c)pH
EC
(dS
/m)
OC
(%)
N (
kg h
a-1)
P (
kg h
a-1)
K (
kg h
a-1)

Network Project on Organic Farming
Annual Report 2012-1364
Bas
mat
i ri
ce-
GM
FYM
7.50
0.28
0.61
33
967
.81
86
whe
at-g
reen
man
ure
GM
+PG
FYM
+PG
7.65
0.28
0.64
33
062
.01
84
GM
+BD
BD
7.70
0.29
0.59
30
849
.41
62
GM
+BD
+FY
MFY
M+B
D7.
620.
300.
603
31
62.6
18
2
GM
+PG
+BD
FY
M+P
G+B
D7.
600.
290.
613
44
62.0
17
5
Con
trol
Con
trol
7.80
0.26
0.43
19
843
.185
.2
Mea
n7.
640.
28
CD
(P
-0.0
5)S
Em
±C
DS
Em
±C
DS
Em
±C
DS
Em
±C
DS
Em
±C
DS
Em
±C
D
Cro
pp
ing
Sou
rce
Cro
ppin
g X
Sou
rce
Sou
rce
X C
ropp
ing
Pan
tnag
ar
Bas
mat
i ri
ce-c
hick
pea
–F
YM
+VC
+NC
+EC
0.99
341.
030
.928
5.7
sesb
ania
(gr
een
man
ure)
(1/4
+1/
4+1/
4+1/
4)
Bio
dyna
mic
(B
D)
0.93
320.
323
.725
7.7
FY
M+V
C+N
C+E
C1.
0136
2.0
28.6
271.
7(1
/4+
1/4+
1/4+
1/4)
+P
anch
gavy
a
FY
M+V
C+N
C+E
C1.
0234
6.0
28.8
274.
31/
4+1/
4+1/
4+1/
4)+
BD
FY
M+V
C+N
C+E
C1.
0435
9.7
32.8
265.
3(1
/4+
1/4+
1/4+
1/4)
+B
D+
Pan
chga
vya
T6=
Con
trol
0.91
312.
723
.823
5.0
Mea
n0.
9834
0.3
28.1
264.
9
Bas
mat
i ric
e –
FY
M+V
C+N
C+E
C0.
9730
3.3
29.4
217.
0V
eget
able
pea
–(1
/4+
1/4+
1/4+
1/4)
ma
ize
+m
oo
ng
(mo
on
g r
esi
du
es
inco
rpor
atio
n)
Cro
pp
ing
sys
tem
So
urc
e o
f n
utr
ien
tB
D (
g/c
c)pH
EC
(dS
/m)
OC
(%)
N (
kg h
a-1)
P (
kg h
a-1)
K (
kg h
a-1)
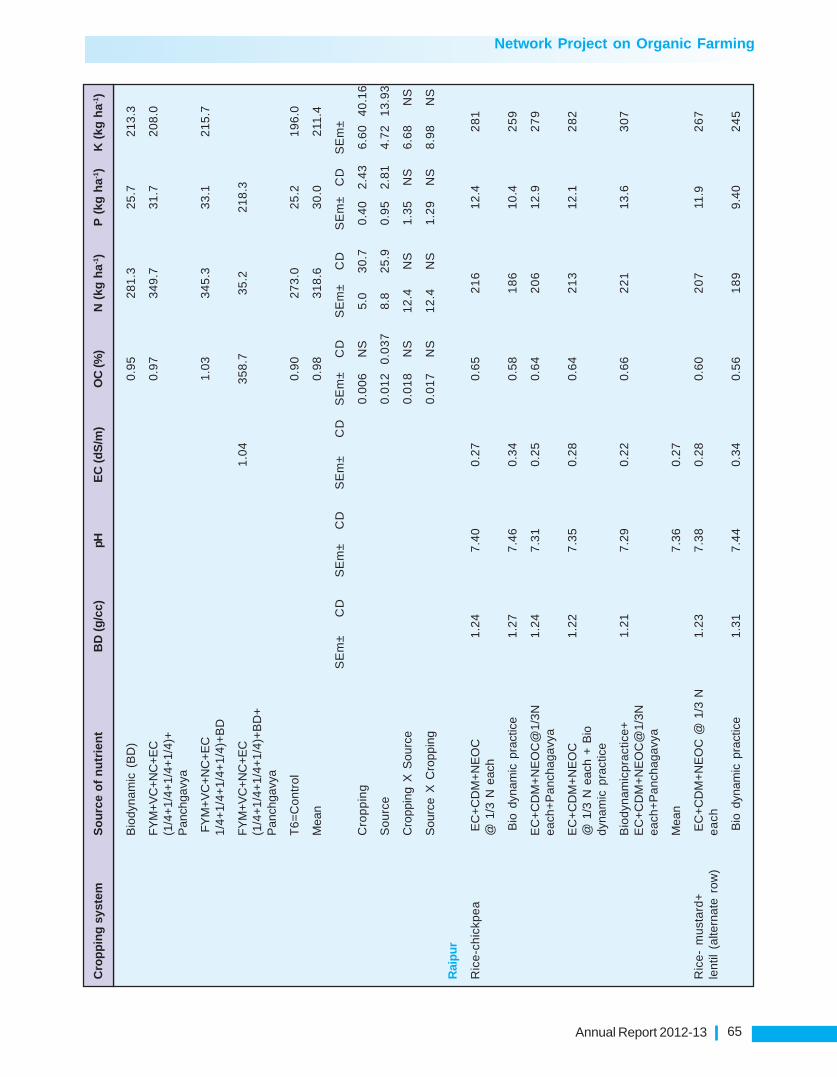
Network Project on Organic Farming
Annual Report 2012-13 65
Bio
dyna
mic
(B
D)
0.95
281.
325
.721
3.3
FY
M+V
C+N
C+E
C0.
9734
9.7
31.7
208.
0(1
/4+
1/4+
1/4+
1/4)
+P
anch
gavy
a
FY
M+V
C+N
C+E
C1.
0334
5.3
33.1
215.
71/
4+1/
4+1/
4+1/
4)+
BD
FY
M+V
C+N
C+E
C1.
0435
8.7
35.2
218.
3(1
/4+
1/4+
1/4+
1/4)
+B
D+
Pan
chga
vya
T6=
Con
trol
0.90
273.
025
.219
6.0
Mea
n0.
9831
8.6
30.0
211.
4
SE
m±
CD
SE
m±
CD
SE
m±
CD
SE
m±
CD
SE
m±
CD
SE
m±
CD
SE
m±
Cro
pp
ing
0.00
6N
S5.
030
.70.
402.
436.
6040
.16
Sou
rce
0.01
20.
037
8.8
25.9
0.95
2.81
4.72
13.9
3
Cro
ppin
g X
Sou
rce
0.01
8N
S12
.4N
S1.
35N
S6.
68N
S
Sou
rce
X C
ropp
ing
0.01
7N
S12
.4N
S1.
29N
S8.
98N
S
Rai
pur
Ric
e-ch
ickp
ea E
C+
CD
M+
NE
OC
1.24
7.40
0.27
0.65
21
612
.42
81
@ 1
/3 N
eac
h
Bio
dyn
amic
pra
ctic
e1.
277.
460.
340.
581
86
10.4
25
9
EC
+C
DM
+N
EO
C@
1/3N
1.24
7.31
0.25
0.64
20
612
.92
79
each
+P
anch
agav
ya
EC
+C
DM
+N
EO
C1.
227.
350.
280.
642
13
12.1
28
2@
1/3
N e
ach
+ B
iody
nam
ic p
ract
ice
Bio
dyna
mic
prac
tice+
1.21
7.29
0.22
0.66
22
113
.63
07
EC
+C
DM
+N
EO
C@
1/3N
each
+P
anch
agav
ya
Mea
n7.
360.
27
Ric
e- m
usta
rd+
EC
+C
DM
+N
EO
C @
1/3
N1.
237.
380.
280.
602
07
11.9
26
7le
ntil
(alte
rnat
e ro
w)
ea
ch
Bio
dyn
amic
pra
ctic
e1.
317.
440.
340.
561
89
9.40
24
5
Cro
pp
ing
sys
tem
So
urc
e o
f n
utr
ien
tB
D (
g/c
c)pH
EC
(dS
/m)
OC
(%)
N (
kg h
a-1)
P (
kg h
a-1)
K (
kg h
a-1)

Network Project on Organic Farming
Annual Report 2012-1366
EC
+C
DM
+N
EO
C1.
237.
280.
270.
602
03
12.1
26
5@
1/3N
each
+P
anch
agav
ya
EC
+C
DM
+N
EO
C @
1/3
N1.
237.
350.
270.
632
03
11.5
26
5ea
ch +
Bio
dyn
amic
pra
ctic
e
Bio
dyna
mic
prac
tice+
EC
+1.
237.
390.
290.
622
15
12.4
27
9C
DM
+N
EO
C@
1/3N
each
+P
anch
agav
ya
Mea
n7.
370.
29
CD
(P
-0.0
5)S
Em
±C
DS
Em
±C
DS
Em
±C
DS
Em
±C
DS
Em
±C
DS
Em
±C
DS
Em
±C
D
Cro
pp
ing
0.01
NS
0.02
NS
0.00
30.
020
0.01
0.02
5.15
NS
0.41
NS
3.94
17.0
Sou
rce
0.01
0.03
0.05
NS
0.01
00.
029
0.02
0.03
7.02
14.9
0.61
1.30
4.60
9.74
Cro
ppin
g X
Sou
rce
0.02
NS
0.07
NS
0.01
4N
S0.
02N
S9.
93N
S0.
87N
S6.
50N
S
Sou
rce
X C
ropp
ing
0.02
NS
0.06
NS
0.01
3N
S0.
02N
S10
.3N
S0.
87N
S7.
02N
S
Ran
chi
Ric
e-w
heat
50%
VC
+50
% K
C2
58
39
15
2
BD
Pre
para
tion
22
12
91
28
(CP
P,B
D50
0 &
501
)
VC
+ K
.C+
Pan
chag
avay
a2
61
39
15
3
VC
+ K
.C+
BD
Pre
part
ion
26
24
21
55
VC
+ K
.C+
BD
Pre
part
ion
+2
64
45
15
6P
anch
agav
ya
Mea
n2
53
39
14
9
Ric
e-po
tato
50%
VC
+50
% K
C2
53
40
14
6
BD
Pre
para
tion
21
62
81
27
(CP
P,B
D50
0 &
501
)
VC
+ K
.C+
Pan
chag
avay
a2
55
42
14
9
VC
+ K
.C+
BD
Pre
part
ion
25
54
61
51
VC
+ K
.C+
BD
Pre
part
ion
+2
58
46
15
5P
anch
agav
ya
Mea
n2
47
40
14
6
Cro
pp
ing
sys
tem
So
urc
e o
f n
utr
ien
tB
D (
g/c
c)pH
EC
(dS
/m)
OC
(%)
N (
kg h
a-1)
P (
kg h
a-1)
K (
kg h
a-1)

Network Project on Organic Farming
Annual Report 2012-13 67
Um
ium
2A
Mai
ze +
soy
bean
FYM
+VC
1.14
5.10
2.24
23
121
.82
28
(GM
) -
toria
Pan
chag
avya
(PG
)1.
214.
991.
601
97
15.7
19
1
FYM
+VC
+PG
1.12
5.16
2.34
23
522
.92
37
Bio
dyna
mic
For
mul
atio
n1.
235.
011.
681
99
16.4
19
8(B
D-5
01)
BD
-50
1 +
PG
1.21
4.97
1.75
20
316
.62
04
Con
trol
1.26
4.89
1.49
17
412
.61
87
Mea
n
Mai
ze (
gree
n co
b) +
FYM
+VC
1.15
5.12
2.29
23
723
.02
29
soyb
ean
(GM
) –
Fre
nch
bean
(Gre
en p
od)
Pan
chag
avya
(PG
)1.
244.
971.
642
06
14.5
19
4
FYM
+VC
+PG
1.14
5.18
2.34
24
225
.22
37
Bio
dyna
mic
For
mul
atio
n1.
224.
962.
082
06
15.2
20
8(B
D-5
01)
BD
-50
1 +
PG
1.26
4.97
2.04
21
414
.32
11
Con
trol
1.28
4.87
1.72
19
612
.61
87
Mea
n
CD
(P
-0.0
5)S
Em
±C
DS
Em
±C
DS
Em
±C
DS
Em
±C
DS
Em
±C
DS
Em
±C
DS
Em
±C
D
Cro
pp
ing
0.01
NS
0.03
NS
0.03
0.11
0.90
3.87
0.72
NS
4.62
NS
Sou
rce
0.02
0.05
0.05
0.11
0.07
0.15
5.24
10.9
1.57
3.28
4.12
8.60
Cro
ppin
g X
Sou
rce
0.03
NS
0.07
NS
0.10
NS
7.41
NS
2.22
NS
5.83
NS
Sou
rce
X C
ropp
ing
0.03
NS
0.07
NS
0.10
NS
6.83
NS
2.15
NS
7.05
NS
Um
ium
2B
Mai
ze+
soyb
ean-
tom
ato
FYM
1.19
5.13
2.25
241.
726
.624
3.2
VC
1.16
5.13
2.18
233.
125
.723
9.3
FYM
+VC
1.13
5.13
2.28
244.
028
.524
4.0
Cro
pp
ing
sys
tem
So
urc
e o
f n
utr
ien
tB
D (
g/c
c)pH
EC
(dS
/m)
OC
(%)
N (
kg h
a-1)
P (
kg h
a-1)
K (
kg h
a-1)
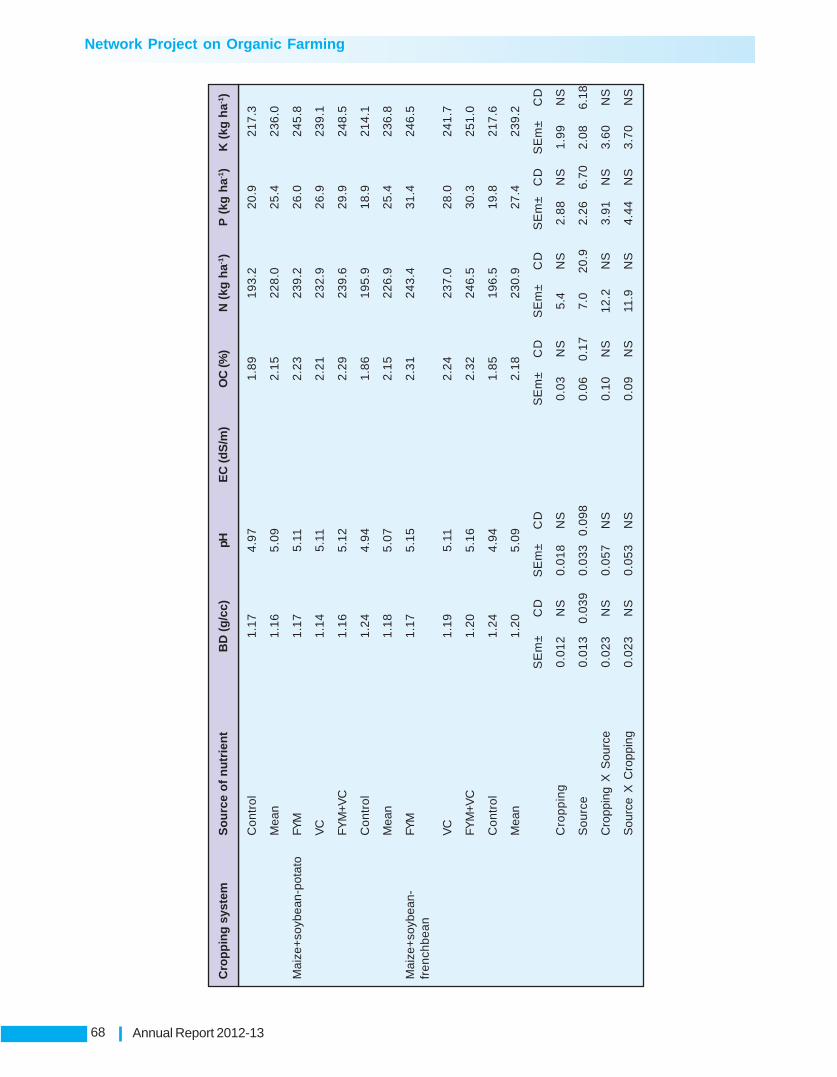
Network Project on Organic Farming
Annual Report 2012-1368
Con
trol
1.17
4.97
1.89
193.
220
.921
7.3
Mea
n1.
165.
092.
1522
8.0
25.4
236.
0
Mai
ze+
soyb
ean-
pota
toFY
M1.
175.
112.
2323
9.2
26.0
245.
8
VC
1.14
5.11
2.21
232.
926
.923
9.1
FYM
+VC
1.16
5.12
2.29
239.
629
.924
8.5
Con
trol
1.24
4.94
1.86
195.
918
.921
4.1
Mea
n1.
185.
072.
1522
6.9
25.4
236.
8
Mai
ze+
soyb
ean-
FYM
1.17
5.15
2.31
243.
431
.424
6.5
fren
chbe
an
VC
1.19
5.11
2.24
237.
028
.024
1.7
FYM
+VC
1.20
5.16
2.32
246.
530
.325
1.0
Con
trol
1.24
4.94
1.85
196.
519
.821
7.6
Mea
n1.
205.
092.
1823
0.9
27.4
239.
2
SE
m±
CD
SE
m±
CD
SE
m±
CD
SE
m±
CD
SE
m±
CD
SE
m±
CD
Cro
pp
ing
0.01
2N
S0.
018
NS
0.03
NS
5.4
NS
2.88
NS
1.99
NS
Sou
rce
0.01
30.
039
0.03
30.
098
0.06
0.17
7.0
20.9
2.26
6.70
2.08
6.18
Cro
ppin
g X
Sou
rce
0.02
3N
S0.
057
NS
0.10
NS
12.2
NS
3.91
NS
3.60
NS
Sou
rce
X C
ropp
ing
0.02
3N
S0.
053
NS
0.09
NS
11.9
NS
4.44
NS
3.70
NS
Cro
pp
ing
sys
tem
So
urc
e o
f n
utr
ien
tB
D (
g/c
c)pH
EC
(dS
/m)
OC
(%)
N (
kg h
a-1)
P (
kg h
a-1)
K (
kg h
a-1)

Network Project on Organic Farming
Annual Report 2012-13 69
Tab
le 1
5. In
flu
ence
of
sou
rce
of
nu
trie
nts
on
so
il m
icro
nu
trie
nts
(p
pm
) an
d m
icro
bia
l co
un
t (x
104
CF
U/g
) at
th
e en
d o
f cr
op
pin
g c
ycle
Cro
pp
ing
sys
tem
So
urc
e o
f n
utr
ien
tM
nZn
Cu
FeFu
ngi
Bac
teri
aA
ctin
om
ycet
es
Baj
aura
Cor
iand
er-p
ea-t
omat
oR
ock
phos
phat
e en
rich
ed46
.63.
632.
8385
.5F
YM
+ V
C (
1:1)
FY
M fb
BD
45.6
3.17
2.78
75.7
Roc
k ph
osph
ate
enri
ched
45.0
3.03
2.76
73.7
FY
M +
VC
(1:
1) fb
Pan
chag
vya
FY
M fb
BD
fb P
anch
agvy
a45
.93.
232.
7877
.4
Con
trol
21.6
0.68
0.64
44.8
Con
trol
with
Pan
chag
avya
24.9
0.71
0.67
45.9
Mea
n38
.32.
412.
0867
.2
Cau
liflo
wer
-pea
-R
ock
phos
phat
e en
rich
ed47
.53.
272.
8084
.2ca
ulifl
ower
FY
M +
VC
(1:
1)
FY
M fb
BD
45.6
3.10
2.76
75.8
Roc
k ph
osph
ate
enri
ched
45.4
3.00
2.72
71.6
FY
M +
VC
(1:
1) fb
Pan
chag
vya
FY
M fb
BD
fb P
anch
agvy
a46
.63.
102.
7977
.2
Con
trol
20.1
0.44
0.64
41.6
Con
trol
with
Pan
chag
avya
25.3
0.48
0.66
45.0
Mea
n38
.42.
232.
0665
.9
CD
(P
=0.
05)
SE
m±
CD
SE
m±
CD
SE
m±
CD
SE
m±
CD
Cro
pp
ing
0.24
NS
0.06
NS
0.02
NS
0.38
NS
Met
hod
0.52
1.08
0.07
0.14
0.02
0.03
0.77
1.60
Cro
ppin
g X
Met
hod
0.73
NS
0.10
NS
0.02
NS
1.08
NS
Met
hod
X C
ropp
ing
0.71
NS
0.10
NS
0.03
NS
1.06
NS
Cal
icu
t
Gin
ger
FY
M+B
D+P
G+R
P5.
731.
179.
8050
.7
FY
M+P
G+R
P7.
631.
4015
.050
.0
FY
M+B
D+R
P3.
870.
7714
.351
.3

Network Project on Organic Farming
Annual Report 2012-1370
FY
M+N
C+2
VC
+PG
+BD
+RP
4.37
1.27
14.8
51.3
FY
M+N
C+2
VC
+RP
3.80
0.97
15.1
51.7
Abs
olut
e co
ntro
l3.
730.
7312
.954
.3
Mea
n4.
861.
0513
.751
.6
Tur
mer
icF
YM
+BD
+PG
+RP
9.29
1.22
2.03
47.0
FY
M+P
G+R
P7.
331.
272.
3049
.0
FY
M+B
D+R
P6.
771.
366.
3547
.0
FY
M+N
C+2
VC
+PG
+BD
+RP
10.3
1.81
3.76
49.3
FY
M+N
C+2
VC
+RP
7.84
1.20
3.42
47.0
Abs
olut
e co
ntro
l7.
701.
392.
3947
.7
Mea
n8.
211.
383.
3847
.8
CD
(P
=0.
05)
SE
m±
CD
SE
m±
CD
SE
m±
CD
SE
m±
CD
Cro
pp
ing
0.73
2.34
0.04
0.13
0.38
1.21
0.63
1.99
Met
hod
0.93
NS
0.10
0.20
0.53
1.09
0.90
NS
Cro
ppin
g X
Met
hod
1.31
NS
0.14
0.29
0.75
1.54
1.27
NS
Met
hod
X C
ropp
ing
1.41
NS
0.14
0.29
0.79
1.82
1.32
NS
Co
imb
ato
re
Cot
ton
- m
aize
-F
YM
+ N
EO
C*
(1/2
+1/
2)21
.011
736
.5gr
een
man
ure
Pan
chag
avya
alo
ne18
.81
01
32.0
FY
M+
NE
OC
*(1/
2+1/
2)+
21.4
12
138
.6P
anch
agav
ya
Bio
dyna
mic
Pra
ctic
es18
.21
05
31.5
Bio
dyna
mic
Pra
ctic
es+
21.0
10
632
.8P
anch
agav
ya
Mea
n20
.111
034
.3
Chi
llies
- S
unflo
wer
-F
YM
+ N
EO
C*
(1/2
+1/
2)21
.911
735
.6G
reen
man
ure
Pan
chag
avya
alo
ne19
.898
.633
.5
Cro
pp
ing
sys
tem
So
urc
e o
f n
utr
ien
tM
nZn
Cu
FeFu
ngi
Bac
teri
aA
ctin
om
ycet
es

Network Project on Organic Farming
Annual Report 2012-13 71
FY
M+
NE
OC
*(1/
2+1/
2)+
22.4
118
39.3
Pan
chag
avya
Bio
dyna
mic
Pra
ctic
es19
.598
.433
.0
Bio
dyna
mic
Pra
ctic
es+
22.2
10
135
.0P
anch
agav
ya
Mea
n21
.21
07
35.3
CD
(P
=0.
05)
SE
m±
CD
SE
m±
CD
SE
m±
CD
Cro
pp
ing
0.17
0.75
2.68
NS
0.76
NS
Met
hod
0.63
1.35
2.95
6.24
1.14
2.42
Cro
ppin
g X
Met
hod
0.90
NS
4.15
NS
1.61
NS
Met
hod
X C
ropp
ing
0.82
NS
4.59
NS
1.63
NS
Dh
arw
ad
Gro
un
dn
ut-
sorg
hu
mE
C+V
C+G
LM13
.61.
031.
4310
.23.
003.
009.
00
Pan
chag
avya
spr
ay11
.61.
051.
399.
153.
007.
008.
00
EC
+V
C+
GLM
+14
.61.
071.
4510
.36.
007.
0011
.0P
anch
agav
ya s
pray
EC
+V
C+
GLM
+ B
iody
nam
ic10
.70.
991.
418.
942.
0011
.07.
00sp
ray
@5g
/ac
EC
+V
C+
GLM
+ B
iody
nam
ic13
.01.
021.
268.
462.
007.
0016
.0sp
ray
@5g
/ac+
Pan
chag
avya
spra
y
FYM
+VC
+GLM
13.1
1.05
1.36
8.19
2.00
8.00
10.0
Con
trol
8.51
0.97
09
97.
853.
0015
.08.
00
Mea
n12
.21.
0315
.39.
013.
008.
299.
86
Mai
ze-c
hick
pea
EC
+VC
+GLM
13.5
1.02
1.36
9.92
3.00
14.0
17.0
Pan
chag
avya
spr
ay11
.41.
041.
199.
459.
0012
.029
.0
EC
+V
C+
GLM
+ P
anch
agav
ya14
.70.
991.
2410
.82.
009.
003.
00sp
ray
EC
+V
C+
GLM
+ B
iody
nam
ic11
.40.
961.
129.
234.
0010
.011
.0sp
ray
@5g
/ac
Cro
pp
ing
sys
tem
So
urc
e o
f n
utr
ien
tM
nZn
Cu
FeFu
ngi
Bac
teri
aA
ctin
om
ycet
es
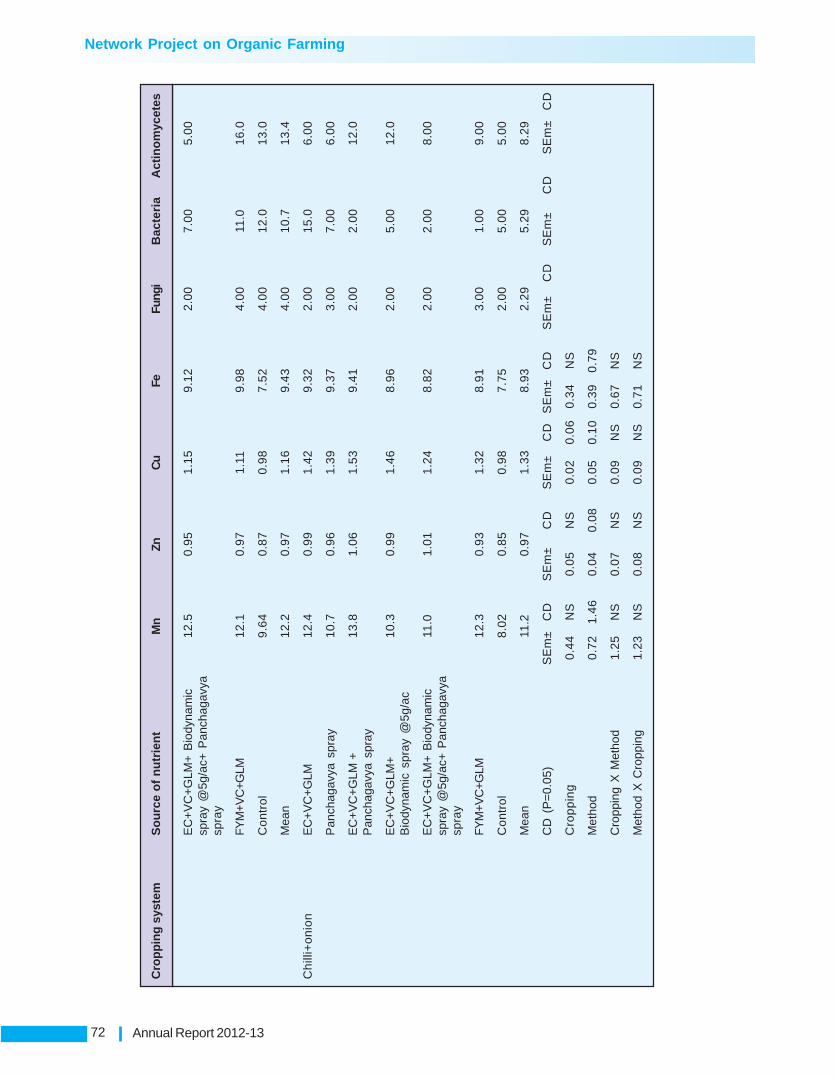
Network Project on Organic Farming
Annual Report 2012-1372
EC
+V
C+
GLM
+ B
iody
nam
ic12
.50.
951.
159.
122.
007.
005.
00sp
ray
@5g
/ac+
Pan
chag
avya
spra
y
FYM
+VC
+GLM
12.1
0.97
1.11
9.98
4.00
11.0
16.0
Con
trol
9.64
0.87
0.98
7.52
4.00
12.0
13.0
Mea
n12
.20.
971.
169.
434.
0010
.713
.4
Ch
illi+
on
ion
EC
+VC
+GLM
12.4
0.99
1.42
9.32
2.00
15.0
6.00
Pan
chag
avya
spr
ay10
.70.
961.
399.
373.
007.
006.
00
EC
+V
C+
GLM
+13
.81.
061.
539.
412.
002.
0012
.0P
anch
agav
ya s
pray
EC
+VC
+GLM
+10
.30.
991.
468.
962.
005.
0012
.0B
iody
nam
ic s
pray
@5g
/ac
EC
+V
C+
GLM
+ B
iody
nam
ic11
.01.
011.
248.
822.
002.
008.
00sp
ray
@5g
/ac+
Pan
chag
avya
spra
y
FYM
+VC
+GLM
12.3
0.93
1.32
8.91
3.00
1.00
9.00
Con
trol
8.02
0.85
0.98
7.75
2.00
5.00
5.00
Mea
n11
.20.
971.
338.
932.
295.
298.
29
CD
(P
=0.
05)
SE
m±
CD
SE
m±
CD
SE
m±
CD
SE
m±
CD
SE
m±
CD
SE
m±
CD
SE
m±
CD
Cro
pp
ing
0.44
NS
0.05
NS
0.02
0.06
0.34
NS
Met
hod
0.72
1.46
0.04
0.08
0.05
0.10
0.39
0.79
Cro
ppin
g X
Met
hod
1.25
NS
0.07
NS
0.09
NS
0.67
NS
Met
hod
X C
ropp
ing
1.23
NS
0.08
NS
0.09
NS
0.71
NS
Cro
pp
ing
sys
tem
So
urc
e o
f n
utr
ien
tM
nZn
Cu
FeFu
ngi
Bac
teri
aA
ctin
om
ycet
es
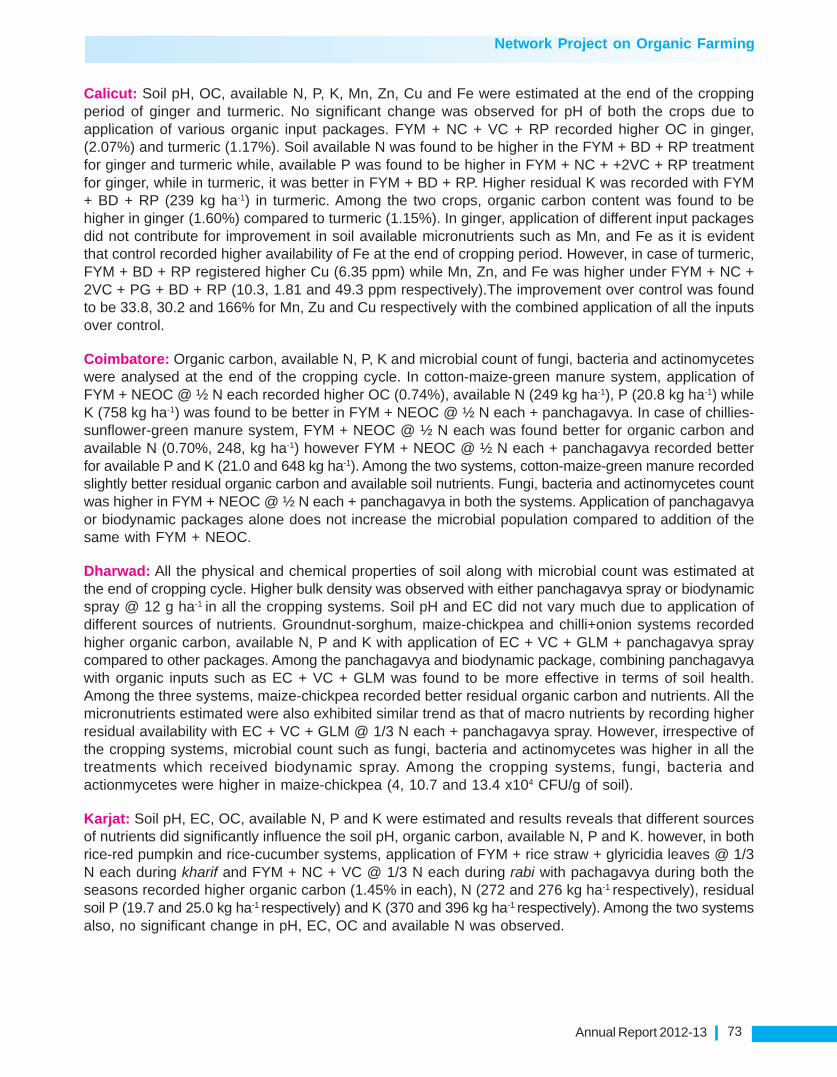
Network Project on Organic Farming
Annual Report 2012-13 73
Calicut: Soil pH, OC, available N, P, K, Mn, Zn, Cu and Fe were estimated at the end of the croppingperiod of ginger and turmeric. No significant change was observed for pH of both the crops due toapplication of various organic input packages. FYM + NC + VC + RP recorded higher OC in ginger,(2.07%) and turmeric (1.17%). Soil available N was found to be higher in the FYM + BD + RP treatmentfor ginger and turmeric while, available P was found to be higher in FYM + NC + +2VC + RP treatmentfor ginger, while in turmeric, it was better in FYM + BD + RP. Higher residual K was recorded with FYM+ BD + RP (239 kg ha-1) in turmeric. Among the two crops, organic carbon content was found to behigher in ginger (1.60%) compared to turmeric (1.15%). In ginger, application of different input packagesdid not contribute for improvement in soil available micronutrients such as Mn, and Fe as it is evidentthat control recorded higher availability of Fe at the end of cropping period. However, in case of turmeric,FYM + BD + RP registered higher Cu (6.35 ppm) while Mn, Zn, and Fe was higher under FYM + NC +2VC + PG + BD + RP (10.3, 1.81 and 49.3 ppm respectively).The improvement over control was foundto be 33.8, 30.2 and 166% for Mn, Zu and Cu respectively with the combined application of all the inputsover control.
Coimbatore: Organic carbon, available N, P, K and microbial count of fungi, bacteria and actinomyceteswere analysed at the end of the cropping cycle. In cotton-maize-green manure system, application ofFYM + NEOC @ ½ N each recorded higher OC (0.74%), available N (249 kg ha-1), P (20.8 kg ha-1) whileK (758 kg ha-1) was found to be better in FYM + NEOC @ ½ N each + panchagavya. In case of chillies-sunflower-green manure system, FYM + NEOC @ ½ N each was found better for organic carbon andavailable N (0.70%, 248, kg ha-1) however FYM + NEOC @ ½ N each + panchagavya recorded betterfor available P and K (21.0 and 648 kg ha-1). Among the two systems, cotton-maize-green manure recordedslightly better residual organic carbon and available soil nutrients. Fungi, bacteria and actinomycetes countwas higher in FYM + NEOC @ ½ N each + panchagavya in both the systems. Application of panchagavyaor biodynamic packages alone does not increase the microbial population compared to addition of thesame with FYM + NEOC.
Dharwad: All the physical and chemical properties of soil along with microbial count was estimated atthe end of cropping cycle. Higher bulk density was observed with either panchagavya spray or biodynamicspray @ 12 g ha-1 in all the cropping systems. Soil pH and EC did not vary much due to application ofdifferent sources of nutrients. Groundnut-sorghum, maize-chickpea and chilli+onion systems recordedhigher organic carbon, available N, P and K with application of EC + VC + GLM + panchagavya spraycompared to other packages. Among the panchagavya and biodynamic package, combining panchagavyawith organic inputs such as EC + VC + GLM was found to be more effective in terms of soil health.Among the three systems, maize-chickpea recorded better residual organic carbon and nutrients. All themicronutrients estimated were also exhibited similar trend as that of macro nutrients by recording higherresidual availability with EC + VC + GLM @ 1/3 N each + panchagavya spray. However, irrespective ofthe cropping systems, microbial count such as fungi, bacteria and actinomycetes was higher in all thetreatments which received biodynamic spray. Among the cropping systems, fungi, bacteria andactionmycetes were higher in maize-chickpea (4, 10.7 and 13.4 x10⁴ CFU/g of soil).
Karjat: Soil pH, EC, OC, available N, P and K were estimated and results reveals that different sourcesof nutrients did significantly influence the soil pH, organic carbon, available N, P and K. however, in bothrice-red pumpkin and rice-cucumber systems, application of FYM + rice straw + glyricidia leaves @ 1/3N each during kharif and FYM + NC + VC @ 1/3 N each during rabi with pachagavya during both theseasons recorded higher organic carbon (1.45% in each), N (272 and 276 kg ha-1 respectively), residualsoil P (19.7 and 25.0 kg ha-1 respectively) and K (370 and 396 kg ha-1 respectively). Among the two systemsalso, no significant change in pH, EC, OC and available N was observed.

Network Project on Organic Farming
Annual Report 2012-1374
Ludhiana: Soil pH did not vary significantly withdifferent nutrient sources while EC, organic carbon,soil available N, P and K was highly influenced. Inmaize-wheat + gram-moong (s), application of FYM+ BD recorded 56% increase in organic carbon and40.4% increase in available N. Application of FYMalone recorded higher availability of residual soil P(64.6%) and K (87%) over control. In basmati rice-wheat-green manure system, an increase of 49%was observed in organic carbon with application ofGM+PG to rice and FYM + PG to other crops while,availability of N in soil was higher with GM+PG+BDin the system compared to control. Significantly Organic chickpea crop at Ludhiana
higher residual P (57.3% increase) and K (118% increase) was observed with application of GM alone tobasmati rice and FYM alone to other crops in the same system.
Pantnagar: Marginal increase of 5 to 6% in organic carbon was observed with FYM + VC + NC + EC @¼ N each + panchagavya+biodynamic spray in basmati rice-chickpea-sesbania (green manure) and inbasmati rice-vegetable pea-maize+moong (residues incorporation) system. Available N, P and K wasalso found to be higher under the same treatments in both the systems.
Raipur: Bulk density and EC of soil was found to be higher with biodynamic package in both rice-chickpeaand rice-mustard+lentil (alternate row) systems (1.27 and 1.31 g cc-1). No significant variation amongdifferent input packages and cropping system was observed in soil pH. However, organic carbon wasfound to be higher under biodynamic+EC + CDM + NEOC @ 1/3 N each + panchagavya in rice-chickpea(0.66%) and EC + CDM + NEOC@ 1/3 N each + biodynamic package in rice-mustard + lentil (0.63%)system. Soil available N, P, K was not significantly influenced by different input packages in croppingsystems. EC + CDM + NEOC@ 1/3 N each with use of biodynamic and panchagavya package registeredhigher availability of residual N, P and K in soil for both the systems.
Ranchi: Higher availability of N, P and K in soil was observed with the application of VC+KC with use ofbiodynamic and panchagavya package in both rice-wheat and rice-potato system.
General view of organic farming experimental block atUmiam
Umiam: Bulk density and soil pH was significantlyinfluenced by application of nutrient sources alongwith panchagavya and biodynamic preparation. Inboth the systems (maize + soybean (GM)–toria andmaize (green cob)+soybean (GM)-french bean(green pod)), application of FYM+VC+PG recordedhigher organic carbon (2.34% each) and higheravailable nutrients after the harvest of crops. N, Pand K was also found to be higher in the sametreatment in both system. Panchagavya spray andbiodynamic application did increase the OC andnutrients compared to control, but the increase waslower than the combined application of nutrient inputswith panchagavya and biodynamic packages. In theanother experiment, FYM + VC @ ½ N each wasfound to be better for increasing higher OC andnutrients over control in all the systems. The increase in OC was found to be 25% over control in thesystem involving frenchbean.

Network Project on Organic Farming
Annual Report 2012-13 75
Nutrient uptake (Table 16-18)
Bajaura: Both coriander-pea-tomato and cauliflower-pea-cauliflower system recorded higher NPKconcentration in plants with rock phosphate enriched FYM + VC @ ½ N each as nutrient sources.Application of panchagavya or biodynamic preparation also improved the concentration of NPK in all thecrops compared to control. No significant improvement in panchagavya alone was observed with respectto uptake of all the nutrients compared to control. Fe, Mn, Zn and Cu concentration in plants of tomato,coriander, pea and cauliflower in the respective system have also been found higher with rock phosphateenriched FYM + VC @ ½ N each compared to other sources. The increase Fe concentration was foundto be 51.1, 52, 11.3 and 24.6% in tomato, coriander, pea and cauliflower respectively.
Dharwad: NPK uptake was found to be significantly higher with application of EC+VC+GLM withpanchagavya spray in all three systems. Uptake of all the nutrients compared to control in plants ofgroundnut, sorghum, maize and chickpea in the respective system have also been found higher withEC+VC+GLM with panchagavya spray. The increase in N uptake over panchagavya and biodynamicpackages alone was found to be 74, 12.6, 47.4 and 14.2% groundnut, sorghum, maize and chickpearespectively. Chilli+onian system also registered higher N, P and K uptake with the same package.
Organic moong crop at Ludhiana
Ludhiana: Estimation of NPK uptake in basmati riceindicates, an increase of 48.3% in N and 67% in Puptake was observed with GM+ PG to basmati riceand FYM + PG to other crops, while GM + PG+BDto basmati rice and FYM + PG + BD to other cropsrecorded higher uptake.
Pantnagar: In both the systems NPK uptake ofbasmati rice was found to be significantly higher withFYM + VC + NC + EC @ ¼ N each + biodynamicpreparation + panchagavya application (92, 17.7 and94.5 kg ha-1 of N, P and K uptake respectively)
compared to FYM + VC + NC + EC alone (77.3, 14.2 and 79.2 kg ha-1 of NPK uptake respectively). Invegetable pea, application of FYM, VC, NC and EC as nutrient sources along with biodynamic preparationand panchagavya recorded higher N and P uptake (129.4and 25.0 kg ha-1) while K uptake (46.2 kg ha-1)was found to be higher under organic sources along with biodynamic preparation compared to combiningthe same with either panchagavya or biodynamic preparation. Micronutrient Fe and Zn was also higherwith the application of FYM, VC, NC and EC as nutrient sources along with biodynamic preparation (35.3and 0.94 ppm) in basmati rice.
Raipur: Uptake of NPK was significantly influenced by nutrient sources in rice-chickpea and rice-mustard+lentil systems. Application of EC + CDM + NEOC @ 1/3 N each + biodynamic spray +panchagavya registered significantly higher N, P and K uptake in all the crops in both the systems (77.1,16.6 and 121 kg ha-1 in rice, 66.2, 18.3 and 29.0 kg ha-1 in chickpea and 40.7, 7.11 and 44.7 kg ha-1 inmustard). Application of biodynamic and panchagavya packages contributed significantly in nutrient uptakecompared to application of nutrients sources EC+ CDM + NEOC.
Ranchi: N, P and K uptake were estimated and results reveals that in both the systems uptake of NPKwas found to be higher by nutrient sources of VC + KC + biodynamic preparation + panchagavya 109.1,18.2 and 75.3 kg ha-1 in rice, 54.2, 9.8 and 43.0 kg ha-1 in wheat and 126.6, 36.2 and 158.2 kg ha-1 inpotato.

Network Project on Organic Farming
Annual Report 2012-1376
Tab
le 1
6. I
nfl
uen
ce o
f so
urc
e o
f n
utr
ien
ts o
n N
PK
up
take
of
dif
fere
nt
cro
ps
Cro
pp
ing
sys
tem
sTr
eatm
ents
NP
K
Kh
arif
Rab
iS
um
mer
Mea
nK
har
ifR
abi
Su
mm
erM
ean
Kh
arif
Rab
iS
um
mer
Mea
n
Baj
aura
Cor
iand
er-p
ea-t
omat
oR
ock
phos
phat
e0.
801.
681.
301.
260.
370.
600.
420.
460.
580.
791.
280.
88en
riche
d F
YM
+V
C (
1:1)
FY
M fb
BD
0.74
1.52
1.29
1.18
0.35
0.57
0.37
0.43
0.54
0.71
1.22
0.82
Roc
k ph
osph
ate
0.72
1.53
1.30
1.18
0.34
0.51
0.44
0.43
0.55
0.68
1.25
0.83
enric
hed
FY
M +
VC
(1:1
) fb
Pan
chag
vya
FY
M f
b B
D f
b0.
721.
521.
251.
160.
330.
520.
340.
400.
530.
691.
240.
82P
anch
agvy
a
Con
trol
0.62
1.15
0.89
0.89
0.28
0.32
0.30
0.30
0.46
0.56
0.98
0.67
Con
trol
with
0.64
1.21
0.93
0.93
0.29
0.34
0.30
0.31
0.49
0.58
0.98
0.68
Pan
chag
avya
Mea
n0.
711.
441.
160.
330.
480.
360.
530.
671.
16
Cau
liflo
wer
-pea
-R
ock
phos
phat
e1.
671.
631.
241.
510.
450.
620.
530.
530.
660.
801.
160.
87ca
ulifl
ower
enric
hed
FY
M +
VC
(1:
1)
FY
M fb
BD
1.60
1.53
1.20
1.44
0.41
0.51
0.48
0.47
0.65
0.73
1.09
0.82
Roc
k ph
osph
ate
1.64
1.43
1.22
1.43
0.39
0.54
0.53
0.49
0.65
0.71
1.11
0.82
enric
hed
FY
M +
VC
(1:
1) f
b P
anch
agvy
a
FY
M f
b B
D f
b1.
611.
501.
231.
450.
400.
480.
540.
470.
630.
711.
120.
82P
anch
agvy
a
Con
trol
1.49
1.15
0.87
1.17
0.33
0.32
0.35
0.33
0.55
0.58
0.87
0.67
Con
trol
with
1.53
1.13
0.86
1.17
0.33
0.33
0.39
0.35
0.55
0.60
0.90
0.68
Pan
chag
avya
Mea
n1.
591.
401.
100.
390.
470.
470.
610.
691.
04
CD
(P
=0.0
5)S
Em
CD
SE
mC
DS
Em
CD
SE
mC
DS
Em
CD
SE
mC
DS
Em
CD
SE
mC
DS
Em
CD
Cro
ppin
g0.
000.
010.
010.
020.
02N
S0.
010.
050.
01N
S0.
010.
040.
003
0.01
70.
01N
S0.
010.
06
Sou
rce
0.01
0.02
0.02
0.04
0.02
0.04
0.01
0.02
0.02
0.03
0.02
0.03
0.00
60.
016
0.02
0.03
0.02
0.03
Cro
ppin
g X
Sou
rce
0.01
NS
0.03
NS
0.03
NS
0.02
NS
0.02
NS
0.02
0.05
0.00
80.
023
0.02
NS
0.02
NS
Sou
rce
X C
ropp
ing
0.01
NS
0.03
NS
0.03
NS
0.02
NS
0.02
NS
0.02
0.05
0.00
80.
026
0.02
NS
0.02
NS

Network Project on Organic Farming
Annual Report 2012-13 77
Cro
pp
ing
sys
tem
sTr
eatm
ents
NP
K
Kh
arif
Rab
iS
um
mer
Kh
arif
Rab
iS
um
mer
Kh
arif
Rab
iS
um
mer
Dh
arw
ad
Gro
un
dn
ut-
sorg
hu
mE
C+V
C+G
LM1
73
130.
539
.729
.61
40
114.
3
Pan
chag
avya
spr
ay1
30
120.
825
.621
.31
22
72.5
EC
+V
C+
GLM
+2
27
136.
048
.237
.11
97
123.
5P
anch
agav
ya s
pray
EC
+VC
+GLM
+1
53
116.
726
.020
.511
070
.9B
iody
nam
ic s
pray
@5g
/ac
EC
+VC
+GLM
+1
67
119.
431
.121
.11
37
74.3
Bio
dyna
mic
spr
ay@
5g/a
c+ P
anch
agav
yasp
ray
FYM
+VC
+GLM
15
011
6.9
34.3
25.8
10
910
2.9
Con
trol
12
010
3.7
21.5
13.7
76.4
58.4
Mea
n1
60
120.
632
.324
.21
27
88.1
Mai
ze-c
hick
pea
EC
+VC
+GLM
22
412
7.6
47.1
17.5
17
862
.3
Pan
chag
avya
spr
ay1
71
115.
137
.315
.61
40
49.3
EC
+V
C+
GLM
+2
52
131.
455
.420
.91
89
65.1
Pan
chag
avya
spr
ay
EC
+VC
+GLM
+1
71
100.
139
.916
.21
35
48.5
Bio
dyna
mic
spr
ay@
5g/a
c
EC
+VC
+GLM
+1
96
110.
341
.215
.91
47
50.4
Bio
dyna
mic
spr
ay@
5g/a
c+P
anch
agav
ya s
pray
FYM
+VC
+GLM
21
910
9.5
43.8
15.2
15
052
.9
Con
trol
13
174
.627
.59.
711
531
.6
Mea
n1
95
109.
841
.715
.91
51
51.4
Ch
illi+
on
ion
EC
+VC
+GLM
30.2
7.60
25.6
Pan
chag
avya
spr
ay26
.15.
9022
.1
EC
+V
C+
GLM
+32
.48.
4026
.9P
anch
agav
ya s
pray

Network Project on Organic Farming
Annual Report 2012-1378
EC
+VC
+GLM
+25
.25.
1021
.1B
iody
nam
ic s
pray
@5g
/ac
EC
+VC
+GLM
+27
.36.
2020
.5B
iody
nam
ic s
pray
@5g
/ac+
Pan
chag
avya
spr
ay
FYM
+VC
+GLM
28.6
6.40
21.6
Con
trol
20.4
4.30
15.6
Mea
n27
.86.
2721
.9
SE
mC
DS
Em
CD
SE
mC
DS
Em
CD
SE
mC
DS
Em
CD
Cro
ppin
g8.
4423
.40.
291.
770.
752.
100.
996.
022.
797.
752.
0912
.7
Sou
rce
7.28
14.8
3.36
9.80
1.67
3.38
1.63
4.77
4.44
9.00
3.52
10.3
Cro
ppin
g X
Sou
rce
12.6
25.6
4.75
NS
2.89
5.86
2.31
NS
7.69
15.6
4.97
14.5
Sou
rce
X C
ropp
ing
14.4
32.9
4.41
NS
2.78
5.79
2.36
NS
7.65
16.3
5.05
17.5
Ludh
iana
Mai
ze-w
heat
+B
asm
ati
Oth
erg
ram
-su
mm
er
mo
on
gR
ice
cro
ps
GM
FYM
17
566
.51
38
GM
+PG
FYM
+PG
18
668
.511
6
GM
+BD
BD
111
46.0
78.8
GM
+BD
+F
YM
+BD
17
960
.61
25
FYM
GM
+PG
+FY
M+P
G+
18
468
.31
28
BD
BD
Con
trol
Con
trol
43.4
17.7
28.3
Mea
n
Bas
mat
i ric
e- w
heat
-G
MFY
M79
.713
.288
.3gr
een
man
ure
GM
+PG
FYM
+PG
87.2
14.2
10
3
GM
+BD
BD
80.3
13.3
95.0
GM
+BD
+F
YM
+BD
84.0
14.0
10
1FY
M
Cro
pp
ing
sys
tem
sTr
eatm
ents
NP
K
Kh
arif
Rab
iS
um
mer
Kh
arif
Rab
iS
um
mer
Kh
arif
Rab
iS
um
mer

Network Project on Organic Farming
Annual Report 2012-13 79
GM
+PG
+FY
M+P
G+
86.6
15.2
10
5B
DB
D
Con
trol
Con
trol
58.8
9.10
69.7
Mea
n
CD
(P
=0.
05)
SE
mC
DS
Em
CD
SE
mC
D
Cro
pp
ing
10.6
45.7
9.06
39.0
15.0
NS
Sou
rce
8.78
18.3
5.18
10.8
10.6
22.0
Cro
ppin
g X
Sou
rce
12.4
25.9
7.32
15.3
15.0
31.2
Sou
rce
X C
ropp
ing
15.5
48.5
11.3
39.6
20.3
67.1
Pan
tnag
ar
Bas
mat
i ri
ce-
FY
M+V
C+N
C+E
C78
.814
.584
.3ch
ickp
ea-
(1/4
+1/
4+1/
4+1/
4)se
sba
nia
(g
ree
nm
an
ure
)
Bio
dyna
mic
(B
D)
70.5
10.8
69.2
FY
M+V
C+N
C+E
C81
.517
.095
.9(1
/4+
1/4+
1/4+
1/4)
+P
anch
gavy
a
FY
M+V
C+N
C+E
C90
.616
.985
.91/
4+1/
4+1/
4+1/
4)+
BD
FY
M+V
C+N
C+E
C97
.817
.610
1.3
(1/4
+1/
4+1/
4+1/
4)+
BD
+P
anch
gavy
a
T6=
Con
trol
65.9
14.4
63.6
Mea
n80
.915
.283
.4
Bas
mat
i ri
ce-
FY
M+V
C+N
C+E
C75
.812
7.4
13.8
16.8
74.0
43.1
vege
tabl
e pe
a-(1
/4+
1/4+
1/4+
1/4)
ma
ize
+m
oo
ng
(mo
on
g r
esi
du
es
inco
rpor
atio
n)
Bio
dyna
mic
(B
D)
52.3
65.4
9.9
12.6
52.9
27.3
FY
M+V
C+N
C+E
C83
.011
5.2
17.7
20.7
85.3
42.3
(1/4
+1/
4+1/
4+1/
4)+
Pan
chga
vya
Cro
pp
ing
sys
tem
sTr
eatm
ents
NP
K
Kh
arif
Rab
iS
um
mer
Kh
arif
Rab
iS
um
mer
Kh
arif
Rab
iS
um
mer

Network Project on Organic Farming
Annual Report 2012-1380
FY
M+V
C+N
C+E
C79
.112
5.9
16.3
20.7
86.1
46.2
1/4+
1/4+
1/4+
1/4)
+B
D
FY
M+V
C+N
C+E
C86
.212
9.4
14.1
25.0
89.5
38.9
(1/4
+1/
4+1/
4+1/
4)+
BD
+P
anch
gavy
a
T6=
Con
trol
65.9
77.2
10.2
13.8
50.0
26.8
Mea
n73
.710
6.7
13.7
18.3
73.0
37.5
CD
(P
=0.0
5)S
Em
CD
SE
mC
DS
Em
CD
SE
mC
DS
Em
CD
SE
mC
D
Cro
ppin
g0.
140.
830.
462.
801.
609.
75
Sou
rce
1.89
5.57
6.6
20.8
0.75
2.22
1.80
5.67
2.26
6.67
2.30
7.24
Cro
ppin
g X
Sou
rce
2.67
7.87
1.07
NS
3.20
NS
Sou
rce
X C
ropp
ing
2.44
7.22
1.08
NS
3.33
NS
Rai
pur
Ric
e-ch
ickp
eaE
C+
CD
M+
NE
OC
68.7
60.8
14.9
16.9
113
28.1
@ 1
/3 N
eac
h
Bio
dyn
amic
pra
ctic
e39
.537
.28.
179.
8768
.316
.7
EC
+C
DM
+N
EO
C75
.654
.717
.015
.311
824
.6@
1/3N
each
+P
anch
agav
ya
EC
+C
DM
+N
EO
C69
.450
.015
.714
.91
20
23.4
@ 1
/3 N
eac
h +
Bio
dyn
amic
pra
ctic
e
Bio
dyna
mic
prac
tice+
80.9
66.2
17.3
18.3
12
229
.0E
C+
CD
M+
NE
OC
@1/
3Nea
ch+
Pan
chag
avya
Mea
n
Ric
e-m
ust
ard
+E
C+
CD
M+
NE
OC
64.1
35.2
14.6
6.66
10
640
.3le
ntil
(alte
rnat
e ro
w)
@ 1
/3 N
eac
h
Bio
dyn
amic
pra
ctic
e34
.324
.97.
944.
4758
.929
.5
EC
+C
DM
+N
EO
C37
.435
.514
.86.
741
09
40.0
@1/
3Nea
ch+
Pan
chag
avya
Cro
pp
ing
sys
tem
sTr
eatm
ents
NP
K
Kh
arif
Rab
iS
um
mer
Kh
arif
Rab
iS
um
mer
Kh
arif
Rab
iS
um
mer

Network Project on Organic Farming
Annual Report 2012-13 81
EC
+C
DM
+N
EO
C37
.738
.215
.66.
8211
441
.1@
1/3
N e
ach
+ B
iody
nam
ic p
ract
ice
Bio
dyna
mic
prac
tice+
73.2
40.7
15.9
7.11
12
044
.7E
C+
CD
M+
NE
OC
@1/
3Nea
ch+
Pan
chag
avya
Mea
n
Cd
(P=0
.05)
SE
mC
DS
Em
CD
SE
mC
DS
Em
CD
SE
mC
DS
Em
CD
Cro
ppin
g3.
13N
S1.
004.
320.
79N
S0.
763.
283.
37N
S1.
496.
39
Sou
rce
2.31
4.89
2.59
5.49
0.69
1.46
0.66
1.39
3.17
6.71
2.31
4.90
Cro
ppin
g X
Sou
rce
3.26
NS
3.66
7.76
0.98
NS
0.93
1.96
4.48
NS
3.27
NS
Sou
rce
X C
ropp
ing
4.28
NS
3.42
7.90
1.18
NS
1.13
3.52
5.23
NS
3.28
NS
Ran
chi
Ric
e-w
heat
50%
VC
+50
% K
C93
.40
47.0
16.1
08.
5065
.138
.3
BD
Pre
para
tion
52.4
023
.17.
503.
9337
.722
.2(C
PP,
BD
500
& 5
01)
VC
+ K
.C+
97.7
049
.316
.40
8.65
66.9
39.5
Pan
chag
avay
a
VC
+ K
.C+
101.
3051
.918
.10
9.02
69.2
40.4
BD
Pre
part
ion
:VC
+ K
.C+
107.
3054
.219
.00
9.81
74.0
43.0
BD
Pre
part
ion
+P
anch
agav
ya
Mea
n
Ric
e-po
tato
50%
VC
+50
% K
C98
.90
121.
916
.10
33.9
667
.815
0.8
BD
Pre
para
tion
55.3
049
.08.
7013
.37
38.5
61.5
(CP
P,B
D50
0 &
501
)
VC
+ K
.C+
101.
8012
3.1
17.2
035
.25
70.7
154.
0P
anch
agav
aya
VC
+ K
.C+
105.
8012
4.7
18.2
035
.51
73.9
155.
4B
D P
repa
rtio
n
VC
+ K
.C+
110.
9012
6.6
17.4
036
.15
76.5
158.
2B
D P
repa
rtio
n +
Pan
chag
avya
Mea
n
Cro
pp
ing
sys
tem
sTr
eatm
ents
NP
K
Kh
arif
Rab
iS
um
mer
Kh
arif
Rab
iS
um
mer
Kh
arif
Rab
iS
um
mer

Network Project on Organic Farming
Annual Report 2012-1382
Tab
le 1
7. I
nfl
uen
ce o
f so
urc
e o
f n
utr
ien
ts o
n F
e &
Mn
up
take
of
dif
fere
nt
cro
ps a
t va
rio
us
loca
tio
ns
Cro
pp
ing
sys
tem
sS
ou
rce
of
nu
trie
nt
FeM
n
Kh
arif
Rab
iS
um
mer
Mea
nK
har
ifR
abi
Su
mm
erM
ean
Baj
aura
Cor
iand
er-p
ea-t
omat
oR
ock
phos
phat
e en
rich
ed5
44
27
63
99
40
68
37
91
39
10
1F
YM
+ V
C (
1:1)
FY
M fb
BD
53
82
72
39
04
00
82
75
14
19
9
Roc
k ph
osph
ate
enri
ched
54
22
73
38
13
99
81
73
13
99
8F
YM
+ V
C (
1:1)
fb P
anch
agvy
a
FY
M fb
BD
fb P
anch
agvy
a5
35
27
13
79
39
58
37
21
39
98
Con
trol
35
82
48
26
42
90
55
61
88
68
Con
trol
with
Pan
chag
avya
36
22
48
26
52
92
57
60
91
69
Mea
n4
80
26
53
46
74
70
12
3
Cau
liflo
wer
-pea
-R
ock
phos
phat
e4
36
27
73
48
35
47
78
11
43
10
0ca
ulifl
ower
enric
hed
FY
M +
VC
(1:
1)
FY
M fb
BD
43
62
71
34
03
49
74
77
14
09
7
Roc
k ph
osph
ate
enri
ched
43
12
74
34
13
49
75
72
13
89
5F
YM
+ V
C (
1:1)
fbP
anch
agvy
a
FY
M fb
BD
fb P
anch
agvy
a4
30
27
53
36
34
77
37
31
38
95
Con
trol
35
02
45
22
62
74
45
60
83
63
Con
trol
with
Pan
chag
avya
35
22
49
22
82
76
48
62
85
65
Mea
n4
06
26
53
03
65
71
12
1
CD
(P
=0.
05)
SE
m±
CD
SE
m±
CD
SE
m±
CD
SE
m±
CD
SE
m±
CD
SE
m±
CD
Cro
pp
ing
0.25
1.10
0.43
NS
1.23
5.41
0.19
0.81
0.55
NS
0.28
1.20
Sou
rce
1.41
2.93
1.83
3.82
2.48
5.12
1.22
2.54
1.10
2.30
2.68
5.60
Cro
ppin
g X
Sou
rce
1.99
4.14
2.59
NS
3.51
7.32
1.72
NS
1.56
NS
3.80
NS
Sou
rce
X C
ropp
ing
1.83
4.00
2.40
NS
3.44
8.20
1.58
NS
1.53
NS
3.48
NS

Network Project on Organic Farming
Annual Report 2012-13 83
Pan
tnag
ar
Bas
mat
i ri
ce–c
hick
pea–
FY
M+
VC
+N
C+
EC
(1/
4+1/
4+1/
4+1/
4)32
.85.
88se
sban
ia (
gree
n m
anur
e)
Bio
dyna
mic
(B
D)
30.1
4.87
FY
M+
VC
+N
C+
EC
(1/
4+1/
4+1/
4+1/
4)+
Pan
chga
vya
32.6
5.09
FY
M+
VC
+N
C+
EC
1/4
+1/
4+1/
4+1/
4)+
BD
34.0
5.28
FY
M+
VC
+N
C+
EC
(1/
4+1/
4+1/
4+1/
4)+
BD
+ P
anch
gavy
a32
.44.
95
T6=
Con
trol
29.4
4.45
Mea
n31
.95.
09
Bas
mat
i ric
e –
FY
M+
VC
+N
C+
EC
(1/
4+1/
4+1/
4+1/
4)32
.17.
57ve
geta
ble
pea
–m
aiz
e+
mo
on
g(m
oo
ng
re
sid
ue
sin
corp
orat
ion)
Bio
dyna
mic
(B
D)
33.4
4.53
FY
M+
VC
+N
C+
EC
(1/
4+1/
4+1/
4+1/
4)+
Pan
chga
vya
32.8
5.43
FY
M+
VC
+N
C+
EC
1/4
+1/
4+1/
4+1/
4)+
BD
36.5
5.44
FY
M+
VC
+N
C+
EC
(1/
4+1/
4+1/
4+1/
4)+
BD
+ P
anch
gavy
a34
.35.
30
T6=
Con
trol
32.6
5.29
Mea
n33
.65.
59
SE
m±
CD
SE
m±
CD
Cro
pp
ing
0.40
2.44
0.01
0.04
Sou
rce
0.56
1.67
0.10
0.31
Cro
ppin
g X
Sou
rce
0.80
NS
0.15
0.43
Sou
rce
X C
ropp
ing
0.83
NS
0.13
0.40
Cro
pp
ing
sys
tem
sS
ou
rce
of
nu
trie
nt
FeM
n
Kh
arif
Rab
iS
um
mer
Kh
arif
Rab
iS
um
mer

Network Project on Organic Farming
Annual Report 2012-1384
Tab
le 1
8. I
nfl
uen
ce o
f so
urc
e o
f n
utr
ien
ts o
n Z
n &
Cu
up
take
of
dif
fere
nt
cro
ps a
t va
rio
us
loca
tio
ns
Cro
pp
ing
sys
tem
sS
ou
rce
of
nu
trie
nt
FeM
n
Kh
arif
Rab
iS
um
mer
Mea
nK
har
ifR
abi
Su
mm
erM
ean
Baj
aura
Cor
iand
er-p
ea-t
omat
oR
ock
phos
phat
e en
rich
ed32
.937
.073
.747
.929
.825
.444
.733
.3F
YM
+ V
C (
1:1)
FY
M fb
BD
31.6
31.7
71.3
44.9
25.2
23.4
38.0
28.9
Roc
k ph
osph
ate
enri
ched
32.8
32.8
67.0
44.2
24.9
24.0
42.3
30.4
FY
M +
VC
(1:
1) fb
Pan
chag
vya
FY
M fb
BD
fb P
anch
agvy
a29
.432
.469
.743
.823
.323
.938
.028
.4
Con
trol
17.4
24.9
43.0
28.4
14.4
15.7
29.0
19.7
Con
trol
with
Pan
chag
avya
17.2
21.0
46.3
28.2
13.9
14.6
29.7
19.4
Mea
n26
.930
.061
.821
.921
.237
.0
Cau
liflo
wer
-pea
-R
ock
phos
phat
e en
rich
ed35
.041
.377
.051
.131
.929
.944
.335
.4ca
ulifl
ower
FY
M +
VC
(1:
1)
FY
M fb
BD
31.0
37.2
73.7
47.3
26.5
24.5
38.0
29.7
Roc
k ph
osph
ate
enri
ched
33.2
36.5
73.0
47.6
26.2
26.7
41.7
31.5
FY
M +
VC
(1:
1) fb
Pan
chag
vya
FY
M fb
BD
fb P
anch
agvy
a28
.634
.073
.045
.223
.424
.739
.329
.1
Con
trol
15.8
23.8
43.7
27.8
13.1
19.1
27.0
19.7
Con
trol
with
Pan
chag
avya
16.9
22.2
47.7
28.9
13.6
18.2
28.7
20.2
Mea
n26
.832
.564
.722
.523
.936
.5
CD
(P
=0.
05)
SE
m±
CD
SE
m±
CD
SE
m±
CD
SE
m±
CD
SE
m±
CD
SE
m±
CD
Cro
pp
ing
0.42
NS
0.41
1.76
0.63
2.71
0.12
0.50
0.30
1.28
0.70
NS
Sou
rce
1.18
2.47
1.63
3.40
1.58
3.29
1.11
2.32
0.71
1.47
1.39
2.90
Cro
ppin
g X
Sou
rce
1.67
NS
2.30
NS
2.23
NS
1.57
NS
0.10
NS
1.97
NS
Sou
rce
X C
ropp
ing
1.58
NS
2.14
NS
2.13
NS
1.44
NS
0.96
NS
1.92
NS
Pan
tnag
ar
Bas
mat
i ric
e –
FY
M+V
C+N
C+E
C0.
711.
12ch
ickp
ea –
ses
bani
a(1
/4+
1/4+
1/4+
1/4)
(gre
en m
anur
e)

Network Project on Organic Farming
Annual Report 2012-13 85
Bio
dyna
mic
(B
D)
0.72
0.88
FY
M+V
C+N
C+E
C0.
791.
14(1
/4+
1/4+
1/4+
1/4)
+P
anch
gavy
a
FY
M+V
C+N
C+E
C0.
901.
071/
4+1/
4+1/
4+1/
4)+
BD
FY
M+V
C+N
C+E
C0.
831.
02(1
/4+
1/4+
1/4+
1/4)
+B
D+
Pan
chga
vya
T6=
Con
trol
0.77
1.04
Mea
n0.
791.
05
Bas
mat
i ric
e –
FY
M+V
C+N
C+E
C1.
150.
89ve
geta
ble
pea
–(1
/4+
1/4+
1/4+
1/4)
mai
ze+
moo
ng(m
oo
ng
re
sid
ue
sin
corp
orat
ion)
Bio
dyna
mic
(B
D)
0.81
0.71
FY
M+V
C+N
C+E
C0.
910.
81(1
/4+
1/4+
1/4+
1/4)
+P
anch
gavy
a
FY
M+V
C+N
C+E
C0.
870.
691/
4+1/
4+1/
4+1/
4)+
BD
FY
M+V
C+N
C+E
C0.
971.
00(1
/4+
1/4+
1/4+
1/4)
+B
D+
Pan
chga
vya
T6=
Con
trol
0.67
0.83
Mea
n0.
900.
82
CD
(P
=0.
05)
SE
m±
CD
SE
m±
CD
Cro
pp
ing
0.03
0.18
0.01
60.
097
Sou
rce
0.03
0.07
0.02
00.
060
Cro
ppin
g X
Sou
rce
0.04
0.11
0.02
90.
085
Sou
rce
X C
ropp
ing
0.04
0.19
0.03
10.
117
Cro
pp
ing
sys
tem
sS
ou
rce
of
nu
trie
nt
FeM
n
Kh
arif
Rab
iS
um
mer
Kh
arif
Rab
iS
um
mer

Network Project on Organic Farming
Annual Report 2012-1386
Quality parameters (Table 19)
Protein content of ground nut, maize and chilli was estimated for all the crops in kharif at Dharwad.Significant variation among different organic input packages and cropping system was observed. Proteincontent was found to be higher with EC+VC+GLM with panchagavya spray in ground nut (21.8%) andmaize (13.1%) while in chilli, FYM+VC+GLM performed better (9.27%). The increase in protein was 74.4%in the groundnut and 24.8 in maize over control.
Table 19. Influence of source of nutrients on quality parameters of different crops at Dharwad in kharif
Cropping systems Source of nutrients Protein
Groundnut-sorghum EC+VC+GLM 19.1
Panchagavya spray 18.1
EC+VC+GLM + Panchagavya spray 21.8
EC+VC+GLM+ Biodynamic spray @5g/ac 18.3
EC+VC+GLM+ Biodynamic spray @5g/ac+ Panchagavya spray 14.4
FYM+VC+GLM 19.1
Control 12.5
Maize-chickpea EC+VC+GLM 10.9
Panchagavya spray 10.2
EC+VC+GLM + Panchagavya spray 13.1
EC+VC+GLM+ Biodynamic spray @5g/ac 8.20
EC+VC+GLM+ Biodynamic spray @5g/ac+ Panchagavya spray 9.00
FYM+VC+GLM 11.6
Control 10.5
Chilli+onion EC+VC+GLM 8.47
Panchagavya spray 8.43
EC+VC+GLM + Panchagavya spray 8.83
EC+VC+GLM+ Biodynamic spray @5g/ac 7.23
EC+VC+GLM+ Biodynamic spray @5g/ac+ Panchagavya spray 7.33
FYM+VC+GLM 9.27
Control 9.23
CD (P=0.05) SEm± CD
Cropping 0.62 1.73
Source 0.70 1.43
Cropping X Source 1.22 2.47
Source X Cropping 1.29 2.84

Network Project on Organic Farming
Annual Report 2012-13 87
Economics of nutrient sources and cropping systems (Table 20)
Bajaura: Application of rock phosphate enriched FYM + vermicompost @ 1:1 ratio to coriander-tomato-pea system recorded higher gross returns of Rs. 2,02,304 ha-1 which is 294% higher than control(panchagavya alone). Net returns (Rs. 1,28,235 ha-1) and B: C ratio (1.73) was also higher in the sametreatment thought cost of cultivation was 96% higher compared to panchagavya alone. Application ofFYM followed by biodynamic spray in cauliflower-pea-cauliflower system recorded higher net returns(Rs. 1,95,117 ha-1) and B: C ratio (2.71). Among the cropping system around 160% increase in net returnsand 61% increase in B:C ratio of cauliflower-pea-cauliflower was observed over tomato-coriander-peasystem.
Coimbatore: Application of FYM+ NEOC @ ½ N each with panchagavya to cotton-maize-green manureand chilli-sunflower-green manure recorded higher net returns (Rs. 45,421 ha-1 and Rs. 44,917 ha-1 inboth the systems respectively) though this treatment recorded 6.2% higher cost than FYM + NEOC@½ N each alone. Among the two systems, chilli-sunflower-green manure recorded 7.6% higher net returnsthan other systems. Application of panchagavya package alone recorded lower net returns among allthe treatments.
Dharwad: Application of EC + VC+ GLM + biodynamic spray @ 12 g ha-1+ panchagavya spray resultedin higher gross and net returns with B:C ratio due to lower cost of cultivation in groundnut-sorghum,maize-chickpea and chilli +onion system. The increase in net returns over control was found to be 56and 76% in groundnut-sorghum and maize-chickpea systems respectively due to combined applicationof panchagavya and biodynamic spray along with other organic inputs such as EC, VC and GLM. Amongthe three cropping systems, groundnut-sorghum registered 130 and 70.5% higher net returns over maize-chickpea and chilli+ onion systems.
Jabalpur: Among the various sources of nutrients, application of VC+ FYM+ NEOF @ 1/3 N each +panchagavya was found to give higher net returns (Rs. 95,678 and 85,008 ha-1) and B: C ratio (2.42 and2.25) in basmati rice-wheat-green manure and basmati rice-berseem systems. Though, marginal increasein cost of cultivation due to panchagavya was observed in this treatment, due to increase in yield netreturns and B: C ratio was better. Additional cost of Rs. 1493 ha-1 is required for panchagavya. Amongthe two systems, basmati rice-berseem recorded higher net returns (Rs. 74892 ha-1). The net returnsand B: C ratio was lower in application of panchagavya or biodynamic packages alone to both thesystems.
Lady bird beetles in organic wheat at Ludhiana
Ludhiana: Application of green manure to basmatirice and FYM to other crops in the maize-wheat+gram-summer moong and basmati-wheat-green manure system was found to be better interms of gross returns, net returns and B: C ratiocompared to application of panchagavya andbiodynamic packages along with green manure andFYM. The increase in net returns was found to be8.1 and 2.4% over control in these systemsrespectively. Although gross returns of basmati rice-wheat-green manure system was higher in GM +PG+BD for basmati rice and FYM +PG +BD for othercrops, it was closely followed by GM+ FYM+biodynamic combination. Among the systems, basmati rice-wheat-green manure recorded 7.5 and 21.3%higher net returns and B: C ratio than maize-wheat+ gram-summer moong.
Pantnagar: Application of biodynamic package and panchagavya along with FYM +VC +NC +EC @ ¼N each registered 11.0 and 12.0% higher gross returns in basmati rice-chickpea-sesbania (green

Network Project on Organic Farming
Annual Report 2012-1388
Table 20. Influence of source of nutrients on economics of different cropping systems
Cropping system Source of nutrient Gross Cost of Net B:Creturns cultivation returns ratio
(Rs ha–1) (Rs ha–1) (Rs ha–1)
Bajaura
Coriander-pea-tomato Rock phosphate enriched 202304 74069 128235 1.73FYM + VC (1:1)
FYM fb BD 179793 71421 108371 1.52
Rock phosphate enriched 192902 80772 112129 1.39FYM + VC (1:1) fb Panchagvya
FYM fb BD fb Panchagvya 179646 78124 101522 1.30
Control 43065 31075 11990 0.39
Control with Panchagavya 51343 37778 13565 0.36
Mean 141509 62207 79302 1.12
Cauliflower-pea- Rock phosphate enriched 258854 76699 182156 2.37cauliflower FYM + VC (1:1)
FYM fb BD 267063 71946 195117 2.71
Rock phosphate enriched 246354 83402 162953 1.95FYM + VC (1:1) fb Panchagvya
FYM fb BD fb Panchagvya 244638 78649 165989 2.11
Control 49346 27825 21521 0.77
Control with Panchagavya 64563 34528 30035 0.87
Mean 188470 62175 126295 1.80
Coimbatore
Cotton-maize- FYM + NEOC (1/2+1/2) 95562 50451 45111 0.89green manure
Panchagavya alone 63006 35478 27528 0.78
FYM+NEOC*(1/2+1/2)+ 99299 53878 45421 0.84Panchagavya
Biodynamic Practices 70165 38628 31537 0.82
BiodynamicPractices+ 77390 40653 36737 0.90Panchagavya
Mean 81084 43818 37267 0.85
Chillies-sunflower- FYM + NEOC (1/2+1/2) 95532 51322 44210 0.86green manure
Panchagavya alone 76074 40425 35649 0.88
FYM+NEOC*(1/2+1/2)+ 99162 54245 44917 0.83Panchagavya
Biodynamic Practices 76860 40696 36164 0.89
BiodynamicPractices+ 85578 45658 39920 0.87Panchagavya
Mean 86641 46469 40172 0.87

Network Project on Organic Farming
Annual Report 2012-13 89
Cropping system Source of nutrient Gross Cost of Net B:Creturns cultivation returns ratio
(Rs ha–1) (Rs ha–1) (Rs ha–1)
Dharwad
Groundnut-sorghum EC+VC+GLM 150394 29777 120617 4.05
Panchagavya spray 122670 28706 93964 3.27
EC+VC+GLM + Panchagavya 162696 31315 131381 4.20spray
EC+VC+GLM+ Biodynamic 156862 27620 129242 4.68spray @5g/ac
EC+VC+GLM+ Biodynamic 172973 28606 144367 5.05spray @5g/ac+ Panchagavyaspray
FYM+VC+GLM 147665 30088 117578 3.91
Control 117386 24818 92568 3.73
Mean 147235 28704 118531 4.13
Maize-chickpea EC+VC+GLM 84558 31625 52933 1.67
Panchagavya spray 74469 28375 46094 1.62
EC+VC+GLM + 90290 33430 56860 1.70Panchagavya spray
EC+VC+GLM+ 85753 28498 57255 2.01Biodynamic spray @5g/ac
EC+VC+GLM+ Biodynamic 92771 29400 63371 2.16spray @5g/ac+ Panchagavyaspray
FYM+VC+GLM 79425 32028 47398 1.48
Control 62307 26244 36063 1.37
Mean 81368 29943 51425 1.72
Chilli+onion EC+VC+GLM 98749 20838 77912 3.74
Panchagavya spray 69255 20724 48531 2.34
EC+VC+GLM + 107296 20848 86448 4.15Panchagavya spray
EC+VC+GLM+ 106936 20116 86820 4.32Biodynamic spray @5g/ac
EC+VC+GLM+ Biodynamic 108336 20836 87500 4.20spray @5g/ac+ Panchagavyaspray
FYM+VC+GLM 88315 22237 66077 2.97
Control 48504 15286 33218 2.17
Mean 89627 20126 69501 3.41
Jabalpur
Basmati rice- VC+FYM+NEOF @1/3 N 155265 65096 90169 1.39D. wheat-green eachmanure

Network Project on Organic Farming
Annual Report 2012-1390
Panchgavya alone 124400 62584 61816 0.99
VC+FYM+NEOF@1/3N 162875 67197 95678 1.42each +Panchgavya
Biodynamic practices 117775 61685 56090 0.91
Biodynamic practices + 134280 63995 70285 1.10Panchgavya
Mean 138919 64111 74808 1.16
Basmati rice- VC+FYM+NEOF @1/3 N 148565 66734 81831 1.23berseem each
Panchgavya alone 132407 63636 68771 1.08
VC+FYM+NEOF @1/3 N 153235 68227 85008 1.25each +Panchgavya
Biodynamic practices 127702 62719 64983 1.04
Biodynamic practices + 138200 64332 73868 1.15Panchgavya
Mean 140022 65130 74892 1.15
Ludhiana
Maize-wheat+ Basmati rice Other cropsgram-summer moong
GM FYM 177730 63400 114330 1.80
GM+PG FYM+PG 172817 66525 106292 1.60
GM+BD BD 120188 59270 60918 1.03
GM+BD+FYM FYM+BD 175415 66400 109015 1.64
GM+PG+BD FYM+PG+BD 175260 69525 105735 1.52
Control Control 68883 56270 12613 0.22
Mean 148382 63565 84817 1.30
Basmati rice-wheat- GM FYM 156603 46975 109628 2.33green manure
GM+PG FYM+PG 156825 52375 104450 1.99
GM+BD BD 129513 52875 76638 1.45
GM+BD+FYM FYM+BD 157593 53412 104181 1.95
GM+PG+BD FYM+PG+BD 159532 52475 107057 2.04
Control Control 89285 44075 45210 1.03
Mean 141559 50365 91194 1.80
Pantnagar
Basmati rice- FYM+VC+NC+EC 236369 53652 182717 3.40Chickpea-Sesbania (1/4+1/4+1/4+1/4)(green manure)
Biodynamic (BD) 178067 53415 124652 2.34
Cropping system Source of nutrient Gross Cost of Net B:Creturns cultivation returns ratio
(Rs ha–1) (Rs ha–1) (Rs ha–1)

Network Project on Organic Farming
Annual Report 2012-13 91
FYM+VC+NC+EC 251278 54142 197136 3.64(1/4+1/4+1/4+1/4)+Panchgavya
FYM+VC+NC+EC 239000 54152 184848 3.411/4+1/4+1/4+1/4)+BD
FYM+VC+NC+EC (1/4+1/4+ 262076 54152 207924 3.841/4+1/4)+BD+Panchgavya
T6=Control 174821 48161 126660 2.63
Mean 223602 52946 170656 3.21
Basmati rice- FYM+VC+NC+EC 186732 82653 104079 1.26vegetable pea- (1/4+1/4+1/4+1/4)maize+moong(moong residuesincorporation)
Biodynamic (BD) 96543 80901 15642 0.19
FYM+VC+NC+EC (1/4+1/4+ 193243 81887 111356 1.361/4+1/4)+Panchgavya
FYM+VC+NC+EC 183304 82590 100714 1.221/4+1/4+1/4+1/4)+BD
FYM+VC+NC+EC 209055 83728 125327 1.50(1/4+1/4+1/4+1/4)+BD+Panchgavya
T6=Control 97810 71307 26503 0.37
Mean 161114 80511 80603 0.98
Ranchi
Rice-wheat 50% VC+50% KC 110695 55939 54756 0.98
BD Preparation (CPP, 62988 28923 34065 1.18BD500 & 501)
VC + K.C+Panchagavaya 115654 58139 57515 0.99
VC + K.C+ BD Prepartion 120757 58539 62218 1.06
VC + K.C+ BD Prepartion + 126968 62539 64429 1.03Panchagavya
Mean 107412 52816 54597 1.05
Rice-potato 50% VC+50% KC 195933 84236 111697 1.33
BD Preparation (CPP, 93517 53918 39598 0.73BD500 & 501)
VC + K.C+Panchagavaya 199025 88236 110789 1.26
VC + K.C+ BD Prepartion 202592 86836 115755 1.33
VC + K.C+ BD Prepartion + 207742 90836 116905 1.29Panchagavya
Mean 179762 80812 98949 1.19
Cropping system Source of nutrient Gross Cost of Net B:Creturns cultivation returns ratio
(Rs ha–1) (Rs ha–1) (Rs ha–1)

Network Project on Organic Farming
Annual Report 2012-1392
manure) and basmati rice-vegetable pea-maize+moong (residues in corporation ) systems respectivelycompared to FYM +VC +NC +EC alone. In the first system, B:C ratio was higher (3.84) in FYM +VC+NC +EC @ ¼ N each+biodynamic package and panchagavya spray owing to higher gross return (Rs.2,62,076 ha-1) but lower cost of cultivation (Rs. 54152 ha-1) which was closely followed in biodynamicspray alone with FYM+VC+NC+EC@1/4 N each (Rs. 2,39,000 ha-1 54152 ha-1 and 3.41 of gross return,cost of cultivation and B:C ratio respectively). However, in the later system, FYM +VC +NC +EC eitherwith panchagavya alone or panchagavya + biodynamic package recorded the higher B: C ratio (2.36and 2.50) compared to control and biodynamic package alone. Basmati rice-chickpea-sesbania (greenmanure) was found to be better by 39, 112 and 62% in terms of gross, net returns and B: C ratiorespectively compared to basmati rice-vegetable pea-maize + moong (moong residues incorporation).
Ranchi: The gross and net returns (Rs. 1,26,968 and 64,429 ha-1 respectively) were higher with VC+KC + BD preparation + panchagavya in rice-wheat system. However, higher B: C ratio of 1.34 wasrecorded with BD preparation (CPP, BD 500 &501) alone owing to its lower cost of cultivation (Rs. 28923ha-1). In rice-potato system, though VC + KC +BD preparation + panchagavya recorded higher grossreturns of Rs 2,07,742 ha-1 net returns and B: C ratio was better in VC + KC +BD preparation (Rs.1,16,905 ha-1 and 1.48 respectively) even though cost of cultivation was lower in application of BDpreparation alone. Among the systems, rice-potato recorded 67.4, 81 and 26% higher gross, net returnsand B: C ratio, though cost of cultivation was 53% more compared to rice-wheat system.

Network Project on Organic Farming
Annual Report 2012-13 93
7.3 Evaluation of Pest and disease management packagefor organic farming
Title of the experiment: Pest and disease management in cropping system under organic farming.
Objective: To study the effect of organic and integrated pest management strategies on pest population,natural enemy complex, microbial population, yield and economics.
Year of start: Varied from centre to centre. Experiment was started in 2004-05 at Coimbatore, Raipur,Karjat, Ludhiana and Bajaura, 2005-06 at Jabalpur, Calicut and Dharwad and in 2007-08 at Modipuramand Umiam.
Treatments: There are no common treatments for all the centres, but they varied from location tolocation. The number of cropping system tested varied from 1 to 2. The details of treatments are givenin Table 21-25 along with experimental results. The first summer ploughing and green manures wereevaluated only at Modipuram. The centre wise data on yield, pest and disease infestation, soil propertiesand economics are presented in table 21-25 and results are given below.
Results
Bajaura (Table 22, 24 and 25)
Cauliflower-pea-tomato system was tested under different pest and disease managementpackages involving leaf extracts, natural products and bio control agents like Bacillus thuringiensis underdifferent combinations. Infestation of pest and diseases like fruit borer, fruit rot and other factors wereassessed in tomato apart from recording yield loss due to these factors in different treatments. Yield ofall the crops in the system have also been recorded. Infestation of fruit borer and fruit rot in tomato waslower in application of Lipel (Bacillus thuringiensis sub sp. kurstaki) @ 1 kg ha-1. Incidence of other factors(pests and diseases) was lower in Metarhizium anisopliae @ 2g per litre of water + Tween -80 (0.05%)as emulsifier applied. The same trend was observed in yield loss in tomato also. Lower yield loss dueto fruit borer was observed with application of Lipel (Bacillus thuringiensis sub sp. kurstaki) @ 1.0 kg ha-
1 (1.63%). The yield loss due to fruit rot ranged from 21.9 to 28.7% in various treatments and no significantvariation was observed among the different treatments. Lower yield loss of 15.8% was observed withother pest and diseases factors under Metarhizium anisopliae @ 2g per litre of water+Tween -80 (0.05%)as emulsifier. Though fruit borer and fruit rot of tomato was lower with Lipel (Bacillus thuringiensis subsp. kurstaki) @ 1 kg ha-1, yield loss due to other factors of pest and diseases was more (18.2%) as aconsequence of higher incidence (16%) of other pest & disease. Significant difference in yield of peawas observed among the different treatments as the yield difference between best performing treatmentMargersom (Azedarachtin 1%) @ 1 ml/l 8944 kg ha-1) and least performing treatment of Lipel (Bacillusthuringiensis sub sp. kurstaki) @ 1 kg/ha in Kharif, and Darek (M. azedarach (2.5% ALE) + Karvi (Royleacinerea) @ 2.5% ALE + cow urine (3%) (7641 kg ha-1) in rabi was only 1303 kg ha-1. Compared to control,higher tomato yield of 10597 kg ha-1 was realized with application of Lipel (Bacillus thuringiensis sub sp.kurstaki) @ 1 kg/ha in Kharif and Darek (M. azedarach (2.5% ALE) + karvi (Roylea cinerea) @ 2.5%ALE + cow urine (3%) as this particular treatment recorded lower incidence of all (fruit borer: 1.63%,other factors 18.2%) and yield loss due to fruit borer, fruit rot and other factors were also less. Bhang(Cannabis sativa) 10% ALE+cow urine (3%)+Tween -80 (0.05%) as emulsifier in kharif and kaner (Neriumsp.) (5%)+ cow urine (3%) in rabi also recorded better tomato yield of 10448 kg ha-1 compared to othercombinations of pest and diseases management packages. Higher gross return of Rs. 1,67,700 ha-1
was recorded with application of margosom (Azodarachtin 1%) @ 1 ml/l during rabi which is 28.4 higherthan gross returns obtained from absolute control. Performance of mixture of derisom (2% EC) @ 2 ml/l and Ha NPV (Helicide) @ 0.5ml/l during khrif and Darek (Meliaazedarach) @ 5% ASE + cow urine

Network Project on Organic Farming
Annual Report 2012-1394
(3%) was also found to better as it also recorded increase in gross returns to the tune of 22% overuntreated check (control).
Experimental crop of Turmeric at Calicut
Calicut (Table 22 and 24)
Rhizome rot infestation in ginger and yield ofginger and turmeric were recorded with sixtreatments comprising of IISR 6, 8, 13, 51, 151 andPb21+P1AR6 cultures, ginger endophytic bacteria andrhizobacteria combinations were tested along withabsolute control. Rhizome rot infestation in gingerwas lower with ginger endophytic bacteria (GEB) 18and IISR 6, 51,853, Pb21 and P1AR6 cultures andginger rhizobacteria (GRB 58) compared to absolutecontrol.
The reduction in infestation was observed to be 68.2, 64.6 and 59.2% respectively. Significantly higherrhizome yield of ginger and turmeric was observed with ginger endophytic bacteria GEB 17 (7250 and 8150kg ha-1 respectively) which was at par with GRB 58 application in ginger. Owing to higher infestation ofrhizome rot in ginger with GRB 57 application, lower yield of 3200 kg ha-1 was recorded which is 24% lowerthan absolute control. However, in turmeric absolute control recorded the lower yield (4600 kg ha-1).
Modipuram (Table 21, 24 25)
Four management packages viz., summer ploughing treated and untreated, green manure treated anduntreated were evaluated in basmati rice-chickpea and basmati rice-mustard systems. The results revealthat summer ploughing and green manure treated plots recorded higher grain yield of basmati rice (3450and 3860 kg ha-1respectively) chick pea (963 and 1297 kg ha-1 ) and mustard (772 and 977 kg ha-1)compared to untreated plots of summers ploughing and green manure. Net returns of basmati rice-chickpea system was higher in green manure untreated (Rs. 53,117 ha-1) followed by summer ploughingtreated (Rs. 52,607 ha-1). The green manure treated plots recorded lower net returns in both systems.
In the second set of treatments, six treatments comprising of organic inputs such as FYM,vermicompost along with biodynamic preparation and panchagavya spray was evaluated besides controlin basmati rice-wheat and maize+ cowpea-wheat +mustard system. The results reveals that applicationof FYM+vermicompost with biodynamic preparation and panchagavya recorded higher increase of (21%)yield in basmati rice over control followed by addition of BD preparation with FYM and vermicompost(20%). In the maize+ cowpea-wheat +mustard system application of BD preparation+ FYM+Vermicompost +panchagavya recorded 12 and 15% increase in yield of maize and wheat respectivelyover FYM +Vermicompost alone indicating the usefulness of biodynamic and panchagavya preparations.Straw yield of all the crops have also followed the similar trend. Economics analysis of various treatmentsindicates FYM + vermicompost + biodynamic preparation + panchagavya and FYM+vermicompost+biodynamic preparation recorded net return of Rs 1,56,801 and 1,53,214 ha- 1 respectivelyin basmati rice-wheat system, however, higher net return and B:C ratio was observed with BD preparationalone. In maize+ cowpea-wheat +mustard system, application of BD preparation alone orFYM+vermicompost+ BD recorded higher net returns (Rs 98,639 and 88,529 ha-1 respectively) even thoughFYM+ Vermicompost + BD + Panchagavya combination recorded higher gross returns (Rs. 1,61853 ha-
1) excluding the control. The cost of cultivation was higher under this combination (Rs. 71,900 ha-1)compared to BD alone (Rs. 29,050 ha-1) and control (Rs. 25,050 ha-1).
Umiam (Table 23 and 24)
Various pest and disease management packages were studied in maize+ soybean-tomato systemand observations on incidence of monolepta, mylloceros, epilechna, leaf folder and soybean rust was

Network Project on Organic Farming
Annual Report 2012-13 95
Table 22. Influence of pest and disease management practices under organic farming on disease infestation andyield loss
Treatments Infestation (%) Yield loss (%)
Fruit Fruit Other Fruit Fruit Otherborer rot factors borer rot factors
Bajaura (Tomato)
Mixture of Derisom (2% EC) @ 2ml/l 3.39 30.4 17.7 2.98 28.7 20.5and Ha NPV (Helicide) @ 0.5 ml/l
Bhang (Cannabis sativa)10% ALE + 2.42 24.1 17.4 2.38 23.3 19.1Cow urine (3%)+ tween -80 (0.05%)as emulsifier
Karvi (Roylea cinerea) @ 10% ALE + 2.57 26.7 16.9 2.74 25.7 16.8Cow Urine (3%)+ tween -80 (0.05%)as emulsifier
Metarhizium anisopliae @ 2g/l of 2.64 25.2 16.0 2.24 23.7 15.8water + tween -80 (0.05%) as emulsifier
Nomurea rileyi (Nolep) @ 2 g/l of 4.29 25.4 20.1 3.83 26.2 19.2water + tween -80 (0.05%) as emulsifier
Margosom (Azedarachtin 1.0% EC) @ 1ml/l 2.03 27.2 17.1 1.65 24.0 17.8
Lipel (Bacillus thuringiensis sub sp. 1.97 23.4 18.3 1.63 21.9 18.2kurstaki) @ 1 kg ha-1
Control ( untreated check) 13.9 25.4 17.7 13.7 24.5 19.3
Calicut (Ginger) Rhizome rot in ginger
Absolute control 42.4
IISR 6, 8, 13, 51, 151 and Pb21+P1AR6 15.0
Ginger endophyticbacteria(GEB) 17 28.5
Ginger endophyticbacteria(GEB) 18 13.5
Ginger rhizobacteria(GRB) 57 26.8
Ginger rhizobacteria(GRB) 58 17.3
Table 21. Influence of pest and disease management practices under organic farming on grain and straw yield(kg ha-1) at Modipuram
Cropping system Pest and disease management Grain Yield Straw Yield Net returns
Kharif Rabi Kharif Rabi (Rs. ha-1)
Basmati rice -mustard Summer ploughing-untreated 3390 646 4680 2367 35209
Summer ploughing-treated 3420 772 4923 3057 35982
Green manure-treated 3640 977 5460 3393 32534
Green manure-untreated 3570 764 5220 2840 36956
Basmati rice- chick pea Summer ploughing-untreated 3330 767 4780 2973 46206
Summer ploughing-treated 3450 963 5180 3517 52607
Green manure-treated 3860 1297 5560 3823 43995
Green manure-untreated 3620 937 5480 3413 53117

Network Project on Organic Farming
Annual Report 2012-1396
Tab
le 2
3. I
nfl
uen
ce o
f p
est
and
dis
ease
man
agem
ent
pra
ctic
es u
nd
er o
rgan
ic f
arm
ing
on
in
sect
an
d d
isea
se i
nfe
stat
ion
(%
) in
Mai
ze +
so
ybea
n-t
om
ato
syst
em a
t U
mia
m
Trea
tmen
tK
har
if (
Mai
ze +
so
ybea
n)
Rab
i (T
om
ato
)
Ear
ly s
tag
eL
ate
stag
e
Mo
no
lep
tam
yllo
cero
sep
ilech
na
leaf
Mo
no
lep
tam
yllo
cero
sep
ilech
na
leaf
Turs
icu
mS
oyb
ean
Fru
it%
Ear
lyfo
lder
fold
erla
te b
ligh
tru
st %
bo
rer
dam
age
blig
ht
Con
trol
0.70
2.27
0.47
0.47
0.20
0.47
0.13
0.67
56.3
37.1
1.47
15.9
47.6
Nee
m o
il @
3ml/l
0.47
2.33
0.23
0.47
0.17
0.33
0.13
0.33
42.0
32.2
1.41
12.9
34.3
Ano
nin
3 m
l/l0.
472.
000.
270.
470.
330.
470.
170.
4752
.636
.11.
2513
.551
.1
Der
isom
@3m
l/l0.
601.
400.
270.
400.
270.
530.
100.
2754
.533
.41.
3013
.047
.8
Pan
chag
avya
3 %
0.40
1.40
0.33
0.47
0.20
0.47
0.13
0.47
40.3
32.1
1.33
11.4
32.5
Pan
chag
avya
. 3 %
+0.
401.
600.
200.
400.
170.
330.
130.
4042
.829
.71.
1310
.232
.3la
ntan
a 10
%+
V.w
ash
10 %
Tric
hode
rma
5g/l
0.47
2.00
0.33
0.60
0.13
0.47
0.13
0.40
51.1
35.0
1.27
12.9
47.8
Bot
anic
als
0.47
1.87
0.30
0.60
0.13
0.37
0.10
0.33
53.1
35.8
2.27
17.8
46.6
Der
isom
+pan
chga
baya
0.53
1.40
0.37
0.53
0.17
0.50
0.10
0.27
47.3
33.5
1.17
10.6
37.4
Der
isom
(3m
l/l)+
0.47
0.93
0.23
0.40
0.10
0.40
0.13
0.33
47.3
33.0
1.13
11.9
35.5
Pan
chag
avya
10
%+
cow
urin
e 3
%

Network Project on Organic Farming
Annual Report 2012-13 97
Tab
le 2
4. I
nfl
uen
ce o
f w
eed
, p
est
and
dis
ease
man
agem
ent
pra
ctic
es u
nd
er o
rgan
ic f
arm
ing
on
gra
in y
ield
& s
traw
yie
ld (
kg h
a-1)
Cro
pp
ing
sys
tem
Pes
t an
d d
isea
se m
anag
emen
t p
ract
ice
Yie
ldS
traw
yie
ld
Cro
p 1
Cro
p 2
Cro
p 3
Baj
aura
Cau
liflo
wer
- pe
as-
tom
ato
Kha
rif :
Mix
ture
of
Der
isom
(2%
EC
) @
2m
l/l a
nd H
a N
PV
85
01
91
41
(Hel
icid
e) @
0.5
ml/L
Rab
i: D
arek
(M
elia
aze
dara
ch)
@ 5
% A
SE
+ C
ow u
rine
(3.0
%)
Kha
rif:
Bha
ng (
Can
nabi
s sa
tiva)
10%
ALE
+ C
ow U
rine
(3%
)+8
28
51
04
48
Twee
n -8
0 (0
.05%
) as
em
ulsi
fier
, R
abi:
Kan
er (
Ner
ium
sp.
)(5
%)
+ C
ow u
rine
(3.0
%)
Kha
rif:
Kar
vi (
Roy
lea
cine
rea)
@ 1
0% A
LE +
Cow
Urin
e (3
%)+
82
03
93
48
twee
n -8
0 (0
.05%
) as
em
ulsi
fier
Rab
i: K
arvi
(R
oyle
a ci
nere
a)@
5%
+ C
ow u
rine
(3.0
%)
Kha
rif:
Met
arhi
zium
ani
sopl
iae
@ 2
g/l
of w
ater
+ t
wee
n -8
07
98
41
03
60
(0.0
5%)
as e
mul
sifie
r R
abi:
Dar
ek (
M.
azed
arac
h) (
5% A
LE)
+C
ow u
rine
(3%
)
Kha
rif:
Nom
urea
rile
yi (
Nol
ep)
@ 2
g/l
of w
ater
+ t
wee
n -8
07
88
81
00
72
(0.0
5%)
as e
mul
sifie
r R
abi:
Dar
ek (
M.
azed
arac
h) @
2.5
%A
SE
+ K
aner
(N
eriu
m s
p.)
@ 2
.5%
ALE
+ C
ow u
rine
(3%
)
Kha
rif:
Mar
goso
m (
Aze
dara
chtin
1%
EC
) @
1m
l/l R
abi:
Kar
vi7
68
29
52
7(R
oyle
a ci
nere
a) @
2.5
% A
LE +
Kan
er (
Ner
ium
sp.
)@
2.5
% A
LE +
Cow
urin
e (3
%)
Kha
rif:
Lipe
l (B
acill
us t
hurin
gien
sis
sub
sp.
kurs
taki
)7
64
11
05
97
@ 1
kg/
ha,
Rab
i: D
arek
(M
. az
edar
ach
(2.5
% A
LE)
+K
arvi
(R
oyle
a ci
nere
a) @
2.5
% A
LE +
Cow
urin
e (3
%)
Kha
rif:
Con
trol
( u
ntre
ated
che
ck),
Rab
i: M
argo
som
80
39
97
43
(Aze
dara
chtin
1%
) @
0.5
ml/
L
Rab
i: M
argo
som
(A
zeda
rach
tin 1
%)
@ 0
.75
ml/
l8
69
7
Rab
i: M
argo
som
(A
zeda
rach
tin 1
%)
@ 1
.0 m
l/ l
89
44
Rab
i: C
ontr
ol (
untr
eate
d ch
eck)
69
68
SE
m±
27
25
18
CD
(P
=0.
05)
80
1N
S
Cal
icu
t
Gin
ger
Abs
olut
e co
ntro
l4
20
0
IISR
6,
51,
853,
Pb2
1 an
d P
1AR
64
25
0
Gin
ger
endo
phyt
icba
cter
ia(G
EB
) 17
72
50

Network Project on Organic Farming
Annual Report 2012-1398
Gin
ger
endo
phyt
icba
cter
ia(G
EB
) 18
47
00
Gin
ger
rhiz
obac
teria
(GR
B)
573
20
0
Gin
ger
rhiz
obac
teria
(GR
B)
587
02
5
Tur
mer
icA
bsol
ute
cont
rol
46
00
IISR
6,
51,
853,
Pb2
1 an
d P
1AR
65
35
0
Gin
ger
endo
phyt
icba
cter
ia(G
EB
) 17
81
50
Gin
ger
endo
phyt
icba
cter
ia(G
EB
) 18
67
00
Gin
ger
rhiz
obac
teria
(GR
B)
575
30
0
Gin
ger
rhiz
obac
teria
(GR
B)
587
87
5
CD
(P
=0.
05)
SE
m±
CD
Cro
p2
72
86
5
Sou
rce
47
19
61
Cro
p x
sour
ce6
66
NS
Sou
rce
x cr
op6
66
NS
Kar
jat
Man
go y
ield
150
kg F
YM
+ 2
0 kg
Gly
ricid
ia l
eave
s as
a b
asal
dos
e tr
ee-1
33
80
Che
ck u
nit
300
kg F
YM
+ 2
0 kg
Gly
ricid
ia l
eave
s as
a b
asal
dos
e tr
ee-1
75
00
155
kg G
lyric
idia
lea
ves
tree
-14
40
0
290
kg G
lyric
idia
lea
ves
tree
-11
00
0
50 k
g V
erm
icom
post
+ 2
0 kg
Gly
ricid
ia l
eave
s as
a b
asal
69
20
dose
tre
e-1
100
kg V
erm
icom
post
+ 2
0 kg
Gly
ricid
ia l
eave
s as
a1
08
0ba
sal
dose
tre
e-1
Con
trol
18
80
SE
m±
62
4
CD
(P
=0.
05)
NS
Mo
dip
ura
m
Bas
mat
i ri
ce-w
heat
FY
M+
verm
i co
mpo
st3
96
03
94
37
04
06
25
7
BD
pre
para
tion
38
70
31
33
63
50
611
3
Cro
pp
ing
sys
tem
Pes
t an
d d
isea
se m
anag
emen
t p
ract
ice
Yie
ldS
traw
yie
ld
Cro
p 1
Cro
p 2
Cro
p 3

Network Project on Organic Farming
Annual Report 2012-13 99
FY
M+
verm
i co
mpo
st+
panc
hgav
ya4
24
04
08
76
66
06
48
0
FY
M+
verm
i co
mpo
st+
bd p
repa
ratio
n4
42
04
27
77
26
06
51
0
BD
pre
para
tion+
FY
M+
verm
icom
post
+ p
anch
gavy
a4
45
34
53
77
51
06
69
7
Con
trol
36
80
29
60
63
00
54
67
Mai
ze+
cow
pea-
whe
at+
FY
M+
verm
i co
mpo
st4
58
03
38
36
73
75
09
0m
ust
ard
BD
pre
para
tion
44
70
27
47
66
70
45
50
FY
M+
verm
i co
mpo
st+
panc
hgav
ya5
02
03
49
06
78
05
06
3
FY
M+
verm
i co
mpo
st+
BD
pre
para
tion
49
60
36
80
70
90
54
67
BD
pre
para
tion+
FY
M+
verm
icom
post
+ p
anch
gavy
a5
26
03
79
37
91
75
56
7
Con
trol
39
60
24
23
62
93
47
73
CD
(P
=0.
05)
SE
m±
CD
SE
m±
CD
SE
m±
CD
SE
m±
CD
CS
22.7
97.5
19
4N
S53
.4N
S16
.571
.0
Sou
rce
12
72
65
14
83
08
18
63
89
25
35
27
CS
x s
ourc
e1
80
NS
20
9N
S2
64
NS
35
7N
S
Sou
rce
x C
s1
66
NS
27
2N
S2
47
NS
32
6N
S
Um
iam
Mai
zeS
oybe
anTo
ma
to
Mai
ze+
soyb
ean-
tom
ato
Con
trol
33
50
65
67
16
07
0
Nee
m o
il @
3ml/l
36
57
72
07
17
41
2
Ano
nin
3 m
l/l3
47
57
33
71
77
03
De
riso
m@
3m
l/l3
55
57
24
01
72
30
Pan
chag
avya
3 %
33
05
75
83
17
19
0
Pan
chag
avya
3 %
+la
ntan
a 10
%+
V.w
ash
10 %
36
80
79
72
18
33
8
Tric
hode
rma
5g/l
31
45
69
40
17
52
7
Bo
tan
ica
ls3
44
06
97
51
65
98
Der
isom
+ P
anch
agav
ya3
52
07
09
51
82
22
Der
isom
(3m
l/l)+
Pan
chag
avya
10
%+
cow
urin
e 3
%3
64
07
21
01
82
42
SE
m±
27
98
48
83
1
CD
(P
=0.
05)
NS
NS
NS
Cro
pp
ing
sys
tem
Pes
t an
d d
isea
se m
anag
emen
t p
ract
ice
Yie
ldS
traw
yie
ld
Cro
p 1
Cro
p 2
Cro
p 3

Network Project on Organic Farming
Annual Report 2012-13100
Table 25. Influence of pest and disease management practices under organic farming on economics of croppingsystems
Cropping system Pest and disease management(Treatment details in Table 16) Gross Cost of Net B:C
returns cultivation returns ratio(Rs ha-1) (Rs ha-1) (Rs ha-1)
Bajura
cauliflower - peas- Kharif : Mixture of Derisom (2% EC) @ 2ml/L 159394tomato and Ha NPV (Helicide) @ 0.5 ml/L Rabi:
Darek (Melia azedarach) @ 5% ASE +Cow Urine (3.0%)
Kharif: Bhang (Cannabis sativa)10% ALE + 155344Cow Urine (3%)+ Tween -80 (0.05%) asemulsifier, Rabi: Kaner (Nerium sp.) (5%)+Cow Urine (3.0%)
Kharif: Karvi (Roylea cinerea) @ 10% ALE + 153806Cow Urine (3%)+ Tween -80 (0.05%) asemulsifier Rabi: Karvi (Roylea cinerea)@ 5%+ Cow Urine (3.0%)
Kharif: Metarhizium anisopliae @ 2g per litre 149700of water + Tween -80 (0.05%) as emulsifierRabi: Darek ( M. azedarach) (5% ALE) +Cow Urine (3%)
Kharif : Nomurea rileyi (Nolep) @ 2 gm per 147900litre of water + Tween -80 (0.05%) asemulsifier Rabi: Darek (M. azedarach)@ 2.5% ASE + Kaner (Nerium sp.)@ 2.5% ALE + Cow Urine (3%)
Kharif : Margosom (Azedarachtin 1.0% EC) 144038@ 1ml/L Rabi: Karvi (Roylea cinerea)@ 2.5% ALE + Kaner (Nerium sp.)@ 2.5% ALE + Cow Urine (3%)
Kharif : Lipel (Bacillus thuringiensis sub 143269sp. kurstaki) @ 1.0 kg/ha, Rabi: Darek(M. azedarach (2.5% ALE) + Karvi (Royleacinerea) @ 2.5% ALE + Cow Urine (3%)
Kharif: Control ( untreated check), Rabi: 150731Margosom (Azedarachtin 1%) @ 0.5ml/ L
Rabi: Margosom (Azedarachtin 1%) @ 0.75 ml/ L 163069
Rabi: Margosom (Azedarachtin 1%) @ 1.0 ml/ L 167,700
Rabi: Control (untreated check) 130650
Modipuram
Basmati rice-wheat FYM+Vermi Compost 140958 60108 80851 1.39
BD Preparation 127071 28980 98091 3.40
FYM+Vermi Compost+Panchgavya 147537 66108 81429 1.26
FYM+Vermi Compost+BD Preparation 153214 64108 89107 1.44
BD Preparation+FYM+Vermicompost+ 156801 70108 86693 1.26Panchgavya
Control 119829 24980 94849 3.83
Maize+cowpea- FYM+Vermi Compost 140361 61900 78461 2.51Wheat+mustard
BD Preparation 127689 29050 98639 3.61
FYM+Vermi Compost+Panchgavya 149793 67900 81893 2.82
Fym+Vermi Compost+BD Preparation 154429 65900 88529 3.02
BD Preparation+Fym+Vermicompost+Panchgavya 161853 71900 89953 3.16
Control 115131 25050 90081 3.52

Network Project on Organic Farming
Annual Report 2012-13 101
observed in two stages in maize +soybean while fruit borer and early blight incidence in tomato wasobserved in one stage. Yield of all the crops were also recorded. Application of derisom (3 ml/l) +panchagavya @ 10% and cow urine 3% recorded lower incidence of monolapta (0.47%), mylloceros(0.93%) and leaf folder (0.40%) in early stage of maize while epilechna incidence (0.20%) was found tobe reduced through application of panchagavya @ 3%+ lantana 10% +vermi wash 10%. Soybean rustwas found to be controlled to the level of 29.7% with the application of panchagavya @ 3% + lantana @10% + vermiwash @ 10%. In tomato, fruit borer incidence can be reduced to the level of 1.13% withapplication of either panchagavya @ 3% + lantana 10% + vermin wash 10% or derisom (3 ml/l) +panchagavya @ 10% and cow urine 3%. Similarly, application of panchagavya @ 3% or panchagavya@ 3%+ lantana @ 10% + vermiwash @ 10% recorded 32.5 and 32.3% less incidence of early blightcompared to control (untreated check). Though application of panchagavya @ 3%+ lantana @ 10% +vermi wash @ 10% recorded higher maize grain yield of 3680 kg ha-1, it is not significantly different withother treatments. Trichoderma 5 g/l recorded lower yield of 3145 kg ha-1 of maize. Although application ofpanchagavya @ 3% + lantana @ 10% + vermi wash @ 10% recorded 14.1% higher tomato yield (18338kgha-1) than control (16070 kg ha-1), it is on par with derisom (3 ml/l) + panchagavya @ 10% and cow urine3% and derisom+panchagavya.

Network Project on Organic Farming
Annual Report 2012-13102
7.4 Weed management under organic farming
Title of the experiment: Weed management in cropping systems under organic farming
Objectives: To study on the effect of weed management practice on weed dynamics, crop nutrient uptake,nutrient removal by weeds, yield and economics under organic farming.
Year of start: 2004-05, treatments are modified during 2009-08.
Treatments: There are no common treatments for all the centres, but they varied from location to location.The number of cropping systems tested at each location ranges from 1 to 3. The details of treatmentsare given in Table 26-32 along with experimental results.
Locations: The experiment was conducted at 9 centres namely Coimbatore, Dharwad, Jabal pur, Karjat,Ludhiana, Pantnagar, Raipur, Ranchi and Umiam.
Results
Coimbatore (Table 28, 29, 31 and 32)
Five treatments comprising of un-weeded check, two hand weeding, spray of aqueous leaf extractat 3-4 leaf stage of weeds, hand weeding + aqueous leaf extract spray and weed free check was evaluatedin rice-blackgram-green manure system and observations on yield, soil properties, microbial count andeconomics were taken. In both rice and blackgram, weed free condition recorded higher yield (4213 and863 kg ha-1 respectively) followed by combination of two hand weeding + spray of aqueous leaf extract at3-4 leaf stage of weeds which recorded 88 and 163% increase yield of rice and blackgram over unweededcontrol. Spray of aqueous leaf extract alone was not effective in controlling of weeds in both the crops asit recorded the reduction in yield to the tune of 39.9 and 49.9% in rice and blackgram compared to weedfree check. Straw yield of rice also exhibited the similar trend. Soil analysis indicated higher organic carbonwith weed free check and two hand weeding + spray of aqueous leaf extract combination (0.64% in each).Residual availability of soil N, P and K also followed the similar trend. Compared to unweeded check,hand weeding, hand weeding + leaf extract spray, leaf extract spray alone and weed free check recorded10.5, 19.8, 12.3 and 22.2% higher fungal population. Though bacteria and actinomycetes population wasnot significantly influenced by weed management packages, numerically higher bacteria was observedunder aqueous leaf extract spray while actinomycetes was higher under weed free check. Higher grossand net returns of Rs. 99,593 and 67,473 ha-1 was observed under weed free check in rice-blackgram-green manure system. The next best treatment for weed management in terms of economics was foundto be two hand weeding + spray of aqueous leaf extract at 3-4 leaf stage of weeds to both the crops inthe system. A reduction of 35.3% in net returns was observed under spray of aqueous leaf extract alonecompared to two hand weeding package. Unweeded check recorded 67.3% reduction in net returns overweed free condition.
Dharwad (Table 28 and 32)
Weed management packages under organic farming in groundnut was evaluated with 14 treatmentscomprising of aqueous leaf spray of cassia, parthenium, Prosopis juliflora in each condition of pre andpost emergence of weeds along with hand weeding, hand hoeing, sorghum stubble mulch, wheat strawmulch, weed free and weedy check. The result indicates, weed free recorded higher pod yield of 3041kg ha-1. The next best treatment was One hand weeding at 20 DAS+Two hand hoeing at 20 and 40DAS+aqueous spray of cassia at 25% as pre-emergent application which was at par with one handweeding at 20DAS+two hand hoeing at 20 and 40 DAS+Aqueous spray of parthenium at 25%as pre-emergent application. Among the aqueous sprays, spray of cassia and prosopis juliflora as post emergentwas found to be more effective than pre or post emergence application of parthenium. Post emergencespray of aqueous leaf extract was found to be better than pre emergence application. On an average, 1

Network Project on Organic Farming
Annual Report 2012-13 103
Table 26. Influence of weed management practices under organic farming on weed count (no’s/m2) of crops atvarious locations
Cropping system/ weed management practices Kharif Rabi
Grasses Sedges Total BLW’s
Jabalpur
Basmati rice-wheat
Unweeded-control 18.1 9.55
Two hand weeding/mechanical weeding 10.0 5.70
Spray of 3-4 leaf stage of weed 10.1 8.40
Two hand weeding/mechanical weeding+Spray of 3-4 leaf stage of weed 8.18 4.70
Weed free 2.30 1.45
SEm± CD SEm± CD
0.05 0.11 0.16 0.65
Pantnagar
Basmati rice-wheat-sesbania
Kh. Weedy check Rb. Weedy check 9.67 30.7
Kh. Use of conoweeder Rb. One HW at 25-30 DAS 3.67 13.7
Kh. One hand weeding at 25-30 DAT Rb. Two HW at 25-30& 45-50 DAS 0.67 10.0
Kh. Two hand weeding at 25 & 45-50 DAT Rb. Stale seed bed + 1.33 16.01HW at 30-35 DAS
Basmati rice-lentil-sesbania
Kh. Weedy check Rb. Weedy check 10.0 32.0
Kh. Use of conoweeder Rb. One HW at 25-30 DAS 6.33 18.0
Kh. One hand weeding at 25-30 DAT Rb. Two HW at 25-30& 45-50 DAS 1.33 7.33
Kh. Two hand weeding at 25 & 45-50 DAT Rb. Stale seed bed + 2.33 24.01HW at 30-35 DAS
Basmati rice-Brassica napus-sesbania
Kh. Weedy check Rb. Weedy check 8.67 48.0
Kh. Use of conoweeder Rb. One HW at 25-30 DAS 2.67 15.3
Kh. One hand weeding at 25-30 DAT Rb. Two HW at 25-30& 45-50 DAS 0.67 9.00
Kh. Two hand weeding at 25 & 45-50 DAT Rb. Stale seed bed + 1.33 18.71HW at 30-35 DAS
CD (P=0.05) SEm± CD SEm± CD
Cropping 0.89 NS 1.27 3.54
Source 1.05 2.20 5.30 11.1
Cropping X Source 1.81 NS 9.17 NS
Source X Cropping 1.80 NS 8.05 NS
Raipur (Rice-mustard)
Weedy check 21.0 435
Kh. Use of cono weeder with square planting Rb.Stale seed bed 6.73 174
1 HW at 25-30 DAT 14.0 206
2 HW at 25-30 and 45-50 DAT 8.70 64.3
Aquious spray at 15-20 DAT + 1 HW at 40-50 DAT 15.0 228
SEm± CD SEm± CD
1.34 4.38 18.3 59.6

Network Project on Organic Farming
Annual Report 2012-13104
Table 27. Influence of weed management practices under organic farming on weed total dryweight (g/m2) ofcrops at various locations
Cropping system/ weed management practices Kharif Rabi
Total Total
Ludhiana
Rice-wheat
Kh. HW @25-30 DAT Rb.HW @25-30 DAS 9.04 754
Kh.2 HW @25-30 and 45-50 DAT Rb.2 HW @30-35 and 45-50 DAS 9.56 882
Kh. ES@15-30DAT+HW@40-45DAT Rb. ES@15-30DAS+HW@40-45DAS 10.7 714
Kh. Sq planting+paddy weeder Rb.Bed sowing+2HW@30-35&45-50DAS 9.06 867
Kh. High density+hw@25-30DAT Rb.High seed rate (25%)+15cm spacing 8.12 624
Control 16.2 559
SEm± CD SEm± CD
1.11 2.35 65.4 139
Pantnagar
Basmati rice-wheat-sesbania
Kh. Weedy check Rb. Weedy check 346
Kh. Use of conoweeder Rb. One HW at 25-30 DAS 71.0
Kh. One hand weeding at 25-30 DAT Rb. Two HW at 25-30& 45-50 DAS 18.7
Kh. Two hand weeding at 25 & 45-50 DAT Rb. Stale seed bed + 1HW at 30-35 DAS 54.0
Basmati rice-lentil-sesbania
Kh. Weedy check Rb. Weedy check 504
Kh. Use of conoweeder Rb. One HW at 25-30 DAS 80.7
Kh. One hand weeding at 25-30 DAT Rb. Two HW at 25-30& 45-50 DAS 28.0
Kh. Two hand weeding at 25 & 45-50 DAT Rb. Stale seed bed + 1HW at 30-35 DAS 74.3
Basmati rice-Brassica napus-sesbania
Kh. Weedy check Rb. Weedy check 624
Kh. Use of conoweeder Rb. One HW at 25-30 DAS 114
Kh. One hand weeding at 25-30 DAT Rb. Two HW at 25-30& 45-50 DAS 43.0
Kh. Two hand weeding at 25 & 45-50 DAT Rb. Stale seed bed + 1HW at 30-35 DAS 101
CD (P=0.05) SEm± CD
Cropping 32.1 NS
Source 65.4 137
Cropping X Source 113 NS
Source X Cropping 103 NS
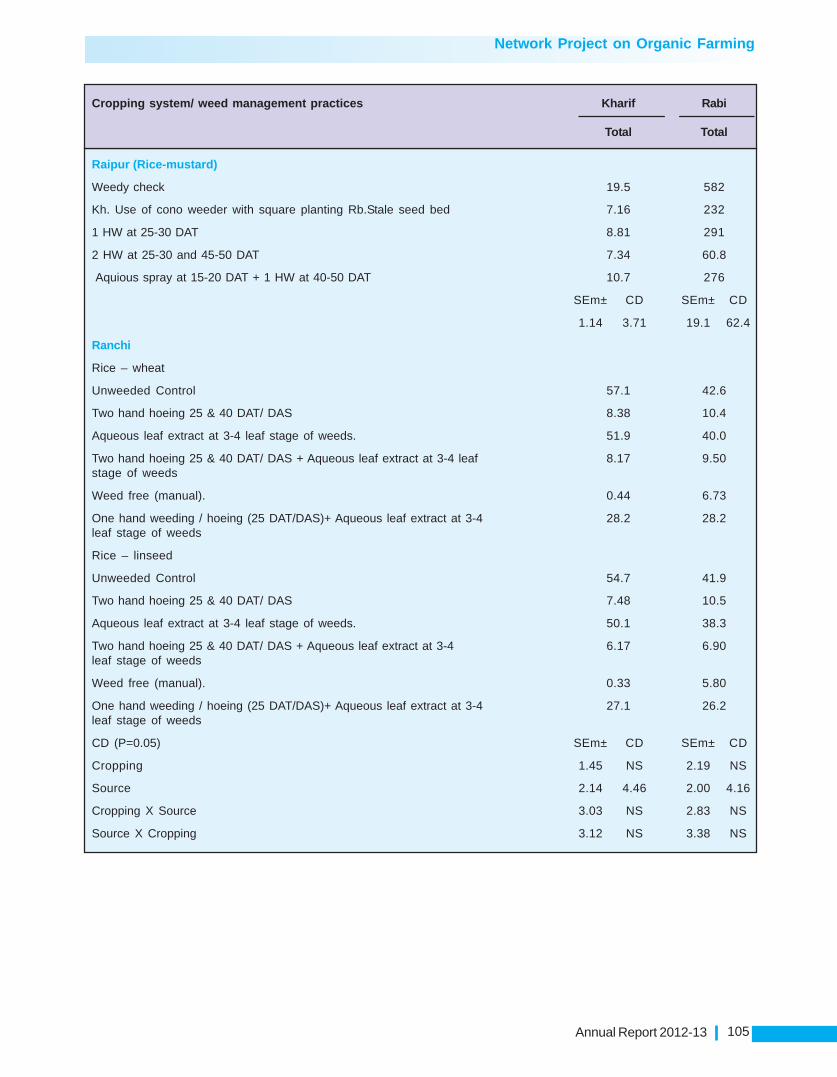
Network Project on Organic Farming
Annual Report 2012-13 105
Raipur (Rice-mustard)
Weedy check 19.5 582
Kh. Use of cono weeder with square planting Rb.Stale seed bed 7.16 232
1 HW at 25-30 DAT 8.81 291
2 HW at 25-30 and 45-50 DAT 7.34 60.8
Aquious spray at 15-20 DAT + 1 HW at 40-50 DAT 10.7 276
SEm± CD SEm± CD
1.14 3.71 19.1 62.4
Ranchi
Rice – wheat
Unweeded Control 57.1 42.6
Two hand hoeing 25 & 40 DAT/ DAS 8.38 10.4
Aqueous leaf extract at 3-4 leaf stage of weeds. 51.9 40.0
Two hand hoeing 25 & 40 DAT/ DAS + Aqueous leaf extract at 3-4 leaf 8.17 9.50stage of weeds
Weed free (manual). 0.44 6.73
One hand weeding / hoeing (25 DAT/DAS)+ Aqueous leaf extract at 3-4 28.2 28.2leaf stage of weeds
Rice – linseed
Unweeded Control 54.7 41.9
Two hand hoeing 25 & 40 DAT/ DAS 7.48 10.5
Aqueous leaf extract at 3-4 leaf stage of weeds. 50.1 38.3
Two hand hoeing 25 & 40 DAT/ DAS + Aqueous leaf extract at 3-4 6.17 6.90leaf stage of weeds
Weed free (manual). 0.33 5.80
One hand weeding / hoeing (25 DAT/DAS)+ Aqueous leaf extract at 3-4 27.1 26.2leaf stage of weeds
CD (P=0.05) SEm± CD SEm± CD
Cropping 1.45 NS 2.19 NS
Source 2.14 4.46 2.00 4.16
Cropping X Source 3.03 NS 2.83 NS
Source X Cropping 3.12 NS 3.38 NS
Cropping system/ weed management practices Kharif Rabi
Total Total

Network Project on Organic Farming
Annual Report 2012-13106
Tab
le 2
8. I
nfl
uen
ce o
f w
eed
man
agem
ent
pra
ctic
es u
nd
er o
rgan
ic f
arm
ing
on
gra
in/s
traw
yie
ld (
kg/h
a) o
f cr
ops
at
vari
ou
s lo
cati
on
s
Cro
pp
ing
sys
tem
/ wee
d(G
Y)
(SY
)(G
Y)
(SY
)(G
Y)
(SY
)m
anag
emen
t p
ract
ices
Kh
arif
Rab
iK
har
ifR
abi
Kh
arif
Rab
iK
har
ifR
abi
Kh
arif
Rab
iK
har
ifR
abi
Co
imb
ato
re (
Ric
e-B
lack
gram
-GM
)
Un-
wee
ded
cont
rol
20
53
31
02
86
2
Two
hand
wee
ding
37
08
79
54
95
0
Spr
ay o
f 3-
4 le
af s
tage
of
wee
ds,
aque
ous
25
91
43
53
36
0le
af e
xtra
ct o
f so
me
loca
l w
eed/
herb
/tree
Two
hand
wee
ding
+ S
pray
of
3-4
leaf
38
50
81
65
22
0st
age
of w
eeds
, aq
ueou
s le
af e
xtra
ct o
fso
me
loca
l w
eed/
herb
/tre
e
Wee
d fr
ee4
21
38
63
58
87
SE
m±
CD
SE
m±
CD
SE
m±
CD
86.8
283.
245
.714
8.9
95.4
311.
0
Dh
arw
ad (
Gro
undn
ut)
Aqu
eous
spr
ay o
f ca
ssia
at
25%
as2
23
0pr
e-em
erge
nt a
pplic
atio
n
Aqu
eous
spr
ay o
f ca
ssia
at
25%
as2
40
3po
st-e
mer
gent
app
licat
ion
Aqu
eous
spr
ay o
f pa
rthe
nium
at
22
59
25%
as p
re-e
mer
gent
app
licat
ion
Aqu
eous
spr
ay o
f pa
rthe
nium
at
25%
23
25
as p
ost-
emer
gent
app
licat
ion
Aqu
eous
spr
ay o
f P
roso
pis
julif
lora
23
20
at 2
5%as
pre
-em
erge
nt a
pplic
atio
n
Aqu
eous
spr
ay o
f P
roso
pis
julif
lora
23
40
at 2
5%as
pos
t-em
erge
nt a
pplic
atio
n
One
han
d w
eedi
ng a
t 20
DA
S+
Two
27
01
hand
hoe
ing
at 2
0 an
d 40
DA
S
One
han
d w
eedi
ng a
t 20
DA
S+
Two
28
22
hand
hoe
ing
at 2
0 an
d 40
DA
S+
Aqu
eous
spr
ay o
f ca
ssia
at
25%
aspr
e-em
erge
nt a
pplic
atio
n
One
han
d w
eedi
ng a
t 20
DA
S+
Two
28
11ha
nd h
oein
g at
20
and
40 D
AS
+A
queo
us s
pray
of
part
heni
um a
t 25
%as
pre
-em
erge
nt a
pplic
atio
n
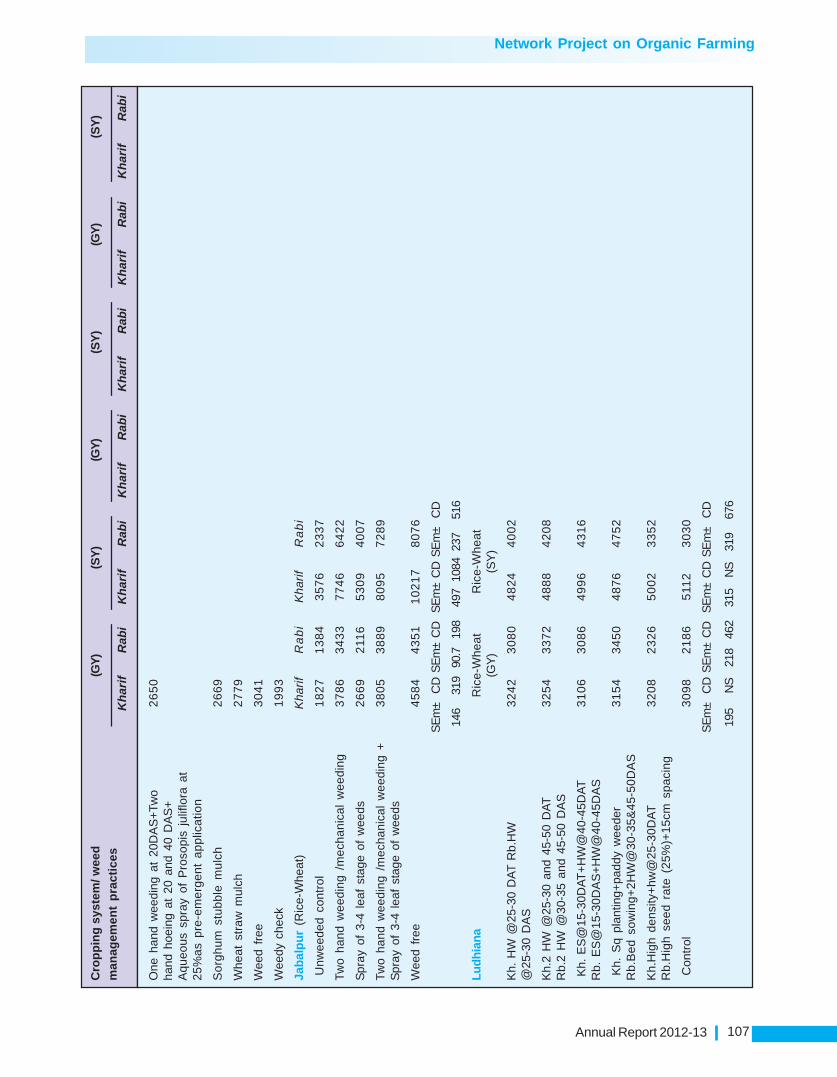
Network Project on Organic Farming
Annual Report 2012-13 107
Cro
pp
ing
sys
tem
/ wee
d(G
Y)
(SY
)(G
Y)
(SY
)(G
Y)
(SY
)m
anag
emen
t p
ract
ices
Kh
arif
Rab
iK
har
ifR
abi
Kh
arif
Rab
iK
har
ifR
abi
Kh
arif
Rab
iK
har
ifR
abi
One
han
d w
eedi
ng a
t 20
DA
S+
Two
26
50
hand
hoe
ing
at 2
0 an
d 40
DA
S+
Aqu
eous
spr
ay o
f P
roso
pis
julif
lora
at
25%
as p
re-e
mer
gent
app
licat
ion
Sor
ghum
stu
bble
mul
ch2
66
9
Whe
at s
traw
mul
ch2
77
9
Wee
d fr
ee3
04
1
Wee
dy c
heck
19
93
Jab
alp
ur
(Ric
e-W
heat
)K
harif
Ra
bi
Kha
rifR
ab
i
Unw
eede
d co
ntro
l1
82
71
38
43
57
62
33
7
Two
hand
wee
ding
/m
echa
nica
l w
eedi
ng3
78
63
43
37
74
66
42
2
Spr
ay o
f 3-
4 le
af s
tage
of
wee
ds2
66
92
116
53
09
40
07
Two
hand
wee
ding
/m
echa
nica
l w
eedi
ng +
38
05
38
89
80
95
72
89
Spr
ay o
f 3-
4 le
af s
tage
of
wee
ds
Wee
d fr
ee4
58
44
35
11
02
17
80
76
SE
m±
CD
SE
m±
CD
SE
m±
CD
SE
m±
CD
146
319
90.7
198
497
1084
237
516
Ludh
iana
Ric
e-W
heat
Ric
e-W
heat
(GY
)(S
Y)
Kh.
HW
@25
-30
DA
T R
b.H
W3
24
23
08
04
82
44
00
2@
25-3
0 D
AS
Kh.
2 H
W @
25-3
0 an
d 45
-50
DA
T3
25
43
37
24
88
84
20
8R
b.2
HW
@30
-35
and
45-5
0 D
AS
Kh.
ES
@15
-30D
AT
+H
W@
40-4
5DA
T3
10
63
08
64
99
64
31
6R
b. E
S@
15-3
0DA
S+
HW
@40
-45D
AS
Kh.
Sq
plan
ting+
padd
y w
eede
r3
15
43
45
04
87
64
75
2R
b.B
ed s
owin
g+2H
W@
30-3
5&45
-50D
AS
Kh.
Hig
h de
nsity
+hw
@25
-30D
AT
32
08
23
26
50
02
33
52
Rb.
Hig
h se
ed r
ate
(25%
)+15
cm s
paci
ng
Con
trol
30
98
21
86
511
23
03
0
SE
m±
CD
SE
m±
CD
SE
m±
CD
SE
m±
CD
195
NS
218
462
315
NS
319
676

Network Project on Organic Farming
Annual Report 2012-13108
Pan
tnag
arB
asm
ati
rice
–B
asm
ati
rice
–B
asm
ati
rice
–B
asm
ati
rice
–B
asm
ati
rice
–B
asm
ati
rice
–w
he
at-
Se
sb
an
iaw
he
at-
Se
sb
an
iale
nti
l-S
es
ba
nia
len
til-
Se
sb
an
iaB
rass
ica
nap
us-
Bra
ssic
a n
apu
s-(g
ree
n m
an
uri
ng
)(g
ree
n m
an
uri
ng
)(g
ree
n m
an
uri
ng
)(g
ree
n m
an
uri
ng
)S
es
ba
nia
Se
sb
an
ia (
gre
en
(GY
)(S
Y)
(GY
) (
SY
)(g
ree
n m
an
uri
ng
) m
an
uri
ng
)(G
Y)
(SY
)
Kh.
Wee
dy c
heck
Rb
Wee
dy c
heck
22
35
24
85
35
96
37
25
25
84
30
53
74
76
51
23
02
58
93
52
41
56
7
Kh.
Use
of
cono
wee
der
Rb.
One
43
85
30
14
54
53
47
84
45
78
65
05
48
51
28
24
45
28
27
54
03
16
46
HW
at
25-3
0 D
AS
Kh.
One
han
d w
eedi
ng a
t 25
-30
36
14
43
72
44
22
46
52
32
78
93
24
56
61
85
53
411
15
95
44
14
23
70
DA
T R
b. T
wo
HW
at
25-3
0& 4
5-50
DA
S
Kh.
Tw
o ha
nd w
eedi
ng a
t 25
& 4
5-50
DA
T4
20
73
96
35
17
35
19
44
39
37
27
53
22
14
18
42
48
12
14
50
82
24
89
Rb.
Sta
le s
eed
bed
+ 1
HW
at
30-3
5 D
AS
Kh.
Rb.
Kh.
Rb.
CD
(P
=0.
05)
SE
m±
CD
SE
m±
CD
SE
m±
CD
SE
m±
CD
Cro
pp
ing
39.7
NS
79.2
220
87.3
NS
246
684
Sou
rce
104
219
85.1
179
155
326
133
279
Cro
ppin
g X
Sou
rce
180
NS
147
310
269
NS
230
484
Sou
rce
X C
ropp
ing
161
NS
150
344
249
NS
317
795
Rai
pur
Ric
e-M
usta
rdR
ice-
Mus
tard
(GY
)(S
Y)
Wee
dy c
heck
26
39
35
96
45
311
86
Kh.
Use
of
cono
wee
der
with
squ
are
35
68
64
07
38
81
95
7pl
antin
g R
b.S
tale
see
d be
d
1 H
W a
t 25
-30
DA
T3
14
67
06
70
112
20
2
2 H
W a
t 25
-30
and
45-5
0 D
AT
33
29
78
66
99
72
40
3
Aqu
ious
spr
ay a
t 15
-20
DA
T +
30
44
65
46
86
12
06
71
HW
at
40-5
0 D
AT
SE
m±
CD
SE
m±
CD
SE
m±
CD
SE
m±
CD
180.
258
7.8
21.3
69.5
170.
3555
.331
.910
4.1
Ran
chi
Ric
e –
Wh
eat
Ric
e –
Wh
eat
Ric
e –
Lin
seed
Ric
e –
Lin
seed
(GY
)(S
Y)
(GY
)(S
Y)
Unw
eede
d C
ontr
ol2
19
81
09
13
40
31
99
22
13
73
92
33
13
85
0
Two
hand
hoe
ing
25 &
40
DA
T/
DA
S3
63
31
81
85
16
02
89
93
57
37
45
48
57
12
29
Cro
pp
ing
sys
tem
/ wee
d(G
Y)
(SY
)(G
Y)
(SY
)(G
Y)
(SY
)m
anag
emen
t p
ract
ices
Kh
arif
Rab
iK
har
ifR
abi
Kh
arif
Rab
iK
har
ifR
abi
Kh
arif
Rab
iK
har
ifR
abi

Network Project on Organic Farming
Annual Report 2012-13 109
Aqu
eous
lea
f ex
trac
t at
3-4
lea
f st
age
26
27
118
24
14
32
08
32
50
44
10
39
77
95
8of
wee
ds.
Two
hand
hoe
ing
25 &
40
DA
T/
DA
S +
38
47
19
39
52
43
31
45
37
25
78
75
117
13
33
Aqu
eous
lea
f ex
trac
t at
3-4
lea
f st
age
of w
eeds
Wee
d fr
ee (
man
ual).
40
31
20
60
56
73
34
01
39
69
83
85
94
31
61
5
One
han
d w
eedi
ng /
hoe
ing
(25
DA
T3
48
11
60
64
76
02
70
83
32
86
07
46
97
114
3/D
AS
)+ A
queo
us le
af e
xtra
ct a
t 3-
4 le
afst
age
of w
eeds
Kh.
Rb.
Kh.
Rb.
CD
(P
=0.
05)
SE
m±
CD
SE
m±
CD
SE
m±
CD
SE
m±
CD
Cro
pp
ing
150
NS
96.0
413
162
NS
186
801
Sou
rce
243
507
92.3
193
400
835
177
368
Cro
ppin
g X
Sou
rce
344
NS
131
NS
566
NS
250
NS
Sou
rce
X C
ropp
ing
348
NS
153
NS
541
NS
294
NS
Um
iam
mai
ze (
gre
enM
aize
(g
reen
cob
) –
mu
star
dco
b)–
mu
star
d(G
Y)
(SY
)
Mec
hani
cal
wee
ding
(20
DA
S)
+ H
W3
21
25
00
69
95
94
4on
ce (
60 D
AS
)
Mul
chin
g w
ith f
resh
Eup
ator
ium
/3
75
66
39
95
07
116
7A
mbr
ossi
a @
10t
/ha
(Afte
r ea
rthi
ng u
p)
Aqu
eous
lea
f ex
trac
t sp
ray
of l
anta
na&
34
62
52
89
20
59
17
pine
spp
. at
3-4
lea
f st
age
of w
eed
HW
tw
ice
(20
& 4
0 D
AS
)2
99
64
72
65
76
86
1
aque
ous
leaf
ext
ract
spr
ay o
f3
32
75
56
85
46
10
83
lant
ana
& p
ine
+ h
and
wee
ding
tw
ice
Soy
bean
gre
en m
anur
e in
corp
orat
ion
31
61
44
48
118
80
6in
situ
(1:
1) +
HW
onc
e
Wee
d fr
ee c
heck
31
45
45
86
45
98
80
Wee
dy c
heck
28
94
38
35
65
77
52
SE
m±
CD
SE
m±
CD
SE
m±
CD
SE
m±
CD
1133
64.4
3510
111.
47.
97.
885
.44.
1
Cro
pp
ing
sys
tem
/ wee
d(G
Y)
(SY
)(G
Y)
(SY
)(G
Y)
(SY
)m
anag
emen
t p
ract
ices
Kh
arif
Rab
iK
har
ifR
abi
Kh
arif
Rab
iK
har
ifR
abi
Kh
arif
Rab
iK
har
ifR
abi

Network Project on Organic Farming
Annual Report 2012-13110
Tab
le 2
9. I
nfl
uen
ce o
f w
eed
man
agem
ent
pra
ctic
es u
nd
er o
rgan
ic f
arm
ing
on
so
il p
hys
ical
an
d c
hem
ical
pro
per
ties
at
the
end
of
cro
pp
ing
cyc
le(B
D: g
/cc,
EC
: dS
/m, O
C: %
, N, P
, K: k
g/h
a)
Cro
pp
ing
BDpH
ECO
CN
PK
BDpH
ECO
CN
PK
BDpH
ECO
CN
PK
syst
em/
wee
dm
anag
emen
tp
ract
ices
*
Co
imb
ato
reR
ice-
Bla
ckg
ram
-G
M
Unw
eede
d co
ntro
l0.
5718
522
.546
8
Two
hand
wee
ding
0.62
225
26.4
551
Spr
ay o
f 3-4
leaf
sta
ge0.
6019
023
.048
0of
wee
ds, a
queo
us le
afex
tract
of s
ome
loca
lw
eed/
herb
/tree
Two
hand
wee
ding
+0.
6424
527
.856
0S
pray
of 3
-4 le
af s
tage
of w
eeds
, aqu
eous
leaf
extra
ct o
f som
e lo
cal
wee
d/he
rb/tr
ee
Wee
d fre
e0.
6425
129
.460
1
SC
DS
CD
SC
DS
CD
SC
DS
CD
SC
DEm
EmEm
EmEm
EmEm
±±
±±
±±
±
0.0.
6.21
.1.4
4.613
.42
.01
046
61
8
Pan
tnag
arBa
smat
i ric
e –
whe
at-S
esba
nia
Basm
ati r
ice
– le
ntil-
Sesb
ania
Basm
ati r
ice
– Br
assi
ca n
apus
-Ses
bani
a(g
reen
man
urin
g(g
reen
man
urin
g)(g
reen
man
urin
g)
Kh.
Wee
dy c
heck
0.97
344
30.5
226
0.95
365
32.7
225
0.96
369
33.8
232
Rb.
Wee
dy c
heck
Kh. U
se o
f con
owee
der
0.91
332
33.8
230
0.95
363
29.9
213
0.91
346
35.4
217
Rb.
One
HW
at 2
5-30
DAS
Kh. O
ne h
and
wee
ding
0.91
347
32.9
223
0.95
381
34.3
232
0.98
363
30.7
225
at 2
5-30
DAT
Rb.
Tw
oH
W a
t 25-
30&
45-5
0DA
S
Kh. T
wo
hand
wee
ding
0.82
343
29.2
219
0.94
355
34.3
240
0.83
368
31.9
230
at 2
5 &
45-
50 D
ATR
b. S
tale
see
d be
d +
1HW
at 3
0-35
DA
S

Network Project on Organic Farming
Annual Report 2012-13 111
CD
(P
=0.
05)
SC
DS
CD
SC
DS
CD
SC
DS
CD
SC
DEm
EmEm
EmEm
EmEm
±±
±±
±±
±
Cro
pp
ing
0.0.
7.19
.1.
NS7.
NS01
0402
517
42
Sou
rce
0.0.
10.
NS1.
NS8.
NS01
029
2422
Cro
ppin
g X
Sou
rce
0.0.
19.
NS2.
4.14
.NS
0204
015
512
Sou
rce
X C
ropp
ing
0.0.
17.
NS2.
5.14
.NS
0205
920
044
Rai
pu
r
(R
ice-
mus
tard
)
Wee
dy c
heck
1.44
7.54
0.21
0.45
204
10.1
276
Kh.
Use
of c
ono
1.42
7.52
0.20
0.44
227
10.8
287
wee
der w
ith s
quar
epl
antin
g R
b.St
ale
seed
bed
1 H
W a
t 25-
30 D
AT1.
377.
560.
210.
4622
912
.229
8
2 H
W a
t 25-
301.
367.
520.
190.
4623
613
.930
6an
d 45
-50
DAT
Aqui
ous
spra
y at
1.41
7.53
0.22
0.46
221
11.3
283
15-2
0 D
AT +
1 H
Wat
40-
50 D
AT
SC
DS
CD
SC
DS
CD
SC
DS
CD
SC
DEm
EmEm
EmEm
EmEm
±±
±±
±±
±
0.02
0.05
0.01
0.01
8.6
1.6
7.7
Ran
chi
Ric
e-w
heat
Ric
e-lin
seed
Unw
eede
d C
ontro
l23
433
.319
222
833
.019
4
Two
hand
hoe
ing
2524
239
.320
324
137
.720
0&
40
DAT
/ DA
S
Aque
ous
leaf
ext
ract
239
34.3
193
234
34.0
195
at 3
-4 le
af s
tage
of
wee
ds.
Cro
pp
ing
BDpH
ECO
CN
PK
BDpH
ECO
CN
PK
BDpH
ECO
CN
PK
syst
em/
wee
dm
anag
emen
tp
ract
ices
*

Network Project on Organic Farming
Annual Report 2012-13112
Two
hand
hoe
ing
2524
540
.320
624
438
.020
3&
40
DAT
/ DA
S +
Aque
ous
leaf
ext
ract
at 3
-4 le
af s
tage
of
wee
ds
Wee
d fre
e (m
anua
l).25
541
.321
324
639
.320
5
One
han
d w
eedi
ng /
233
37.0
200
233
35.0
198
hoei
ng (2
5 D
AT/D
AS)+
Aqu
eous
leaf
ext
ract
at
3-4
leaf
sta
ge o
f wee
ds
Um
iam
m
aize
(gre
en c
ob) -
mus
tard
Mec
hani
cal w
eedi
ng1.
275.
532.
4327
618
.227
8(2
0 D
AS
) + H
W o
nce
(60
DAS
)
Mul
chin
g w
ith fr
esh
1.18
5.62
3.18
270
24.6
281
Eupa
toriu
m/ A
mbr
ossi
a@
10t
/ha
(Afte
rea
rthin
g up
)
Aque
ous
leaf
ext
ract
1.24
5.10
2.52
238
32.2
265
spra
y of
lant
ana&
pine
spp.
at 3
-4 le
af s
tage
of w
eed
HW
twic
e (2
0 &
1.24
5.33
2.39
251
20.4
263
40 D
AS)
aque
ous
leaf
ext
ract
1.21
5.51
2.39
263
20.3
267
spra
y of
lant
ana
&pi
ne +
han
d w
eedi
ngtw
ice
Soyb
ean
gree
n m
anur
e1.
205.
462.
6325
719
.427
9in
corp
orat
ion
in s
itu(1
:1) +
HW
onc
e
Wee
d fre
e ch
eck
1.30
5.58
2.21
276
19.4
271
Wee
dy c
heck
1.25
5.12
2.18
235
23.4
244
SC
DS
CD
SC
DS
CD
SC
DS
CD
EmEm
EmEm
EmEm
±±
±±
±±
0.NS
0.0.
0.6.
18.
2.6.
4.14
.03
1609
270
22
87
2
Cro
pp
ing
BDpH
ECO
CN
PK
BDpH
ECO
CN
PK
BDpH
ECO
CN
PK
syst
em/
wee
dm
anag
emen
tp
ract
ices
*

Network Project on Organic Farming
Annual Report 2012-13 113
Tab
le 3
0. I
nfl
uen
ce o
f w
eed
man
agem
ent
pra
ctic
es u
nd
er o
rgan
ic f
arm
ing
on
NP
K u
pta
ke b
y cr
ops
at
vari
ou
s lo
cati
on
s
Cro
pp
ing
sys
tem
/ w
eed
man
agem
ent
pra
ctic
esN
PK
up
take
by
cro
p (
kg/h
a)
Kh
arif
Rab
iS
um
mer
NP
KN
PK
NP
K
Pan
tnag
ar
B
asm
ati
rice
– w
heat
-ses
bani
a (g
reen
man
urin
g)
Kh.
Wee
dy c
heck
Rb.
Wee
dy c
heck
43.4
10.4
32.6
59.2
10.6
69.3
Kh.
Use
of
cono
wee
der
Rb.
One
HW
at
25-3
0 D
AS
75.7
19.2
47.7
68.5
18.6
84.9
Kh.
One
han
d w
eedi
ng a
t 25
-30
DA
T R
b. T
wo
HW
at
64.6
15.4
53.8
77.2
19.9
93.6
25-3
0& 4
5-50
DA
S
Kh.
Tw
o ha
nd w
eedi
ng a
t 25
& 4
5-50
DA
T R
b. S
tale
72.6
17.8
48.6
74.7
18.1
10
5
seed
bed
+ 1
HW
at
30-3
5 D
AS
Bas
mat
i ri
ce –
len
til-s
esba
nia
(gre
en m
anur
ing)
Kh.
Wee
dy c
heck
Rb.
Wee
dy c
heck
50.9
12.9
36.7
21.1
2.74
12.0
Kh.
Use
of
cono
wee
der
Rb.
One
HW
at
25-3
0 D
AS
76.8
18.7
50.7
40.9
3.56
21.4
Kh.
One
han
d w
eedi
ng a
t 25
-30
DA
T R
b. T
wo
HW
65.4
14.6
46.0
54.7
4.41
31.5
at 2
5-30
& 4
5-50
DA
S
Kh.
Tw
o ha
nd w
eedi
ng a
t 25
& 4
5-50
DA
T77
.519
.144
.848
.94.
1425
.2R
b. S
tale
see
d be
d +
1H
W a
t 30
-35
DA
S
Bas
mat
i ric
e –
Bra
ssic
a na
pus-
sesb
ania
(gr
een
man
urin
g)
Kh.
Wee
dy c
heck
Rb.
Wee
dy c
heck
47.5
12.0
35.3
19.5
3.07
23.2
Kh.
Use
of
cono
wee
der
Rb.
One
HW
at
25-3
0 D
AS
77.8
18.5
49.3
17.4
4.07
27.1
Kh.
One
han
d w
eedi
ng a
t 25
-30
DA
T58
.915
.644
.432
.17.
3443
.4
Rb.
Tw
o H
W a
t 25
-30&
45-
50 D
AS
Kh.
Tw
o ha
nd w
eedi
ng a
t 25
& 4
5-50
DA
T68
.418
.146
.021
.811
.58
42.8
Rb.
Sta
le s
eed
bed
+ 1
HW
at
30-3
5 D
AS

Network Project on Organic Farming
Annual Report 2012-13114
Cro
pp
ing
sys
tem
/ w
eed
man
agem
ent
pra
ctic
esN
PK
up
take
by
cro
p (
kg/h
a)
Kh
arif
Rab
iS
um
mer
NP
KN
PK
NP
K
Ran
chi I
Ric
e-w
hea
t
Unw
eede
d C
ontr
ol52
.610
.139
.325
.46.
127
.5-
--
Two
hand
hoe
ing
25 &
40
DA
T/
DA
S86
.513
.159
.943
.710
.240
.2-
--
Aqu
eous
lea
f ex
trac
t at
3-4
lea
f st
age
of w
eeds
.64
.310
.845
.328
.06.
629
.2-
--
Two
hand
hoe
ing
25 &
40
DA
T/
DA
S +
Aqu
eous
95.6
17.6
62.2
46.6
11.2
42.2
--
-le
af e
xtra
ct a
t 3-
4 le
af s
tage
of
wee
ds.
Wee
d fr
ee (
man
ual).
102.
218
.667
.149
.711
.744
.7-
--
One
han
d w
eedi
ng /
hoe
ing
(25
DA
T/D
AS
)+ A
queo
us78
.113
.353
.539
.49.
236
.6-
--
leaf
ext
ract
at
3-4
leaf
sta
ge o
f w
eeds
.
Ric
e-lin
seed
Unw
eede
d C
ontr
ol52
.49.
437
.311
.55.
327
.6
Two
hand
hoe
ing
25 &
40
DA
T/
DA
S85
.614
.058
.621
.39.
140
.6
Aqu
eous
lea
f ex
trac
t at
3-4
lea
f st
age
of w
eeds
.58
.911
.644
.912
.95.
528
.3
Two
hand
hoe
ing
25 &
40
DA
T/
DA
S +
Aqu
eous
92.2
16.6
61.7
22.4
9.2
42.2
leaf
ext
ract
at
3-4
leaf
sta
ge o
f w
eeds
.
Wee
d fr
ee (
man
ual).
103.
217
.066
.625
.410
.246
.1
One
han
d w
eedi
ng /
hoe
ing
(25
DA
T/D
AS
)+ A
queo
us79
.013
.153
.118
.37.
634
.4le
af e
xtra
ct a
t 3-
4 le
af s
tage
of
wee
ds.

Network Project on Organic Farming
Annual Report 2012-13 115
Table 31. Influence of weed management practices under organic farming on soil microbial population (x104 CFU/g)at the cropping cycle at Coimbatore
Cropping system/ weed management practices Fungi Bacteria Actinomycetes(Treatment details in Table 21)
Coimbatore
Unweeded control 16.2 96.0 26.3
Two hand weeding 17.9 98.9 24.9
Spray of 3-4 leaf stage of weeds, aqueous leaf extract of 18.2 107 29.4some local weed/herb/tree
Two hand weeding + Spray of 3-4 leaf stage of weeds, 19.4 102 28.0aqueous leaf extract of some local weed/herb/tree
Weed free 19.8 105 29.9
spray of aqueous leaf extracts alone recorded reduction in yield to the tune of 23.9% over weed freecondition while the increase over weedy check was found to be 16% indicating usefulness of aqueousleaf extract which can be combined with hand weeding packages. Gross, net return and BC ratio washigher with hand weeding+hand hoeing+cassia spray as pre emergent application.
Jabalpur (Table 26, 28 and 32)
Weed management packages viz., two hand/mechanical weeding, spray at 3-4 leaf stage of weedsand its combination along with weed free and unweeded control were experimented in rice-wheat system.The results reveals that weed free recorded higher grain yield of rice (4584 kg ha-1) and wheat (4351 kgha-1) followed by combination of two hand weeding + spray at 3-4 leaf stage of weeds which recorded108 and 181% higher grain yield of rice and wheat respectively compared to unwedded check. Strawyield of both the crops also exhibited the similar trend. Higher gross (Rs 201620 ha-1), net (Rs. 139075ha-1) return and B: C ratio (3.22) was recorded with weed free condition in rice-wheat system even thoughhigh cost of cultivation (Rs. 62545 ha-1) was noticed in weed free condition. The next best treatment interms of gross, net returns and B: C ratio was two hand/mechanical weeding +spray at 3-4 leaf stage ofweeds (Rs. 1,72,905, 1,16,916 ha-1 and 3.09 respectively).
Ludhiana (Table 27 and 28)
Five management packages along with unweeded control was evaluated in basmati rice-wheatsystem. Observations on total dry weight of weeds, grain and straw yield were recorded. High densityplanting + hand weeding at 25-30 DAT recorded maximum reduction of total dry weight of weeds (8.1gm-2) which was on par with hand weeding at 25-30 DAT, hand weeding at 25-30 and 45-50 DAT andsquare planting + weeder in rice. Two hand weeding @ 25-30 and 45-50 DAT in rice recorded higheryield of 3254 kg ha-1 and it was not significantly different with other practices. In case of wheat, bed sowing+ two hand weeding at 30-35 and 45-50 DAS recorded higher yield (3450 kg ha-1) which is 48.3 and57.8% increase over high seed rate (25%) + 15 cm spacing and unweeded check respectively. Otherpractice such as hand weeding at 25-30 DAS and ES @ 15-30 DAS + HW @ 40-45 DAS recorded yieldon par (3080 and 3086 kg ha-1). The straw yield of rice and wheat also followed the similar trend as thatof grain yield.
Pantnagar (Table 26, 27, 28, 29, 30 and 32)
Three weed management packages namely use of conoweeder during kharif and one hand weedingat 25-30 DAS in rabi, one hand weeding during kharif and two hand weeding at 25-30 and 45-50 DAS inrabi, two hand weeding at 25 and 45-50 DAT during kharif and stale seed bed + 1 hand weeding at 30-35 DAS rabi along with weedy check were evaluated in three cropping systems namely basmati rice-

Network Project on Organic Farming
Annual Report 2012-13116
Tab
le 3
2. I
nfl
uen
ce o
f w
eed
man
agem
ent
pra
ctic
es u
nd
er o
rgan
ic f
arm
ing
on
eco
no
mic
s (R
s/h
a) o
f cr
op
pin
g s
yste
ms
at v
ario
us
loca
tio
ns
Cro
pp
ing
sys
tem
/G
ross
Co
st o
fN
etB
:CG
ross
Co
st o
fN
etB
:CG
ross
Co
st o
fN
etB
:Cw
eed
man
agem
ent
retu
rns
culti
vatio
nre
turn
sra
tio
retu
rns
culti
vatio
nre
turn
sra
tio
retu
rns
culti
vatio
nre
turn
sra
tio
pra
ctic
es (
Trea
tmen
td
etai
ls i
n T
able
21)
Co
imb
ato
reR
ice-
Bla
ckg
ram
-GM
Unw
eede
d co
ntro
l4
29
98
20
95
02
20
48
Two
hand
wee
ding
89
19
62
95
00
59
69
6
Spr
ay o
f 3-
4 le
af s
tage
of
56
20
22
27
00
33
50
2w
eeds
, aq
ueou
s le
af e
xtra
ctof
som
e lo
cal
wee
d/he
rb/tr
ee
Two
hand
wee
ding
+ S
pray
92
22
02
94
80
62
74
0of
3-4
lea
f st
age
of w
eeds
,aq
ueou
s le
af e
xtra
ct o
f so
me
loca
l w
eed/
herb
/tree
Wee
d fr
ee9
95
93
32
12
06
74
73
Dh
arw
adG
roun
dnut
Aqu
eous
spr
ay o
f ca
ssia
66
89
44
70
94
3.38
at 2
5%as
pre
-em
erge
ntap
plic
atio
n
Aqu
eous
spr
ay o
f ca
ssia
72
07
75
28
77
3.75
at 2
5%as
pos
t-em
erge
ntap
plic
atio
n
Aqu
eous
spr
ay o
f pa
rthe
nium
67
75
84
73
58
3.32
at 2
5%as
pre
-em
erge
ntap
plic
atio
n
Aqu
eous
spr
ay o
f pa
rthe
nium
69
73
94
90
99
3.38
at 2
5%as
pos
t-em
erge
ntap
plic
atio
n
Aqu
eous
spr
ay o
f P
roso
pis
69
61
44
89
74
3.37
julif
lora
at
25%
as p
re-
emer
gent
app
licat
ion
Aqu
eous
spr
ay o
f P
roso
pis
70
18
84
91
88
3.34
julif
lora
at
25%
as p
ost-
emer
gent
app
licat
ion
One
han
d w
eedi
ng a
t8
10
19
58
81
93.
6520
DA
S+
Two
hand
hoe
ing
at 2
0 an
d 40
DA
S
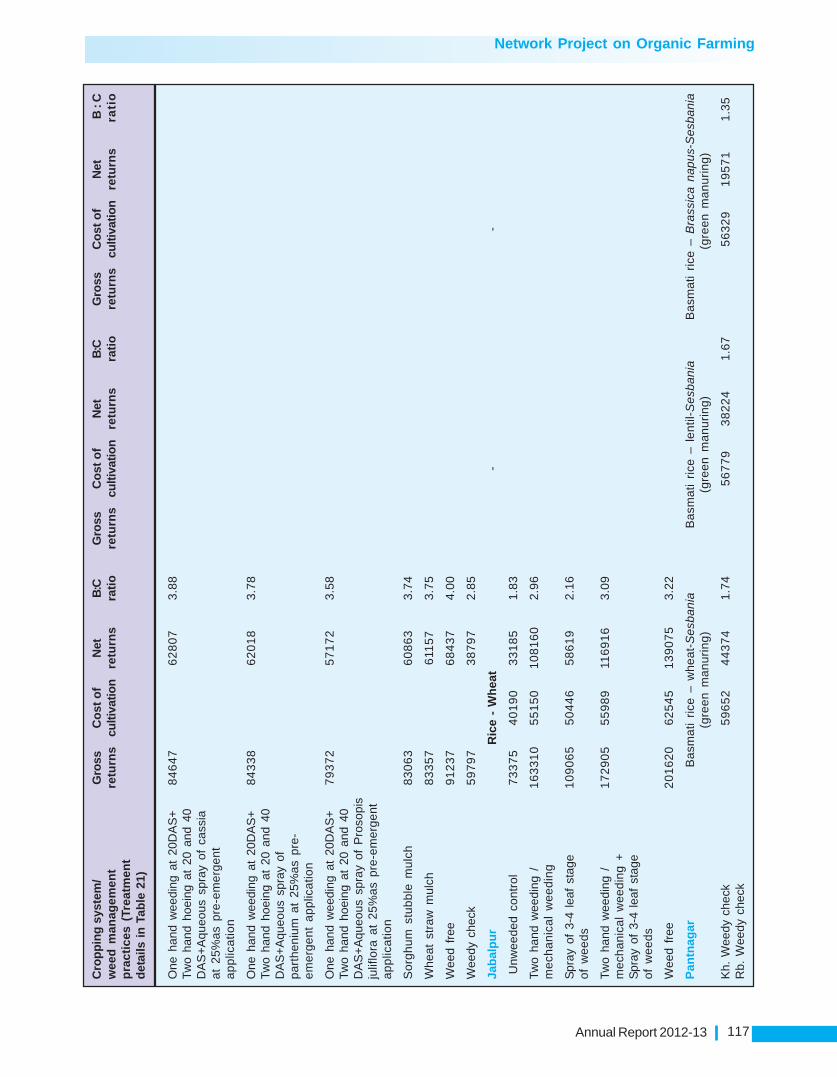
Network Project on Organic Farming
Annual Report 2012-13 117
One
han
d w
eedi
ng a
t 20
DA
S+
84
64
76
28
07
3.88
Two
hand
hoe
ing
at 2
0 an
d 40
DA
S+
Aqu
eous
spr
ay o
f ca
ssia
at 2
5%as
pre
-em
erge
ntap
plic
atio
n
One
han
d w
eedi
ng a
t 20
DA
S+
84
33
86
20
18
3.78
Two
hand
hoe
ing
at 2
0 an
d 40
DA
S+
Aqu
eous
spr
ay o
fpa
rthe
nium
at
25%
as p
re-
emer
gent
app
licat
ion
One
han
d w
eedi
ng a
t 20
DA
S+
79
37
25
71
72
3.58
Two
hand
hoe
ing
at 2
0 an
d 40
DA
S+
Aqu
eous
spr
ay o
f P
roso
pis
julif
lora
at
25%
as p
re-e
mer
gent
appl
icat
ion
Sor
ghum
stu
bble
mul
ch8
30
63
60
86
33.
74
Whe
at s
traw
mul
ch8
33
57
611
57
3.75
Wee
d fr
ee9
12
37
68
43
74.
00
Wee
dy c
heck
59
79
73
87
97
2.85
Jab
alp
ur
Ric
e -
Wh
eat
--
Unw
eede
d co
ntro
l7
33
75
40
19
03
31
85
1.83
Two
hand
wee
ding
/1
63
31
05
51
50
10
81
60
2.96
me
cha
nic
al
we
ed
ing
Spr
ay o
f 3-
4 le
af s
tage
10
90
65
50
44
65
86
19
2.16
of w
eeds
Two
hand
wee
ding
/1
72
90
55
59
89
116
91
63.
09m
echa
nica
l w
eedi
ng +
Spr
ay o
f 3-
4 le
af s
tage
of w
eeds
Wee
d fr
ee2
01
62
06
25
45
13
90
75
3.22
Pan
tnag
arB
asm
ati
rice
– w
heat
-Ses
bani
aB
asm
ati
rice
– l
entil
-Ses
bani
aB
asm
ati
rice
– B
rass
ica
napu
s-S
esba
nia
(gre
en m
anur
ing)
(gre
en m
anur
ing)
(gre
en m
anur
ing)
Kh.
Wee
dy c
heck
59
65
24
43
74
1.74
56
77
93
82
24
1.67
56
32
91
95
71
1.35
Rb.
Wee
dy c
heck
Cro
pp
ing
sys
tem
/G
ross
Co
st o
fN
etB
:CG
ross
Co
st o
fN
etB
:CG
ross
Co
st o
fN
etB
:Cw
eed
man
agem
ent
retu
rns
culti
vatio
nre
turn
sra
tio
retu
rns
culti
vatio
nre
turn
sra
tio
retu
rns
culti
vatio
nre
turn
sra
tio
pra
ctic
es (
Trea
tmen
td
etai
ls i
n T
able
21)

Network Project on Organic Farming
Annual Report 2012-13118
Kh.
Use
of
cono
wee
der
63
52
51
02
58
22.
616
06
52
12
20
15
3.01
60
20
27
65
54
2.27
Rb.
One
HW
at
25-3
0 D
AS
Kh.
One
han
d w
eedi
ng a
t6
51
07
95
99
42.
476
22
34
10
44
70
2.68
61
78
45
47
07
1.88
25-3
0 D
AT
Rb.
Tw
o H
W a
t25
-30&
45-
50 D
AS
Kh.
Tw
o ha
nd w
eedi
ng a
t6
76
89
10
75
59
2.59
61
81
611
68
68
2.89
64
36
67
08
31
2.10
25 &
45-
50 D
AT
Rb.
Sta
lese
ed b
ed +
1H
W a
t 30
-35
DA
S
Rai
pur
Ric
e-m
ust
ard
Wee
dy c
heck
44
71
51
75
79
Kh.
Use
of
cono
wee
der
48
61
54
01
65
with
squ
are
plan
ting
Rb.
Sta
le s
eed
bed
1 H
W a
t 25
-30
DA
T5
07
15
33
47
0
2 H
W a
t 25
-30
and
45-5
0 D
AT
53
71
53
63
92
Aqu
ious
spr
ay a
t 15
-20
51
91
52
85
08
DA
T +
1 H
W a
t 40
-50
DA
T
Ran
chi
Ric
e -
Wh
eat
Ric
e -
Lin
seed
Unw
eede
d C
ontr
ol6
47
63
53
04
111
72
24
73
24
44
24
63
07
8
Two
hand
hoe
ing
25 &
10
48
81
56
99
54
78
86
78
89
04
78
05
31
08
540
DA
T/ D
AS
Aqu
eous
lea
f ex
trac
t at
74
72
85
34
41
21
28
75
47
99
44
64
61
01
53
3-4
leaf
sta
ge o
f w
eeds
.
Two
hand
hoe
ing
25 &
110
95
85
73
95
53
56
28
25
66
48
20
53
43
61
40 D
AT
/ D
AS
+A
queo
usle
af e
xtra
ct a
t 3-
4 le
afst
age
of w
eeds
.
Wee
d fr
ee (
man
ual).
117
47
85
77
87
59
69
28
92
66
48
59
64
06
70
One
han
d w
eedi
ng /
97
68
15
60
77
41
60
47
24
19
47
01
92
54
01
hoei
ng (
25 D
AT
/DA
S)+
Aqu
eous
lea
f ex
trac
t at
3-4
leaf
sta
ge o
f w
eeds
.
Cro
pp
ing
sys
tem
/G
ross
Co
st o
fN
etB
:CG
ross
Co
st o
fN
etB
:CG
ross
Co
st o
fN
etB
:Cw
eed
man
agem
ent
retu
rns
culti
vatio
nre
turn
sra
tio
retu
rns
culti
vatio
nre
turn
sra
tio
retu
rns
culti
vatio
nre
turn
sra
tio
pra
ctic
es (
Trea
tmen
td
etai
ls i
n T
able
21)

Network Project on Organic Farming
Annual Report 2012-13 119
wheat-sesbania (green manure), basmati rice-lentil-sesbania (green manure) and basmati rice-brassicanapus-sesbania (green manure). Observations on weed count, total dry weight, grain, straw yield, soilproperties, NPK uptake by crops along with economics were taken. Total grasses and sedges countduring kharif and broad leaved weeds count during rabi was found to be significantly lower in all the threesystems with one hand weeding at 25-30 DAT during kharif and 2 hand weeding at 25-30 and 45-50DAS during rabi. Across the cropping systems, the reduction of total grasses & sedges and broad leavedweeds was found to be 90.6 and 77.2 % respectively due to 1 hand weeding during kharif and 2 handsweeding during rabi. Among the three cropping systems, basmati rice-wheat-sesbania recorded lowergrasses, sedges and broad leaved weeds compared to other systems. The reduction in total dry weightof weeds during rabi was significantly higher in one hand weeding at 25-30 DAT during kharif and twohand weeding at 25-30 and 45-50 DAS during rabi. The reduction over weedy check was found to be 95,94.4 and 93.1% in basmatirice-wheat-sesbania, basmatirice-lentil-sesbania and basmati rice-brassicanapus-sesbania respectively. More than 50% reduction was also observed in conoweeder + handweeding and hand weeding + stale seed bed techniques.
Significantly higher grain yield of basmati rice in all the three systems during kharif was recordedwith use of conoweeder during kharif and one hand weeding at 25-30 DAS during rabi which registeredon an average 88.4% increase in yield over weedy check. This was closely followed by two hands weedingat 25 & 45-50 DAT in kharif and stale seed bed + one hand weeding at 30-35 DAS during rabi. The yieldof wheat and lentil during rabi was found to be significantly higher with one hand weeding at 25-30DAT inkharif and two hand weeding at 25-30 and 45-50 DAS in rabi. The increase over weedy check was foundto be 75.9, 205.6% and 170.8 respectively for wheat, lentil and Brassica napus. Weedy check registeredsignificantly lower yield in all the three systems. Straw yield of all the crops in the three systems resultedin similar trend as that of grain yield. No significant variation in available soil N, P and K was observed inall the three systems with various weed management packages. Among the three systems residual organiccarbon was found to be higher with basmati rice-lentil-sesbania (green manure) system. Uptake of Nwas numerically higher in one hand weeding at 25-30 DAT in kharif and Two HW at 25-30& 45-50 DASin rabi in basmati rice while it was higher in Weedy check for brassicanapus. Economic analysis indicates,in all the systems, use of conoweeder during kharif and one hand weeding at 25-30 DAS during rabirecorded higher gross, net returns and B: C raio in all the three systems. This was closely followed byone hand weeding during kharif and stale seed bed + 1 hand weeding during rabi. Among the threesystems, basmati rice-wheat-sesbania (green manure) recorded higher net return of Rs 58248 ha-1 withB: C ratio of 1.95. In general use of conoweeder, stale seed bed and hand weeding are found to be suitableweed management technique under organic farming conditions.
Raipur (Table 26, 27, 28, 29 and 32)
Weed management packages comprising of cono weeder with square planting in rice, state seedbed in mustard, aqueous spray and hand weeding along with weedy check was evaluated under rice-mustard system and observations on weed count grain and straw yield along with soil fertility status wererecorded. Maximum reduction in total weed count was observed with use of conoweeder with squareplanting in rice while in mustard it was found with 2 hand weeding at 25-30 and 45-50 DAT (Reduction of68% in rice and 85% in mustard compared to weedy check). Aqueous spray at 15-20 DAT + 1HW at 40-50 DAT recorded 28.6 and 47.6%reduction in rice and mustard respectively. Use of conoweeder withsquare planting in rice contributed for 68% reduction while stale seed bed to mustard resulted in 60%reduction in total weed count. Dry weight of weed also exhibited similar trend as that of weed count. Useof conoweeder with square planting recorded significantly higher yield of rice (3568 kg ha-1) while in mustardit was higher under 2 hand weeding at 25-30 and 45-50 DAT (786 kg ha-1). Aqueous spray and one handweeding recorded 14.7 and 16.8% reduction in yield compared to best performing treatment of conoweederwith square planting and 2 hand weeding to rice and mustard respectively. Straw yield also exhibitedsimilar trend as that of grain yield. Post harvest analysis of soil indicates no significant variation in bulkdensity, pH, EC and available N, P and K. Use of conoweeder with square planting recorded lower organic

Network Project on Organic Farming
Annual Report 2012-13120
carbon of 0.44% while 2 hand wedding and aqueous spray+1 hand weeding package recorded higherorganic carbon content (0.46% in both the treatments). Higher net return of rice-mustard system Rs.40165 ha-1 was recorded with conoweeder+square planting in rice and stale bed in mustard.
Ranchi (Table 27, 28, 29, 30 and 32)
Four weed management packages involving hand hoeing, use of aqueous leaf extract and handweeding were evaluate along with weed free and unweeded control in rice-wheat and rice-linseed system.Observations on weed dry weight, grain, straw yield, NPK uptake and economics were taken. Two handhoeing at 25 and 40 DAS/DAT with use of aqueous leaf extract registered significantly lower weed dryweight in both the system. (On an average reduction of 87.2% in rice, 77.7% in wheat and 83.5% inlinseed compared to unweeded control). It was at par with two hand hoeing 25 and 40 DAS/DAT. In allthe crops in the systems, weed free recorded higher grain yield followed by two hand hoeing at 25 and40 DAT/DAS with aqueous leaf extract spray at 3-4 leaf stage. Spray of aqueous leaf extract alone recordedreduction in yield to the tune of 34.8% in rice, 42.6% in wheat and 51.1% in linseed. Keeping the fieldfree from weeds gave yield advantage of 83.4% in rice, 88.8% in wheat and 114% in linseed over unweededcontrol. Similar trend was observed for straw yield of all the crops. Keeping the field free from weedsthrough hand weeding recorded higher NPK uptake in all the crops, this was closely followed by twohand hoeing + aqueous leaf extract spray at 3-4 leaf stage of weeds. In both rice-wheat and rice-linseedsystem, weed free recorded higher net return of Rs 59692 and 34361 ha-1 and B: C ratio of 2.03 and1.84 respectively followed by two hand weeding and aqueous leaf extract spray (Net return of Rs 53562and 48205 ha-1 respectively in rice-wheat and rice-linseed). Unweeded control and spray of aqueous leafextract resulted in lower net returns and B:C ratio indicating loss, over investment.
Umiam (Table 28 and 29)
Six weed control treatments involving mechanical weeding (20 DAS) + hand weeding once (60 DAS),mulching with fresh Eupatorium/Ambrosia @ 10 t ha-1 (after earthing up), aqueous leaf extract spray oflantana and pine spp. at 3-4 leaf stage of weed, hand weeding twice at 20 and 40 DAS, aqueous leafextract spray of lantana and pine+2 hand weeding and soybean green manure incorporation insitu (1:1)+ one hand weeding was evaluated along with weed free and weedy checks in maize (green cob)- mustardsystem. Observations on grain, straw yield and post harvest soil parameters were taken. In both maize(green cobs) and mustard, mulching with fresh eupatorium ambrosia @ 10 t ha-1 (after earthing up)recorded higher yield followed by aqueous leaf extract spray of lantana and pine spp. at 3-4 leaf stage ofweed. The increase in yield under mulching with fresh Eupatorium/Ambrosia was found to be 19.4 and29.8% in maize and 39.5 and 66.8% in mustard over weed free and weedy checks respectively. Twohand weeding along with aqueous leaf extract spray of lantana and pine and mechanical weeding + onehand weeding to both the crops was more effective than two hand weeding (20 and 40 DAS) alone. Insitu incorporation of soybean green manure and hand weeding recorded lower yield compared to mulchingor aqueous leaf extract spray. Straw yield also exhibited the similar trend. Post harvest analysis of soilsample indicates, bulk density was lower in mulching with Eupatorium/Ambrosia (1.18 g/cc). Soil was inacidic condition and no significant variation in pH was observed. Organic carbon content of soil rangedfrom 2.21 to 3.18% in various treatments and mulching with fresh Eupatorium/Ambrosia @ 10 t ha-1
recorded the higher organic carbon followed by insitu incorporation of soybean as green manure + onehand weeding (2.63%). Residual available N (276 kg ha-1) was higher with mechanical weeding (20DAS)+ hand weeding once (60 DAS) and weed free check which was followed by mulching with freshEupatorium/Ambrosia @ 10 t ha-1 (270 kg ha-1). Available P in soil was higher with aqueous leaf extractspray of lantana and pine spp. at 3-4 leaf stage while K was higher in mulching with fresh Eupatorium/Ambrosia @ 10 t ha-1.

Network Project on Organic Farming
Annual Report 2012-13 121
8. PUBLICATION AND HUMAN RESOURCEDEVELOPMENT
8.1 List of Publications
Research Papers
Subbarao, A., Singh AB and K. Ramesh (2011) Nutrient management strategies for organic package ofpractices. In: Proceedings of International Conference on Organic Bihar. June 22-24, 2011 p. 23-35.
Upadhyay, V B., Vikas Jain, S. K. Vishwakarma and A.K.Kumhar (2011) .Production potential, soil health,water productivity and economics of rice (Oryza sativa)–based cropping systems under differentnutrient sources. Indian Journal of Agronomy. 56 (4): 311-316.
Book Chapters
Singh AB and Subba Rao A (2011). Efficient Methods of Organic Wastes Recycling for SustainableAgriculture. In: Recycling Organic wastes Soil Health and Productivity. Published by Agrotech publishingAcademy Udaipur, pp 1-344.
Subba Rao, Ramesh P, Sammi Reddy K, Singh AB and Ramesh K (2011) Soil fertility Management andSoil Quality Under organic Farming. In: Recycling Organic wastes Soil Health and Productivity.Published by Agro-tech Publishing Academy Udaipur, pp 1-344.
Singh AB (2011). Chemical and Biochemical quality assessment of compost prepared from organic wastes.In: Efficient Utilization of Farm Wastes for Sustainable Agriculture. Published by Agro-tech publishingAcademy Udaipur, pp 1-328.
Presentation in Symposium/ Conferences
Singh AB, Ramesh K and Subba Rao A (2011). Nutrient Management Options in Organic Farming. In:State Level Seminar on “Soil Health, Sustainability and Food Security” at Dr Balsaheb Sawant KonkanKrishi Vidyapeeth, Dapoli Distt. Ratnagiri (M. S), held during January 21-22, 2011.
Ramesh K, AB Singh, S Ramana, Brijlal Lakaria, Dasrath Singh and Kuldeep S Solanki (2011). Chickpearesponses to organic farming under conserved soil moisture. 76th ISSS convention held during 16-19, Nov 2011 at UAS, Dharward. P.14
Ramesh K, AB Singh, S. Ramana and NR Panwar (2011). Soybean yields in soybean based croppingsystems under organic, inorganic and integrated nutrient management systems. National symposiumcum brain storming workshop on Organic agriculture, 19-20 Apr 2011, CSKHPKV, Palampur, HP p.48
Singh AB, K.Ramesh, S. Ramana, NR Panwar and A Subba Rao (2011) Improving Soybean quality underOrganic Farming in soybean based cropping systems. Paper presented at National symposiumcum brain storming workshop on Organic agriculture, 19-20 Apr 2011, CSKHPKV, Palampur, HP p.47

Network Project on Organic Farming
Annual Report 2012-13122
Brij Lal Lakaria, K. Ramesh, A.B. Singh, J.K .Thakur and S. Ramana (2012). Phosphorus and potassiumdynamics in soybean based cropping systems under different nutrient management options in avertisol.
A. K. Jha, Upadhyay, V. B. and Vishwakarma, S. K. (2011). Diversification through selection vegetablecrops for maximizing the productivity and soil health indifferent rice based cropping system underthe organic farming. Paper presented in “National Symposium on Vegetable Biodiversity” organizedbyIndian Society of Vegetable Science, Varansi held at Jawaharlal Nehru KrishiVishwaVidyalaya, Jabalpur (M.P.) on 4-5 April 2011
Pamphlets
Singh AB, Ramana S, Brij Lal Lakaria, Ramesh K and Thakur JK (2012). Soybean ke Jaivik Kheti. Publishedby IISS, Bhopal.
Singh AB, Ramana S, Ramesh P, Panwar NR, Brij Lal Lakaria, Ramesh K and Thakur JK (2012). Isabgolke Jaivik Kheti. Published by IISS, Bhopal.
Singh AB, Ramana S, Brij Lal Lakaria, Ramesh K and Thakur JK, Ramesh P and Panwar NR (2012).Durum wheat ke Jaivik Kheti. Published by IISS, Bhopal.
Singh AB (2012). Vermicopmosting (Hindi & English). Published by Indian Institute of Soil Science Bhopal
A.B. Singh, N.R. Panwar, P. Ramesh, S. Ramanna, K. Ramesh and J.K. Thakur (2012). Chana ki jaivikkheti, Published by Indian Institute of Soil Science Bhopal.
A.B. Singh, N.R. Panwar, P. Ramesh, S. Ramanna, K. Ramesh and J.K. Thakur (2012). Sarson ki jaivikkheti, Published by Indian Institute of Soil Science Bhopal.
8.2 Human Resource Development
1. M.sc /Ph.D. thesis generated from the project
S.No. Name & Year Thesis title Degree
Jabalpur
1. Ms. Such Gangwar Agronomic evaluation of biodynamic product and panchgavya Ph Dfor organic calculation of important cropping system
2. Ms Megha Dubey Studies on comparative efficiency of organic, chemical and Ph.Dintegrated nutrient management practices on soil health andcrop productivity under various cropping system
2. Participation of Scientists in Seminars/workshops
S.No. Title of the Programme Name of theScientists
Bajaura
1. International Conference on Preparing Agriculture for Climate Change organized by Crop Improvement Dr. D.K. ParmarSociety of India on February 6-8, 2011 at PAU Ludhiana, India
2. National Symposium cum Brainstorming Workshop on Organic Agriculture Organised by Organic Dr. J.K. SharmaAgricultural Society of India, Palampur; ICAR, New Delhi; National Centre of Organic Farming, Dr. D.R. ThakurGaziabad (UP) and CSKHPKV, Palampur on April 19-20, 2011 at CSKHPKV, Palampur Dr. D.K. Parmar
Dr. (Mrs.) Brij Bala

Network Project on Organic Farming
Annual Report 2012-13 123
3. Human Resource Development in organic farming (Farmers) at Bhopal
Name of the Organization Beneficiaries Coordinating Duration of Training imparted on(No) Scientist the training
Purvi Champaran Distt. Bihar 25 Dr A. B Singh September, Organic farming and variousunder ATMA Project (16-21, 2011) technologies developed in the
institute
Gaya Distt. Bihar under ATMA 25 Dr A. B Singh 26/09/2011 to Organic farming and variousProject 01/10/2011 technologies developed in the
institute
Saran Distt. Bihar under ATMA Project 25 Dr A. B Singh October 10-15, Organic farming and various2011 technologies developed in the
institute
Darbhanga Distt. Bihar under 25 Dr A. B Singh December 1-6, Organic farming and variousATMA Project 2011 technologies developed in the
institute
Diara Development Project Patna, 25 Dr A. B Singh December 26- Organic farming and variousBihar 30, 2011 technologies developed in the
institute
Supoul Distt. Bihar under ATMA 25 Dr A. B Singh January 15-20, Organic farming and variousProject 2012 technologies developed in the
institute
Supoul Distt. Bihar under ATMA 25 Dr A. B Singh February 02-07, Organic farming and variousProject 2012 technologies developed in the
institute
Raisen Distt. Madhya Pradesh 25 Dr A. B Singh March 15-19, Organic farming and Soil health inATMA Project 2012 the institute.
Banka Distt. Bihar under ATMA 25 Dr A. B Singh June 2-7, 2012 Organic farming and Soil health inthe institute
4. Human Resource Development in organic farming (Technical) for students at Bhopal
Name of college Details of training programme Coordinating Duration TopicScientist
Govt. Geetanjali Girls 12 students of B.Sc. IIIrd Semester. Dr. A.B. Singh 10 days Vermicomposting andcollege, Bhopal Vermiculture technique
Govt. Geetanjali Girls 13 students of B.Sc. vth Semester. Dr. A.B. Singh 10 days Vermicomposting andcollege, Bhopal Vermiculture technique

Network Project on Organic Farming
Annual Report 2012-13124
9. APPENDIX
Details of crops and varieties used in experiment at variouslocations
Crop Variety Duration / days
Bajaura
Tomato (Summer) No.7711/Roma/Naveen/Heem Sona MediumFrench bean (Summer) Falguni MediumCauliflower (Summer) Megha MediumFrench bean (Kharif) Falguni MediumCauliflower (Kharif) Swati MediumFrench bean (Kharif) Pole Type MediumMaize (Kharif) Bajaura Makka MediumPea (Rabi) Azad P-1/GC-477/DPP-68 MediumCauliflower (Rabi) Swati MediumGarlic (Rabi) GHC-1 LongCoriander (Kharif) Hybrid 363 Medium
Bhopal
Soybean JS-335Duram wheat HI-8498Mustard Pusa BoldChickpea JG-130Linseed JL-9
Calicut
Ginger Varada, Rejatha and Mahima ShortTurmeric Alleppey Supreme,Prathibha ShortBlack pepper Sreekara, Panniyur -1 Long
Coimbatore
Green manure (Sun hemp) CO 1 45Cotton MCU 12/Suraj 167/170Maize CO1 93Chillies K1 170Sunflower CO 4 92Brinjal CO 2 170Sunflower CO 4 92Daincha (GM) Local 63Rice White Ponni 141Greengram CO 6 64
Dharwad
Groundnut GPBD-4 105-110 daysRabi sorghum DSV-4 MediumSoybean JS-335 85-90 daysDurum wheat DWR-2006 85-90 daysPotato Kufri Jawahar 85-90 daysChickpea JG-11 85-90 daysCotton DHB-915 175-180 daysPea Arka komal 60 daysMaize Arjun 110-115 daysChilli+onion Byadagi dabbi+Arka kalyani MediumSugar Cane CO86032Soybean DSB-121
DSB-8

Network Project on Organic Farming
Annual Report 2012-13 125
DSB-21DSB-16DSB-18JS-335 85-90 days
Groundnut Dh 4-3Dh 86Dh 2000-1Dh 101Mutant IIIJL 24TMV 2TGLPS 3GPBD 4GPBD 5 105-110 days
Chickpea JJ-11 LongBGD-103A-1 -BG-1105 -BG-256 -ICCV-10 -KAK-2 -ICCV-2 -
French bean Arka Komal
Jabalpur
Basmati rice PB 127Wheat MPO-1106 140Chickpea JG-322 128Berseem JB-1/JB-5 174/160Vegetable pea Arkel 98Sesame TKG-55 123Sorghum MP Chari 51Sun hemp Local 47
Karjat
Rice Karjat - 4 EarlyGroundnut SB-XI EarlyMaize (Sweet corn) Sugar-75 EarlyMustard Varuna EarlyDolichos bean(Green pod vegetable) Konkan Bhushan EarlyRed pumpkin MPH 1 MediumCucumber Himangi MediumGreen gram VaishaliMango Alphonso 15 years old mango trees
Ludhiana
Cotton F-1861Chickpea GPP-2/BG-1053Maize Peral Popcorn/PMH-1/J-1006Basmati rice PB-2Wheat PBW-550Summer moong SML-668Turmeric LocalOnion Pb.NaroyaPotato Kufri JyotiBajra PCB-164 ShortCowpea CL-367 ShortSorghum SL-44 ShortGuara Guara-80 Short
Crop Variety Duration / days

Network Project on Organic Farming
Annual Report 2012-13126
Berseem BL-10 ShortOats OL-9 Short
Modipuram
Basmati rice Basmati 370 / PB-2 /120Rice Saket-4Maize cob Star-56Maize grain Star-56Wheat PBW-343Barley AjadMustard Pusa Bold 115Radish Ivory WhitePotato Chipsona-3Okra Arka AnamikaGreen gram SML-668Chickpea Avrodhi 160Cowpea Pusa barsati
Pantnagar
Sesbania Ses pant - 1Rice Pusa Basmati -1/ Pusa-1121 MediumWheat PBW-343/ PBW-502 MediumLentil Pant Lentil - 406 MediumVegetable pea Arkel EarlyBrassica napus GLS-1 MediumChick pea Pant Kabuli Chana-1Maize GauravMoong Pant Moong-5
Raipur
Soybean JS – 335 MediumBerseem JB-2 MediumIsabgol GI-2 MediumOnion Nasik red MediumSafflower NARI-NH 1 MediumRice Kasturi MediumChickpea Vaibhav MediumMustard Pusa bold MediumLentil JL-1 Medium
Ranchi
Rice Birsamati 125 - 135 (Medium)Wheat K- 9107 130Potato Kufri Ashoka 95Linseed Shekhar 140Lentil PL 406 115
Umiam
Maize (green cob/seed) DA61-A 80/110 daysSoybean JS-80-21 40 days/142daysFrenchbean Naga local 100 days/120daysToria M-27 127 daysTomato Avinash-2 140 days/105daysPotato Kufri jyoti 110 daysRice IR-64/Lumpnah/Vivek dham/Sahsarang-1/Bhalum-1 140days/140days/
135days/140days/125daysCarrot New curoda 98days
Crop Variety Duration / days

Network Project on Organic Farming
Annual Report 2012-13 127
10. ANNEXURE
Contact Address of Centres
PDFSR, Modipuram
Dr B. Gangwar, Project Director, Project Directorate for Farming Systems Research, Modipuram, Meerut-250 110, U.P. Tel: (Off.)0121- 295 6318; (Mob.) 09412202070; (Fax) 0121-288 8546, Email:[email protected], [email protected]
Dr N. Ravisankar, Principal Scientist & National PI, NPOF, Project Directorate for Farming SystemsResearch, Modipuram, Meerut-250 110, U.P. Tel: (Off.) 0121-288 8571; (Mob.) 08755195404, (Fax) 0121-288 8546, Email: [email protected]
Principal Investigators at Centres
Dr D.K. Singh, Principal Investigator, NPOF, Department of Agronomy, College of Agriculture, GBPUA&T,Pantnagar-263145, District-Udhamsinghnagar 263 145 (Uttarakhand), Tel: (Off.)05944-233625; (Mob.)09411320066; (Fax) 05944-233608/233473, Email:[email protected]
Dr D.R. Thakur, Senior Agronomist and Principal Investigator (NPOF), CSKHPKV, HAREC, Bajaura(Kullu) HP-175125, Phone: 09418183548 E mail : [email protected]
Dr G.P. Pali, Chief Agronomist, AICRP on IFS & PI (NPOF), Indira Gandhi Krishi Vishwa Vidyalaya, KrishakNagar,Raipur-492 001 (Chhattishgarh) Tel: (Off.) 0771-2442177, (Mob.) 09425524749, (Fax) 0771-2442131,Email:[email protected]
Dr V.K. Shukla, Chief Agronomist, AICRP-IFS, Department of Agronomy, JNKVV, Adhartal, Jabalpur-482004 (M.P.) Tel.: (Off.) 0761- 2681773, 2680771. 0761-2647670 (Mob.) 09424306503 , (Fax) 0761-2481236,Email: [email protected]
Dr L.S. Chavan, Chief Agronomist,AICRP-IFS & Principal Investigator, NPOF, Agricultural ResearchStation Karjat-410 201 Dist. Raigad (Maharashtra), Tel.: (Off.) 02148-222072, (Mob.) 09850971545, (Fax)02148-222035, Email:[email protected],
Dr C.S. Aulakh, Sr. Agronomist, PI, NPOF, Department of Agronomy, PAU, Ludhiana-141 004 (Punjab),Tel.: (Off.) 0161-2401960, Ext.-308, (Mob.) 9888350044, (Fax) 0161-2400945, Email:[email protected]
Dr S. Ramasamy, Professor and Head, PI, NPOF, Department of Sustainable Organic Agriculture,TNAU, Coimbatore-641 003 (T.N.), (Mob.) 09443724294, (Fax) 0422-6611246, Email: [email protected]
Dr Lokanath Malligawad, Professor & PI-NPOF, Institute of Organic Farming, U.A.S., YettinaguddaCampus, Krishinagar, Dharwad-580 005, Karnataka, Tel.: (Off.) 0836-2448566/2448321*305; (Mob.)09448591719; (Fax) 0836-2748377/2448349, Email:[email protected]
Dr C.S. Singh, Jr. Scientist cum Asstt. Prof. Department of Agronomy, Birsa Agricultural University, Kanke,Ranchi-834 006 (Jharkhand), Tel.: (Off.) 0651-2450608; (Mob.) 09431314755; (Fax) 0651-2451106,Email:[email protected]

Network Project on Organic Farming
Annual Report 2012-13128
Dr A.B. Singh, Principal Scientist & PI, NPOF, Indian Institute of Soil Sciences, Nabi, Bagh, BerasiaRoad, Bhopal-462 038 (M.P.) Tel: (Off.) 0755- 2730970 / 2733341 / 2733372 / 2734221; (Mob.) 09425013470;E mail: [email protected]
Dr C.K. Thangamani, Principal Scientist & PI NPOF, Indian Institute of Spices Research, P.B.No.1701,Marikunnu PO, Calicut-673 012 (Kerala), Tel.: (Off.) 0495 - 2731410, (Mob.) 09495083552, (Fax) 0495-2730294, Email: [email protected]
Dr Anup Das, Sr. Scientist (Agronomy) ICAR Research Complex for NEH Region Umroi Road, Umiam-793 103, (Meghalaya), Tel: (Off.) 0364-2570306; (Mob.) 09436336070; (Fax) 0364-2570306,Email:[email protected]
Dr N.K. Jat, Scientist, & PI, NPOF, PDFSR, Modipuram, Meerut-250110, U.P., Tel: (Off.) 0121-288 8571;(Mob.) 07895517934; (Fax) 0121-288 8546, Email: [email protected]

Network Project on Organic Farming
Annual Report 2012-13 129
ACRONYMS
ALE : Aquous leaf extract
ASE : Aquous seed extract
B:C : Benefit:Cost
BD : Biodynamic
CC : Cost of cultivation
CDM : Cowdung manure
Cu : Copper
EC : Enriched compost
ECe : Electrical conductivity
fb : followed by
Fe : Iron
FYM : Farm yard manure
GLM : Green leaf manure
GM : Green manure
GR : Gross returns
IM : Integrated management
K : Potassium
KC : Karanj cake
Mn : Manganese
MOP : Muriate of potash
N : Nitrogen
NC : Neem coated
NEOC: Non edible oil cakes
NPV : Nuclear Polyhedrosis virus
NR : Net returns
OC : Organic carbon
P : Phosphorus
PG : Panchagavya
pH : Negative logarithum of hydrogen ionconcentration
PPM : Parts per million
RP : Rock phosphate
SSP : Single super phosphate
VC : Vermicompost
Zn : Zinc

NOTES

