netpoirot: taking the blame game out of data center operations€¦ · netpoirot: taking the blame...
TRANSCRIPT
NetPoirot: Taking The Blame Game Out of Data Center Operations
Behnaz Arzani, Selim Ciraci, Boon Thau Loo,
Assaf Schuster, Geoff Outhred
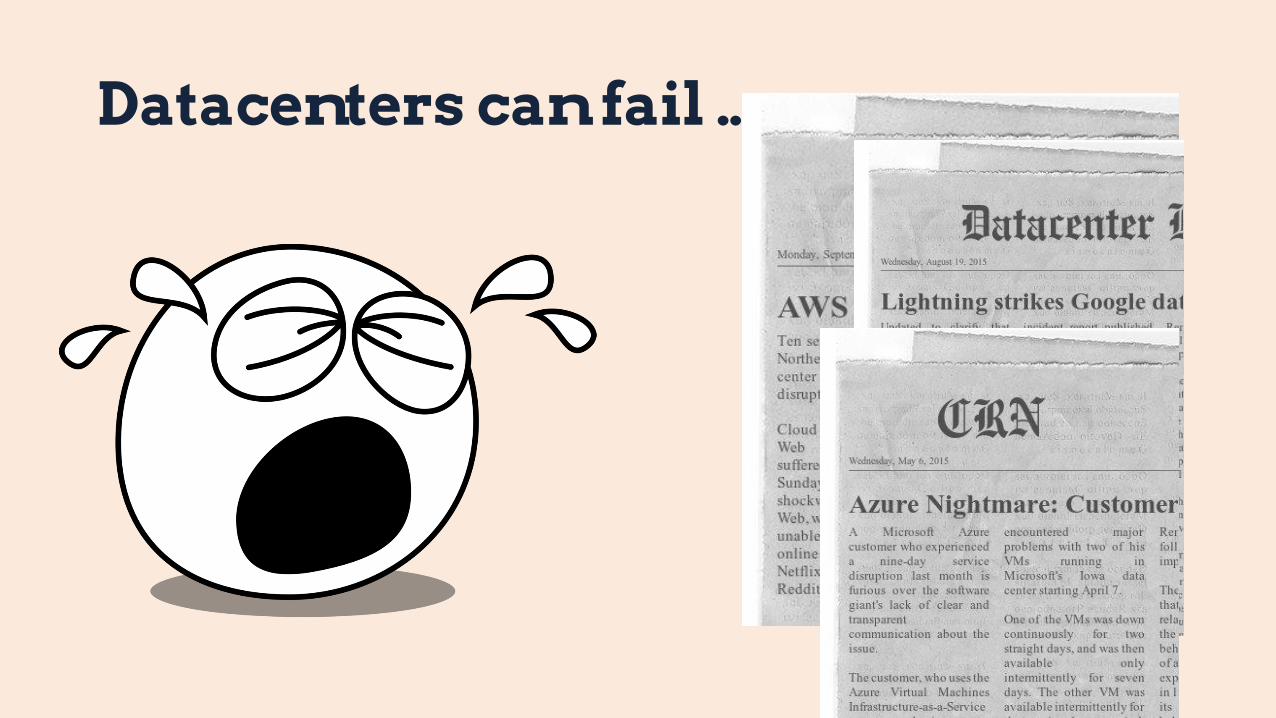
Datacenters can fail …
2
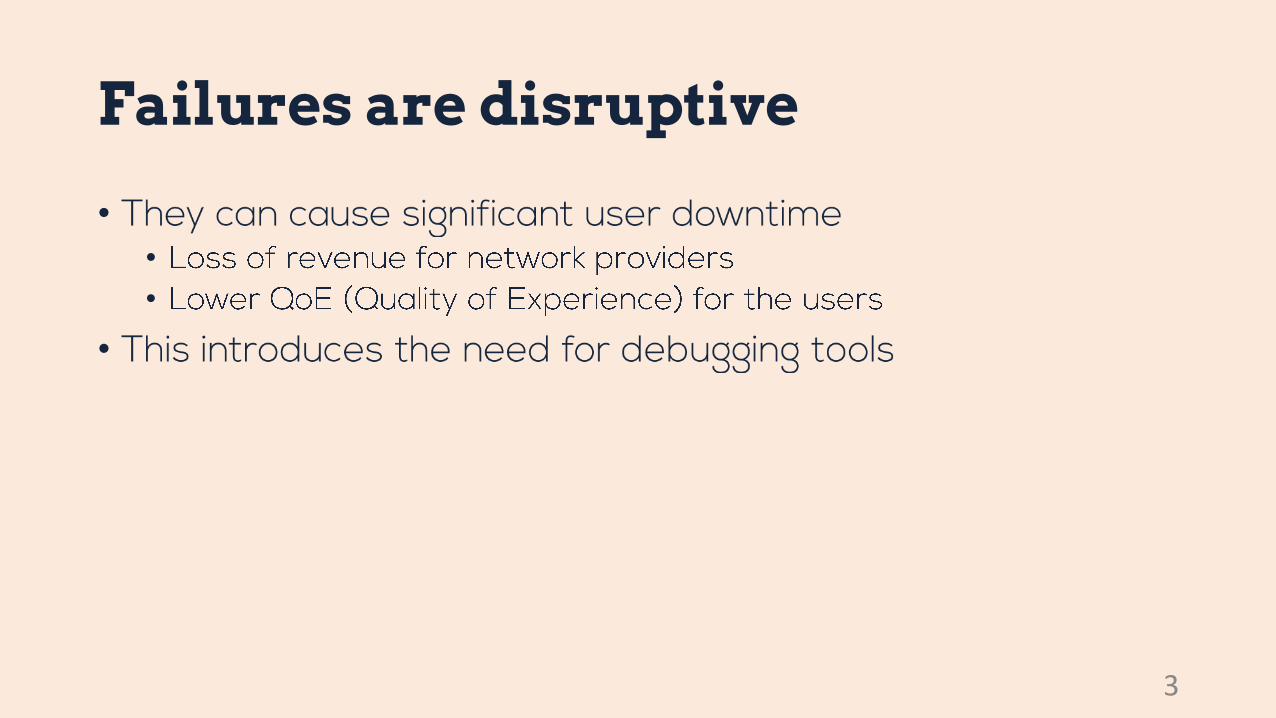
Failures are disruptive
••
•
•
3

Why is debugging hard?
4
Penn researcher
Azure VM Azure Network Service X
Network
NetworkNetwork
`
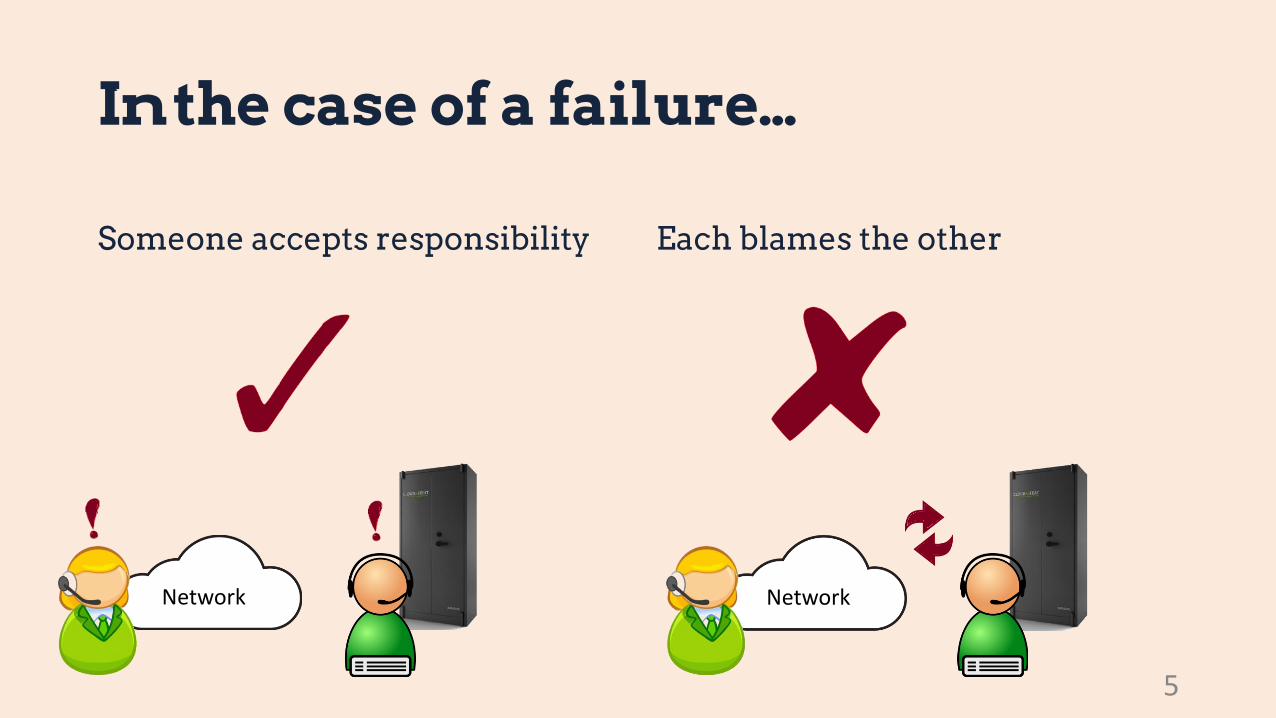
Someone accepts responsibility Each blames the other
5
In the case of a failure…

A real example… Event X
•
••
•
6
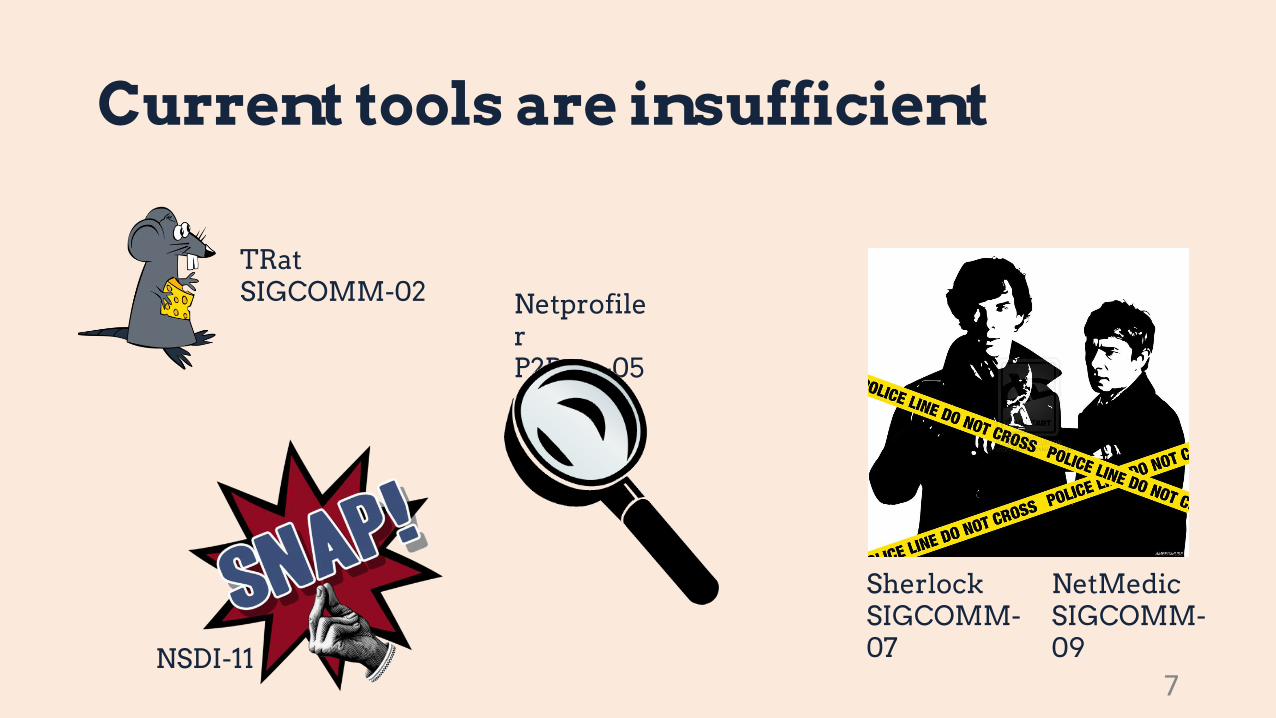
Current tools are insufficient
SherlockSIGCOMM-07
NetMedicSIGCOMM-09NSDI-11
TRatSIGCOMM-02 Netprofile
rP2Psys-05
7

Can we do better? (Overview)
• Introducing…
8
NetPoirot
Fault injector
Learning Agent
The monitoring agent
•
•
•
••
•
•
9
What is the TCP event digest?
•
•
•
10

Why do we think this can work?
••
•
•
••
11

To distinguish failures…
•
••
12

Decision trees…
•
13His uncertainty is X

Decision trees…
••
14His uncertainty is X-Y

Decision trees alone are not enough
15
Decision trees alone are not enough
16

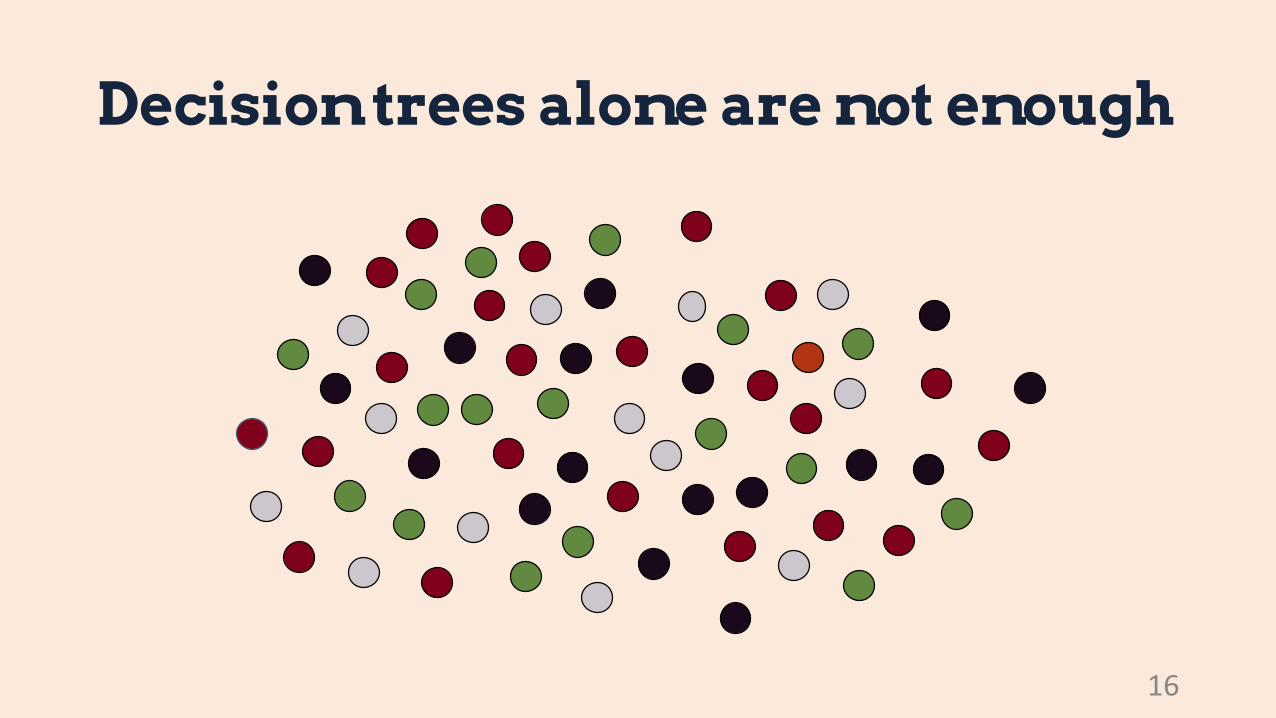
Decision trees alone are not enough
17Feature 1
Fe
atu
re 2

Decision trees alone are not enough
Easiest to
18
Hardest to classify
Fe
atu
re 2
Feature 1

What we do to deal with this
19
Fe
atu
re 2
Feature 1

Upper portion of an example tree…
20
Mean of max congestion window
Min of the last congestion window
50th percentile of number of triple duplicate ACKs
50th percentile of connection duration
Max of the number of triple duplicate Acks
95th percentile of the max congestion window
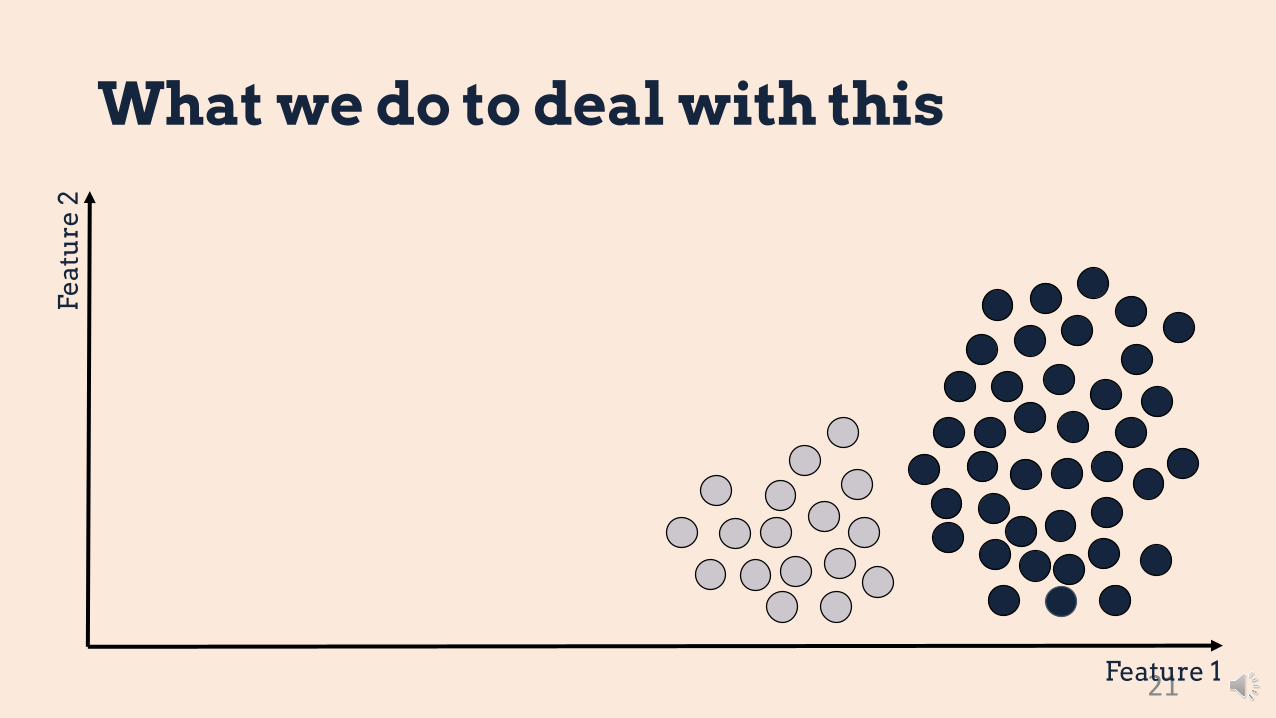
What we do to deal with this
21
Fe
atu
re 2
Feature 1
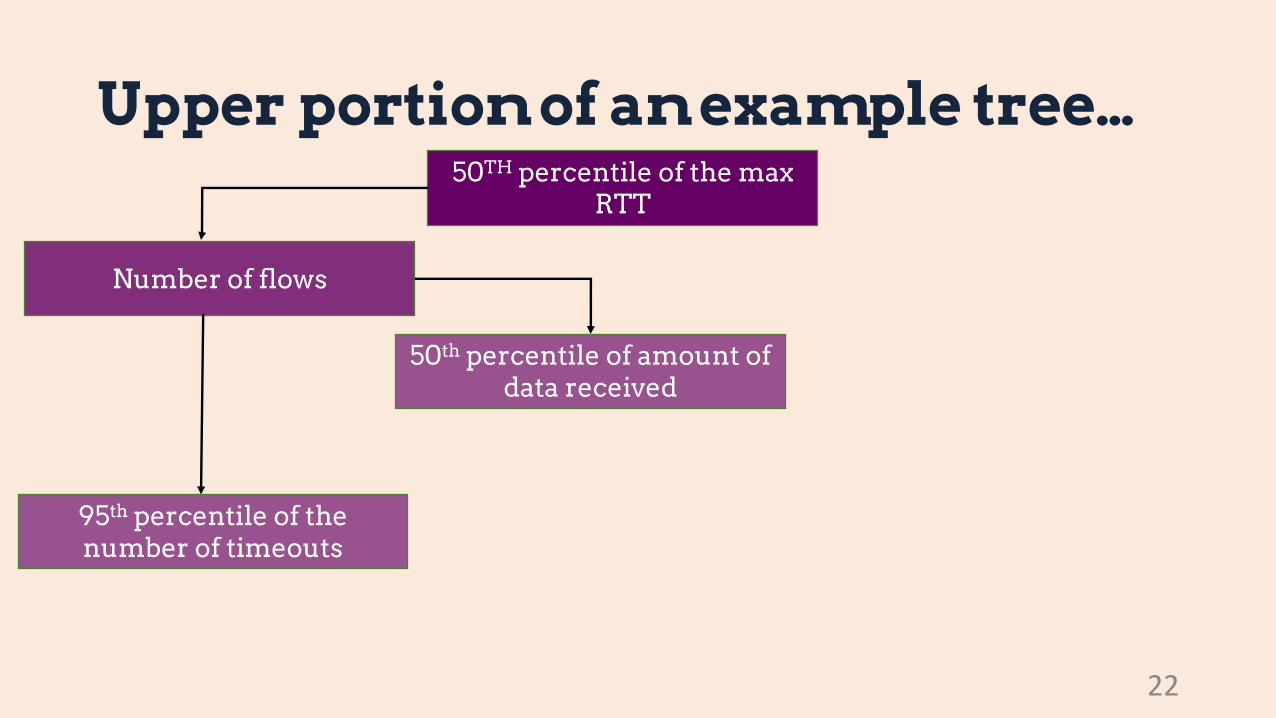
Upper portion of an example tree…
22
50TH percentile of the max RTT
Number of flows
50th percentile of amount of data received
95th percentile of the number of timeouts

Decision trees alone are not enough
23Feature 1
Fe
atu
re 2

The upper portion of an example tree…
24
Mean time spent in zero window probing
95th percentile of the ratio of number of bytes posted
to received
Number of flows
Number of flows
95th percentile of connection durations
Minimum of the number of bytes received
25
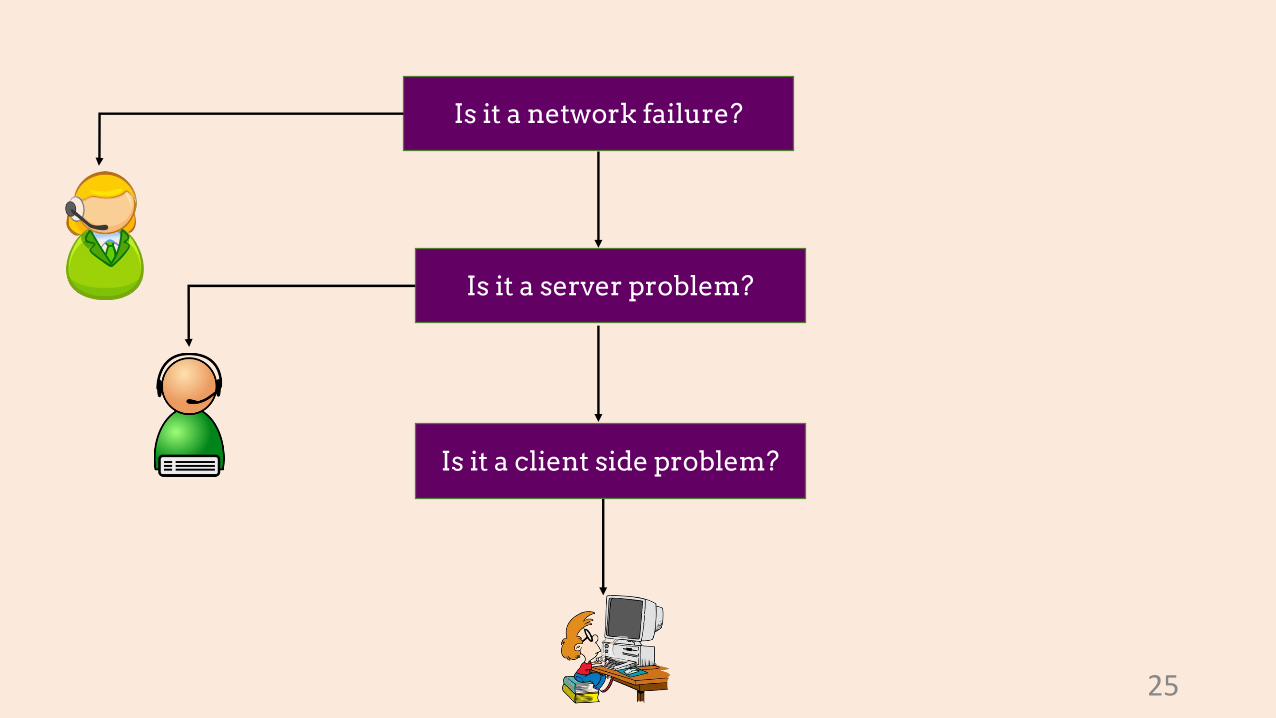
Is it a network failure?
Is it a server problem?
Is it a client side problem?
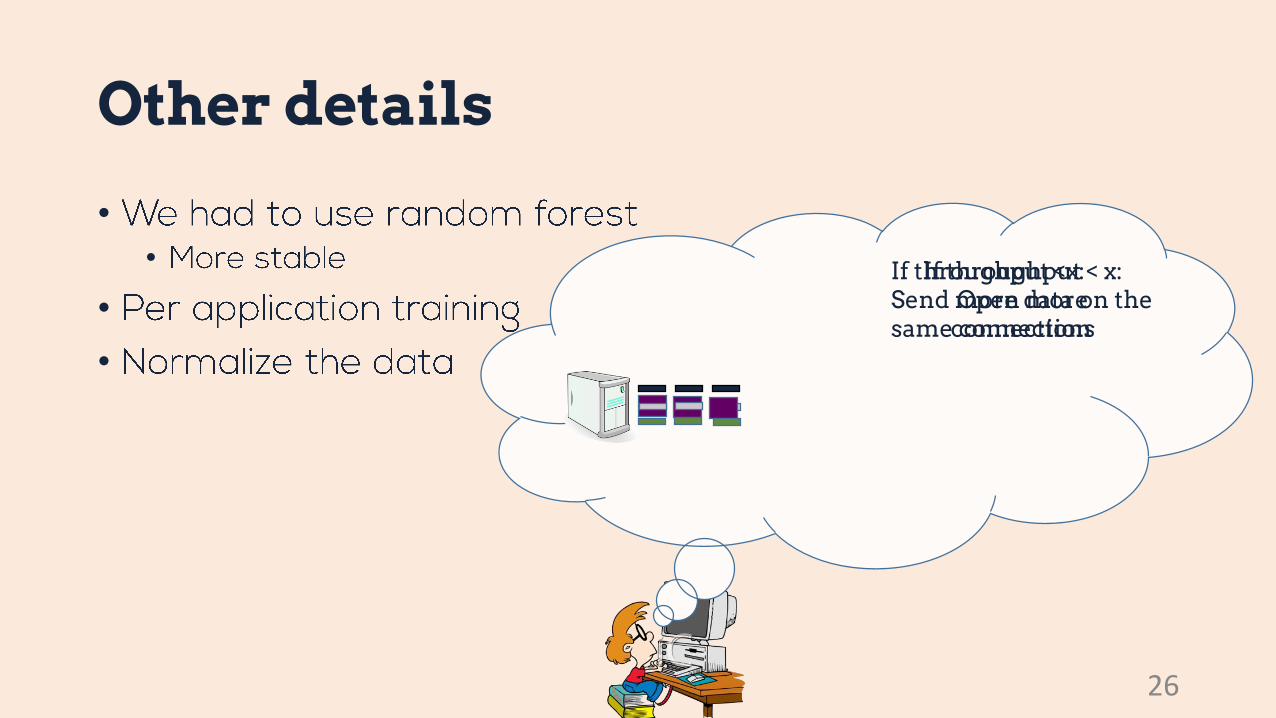
Other details
••
•
•
26
If throughput < x:Open more
connections
If throughput <x:Send more data on the same connection
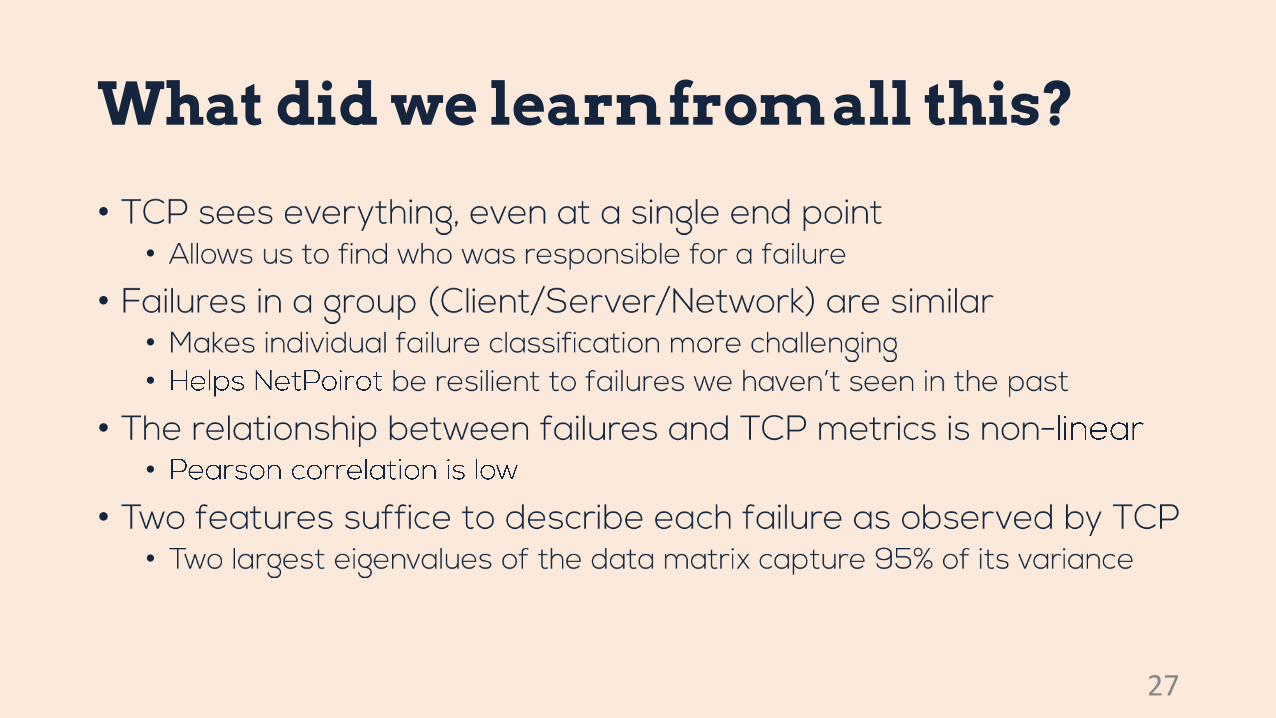
What did we learn from all this?
••
••
•
••
••
27

Evaluation
••
•
•
••
•
28

How did we get labeled data?
•
•
••
•
•
•
29
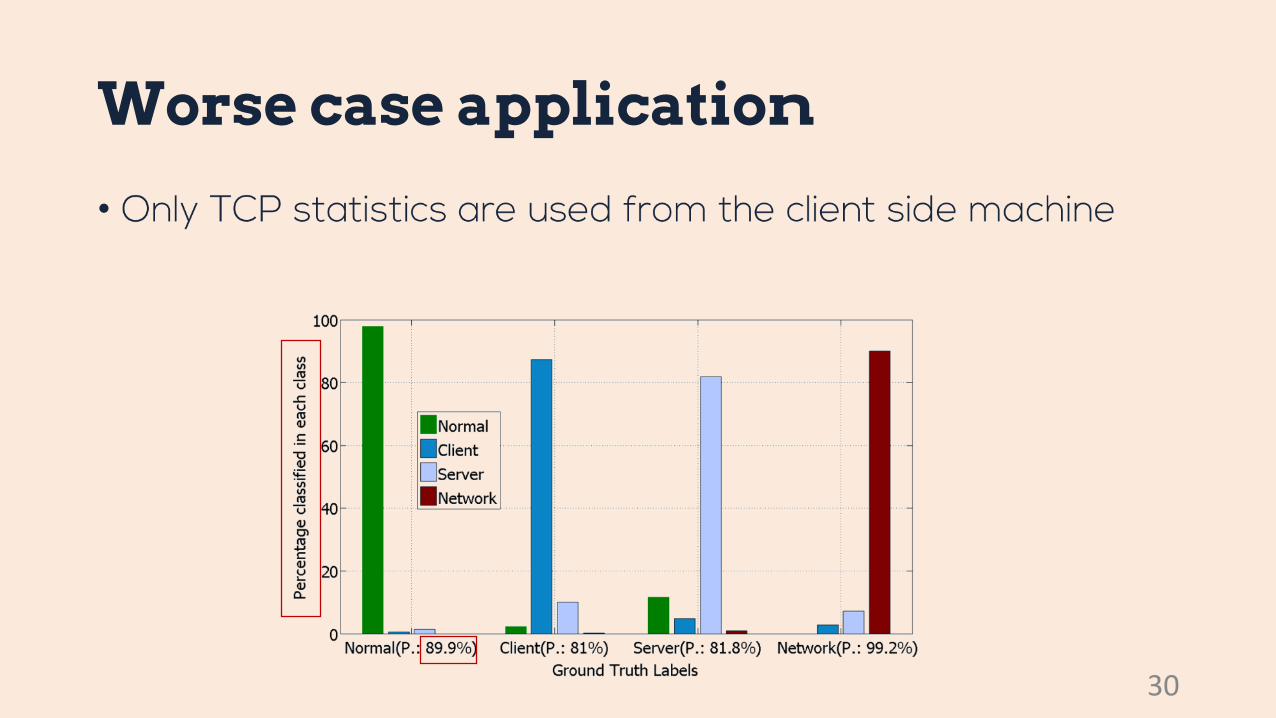
Worse case application
•
30

What if we haven’t seen the failure before?
31

Performance on real applications
32
General label
Normal Client Network
Precision
97.78% 99.7% 100%
Recall 99.68% 98.25% 99.37
YouTube
Event X

Things we did not talk about
•
•
•
•
•
33

What’s next?
••
••
34

Conclusion
•
•
35