net sales operating profit (ebit ... - mb.cision.commb.cision.com/main/10773/2506006/829952.pdf ·...
TRANSCRIPT

1 SOLNA, APRIL 26, 2018
REPORT ON THE
FIRST QUARTER 2018
NET SALES
4,442 SEK MILLION
(3,443)
OPERATING PROFIT (EBIT)
638 SEK MILLION
(418)
OPERATING CASH FLOW
-27 SEK MILLION
(-44)
FIRST QUARTER
• Net sales for the quarter totaled SEK 4,442 m (3,443); an increase of 29%, of which 10% organic, -2% currency translation and 21% M&A.
• Operating profit (EBIT) for the quarter amounted to SEK 638 m (418), an increase of 53% including SeaStar. This represents a margin of 14.4% (12.1%). Excluding SeaStar, EBIT increased by 26%.
• There were no items affecting comparability in the quarter.
• Cash flow for the quarter improved to SEK -116 m (-384).
• Operating cash flow for the quarter improved to SEK -27 m (-44).
• Profit for the quarter increased by 27%, to SEK 375 m (296).
• Earnings per share increased by 27%, to SEK 1.27 (1.00).
FINANCIAL OVERVIEW
Q1 Q1 LTM FY
SEK m 2018 2017 2018 2017
Net sales 4,442 3,443 15,043 14,044
EBITDA 761 495 2,494 2,228
% of net sales 17.1% 14.4% 16.6% 15.9%
Operating profit (EBIT) 638 418 2,127 1,907
% of net sales 14.4% 12.1% 14.1% 13.6%
Operating profit (EBIT) before items affecting comparability 638 418 2,081 1,860
% of net sales 14.4% 12.1% 13.8% 13.2%
Profit for the period 375 296 1,574 1,495
Earnings per share, SEK 1.27 1.00 5.32 5.05
Cash flow for the period -116 -384 -149 -417
Operating cash flow⁽¹⁾ -27 -44 1,744 1,727
Core working capital 4,298 3,239 4,298 3,376
Capital expenditure in fixed assets -78 -63 -321 -306
RoOC 32.3% 31.2% 32.3% 33.0%
⁽¹⁾Net cash flow from operations after investments in fixed assets and excluding income tax paid.
DOMETIC INTERIM REPORT – Q1 2018
2
HEALTHY START TO 2018
Net sales (SEK m)
Operating profit (EBIT) before i.a.c (SEK m)
Dometic had a positive start to the year, with our efficiency and pricing initiatives
beginning to generate results. Sales were strong, despite fewer working days
due to Easter and cold weather in Americas and EMEA. Total sales growth was
29 percent, of which 10 percent was organic. The EBIT margin grew by 2.3
percentage points, whereof 0.4 percentage points were contributed by SeaStar.
The integration of SeaStar is progressing according to plan and performance is
in line with expectations.
Americas showed strong RV development and a good performance from
SeaStar. Total sales growth was 52 percent, of which 12 percent was organic.
The EBIT margin improved by 3.7 percentage points, of which 0.2 percentage
points related to SeaStar. The outlook for the RV and Marine markets remains
positive.
EMEA reported organic growth of 6 percent and an EBIT margin improvement
of 1.7 percentage points. I am especially pleased to see positive effects from
our efficiency and pricing improvements in the region. Aftermarket performed
well, particularly in RV AM and Retail.
APAC reported organic growth of 16 percent. The EBIT margin declined by 1.6
percentage points, mainly due to the geographical mix. We saw strong
development in China, Korea and Taiwan, all growing at double-digit rates
driven by RV, Retail and Lodging.
Cash flow was in line with our expectations. Leverage was at 3.4x at the end of
the quarter and we will now begin deleveraging based on the seasonally strong
cash flow in the coming quarters.
Our short-term priorities are to improve margins through further efficiency gains,
compensate the commodity cost increases through pricing, focus on cash flow
and deleveraging.
Strategically, we are currently emphasizing three areas: growth, innovation and
competitive cost base. We have initiated a number of activities to support
further growth and improved profitability.
During the quarter we appointed a new CTO, an important step as part of our
ambition to improve process ownership and increase speed and efficiency in
product development and innovation.
The outlook for our combined businesses remains positive with an estimated
organic growth in line with our target of 5 percent. With the acquisition of
SeaStar, combined with continued efficiency improvements, we are aiming at
reaching our target of 15 percent EBIT margin during 2018. Leverage is
expected to be around 2.5x by the end of 2018.
Juan Vargues, President and CEO
0
2,000
4,000
6,000
8,000
10,000
12,000
14,000
16,000
0
500
1,000
1,500
2,000
2,500
3,000
3,500
4,000
4,500
5,000
2016Q1
2016Q2
2016Q3
2016Q4
2017Q1
2017Q2
2017Q3
2017Q4
2018Q1
RTQ
Quarterly net sales
Rolling 12-month net sales
0
500
1,000
1,500
2,000
2,500
0
100
200
300
400
500
600
700
2016Q1
2016Q2
2016Q3
2016Q4
2017Q1
2017Q2
2017Q3
2017Q4
2018Q1
RTQ
Quarterly EBIT before i.a.c.
Rolling 12-month EBIT before i.a.c.

DOMETIC INTERIM REPORT – Q1 2018
3
FINANCIAL SUMMARY – FIRST QUARTER
Net sales totaled SEK 4,442 m (3,443), an increase of
29% compared to the same quarter the previous year. This is
made up of 10% organic growth, -2% currency translation
and 21% M&A.
Operating profit (EBIT) totaled SEK 638 m (418), an
increase of 53% compared to the same quarter the previous
year. The EBIT margin was 14.4% (12.1%).
Items affecting comparability totaled SEK 0 m (0).
Financial items amounted to a net of SEK -127 m (-31),
including SEK -96 m in interest on external bank loans (-26)
and SEK 1 m for revaluation of unrealized exchange gains
on cash (6). Other FX revaluations and other items
amounted to SEK -35 m (-11) and financial income to
SEK 3 m (0).
Taxes totaled SEK -136 m (-91), corresponding to
27% (24%) of profit before tax. Current tax amounted to SEK
-66 m (-52) and deferred tax to SEK -70 m (-39). Paid tax of
19% is higher compared to the same quarter the previous
year, mainly due to withholding tax on a dividend distribution
from Hong Kong and higher paid tax in SeaStar’s Canadian
business.
Profit for the quarter totaled SEK 375 m (296).
Earnings per share amounted to SEK 1.27 (1.00).
Operating cash flow totaled SEK -27 m (-44). The
improvement mainly derives from stronger operating profit.
Cash flow for the quarter of SEK -116 m (-384)
includes a positive impact of SEK 62 m related to the final
payment from relocation of a manufacturing facility in China
in the third quarter of 2017. During the first quarter, a deposit
of SEK 233 m has been made for an ongoing tax audit in
Hong Kong.
Financial position. Leverage was 3.4x (1.8) at the end of
the first quarter of 2018.
EVENTS AFTER THE QUARTER.
At the 2018 Annual General Meeting held on April 10, Fredrik
Cappelen was re-elected as member and Chairman of the
Board. Jacqueline Hoogerbrugge, Rainer E. Schmückle, Erik
Olsson, Peter Sjölander, Heléne Vibbleus and Magnus
Yngen were re-elected as members of the Board of
Directors. The proposed dividend of SEK 2,05 per share was
adopted.
Q1 Q1 LTM FY
SEK m 2018 2017 Rep. Adj.⁽¹⁾ 2018 2017
Americas ⁽³⁾ 2,287 1,506 52% 63% 7,110 6,329
EMEA 1,696 1,527 11% 7% 6,131 5,962
Asia Pacific 459 410 12% 17% 1,802 1,753
Net sales 4,442 3,443 29% 31% 15,043 14,044
Americas ⁽³⁾ 334 164 104% 120% 1,055 885
EMEA 209 162 29% 26% 665 618
Asia Pacific 95 92 4% 9% 360 357
Operating profit (EBIT) bef. i.a.c.⁽²⁾ 638 418 53% 58% 2,081 1,860
Americas ⁽³⁾ 14.6% 10.9% 14.8% 14.0%
EMEA 12.3% 10.6% 10.8% 10.4%
Asia Pacific 20.8% 22.4% 20.0% 20.4%
Operating profit % bef. i.a.c.⁽²⁾ 14.4% 12.1% 13.8% 13.2%
⁽¹⁾Represents change in comparable currency. ⁽²⁾Before items affecting comparability. ⁽³⁾Including SeaStar Solutions.
Change (%)

DOMETIC INTERIM REPORT – Q1 2018
4
AMERICAS
Net sales (SEK m)
Sales split AM/OEM
Q1
NET SALES
2,287 SEK MILLION
(1,506)
OPERATING PROFIT (EBIT)¹
334 SEK MILLION
(164)
OPERATING MARGIN (EBIT%)¹
14.6%
(10.9%)
¹ Before i.a.c.
NET SALES AND OPERATING PROFIT (EBIT)
First quarter 2018
Americas reported net sales of SEK 2,287 m (1,506), representing 52% of Group
sales. Total growth was 52%, of which 12% was organic, -7% currency translation
and 47% M&A.
Operating profit (EBIT) before i.a.c. totaled SEK 334 m (164); an increase of 104%
compared to the same quarter the previous year. The EBIT margin was 14.6%
(10.9%).
Market development
In the US, growth in the volume of RV shipments from OEM manufacturers to
dealers remains strong. For the January – February period 2018, RV shipments
increased by 17% to 85,479 units compared with the same period the previous
year. For the rolling three-months December 2017 – February 2018, RV shipments
increased by 15% to 121,706 units.
Sales of US power boats increased by 3% for the rolling 12-months period from
April 2017 – March 2018.
Business highlights, Q1
Total OEM growth was 53%, of which growth in constant currency adjusted for the
acquisition of SeaStar was 18%.
Total Aftermarket growth was 48%, of which growth in constant currency adjusted
for the acquisition of SeaStar was -6%.
RV OEM reported strong sales. High growth for refrigerators and air conditioners.
Marine OEM excluding SeaStar reported slightly negative growth.
CPV OEM reported modest growth.
Aftermarket excluding SeaStar reported negative growth, mainly because RV AM
sales was impacted by cold weather. Retail and Lodging showed strong growth.
Proceedings related to the putative class action complaints continue. During the
quarter, Dometic was successful in defeating the plaintiffs’ request for multi-district
litigation in California. The California courts then granted Dometic’s requests to
transfer the cases pending in California to the Southern District of Florida.
Consequently, the proceedings filed in California are now only pending in the
Southern District of Florida in front of the same judge who previously granted
summary judgment for Dometic. Dometic awaits a decision from this judge as to
whether the cases will be consolidated for unified proceedings.
During the quarter, Dometic was reimbursed for a certain portion of its defense
costs related to the class actions complaints. Total reimbursement from the
insurance company amounted to SEK 29 m, with a net positive net effect on EBIT
of SEK 22 m.
We remain firm in our position that the allegations in the cases are without merit.
0
1,000
2,000
3,000
4,000
5,000
6,000
7,000
8,000
0
500
1,000
1,500
2,000
2,500
2016Q1
2016Q2
2016Q3
2016Q4
2017Q1
2017Q2
2017Q3
2017Q4
2018Q1
RTQ
Quarterly net sales
Rolling 12-month net sales
OEM
76%
(75%)
AM
24%
(25%)

DOMETIC INTERIM REPORT – Q1 2018
5
EMEA
Net sales (SEK m)
Sales split AM/OEM
Q1
NET SALES
1,696 SEK MILLION
(1,527)
OPERATING PROFIT (EBIT)¹
209 SEK MILLION
(162)
OPERATING MARGIN (EBIT%)¹
12.3%
(10.6%)
NET SALES AND OPERATING PROFIT (EBIT)
First quarter 2018
EMEA reported net sales of SEK 1,696 m (1,527), representing 38% of Group
sales. Total growth was 11%, of which 6% was organic, 4% currency translation
and 1% M&A.
Operating profit (EBIT) before i.a.c. totaled SEK 209 m (162); an increase of 29%
compared to the same quarter the previous year. The EBIT margin was 12.3%
(10.6%). The EMEA profitability improvement program is progressing according to
plan.
Market development
During the January 2018 – March 2018 period, RV registrations in the largest
European markets, excluding the UK and Spain, increased by 16% to 30,722 units.
Heavy truck registrations increased by 3% in the rolling three-months period from
December 2017 – February 2018, compared with the same period the previous
year.
Business highlights, Q1
Total OEM growth was 11%, of which growth in constant currency was 7%.
Total Aftermarket growth was 11%, of which growth in constant currency was 7%.
RV OEM reported good sales growth. Demand remained positive on key European
markets.
Marine OEM reported good sales growth. Positive impact from the Oceanair
acquisition in Q1 2017.
CPV OEM reported strong sales growth. High demand in the passenger vehicle
segment and a solid performance in the commercial vehicle segment.
Aftermarket reported strong growth, mainly due to good performance in Retail, and
RV AM.
¹ Before i.a.c.
0
1,000
2,000
3,000
4,000
5,000
6,000
7,000
0
500
1,000
1,500
2,000
2016Q1
2016Q2
2016Q3
2016Q4
2017Q1
2017Q2
2017Q3
2017Q4
2018Q1
RTQ
Quarterly net sales
Rolling 12-month net sales
OEM
54%
(55%)
AM
46%
(45%)

DOMETIC INTERIM REPORT – Q1 2018
6
APAC
Net sales (SEK m)
Sales split AM/OEM
Q1
NET SALES
459 SEK MILLION
(410)
OPERATING PROFIT (EBIT)¹
95 SEK MILLION
(92)
OPERATING MARGIN (EBIT%)¹
20.8%
(22.4%)
¹ Before i.a.c.
NET SALES AND OPERATING PROFIT (EBIT)
First quarter 2018
APAC reported net sales of SEK 459 m (410), representing 10% of Group sales.
Total growth was 12%, of which 16% was organic, -4% currency translation and 0%
M&A.
Operating profit (EBIT) before i.a.c. totaled SEK 95 m (92); an increase of 4%
compared to the same quarter the previous year. The EBIT margin was 20.8%
(22.4%).
Market development
For the January – February 2018 period, statistics on Australian domestic RV
production showed an increase of 12% to 3,127 units. RV production increased by
10% to 4,650 units in the rolling three-months period from December 2017 –
February 2018.
Business highlights, Q1
Total OEM growth was 14%, of which growth in constant currency was 19%.
Total Aftermarket growth was 10%, of which growth in constant currency was 15%.
RV OEM reported strong growth. Performance was particularly good in China.
Continued good performance in Australia.
Marine OEM reported high growth. General good performance across the region
and especially strong in Taiwan.
CPV OEM reported very high growth, driven by continued strong sales in China.
Aftermarket reported strong development. Growth was mainly driven by the Retail,
RV AM and lodging business.
0
300
600
900
1,200
1,500
1,800
2,100
0
100
200
300
400
500
600
2016Q1
2016Q2
2016Q3
2016Q4
2017Q1
2017Q2
2017Q3
2017Q4
2018Q1
RTQ
Quarterly net sales
Rolling 12-month net sales
OEM
47%
(46%)
AM
53%
(54%)

DOMETIC INTERIM REPORT – Q1 2018
7
PARENT COMPANY DOMETIC GROUP AB
(PUBL)
First quarter
The Parent Company Dometic Group AB (publ)
comprises the functions of the Group’s head office, such
as Group-wide management and administration. The
Parent Company invoices its costs to Group companies.
For the first quarter of 2018, the Parent Company had an
operating profit of SEK 0 m (-4), including administrative
expenses of SEK -37 m (-36) and other operating income
of SEK 37 m (32), of which the full amount relates to
income from Group companies.
Profit (loss) from financial items totaled SEK -206 m (15),
including interest income from Group companies of SEK
56 m (25), interest expenses to Group companies of SEK
0 m (0) and other financial income and expenses of SEK
-263 m (-10).
Profit (loss) for the period totaled SEK -1 m (11).
For further information, please refer to the Parent
Company’s condensed financial statements on page 11.
Solna, April 26, 2018
Juan Vargues
President and CEO
REPORT OF REVIEW OF INTERIM FINANCIAL
INFORMATION REPORT
Dometic Group AB (publ) reg. no. 556829-4390
Introduction
We have reviewed the condensed interim financial
information (interim report) of Dometic Group AB (publ)
as of 31 March 2018 and the three-month period then
ended. The board of directors and the CEO are
responsible for the preparation and presentation of the
interim financial information in accordance with IAS 34
and the Swedish Annual Accounts Act. Our responsibility
is to express a conclusion on this interim report based on
our review.
Scope of Review
We conducted our review in accordance with the
International Standard on Review Engagements ISRE
2410, Review of Interim Report Performed by the
Independent Auditor of the Entity. A review consists of
making inquiries, primarily of persons responsible for
financial and accounting matters, and applying analytical
and other review procedures. A review is substantially
less in scope than an audit conducted in accordance with
International Standards on Auditing, ISA, and other
generally accepted auditing standards in Sweden. The
procedures performed in a review do not enable us to
obtain assurance that we would become aware of all
significant matters that might be identified in an audit.
Accordingly, we do not express an audit opinion.
Conclusion Based on our review, nothing has come to our attention
that causes us to believe that the interim report is not
prepared, in all material respects, in accordance with IAS
34 and the Swedish Annual Accounts Act, regarding the
Group, and with the Swedish Annual Accounts Act,
regarding the Parent Company.
Stockholm, 26 April 2018
PricewaterhouseCoopers AB
Anna Rosendal
Authorized Public Accountant
Auditor in charge

DOMETIC INTERIM REPORT – Q1 2018
8
CONSOLIDATED INCOME STATEMENT
CONSOLIDATED STATEMENT OF
COMPREHENSIVE INCOME
Q1 Q1 FY
SEK m 2018 2017 2017
Net sales 4,442 3,443 14,044
Cost of goods sold -3,064 -2,359 -9,599
Gross Profit 1,378 1,084 4,445
Sales expenses -527 -451 -1,791
Administrative expenses -191 -188 -667
Other operating income and expenses 30 -9 -52
Items affecting comparability 0 0 47
Amortization of acquisition related intangible assets -51 -18 -76
Operating profit 638 418 1,907
Financial income 3 0 6
Financial expenses -130 -31 -212
Loss from financial items -127 -31 -206
Profit before tax 511 387 1,700
Taxes -136 -91 -206
Profit for the period 375 296 1,495
Profit for the period attributable to owners of the Parent Company 375 296 1,495
Earnings per share before and after dilution effects, SEK - Owners of
the Parent Company
1.27 1.00 5.05
Number of shares, million 295.8 295.8 295.8
Q1 Q1 FY
SEK m 2018 2017 2017
Profit for the period 375 296 1,495
Other comprehensive income
Items that will not be reclassified subsequently to profit or loss:
Remeasurements of defined benefit pension plans, net of tax 21 -2 0
21 -2 0
Items that may be reclassified subsequently to profit or loss:
Cash flow hedges, net of tax 34 5 25
Gains/losses from hedges of net investments in foreign operations,
net of tax -65 -17 66
Exchange rate differences on translation of foreign operations 303 35 -502
272 23 -411
Other comprehensive income for the period 293 21 -411
Total comprehensive income for the period 668 317 1,084
Total comprehensive income for the period attributable to owners of the
Parent Company 668 317 1,084

DOMETIC INTERIM REPORT – Q1 2018
9
CONSOLIDATED
BALANCE SHEET (IN SUMMARY)
SEK m
ASSETS
Non-current assets
Goodwill and trademarks 17,363 12,872 17,016
Other intangible assets 4,237 1,040 4,260
Tangible assets 2,016 1,588 1,952
Deferred tax assets 842 1,183 897
Derivatives, long-term 11 6 1
Other non-current assets 69 53 65
Total non-current assets 24,538 16,742 24,191
Current assets
Inventories 3,701 2,785 3,350
Trade receivables 2,159 1,699 1,485
Current tax assets 188 51 180
Derivatives, short-term 152 36 90
Other current assets 586 261 418
Prepaid expenses and accrued income 148 106 132
Cash and cash equivalents 1,066 1,213 1,159
Total current assets 8,000 6,151 6,814
TOTAL ASSETS 32,538 22,893 31,005
EQUITY AND LIABILITIES
EQUITY 15,182 14,294 14,514
LIABILITIES
Non-current liabilities
Liabilities to credit institutions, long-term 9,962 4,332 9,810
Deferred tax liabilities 1,930 607 1,901
Other non-current liabilities 41 17 –
Provisions for pensions 681 534 687
Other provisions, long-term 148 106 131
Total non-current liabilities 12,762 5,596 12,529
Current liabilities
Liabilities to credit institutions, short-term 1,182 321 733
Trade payables 1,562 1,244 1,459
Current tax liabilities 328 352 371
Advance payments from customers 29 28 23
Derivatives, short-term 34 27 45
Other provisions, short-term 302 218 289
Other current liabilities 306 181 264
Accrued expenses and prepaid income 852 632 778
Total current liabilities 4,594 3,003 3,962
TOTAL LIABILITIES 17,356 8,599 16,491
TOTAL EQUITY AND LIABILITIES 32,538 22,893 31,005
Mar 31,
2018
Mar 31,
2017
Dec 31,
2017
DOMETIC INTERIM REPORT – Q1 2018
10
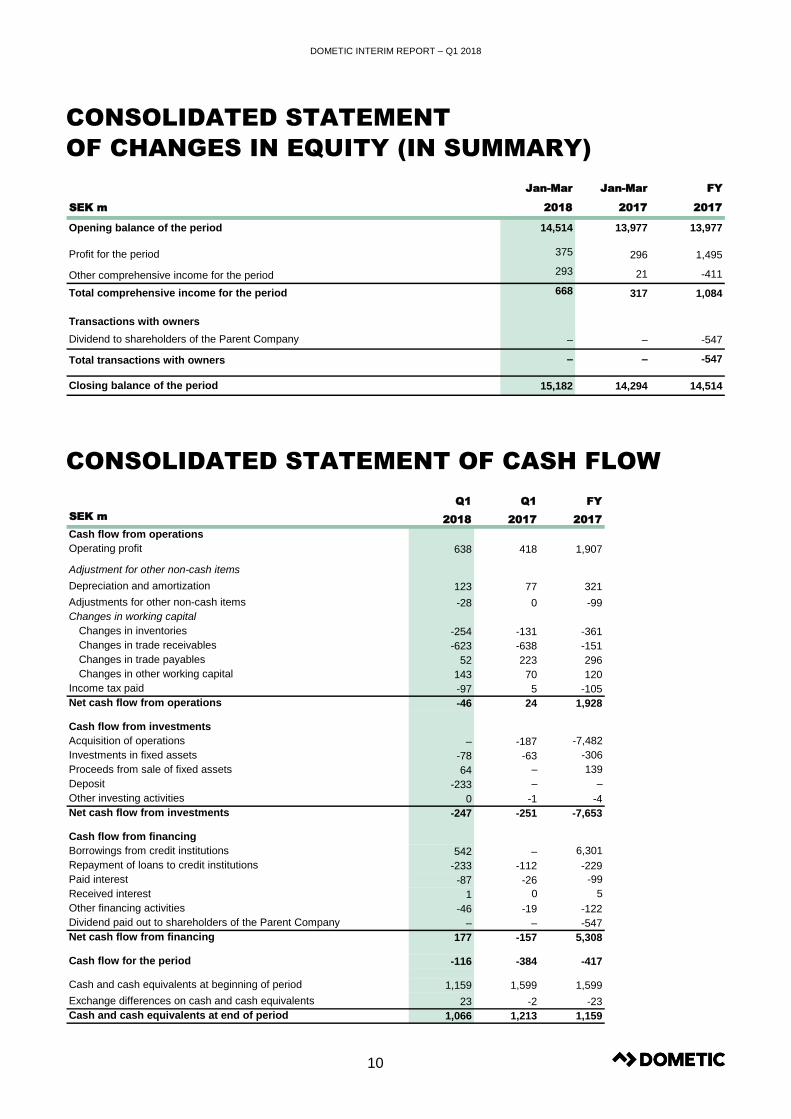
CONSOLIDATED STATEMENT
OF CHANGES IN EQUITY (IN SUMMARY)
CONSOLIDATED STATEMENT OF CASH FLOW
Jan-Mar Jan-Mar FY
SEK m 2018 2017 2017
Opening balance of the period 14,514 13,977 13,977
Profit for the period 375 296 1,495
Other comprehensive income for the period 293 21 -411
Total comprehensive income for the period 668 317 1,084
Transactions with owners
Dividend to shareholders of the Parent Company – – -547
Total transactions with owners – – -547
Closing balance of the period 15,182 14,294 14,514
Q1 Q1 FY
SEK m2018 2017 2017
Cash flow from operations
Operating profit 638 418 1,907
Adjustment for other non-cash items
Depreciation and amortization 123 77 321
Adjustments for other non-cash items -28 0 -99
Changes in working capital
Changes in inventories -254 -131 -361
Changes in trade receivables -623 -638 -151
Changes in trade payables 52 223 296
Changes in other working capital 143 70 120
Income tax paid -97 5 -105
Net cash flow from operations -46 24 1,928
Cash flow from investments
Acquisition of operations – -187 -7,482
Investments in fixed assets -78 -63 -306
Proceeds from sale of fixed assets 64 – 139
Deposit -233 – –
Other investing activities 0 -1 -4
Net cash flow from investments -247 -251 -7,653
Cash flow from financing
Borrowings from credit institutions 542 – 6,301
Repayment of loans to credit institutions -233 -112 -229
Paid interest -87 -26 -99
Received interest 1 0 5
Other financing activities -46 -19 -122
Dividend paid out to shareholders of the Parent Company – – -547
Net cash flow from financing 177 -157 5,308
Cash flow for the period -116 -384 -417
Cash and cash equivalents at beginning of period 1,159 1,599 1,599
Exchange differences on cash and cash equivalents 23 -2 -23
Cash and cash equivalents at end of period 1,066 1,213 1,159

DOMETIC INTERIM REPORT – Q1 2018
11
PARENT COMPANY
INCOME STATEMENT
PARENT COMPANY
BALANCE SHEET (IN SUMMARY)
Q1 Q1 FY
SEK m 2018 2017 2017
Administrative expenses -37 -36 -133
Other operating income 37 32 130
Operating profit 0 -4 -3
Interest income subsidiaries 56 25 50
Interest expenses subsidiaries 0 0 –
Other financial income and expenses -263 -10 -77
Profit (loss) from financial items -206 15 -28
Group contributions 205 – -157
Profit (loss) before tax -1 11 -188
Taxes 0 0 2
Profit (loss) for the period -1 11 -186
SEK m
ASSETS
Shares in subsidiaries 16,622 13,563 16,622
Other non-current assets 5,203 17 5,116
Total non-current assets 21,825 13,580 21,738
Current assets 1,274 2,628 893
TOTAL ASSETS 23,099 16,208 22,631
EQUITY 10,843 11,590 10,845
PROVISIONS
Provisions 30 14 27
Total provisions 30 14 27
LIABILITIES
Non-current liabilities 9,962 4,332 9,810
Total non-current liabilities 9,962 4,332 9,810
Current liabilities 2,264 272 1,949
Total current liabilities 2,264 272 1,949
TOTAL EQUITY AND LIABILITIES 23,099 16,208 22,631
Mar 31,
2018
Mar 31,
2017
Dec 31,
2017

DOMETIC INTERIM REPORT – Q1 2018
12
CONDENSED NOTES
NOTE 1 | ACCOUNTING PRINCIPLES
Dometic Group AB (publ) (“Dometic”) applies International
Financial Reporting Standards (IFRS), as adopted by the EU.
This consolidated Interim Financial Report has been prepared in
accordance with IAS 34 ‘Interim Financial Reporting’. The
Swedish Annual Accounts Act and RFR 2 Accounting for Legal
Entities, issued by the Swedish Financial Reporting Board, have
been applied for the Parent Company. The interim report
comprises pages 1-19 and pages 1-7 are thus an integral part of
this financial report (IAS 34.16A).
Totals quoted in tables and statements may not always be the
exact sum of the individual items because of rounding
differences. The aim is for each line item to correspond to its
source, and rounding differences may therefore arise.
New and amended accounting policies for 2018 adopted by
the Group
The Group has adopted IFRS 15 Revenue from Contracts with
Customers. This supersedes all current revenue recognition
requirements under IFRS. The Group has chosen to use the full
retrospective transition method. The standard came into effect as
of January 1, 2018. The Group concluded that comparative
figures for the 2017 financial year do not need to be restated
since the impact is immaterial, which is why there is no effect in
Q1 2018. Consequently, no transition provision was required to
be disclosed at the end of December 2017. The accounting
policies for the Group’s main type of revenue are described
below.
The standard IFRS 9 Financial instruments is also adopted and
came into effect as of January 1, 2018.
Changes in accounting policies, applicable as of
January 1, 2018
As described above, the accounting principles applied
correspond to those described in the 2017 Annual Report, with
the exception of IFRS 15 Revenue from Contracts with
Customers and IFRS 9 Financial Instruments, for which there are
changes to Dometic’s accounting and valuation principles
compared to the principles described in Notes 2 and 4 of the
2017 Annual Report.
The detailed description of the accounting and valuation
principles applied by the Group in this interim report are to be
read in addition to descriptions found in Notes 1, 2 and 4 of the
2017 Annual Report, available at www.dometic.com.
Preparations for the new accounting standards
The following information should be considered in addition to the
description of the new accounting standards and related
activities provided in the 2017 Annual Report, Note 2.
IFRS 16 Leases
Dometic is currently assessing the impact of the new standard.
Ongoing activities include further analysis of lease terms in
agreements. Indications so far in the investigation phase, during
which contracts have been compiled and analyzed at a high
level, are that some impact is expected on financial reporting as
of 2019. Note 8 in the Annual Report discloses the future cash
flows for current operating leases. These cash flows, discounted
to present value, may provide an indication of the increase in
assets and liabilities that the Group will see in the balance sheet.
The Group is not able to quantify the impact on its consolidated
financial statements at this stage of the project.
For the IFRS 16 transition, Dometic has decided to use the
modified retrospective approach.
The standard is effective as of January 1, 2019. Dometic will not
adopt earlier application.
Accounting principles to be read in addition to the
descriptions in Notes 1, 2 and 4 of the 2017 Annual Report
IFRS 15 Revenue from Contracts with Customers
Revenue recognition in Dometic Group is based on IFRS 15 –
Revenue from Contracts with Customers. This standard specifies
the requirements for recognizing revenue from all contracts with
customers, except for contracts that are within the scope of the
Standards on leasing, insurance contracts and financial
instruments.
Dometic is in the business of manufacturing and selling a diverse
range of products within Climate, Hygiene & Sanitation, Food &
Beverage, Power & Control and Safety & Security. These
products are primarily for use in Recreational Vehicles, pleasure
boats, work boats, trucks and premium cars.
Products in the area of Mobile living are sold via the two sales
channels Original Equipment Manufacturer (OEM) and
Aftermarket (AM).
The new revenue model is made up of a series of steps required
to help entities determine when and how much revenue to
recognize.
In the first step of the revenue model, the Group identifies the
contract with a customer. This is then followed by the second
step, in which the various goods and services that need to be
accounted for separately, or distinct performance obligations, are
identified. In the third step, the Group determines the transaction
price, which is the total amount to which the Group expects to be
entitled, and then in the fourth step the transaction price is
allocated to the distinct performance obligations. Finally, the
amount of revenue allocated to each distinct performance
obligation is recognized either at a point in time or over a period
of time, depending on when the customer acquires control over
the promised goods or services in that performance obligation.
Customer contract
Purchase orders from the customer, which is the most common
way of ordering goods, qualify as an IFRS 15 contract, including
all enforceable rights and obligations required.
Distinct performance obligations
The promises are all distinct, since the customer can benefit
from the goods on their own and the service (if included in a
contract) together with the readily available goods. Each promise
(performance obligation) is accounted for separately.
In the rare cases where the Group offers installation services,
revenue for that performance obligation is recognized over the

DOMETIC INTERIM REPORT – Q1 2018
13
contract period during which the service is provided. At present,
the service part of the Group’s revenue is immaterial, which is
why revenue over time is not separately presented in the
disclosures.
Transaction price
Sales are recorded based on the price specified in the customer
agreements, net of the estimated discounts and returns at the
time of sale. Accumulated experience is used to estimate and
provide for the discounts and returns. If the consideration
includes a variable amount, the transaction price includes an
estimate of what the entity will be entitled to receive. Estimated
discounts are accounted for at the time of the sale and
simultaneously reduce external revenue. The amount is
estimated by using either the expected value or the most likely
amount.
The revenue estimate is included in the transaction price only if it
is highly probable that there will not be a significant reversal in
the amount of cumulative revenue recognized.
Revenue recognition
Revenue is recognized when the Group has fulfilled its
performance obligation, which means the Group has transferred
the promised good or service to the customer. The good or
service is regarded as transferred when the customer has
obtained control of the good or service. Revenue from the sale of
goods and services is recognized in a pattern that reflects the
transfer of control of the promised good or service to the
customer, and this takes place when the customer has obtained
the ability to direct the use of the goods and obtained
substantially all remaining benefits from the asset.
Control either transfers to the customer over time or at a point in
time, and this is determined at contract inception. The
assessment of whether control transfers over time or at a point in
time is critical to the timing of revenue recognition, since revenue
is recorded when or as control transfers.
The Group has a limited number of arrangements where the
performance obligations are satisfied over time, including some
services but also a small volume of customized goods
constructed for customers. To achieve valid revenue timing,
progress toward satisfaction of a performance obligation must be
measured.
Indicators for the transfer of control at a point in time for goods
are if the Group has a right to payment for the goods or if the
customer has legal title to the goods. Other indicators which the
Group considers are if the Group has transferred physical
possession of the goods and if the customer has the significant
risks and rewards related to the ownership of the goods.
Additionally, the Group considers whether the customer has
accepted the goods in accordance with the customer acceptance
clause.
International commercial terms are important as a checkpoint, to
determine when control transfers to a customer. The Group must
use judgement to determine whether all relevant IFRS control
factors collectively indicate that the customer has obtained
control before recognizing revenue.
Financing component If the timing of the payment of the consideration is in advance or deferred and the timing provides a significant financing benefit, the payments are adjusted for the time value of money. However, since sales are normally made with a credit term of 30-60 days, which is consistent with market practice, no element of financing is considered to exist.
Right to return
Revenue is not recognized for products expected to be returned
in cases where the customer has a contractual return right. A
liability for the refund (refund accrual) and an asset plus a
corresponding adjustment to cost of goods sold for its right to
recover products from customers on settling the refund accrual is
recorded.
Warranty
Dometic offers a standard warranty, normally of between two
and three years. In some cases, an extended warranty may be
offered to the customer. The standard warranty is recorded as a
provision and a warranty cost in the income statement, whereas
the extended warranty is a separate performance obligation. The
portion of the transaction price in the contract that is allocated to
the extended warranty is accounted for as revenue over the term
of the warranty period.
IFRS 9 Financial Instruments
IFRS 9 Financial instruments addresses the classification,
recognition, measurement and impairment of financial
instruments and hedge accounting. The standard replaces the
earlier IAS 39 standard and is effective from January 1, 2018,
although early adoption is permitted.
Dometic will apply the new standards effective from January 1,
2018, with no comparative historical adjustments as permitted by
the standard.
Dometic has reviewed the standard during latter 2016 and 2017
with the conclusion presented in the Annual report 2017 that the
new rules regarding classification and valuation have immaterial
impact on Dometic Group. As a result of this, no material
transition effects have been identified and no transition effect is
recorded in the group financial statements on December 31,
2017.
Dometic determined that all existing hedge relationships that are
currently designated in effective hedging relationships will
continue to qualify for hedge accounting under IFRS 9.
Financial assets
Financial assets are initially recognized at fair value plus transaction costs for all financial assets not carried at fair value through profit and loss. Financial assets carried at fair value through profit or loss are initially recognized at fair value, and transaction costs are expensed in the income statement. Financial assets are derecognized when the rights to receive cash flows from the investments have expired and substantially all risks and rewards of ownership are transferred. Regular way purchases and sales of financial assets are recognized on trade-date, the date on which the Group commits to purchase or sell the asset.
Dometic classifies and measures its financial assets in the
following categories: Amortized cost and fair value through profit
and loss.
a) Amortized costs: The Group’s financial assets at amortized cost comprise trade receivables and other receivables as well as cash and cash equivalents in the balance sheet. The objective of holding these financial assets is to collect the contractual cash flows, thus the “hold to collect” business model. The cash flows from these assets are solely payment of principal and interest, and are therefore measured at amortized cost. Selling or trading these financial assets are not part of the business model. If a sale would occur, it would be incidental and low frequent.
Trade receivables within this category are amounts
due from customers in the ordinary course of

DOMETIC INTERIM REPORT – Q1 2018
14
business. Trade receivables are recognized initially at
fair value and subsequently measured at amortized
cost using the effective interest method, less provision
for impairment.
b) Fair value through profit and loss: Financial derivatives that are not subject to hedge accounting are always recognized at fair value through profit and loss. Valuation of financial derivatives at fair value is done at the most recent updated market prices. Gains or losses arising from changes in the fair value of the “financial assets at fair value through profit or loss” category is presented in the operating result or financial net in the income statement depending on the nature of the economic relationship with the underlying asset.
Assets are classified as current assets if expected to be settled within 12 months, otherwise they are classified as non-current. Receivables are non-derivative financial assets with fixed or determinable payments that are not quoted in an active market. They are included in current assets, except for maturities later than 12 months after the balance sheet date.
Impairment of financial assets
The Group has revised its impairment methodology for financial
assets subject to IFRS 9’s impairment model for financial assets
leading to a so called expected credit loss model. With start on
January 1, 2018, Dometic recognizes expected credit losses
over the expected life of the trade receivables. Historical
information by legal entity is used regarding credit loss
experience and ageing to forecast future credit losses. In
addition, current and forward-looking information by legal entity
is used to reflect current and expected future losses. To support
and harmonize the organization, a calculation matrix for
calculating expected credit losses has been developed by
headquarters and distributed to the relevant functions throughout
the Group.
Dometic applies the simplified approach to measure life time
expected credit losses for trade receivables to provide for losses
each closing. The new model changed the loss allowance
immaterially.
Financial liabilities
Financial liabilities are recognized initially at fair value, net of
transaction costs incurred. Liabilities to credit institutions are
subsequently stated at amortized cost; any difference between
the proceeds (net of transaction costs) and the redemption value
is recognized in the income statement over the period of the
borrowings using the effective interest method. Fees paid on the
establishment of loan facilities are recognized as transaction
costs of the loan to the extent that it is probable that some or all
of the facility will be drawn down. In this case, the fee is deferred
until the draw-down occurs. To the extent there is no evidence
that it is probable that some or all of the facility will be drawn
down, the fee is capitalized as a pre-payment for liquidity
services and amortized over the period of the facility to which it
relates. Liabilities to credit institutions are classified as current
liabilities unless the Group has the right to defer settlement of
the liability for at least 12 months after the balance sheet date. A
financial liability is derecognized when the obligation under the
liability is discharged or cancelled or expires.
Trade payables are obligations to pay for goods or services that
have been acquired in the ordinary course of business from
suppliers. Trade payables are classified as current liabilities if
payment is due within one year or less. If not, they are presented
as non-current liabilities. Trade payables are recognized initially
at fair value and subsequently measured at amortized cost using
the effective interest method.
Offsetting financial instruments
Financial assets and liabilities are offset and the net amount
reported in the balance sheet, when there is a legally
enforceable right to offset the recognized amounts and there is
an intention to settle on a net basis or realize the asset and
settle the liability.
Derivative financial instruments and hedging activities
Derivatives are initially recognized at fair value on the date a
derivative contract is entered into and are subsequently re-
measured at their fair value. The method of recognizing the
resulting gain or loss depends on whether the derivative is
designated as a hedging instrument, and if so, the nature of the
item being hedged. The derivatives in Dometic hedge a
particular risk associated with a recognized asset or liability or a
highly probable forecast transaction (cash flow hedge).
Cash flow hedge
The effective portion of changes in the fair value of derivatives
that are designated and qualify as cash flow hedges is
recognized in other comprehensive income, and accumulated in
reserves in equity. The gain or loss relating to the ineffective
portion is recognized immediately in the income statement.
Amounts accumulated in equity are accounted for in the income
statement in the periods when the hedged item affects profit or
loss. The gain or loss relating to the effective portion of interest
rate swaps hedging variable rate borrowings are recognized in
the financial net. The gain or loss relating to the ineffective
portion is also recognized in the financial net. When a hedging
instrument expires or is sold, or when a hedge no longer meets
the criteria for hedge accounting, any cumulative gain or loss
existing in equity at that time remains in equity and is recognized
when the forecast transaction is ultimately recognized in the
income statement.
Net investment hedges
Dometic applies hedge accounting for net investment in foreign
operations. Hedges of net investments in foreign operations are
accounted for similarly to cash flow hedges. Any gain or loss on
the hedging instrument relating to the effective portion of the
hedge is recognized in other comprehensive income and
accumulated in reserves in equity. The gain or loss relating to
the ineffective portion is recognized immediately in profit or loss
within other income or other expenses. Gains and losses
accumulated in equity are reclassified to profit or loss when the
foreign operation is sold.
NOTE 2 | RISKS AND UNCERTAINTIES
As all businesses, Dometic is exposed to a number of risks that
could have a material impact on the Group. These risks are
factors that impact Dometic’s ability to achieve established
Group targets. This applies to both financial targets and targets
in other areas outlined in Dometic’s business strategy. Dometic
performs an annual risk analysis by assessing each defined
risk’s likelihood and impact in a risk register, resulting in global
and regional risk maps presented to Group management and the
Board of Directors and used as a foundation for the control
activities within Dometic. The risks that Dometic is exposed to
are classified into four main categories (business and market
risks, operational risks, compliance and regulatory risks and
financial risks) where each category has underlying risks. These
risks can be both internal and external. Internal risks are mainly
managed and controlled by Dometic whereas external risk
factors are not caused nor can be controlled by Dometic but the
effects can be limited by an effective risk management.
Dometic is subject to transaction risks at the time of purchasing
and selling, as well as when conducting financial transactions.
Transaction exposure is primarily related to the currencies EUR,
USD and AUD. As the majority of the Group’s profit is generated

DOMETIC INTERIM REPORT – Q1 2018
15
outside Sweden, the Group is also exposed to translational risks
in all the major currencies.
Efficient risk management is a continual process conducted
within the framework of business control, and is part of the
ongoing review of operations and forward-looking assessment of
operations. In the preparation of financial reports, the Board of
Directors and Group management are required to make
estimates and judgments. These estimates and judgments
impact the income statement and balance sheet, as well as the
disclosures. The actual outcome may differ from these estimates
and judgments under different circumstances and conditions.
Dometic’s future risk exposure is assumed not to deviate from
the inherent exposure associated with Dometic’s ongoing
business operations. For a more in-depth analysis of risks and
risk management, please refer to Dometic’s 2017 Annual Report.
NOTE 3 | FINANCIAL INSTRUMENTS
Dometic uses interest rate swaps to hedge senior facility term
loans to move from a floating interest rate to a fixed interest rate.
The Group also uses currency forward agreements to hedge part
of its cash flow exposure.
The fair value of Dometic’s derivative asset and liabilities were
SEK 163 m (Q1 2017: SEK 42 m) and SEK 34 m, (Q1 2017:
SEK 27 m). The value of derivatives is based on published
prices in an active market. No transfers between levels of the fair
value hierarchy have occurred during the period.
For financial assets and liabilities other than derivatives, fair
value is assumed to be equal to the carrying amount.
TABLE TO NOTE 3 – FINANCIAL INSTRUMENTS
Mar 31, 2018
Balance sheet
carrying amount
Financial
instruments at
amortized cost
Financial
instruments at fair
value
Derivatives used
for hedging
Per category
Derivatives 163 – 52 111
Financial assets 3,880 3,880 – –
Total financial assets 4,043 3,880 52 111
Derivatives 34 – 9 25
Financial liabilities 13,012 13,012 – –
Total financial liabilities 13,046 13,012 9 25

DOMETIC INTERIM REPORT – Q1 2018
16
NOTE 4 | SEGMENT INFORMATION
Segment performance is primarily assessed based on sales and
operating profit. Information regarding income for each region is
based on where customers are located. Management follow-up
is based on the integrated result in each segment. For further
information, please refer to Note 5 of the 2017 Annual Report.
Q1 Q1 FY
SEK m 2018 2017 2017
Net sales, external
Americas ⁽¹⁾
OEM 1,731 1,130 4,576
Aftermarket 557 376 1,753
Americas net sales, external 2,287 1,506 6,329
RV 1,369 1,282 5,341
Marine 839 147 651
CPV 50 52 208
Other (Lodging and Retail) 29 26 128
Americas net sales, external 2,287 1,506 6,329
EMEA
OEM 924 833 3,154
Aftermarket 772 694 2,808
EMEA net sales, external 1,696 1,527 5,962
RV 857 778 2,821
Marine 191 181 725
CPV 409 382 1,553
Other (Lodging and Retail) 240 186 863
EMEA net sales, external 1,696 1,527 5,962
APAC
OEM 215 188 847
Aftermarket 244 222 907
APAC net sales, external 459 410 1,753
RV 221 209 921
Marine 33 29 109
CPV 46 39 160
Other (Lodging and Retail) 160 135 563
APAC net sales, external 459 410 1,753
Net sales, external
Americas ⁽¹⁾ 2,287 1,506 6,329
EMEA 1,696 1,527 5,962
APAC 459 410 1,753
Total net sales, external 4,442 3,443 14,044
Operating profit (EBIT)
Americas ⁽¹⁾ 334 164 827
EMEA 209 162 557
APAC 95 92 523
Total operating profit (EBIT) 638 418 1,907
Financial income 3 0 6
Financial expenses -130 -31 -212
Taxes -136 -91 -206
Profit for the period 375 296 1,495
⁽¹⁾Including SeaStar Solutions.

DOMETIC INTERIM REPORT – Q1 2018
17
NOTE 5 | ITEMS AFFECTING COMPARABILITY
NOTE 6 | TRANSACTIONS WITH RELATED
PARTIES
No transactions between Dometic and related parties that have
significantly affected the company’s position and earnings took
place during 2018.
NOTE 7 | ACQUISITIONS AND DIVESTMENTS
2018
Dometic has not made any acquisitions or divestments during
Q1 2018.
Acquisition of SeaStar Solutions
During Q1 2018 the goodwill in the preliminary purchase price
allocation has been adjusted with SEK +13 million.
Acquisition of IPV and Oceanair Marine Limited
The purchase price allocation of IPV and Oceanair Marine
Limited are considered as final. No changes have been made.
2017
Acquisition of SeaStar Solutions
On November 22, 2017, Dometic announced the acquisition of
SeaStar Solutions, leading provider of vessel control, fuel and
system integration systems to the leisure marine industry.
SeaStar Solutions is based in North America and employs 1,250
people. The transaction was closed on December 15, 2017 after
all approvals from relevant competition authorities was obtained,
and Dometic has consolidated the company as of that date. The
total cash purchase price amounted to USD 868 m (SEK 7,286
m). The summary of value adjustments recognized as a result of
the preliminary purchase price allocation of SeaStar Solutions
amounts in total to SEK 7,361 m, including goodwill of SEK
3,361 m, trademarks and tradenames SEK 1,376 m, other
intangible assets SEK 3,365 m, tangible assets SEK 347 m,
other non-current assets SEK 1 m, cash SEK 1 m, net operating
assets and liabilities SEK 686 m and provisions and other non-
current liabilities of SEK -1,777 m.
Goodwill is justified by new potential customers and new future
technologies with SeaStar Solution’s leading position in vessel
control, fuel systems and system integration and strong
relationships with manufacturers. Acquisition-related costs
amount to SEK 58 m, reported as items affecting comparability in
Q4 2017. Sales and cost synergies of USD 20 m per annum will
be fully realized within 3 years. The acquisition has affected
consolidated net sales from the date of the acquisition by SEK
108 m and operating profit by SEK 5 m, including step-up costs
for fair value revaluation of inventory of SEK 9 m. If the
acquisition had been consolidated as of January 1, 2017, the
effect on pro forma net sales would have been USD 320 m and
EBITDA of USD 85 m.
While the Company uses its best estimates and assumptions as
part of the purchase price allocation process to value assets
acquired and liabilities assumed at the acquisition date, the
purchase price allocation for acquisition is preliminary for up to
12 months after the acquisition date and is subject to refinement
as more detailed analyses are completed and additional
information about the fair values of the assets and liabilities
becomes available.
Acquisition of IPV and Oceanair Marine Limited
On December 22, 2016, Dometic announced the acquisition of
the assets of IPV, a Germany-based aftermarket provider of
coolers and other outdoor products. The acquisition strengthens
Dometic’s position in the EMEA market for mobile coolers. The
purchase price was EUR 3.5 m, and the transaction was closed
on January 3, 2017. On February 7, 2017, Dometic acquired
Oceanair Marine Limited, a UK-based market-leading
manufacturer of marine blinds, screens and soft furnishings for
the Leisure Marine and Super Yacht segments. The acquisition
strengthens Dometic’s presence in the marine market and
broadens the product portfolio. The company reported revenues
of GBP 11.4 m for the 2015/2016 fiscal year. The initial purchase
price was GBP 14.0 m in cash, with an additional earn-out
consideration of a maximum of GBP 2.5 m subject to the
achievement of certain performance-related targets over the next
16 months.
The summary of value adjustments recognized as a result of the
acquisition of Oceanair amounts in total to SEK 160 m, including
goodwill of SEK 80 m, other intangible assets (trademarks and
customer relationships) of SEK 100 m, and a deferred tax liability
of SEK 20 m. Acquisition-related costs expensed in the
consolidated income statement Q1 2017 amounts SEK 2.5 m.
The total purchase price consideration in cash for the
transactions (IPV, Oceanair), less cash and cash equivalents,
amounts to SEK 197 m, including earn-out paid in the third
quarter 2017. The acquisitions did not have any significant
impact on operating profit during 2017.
NOTE 8 | SIGNIFICANT EVENTS AFTER THE
END OF THE PERIOD
At the 2018 Annual General Meeting held on April 10, Fredrik
Cappelen was re-elected as member and Chairman of the
Board. Jacqueline Hoogerbrugge, Rainer E. Schmückle, Erik
Olsson, Peter Sjölander, Heléne Vibbleus and Magnus Yngen
were re-elected as members of the Board of Directors. The
proposed dividend of SEK 2,05 per share was adopted.
Q1 Q1 FY
SEK m 2018 2017 2017
Relocation China – – 166
Acquistion-related costs SeaStar Solutions – – -58
EMEA profitability improvement program – – -61
Total – – 47

DOMETIC INTERIM REPORT – Q1 2018
18
RECONCILIATION OF NON-IFRS MEASURES TO
IFRS (ALTERNATIVE PERFORMANCE MEASURES)
Dometic presents some financial measures in this interim report, which are not defined by IFRS. The company believes that these
measures provide valuable additional information to investors and management for evaluating the company’s financial performance,
financial position and trends in our operations. It should be noted that these measures, as defined, may not be comparable to similarly titled
measures used by other companies. These non-IFRS measures should not be considered as substitutes for financial reporting measures
prepared in accordance with IFRS. See Dometic’s website www. dometic.com for the detailed reconciliation.
Core working capital
Consists of inventories and trade receivables less trade
payables.
EBITDA
Operating profit (EBIT) before Depreciation and Amortization.
EBITDA margin
EBITDA divided by net sales.
Leverage
Net debt excluding pensions and accrued interest in relation to
EBITDA.
Net debt
Total borrowings including pensions and accrued interest less
cash and cash equivalents.
Operating cash flow
EBITDA +/- change in working capital excluding paid tax, after
capital expenditure.
Organic growth
Sales growth excluding acquisitions/divestments and currency
translation effects. Quarters calculated at comparable currency,
applying latest period average rate.
RoOC – Return on Operating Capital
Operating profit (EBIT) divided by operating capital. Based on
the operating profit (EBIT) for the four previous quarters, divided
by the average operating capital for the previous four quarters,
excluding goodwill and trademarks for the previous quarter.
DEFINITIONS AND KEY RATIOS
AM
Aftermarket.
Capital expenditure
Expenses related to the purchase of tangible and intangible assets.
CPV
Commercial and Passenger Vehicles.
EPS – Earnings per share
Net profit for the period divided by average number of shares.
FY 2017
Financial Year ended December 31, 2017.
i.a.c. – items affecting comparability
Items affecting comparability are events or transactions with
significant financial effects, which are relevant for understanding the
financial performance when comparing profit for the current period
with previous periods. Items included are for example restructuring
programs, expenses related to major revaluations, gains and losses
from acquisitions or disposals of subsidiaries.
Interest-bearing debt
Liabilities to credit institutions plus liabilities to related parties plus
provisions for pensions.
Net profit
Profit (loss) for the period
OCI
Other comprehensive income.
OEM
Original Equipment Manufacturers.
Operating capital
excluding goodwill and trademarks
Interest-bearing debt plus equity less cash and cash equivalents,
excluding goodwill and trademarks.
Operating profit (EBIT)
Earnings before financial items and taxes.
Operating profit (EBIT) margin
Operating profit (EBIT) divided by net sales.
RV
Recreational Vehicles.
Q1 2018
January to March 2018 for Income Statement.
Q1 2017
January to March 2017 for Income Statement.
Working capital
Core working capital plus other current assets less other current
liabilities and provisions relating to operations.

DOMETIC INTERIM REPORT – Q1 2018
19
PRESENTATION OF THE
INTERIM REPORT
Analysts and media are invited to participate in a telephone
conference at 10.00 (CEST), April 26, 2018, during which President
and CEO, Juan Vargues and CFO, Per-Arne Blomquist, will present
the report and answer questions. To participate in the
webcast/telephone conference, please dial in five minutes prior to
the start of the conference call:
Sweden: +46 8 566 42669
UK: +44 20 3008 9802
US: +1 855 831 5945
Webcast URL and presentation are available at www.dometic.com
FOR FURTHER INFORMATION,
PLEASE CONTACT
Johan Lundin
Head of Investor Relations and Communications
Phone: +46 8 501 025 46
E-mail: [email protected]
FINANCIAL CALENDAR
CONTACT DETAILS
Dometic Group AB (publ)
Hemvärnsgatan 15
SE-171 54 Solna, Sweden
Phone: +46 8 501 025 00
www.dometic.com
Corporate registration number 556829-4390
ABOUT DOMETIC
Dometic is a global market leader in branded solutions for mobile
living in the areas of Climate, Hygiene & Sanitation, Food &
Beverage, Power & Control and Safety & Security. Dometic
operates in the Americas, EMEA and Asia Pacific, providing
products for use in recreational vehicles, trucks and premium cars,
pleasure and workboats, and for a variety of other uses. Dometic
offers products and solutions that enrich people’s experiences away
from home, whether in a motorhome, caravan, boat or truck. Our
motivation is to create smart and reliable products with outstanding
design. We operate 28 manufacturing/assembly sites in eleven
countries, sell our products in approximately 100 countries and
manufacture approximately 85% of products sold in-house. We
have a global distribution and dealer network in place to serve the
aftermarket. Dometic employs approximately 8,800 people
worldwide, had net sales of SEK 14.0 billion in 2017 and is
headquartered in Solna, Sweden.
This information is information that Dometic Group AB (publ) is
obliged to make public pursuant to the EU Market Abuse
Regulation. The information was submitted for publication, through
the agency of the contact person set out above, at 08:00 CEST on
April 26, 2018.
This document is a translation of the Swedish version of the interim
report. In the event of any discrepancy, the Swedish wording shall
prevail.
18 JULY 2018: Interim report for the second quarter 2018
25 OCTOBER 2018: Interim report for the third quarter 2018