neri working paper series productivity and the northern
TRANSCRIPT

1
NERI Working Paper Series
Productivity and the Northern Ireland Economy
Paul Mac Flynn
December 2016
NERI WP 2016/No 39
For more information on the NERI working paper series see: www.NERInstitute.net
PLEASE NOTE: NERI working papers represent un-refereed work-in-progress and the author(s) are solely responsible for the content and any views expressed therein. Comments on these papers are invited and should be sent to the author(s) by e-mail. This paper may be cited.

2
Nevin Economic Research Institute (NERI)
31/32 Parnell Square Dublin 1 Phone + 353 1 889 7722
45-47 Donegall Street Belfast BT1 2FG Phone + 44 28 902 46214
Email: [email protected] Web: www.NERInstitute.net

3
PRODUCTIVITY AND THE NORTHER IRELAND ECONOMY
Paul Mac Flynn, NERI* Keywords: Productivity JEL Codes: J24, O47, E24
______________________________________________________________________ ABSTRACT Productivity in many western economies has been stagnant in the years following the 2008 financial crash. The UK has been among the worst performing economies and within it, Northern Ireland has been a consistent laggard. Many have attributed Northern Ireland’s comparatively weak productivity performance to differences in the industrial makeup of the region. However, headline sectoral figures do not bear this out. The productivity gap between Northern Ireland and the rest of the UK lies within industries and sectors. This paper seeks to highlight the sectors and industries where Northern Ireland falls behind and to consider why they fall behind. Manufacturing and Public Services are sectors where Northern Ireland performs well while Agriculture and most of the Services Sector drag overall productivity down. In many cases Northern Ireland’s firms lack the scale of their counterparts in Great Britain, but even adjusting for this many firms still fall behind. To compound the problem, in many cases activity is concentrated in areas where Northern Ireland has a productivity deficit and less concentrated in areas where it is more productive. There are economy wide productivity issues relating to skills and physical capital investment where Northern Ireland has structural challenges to overcome. In addition to tackling sectoral issues, enterprise policy also need to focus on stimulating demand for skills among employers and employees while encouraging a culture of innovation among firms that lack the market incentive to do so. This version: 28th November 2016
* The author wishes to acknowledge comments regarding this research from NERI colleagues The usual disclaimer applies. All correspondents to [email protected]

4
PRODUCTIVITY AND THE NORTHER IRELAND ECONOMY
Paul Mac Flynn, Nevin Economic Research Institute
1. INTRODUCTION It has been accepted wisdom for many years now that Northern Ireland’s private sector has been underperforming when compared to the rest of the United Kingdom (Love et al (2010). The region has consistently produced output per head at a rate below that of the average in Great Britain (GB) and amongst the lowest of all UK regions. Employment levels in the private sector are well below other UK regions on a per head of population basis, while public sector employment is broadly comparable (Mac Flynn, 2015). A similar pattern emerges with wages in Northern Ireland (NI) compared to other UK regions. NI as a regional economy has important structural differences with other regions of the UK. It is noticeably more concentrated in areas like agriculture and retail and less focussed in the professional and scientific sectors which generally produce proportionately more output. However, adjusting for these differences only explains part of the output gap between NI and the rest of the UK. Of course, there are individual and distinctive reasons for the underperformance of the private economy in NI. NI is the most geographically peripheral region of the United Kingdom and its recent history of civil strife is also perceived to have stunted its growth (Dorsett, 2013). However, while NI is peripheral to the rest of the UK, it shares a land border with one of the most dynamic European economies, the Republic of Ireland. Furthermore, whilst there will necessarily be legacy issues from the conflict, NI has failed to improve on many measures of economic performance since the signing of the Good Friday Agreement in 1998. Indeed, on any number of measures it is falling further behind the rest of the UK. This paper seeks to examine NI’s private sector in greater depth in order to identify possible structural causes of this under-performance and if these issues necessitate a change in industrial and enterprise policy in NI. How do we identify the scale of the productivity problem? How do industries in NI differ from the rest of the UK? Is it just about firm size or market share? Why are workers in NI less skilled? Are firms in NI less ambitious? In order to answer these questions Section 2 looks at the structure of output in NI and the scale of the challenge facing policy makers. Section 3 will look at the industries in NI where the bulk of the productivity gap lies and attempt to identify sector specific productivity issues. Section 4 will look at both human and physical capital investment. It will examine the depth of NI’s skills deficit and possible causes for it whilst also examining the limited data surrounding physical capital investment in the region and why there may be a lack of ambition among firms. Section 5 will conclude.
2. THE PROBLEM Output or the sum of economic activity is an accepted if imperfect measure of how an economy is
performing. There are other measures such as household income or indicators from the labour
market that can create a fuller picture of economic health but economic output gives the most
comprehensive measure of productive performance. Output is usually measured by Gross
Domestic Product (GDP), but unfortunately that measure is not readily available for NI. Instead,
output in NI is measured by Gross Value Added (GVA) which is equivalent to GDP with subsidies
added in and less indirect taxes. Experimental figure for Northern Ireland in 2012 found that tax

5
and subsidies accounted for £4.9bn or 13 per cent of GDP in 2012 (NISRA, 2016). GVA is
calculated using the income approach from National Accounts.
Adjusting total output for size of population allows for international and regional comparisons of
productivity and living standards. As Chart 1 shows despite some progress in the mid-2000s, GVA
per head in NI is only 75 per cent of the GB average. This means that there is a 25 per cent
productivity gap between the GB and NI. As Chart 1 shows the productivity gap was not much
better in 2007 than it was in 1997. Given the economic growth experienced over this period this
is a significant result.
Chart 1: Gross Value Added per head of population Great Britain and Northern Ireland
1997-2014
Source: ONS Regional GVA (2015); ONS Workforce Jobs (2016)
As Chart 1 also shows, the gap has become substantially worse over the last six years. Productivity
growth has fallen off IN GB, but the decline In NI has been more severe. The impact of the Great
Recession and the scale of the adjustment that followed it in NI particularly with regard to the
construction and property sector may go some way to explaining this trend. However, the fact
that at its smallest in 2007 the productivity gap between NI and GB was still 15 per cent suggests
that the productivity problem will not be rectified by a broader business cycle recovery.
The Right Measure
While GVA per head is often the most utilised comparison of productivity it has many pitfalls. The
most accurate measure of productivity in any economy is Total Factor Productivity. This
measures the performance of the economy in supplying goods and services with the inputs of
labour and capital. It measures the quality and quantities of these inputs and the efficiency with
which they are combined (Bank of England, 2004). Data restrictions on investment in NI mean
that any focus on the productivity of capital would be severely limited. It is possible to calculate
70
72
74
76
78
80
82
84
86
0
5000
10000
15000
20000
25000
30000
NI/
UK
%
GV
A £
00
0s
Great Britain Northern Ireland NI/UK
6
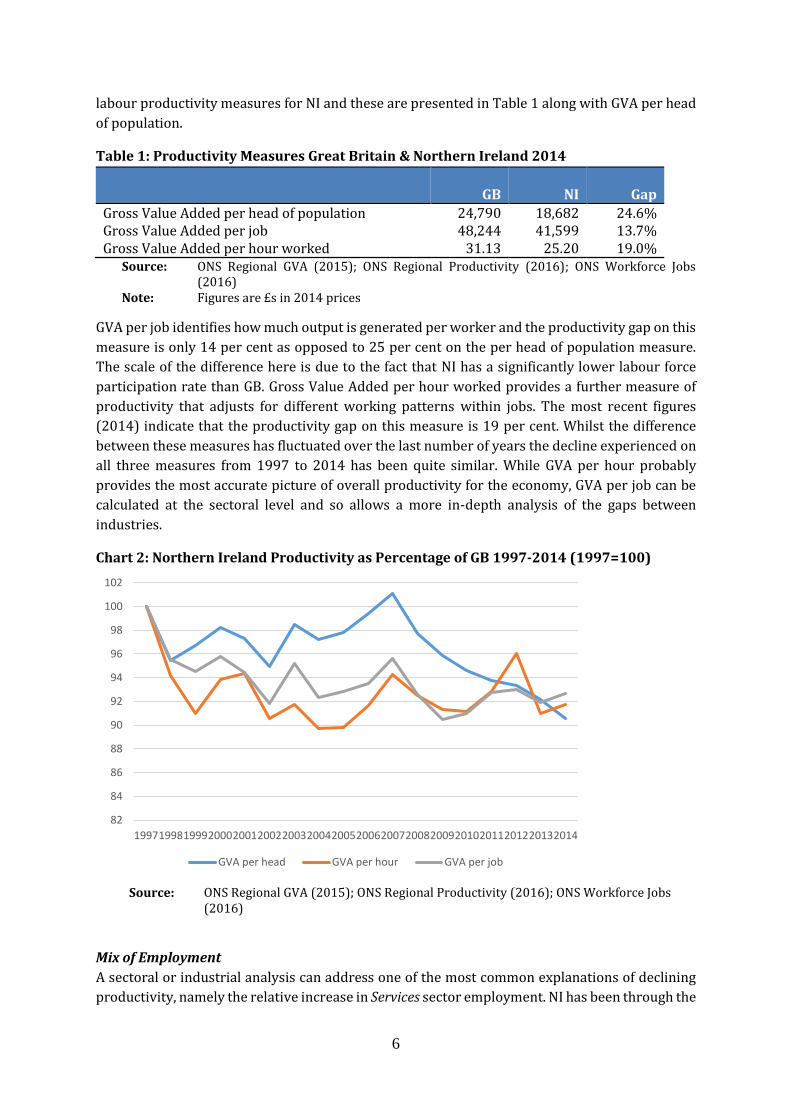
labour productivity measures for NI and these are presented in Table 1 along with GVA per head
of population.
Table 1: Productivity Measures Great Britain & Northern Ireland 2014
GB NI Gap
Gross Value Added per head of population 24,790 18,682 24.6% Gross Value Added per job 48,244 41,599 13.7% Gross Value Added per hour worked 31.13 25.20 19.0%
Source: ONS Regional GVA (2015); ONS Regional Productivity (2016); ONS Workforce Jobs (2016)
Note: Figures are £s in 2014 prices
GVA per job identifies how much output is generated per worker and the productivity gap on this
measure is only 14 per cent as opposed to 25 per cent on the per head of population measure.
The scale of the difference here is due to the fact that NI has a significantly lower labour force
participation rate than GB. Gross Value Added per hour worked provides a further measure of
productivity that adjusts for different working patterns within jobs. The most recent figures
(2014) indicate that the productivity gap on this measure is 19 per cent. Whilst the difference
between these measures has fluctuated over the last number of years the decline experienced on
all three measures from 1997 to 2014 has been quite similar. While GVA per hour probably
provides the most accurate picture of overall productivity for the economy, GVA per job can be
calculated at the sectoral level and so allows a more in-depth analysis of the gaps between
industries.
Chart 2: Northern Ireland Productivity as Percentage of GB 1997-2014 (1997=100)
Source: ONS Regional GVA (2015); ONS Regional Productivity (2016); ONS Workforce Jobs
(2016)
Mix of Employment
A sectoral or industrial analysis can address one of the most common explanations of declining
productivity, namely the relative increase in Services sector employment. NI has been through the
82
84
86
88
90
92
94
96
98
100
102
199719981999200020012002200320042005200620072008200920102011201220132014
GVA per head GVA per hour GVA per job

7
process of de-industrialisation which has affected most western economies since the mid-1970s.
Like many of these economies NI has become more orientated toward the service sector in terms
of employment. Many attribute this shift away from production industries to services as one of
the root causes of low productivity particularly in the US since the mid-1970s (Triplett &
Bosworth, 2000). The growth in the Services Sector in the EU is considered to have made an above
average contribution to employment growth and a below average contribution to productivity
growth over the 1990s (Uppenburg & Strauss, 2010). Chart 3 shows the growth and contraction
of employment by broad industrial sector in NI and the GB over this period of de-industrialisation.
Chart 3: Headline Industrial Sector Employment as percentage of Total Employment Great
Britain & Northern Ireland 1978 & 2014
Source: ONS Workforce Jobs (2016)
The most interesting result is the while manufacturing employment contracted sharply over the
period for both the GB and NI, that trend was less pronounced in NI. The rate of decline in
manufacturing employment was steeper in NI in the late 1970s and early 1980s, but flattened out
in subsequent years. Growth in the services sector NI has been slightly stronger in NI but this
occurred in the context of a sharp fall in the construction sector which was not the experience at
GB level. Chart 3 shows that NI has not been disproportionately affected by the generalised trend
toward services sector employment compared to GB. Services sector employment growth was
stronger in NI but this should have been aided by a less severe contraction in manufacturing.
While growth in the services sector may have brought lower productivity growth, a relatively
stronger manufacturing sector meant that this should actually have had less of an impact in NI
than GB.
Headline Industrial sectors of employment are a very broad categorisation, and differences in the
precise mix of employment between NI and GB do help to explain part of the productivity gap.
There are significant differences for instance in employment at the Standard Industrial
Classification (SIC) level. However, even differences at SIC level do not explain all of the gap and
25 26
8 11
7 8
6 4
64 60
83 82
5 6 2 3
0%
10%
20%
30%
40%
50%
60%
70%
80%
90%
100%
GB 1978 NI 1978 GB 2014 NI 2014
Manufacturing Construction Services Other Production

8
this can be best demonstrated by calculating what GVA for NI would be if the sectoral mix of
employment were exactly the same as GB.
Calculating a hypothetical GVA for NI can be achieved in two steps. Firstly, using GVA per job it is
possible to calculate a GVA per job for each of the SIC sectors. Secondly, total employment in NI
in 2014 can be reformulated as if it were distributed in the same proportions as it is in the GB.
Multiplying the new employment level in each sector by the existing GVA per job in that sector
gives a new level of output for each sector shown in the second column of Table 2.
Table 2: Northern Ireland Gross Value Added Adjusted for GB Employment 2014
Sector NI Emp Mix GB Emp Mix
Agriculture 408 124 Mining 103 91 Manufacturing 5,363 4,288 Electricity & gas 435 657
Water 552 446 Construction 1,852 1,909 Retail 4,610 4,311 Transportation 1,295 1,542 Accommodation & food 861 1,010 Info & Communication 1,126 2,000 Finance 1,479 2,189 Real estate 3,021 5,281 Professional & scientific 1,376 2,729 Administration 1,175 1,525 Public Administration 3,605 2,244 Education 2,611 2,424 Health 3,191 2,519 Arts 494 609 Other 772 789 Households 55 112 Total 34,384 36,799
Source: ONS Regional GVA (2015); ONS Workforce Jobs (2016) Note: Figures are £000s in 2014 prices
Adjusted for GB sectoral employment mix, NI’s productivity gap measured by output per job is
still 7 per cent. This portion of the productivity gap requires further investigation - Why are
industries within NI less productive than their GB counterparts?
3. A SECTORAL PROBLEM
This section will seek to explore in further detail the productivity gaps between specific sectors
in NI and GB. In deciding which industries to examine in more detail, three metrics are important;
the scale of the productivity gap within that industry; that industry’s importance to total
employment; and that industry’s share of total Gross Value Added. This is not to say that some
sectors are not worthy of closer analysis. It is to say that the scale of the negative productivity
gaps within the other sectors are more likely to shed some light on the recent decline in overall
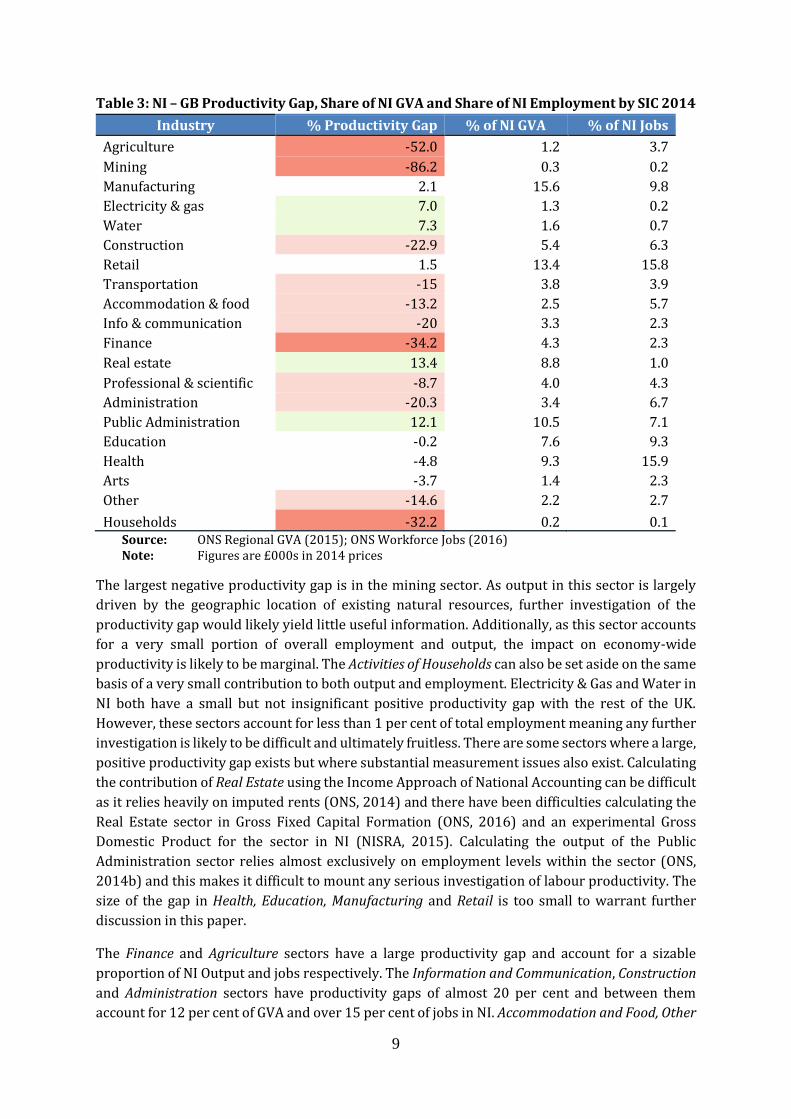
productivity in NI. These figures are presented in Table 3.
9
Table 3: NI – GB Productivity Gap, Share of NI GVA and Share of NI Employment by SIC 2014
Industry % Productivity Gap % of NI GVA % of NI Jobs
Agriculture -52.0 1.2 3.7
Mining -86.2 0.3 0.2
Manufacturing 2.1 15.6 9.8
Electricity & gas 7.0 1.3 0.2
Water 7.3 1.6 0.7
Construction -22.9 5.4 6.3
Retail 1.5 13.4 15.8
Transportation -15 3.8 3.9
Accommodation & food -13.2 2.5 5.7
Info & communication -20 3.3 2.3
Finance -34.2 4.3 2.3
Real estate 13.4 8.8 1.0
Professional & scientific -8.7 4.0 4.3
Administration -20.3 3.4 6.7
Public Administration 12.1 10.5 7.1
Education -0.2 7.6 9.3
Health -4.8 9.3 15.9
Arts -3.7 1.4 2.3
Other -14.6 2.2 2.7
Households -32.2 0.2 0.1 Source: ONS Regional GVA (2015); ONS Workforce Jobs (2016) Note: Figures are £000s in 2014 prices
The largest negative productivity gap is in the mining sector. As output in this sector is largely
driven by the geographic location of existing natural resources, further investigation of the
productivity gap would likely yield little useful information. Additionally, as this sector accounts
for a very small portion of overall employment and output, the impact on economy-wide
productivity is likely to be marginal. The Activities of Households can also be set aside on the same
basis of a very small contribution to both output and employment. Electricity & Gas and Water in
NI both have a small but not insignificant positive productivity gap with the rest of the UK.
However, these sectors account for less than 1 per cent of total employment meaning any further
investigation is likely to be difficult and ultimately fruitless. There are some sectors where a large,
positive productivity gap exists but where substantial measurement issues also exist. Calculating
the contribution of Real Estate using the Income Approach of National Accounting can be difficult
as it relies heavily on imputed rents (ONS, 2014) and there have been difficulties calculating the
Real Estate sector in Gross Fixed Capital Formation (ONS, 2016) and an experimental Gross
Domestic Product for the sector in NI (NISRA, 2015). Calculating the output of the Public
Administration sector relies almost exclusively on employment levels within the sector (ONS,
2014b) and this makes it difficult to mount any serious investigation of labour productivity. The
size of the gap in Health, Education, Manufacturing and Retail is too small to warrant further
discussion in this paper.
The Finance and Agriculture sectors have a large productivity gap and account for a sizable
proportion of NI Output and jobs respectively. The Information and Communication, Construction
and Administration sectors have productivity gaps of almost 20 per cent and between them
account for 12 per cent of GVA and over 15 per cent of jobs in NI. Accommodation and Food, Other
10
Services and Transportation have productivity gaps just above or below the overall NI gap of 13
per cent and account for 8.5 per cent of GVA and just over 12 per cent of jobs. The Professional
and Scientific sector accounts for just over 4 per cent of both jobs and GVA and has a productivity
gap of 8 per cent. The following section will look at these industries in greater detail to discern
what if anything existing economic data can reveal about their comparative regional weakness.
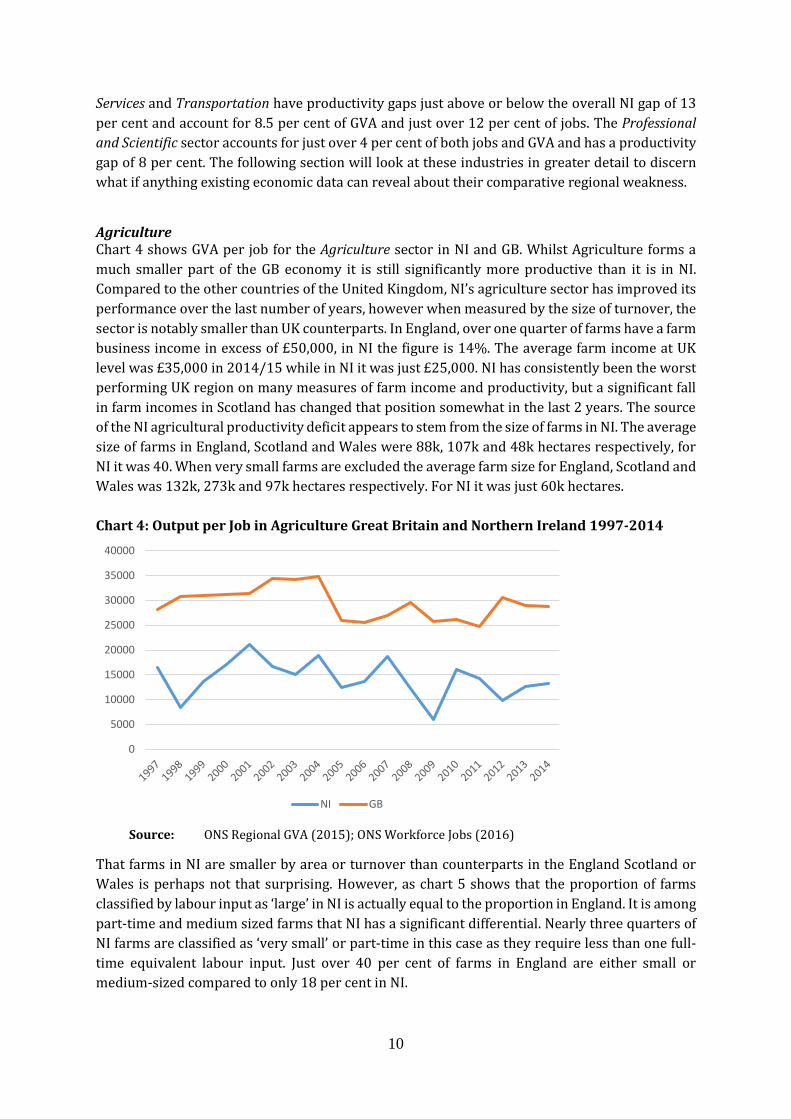
Agriculture Chart 4 shows GVA per job for the Agriculture sector in NI and GB. Whilst Agriculture forms a
much smaller part of the GB economy it is still significantly more productive than it is in NI.
Compared to the other countries of the United Kingdom, NI’s agriculture sector has improved its
performance over the last number of years, however when measured by the size of turnover, the
sector is notably smaller than UK counterparts. In England, over one quarter of farms have a farm
business income in excess of £50,000, in NI the figure is 14%. The average farm income at UK
level was £35,000 in 2014/15 while in NI it was just £25,000. NI has consistently been the worst
performing UK region on many measures of farm income and productivity, but a significant fall
in farm incomes in Scotland has changed that position somewhat in the last 2 years. The source
of the NI agricultural productivity deficit appears to stem from the size of farms in NI. The average
size of farms in England, Scotland and Wales were 88k, 107k and 48k hectares respectively, for
NI it was 40. When very small farms are excluded the average farm size for England, Scotland and
Wales was 132k, 273k and 97k hectares respectively. For NI it was just 60k hectares.
Chart 4: Output per Job in Agriculture Great Britain and Northern Ireland 1997-2014
Source: ONS Regional GVA (2015); ONS Workforce Jobs (2016)
That farms in NI are smaller by area or turnover than counterparts in the England Scotland or
Wales is perhaps not that surprising. However, as chart 5 shows that the proportion of farms
classified by labour input as ‘large’ in NI is actually equal to the proportion in England. It is among
part-time and medium sized farms that NI has a significant differential. Nearly three quarters of
NI farms are classified as ‘very small’ or part-time in this case as they require less than one full-
time equivalent labour input. Just over 40 per cent of farms in England are either small or
medium-sized compared to only 18 per cent in NI.
0
5000
10000
15000
20000
25000
30000
35000
40000
NI GB

11
Chart 5: Farm Size in Northern Ireland and England 2013/14
Source: DAERA Statistical Review of Northern Ireland Agriculture 2014 (2015); DEFRA Farm
Business Survey 2013/14 (2015)
Adjusted for labour inputs Direct Farm Income in NI shows a significant problem at the upper and
lower end of the scale. For Part-Time farms average income is two thirds of the England average.
As this group accounts for three quarters of all farms this is where the largest productivity gap
exits. As Chart 6 shows the average income for small and medium sized firms in NI is remarkably
similar to their equivalents in England. There is a large gap for large farms which may be
overstated as the upper definitional limit of large farms is open-ended.
What is clear from the available data is that farms in NI are smaller than their GB counterparts.
However, the real problem is that farms in NI are more likely to be part-time or large and that is
where NI is least productive. The problem is scale but not large scale.
0%
10%
20%
30%
40%
50%
60%
70%
80%
90%
100%
NI England
Large
Medium
Small
Part-time

12
Chart 6: Average Income by Farm Size in Northern Ireland and England 2013/14
Source: DAERA Statistical Review of Northern Ireland Agriculture 2014 (2015); DEFRA Farm
Business Survey 2013/14 (2015)
Finance
In the Finance sector, often the productivity gap between NI and GB is attributed to the distortion
of the City of London. As Chart 7 shows, whilst the London region does lift the GB average,
productivity in the NI finance sector still lags behind GB when this is accounted for.
Chart 7: Finance Sector Productivity Growth Great Britain, London & Northern Ireland
(1997-2014)
Source: ONS Regional GVA (2015); ONS Workforce Jobs (2016)
0
20000
40000
60000
80000
100000
120000
Part-time Small Medium Large
NI England
0
20,000
40,000
60,000
80,000
100,000
120,000
140,000
160,000
180,000
200,000
1997 1998 1999 2000 2001 2002 2003 2004 2005 2006 2007 2008 2009 2010 2011 2012 2013 2014
NI GB London GB ex London
13
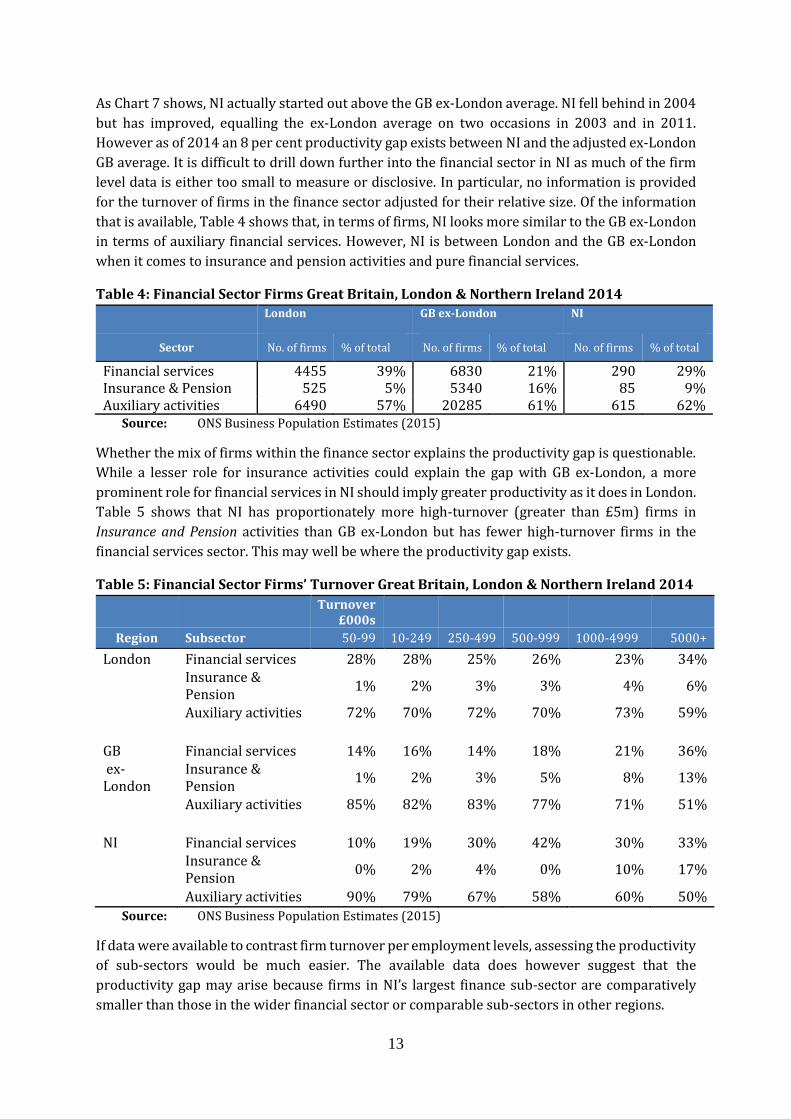
As Chart 7 shows, NI actually started out above the GB ex-London average. NI fell behind in 2004
but has improved, equalling the ex-London average on two occasions in 2003 and in 2011.
However as of 2014 an 8 per cent productivity gap exists between NI and the adjusted ex-London
GB average. It is difficult to drill down further into the financial sector in NI as much of the firm
level data is either too small to measure or disclosive. In particular, no information is provided
for the turnover of firms in the finance sector adjusted for their relative size. Of the information
that is available, Table 4 shows that, in terms of firms, NI looks more similar to the GB ex-London
in terms of auxiliary financial services. However, NI is between London and the GB ex-London
when it comes to insurance and pension activities and pure financial services.
Table 4: Financial Sector Firms Great Britain, London & Northern Ireland 2014
London
GB ex-London
NI
Sector No. of firms % of total No. of firms % of total No. of firms % of total
Financial services 4455 39% 6830 21% 290 29% Insurance & Pension 525 5% 5340 16% 85 9% Auxiliary activities 6490 57% 20285 61% 615 62%
Source: ONS Business Population Estimates (2015)
Whether the mix of firms within the finance sector explains the productivity gap is questionable.
While a lesser role for insurance activities could explain the gap with GB ex-London, a more
prominent role for financial services in NI should imply greater productivity as it does in London.
Table 5 shows that NI has proportionately more high-turnover (greater than £5m) firms in
Insurance and Pension activities than GB ex-London but has fewer high-turnover firms in the
financial services sector. This may well be where the productivity gap exists.
Table 5: Financial Sector Firms’ Turnover Great Britain, London & Northern Ireland 2014
Turnover £000s
Region Subsector 50-99 10-249 250-499 500-999 1000-4999 5000+
London Financial services 28% 28% 25% 26% 23% 34%
Insurance & Pension
1% 2% 3% 3% 4% 6%
Auxiliary activities 72% 70% 72% 70% 73% 59%
GB Financial services 14% 16% 14% 18% 21% 36% ex-London
Insurance & Pension
1% 2% 3% 5% 8% 13%
Auxiliary activities 85% 82% 83% 77% 71% 51%
NI Financial services 10% 19% 30% 42% 30% 33%
Insurance & Pension
0% 2% 4% 0% 10% 17%
Auxiliary activities 90% 79% 67% 58% 60% 50%
Source: ONS Business Population Estimates (2015)
If data were available to contrast firm turnover per employment levels, assessing the productivity
of sub-sectors would be much easier. The available data does however suggest that the
productivity gap may arise because firms in NI’s largest finance sub-sector are comparatively
smaller than those in the wider financial sector or comparable sub-sectors in other regions.

14
Information and Communications
Information and communication is a large sector ranging from publishing and broadcasting to
telecommunications and computing. As Chart 8 shows NI’s performance in this sector did quite
well until the early 2000’s. Interestingly, after a strong period of growth up to 2003, productivity
in both GB and NI dropped off in subsequent years. This fall off in growth was not confined to the
United Kingdom but was actually part of a wider global trend. The OECD have identified two
periods of significant productivity growth in the Information and Communications sector in both
the US and the EU from 1995-2000 and from 2000-2003. Both the EU and US saw significant
growth over these periods but the US saw almost double the rate of the EU in the 1995-2000
period (Kretschmer, 2012). In an international context the post-2003 slowdown is to be expected.
Why NI’s slump was much deeper is less clear.
Chart: 8 Information and Communication Productivity Great Britain and Northern Ireland
1997-2014
Source: ONS Regional GVA (2015); ONS Workforce Jobs (2016)
Firm level analysis shows that while, once again, London is an outlier NI still falls significantly
behind the rest of the UK in turnover per employment. As table 6 shows NI only manages to best
Scotland amongst all 12 of the UK regions.
40000
45000
50000
55000
60000
65000
70000
75000
80000
85000
NI GB

15
Table 6: Information and Communication Turnover per employment 2014
Region Turnover/ Employment
£000's
London 214.9
South East 189.0
South West 161.7
West Midlands 114.2
East of England 104.5
North West 100.0
Yorks & Humber 93.9
East Midlands 88.7
North East 81.5
Wales 80.6
Northern Ireland 74.2
Scotland 69.1 Source: ONS Regional GVA (2015); ONS Workforce Jobs (2016) Note: Figures are £000s in 2014 prices
In respect of firms categorised by sub-sector, NI differs from the rest of the UK in two areas. Firms
in NI are more concentrated in publishing and movie and television production, and are less
concentrated in computer programming and consultancy. Computer programming is an
important area of Information and Communications not just because it is a relatively newer
technology than either publishing or broadcasting, but because of its impacts on the wider
economy. The ICT sector, but computer programming in particular, has significant productivity
spill-over effects for the wider economy (Biagai, 2013). The lack of output in computer
programming may explain not only the productivity gap in ICT but may also explain a residual
gap in productivity for the wider economy.
Construction
The Construction industry in NI has faced significant difficulties in the years following the
financial crash of 2008. However even during its most buoyant period in the years leading up to
the crash, productivity in the sector was well below the GB average, and had in fact been falling
behind since 1997. Measuring output in the construction sector is notoriously difficult and most
studies that have examined productivity in the sector highlight this (Abdel-Wahab & Vogl, 2014).
Many studies have also charted falling construction sector productivity and attributed it to shifts
toward lower productivity activities within the sector

16
Chart 9: Construction Sector Output Norther Ireland and Great Britain 2015
Source: NISRA Northern Ireland Construction Bulletin Q1 2016; ONS Output in the
Construction Industry No. 17 (2016)
As Chart 9 shows that output in the construction sector in NI does look somewhat different to
that of GB. In the first instance Repair and Maintenance accounts for a much larger share of overall
output in GB, while Infrastructure and Housing are proportionately larger in NI. Interestingly the
share of output for private commercial work and non-housing public work are exactly reversed
between GB and NI, underlying the proportionately larger role of the public spending in the NI
economy.
The larger share of output in housebuilding could be significant as Allen (1985) identifies a shift
toward housebuilding as a key contributor to the productivity decline in the construction sector
in the US. However, Mildenberger et al (2013) find that firm size and the shift from ‘heavy
construction’ to contractors explains more of the decline. Once again, for NI the picture is mixed.
Just under one third of construction businesses in NI have only one employee compared to 15 per
cent in GB. However, NI and GB have the same proportion of firms with 10-49 employees at 10
and 10.3 per cent respectively.
Repair and Maintenance (R&M) is considered to be much more labour intensive than New Build,
however Abdel-Wahab (2008) finds a significant difference in productivity between R&M and
New Build in the housebuilding sector compared to the non-residential sector. Non-Residential
New Build was found to be nearly three times as productive as Residential New Build whilst
Residential R&M was found to be 1.3 times as productive as Non-Residential R&M. Housing makes
up 34 per cent of NI’s new build compared to only 29 per cent of the GB total. At GB level housing
accounts for half of all R&M activity whilst in NI it was only 36 per cent. Further work is needed
to fully assess sub-sectoral productivity within NI’s construction sector and all output figures
should be handled with caution. However, it does seem likely that a concentration of activity in
lower value added sub-sectors may explain a significant portion of the productivity gap in this
sector.
25% 22%
18%
11%
19%
8%
3%
3%
8%
19%
26%37%
0%
10%
20%
30%
40%
50%
60%
70%
80%
90%
100%
NI GB
All Repair & Maintenance
Private Commercial
Private Industrial
Non-housing Public
Infrastructure
Housing
17
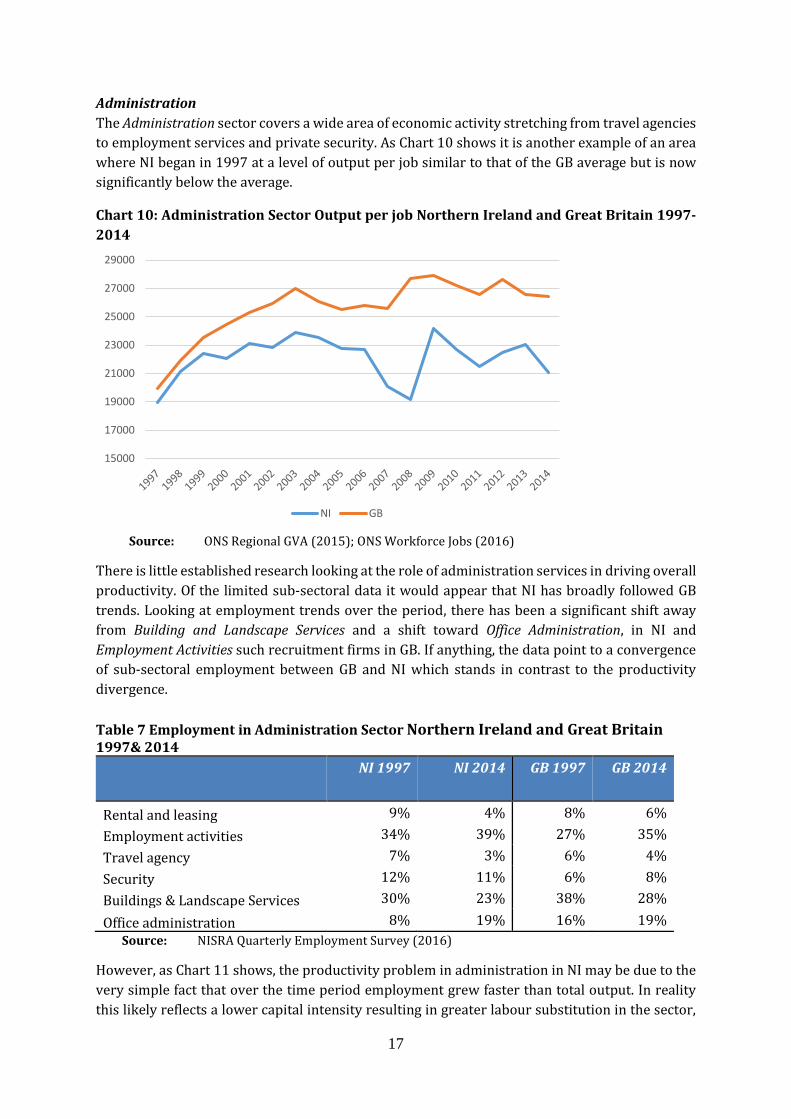
Administration
The Administration sector covers a wide area of economic activity stretching from travel agencies
to employment services and private security. As Chart 10 shows it is another example of an area
where NI began in 1997 at a level of output per job similar to that of the GB average but is now
significantly below the average.
Chart 10: Administration Sector Output per job Northern Ireland and Great Britain 1997-
2014
Source: ONS Regional GVA (2015); ONS Workforce Jobs (2016)
There is little established research looking at the role of administration services in driving overall
productivity. Of the limited sub-sectoral data it would appear that NI has broadly followed GB
trends. Looking at employment trends over the period, there has been a significant shift away
from Building and Landscape Services and a shift toward Office Administration, in NI and
Employment Activities such recruitment firms in GB. If anything, the data point to a convergence
of sub-sectoral employment between GB and NI which stands in contrast to the productivity
divergence.
Table 7 Employment in Administration Sector Northern Ireland and Great Britain 1997& 2014
NI 1997 NI 2014 GB 1997 GB 2014
Rental and leasing 9% 4% 8% 6%
Employment activities 34% 39% 27% 35%
Travel agency 7% 3% 6% 4%
Security 12% 11% 6% 8%
Buildings & Landscape Services 30% 23% 38% 28%
Office administration 8% 19% 16% 19%
Source: NISRA Quarterly Employment Survey (2016)
However, as Chart 11 shows, the productivity problem in administration in NI may be due to the
very simple fact that over the time period employment grew faster than total output. In reality
this likely reflects a lower capital intensity resulting in greater labour substitution in the sector,
15000
17000
19000
21000
23000
25000
27000
29000
NI GB

18
which is common in low wage services sectors particularly those with lower levels of unionisation
(Gordon, 1996). Data limitations prevent a further exposition of these issues within the
Administration sector. It is likely that productivity in the administration sector in NI suffers from
economy-wide productivity issues which are covered in greater detail in section 4.
Chart 11: Northern Ireland Administration Sector Output and Employment as a Percentage
of Great Britain total 1997-2014
Source: ONS Regional GVA (2015); ONS Workforce Jobs (2016)
Accommodation and Food The Accommodation and Food sector is already of significant interest within NI as one of the
lowest paid sectors in the economy (Mac Flynn, 2014). Whether low pay is driven by low
productivity or vice versa is beyond the scope of this paper but the fact remains that after
Agriculture, Accommodation and Food has the lowest output per job in NI. The productivity gap
between NI and the GB average is distorted by the presence of London, but even when the GB
average is adjusted for this, NI is still 8 per cent behind. As Chart 12 shows however, NI’s
performance had been quite good in the years before 2008. Following the crash, both output and
employment fell significantly and have yet to recover.
0.00%
0.50%
1.00%
1.50%
2.00%
2.50%
Employment Output

19
Chart 12: Accommodation and Food Sector Output per job Norther Ireland and Great
Britain 1997-2014
Source: ONS Regional GVA (2015); ONS Workforce Jobs (2016)
The Food Service sector accounts for almost 80 per cent of jobs in the sector and Food and Drink
service providers account for the vast majority of firms in the sector. When firm size is measured
by employment NI measures up quite well to the rest of the UK with firms that are actually slightly
larger in both Accommodation and Food Services. However, when turnover is compared between
firms, a different pattern emerges. In the food sector firms in NI have, if anything, a slightly larger
turnover profile than the GB average, but in the accommodation sector NI firms are significantly
smaller.
Table 8: Firms in Accommodation & Food Sector by Size of Turnover GB & NI 2014
Source: ONS Business Population Estimates (2015)
As table 8 shows 17 per cent of firms in NI’s accommodation sector have a turnover of less than
£50,000 almost double the proportion in GB. The food sector by comparison compares
favourably, particularly in the £10,000 to £49,000 category. The disparity in turnover size in the
accommodation sector would explain the productivity gap, but the root causes are still unclear.
Unfortunately, the stock of accommodation does not break down serviced accommodation into
sub-sectors and therefore it is not possible to be more prescriptive.
0
5000
10000
15000
20000
25000
NI GB
Region Turnover Size Band
0-49 50-99 100-249 250-499 500-999 1000-4999 5000+
NI Accommodation 17% 13% 17% 14% 10% 24% 5%
Food 4% 27% 41% 15% 8% 5% 0%
GB Accommodation 9% 15% 29% 17% 14% 14% 3% Food 5% 25% 43% 17% 7% 3% 1%

20
Other Service Activities
The Other Activities Sector naturally covers a curious mix of industries ranging from churches and
Trade Unions to dry-cleaning and hair-dressing. Identifying a productivity gap is difficult in this
area as the industries involved are so disperse. There is no indication that turnover levels within
firm are any smaller and the average size of a firm by employment is roughly similar among all
sub sectors. There are more firms in NI in the religious/political/membership organisation
section and more firms at GB level involved in funeral services and personal well-being. While the
Other Services Sector does account for just over 2 per cent of GVA and 3 per cent of total
employment, it is too diverse to identify any trends or patterns beyond what is contained in
standard labour market and business statistics. As with the sdministration sector, the cause of
the productivity gap here will likely be contained in economy-wide productivity issues covered
in detail in section 4.
Transportation and Storage
While there is a significant productivity gap between GB and NI in the Transportation sector, the
experience of the last few years has been somewhat mixed. In 2007 and 2011 the transportation
Sector productivity gap was negligible, but the most recent data suggests the gap is back to what
it was throughout the early 2000s.
Chart 13: Transportation Sector Output per job Norther Ireland and Great Britain 1997-
2014
Source: ONS Regional GVA (2015); ONS Workforce Jobs (2016)
Transportation is another area where measuring productivity is quite difficult. The
transportation sector experienced a comparatively higher level of deregulation, particularly in
the airline industry and this should have been a positive productivity development according to
conventional economic wisdom but internationally, transportation productivity has been in
decline for decades (Duke & Torres, 2005). What many previous studies highlight is the role of
infrastructure in the pace of productivity growth in the transportation sector. Among all the
private sector service industries, transportation is probably the sector most sensitive to
improvements or declines in a country’s stock of infrastructure. Haulage industries rely on good
road networks and airlines depend on increased runway capacity. The lack of significant
0
10000
20000
30000
40000
50000
60000
NI GB

21
infrastructure investment in NI over the last number of decades has no doubt reduced
productivity for the whole economy, but this deficit will be most keenly felt in transportation
productivity. For example, NI has 0.04 miles of rail track per square mile compared to 0.12 in GB,
and this does not take account of the High-Speed Rail infrastructure that is planned and already
in place in England. NI is not alone in suffering an infrastructural deficit with other parts of the
United Kingdom. Studies have highlighted the fact in the four years to 2020 the UK government
will spend £1280 per person on transport in London compared to just £280 in the North of
England (IPPR, 2016). NI’s productivity gap in transport and for the economy as a whole is likely
to remain subdued until such time as infrastructure spending is targeted towards areas of the
United Kingdom with a deficit of investment.
Professional and Scientific
The Professional and Scientific Sector is unique in NI in the sense that it is the only sector that had
a positive productivity gap in 1997 and a negative gap in 2014. As chart 14 shows NI began in
1997 significantly above the GB average output per job before falling behind in 1998. The early
2000s saw another period of positive productivity differentiation, while recently the negative gap
has been sustained every year except 2013. What is clear is that NI has the capacity to not only
meet GB productivity levels in this sector but even exceed them.
Chart 14: Professional and Scientific Sector Output per job Norther Ireland and Great
Britain1997-2014
Source: ONS Regional GVA (2015); ONS Workforce Jobs (2016)
Looking at the sub-sectors within the professional and scientific sector there is a clear divide
between NI and GB. The sector is dominated by legal and accounting services in NI which account
for one third of firms, compared to 19 per cent in the GB. In GB 36 per cent of firms in the sector
are classed as Activities of Head Offices and Management Consultancies. Head office activities are
more likely to be contained in London but Table 9 shows both Wales and Scotland have
significantly more firms in this sub-sector than NI.
0
10000
20000
30000
40000
50000
60000
NI GB

22
Table 9: Professional and Scientific firms 2014
% of firms in Sector
Sector UK Scotland Wales NI
Legal & Accountancy 18 12 20 34
Head Offices 37 29 30 20
Architecture 22 39 26 26
Scientific Research 1 1 1 1
Advertising 5 2 3 4
Other 16 15 17 12
Veterinary 1 1 2 2
Source: ONS Business Population Estimates (2015)
The difference in the proportion of firms classified as head offices in NI may not be significant on
its own. However, the absence of head office functions may help to explain the lower productivity
of other sub-sectors and legal and accountancy firms in particular. In recent years, many of the
new jobs created in the legal and accountancy sector in NI have been subsidiaries of larger firms
operating in London and the rest of the UK. Whilst the activity carried out here may be in the same
category, it may not be of the same value and this is re-enforced by wage levels in the sector in
NI. The wage gap in the professional and scientific sector would suggest that activity in the
professional and scientific sector is of a lower value added profile. Wages in the sector in NI are
25 per cent lower than the UK compared to a gap of 14 per cent in the economy overall (NISRA,
2015) and a productivity gap of only 8.6 per cent in the sector.
4. BROADER PRODUCTIVITY ISSUES
Beyond the sector specific issues, there are productivity concerns that cut across all industries.
One of the key drivers of labour productivity is the growth and development of human capital or
skills. How and when skills are accumulated and how they are rewarded within an economy can
go some way to explaining the development of labour productivity. As mentioned in the preceding
section, due to a lack of data on investment a detailed examination of capital productivity is not
possible. However, the role of investment and innovation in the development of overall
productivity cannot be ignored and requires some contextualisation for NI. The following section
will discuss these topics in greater detail.
Skills
The skills deficit in NI is sizeable and enduring and the most worrying statistic is for those with
no level 1National Vocational Qualifications. NVQ stratifies a range of qualifications ranging from
GCSEs to trade apprenticeships and University degrees. In 2015, 16 per cent of 16 to 64 year olds
did not have a level 1 NVQ. To have less than a level 1 NVQ means less than 5 GCSEs at A-C grade.
Table 10 puts NIs performance on this measure in a regional context and only the West Midlands
come close at 13 per cent.

23
Table 10: Percentage of 16-64 with no NVQ level Qualifications by UK Region 2015
Source: ONS Annual Population Survey (2016)
It should be pointed out at this stage that the situation in NI has become markedly better over the
last 10 years, but that a persistent gap remains. Chart 15 shows these trends in the context of the
UK nations and while the reduction in NI has been impressive it has been less impressive than
other regions of the UK over the same period.
Chart 15: Number of 16-64 with no NVQ level Qualifications by UK Nation 2004-15
(2004=100)
Source:
There are many and disparate motivations for education and skills attainment ranging from the
familial to the geographical, and within NI there are even more related to religious and
community affiliation. Whilst many of these issues are beyond the scope of this paper there are
some issues specific to the skills and the NI labour market which warrant a closer examination
based on the issued raised in the preceding paragraphs.
60
65
70
75
80
85
90
95
100
105
110
2004 2005 2006 2007 2008 2009 2010 2011 2012 2013 2014 2015
England Wales Scotland Northern Ireland
Region Percentage with no NVQ
North East 10.4 North West 9.8 Yorkshire and The Humber 9.8 East Midlands 8 West Midlands 13 East 8 London 7.4 South East 6.3 South West 5.5 Wales 10.5 Scotland 9 Northern Ireland 16.3 United Kingdom 8.8

24
The OECD Survey of Adults Skills is an international survey that forms part of the Programme for
the International Assessment of Adult Competencies (PIAAC). The survey has a large sample size
for NI and provides some much-needed insights into the attainment of skills and its interaction
with the labour market.
Chart 16: Effect of Literacy and Years of Education on likelihood of Employment
Source: OECD Survey of Adults Skills (2015)
The data cover the survey period 2008-2013 and no UK or GB comparable figure is available.
What the data show is that years of education have almost exactly the same very small effect on
the likelihood of being employed in NI. In the US and the Republic of Ireland, years of education
and literacy have a far greater effect on employment possibilities. The figures for numeracy tell a
similar story, although numeracy has a much lower effect on employment across the board.
Chart 17: Effect of Years of Education on likelihood of Employment and Wages
Source: OECD Survey of Adults Skills (2015)
0
1
2
3
4
5
6
Northern Ireland OECD average United States Ireland England
Education Literacy
0
5
10
15
20
25
Northern Ireland OECD average United States Ireland England
Employment Wages

25
The ‘brain drain’ from Northern Ireland may explain the differing effect of years of education on
employment prospects. If those with more years of education are attracted to employment
outside Northern Ireland this may mean that those left behind who do find employment have
comparatively less education. However, when it comes to the effects of skills on wages NI tells a
very different story. Years of Education have a very significant effect on average wages, above the
OECD average and greater than either England or the Republic of Ireland. What Charts 16 and 17
show is that while gaining employment may not be that dependent on years of education, moving
up the wages distribution very much is. This mismatch could explain why NI manages to maintain
such a high level of workers with no qualifications and relatively low wages.
Most government programmes aimed at re-skilling or up-skilling focus on getting workers into
employment, very few focus on using increased education to boost wages. Programmes in NI
such as Essential Skills focus on literacy, numeracy and basic IT skills as a means to gaining
employment. Based on the statistics in Chart 16 this focus is warranted because basic skills play
as much of a role in gaining employment as formal education. However, this focus may have
unintended effects on labour productivity. Higher wages are predominantly driven by higher
labour productivity (Dearden, Reed & Van Reenen, 2006) and in NI higher wages are generally
seem to be associated with years of education. It is not difficult to see a clear connection between
greater educational attainment and higher labour productivity and ultimately a higher wage
economy.
It would be misleading, however, to cast the problem of skills as merely one of supply. While years
of education may be associated with higher wages, the data do not suggest that gaining years of
education will ultimately lead to higher wages. With such a shortage of skills in the labour market.
One would expect NI workers and jobs to be highly mismatched. However, the data suggests that
workers in NI are neither more underqualified or overqualified than their comparators.
Chart 18: Qualification mismatch by Country/Region
Source: OECD Survey of Adults Skills (2015)
The problem of a lack of skills in NI may be due as much to lack of demand as it is to lack of supply.
Government programmes that induce upskilling will ultimately be futile if firms in NI do not use
or properly reward skills. The theory of a low-skill/low-wage equilibrium has been examined for
0
10
20
30
40
50
60
70
80
Northern Ireland OECD average United States England Ireland
Well-macthed Overqualified Underqualified

26
the UK economy (Wilson & Hogarth, 2003) and it would seem that NI falls into a category of UK
regions where a high volume of low wage employment breeds a low level of skills acquisition. The
interaction between employment prospects and skills acquisition in NI requires more study to
make further policy recommendations in this area.
Capital
The other cross sectoral issue for productivity in NI is the combination of labour and capital
inputs used in the production of goods and services. NI could have a workforce just as educated
and skilled as the rest of the United Kingdom, but if firms in the rest of the UK match investment
in human capital with investment in physical capital, productivity in NI would struggle to keep
pace.
As mentioned earlier the absence of official data on investment means that there is no reliable
figure for capital productivity in NI. There have been efforts to calculate Gross Fixed Capital
Formation (GFCF), the main component of investment, for NI. However, these efforts have been
the subject of intense discussion between NI Statistics and Research Agency and the Office for
National Statistics. While the ONS estimates of GFCF for NI do come with a strong health warning
they do provide the greatest detail on the industrial breakdown of capital investment. Table 11
shows estimates of GFCF by sector in NI.
Table 11 gives an indication of the regional breakdown of investment. However, it must be
stressed that these are just estimates and constructing any measure of capital productivity from
them would be misleading. To illustrate the scale of possible inaccuracy, the NI Statistics and
Research Agency produced their own estimate of GFCF for NI in 2015 as a part of a project to
develop national accounts for NI. The produced a figure of £4bn for 2012 which contrasts sharply
with the £6.9bn figure produced by the ONS for the same year. The NISRA estimate uses a
methodology similar to that used to calculate total UK GFCF. The ONS estimates of regional GFCF
are apportioned out from total UK GFCF rather than being calculated from existing NI expenditure
data. Further work will be carried out to reconcile these estimates, but for the moment they can
only serve as a rough guide.
Table 11: Gross Fixed Capital Formation in Northern Ireland by Sector 2014
Sector GFCF
Agriculture, forestry and fishing 711
Production 228
Of which Manufacturing 756
Construction 297
Distribution; transport; accommodation and food 556
Information and communication 201
Financial and insurance activities 137
Real estate activities 3103
Business service activities 170
Public administration; education; health 925
Other services and household activities 117
Total GFCF 7199 Source: ONS Regional Gross Fixed Capital Formation (2015) Note: Figures presented are NOT national statistics

27
Despite methodological differences both the NISRA and ONS measures find NI to have the lowest
per population investment levels in the UK. The low levels of physical capital investment in NI are
possibly as much of a drag on productivity as low levels of human capital investment or skills.
While there are more data to indicate why accumulation of human capital in NI is low by regional
standards, there is little evidence of the same for physical capital investment. One possible source
of information however is the UK wide Innovation Survey which measures the actions firms have
taken to improve either their products or methods of production. It covers areas such as research
and development and machinery acquisition but also covers areas such marketing investment
and business organisation. It is not a perfect indicator of physical capital investment but does give
some insight firm behaviour with regard to investment.
Chart 19: Percentage of Innovative Firms by Region 2013 & 2015
Source: ONS UK Innovation Survey (2015)
Chart 19 shows that NI had the least proportion of innovative firms in the UK in 2013 and owing
to a substantial collapse in innovation in the South West of England, had only the second lowest
proportion in 2015. In the production sector manufacturers of electrical and optical equipment
were the most innovative (87 per cent) whilst in the Services sector financial intermediation
firms (70 per cent) were the most innovative. More interestingly the firms who reported no
innovation activity were asked to detail why this was so and of the firms who answered the most
common response (19 per cent) was “No need due to market conditions”. This finding goes to the
heart the investment issue in NI. There is no government policy that can reasonably be expected
to induce firms to increase investment or innovation. If prevailing market conditions do not
induce firm to invest or innovate then they will not.
Policies promoted by the Norther Ireland Executive to lower Corporation Tax are premised on
the theory that if firms retained a larger share of their profits they would use this to further
investment or innovation. Whilst the evidence from the Innovation Survey does not by any means
0 10 20 30 40 50 60 70
North East
North West
Yorkshire and The Humber
East Midlands
West Midlands
East of England
London
South East
South West
Wales
Scotland
Northern Ireland
2015
2013

28
refute that hypothesis, it certainly does call it into question. Without more reliable data on
investment it is not possible to be prescriptive about how policy should meet this challenge. The
existing data does give some indication of the mindset of firms, and it would indicate that there is
a cultural problem with investment and innovation among certain firms and this lies at the heart
of the lack of investment in NI
5. CONCLUSION The productivity gap between NI and the rest of the United Kingdom is a significant problem, but
it is more complex that it first seems. While the mix of employment plays a role in that gap, the
truth is that in several industries NI falls well short of its UK counterparts. As was shown in
section 2, the problem is not that NI employment is more reliant on an industry like agriculture.
It is that NI manages to produce less output per person within the agriculture sector. There are
individual reasons within individual sectors as to why there is such a large productivity gap, but
a residual productivity gap is likely to be explained by a lack of investment in capital, both human
and physical.
The motivations surrounding the lack of investment are key to rectifying the situation. It is not
enough to lament the lack of skilled workers in the economy without acknowledging that in many
cases the labour market simply does not demand or reward such skills. A firm that does not feel
the market compels them to innovate their products or processes will not suddenly feel the need
to do so with larger retained profits. Bridging the productivity gap will require action within
specific sectors.
The culture change will need to be one that encourages workers not to seek the bare minimum of
qualifications necessary just to enter the workforce but enough to sustain career progression. It
will also require an industrial policy that seeks to persuade firms, and smaller firms in particular
not to be content with status quo but to engage in permanent investment in order to grow in the
domestic market and beyond. Both these strategies would begin to move NI’s economy in a new
direction. If current policies are maintained it would seem highly unlikely that the present
perilous productivity situation will change.

29
REFERENCES Abdel-Wahab, Mohammed (2008) An examination of the relationship between skills development
and productivity in the construction industry Loughborough: University of Loughborough Allen, Steven G. (1985) "Why Construction Industry Productivity is Declining," Review of
Economics and Statistics, Vol. LXVII, No. 4, (November 1985) pp. 6 61-669 Bank of England (2014) The UK productivity puzzle Quarterly Bulletin 2014 Q2 Biagi, Federico (2013) ICT and Productivity: A Review of the Literature Brussels: European
Commission. Bosworth, Barry P. & Jack E. Triplett (2001) Productivity in the Services Sector in Stern, R. ed.
Services in the International Economy Michigan: UOM Press pp 23-53. Dearden, L., Reed, H & J Van Reenen (2006) The Impact of Training on Productivity and Wages:
Evidence from British Panel Data Oxford Bulletin of Economics and Statistics Volume 68, Issue 4 August 2006 Pages 397–421
Department for Environment Food & Rural Affairs (2015) Farm Accounts in England – Results from the Farm Business Survey 2013/14 London: DEFRA.
Department of Agriculture, Environment and Rural Affairs (2015) Statistical Review of Northern Ireland Agriculture 2015 Belfast: DAERA
Dorsett, Richard (2013) The effect of the Troubles on GDP in Northern Ireland European Journal of Political Economy Volume 29, March 2013, Pages 119–133
Duke, J. & D. Torres (2005) Multifactor productivity change in the air transportation industry Washington DC: BLS
Gordon, Robert J. (1996) Problems in the Measurement and Performance of Service-Sector Productivity in the United States NBER Working Papers 5519
Institute for Public Policy Research (2016) Why ‘North First’? Manchester: IPPR Kretschmer, Tobias (2012) Information and Communication Technologies and Productivity
Growth Paris:OECD Love, James H., Roper, Stephen., and Nola Hewitt-Dundas Service Innovation,
Embeddedness and Business Performance: Evidence from Northern Ireland Regional
Studies Vol. 44 , Iss. 8,2010 Mac Flynn, Paul (2014) Hours and Earnings in the Northern Ireland Labour Market Belfast:NERI Mac Flynn, Paul (2015) Public Sector Employment in Northern Ireland Belfast:NERI Mildenberger, J., Sveikauskas, L., Rowe, S., Price, J. and A. Young (2014) Productivity Growth in
Construction Washington DC: BLS Northern Ireland Statistics and Research Agency (2014) UK Innovation Survey 2013: Northern
Ireland Results Belfast: NISRA. Northern Ireland Statistics and Research Agency (2015) Annual Survey of Hours and Earnings
Belfast: NISRA. Northern Ireland Statistics and Research Agency (2016) Structure of the NI Economy:
Experimental Results Belfast: NISRA. Northern Ireland Statistics and Research Agency (2016) Output in the Construction Industry – Office for National Statistics (2014) Real Estate Activities Industry Review – 2014 London: ONS. Office for National Statistics (2014b) Public Administration, Defence and Compulsory Social
Security Industry Review - 2014 Review – 2014 London: ONS. Office for National Statistics (2015) Regional Gross Value Added (Income Approach) London:
ONS. Office for National Statistics (2016) Annual Population Survey London: ONS. Office for National Statistics (2016) Business Population Estimates London: ONS. Office for National Statistics (2016) Construction Statistics: No 17, 2016 Edition London: ONS. Office for National Statistics (2016) Regional Productivity Series London: ONS. Office for National Statistics (2016) Regional Productivity Series London: ONS. Office for National Statistics (2016) UK Innovation Survey 2015 London: ONS.

30
Office for National Statistics (2016) Workforce Jobs London: ONS. Organisation for Economic Co-operation and Development (2016) Further Results from the
Survey of Adult Skills Paris: OECD. Q1 2016 Belfast NISRA. Uppenberg, Kristian & Hubert Strauss (2010) Innovation and productivity growth in the EU
services sector Luxembourg: EIB Vogl, B. and Abdel-Wahab, M. (2014). "Measuring the Construction Industry’s Productivity
Performance: Critique of International Productivity Comparisons at Industry Level." J. Constr. Eng. Manage., 10.1061/(ASCE)CO.1943-7862.0000944, 04014085.

31
RECENT NERI WORKING PAPERS
The following is a list of recent research working papers from the NERI. Papers are available to download by clicking on the links below or from the NERI website: http://www.nerinstitute.net/research/category/neriworkingpaperseries/
Number Title/Author(s) 38 Divisions in Job Quality in Northern Ireland – Lisa Wilson
37 Employees on the Minimum Wage in the Republic of Ireland –Micheál L. Collins
36 Modelling the Impact of an Increase in Low Pay in the Republic of Ireland – Niamh Holton and Micheál L. Collins
35 The Economic Implications of BREXIT for Northern Ireland – Paul Mac Flynn
34 Estimating the Revenue Yield from a Financial Transactions Tax for the Republic of Ireland – Micheál L. Collins
33 The Fiscal Implications of Demographic Change in the Health Sector – Paul Goldrick-Kelly
32 Understanding the Euro Crisis: Causes and Fixes – Thomas A. McDonnell
2015:
31 Cultivating Long-Run Economic Growth in the Republic of Ireland– Thomas A. McDonnell
30 Incomes in Northern Ireland: What’s driving the change – Paul Mac Flynn
29 Earnings and Low Pay in the Republic of Ireland: a profile and some policy issues – Micheál L. Collins
28 Internal Devaluation and Labour Market Trends during Ireland's Economic Crisis - Thomas A. McDonnell and Rory O’Farrell
27 A Profile of those on the Minimum Wage – Micheál L. Collins
25 Taxes and Income Related Taxes Since 2007 - Micheál L. Collins
24 A New Industrial Policy for Northern Ireland - Paul Mac Flynn
23 The Better is Yet to Come: a social vision and an economic strategy for Ireland in the 21st Century – Tom Healy
22 Outsourcing in the Public Sector: a value for money perspective – Aoife Ní Lochlainn and Micheál L. Collins
2014:
21 Assessing Funding Models for Water Services Provision in Ireland - Thomas A. McDonnell
20 Modelling the Distributive Impact of Indirect Taxation Changes in the Republic of Ireland - Micheál L. Collins
19 The Distributive Effects of Recent VAT changes in the Republic of Ireland - Micheál L. Collins
18 Total Direct and Indirect Tax Contributions of Households in Ireland: Estimates and Policy Simulations - Micheál L. Collins
17 Hours and Earnings in the Northern Ireland Labour Market - Paul Mac Flynn
16 Pension Policy in Ireland: an evaluation – How we Might Better Achieve its Stated Aims – Eamon Murphy
15 An Overview of the Irish Labour Market – Rory O’Farrell 14 We Need to Talk About Higher Education – Austin Delaney and Tom
Healy