productivity improvement service - invest northern … · productivity improvement service page iii...
TRANSCRIPT
PRODUCTIVITY IMPROVEMENT SERVICE
EVALUATION - FINAL
6th
January 2014
PRODUCTIVITY IMPROVEMENT SERVICE
EVALUATION
CONTENTS
Page
EXECUTIVE SUMMARY .............................................................................................................................. i
Introduction .................................................................................................................................................... i
The Productivity Improvement Service .......................................................................................................... i
Strategic Context and Rationale .................................................................................................................... ii
Recommendations ......................................................................................................................................... v
1. INTRODUCTION AND BACKGROUND............................................................................................ 7
1.1 Introduction .......................................................................................................................................... 7
1.2 The Productivity Improvement Service ................................................................................................ 7
1.3 Invest NI’s Requirements ................................................................................................................... 13
1.5 Methodology ...................................................................................................................................... 14
2. STRATEGIC CONTEXT & RATIONALE ........................................................................................ 15
2.1 Introduction ........................................................................................................................................ 15
2.2 Service Rationale ................................................................................................................................ 15
2.3 Strategic Context ................................................................................................................................ 16
2.4 Summary Conclusions ........................................................................................................................ 18
3. PROGRAMME ACTIVITY ................................................................................................................. 19
3.1 Introduction ........................................................................................................................................ 19
3.2 Service Marketing .............................................................................................................................. 19
3.3 Service Referrals and Demand ........................................................................................................... 19
3.4 Business Support Delivered ............................................................................................................... 22
3.5 Risks ................................................................................................................................................... 27
3.6 Equality Considerations...................................................................................................................... 28
3.7 Summary Conclusions ........................................................................................................................ 29
4. STAKEHOLDERS’ SATISFACTION WITH, & VIEWS OF, THE PIS SERVICE ..................... 31
4.1 Introduction ........................................................................................................................................ 31
4.3 Marketing and Promotion ................................................................................................................... 32
4.4 Satisfaction with the Support Provided .............................................................................................. 32
4.5 Overall Satisfaction with the Support ................................................................................................. 35
4.6 Willingness to pay for support ........................................................................................................... 36
4.7 Businesses’ Recommendations for Improvement .............................................................................. 37
4.8 Summary Conclusions ........................................................................................................................ 38
5. IMPACT OF THE PIS SERVICE ....................................................................................................... 39
5.1 Introduction ........................................................................................................................................ 39
5.2 Businesses’ Ability to Integrate Productivity Improvement Measures .............................................. 39
5.3 Activity Deadweight/Additionality .................................................................................................... 41
5.4 Nature and Extent of Market Failure .................................................................................................. 42
5.5 Achievement of Operational Impacts ................................................................................................. 44
5.6 Achievement of Business Outcomes .................................................................................................. 45
5.8 Duplication ......................................................................................................................................... 53
5.9 Wider and Regional Benefits .............................................................................................................. 53
5.10 Case studies .................................................................................................................................... 54
5.11 Summary Conclusions ................................................................................................................... 62
6. ACHIEVEMENT OF OBJECTIVES .................................................................................................. 63
6.1 Introduction ........................................................................................................................................ 63
6.2 Overview and progress towards PIS targets ....................................................................................... 63
7. BENCHMARKING ............................................................................................................................... 65
7.1 Introduction ........................................................................................................................................ 65
7.2 Summary Conclusions ........................................................................................................................ 69
8. PROGRAMME FINANCE ................................................................................................................... 70
8.1 Introduction ........................................................................................................................................ 70
8.2 Proposed versus Actual Costs ............................................................................................................ 70
8.3 GVA Return-on-investment ............................................................................................................... 70
8.4 Cost Effectiveness .............................................................................................................................. 71
8.5 Value-for-Money ................................................................................................................................ 71
9. CONCLUSIONS & RECOMMENDATIONS .................................................................................... 74
9.1 Introduction ........................................................................................................................................ 74
9.2 Conclusions ........................................................................................................................................ 74
9.4 Recommendations .............................................................................................................................. 78
APPENDICES
I Glossary of Productivity Terms
II PIS Interventions supporting different Operational Performance Stages
III Detailed PIT Enquiry/Engagement Process
IV Evaluation Requirements
V Overview of Training Delivered
VI Deadweight and displacement analysis
VII Additional Case Studies
VIII Progress towards balanced scorecard targets
IX Additional Benchmarking Analysis
X Disaggregation of Staff Costs
This report has been prepared for, and only for Invest NI and for no other purpose. Cogent Management Consulting
LLP does not accept or assume any liability or duty of care for any other purpose or to any other person to whom this
report is shown or into whose hands it may come save where expressly agreed by our prior consent in writing.
List of Abbreviations
Abbreviation Definition
ADS Aerospace, Defence and Security Sector
BAs Business Advisers
CEs Client Executives
EAM Economic Appraisal Methodology
ERNI Employers National Insurance Contributions
FTE Full Time Equivalent
GB Great Britain
GVA Gross Value Added
HM Her Majesty's
HMT's Her Majesty's Treasury
IA Innovation Adviser
Invest NI Invest Northern Ireland
LED Local Economic Development
LFT Lean Fundamentals Training
MAS Manufacturing Advisory Service
NEDp Non-Executive Director Programme
NI Northern Ireland
NIGEAE Northern Ireland Guide to Expenditure Appraisal and Evaluation
PIA Productivity Improvement Advisers
PIM Productivity Improvement Manager
PIS Productivity Improvement Service
PIT Productivity Improvement Team
PSA Public Service Agreement
R&D Research and Development
R,D&I Research, Development and Innovation
SC21 Supply Chains for the 21st Century
TPM Total Productive Maintenance
SMART Specific, Measurable, Achievable, Realistic and Time-bound
SMAS Scottish Manufacturing Advisory Service
SMEs Small and Medium Sized Enterprises
SMED Single-Minute Exchange of Dies
UK United Kingdom
PRODUCTIVITY IMPROVEMENT SERVICE Page i
EXECUTIVE SUMMARY
Introduction
Invest NI has commissioned Cogent Management Consulting LLP (‘Cogent’ or the Evaluation Team) to
undertake an independent evaluation of its Productivity Improvement Service (‘PIS'), covering the period 1st
September 2011 to 31st March 2014.
The evaluation has been undertaken in line with national and regional requirements. It is compliant with
Central Government guidance including:
“The Green Book: Appraisal and Evaluation in Central Government”, HM Treasury 2003;
“The Northern Ireland Guide to Expenditure Appraisal and Evaluation (NIGEAE), Current Edition”,
Department of Finance and Personnel;
“The Magenta Book: Guidance for Evaluation”; and
Invest NI Economic Appraisal Methodology (EAM) guidance.
The Productivity Improvement Service
The PIS was established in October 2009 with the overarching aim to deliver an improvement in the
productivity, competitiveness and sustainability of participating NI businesses by creating awareness and
understanding of productivity improvement concepts, tools and techniques to deliver sustainable productivity
improvements.
The PIS is based around the delivery of tailored one-to-one and/or one-to-many support to assist businesses
to introduce ‘Lean Thinking’ and effective supply-chain management approaches in order to enhance their
operational efficiency and productivity during different periods of operational performance.
The Service is delivered free-of-charge by Invest NI’s Productivity Improvement Team (PIT), supported by
external expertise as and when required, and is available to all Invest NI clients regardless of size and sector.
Whilst the nature and intensity of the support that is provided will vary depending on business need,
businesses are potentially able to avail of the following support:
Visit, Contact and Advice - This support is the least intensive type of support provided by the PIS and typically
involved the Team responding to less-complex/intensive requests for support by providing advice by telephone, emails
and/or during a company visit and signposting businesses to potential other forms of support (that were more relevant
for their needs);
Diagnostic and Action Planning - If deemed necessary, the PIT will perform a productivity diagnostic/assessment
which will seek to identify business constraints, possible improvement opportunities and (where possible) provide
advice to the company to help them resolve immediate operational / business problems. An action plan will be delivered
to the business which will identify a number of issues and problems to address and may recommend more in-depth
support through attendance at training workshops and/or an intervention;
Awareness, Networking and Training - Delivered on a one-to-many basis, these PIT delivered activities seek to raise
awareness and understanding of ‘Lean Thinking’ and supply chain management as a basis to drive productivity
improvements. This will include the dissemination of marketing materials and delivery of benchmarking best practice
networking events (e.g. Beyond Operational Excellence, Hoshin Kanri) and training (e.g. Lean Fundamental Training
(LFT), Supply Chain Management Fundamentals Training, Lean for Services);
One-to-One Mentoring Support - The most intensive form of support involves a PIT Advisor providing between 5 -
10 days of tailored mentoring support to implement a specific productivity improvement project that offers the potential
to achieve real and quantifiable improvements in the business (‘transformational change’). A key feature of the Service
is that it seeks to provide businesses with the skills and knowledge to implement effective productivity improvement
measures rather than implementing the measures on behalf of the business. Whilst the nature of the project support will
differ depending on business need, the PIT will typically utilise a range of lean and supply chain tools and techniques
(e.g. Value Stream Maps, Total Productive Maintenance (TPM), 7 Quality Tools, A3, Six Sigma etc.) with the aim of
achieving tangible productivity outcomes;
Information/Signposting - There may be occasions when the PIT need to refer a particular company to other services
or programmes which are ‘non-core’ to PIT, for example strategy development or marketing. Where possible, PIT will
help clients access the most appropriate Invest NI resources. Where support / services have to be sourced outside of
Invest NI, the PIT will liaise with the client to identify the most appropriate provider.

PRODUCTIVITY IMPROVEMENT SERVICE Page ii
Strategic Context and Rationale
At the time of approval, there was a need for Government to provide support to encourage greater levels of
innovation in order to facilitate business growth and reduce the productivity gap with other UK regions.
Research suggested that a number of market failures (including asymmetric information and co-ordination
failures) and non-market failure factors (e.g. constraints relating to capacity and throughput, businesses
utilising inefficient and ineffective equipment etc.) were preventing businesses from implementing measures
to address operational inefficiencies and improve productivity independent of receiving support.
Reflecting this market need, the NI Government (including DETI and Invest NI) placed a strong emphasis on
the need for support to be provided to encourage businesses to:
Address barriers to business growth;
Increase innovation in its widest sense including encouraging businesses to transform creative thinking
into new and improved processes (i.e. engage in process innovation);
Embed a culture of change in approach and behaviours within NI businesses and their leaders; and
Increase business’ understanding of innovation and facilitate the exchange and exploitation of
knowledge by supporting businesses with high growth and export potential to apply the use of
Productivity Improvement Tools and Techniques in order to leverage competitive advantage from the
innovation process
It is the Evaluation Team’s view that there was, and continues to be, clear alignment between the aims and
objectives of the PIS and the strategic imperatives of the NI Government (including with DETI and Invest
NI’s Corporate Plans).
Indeed, based upon the outcomes derived by recipients of support, the Evaluation team concludes that the
PIS made a positive contribution to realising these strategic imperatives.
Operation and Delivery (TOR Points 32e-32h)
The PIS is based around the delivery of tailored one-to-one and/or one-to-many support to assist businesses
to introduce ‘Lean Thinking’ and effective supply-chain management approaches in order to enhance their
operational efficiency and productivity. The Service was managed and delivered internally within Invest NI
(by the PIT) who drew upon external expertise, as and when required.
A total of 459 unique businesses received support through the PIS during the period under review. The
intensity of the support that was ultimately delivered was tailored to business’ specific needs. For example,
the analysis suggests that:
The PIT visited and provided advice to 211 NI businesses on 224 separate occasions;
47 businesses received a productivity diagnostic plan;
There were 665 employee attendances from 231 unique businesses at the benchmarking / best practice networking
events;
There were 1,739 employee attendances from 213 unique businesses at 105 training sessions during the period
under review; and
137 businesses commenced one-to-one mentoring engagement during the period, the majority of which sought to
assist them to implement lean thinking and principles within their business. Just under two-thirds of businesses
(64% - N=138) have completed their one-to-one mentoring engagements with the PIT, with the remainder of
businesses (36% - N=138) continuing to receive support within their respective areas.
It is Invest NI’s view, and shared by the Evaluation Team, that a level of latent demand presently exists for
PIS support. This assertion is based on the fact that:

PRODUCTIVITY IMPROVEMENT SERVICE Page iii
Despite the broadly equal split in Invest NI’s client base between manufacturing and service-based
businesses, monitoring information provided by Invest NI indicates that circa four-fifths of the RDS’
raised were for businesses from the manufacturing sector. It is Invest NI’s view, and shared by the
Evaluation Team based on its discussions with a number of CEs and businesses that did not engage with
the Service, that this is likely to reflect the fact that there continues to be a misconception (both amongst
a number of CEs and within the NI business base) that productivity improvement tools and techniques
are more overtly focused on supporting manufacturing rather than service-based businesses.
It is the PIT’s view that, while progress has been made in working with businesses from a more diverse
range of sectors, further work is required to support businesses such as those operating in the ICT,
financial/transactional services, and legal sectors. In addition to the misconception that may exist
amongst these businesses with regards to the applicability of lean concepts to non-manufacturing sectors,
consultation with Invest NI indicates that there may be additional issues relating to the perceived
credibility and technical ability of the PIT to provide support to these sectors;
Latent demand is likely to exist within Invest NI’s manufacturing client base which the PIT has thus far
not been able to address (e.g. due to the availability of resource, a perceived view amongst some
businesses that they do not require support and/or do not feel that the Service can provide the support
that they require). The Evaluation Team’s consultation with a number of manufacturing businesses, that
had not received support through the Service, provides weight to this view with a number of businesses
expressing strong interest in receiving support from the Service moving forward;
Whilst noting that considerable work has been undertaken to provide productivity support in the area of
supply-chain management, it is Invest NI’s view that additional work could be undertaken in this area. It
was noted that the Wrightbus supply-chain intervention model could potentially be rolled out to a
number of strategically important NI businesses;
Consultation with the PIT indicates that the majority of effort has been placed on the delivery of support
to businesses facing operational instability or stability. However, it is Invest NI’s view that additional
work is required to support businesses operating at the managed improvement stage which are seeking to
implement strategic change management practices and more formally embed a culture of continuous
improvement; and
Moving forward it is the PIT’s view that additional work should be undertaken to address the needs of
high growth businesses.
It will be essential that a holistic Corporate-wide strategy is developed to address this demand (assuming that
appropriate levels of resourcing are made available). We have identified a number of recommendations for
Invest NI’s consideration in this regard.
Based upon the feedback from businesses, we consider that the Service was, in general, managed and
delivered in a proactive and efficient manner by Invest NI, with the Service’s content, structure and delivery
model being appropriately developed on reflection of evolving client need. This has, in the Evaluation
Team’s view, contributed to support being channelled in an effective and efficient manner to address the
needs of NI businesses.
The feedback from businesses in receipt of PIS support during the period under review also suggests that
(amongst other things):
The content, structure and duration of support is, on the whole, appropriate to meet the needs of
businesses;
The PIT, and any supporting external expertise, transferred relevant knowledge and advice in a timely
manner; and
Recipients of one-to-one mentoring support welcomed the tailored nature of support that was provided
and the range of practical productivity improvement tools that were adopted by the PIT.
PRODUCTIVITY IMPROVEMENT SERVICE Page iv
Reflecting the quality of the support received and subsequent impact that it made on recipients of support,
the vast majority of businesses suggested that the support was effective in meeting their needs and this was
reflected in (amongst other things) the high proportion of businesses that had taken forward the process
innovation activities based on the advice provided by the PIT.
Given the levels of demand for the PIS, business’ high levels of satisfaction with the support and the positive
contribution of the Service to the NI economy, the Evaluation Team would suggest that Invest NI’s overall
approach to risk management was robust and proportionate.
Based upon monitoring information provided by Invest NI, the actual full economic cost of delivering the
PIS during the period under review was c. £1.1m. £892k (or 83%) of these costs were in the form of staff
costs (primarily associated with the PIT) and the remainder (c. £185k or 17%) related to other delivery costs.
Performance and Impact (TOR Points 32i-32m)
Based on the feedback from businesses in receipt of support, the following key conclusions can be drawn
with regards to the monetary and non-monetary economic impact made by the PIS during the period under
review:
The Service has stimulated process innovation amongst recipient businesses by enhancing (amongst
other things) their:
Ability to identify the issues that were inhibiting their productivity;
Understanding of the productivity improvement tools and techniques that can be employed to
improve their productivity; and
Ability and confidence to ultimately integrate the productivity tools and techniques within the
business.
Levels of activity (61%) and impact (59%) additionality should be viewed positively (especially when
benchmarked against other programmes/interventions) indicating that the Service has played a strong
role in encouraging business to undertake productivity improvement activities and subsequently realise
benefit from the support;
Market failure, typically in the form of asymmetric information, has played a strong role in preventing
businesses from taking forward similar productivity improvement activities independent of support;
The Evaluation Team’s analysis suggests that that the displacement factor at the NI level is 12.95%;
whilst at the GB level it is 16.38%;
Positively, from a monetary perspective the analysis suggests that the PIS has:
Contributed £19.6m in gross or £10.1m in net additional GVA;
Supported the creation of 90 gross or 46 net additional FTE jobs;
Safeguarded 330 gross or 195 net additional jobs; and
Delivered £2,767 in gross or £1,421 in net additional annual productivity per FTE.
The feedback from businesses also suggests that the support has assisted them to realise a number of
non-monetary benefits including (but not limited to) increasing competitiveness and sustainability and
embedding a cultural shift towards continuous productivity improvement across organisations.
The majority of businesses suggests that they would not have been able to get similar support elsewhere;
and

PRODUCTIVITY IMPROVEMENT SERVICE Page v
The Service has contributed to providing the NI economy with a number of other wider (including
knowledge transfers and skills development) and regional (including the innovative nature of the project)
benefits.
Return-on-Investment and VFM
Given the level of net additional GVA (i.e. £10,061,559) that has been provided by the Service and the full
economic cost of delivering the support (i.e. £1,076,7981), then the GVA return on investment is £1:£9.34
2.
It is the Evaluation Team’s view, based upon all available evidence, that the PIS delivered VFM in respect of
the costs incurred, during the period under review.
Equality Considerations (TOR Points 32r)
The Evaluation Team has identified no negative equality impacts, and considers the Service to be accessible
to all Section 75 groupings and people with disabilities.
Recommendations
1. Given the reported positive impacts that the PIS has had on businesses and the wider NI economy, and
evidence of continued need for support, Invest NI should continue to provide support through its PIS. In
doing so all appropriate approvals should be sought in a timely manner to ensure the continuity in the
provision of support to NI’s business base.
2. Invest NI should develop a holistic strategy to addressing the latent demand that is likely to exist for the
Service. It is the Evaluation Team’s view that such a Strategy should include (at a minimum)
consideration of:
a) Undertaking additional internal and external awareness raising activities. These activities should
place focus on clearly articulating (amongst other things) the:
Nature of activity that the Service seeks to support (and importantly the activity that it will not
support);
Nature and levels of support that is available to businesses; and
The wider range of sectors that productivity improvement tools and techniques can potentially
be embedded.
b) Utilising external expertise to support the PIT in building credibility and sector-specific
knowledge/expertise in those non-manufacturing sectors where the Service has had more limited
impact e.g. ICT, transactional services etc. This may involve the external expertise leading initial
business engagements with the PIT providing a supporting role until such times when it has built a
suitable level of credibility and sector-specific knowledge to facilitate these engagements alone.
c) Linked to Recommendation 2b, by way of fostering demand and buy-in for the Service within these
sectors, Invest NI should seek leverage from its considerable industry linkages e.g. with ICT
businesses through the various collaborative networks that have been established as part of the
Collaborative Network Programme (CNP) and Momentum (the NI ICT Federation). Invest NI
should ensure that suitable marketing/promotional materials (e.g. case studies) are created from these
engagements and distributed to other businesses operating within these sectors;
1 Please note that this cost excludes time spent by PIT members on wider Invest NI and PIT corporate responsibilities
(i.e. non-core delivery activities such as assessing Local Economic Development (LED) and INTERREG applications,
undertaking Business Health Checks and caseworks/appraisals etc.). 2 Return-on-investment is based on actual outcomes derived to date i.e. excludes outturns anticipated to be derived by
businesses in the future.
PRODUCTIVITY IMPROVEMENT SERVICE Page vi
d) Providing additional resources e.g. through an expansion in the number of PIAs and/or the wider use
of external expertise to support the PIT (as and when required);
e) Reviewing the appropriateness of the range of interventions that are available to support businesses
to implement longer-term strategic cultural and change management practices and more formally
embed a culture of continuous improvement; and
f) Reviewing how best to integrate the wider range of Invest NI supports/interventions to address
businesses’ productivity improvement needs. Consideration should also be given to including a
formal meeting between the PIT, the business recipient and their CE to identify any further support
required by the business.
3. In line with NIGEAE guidance, Invest NI should ensure that appropriate consideration is given to
identifying the full-economic costs of delivering any future phase of the Service. The Appraisal should
also focus upon establishing a more appropriate mix of SMART activity, output and outcome targets
which are more intrinsically focused and linked with the overarching aims and anticipated outcomes of
the Service. The outcomes of this evaluation should be used to inform all future target setting.
4. Invest NI should undertake a review of its procedures for monitoring the activity delivered by Service.
Ultimately, monitoring information should be collated and retained on a central database that clearly
identifies (at an individual business level) the:
Activity that was delivered (including who the support was delivered to, when it was delivered, the
number of one-to-one mentoring projects completed and the number of days support provided to
each business); and
The impacts and outcomes that were achieved. This will require monitoring to be completed on a
consistent basis and the nature of impact/outcome metrics to be clearly defined.
All information monitored should be, at a minimum, intrinsically linked to the SMART objectives that
are established for the Service.
5. Linked to Recommendation 4, and by way of assisting post programme evaluation, consideration should
be given to establishing (where possible) quantified baselines in relation to key operational impact (e.g.
levels of output cycle times, changeover times, delivery performance) and business outcome (e.g.
turnover, costs) metrics.
6. Whilst the Evaluation Team is not aware of Invest NI’s corporate policies on the storage of corporate
information or its practices in terms of storing information, we recommend that all Service-related
information is saved and filed appropriately in a central repository on Invest NI’s server. This should
include all pertinent programme information including Economic Appraisals (where completed),
casework papers, approval documentation and all programme monitoring information.
7. Consideration should be given to businesses being required to make a financial contribution to the
receipt of one-to-one mentoring support. The benefits of such a system should be carefully weighed up
against the potential impact on levels of demand and the costs associated with administering the system.
8. Consideration should be given to establishing a networking forum whereby businesses in receipt of
support can share good practice.
PRODUCTIVITY IMPROVEMENT SERVICE Page 7
1. INTRODUCTION AND BACKGROUND
1.1 Introduction
Invest NI has commissioned Cogent Management Consulting LLP (‘Cogent’ or the Evaluation Team)
to undertake an independent evaluation of its Productivity Improvement Service (‘PIS'), covering the
period 1st September 2011 to 31
st March 2014.
The evaluation has been undertaken in line with national and regional requirements and is compliant
with Central Government guidance including:
“The Green Book: Appraisal and Evaluation in Central Government”, HM Treasury 2003;
“The Northern Ireland Guide to Expenditure Appraisal and Evaluation (NIGEAE), Current
Edition”, Department of Finance and Personnel;
“The Magenta Book: Guidance for Evaluation”; and
Invest NI Economic Appraisal Methodology (EAM) guidance.
1.2 The Productivity Improvement Service
1.2.1 Background to the Development of the PIS3
In August 2008, Invest NI sought (and was subsequently granted) internal approval for the delivery of
a Demand Stimulation Programme (later renamed as the ‘Innovation Programme’) which would offer
targeted innovation development programmes for the period September 2008 to March 2011 aimed at
improving the productivity, competitiveness and sustainability of NI businesses 4.
The Programme was built around a model whereby a team of Innovation Advisers (IAs)5 would aim to
stimulate demand for Invest NI innovation support, promote innovation and assist businesses to
maximise efficiencies including by (amongst other things):
Encouraging businesses to adopt new technologies and apply technology in ways that will have a direct
impact on profitability;
Assisting NI companies to develop and implement strategies to drive down costs, improve productivity,
reduce waste to landfill and deliver CO2 savings; and Facilitating the implementation of quantifiable productivity improvements through the introduction of a
“Lean Thinking” based approach to productivity improvement.
During October 2009, Invest NI established the PIS as part of the wider Innovation Programme. The
Service was initially established6 for the period October 2009 - August 2011 with the overarching aim
to deliver an improvement in the productivity, competitiveness and sustainability of participating NI
businesses by creating awareness and understanding of productivity improvement concepts, tools and
techniques to deliver sustainable productivity improvements. Associated objectives of the Service
included to:
3 Please note a glossary of productivity terms which are frequently used in this Evaluation report is included in
Appendix I. 4 At that time Invest NI had secured funding from the Innovation Fund which had been established to support projects
which had a clear commercial focus and were linked to one or more of the following five strands: Innovation and
Stimulation; Research & Innovation Capacity; International Collaboration; New/Emerging Technologies; and Energy. 5 The Team was made up of 15 Innovation Advisers and 5 additional administrative personnel on fixed term contracts.
6 Initially the PIS model of delivery was based upon a ‘5 levels of intervention support’ model established by the
Manufacturing Advisory Service (MAS) model for England and Wales and subsequently deployed by the Scottish
Manufacturing Advisory Service (SMAS).
PRODUCTIVITY IMPROVEMENT SERVICE Page 8
Create an awareness of productivity improvement opportunities and processes across Invest NI clients and
the wider business community;
Build credibility in regards to practical, hands-on productivity improvement advice and support to
companies from the manufacturing and private services sector; and
Provide hands-on, practical advice and support to facilitate real, measureable value-add to participating
companies from the manufacturing and private services sectors.
An internal review of the PIS’ activities and impacts was conducted in September 2011 which resulted
in a business case being approved to expand the nature, scale and scope of activity delivered through
its PIS over the 2011 – 2015 period, in response to emerging client needs (see Section 3). On
reflection of the development in the Service and levels of demand, Invest NI sought (and was granted)
approval to expand its complement of staff to deliver productivity improvement activities during this
period7.
1.2.2 Defining Productivity
Productivity is an average measure of the efficiency of production. It can be expressed as the ratio of
output to inputs used in the production process, i.e. output per unit of input.
Measures of labour productivity, the value of output produced by workers (i.e. GVA/FTEs), are often
used to track progress in overall productivity8. Broader measures of productivity can also include other
inputs in addition to labour such as equipment and raw materials (the calculation of which can provide
an estimate of Total Factor Productivity). Assets such as vehicles, computers and software play an
important role in helping workers to produce goods and services. However, the value of the role
played by different assets is difficult to measure at a UK level and is significantly more challenging at
the NI level with larger gaps in economic and financial data.
In the context of the PIS, the Service seeks to support businesses to enhance their operational
efficiency which will ultimately result in the realisation of quantifiable business outturns primarily in
the form of reduced costs and/or increased turnover9. Thus, it is anticipated that the productivity
improvement measures embedded as a result of the support provided by the Service will result in
enhanced levels of labour productivity at a business level.
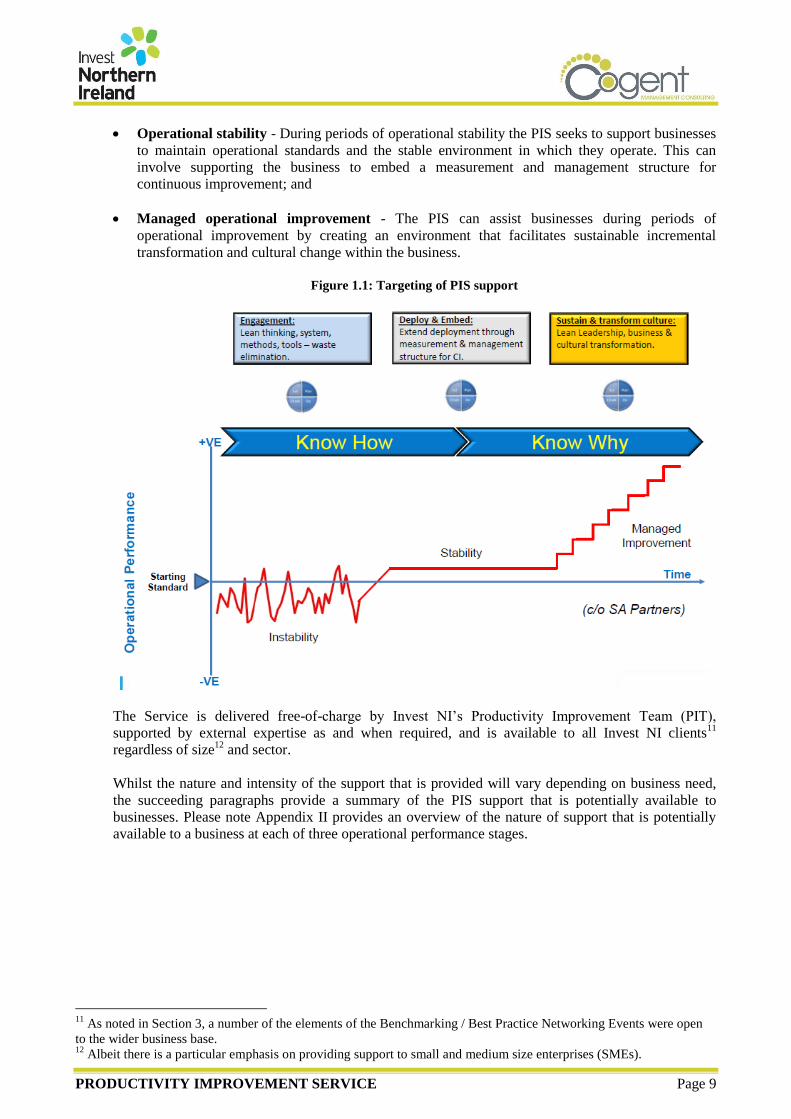
1.2.3 Model of Programme Delivery
The PIS is based around the delivery of tailored one-to-one and/or one-to-many support to assist
businesses to introduce ‘Lean Thinking’10
and effective supply-chain management approaches in order
to enhance their operational efficiency and productivity during different periods of operational
performance, including during periods of:
Operational instability - Businesses facing operational instability can be provided with support
to shape their environment by diagnosing and implementing measures to address inefficiencies
and ‘waste’ that are inhibiting their productivity;
7 Specifically, Invest NI increased the size of the Productivity Improvement Team (PIT) from 6 (1 Lean Process
Manager, 4 Productivity Improvement Advisers (PIAs), and administrative officer) to 8 through the provision of 2
additional PIAs. 8 Indeed this is the standard measure of productivity that has been adopted by Invest NI.
9 Whilst not the primary focus of the productivity improvement activities, the operational changes may also result in
changes in employment. 10
“Lean” is best defined as a management philosophy that focuses on reducing waste in all business processes.
PRODUCTIVITY IMPROVEMENT SERVICE Page 9
Operational stability - During periods of operational stability the PIS seeks to support businesses
to maintain operational standards and the stable environment in which they operate. This can
involve supporting the business to embed a measurement and management structure for
continuous improvement; and
Managed operational improvement - The PIS can assist businesses during periods of
operational improvement by creating an environment that facilitates sustainable incremental
transformation and cultural change within the business.
Figure 1.1: Targeting of PIS support
The Service is delivered free-of-charge by Invest NI’s Productivity Improvement Team (PIT),
supported by external expertise as and when required, and is available to all Invest NI clients11
regardless of size12
and sector.
Whilst the nature and intensity of the support that is provided will vary depending on business need,
the succeeding paragraphs provide a summary of the PIS support that is potentially available to
businesses. Please note Appendix II provides an overview of the nature of support that is potentially
available to a business at each of three operational performance stages.
11
As noted in Section 3, a number of the elements of the Benchmarking / Best Practice Networking Events were open
to the wider business base. 12
Albeit there is a particular emphasis on providing support to small and medium size enterprises (SMEs).

PRODUCTIVITY IMPROVEMENT SERVICE Page 10
Visit, Contact and Advice
This support is the least intensive type of support provided by the PIS and typically involves the
Team:
Responding to less-complex/intensive requests for support by providing advice by telephone,
emails and/or during a company visit and signposting businesses to potential other forms of
support (that were more relevant for their needs); and
Dealing with requests for productivity assessments/diagnostics.
Diagnostic and Action Planning
If deemed necessary by the PIT in conjunction with the business, the Team performs a productivity
diagnostic/assessment which typically takes up to 1 day and is conducted at the client’s site.
The diagnostic seeks to identify business constraints, possible improvement opportunities and (where
possible) provide advice to the company to help them resolve immediate operational / business
problems. There is a distinction between the advice given at this level during the assessment and the
in-depth support provided during a one-to-one mentored project.
On completion of the productivity diagnostic/assessment an action plan is delivered to the business
which identifies a number of issues and problems to address and may recommend more in-depth
support through attendance at training workshops and/or a one-to-one mentored intervention. On
receipt of the action plan the business has four options:
1. Do nothing;
2. Carry out improvement with own internal resources;
3. Request attendance at training workshops and/or request one-to-one mentoring support; or
4. Obtain assistance from other Invest NI initiatives/programmes or from third party providers.
Awareness, Networking and Training
Delivered on a one-to-many basis, these activities delivered by PIT seek to raise awareness and
understanding of ‘Lean Thinking’ and supply chain management as a basis to drive productivity
improvements. This includes the creation and dissemination of materials and delivery of
benchmarking best practice networking events and training.
Service Awareness Raising
The PIT develops and delivers a range of awareness raising and promotional activities (e.g. targeted
mailshots, online case studies, presentations) to introduce ‘Lean Thinking’ and supply chain
management concepts in order to market the services delivered by the PIT. These are made available
to Invest NI (including the Regional Office Network), Invest NI clients and the wider business base (in
conjunction with the appropriate representative bodies such as local councils, Local Enterprise
Agencies, sector bodies etc.).
Benchmarking Best Practice Networking Events
The objective of the Benchmarking Best Practice Networking Events is to enable companies to
develop their processes and practices by sharing best practice information, learning from other
business’ experience, sharing solutions to common problems, benchmarking and collaborating on
issues of common interest. Benchmarking Best Practice Networking Events are typically held 3-4
times per annum.

PRODUCTIVITY IMPROVEMENT SERVICE Page 11
Each event deals with a specific productivity-related topic and includes a presentation delivered by an
industry expert. The events range in duration (from breakfast meetings to all day events) and typically
include a question and answer session and networking opportunities with other attendees.
Examples of benchmarking Best Practice Networking events delivered as part of the PIS includes:
Beyond Operational Excellence, Hoshin Kanri, Mastering Lean Product Development and the People
Side of Lean.
Training
The PIT, supported on occasions by external organisations, delivers one-to-many and one-to-one
training (typically onsite) to create awareness and understanding of lean thinking and supply chain
management concepts and the tools and techniques required to deliver sustainable productivity
improvements. All training materials are mapped against National Occupational Standards to ensure
alignment with best practice and industry requirements. This also provides an opportunity for the
attendees to consider using the training as a base for the achievement of nationally recognised
qualifications (e.g. NVQ Level III).
During the period of the evaluation the PIS has developed the range and scope of training considerably
and now includes: Lean Fundamental Training (LFT), Supply Chain Management Fundamentals
Training, Lean for Services, Total Productive Maintenance (TPM), Single-Minute Exchange of Dies
(SMED) and Practical Problem Solving.
One-to-One Mentoring Support
The most intensive form of support involves a PIT Advisor providing tailored mentoring support13
to
implement a specific productivity improvement project that offers the potential to achieve real and
quantifiable improvements in the business (‘transformational change’). These interventions can
therefore be viewed as progressing a business’ operation from its current state (as defined in the initial
Productivity Diagnostic and Action plan) to an improved state which results in added value and
tangible results. The project support involves working closely with business personnel on a ‘learn and
do’ basis, and hence typically involves a mix of training and work based facilitation/mentoring.
A key feature of the Service is that it seeks to provide businesses with the skills and knowledge to
implement effective productivity improvement measures rather than implementing the measures on
behalf of the business. In doing so, the service seeks to embed a sustainable business-led approach to
productivity improvement and develop a culture of continuous improvement within the business.
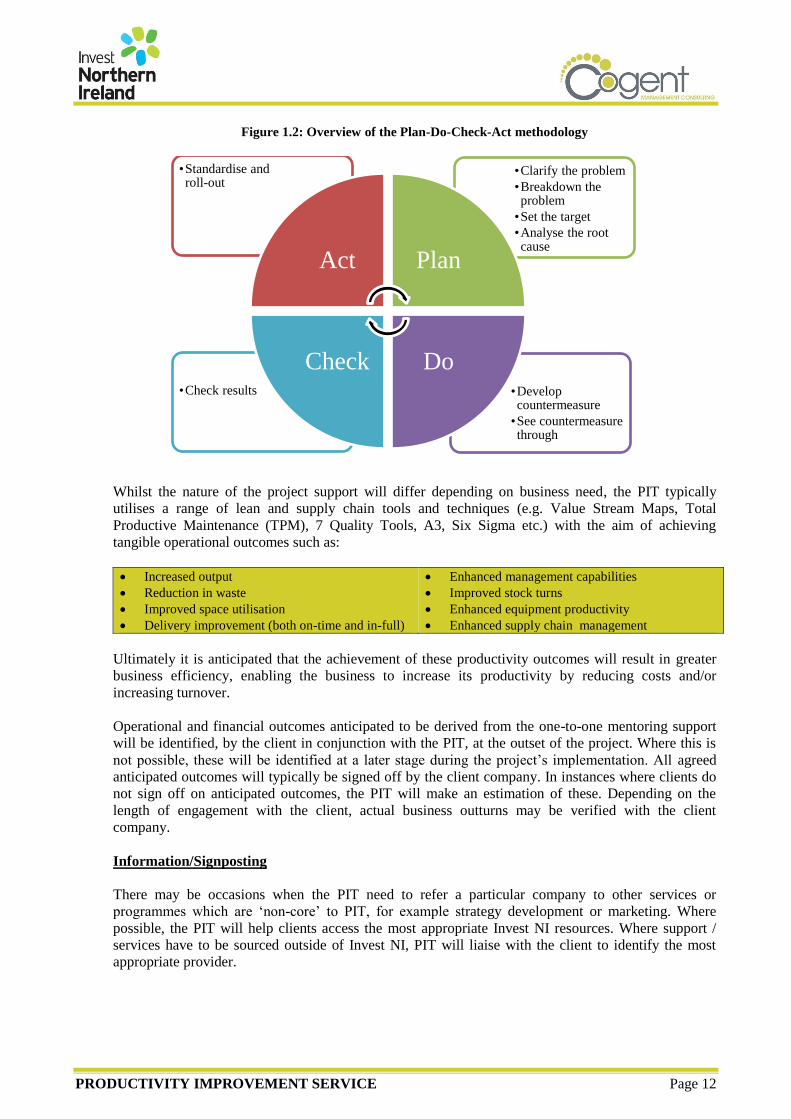
The one-to-one project support typically involves the PIT implementing an 8-step ‘Plan-Do-Check-
Act’ methodology in conjunction with the business.
13
The number of days of mentoring support will depend on the individual needs of the business.
PRODUCTIVITY IMPROVEMENT SERVICE Page 12
Figure 1.2: Overview of the Plan-Do-Check-Act methodology
Whilst the nature of the project support will differ depending on business need, the PIT typically
utilises a range of lean and supply chain tools and techniques (e.g. Value Stream Maps, Total
Productive Maintenance (TPM), 7 Quality Tools, A3, Six Sigma etc.) with the aim of achieving
tangible operational outcomes such as:
Increased output
Reduction in waste
Improved space utilisation
Delivery improvement (both on-time and in-full)
Enhanced management capabilities
Improved stock turns
Enhanced equipment productivity
Enhanced supply chain management
Ultimately it is anticipated that the achievement of these productivity outcomes will result in greater
business efficiency, enabling the business to increase its productivity by reducing costs and/or
increasing turnover.
Operational and financial outcomes anticipated to be derived from the one-to-one mentoring support
will be identified, by the client in conjunction with the PIT, at the outset of the project. Where this is
not possible, these will be identified at a later stage during the project’s implementation. All agreed
anticipated outcomes will typically be signed off by the client company. In instances where clients do
not sign off on anticipated outcomes, the PIT will make an estimation of these. Depending on the
length of engagement with the client, actual business outturns may be verified with the client
company.
Information/Signposting
There may be occasions when the PIT need to refer a particular company to other services or
programmes which are ‘non-core’ to PIT, for example strategy development or marketing. Where
possible, the PIT will help clients access the most appropriate Invest NI resources. Where support /
services have to be sourced outside of Invest NI, PIT will liaise with the client to identify the most
appropriate provider.
•Develop countermeasure
•See countermeasure through
•Check results
•Clarify the problem
•Breakdown the problem
•Set the target
•Analyse the root cause
•Standardise and roll-out
Act Plan
Do Check

PRODUCTIVITY IMPROVEMENT SERVICE Page 13
1.2.5 PIT Enquiry/Engagement Process
The following process has been broadly adopted by the PIT in response to a referral to the service (or
request for assistance)14
:
Figure 1.3: The PIT Enquire/Engagement Process
Reflecting the tailored nature of the support delivered through the PIT, it should be noted that a
business is not necessarily required to progress through each stage of this engagement process. Rather
the most appropriate business journey through the Service is determined by the PIT, in conjunction
with the business.
1.3 Invest NI’s Requirements
Invest NI requires an Evaluation of its PIS for the period 1st September 2011 to 31
st March 2014. The
overall evaluation objectives are to:
Determine the extent to which the principal aims, objectives and targets of the PIS intervention have
been met;
Determine the extent to which the intervention represents good Value For Money (VFM) and appropriate
use of public funds; and
Identify areas for PIS service/delivery improvement based on evaluation and customer feedback
(including external stakeholders) and make recommendations.
Further details of Invest NI’s specific requirements are detailed in full within Appendix IV.15
14
A more detailed summary of the Invest NI PIT Enquiry/Engagement process in provided in Appendix III. 15
Please note that the PIS also plays a role in supporting the aerospace, defence and security sector (ADS) initiative
Supply Chains for the 21st Century (SC21). However, on the direction of Invest NI, this work is outside the scope of the
Evaluation.
PRODUCTIVITY IMPROVEMENT SERVICE Page 14
1.5 Methodology
In conducting the evaluation, Cogent employed a methodology that included:
A robust desk-based analysis of pertinent materials relating to the PIS during the period under
review;
Consultation with the Steering Group that was established for the evaluation. This included
representation from Invest NI’s PIT;
Face-to-face consultation with members of the PIT (Le (N=8);
6 cases study visits to businesses that had completed (at a minimum) a one-to-one mentoring
engagement with the PIT;
A telephone survey with all other businesses that completed (at a minimum) a one-to-one
mentoring engagement with the PIT;
Distribution of an online survey to all remaining businesses that attended a benchmarking/best
practice networking event and/or attended training provided by the PIT;
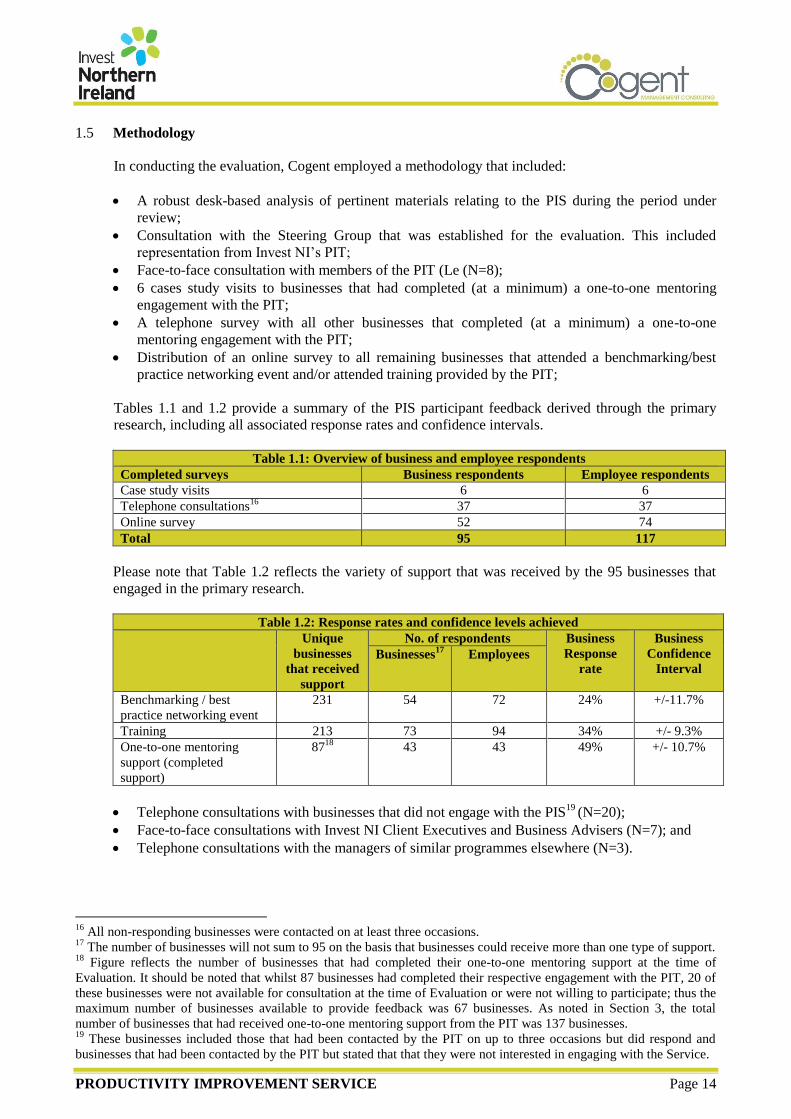
Tables 1.1 and 1.2 provide a summary of the PIS participant feedback derived through the primary
research, including all associated response rates and confidence intervals.
Table 1.1: Overview of business and employee respondents
Completed surveys Business respondents Employee respondents
Case study visits 6 6
Telephone consultations16
37 37
Online survey 52 74
Total 95 117
Please note that Table 1.2 reflects the variety of support that was received by the 95 businesses that
engaged in the primary research.
Table 1.2: Response rates and confidence levels achieved
Unique
businesses
that received
support
No. of respondents Business
Response
rate
Business
Confidence
Interval Businesses
17 Employees
Benchmarking / best
practice networking event
231 54 72 24% +/-11.7%
Training 213 73 94 34% +/- 9.3%
One-to-one mentoring
support (completed
support)
8718
43 43 49% +/- 10.7%
Telephone consultations with businesses that did not engage with the PIS19
(N=20);
Face-to-face consultations with Invest NI Client Executives and Business Advisers (N=7); and
Telephone consultations with the managers of similar programmes elsewhere (N=3).
16
All non-responding businesses were contacted on at least three occasions. 17
The number of businesses will not sum to 95 on the basis that businesses could receive more than one type of support. 18
Figure reflects the number of businesses that had completed their one-to-one mentoring support at the time of
Evaluation. It should be noted that whilst 87 businesses had completed their respective engagement with the PIT, 20 of
these businesses were not available for consultation at the time of Evaluation or were not willing to participate; thus the
maximum number of businesses available to provide feedback was 67 businesses. As noted in Section 3, the total
number of businesses that had received one-to-one mentoring support from the PIT was 137 businesses. 19
These businesses included those that had been contacted by the PIT on up to three occasions but did respond and
businesses that had been contacted by the PIT but stated that that they were not interested in engaging with the Service.

PRODUCTIVITY IMPROVEMENT SERVICE Page 15
2. STRATEGIC CONTEXT & RATIONALE
2.1 Introduction
Section 2 provides a high-level summary of the rationale that was approved for supporting the PIS
during the period under review, as well as reviewing the strategic context in which the Service
operated.
2.2 Service Rationale
A review of the approval and internal review documentation20
provided by Invest NI suggests that a
number of factors combined to provide a strong rationale for Government intervention. These
included:
NI’s relatively poor economic performance vis-à-vis other UK regions - At the time of
approval it was noted that there was a significant productivity gap with other UK regions, with
NI’s GVA per capita equating to c. 80% of the UK average. Research undertaken by Oxford
Economics suggested that two thirds of the productivity gap could be explained by lower
productivity in individual sectors with the remainder of the gap arising as a result of the industrial
structure of the NI economy (with NI having a relatively higher share of low productivity sectors
compared to the rest of the UK);
Low levels of innovation activity - A relatively low number and proportion of businesses were
actively engaged in undertaking Research, Development and Innovation (R,D&I) activities. For
example, at the time of approval, NI ranked joint lowest (along with Scotland) of the 12 UK
regions in terms of innovative activity by firms. Similarly, expenditure on R,D&I activities was
significantly lower than other UK regions with the region highly dependent on a relatively small
number of companies for a significant proportion of R&D expenditure;
Complexity of the managing innovation for change - The approval documentation highlighted
the complex nature of business innovation which typically requires businesses to simultaneously
manage the interaction of a number of key functions including technology, marketing, regulation,
financing and human resources. It was suggested that the “lack of critical support in these areas
can jeopardise a company’s entire innovation process”;
Barriers inhibiting operational effectiveness and business growth - It was noted that there
were a number of market failures, including asymmetric information and co-ordination failures,
that were preventing businesses from undertaking innovation-related activities including the
implementation of productivity improvement and cost saving measures. Examples of these market
failures include: a lack of awareness of the benefit of implementing productivity improvement
activities, a lack of knowledge on how to develop and implement the productivity improvement
activities, a lack of awareness of the expertise that could potentially provide the support required
by the business.
Based upon its own observations, the PIT also identified a range of other barriers that were
inhibiting the operational effectiveness, productivity and growth of NI’s business base. These
included: constraints relating to capacity and throughput, unnecessary capital expenditure,
businesses utilising inefficient and ineffective equipment, businesses incurring unnecessary costs
and excessive lead times.
20
Source: Proposal for the delivery of a Demand Stimulation Programme to encourage greater uptake of Invest NI’s
Innovation Products and Services (August 2008), Review of Activity and Impact under the Productivity and Innovation
Strands of the Innovation Fund (September 2011) and the Innovation Fund Business case for the Extension of the
Innovation Adviser contracts (December 2011).

PRODUCTIVITY IMPROVEMENT SERVICE Page 16
On the basis of these points, Invest NI identified a need to stimulate demand for innovation
interventions, promote innovation and assist businesses to maximise efficiencies. This included the
need to:
Make companies aware of up-to-date services, sources of funding and advice;
Provide a valuable external perspective, which prevents the company from becoming blinkered in its
approach to innovation;
Facilitate the process of seeking help, obtaining funding, saving time and accelerating the innovation
process;
Give confidence and encourage the uptake of more adventurous, leading edge projects rather than ‘safer’
routes;
Open up more innovation opportunities that had not been considered and help managers to look at their
business in a different way;
Provide hands-on, practical advice and support to facilitate real, measureable value-add to participating
companies from the manufacturing and private services sectors; and
Enable businesses to understand the true value of innovation.
2.3 Strategic Context
Subsection 2.3 provides a succinct overview of the strategic context in which the PIS operated during
the period under review. In doing so, the subsection considers (amongst other things) the ‘fit’ of the
Service with the DETI and Invest NI Corporate Plans that operated.
2.3.1 NI Programme for Government 2011-2015
The Programme for Government (PfG) 2011-2015 sets out that the Executive has taken the important
step of making the economy the top priority. The PfG contains 5 key priorities, one of which is:
“Growing a Sustainable Economy and Investing in the Future”. The primary purpose of this Priority
is to achieve long term economic growth by improving competitiveness and building a larger and
more export-driven private sector. To do this, the PfG notes that we must rebuild the labour market in
the wake of the global economic downturn and rebalance the economy to improve the wealth and
living standards of everyone.
Two specific PfG objectives that the PIS offered the potential to contribute to during the period under
review included:
Encouraging innovation and R&D; and
Growing the private sector.
Furthermore, in-line with the PfG, it is the Evaluation Team’s view that the Service also offered the
potential to target activities and resources in priority areas in order to “ensure that we stimulate action
and interventions to increase productivity and competitiveness, and enable local companies to grasp
opportunities”.
2.3.2 NI Economic Strategy - Priorities for Sustainable Growth and Prosperity
Within its Economic Strategy the NI Executive has established an overarching goal to improve the
economic competitiveness21
of the Northern Ireland economy. In order to achieve this, the Executive is
committed to strengthening our competitiveness through a focus on export led economic growth. The
Strategy suggests that this can only be achieved by rebalancing and rebuilding our economy.
21
Economic competitiveness is defined by the World Economic Forum as ‘the set of institutions, policies and factors
that determine the level of productivity of a country”.
PRODUCTIVITY IMPROVEMENT SERVICE Page 17
In-line with the strategic imperatives identified within the Economic Strategy, the PIS offered the
potential to contribute to the rebalancing of the NI economy by delivering higher productivity as a
result of stimulating greater levels of innovation, improving the skills and knowledge of the
workforce, assisting NI business to compete effectively within the global economy and encouraging
business growth.
2.3.3 Innovate NI - Innovation Strategy for Northern Ireland 2014-2025
Within its Innovation Strategy, the NI Executive has established that: “Northern Ireland, by 2025, will
be recognised as an innovation hub and will be one of the UK’s leading high-growth, knowledge-
based regions which embraces creativity and innovation at all levels of society”.
It is the Evaluation Team’s view that the PIS offered the potential to contribute to the following
strategic imperatives identified within the Innovation Strategy:
Increasing innovation in its widest sense including encouraging businesses to transform creative
thinking into new and improved processes;
Embedding a culture of change in approach and behaviours within NI businesses and their leaders;
and
Increasing business’ understanding of innovation and facilitating the exchange and exploitation of
knowledge by supporting businesses with high growth and export potential to “apply the use of
Productivity Improvement Tools and Techniques in order to leverage competitive advantage from
the innovation process”.
2.3.4 DETI Corporate Plan 2011-2015
In-line with the NI PfG and Economic Strategy, DETI’s current Corporate Plan places focus on
creating wealth and employment through a focus on export-led economic growth. In reflection of this,
the Department’s goal over the life of the Plan is to “promote the growth of a competitive and export
led economy”.
The Plan highlights the need for the NI Government to place focus on rebalancing and rebuilding the
Northern Ireland economy, i.e. focusing on actions that will deliver the necessary rebalancing of the
economy over the longer term, while taking immediate steps to rebuild the local labour market after
the recession.
Specifically, in-line with the economic priorities established within DETI’s Corporate Plan, it is the
Evaluation Team’s view that PIS offered the potential to contribute to stimulating R&D, innovation
and creativity, helping Northern Ireland businesses compete in the global economy and encouraging
business growth.
2.3.5 Invest NI Corporate Plan 2011-2015
In-line with the NI PfG and DETI’s Corporate Plan, Invest NI’s 2011-2015 Corporate Plan states that
the organisation will contribute to the rebalancing and rebuilding of the NI economy to increase the
overall standard of living by driving productivity growth and increasing employment. The Plan states
that the support provided will be fully aligned with the drivers of economic growth and its activities
will be targeted to increase the size, productivity, competitiveness and value of the private sector by
embedding innovation, growing our local companies to scale, increasing our export base and attracting
inward investment.
Given the nature of support delivered by the PIS, it is the Evaluation Team’s view that the Service
offered the potential to contribute to the following strategic priorities:

PRODUCTIVITY IMPROVEMENT SERVICE Page 18
Stimulating innovation. R&D and creativity - The Plan highlights the need to put innovation at the
core of enterprise in NI by driving market led innovation within its business base, supporting
research, product, process, market and organisational development for the earliest stages to the
leading edge technologies;
Enabling NI businesses to compete in the global economy; and
Encouraging business growth by addressing the real and perceived barriers to growth.
2.4 Summary Conclusions
The preceding analysis suggests that:
At the time of approval, there was a need for Government to provide support to encourage greater
levels of innovation in order to facilitate business growth and reduce the productivity gap with
other UK regions;
A number of market failure (including asymmetric information and co-ordination failures) and
non-market failure factors (e.g. constraints relating to capacity and throughput, businesses utilising
inefficient and ineffective equipment etc.) were preventing businesses from implementing
measures to address operating inefficiencies and improve productivity independent of receiving
support;
There was, and continues to be, clear alignment between the aims and objectives of the PIS and
the strategic imperatives of the NI Government (including with DETI and Invest NI’s Corporate
Plans). Specifically, in line with Government’s strategic focus, the activities supported by the PIS
offers the potential to:
Address barriers to business growth;
Increase innovation in its widest sense including encouraging businesses to transform creative
thinking into new and improved processes (i.e. engage in process innovation);
Embed a culture of change in approach and behaviours within NI businesses and their leaders;
and
Increase business’ understanding of innovation and facilitate the exchange and exploitation of
knowledge by supporting businesses with high growth and export potential to apply the use of
Productivity Improvement Tools and Techniques in order to leverage competitive advantage
from the innovation process.
In doing so the Service offers the potential to “stimulate action and interventions to increase
productivity and competitiveness, and enable local companies to grasp opportunities.”
Please note that the Evaluation Team’s analysis of the degree to which there continues to be a need for
Government intervention (including the nature and extent of market failure that currently exists) can
be found in Sections 5 and 9.

PRODUCTIVITY IMPROVEMENT SERVICE Page 19
3. PROGRAMME ACTIVITY
3.1 Introduction
Section 3 provides a summary of the activity that was supported through the PIS during the period
under review.
All information presented is based upon monitoring information provided by Invest NI. The
Evaluation Team’s review of monitoring information retained by Invest NI suggests that whilst the
PIT has placed effort to monitor information relating to the Service’s inputs, activities, outputs and
outcomes, this information could be collated more robustly in a central location in order to provide
more effective Service management information and assist with future evaluation. Specifically, the
manner in which monitoring information was collated resulted in a disproportionate effort, made by
both the PIT and Evaluation Team during the evaluation exercise, to establish programme-level
activity (and identify recipients of support) during the review period22
. Indeed, much of this
information had to be collated and built-up from the level of individual businesses.
Additional monitoring issues have been identified by the Evaluation Team through the research
process and have been identified elsewhere in this report. The Evaluation Team has made a number of
recommendations in Section 9 relating to the future monitoring and retention of data.
3.2 Service Marketing
During the period under review, a range of mechanisms were utilised by the PIT to raise awareness of
the Service. These included (but were not limited to):
Provision of training to Invest NI Client Executives (CEs) to increase awareness of the service and to
improve the quality of referrals being made;
Attendance, and provision of Service information, at Invest NI Sector Team meetings;
Presentation at client facing Invest NI workshops;
Hosting of workshops, seminars and events to raise awareness and understanding of Productivity
Improvement strategies, tools and techniques (focused on Invest NI clients);
Awareness raising workshops as part of Invest NI’s Boosting Business campaign (which were made
available to the wider business base);
Presentations at external Invest NI supported events (e.g. World Quality Day, Accountants in Ireland,
Sustainex etc.) as well as external events held at local colleges, local universities, Enterprise Ireland etc.;
Creation and distribution of promotional literature documenting the nature of support available through the
Service through local media, Invest NI’s website (and intranet) and E-zine/newsletter; and
Creation of a social media channel providing case studies of businesses that have benefited from the
Service.
3.3 Service Referrals and Demand
Analysis of monitoring information provided by Invest NI indicates that demand for support remained
strong for the PIS during the period under review. A total of 341 Requests for Development Services
(RDS) were made by 91 Invest NI Client Executives (CEs) and Business Advisers (BAs) during the
period under review. Half (50%) of the RDS’ were raised by a relatively small proportion (20%) of
CEs and Business Advisors.
Figure 3.1 provides a summary of the RDS’ raised by Invest NI Client Executives and Business
Advisors since the creation of the Service.
22
This is best illustrated by the differences in the profile of activity documented in Section 3 of this Evaluation Report
and the profile of activity identified within Terms of Reference.

PRODUCTIVITY IMPROVEMENT SERVICE Page 20
Figure 3.1: No. of RDS’ raised by Invest NI Client Executives and Business Advisors
Whilst the trend analysis indicates that the number of RDS’ fell by just over one-quarter (28%)
between 2010/11 and 2013/14, discussions with Invest NI indicates that this is likely to reflect the
following:
The number of RDS’ may have been artificially high at the outset of the Service, as Client
Executives sought to identify means of supporting client businesses during the preliminary years
of the economic downturn (2009-2011); and
Internal awareness raising activities undertaken by the PIT since the creation of the Service has
resulted in a greater understanding of its role and remit. This has, in turn, resulted in a decrease in
the number of non-relevant referrals being made. Notwithstanding this point, consultation with
Invest NI suggests that, whilst the quality of referrals that have been provided to the PIT has
generally increased during the period under review, the Team continues to receive a large number
of referrals that are not of the quality (in terms of their relevance to the Service’s offering) as
would preferably be the case.
Consultation with Invest NI indicates that whilst the numbers of RDS’s raised have decreased over the
period the proportion of RDS resulting in an intervention has significantly increased.
On reflection of the activity that was delivered during the period under review, and on consideration of
the future direction of the Service (if it continues beyond March 2015), it is Invest NI’s view that the
scale and nature of activities delivered by the PIS could be expanded upon in order to address the
latent demand which it perceives to exist and further increase the effectiveness of the Service. This
assertion is based on the following:
Despite the broadly equal split in Invest NI’s client base between manufacturing and service-based
businesses, monitoring information provided by Invest NI (Table 3.1) indicates that circa four-
fifths of the RDS’ raised were for businesses from the manufacturing sector. It is Invest NI’s view,
and shared by the Evaluation Team based on its discussions with a number of CEs and businesses
that did not engage with Service, that this is likely to reflect the fact that there continues to be a
misconception (both amongst a number of CEs and within the NI business base) that productivity
improvement tools and techniques are more overtly focused on supporting manufacturing rather
than service-based businesses.
116
181
147 138
130
110
0
20
40
60
80
100
120
140
160
180
200
2009 - 10
(6 months)
2010-11 2011-12 2012-13 2013-14 2014-15
(to Nov)
No
. o
f R
DS

PRODUCTIVITY IMPROVEMENT SERVICE Page 21
Table 3.1: Sectoral profile of RDS’ raised
2009 - 10
(6 months)
2010 - 11 2011 - 12 2012 - 13 2013 - 14 2014 - 15 2009 – 15
(to date)
Manufacturing 88% 89% 88% 80% 80% 83% 84%
Service 12% 11% 12% 20% 20% 17% 16%
It is the PIT’s view that, while progress has been made in working with businesses from a more
diverse range of sectors, further work is required to support businesses such as those operating in the
ICT, financial/transactional services, and legal sectors. In addition to the misconception that may exist
amongst these businesses with regards to the applicability of lean concepts to non-manufacturing
sectors, consultation with Invest NI indicates that there may be additional issues relating to the
perceived credibility and technical ability of the PIT to provide support to these sectors;
Latent demand is likely to exist within Invest NI’s manufacturing client base which the PIT has
thus far not been able to address (e.g. due to the availability of resource, a perceived view amongst
some businesses that they do not require support and/or do not feel that the Service can provide
the support that they require). The Evaluation Team’s consultation with a number of
manufacturing businesses, that had not received support through the Service, provides weight to
this view with a number of businesses expressing strong interest in receiving support from the
Service moving forward;
Whilst noting that considerable work has been undertaken to provide productivity support in the
area of supply-chain management, it is Invest NI’s view that additional work could be undertaken
in this area. It was noted that the Wrightbus supply-chain intervention model could potentially be
rolled out to a number of strategically important NI businesses;
Consultation with the PIT indicates that the majority of effort has been placed on the delivery of
support to businesses facing operational instability or stability (as outlined in Section 1.1).
However, it is Invest NI’s view that additional work is required to support businesses operating at
the managed improvement stage which are seeking to implement strategic change management
practices and more formally embed a culture of continuous improvement; and
Moving forward it is the PIT’s view that additional work should be undertaken to address the
needs of high growth businesses that have the greatest potential to contribute to the NI economy.
During 2014-15 (to date) 17% of the RDS’ raised were for high growth businesses.
As part of any strategy to address the latent demand that potentially exists, the Evaluation Team
recommends that Invest NI gives consideration to each of the following:
Whilst noting that the PIT was actively involved in undertaking activities to raise awareness of the
PIS during the period under review (as noted in Section 3.2), it is the Evaluation Team’s view (and
shared by Invest NI) that additional internal and external awareness raising activities will be
required moving forward. These activities should place focus on clearly articulating (amongst
other things) the:
Nature of activity that the Service seeks to support and importantly the activity that it will
not support;
Nature and levels of support that is available to businesses; and
The wider range of sectors in which productivity improvement tools and techniques can
potentially be embedded.
Consideration should be given by Invest NI to utilising external expertise to support the PIT in
building credibility and sector-specific knowledge/expertise in those non-manufacturing sectors
that the Service has had more limited impact on e.g. ICT, financial/transactional services. In the
short-term, this may involve the external expertise leading initial business engagements with the
PIT providing a supporting role until such times when it has built a suitable level of credibility and
sector-specific knowledge to facilitate these engagements alone.
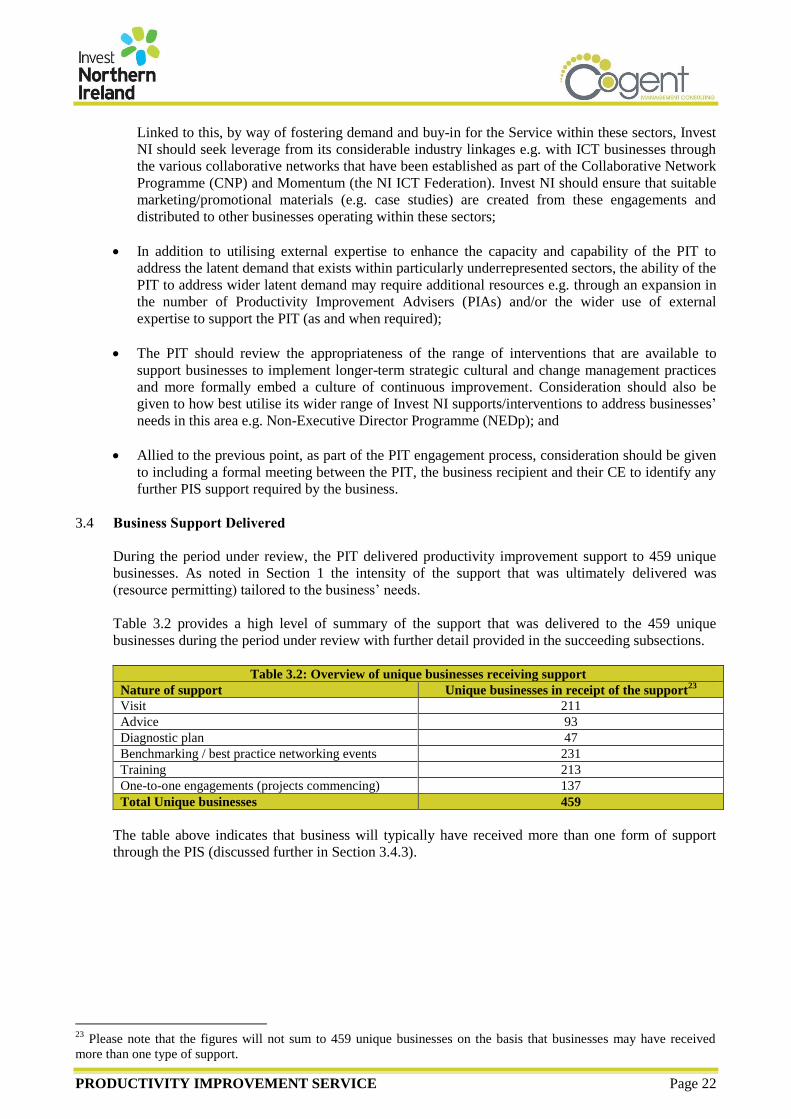
PRODUCTIVITY IMPROVEMENT SERVICE Page 22
Linked to this, by way of fostering demand and buy-in for the Service within these sectors, Invest
NI should seek leverage from its considerable industry linkages e.g. with ICT businesses through
the various collaborative networks that have been established as part of the Collaborative Network
Programme (CNP) and Momentum (the NI ICT Federation). Invest NI should ensure that suitable
marketing/promotional materials (e.g. case studies) are created from these engagements and
distributed to other businesses operating within these sectors;
In addition to utilising external expertise to enhance the capacity and capability of the PIT to
address the latent demand that exists within particularly underrepresented sectors, the ability of the
PIT to address wider latent demand may require additional resources e.g. through an expansion in
the number of Productivity Improvement Advisers (PIAs) and/or the wider use of external
expertise to support the PIT (as and when required);
The PIT should review the appropriateness of the range of interventions that are available to
support businesses to implement longer-term strategic cultural and change management practices
and more formally embed a culture of continuous improvement. Consideration should also be
given to how best utilise its wider range of Invest NI supports/interventions to address businesses’
needs in this area e.g. Non-Executive Director Programme (NEDp); and
Allied to the previous point, as part of the PIT engagement process, consideration should be given
to including a formal meeting between the PIT, the business recipient and their CE to identify any
further PIS support required by the business.
3.4 Business Support Delivered
During the period under review, the PIT delivered productivity improvement support to 459 unique
businesses. As noted in Section 1 the intensity of the support that was ultimately delivered was
(resource permitting) tailored to the business’ needs.
Table 3.2 provides a high level of summary of the support that was delivered to the 459 unique
businesses during the period under review with further detail provided in the succeeding subsections.
Table 3.2: Overview of unique businesses receiving support
Nature of support Unique businesses in receipt of the support23
Visit 211
Advice 93
Diagnostic plan 47
Benchmarking / best practice networking events 231
Training 213
One-to-one engagements (projects commencing) 137
Total Unique businesses 459
The table above indicates that business will typically have received more than one form of support
through the PIS (discussed further in Section 3.4.3).
23
Please note that the figures will not sum to 459 unique businesses on the basis that businesses may have received
more than one type of support.

PRODUCTIVITY IMPROVEMENT SERVICE Page 23
3.4.2 Visit, Advice and Productivity Diagnostics
As detailed in Table 3.3, during the period under review:
The PIT visited and provided advice to 211 unique NI businesses on 224 separate occasions;
Advice (typically by phone or email) on productivity related issues was provided to 93 businesses;
and
47 businesses received a productivity diagnostic plan. It should be noted that the number of unique
businesses that received a productivity diagnostic is significantly below the number of unique
businesses that received a one-to-one mentoring project (N=137 – see Section 3.4.4 for further
details). Discussions with Invest NI indicates that this is a reflection of the fact that the PIT was
able to utilise a number of the one-to-many training interventions (e.g. LFT) as means to raise
awareness of the common productivity issues facing businesses and the tools and techniques that
could be employed to address these issues. As such, in many cases this removed the need for the
PIT to complete a business-specific diagnostic or, if still required, deliver a ‘scaled-down’ version
of this.
Table 3.3: Overview of support delivered
Nature of support
delivered
Sep 2011 -
March 2012
April 2012 -
March 2013
April 2013 -
March 2014
Total
Business
interventions
Unique
businesses24
Visit 78 78 68 224 211
Advice 21 46 29 96 93
Diagnostic plan 21 17 10 48 47
24
The unique businesses under each area of support are not mutually exclusive i.e. a business may have received a visit,
advice or diagnostic plan or some combination of these types of support.
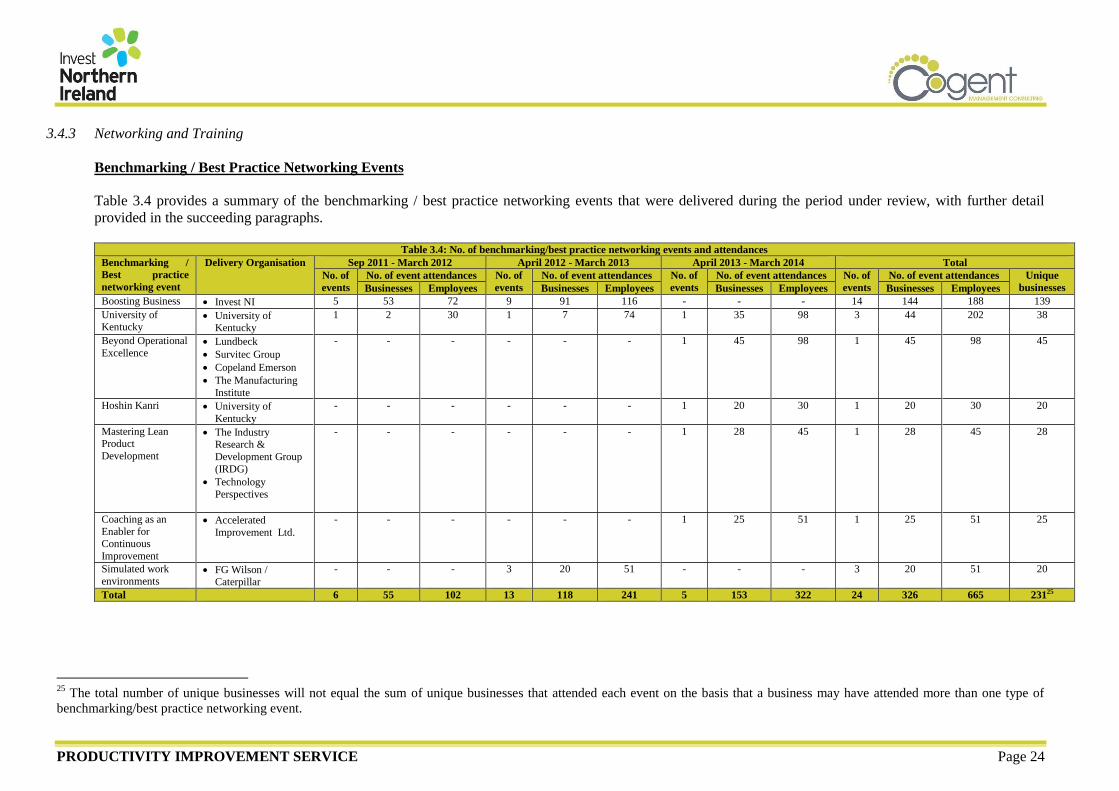
PRODUCTIVITY IMPROVEMENT SERVICE Page 24
3.4.3 Networking and Training
Benchmarking / Best Practice Networking Events
Table 3.4 provides a summary of the benchmarking / best practice networking events that were delivered during the period under review, with further detail
provided in the succeeding paragraphs.
Table 3.4: No. of benchmarking/best practice networking events and attendances
Benchmarking /
Best practice
networking event
Delivery Organisation Sep 2011 - March 2012 April 2012 - March 2013 April 2013 - March 2014 Total
No. of
events
No. of event attendances No. of
events
No. of event attendances No. of
events
No. of event attendances No. of
events
No. of event attendances Unique
businesses Businesses Employees Businesses Employees Businesses Employees Businesses Employees
Boosting Business Invest NI 5 53 72 9 91 116 - - - 14 144 188 139
University of Kentucky
University of Kentucky
1 2 30 1 7 74 1 35 98 3 44 202 38
Beyond Operational
Excellence Lundbeck
Survitec Group
Copeland Emerson
The Manufacturing
Institute
- - - - - - 1 45 98 1 45 98 45
Hoshin Kanri University of
Kentucky
- - - - - - 1 20 30 1 20 30 20
Mastering Lean Product
Development
The Industry Research &
Development Group
(IRDG)
Technology
Perspectives
- - - - - - 1 28 45 1 28 45 28
Coaching as an
Enabler for Continuous
Improvement
Accelerated
Improvement Ltd.
- - - - - - 1 25 51 1 25 51 25
Simulated work
environments FG Wilson /
Caterpillar
- - - 3 20 51 - - - 3 20 51 20
Total 6 55 102 13 118 241 5 153 322 24 326 665 23125
25
The total number of unique businesses will not equal the sum of unique businesses that attended each event on the basis that a business may have attended more than one type of
benchmarking/best practice networking event.

PRODUCTIVITY IMPROVEMENT SERVICE Page 25
Salient points to note include:
A total of 24 benchmarking/best practice networking events were delivered based around 7 key events. Consultation with Invest NI suggests that the range
and nature of events broadened during the period under review in response to client need;
With the exception of the ‘Boosting Business’ events, all other events were delivered by external businesses and organisations with a reputation for
productivity excellence;
There were 665 employee attendances from 231 unique businesses at the events. Attendees were drawn from Invest NI’s client base and the wider NI
business base;
Whilst ‘Boosting Business’ was the most frequently delivered event (N=14) and attracted the highest number of businesses (N=144), the ‘Beyond
Operational Excellence’ attracted the highest number of businesses and employees on a per event basis; and
Training
Table 3.5 provides a summary of the training that was delivered by the PIT during the period under review26
.
Table 3.5: Summary of training delivered
Training Sep 2011 - March 2012 April 2012 - March 2013 April 2013 - March 2014 Total
No. of
training
sessions
No. of training
attendances
No. of
training
sessions
No. of training attendances No. of
training
sessions
No. of training
attendances
No. of
training
sessions
No. of training
attendances
Unique
businesses
Businesses Employees Businesses Employees Businesses Employees Businesses Employees
One-to-many training
Lean Fundamentals Training 5 50 108 10 81 192 6 60 123 21 191 423 160
Supply Chain Management
Training
- - - 2 15 27 4 31 57 6 46 84 44
Lean for Services - - - - - - 3 13 30 3 13 30 13
Total Productive
Maintenance
- - - 1 6 9 2 14 31 3 20 40 16
8 Step Practical problem solving/A327
- - - - - - 4 29 56 4 29 56 29
Sub-total 5 50 108 13 102 228 19 147 297 37 299 633 193
One-to-one training
Wrightbus Supplier Development Programme
- - - - - - 2 6 41 2 6 41 6
In-House/On-site training 15 15 315 39 39 564 12 12 186 66 66 1,065 58
Sub-total 15 15 315 39 39 564 14 18 227 68 72 1,106 60
Total 20 65 423 52 141 792 33 165 524 105 371 1,739 21328
26
Appendix V provides further details on nature of training that was delivered during the period under review. 27
Delivered in conjunction with external providers. 28
The total number of unique businesses will not equal the sum of unique businesses that attended each event on the basis that a business may have attended more than one type of
training.

PRODUCTIVITY IMPROVEMENT SERVICE Page 26
Salient points to note include:
With the exception of the 8 Step Practical problem solving/A3 training (which was delivered in
conjunction with an external provider), all other training was delivered by the PIT;
There were 1,739 employee attendances from 213 unique businesses at 105 training sessions
during the period under review;
Lean Fundamentals Training was the most frequently delivered ‘one-to-many’ training type (N=21
training sessions) and attracted the largest number of business attendances; and
The majority of employee attendances (61% - N-1,739) resulted from the delivery of one-to-one
in-house/on-site training.
3.4.4 One-to-One Mentoring Projects/Engagements
Table 3.6 provides a summary of the number of businesses that received one-to-one mentoring support
during the period under review.
Table 3.6: Overview of one-to-one engagements
Engagement Type No. of businesses
commencing support
No. of businesses
completing support
No. of businesses with
support ongoing
No. %29
No. % No. %
Lean 112 82% 71 63% 41 37%
SCM 18 13% 10 56% 8 44%
Lean and SCM 7 5% 6 86% 1 14%
Total 137 100% 87 64% 50 36%
During consultation, Invest NI indicated that its project monitoring procedures were not as robust as
might have preferably been the case during the majority of the period under review (September 2011
to December 2013). This led to a situation whereby, following an initial engagement with a client,
some clients would request additional support from the PIT to address issues other than those that
were subject to the initial engagement. However, rather than ‘close’ the original project and raise a
new RDS, the PIT would (resource permitting) extend the original project.
The Evaluation Team is therefore unable to determine the number of different one-to-one projects that
were delivered by the PIT during this period and has instead summarised the PIT’s activity in relation
to the number of businesses that received a one-to-one mentoring engagement during the period (see
Table 3.6). In doing so, the numbers identified are likely to underestimate the extent of support
provided by the PIT during the period under review.
Discussion with the PIT indicates that whilst it formally tried to address this issue (in January 2014)
by placing focus on ‘closing’ initial projects and raising new RDS’ for additional projects, it is the
PIT’s view that this process is not as robust as it could be.
The Evaluation Team notes that whilst there was not a formal requirement of the PIT to record the
number of mentoring days support that was delivered to businesses, the Evaluation Team understands
that the PIT commenced recording this information in the last 6 months of the period under review
(albeit this information does not appear to have been monitored and centrally collated on a consistent
basis). By way of assisting with future Appraisal and Evaluation processes, Invest NI should ensure to
monitor and collate this information on a consistent basis.
29
Relates to the proportion of each type of PIS one-to-one engagement.

PRODUCTIVITY IMPROVEMENT SERVICE Page 27
Salient points to note include:
137 businesses commenced one-to-one mentoring engagement during the period. More than four-
fifths of these businesses (82% - N=137) received mentoring support to assist them to implement
lean thinking and principles within their business, whilst 19 businesses (13% - N=137) received
support in the area of supply chain management. The remaining 7 businesses received support in
the area of both lean and supply chain management; and
Just under two-thirds of businesses (63% - N=137) have completed their one-to-one mentoring
engagements with the PIT, with the remainder of businesses (37% - N=137) continuing to receive
support within their respective areas.
As illustrated in Table 3.7, in addition to the support provided through their respective one-to-one
engagements, businesses will typically have received different types of support through the PIS.
Table 3.7: Support received by businesses that completed a one-to-one engagement
Level of support Number receiving
One-to-one mentoring support only 0
Visit/contact/advice, benchmarking / best practice networking event, training and one-
to-one mentoring support
27
Visit/contact/advice and one-to-one mentoring support 11
Visit/contact/advice, benchmarking / best practice networking event, and one-to-one
mentoring support
3
Visit/contact/advice, training and one-to-one mentoring support 36
Benchmarking / best practice networking event,, training and one-to-one mentoring
support
5
Benchmarking / best practice networking event and one-to one mentoring support 1
Training and one-to-one mentoring support 4
Total 87
In addition to the activity detailed above, the PIT indicated that it was involved in a range of other
activities that have sought to contribute to wider Invest NI and PIT corporate responsibilities (e.g.
assessing Local Economic Development (LED) and INTERREG applications, undertaking Business
Health Checks and caseworks/appraisals, implementing internal productivity improvements and
facilitating external events/presentations.
3.5 Risks
The initial 2008 Demand Stimulation (Innovation Programme) Business Case identified four key risks
that could potentially impact upon delivery. These included:
Table 3.8: Risks identified as part of the Demand Stimulation/Innovation Programme
Risk Likelihood of risk occurring
Recruitment and retention of quality Advisers Low
Lack of follow through from awareness to project implementation Low
Lack of local demand (interventions) due economic downturn Medium
Lack of demand (interventions) due to economic downturn Medium
Based upon discussions with Invest NI and the wider research findings, we note the following in
relation to each of these risks:
No issues were faced in recruiting suitably qualified Productivity Improvement Advisers to deliver
the Service. Based upon the positive feedback from recipients of support (see Sections 4 and 5),
the Evaluation Team concludes that the Advisers recruited by Invest NI are of a high quality.
PRODUCTIVITY IMPROVEMENT SERVICE Page 28
Notwithstanding this, discussions with Invest NI suggest that the continued employment of two
Advisers on fixed-term contracts continues to raise concerns over their retention in the longer
term. As part of any continuation of the Service, Invest NI should give consideration to the most
appropriate means of retaining these Advisers. Any loss of staff resource is likely to have a
detrimental impact on the ability of the PIT to sustain the current level of support and the ability to
realise the productivity improvement impacts documented in Section 5.
As noted in Section 5, 93% (N=92) of businesses indicated that they had wholly (28%) or partially
(66%) implemented the advice that had been provided by the PIT. Again, the Evaluation Team
suggests that this is a reflection of the quality of support that was delivered by the Service during
the period under review.
Levels of demand for PIS support remained high through-out the period. However, as noted,
discussions with Invest NI indicates that a level of latent demand potentially exists (e.g. from
businesses operating within service industries) and the Evaluation Team recommends that options
for addressing this demand are considered as part of any future Economic Appraisal.
In summary, based on levels of demand for the Service, business’ high levels of satisfaction with the
Service (see Section 4) and the positive contribution of the Service to the NI economy (see Section 5),
the Evaluation Team would suggest that Invest NI’s overall approach to risk management was robust
and proportionate.
3.6 Equality Considerations
Section 75 of the Northern Ireland Act 1998 requires that Invest NI shall, “in carrying out its function
relating to Northern Ireland, have due regard to the need to promote equality of opportunity” between
the following nine Section 75 groups:
Persons of different religious belief, political opinion, racial group, age, marital status or sexual
orientation;
Men and women generally;
Persons with a disability and persons without; and
Persons with dependents and persons without.
In addition and without prejudice to these obligations, in carrying out its functions, Invest NI is also
committed to promote good relations between persons of different religious belief, political opinion or
racial group.
During December 2011, Invest NI undertook a Section 75 Screening of the Productivity Improvement
Team and Supply Chain Development support. This exercise concluded that there was no or limited
evidence to suggest that:
The policy was likely to impact on the equality of opportunity for each of the Section 75 equality
categories;
There were opportunities to better promote equality of opportunity for people within the Section
75 equalities categories;
The policy was likely to impact on good relations between people of different religious belief,
political opinion or racial group;
There were opportunities to better promote good relations between people of different religious
belief, political opinion or racial group; and
The policy was likely to impact upon individuals with multiple identities.
Both Screenings concluded that there was no requirement to undertake an Equality Impact Assessment
(EQIA).
PRODUCTIVITY IMPROVEMENT SERVICE Page 29
The Evaluation Team’s review of PIS activity, monitoring information provided during the evaluation
process and our discussions with PIS recipients has identified:
No evidence of higher or lower participation or uptake of different groups;
No evidence to indicate that different groups had different needs, experiences, issues and priorities
in relation to PIS activity;
No opportunities to better promote equality of opportunity or better community relations by
altering the work of PIS;
No accessibility issues that might run contrary to the Disability Discrimination Act 1995.
On this basis, the Evaluation Team would conclude that whilst the PIS was not specifically targeted at
any specific Section 75 categories, it does not appear to have had an adverse impact on any Section 75
group.
3.7 Summary Conclusions
Salient points to note with regards to the Evaluation Team’s review of the Service’s activity include:
A total of 459 unique businesses received support through the PIS during the period under review.
The intensity of the support that was ultimately delivered was tailored to business’ specific needs.
For example, monitoring information provided by Invest NI suggests that:
The PIT visited and provided advice to 211 NI businesses on 224 separate occasions;
47 businesses received a productivity diagnostic plan;
There were 665 employee attendances from 231 unique businesses at the benchmarking / best
practice networking events;
There were 1,739 employee attendances from 213 unique businesses at 105 training sessions
during the period under review; and
137 businesses commenced one-to-one mentoring engagement during the period, the majority
of which sought to assist them to implement lean thinking and principles within their business.
Just under two-thirds of businesses (63% - N=137) have completed their one-to-one mentoring
engagements with the PIT, with the remainder of businesses (37% - N=137) continuing to
receive support within their respective areas.
The Evaluation Team faced a number of difficulties in profiling the activity that was supported
during the period under review and would recommend that Invest NI undertakes a review of its
procedures for monitoring the activity delivered by the Service and the associated storage of
information. Specific recommendations are provided in Section 9.
It is Invest NI’s view, and shared by the Evaluation Team, that a level of latent demand presently
exists for PIS support. Whilst the options for addressing this latent demand should be carefully
considered, this may require Invest NI to:
Undertake additional internal and external awareness raising activities;
Utilise external expertise to support the PIT in building credibility and sector-specific
knowledge/expertise in those non-manufacturing sectors that the Service has had more limited
impact;
Provide additional resources e.g. through an expansion in the number of PIAs and/or the wider
use of external expertise to support the PIT (as and when required);
Review the appropriateness of the range of interventions that are available to support
businesses to implement longer-term strategic cultural and change management practices and
more formally embed a culture of continuous improvement; and
Utilise its wider range of Invest NI supports/interventions to address businesses’ productivity
improvement needs.
PRODUCTIVITY IMPROVEMENT SERVICE Page 30
Given the levels of demand for the Service, business’ high levels of satisfaction with the Service
and the positive contribution of the Service to the NI economy, the Evaluation Team would
suggest that Invest NI’s overall approach to risk management was robust and proportionate; and
Whilst the PIS was not specifically targeted at any specific Section 75 categories, it does not
appear to have had an adverse impact on any Section 75 group.

PRODUCTIVITY IMPROVEMENT SERVICE Page 31
4. STAKEHOLDERS’ SATISFACTION WITH, & VIEWS OF, THE PIS SERVICE
4.1 Introduction
Section 4 provides a detailed analysis of the key findings, emerging from the primary research with
businesses in receipt of PIS support, in terms of their satisfaction with, and views of the Service.
Tables 4.1 and 4.2 provide a summary of the PIS participant feedback derived through the primary
research, including all associated response rates and confidence intervals.
Table 4.1: Overview of business and employee respondents
Completed surveys Business respondents Employee respondents
Case study visits 6 6
Telephone consultations 37 37
Online survey 52 74
Total 95 117
Table 4.2 reflects the variety of support that was received by the 95 businesses that engaged in the
primary research.
Table 4.2: Response rates and confidence levels achieved
Unique
businesses
that received
support
No. of respondents Business
Response
rate
Business
Confidence
Interval Businesses
30 Employees
Benchmarking / best
practice networking event
231 54 72 24% +/-11.7%
Training 213 73 94 34% +/- 9.3%
One-to-one mentoring
support (completed
support)
8731
43 43 49% +/- 10.7%
Please note, at the request of Invest NI, the analysis of businesses’ view of, and satisfaction with, the
support delivered through the PIS has been limited to those businesses that availed of, at a minimum,
training support. The number of questions posed to businesses, and the number of business responses
provided, varies depending on the nature of PIS support received by the business and also the method
of primary research employed (i.e. a telephone consultation, a case study visit or the online survey).
As such, the number of respondents (N) will differ across questions.
30
The number of businesses will not sum to 95 on the basis that businesses could receive more than one type of support. 31
Figure reflects the number of businesses that had completed their one-to-one mentoring support at the time of
Evaluation. It should be noted that whilst 87 businesses had completed their respective engagement with the PIT, 20 of
these businesses were not available for consultation at the time of Evaluation or were not willing to participate; thus the
maximum number of businesses available to provide feedback was 67 businesses. As noted in Section 3, the total
number of businesses that had received one-to-one mentoring support from the PIT was 137 businesses.

PRODUCTIVITY IMPROVEMENT SERVICE Page 32
4.3 Marketing and Promotion
Just over four-fifths (81%, N=43 businesses) of respondents suggested that they had been made aware
of the PIS as a result of a representative from Invest NI; typically by a member of the PIT or their CE.
Table 4.3: Method by which awareness was raised32
Source %of business respondents
A representative from Invest NI 81%
Other 7%
Invest NI E-zine or newsletter 5%
Through attendance at an event or seminar 5%
Cannot Recall/Not Sure 2%
Invest NI website -
Local press -
N= 43
Positively, nearly all (95% - N=43) were in agreement that the PIS was an appropriate solution to
address their business’ needs at that time.
“Our Invest NI Client Executive spent quite a bit quite of time listening to our needs. He set up a meeting with
a Productivity Improvement Adviser and we haven’t looked back…the support was exactly what we needed.”
“The Productivity Improvement Team contacted us directly and made us aware of the range of support that we
could avail of through its Service. We subsequently attended a Lean Fundamentals Training session and got
some one-to-one project support which really helped us to reduce our cost and increase our bottom line.”
4.4 Satisfaction with the Support Provided
Positively, as detailed in Figure 4.1, the vast majority of respondents expressed a high level of
satisfaction with the support that was delivered through the benchmarking/best practice networking
events and training elements of support. For example, 90% or more of respondents indicated that they
were ‘very satisfied’ or ‘satisfied’ with the:
Calibre of the expert/trainer who provided the support (i.e. the PIT and/or any external expertise
that was utilised) including their knowledge of the subject matter and ability to transfer relevant
knowledge and advice;
Duration, structure and content of the support;
Quality of the supporting materials (e.g. presentations) that were used; and
Opportunities to network with like-minded businesses and garner additional support (where
required).
32
Feedback provided by those businesses that engaged in the telephone consultations or case study visits.
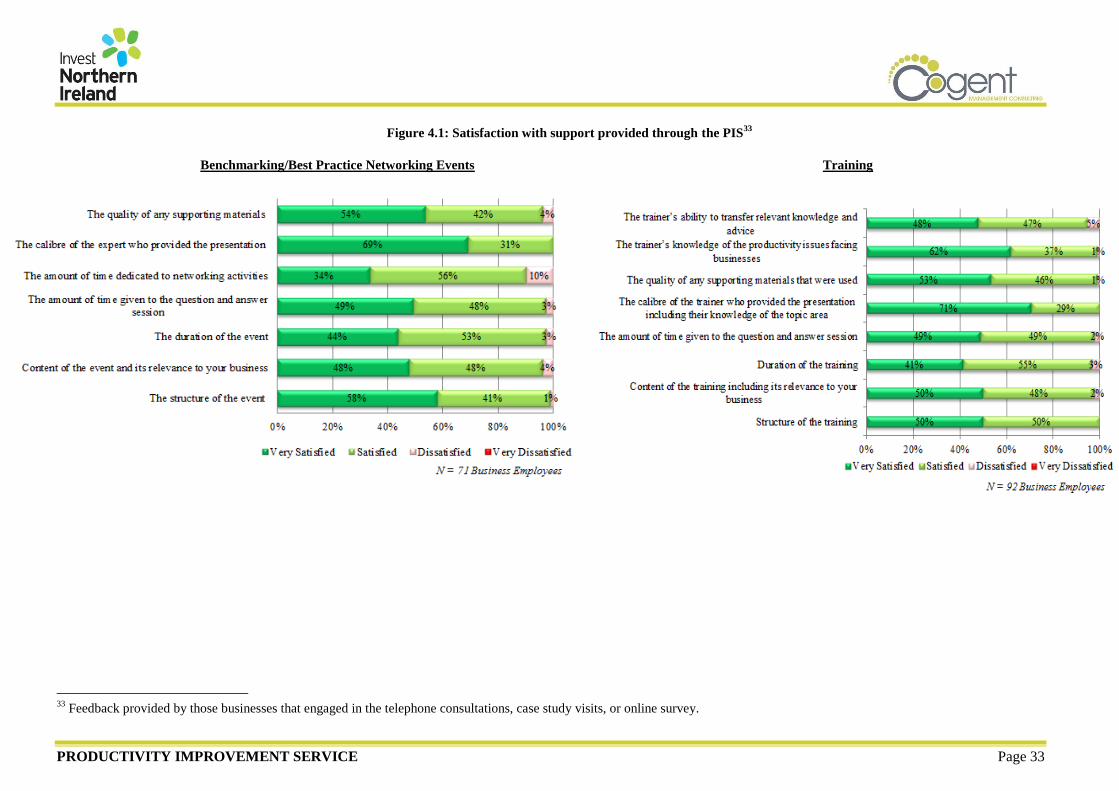
PRODUCTIVITY IMPROVEMENT SERVICE Page 33
Figure 4.1: Satisfaction with support provided through the PIS33
Benchmarking/Best Practice Networking Events Training
33
Feedback provided by those businesses that engaged in the telephone consultations, case study visits, or online survey.
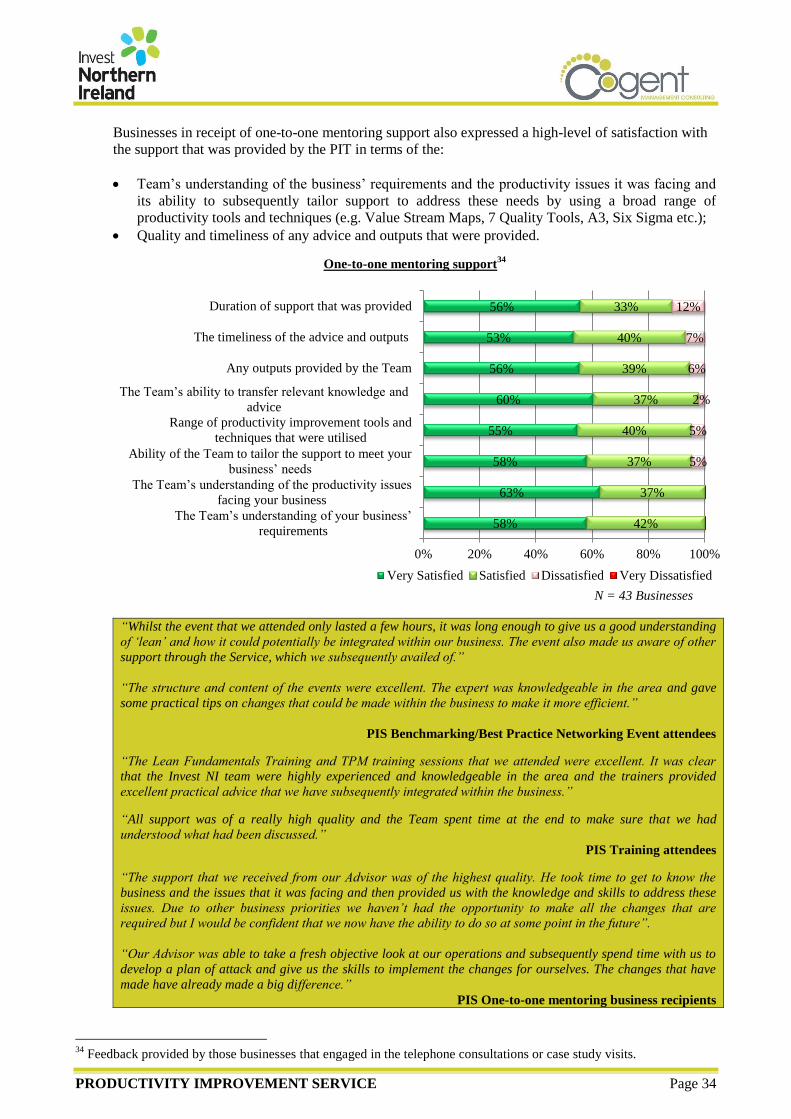
PRODUCTIVITY IMPROVEMENT SERVICE Page 34
Businesses in receipt of one-to-one mentoring support also expressed a high-level of satisfaction with
the support that was provided by the PIT in terms of the:
Team’s understanding of the business’ requirements and the productivity issues it was facing and
its ability to subsequently tailor support to address these needs by using a broad range of
productivity tools and techniques (e.g. Value Stream Maps, 7 Quality Tools, A3, Six Sigma etc.);
Quality and timeliness of any advice and outputs that were provided.
One-to-one mentoring support34
“Whilst the event that we attended only lasted a few hours, it was long enough to give us a good understanding
of ‘lean’ and how it could potentially be integrated within our business. The event also made us aware of other
support through the Service, which we subsequently availed of.”
“The structure and content of the events were excellent. The expert was knowledgeable in the area and gave
some practical tips on changes that could be made within the business to make it more efficient.”
PIS Benchmarking/Best Practice Networking Event attendees
“The Lean Fundamentals Training and TPM training sessions that we attended were excellent. It was clear
that the Invest NI team were highly experienced and knowledgeable in the area and the trainers provided
excellent practical advice that we have subsequently integrated within the business.”
“All support was of a really high quality and the Team spent time at the end to make sure that we had
understood what had been discussed.”
PIS Training attendees
“The support that we received from our Advisor was of the highest quality. He took time to get to know the
business and the issues that it was facing and then provided us with the knowledge and skills to address these
issues. Due to other business priorities we haven’t had the opportunity to make all the changes that are
required but I would be confident that we now have the ability to do so at some point in the future”.
“Our Advisor was able to take a fresh objective look at our operations and subsequently spend time with us to
develop a plan of attack and give us the skills to implement the changes for ourselves. The changes that have
made have already made a big difference.”
PIS One-to-one mentoring business recipients
34
Feedback provided by those businesses that engaged in the telephone consultations or case study visits.
58%
63%
58%
55%
60%
56%
53%
56%
42%
37%
37%
40%
37%
39%
40%
33%
5%
5%
2%
6%
7%
12%
0% 20% 40% 60% 80% 100%
The Team’s understanding of your business’
requirements
The Team’s understanding of the productivity issues
facing your business
Ability of the Team to tailor the support to meet your
business’ needs
Range of productivity improvement tools and
techniques that were utilised
The Team’s ability to transfer relevant knowledge and
advice
Any outputs provided by the Team
The timeliness of the advice and outputs
Duration of support that was provided
Very Satisfied Satisfied Dissatisfied Very Dissatisfied
N = 43 Businesses
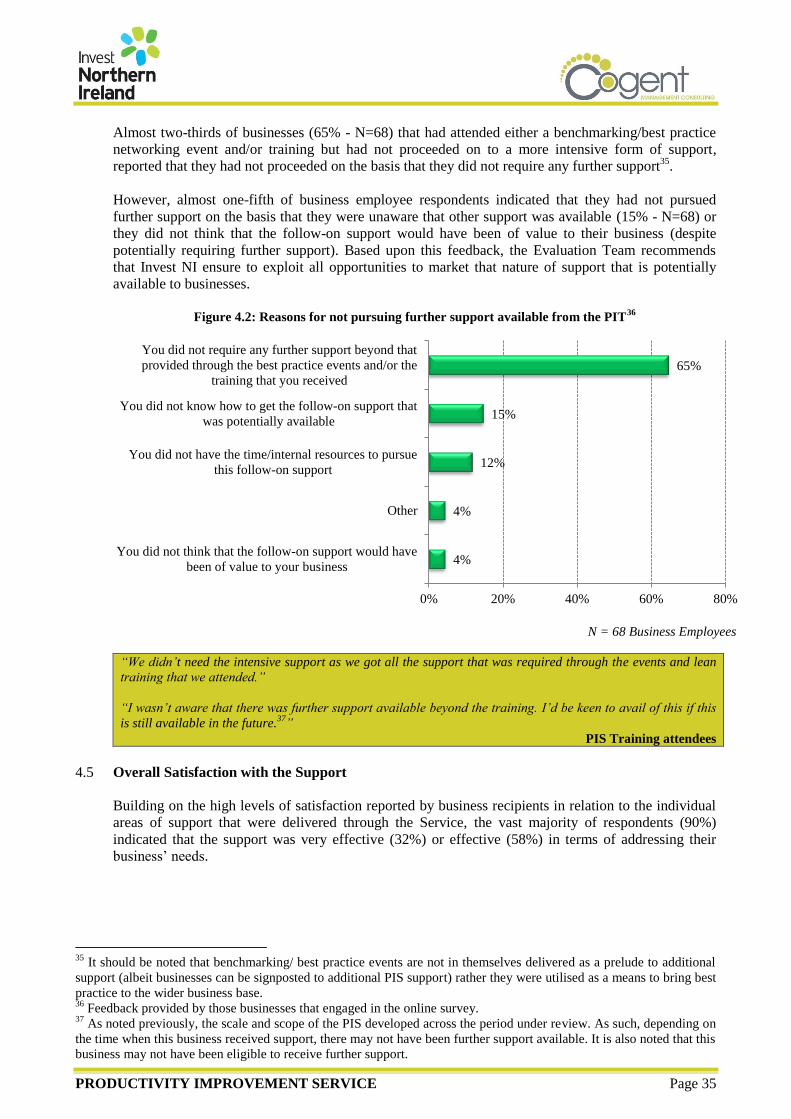
PRODUCTIVITY IMPROVEMENT SERVICE Page 35
Almost two-thirds of businesses (65% - N=68) that had attended either a benchmarking/best practice
networking event and/or training but had not proceeded on to a more intensive form of support,
reported that they had not proceeded on the basis that they did not require any further support35
.
However, almost one-fifth of business employee respondents indicated that they had not pursued
further support on the basis that they were unaware that other support was available (15% - N=68) or
they did not think that the follow-on support would have been of value to their business (despite
potentially requiring further support). Based upon this feedback, the Evaluation Team recommends
that Invest NI ensure to exploit all opportunities to market that nature of support that is potentially
available to businesses.
Figure 4.2: Reasons for not pursuing further support available from the PIT
36
“We didn’t need the intensive support as we got all the support that was required through the events and lean
training that we attended.”
“I wasn’t aware that there was further support available beyond the training. I’d be keen to avail of this if this
is still available in the future.37
”
PIS Training attendees
4.5 Overall Satisfaction with the Support
Building on the high levels of satisfaction reported by business recipients in relation to the individual
areas of support that were delivered through the Service, the vast majority of respondents (90%)
indicated that the support was very effective (32%) or effective (58%) in terms of addressing their
business’ needs.
35
It should be noted that benchmarking/ best practice events are not in themselves delivered as a prelude to additional
support (albeit businesses can be signposted to additional PIS support) rather they were utilised as a means to bring best
practice to the wider business base. 36
Feedback provided by those businesses that engaged in the online survey. 37
As noted previously, the scale and scope of the PIS developed across the period under review. As such, depending on
the time when this business received support, there may not have been further support available. It is also noted that this
business may not have been eligible to receive further support.
4%
4%
12%
15%
65%
0% 20% 40% 60% 80%
You did not think that the follow-on support would have
been of value to your business
Other
You did not have the time/internal resources to pursue
this follow-on support
You did not know how to get the follow-on support that
was potentially available
You did not require any further support beyond that
provided through the best practice events and/or the
training that you received
N = 68 Business Employees
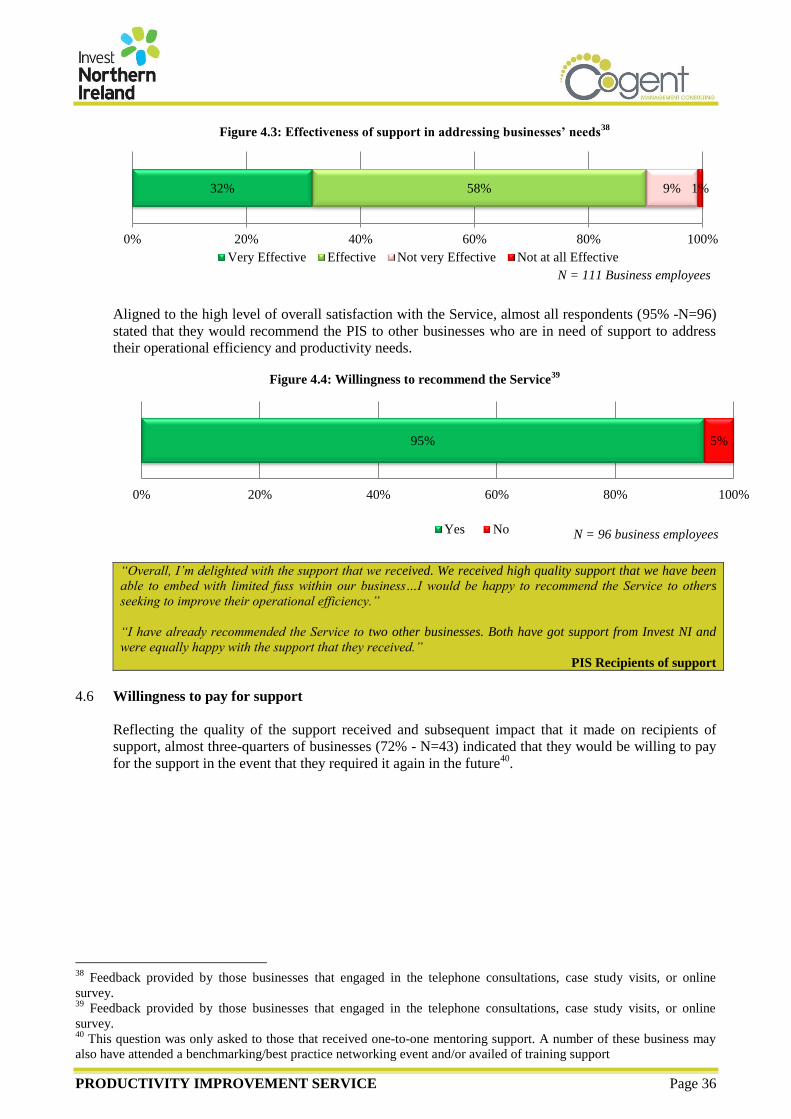
PRODUCTIVITY IMPROVEMENT SERVICE Page 36
Figure 4.3: Effectiveness of support in addressing businesses’ needs38
Aligned to the high level of overall satisfaction with the Service, almost all respondents (95% -N=96)
stated that they would recommend the PIS to other businesses who are in need of support to address
their operational efficiency and productivity needs.
Figure 4.4: Willingness to recommend the Service39
“Overall, I’m delighted with the support that we received. We received high quality support that we have been
able to embed with limited fuss within our business…I would be happy to recommend the Service to others
seeking to improve their operational efficiency.”
“I have already recommended the Service to two other businesses. Both have got support from Invest NI and
were equally happy with the support that they received.”
PIS Recipients of support
4.6 Willingness to pay for support
Reflecting the quality of the support received and subsequent impact that it made on recipients of
support, almost three-quarters of businesses (72% - N=43) indicated that they would be willing to pay
for the support in the event that they required it again in the future40
.
38
Feedback provided by those businesses that engaged in the telephone consultations, case study visits, or online
survey. 39
Feedback provided by those businesses that engaged in the telephone consultations, case study visits, or online
survey. 40
This question was only asked to those that received one-to-one mentoring support. A number of these business may
also have attended a benchmarking/best practice networking event and/or availed of training support
32% 58% 9% 1%
0% 20% 40% 60% 80% 100%
Very Effective Effective Not very Effective Not at all Effective
N = 111 Business employees
95% 5%
0% 20% 40% 60% 80% 100%
Yes No N = 96 business employees

PRODUCTIVITY IMPROVEMENT SERVICE Page 37
Figure 4.5: Willingness to pay for the support41
Businesses that were willing to quantify the level that they would be prepared to pay (N=15) indicated
that they would be willing to pay, on average:
£75 per business attendance at a training event (the price ranged from £25 per business to £150 per
business); and
£800 for a one-to-one engagement (the price ranged from £100 per business to £1,100 per
business), which is broadly equivalent to c. £100 - £160 per day of mentoring support42
.
Whilst acknowledging the quality of the support provided through the benchmarking/best practice
networking events, businesses indicated that they would be less likely to pay for these events on the
basis that these were viewed to be less intensive introductory sessions to productivity improvement
activities and the more intensive support available through the PIS.
For those businesses that were not willing to pay for similar support in the future (28% - N=43), these
businesses indicated that this was more a reflection of the ongoing challenging economic environment
in which they operate, rather being dissatisfied with the quality of the support that was provided to
them.
4.7 Businesses’ Recommendations for Improvement
Given the reported high levels of satisfaction, only a small number of businesses (N=1543) made
recommendations to improve the Service. These recommendations included:
Improving the promotion and marketing of the full range of supports that are available through the
Service (N=8);
Providing additional support to businesses to assist the implementation of the productivity
improvement measures within the business (N=6);
Following up with businesses after a period (e.g. six months) to evaluate its progress towards
implementing the changes and providing additional mentoring support (where necessary) (N=4);
and
Tailoring support for businesses operating in different sectors (N=4).
“I wasn’t aware that support was available beyond the training that I attended. Business should be made better
aware of this support.”
“I felt that the support was too focused on supporting manufacturing businesses. It would be useful if sessions
could be provided that were tailored to different sectors.”
PIS Recipients of support
41
Feedback provided by those businesses that engaged in the telephone consultations or case study visits. 42
On the basis that Invest NI indicated that between 5 and 8 days of mentoring support would typically have been made
provided to businesses in receipt of one-to-one mentoring support. 43
Feedback provided by those businesses that engaged in the telephone consultations, case study visits, or online
survey.
72% 28%
0% 10% 20% 30% 40% 50% 60% 70% 80% 90% 100%
Yes No N = 43 Businesses
PRODUCTIVITY IMPROVEMENT SERVICE Page 38
4.9 Summary Conclusions
The preceding analysis suggests that businesses are, on the whole, highly satisfied with the support
provided through the PIS. Specifically, the feedback from businesses in receipt of PIS support during
the period under review suggests that (amongst other things):
The content, structure and duration of support is, on the whole, appropriate to meet the needs of
businesses;
The PIT, and any supporting external expertise, transferred relevant knowledge and advice in a
timely manner; and
Recipients of one-to-one mentoring support welcomed the tailored nature of support that was
provided and the range of practical productivity improvement tools that were adopted by the PIT.
Reflecting the quality of the support received and subsequent impact that it made on recipients of
support, the vast majority of businesses suggested that the support was effective in meeting their
needs, would be willing to recommend to others and would be willing to pay for the support if they
required the service in future.
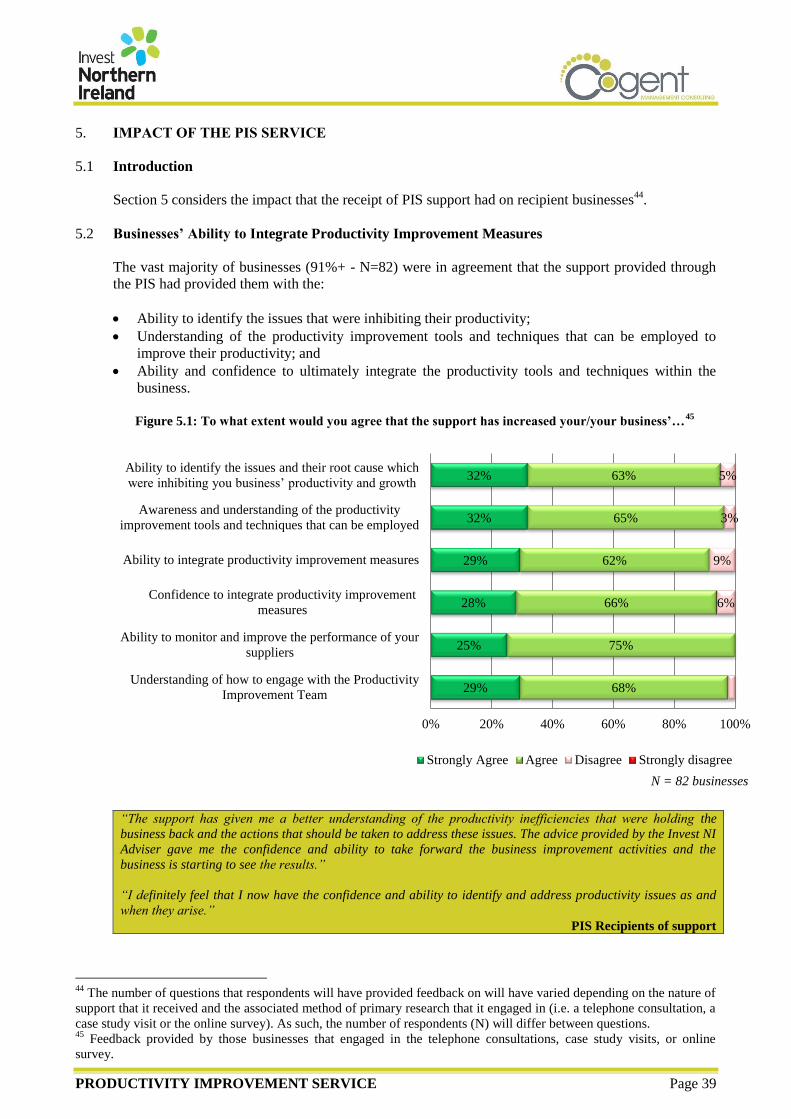
PRODUCTIVITY IMPROVEMENT SERVICE Page 39
5. IMPACT OF THE PIS SERVICE
5.1 Introduction
Section 5 considers the impact that the receipt of PIS support had on recipient businesses44
.
5.2 Businesses’ Ability to Integrate Productivity Improvement Measures
The vast majority of businesses (91%+ - N=82) were in agreement that the support provided through
the PIS had provided them with the:
Ability to identify the issues that were inhibiting their productivity;
Understanding of the productivity improvement tools and techniques that can be employed to
improve their productivity; and
Ability and confidence to ultimately integrate the productivity tools and techniques within the
business.
Figure 5.1: To what extent would you agree that the support has increased your/your business’…
45
“The support has given me a better understanding of the productivity inefficiencies that were holding the
business back and the actions that should be taken to address these issues. The advice provided by the Invest NI
Adviser gave me the confidence and ability to take forward the business improvement activities and the
business is starting to see the results.”
“I definitely feel that I now have the confidence and ability to identify and address productivity issues as and
when they arise.”
PIS Recipients of support
44
The number of questions that respondents will have provided feedback on will have varied depending on the nature of
support that it received and the associated method of primary research that it engaged in (i.e. a telephone consultation, a
case study visit or the online survey). As such, the number of respondents (N) will differ between questions. 45
Feedback provided by those businesses that engaged in the telephone consultations, case study visits, or online
survey.
29%
25%
28%
29%
32%
32%
68%
75%
66%
62%
65%
63%
6%
9%
3%
5%
0% 20% 40% 60% 80% 100%
Understanding of how to engage with the Productivity
Improvement Team
Ability to monitor and improve the performance of your
suppliers
Confidence to integrate productivity improvement
measures
Ability to integrate productivity improvement measures
Awareness and understanding of the productivity
improvement tools and techniques that can be employed
Ability to identify the issues and their root cause which
were inhibiting you business’ productivity and growth
Strongly Agree Agree Disagree Strongly disagree
N = 82 businesses
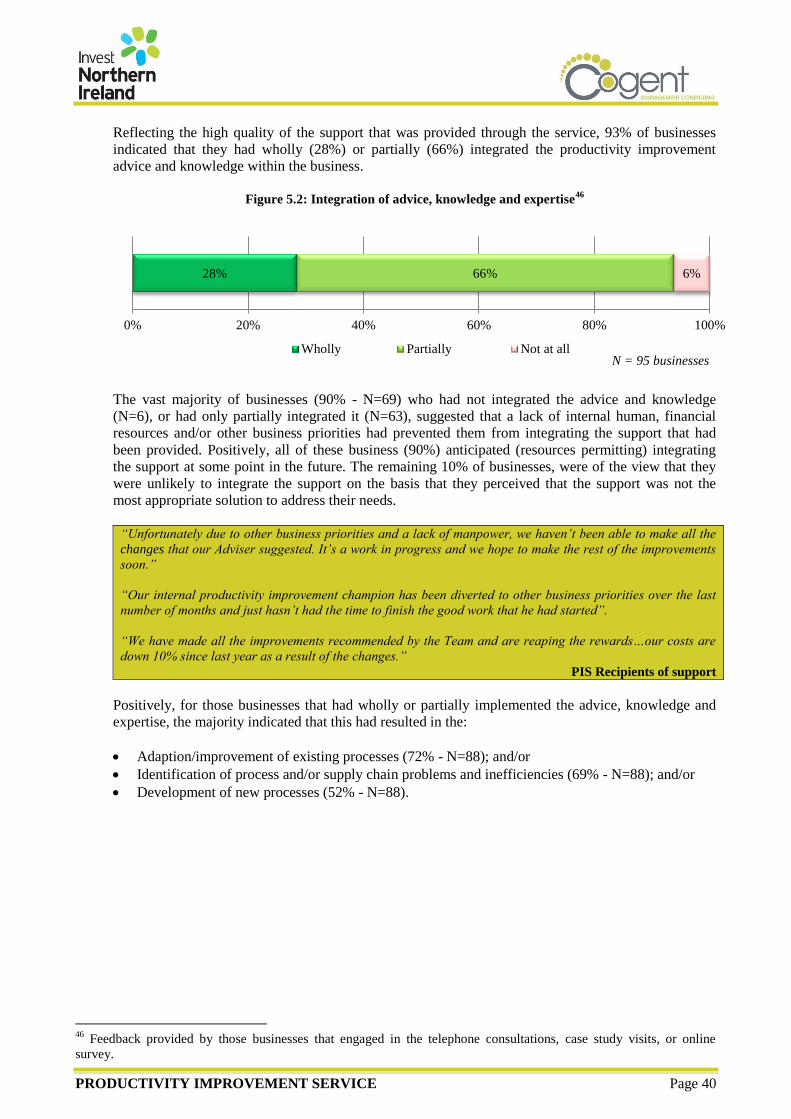
PRODUCTIVITY IMPROVEMENT SERVICE Page 40
Reflecting the high quality of the support that was provided through the service, 93% of businesses
indicated that they had wholly (28%) or partially (66%) integrated the productivity improvement
advice and knowledge within the business.
Figure 5.2: Integration of advice, knowledge and expertise
46
The vast majority of businesses (90% - N=69) who had not integrated the advice and knowledge
(N=6), or had only partially integrated it (N=63), suggested that a lack of internal human, financial
resources and/or other business priorities had prevented them from integrating the support that had
been provided. Positively, all of these business (90%) anticipated (resources permitting) integrating
the support at some point in the future. The remaining 10% of businesses, were of the view that they
were unlikely to integrate the support on the basis that they perceived that the support was not the
most appropriate solution to address their needs.
“Unfortunately due to other business priorities and a lack of manpower, we haven’t been able to make all the
changes that our Adviser suggested. It’s a work in progress and we hope to make the rest of the improvements
soon.”
“Our internal productivity improvement champion has been diverted to other business priorities over the last
number of months and just hasn’t had the time to finish the good work that he had started”.
“We have made all the improvements recommended by the Team and are reaping the rewards…our costs are
down 10% since last year as a result of the changes.”
PIS Recipients of support
Positively, for those businesses that had wholly or partially implemented the advice, knowledge and
expertise, the majority indicated that this had resulted in the:
Adaption/improvement of existing processes (72% - N=88); and/or
Identification of process and/or supply chain problems and inefficiencies (69% - N=88); and/or
Development of new processes (52% - N=88).
46
Feedback provided by those businesses that engaged in the telephone consultations, case study visits, or online
survey.
28% 66% 6%
0% 20% 40% 60% 80% 100%
Wholly Partially Not at allN = 95 businesses
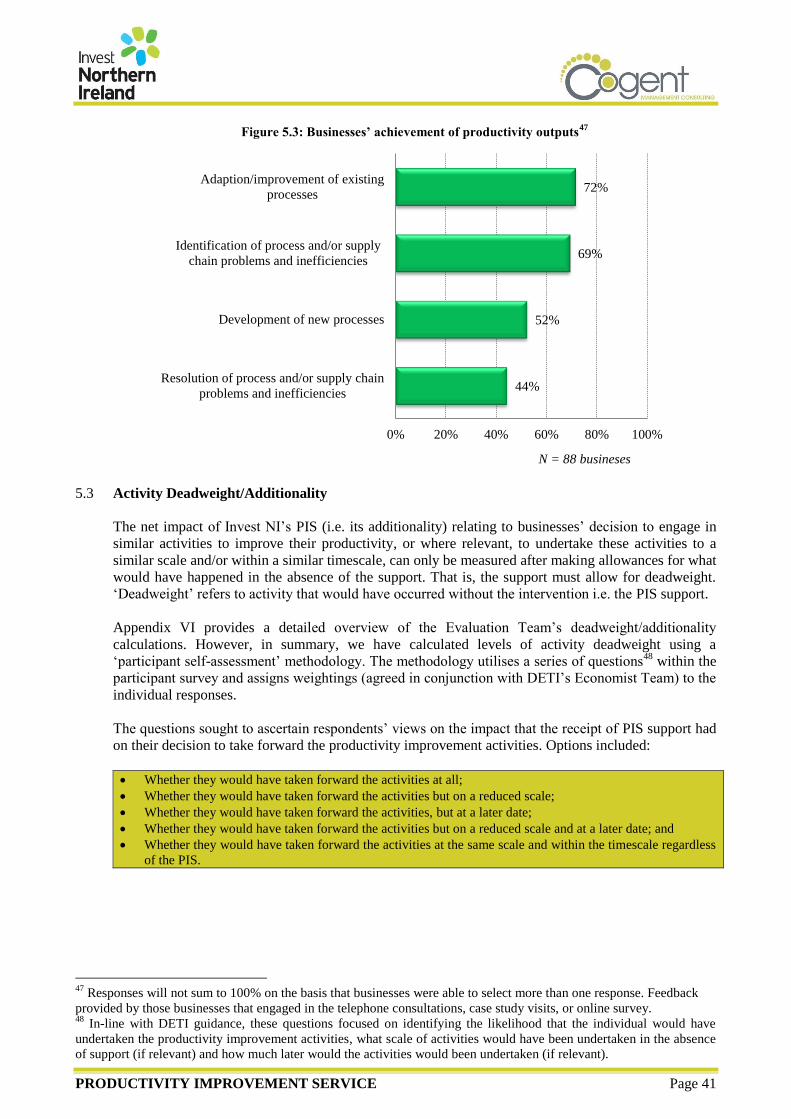
PRODUCTIVITY IMPROVEMENT SERVICE Page 41
Figure 5.3: Businesses’ achievement of productivity outputs47
5.3 Activity Deadweight/Additionality
The net impact of Invest NI’s PIS (i.e. its additionality) relating to businesses’ decision to engage in
similar activities to improve their productivity, or where relevant, to undertake these activities to a
similar scale and/or within a similar timescale, can only be measured after making allowances for what
would have happened in the absence of the support. That is, the support must allow for deadweight.
‘Deadweight’ refers to activity that would have occurred without the intervention i.e. the PIS support.
Appendix VI provides a detailed overview of the Evaluation Team’s deadweight/additionality
calculations. However, in summary, we have calculated levels of activity deadweight using a
‘participant self-assessment’ methodology. The methodology utilises a series of questions48
within the
participant survey and assigns weightings (agreed in conjunction with DETI’s Economist Team) to the
individual responses.
The questions sought to ascertain respondents’ views on the impact that the receipt of PIS support had
on their decision to take forward the productivity improvement activities. Options included:
Whether they would have taken forward the activities at all;
Whether they would have taken forward the activities but on a reduced scale;
Whether they would have taken forward the activities, but at a later date;
Whether they would have taken forward the activities but on a reduced scale and at a later date; and
Whether they would have taken forward the activities at the same scale and within the timescale regardless
of the PIS.
47
Responses will not sum to 100% on the basis that businesses were able to select more than one response. Feedback
provided by those businesses that engaged in the telephone consultations, case study visits, or online survey. 48
In-line with DETI guidance, these questions focused on identifying the likelihood that the individual would have
undertaken the productivity improvement activities, what scale of activities would have been undertaken in the absence
of support (if relevant) and how much later would the activities would been undertaken (if relevant).
44%
52%
69%
72%
0% 20% 40% 60% 80% 100%
Resolution of process and/or supply chain
problems and inefficiencies
Development of new processes
Identification of process and/or supply
chain problems and inefficiencies
Adaption/improvement of existing
processes
N = 88 busineses
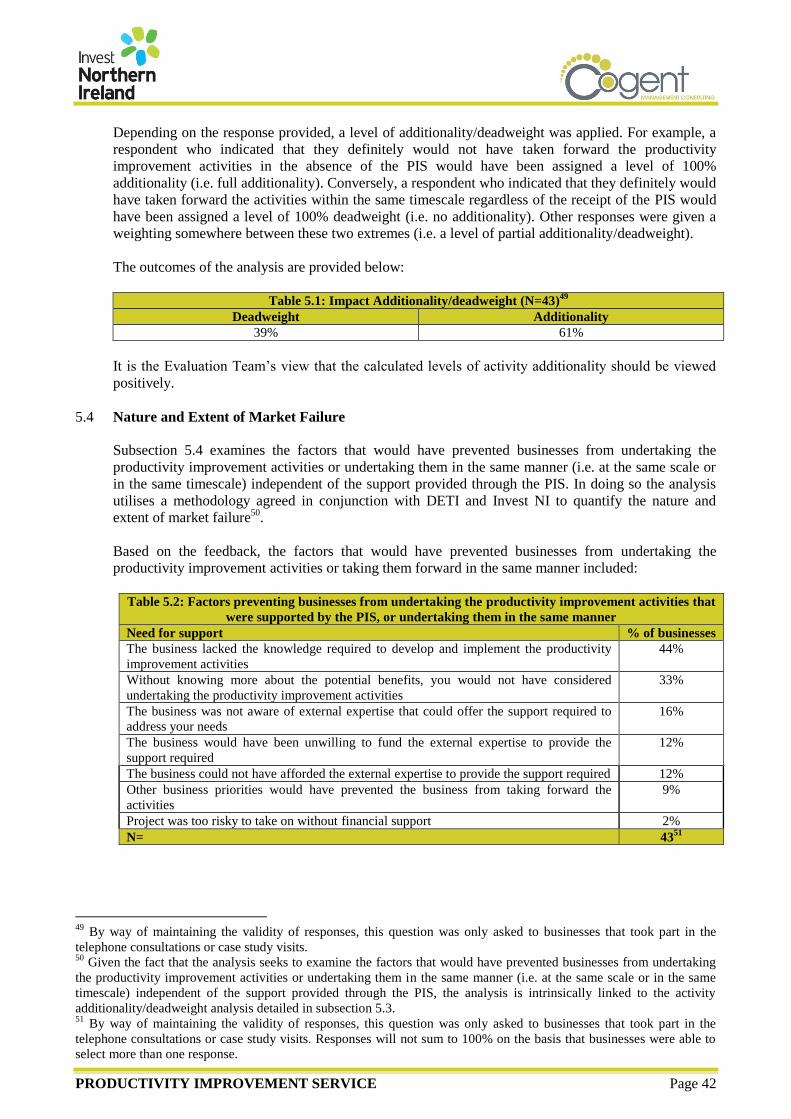
PRODUCTIVITY IMPROVEMENT SERVICE Page 42
Depending on the response provided, a level of additionality/deadweight was applied. For example, a
respondent who indicated that they definitely would not have taken forward the productivity
improvement activities in the absence of the PIS would have been assigned a level of 100%
additionality (i.e. full additionality). Conversely, a respondent who indicated that they definitely would
have taken forward the activities within the same timescale regardless of the receipt of the PIS would
have been assigned a level of 100% deadweight (i.e. no additionality). Other responses were given a
weighting somewhere between these two extremes (i.e. a level of partial additionality/deadweight).
The outcomes of the analysis are provided below:
Table 5.1: Impact Additionality/deadweight (N=43)
49
Deadweight Additionality
39% 61%
It is the Evaluation Team’s view that the calculated levels of activity additionality should be viewed
positively.
5.4 Nature and Extent of Market Failure
Subsection 5.4 examines the factors that would have prevented businesses from undertaking the
productivity improvement activities or undertaking them in the same manner (i.e. at the same scale or
in the same timescale) independent of the support provided through the PIS. In doing so the analysis
utilises a methodology agreed in conjunction with DETI and Invest NI to quantify the nature and
extent of market failure50
.
Based on the feedback, the factors that would have prevented businesses from undertaking the
productivity improvement activities or taking them forward in the same manner included:
Table 5.2: Factors preventing businesses from undertaking the productivity improvement activities that
were supported by the PIS, or undertaking them in the same manner
Need for support % of businesses
The business lacked the knowledge required to develop and implement the productivity
improvement activities
44%
Without knowing more about the potential benefits, you would not have considered
undertaking the productivity improvement activities
33%
The business was not aware of external expertise that could offer the support required to
address your needs
16%
The business would have been unwilling to fund the external expertise to provide the
support required
12%
The business could not have afforded the external expertise to provide the support required 12%
Other business priorities would have prevented the business from taking forward the
activities
9%
Project was too risky to take on without financial support 2%
N= 4351
49
By way of maintaining the validity of responses, this question was only asked to businesses that took part in the
telephone consultations or case study visits. 50
Given the fact that the analysis seeks to examine the factors that would have prevented businesses from undertaking
the productivity improvement activities or undertaking them in the same manner (i.e. at the same scale or in the same
timescale) independent of the support provided through the PIS, the analysis is intrinsically linked to the activity
additionality/deadweight analysis detailed in subsection 5.3. 51
By way of maintaining the validity of responses, this question was only asked to businesses that took part in the
telephone consultations or case study visits. Responses will not sum to 100% on the basis that businesses were able to
select more than one response.

PRODUCTIVITY IMPROVEMENT SERVICE Page 43
Based on these findings, the Evaluation Team was able to undertake an analysis of the degree to which
market failure played a role in businesses’ decision to take forward the productivity improvement
activities. This analysis involved categorising a business’ motives for participation based on:
No Market failure - The business felt that the productivity improvement activities ‘definitely
would have happened anyway’ or stated that they would not have undertaken the activities
because they:
- Would not have be able to afford the external expertise without financial support; and/or
- Would have been unwilling to pay the cost of using the external expertise without financial support;
and/or
- Other business priorities would have prevented the business from taking forward the activities.
Partial Market failure - The business’ decision to undertake the productivity improvement
activities was due to both non-market failure and market failure factors. That is to say, they would
not have undertaken the activities or would not have undertaken them in the same manner (i.e. to
the same scale and/or within the same timescales), because they:
- Would not have be able to afford the external expertise without financial support; and/or
- Would have been unwilling to pay the cost of using the external expertise without financial support;
and/or
- Other business priorities would have prevented the business from taking forward the activities; and
- The business lacked the knowledge required to develop and implement the productivity improvement
activities (market failure – asymmetric information); and/or
- Without knowing more about the potential benefits, the business would not have considered
undertaking the productivity improvement activities (market failure – asymmetric information) and/or
- The business was not aware of the external expertise that could offer the support required to address
your business needs (market failure – asymmetric information); and/or
- Project was too risky to take on without financial support (market failure – risk aversion due to
asymmetric information).
Full Market Failure - The business’ decision to undertake the productivity improvement
activities was solely due to market failure factors (asymmetric information) i.e.:
- The business lacked the knowledge required to develop and implement the productivity improvement
activities (market failure – asymmetric information); and/or
- Without knowing more about the potential benefits, the business would not have considered
undertaking the productivity improvement activities (market failure – asymmetric information) and/or
- The business was not aware of the external expertise that could offer the support required to address
your business needs (market failure – asymmetric information); and/or
- Project was too risky to take on without financial support (market failure – risk aversion due to
asymmetric information).
The results of this analysis are presented in the table below:
Table 5.3: Impact of market failure
No. of businesses
No Market Failure 26%
Partial Market Failure 14%
Full Market Failure 60%
Total (N=43)52
100%
In summary, the analysis indicates that almost three-quarters of businesses (74% - N=43) would not
have taken forward the productivity improvement activities (or would have taken the activities
forward to a different scale and/or timescale) due to full (60%) or partial market failure factors (14%)
primarily relating to asymmetric information.
52
Feedback provided by those businesses that engaged in the telephone consultations or case study visits.

PRODUCTIVITY IMPROVEMENT SERVICE Page 44
5.5 Achievement of Operational Impacts
As detailed in Table 5.4, the PIS supported businesses to achieve a range of quantifiable and non-quantifiable operational impacts.
Table 5.4: Achievement of productivity-related outcomes
53
Productivity Outcomes N % of business
deriving
benefit
Businesses able to quantify the impact
N % Range % average
change
% median
change
Increased levels of production/outputs/throughput 88 51% 29 5% - 100% 20% 29%
Reduced cycle/process/lead times 88 49% 22 8% - 50% 19% 22%
Reduction in levels of waste 88 47% 21 2% - 50% 12% 21%
Improved your on-time delivery performance 88 42% 17 1% - 100% 22% 17%
Improved your in-full delivery performance 88 34% 17 1% - 100% 22% 17%
Reduced inventory/work in progress 88 30% 13 2% - 30% 13% 13%
Reduced changeover time 88 26% 15 5% - 50% 23% 15%
Increased inventory turnover/higher stock turn rates 88 18% 9 2% - 50% 20% 9%
Improved supplier on-time delivery performance (supply
chain engagements only)
4 1 business 1 business 1 business 1 business 1 business
Improved supplier in-full delivery performance (supply chain
engagements only)
4 1 business 1 business 1 business 1 business 1 business
Improved employee engagement, morale and communication
with employees
88 61%
Enhanced utilisation of human capital i.e. manpower 88 60%
Increased customer satisfaction 88 56%
Enhance management capabilities 88 53%
Increased product or service quality 88 48%
Enhanced utilisation of physical capital i.e. machines 88 43%
Increased space and/or more effective space utilisation 88 34%
Safer working environment 88 33%
Improved communication with suppliers (supply chain
engagements only)
4 2 businesses
53
Feedback provided by those businesses that engaged in the telephone consultations, case study visits, or online survey.
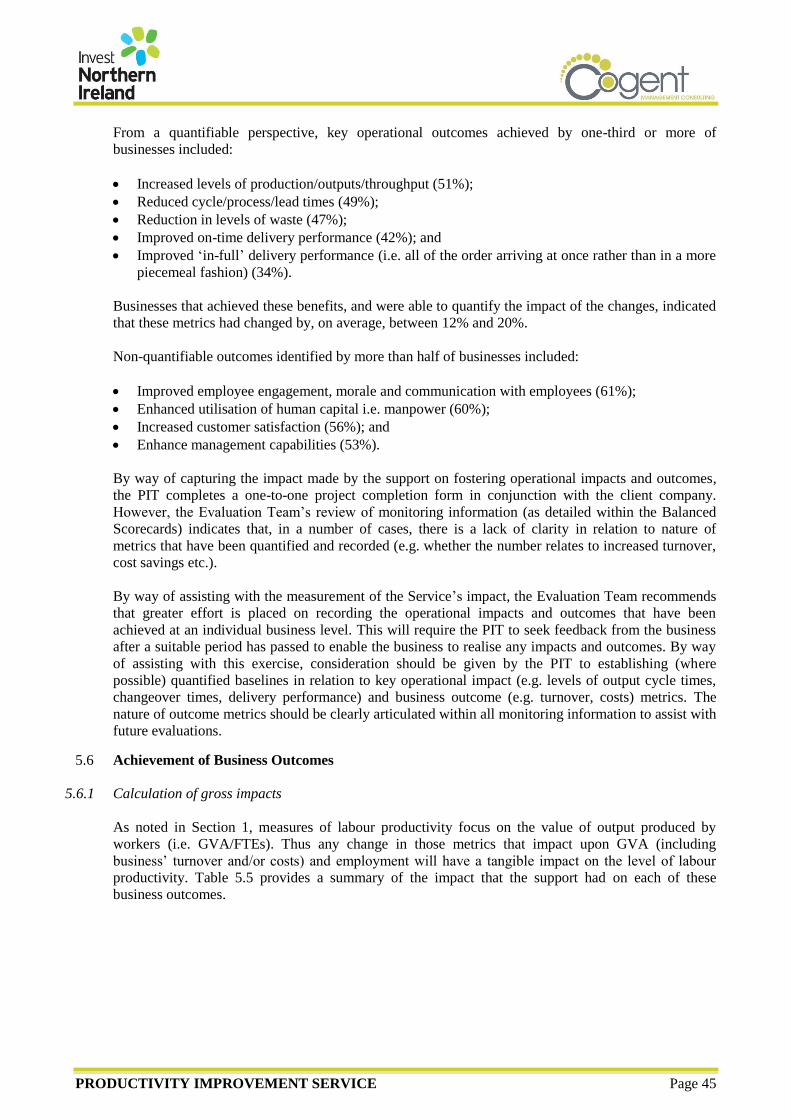
PRODUCTIVITY IMPROVEMENT SERVICE Page 45
From a quantifiable perspective, key operational outcomes achieved by one-third or more of
businesses included:
Increased levels of production/outputs/throughput (51%);
Reduced cycle/process/lead times (49%);
Reduction in levels of waste (47%);
Improved on-time delivery performance (42%); and
Improved ‘in-full’ delivery performance (i.e. all of the order arriving at once rather than in a more
piecemeal fashion) (34%).
Businesses that achieved these benefits, and were able to quantify the impact of the changes, indicated
that these metrics had changed by, on average, between 12% and 20%.
Non-quantifiable outcomes identified by more than half of businesses included:
Improved employee engagement, morale and communication with employees (61%);
Enhanced utilisation of human capital i.e. manpower (60%);
Increased customer satisfaction (56%); and
Enhance management capabilities (53%).
By way of capturing the impact made by the support on fostering operational impacts and outcomes,
the PIT completes a one-to-one project completion form in conjunction with the client company.
However, the Evaluation Team’s review of monitoring information (as detailed within the Balanced
Scorecards) indicates that, in a number of cases, there is a lack of clarity in relation to nature of
metrics that have been quantified and recorded (e.g. whether the number relates to increased turnover,
cost savings etc.).
By way of assisting with the measurement of the Service’s impact, the Evaluation Team recommends
that greater effort is placed on recording the operational impacts and outcomes that have been
achieved at an individual business level. This will require the PIT to seek feedback from the business
after a suitable period has passed to enable the business to realise any impacts and outcomes. By way
of assisting with this exercise, consideration should be given by the PIT to establishing (where
possible) quantified baselines in relation to key operational impact (e.g. levels of output cycle times,
changeover times, delivery performance) and business outcome (e.g. turnover, costs) metrics. The
nature of outcome metrics should be clearly articulated within all monitoring information to assist with
future evaluations.
5.6 Achievement of Business Outcomes
5.6.1 Calculation of gross impacts
As noted in Section 1, measures of labour productivity focus on the value of output produced by
workers (i.e. GVA/FTEs). Thus any change in those metrics that impact upon GVA (including
business’ turnover and/or costs) and employment will have a tangible impact on the level of labour
productivity. Table 5.5 provides a summary of the impact that the support had on each of these
business outcomes.
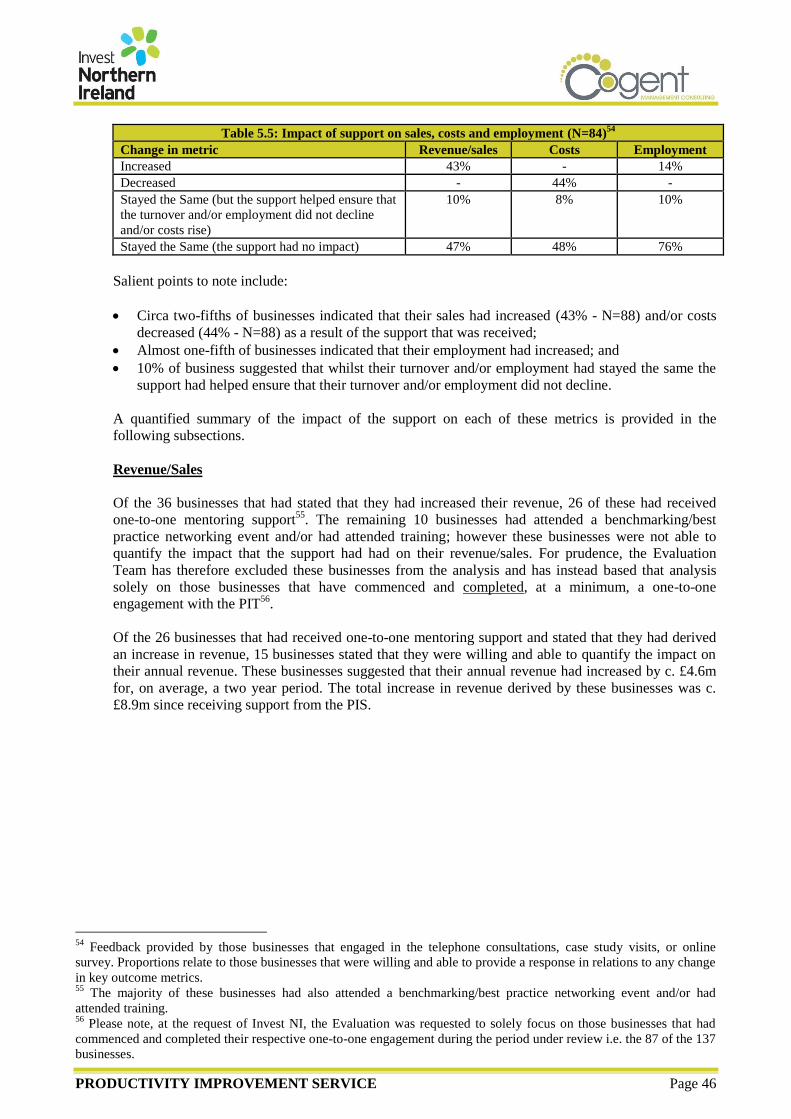
PRODUCTIVITY IMPROVEMENT SERVICE Page 46
Table 5.5: Impact of support on sales, costs and employment (N=84)54
Change in metric Revenue/sales Costs Employment
Increased 43% - 14%
Decreased - 44% -
Stayed the Same (but the support helped ensure that
the turnover and/or employment did not decline
and/or costs rise)
10% 8% 10%
Stayed the Same (the support had no impact) 47% 48% 76%
Salient points to note include:
Circa two-fifths of businesses indicated that their sales had increased (43% - N=88) and/or costs
decreased (44% - N=88) as a result of the support that was received;
Almost one-fifth of businesses indicated that their employment had increased; and
10% of business suggested that whilst their turnover and/or employment had stayed the same the
support had helped ensure that their turnover and/or employment did not decline.
A quantified summary of the impact of the support on each of these metrics is provided in the
following subsections.
Revenue/Sales
Of the 36 businesses that had stated that they had increased their revenue, 26 of these had received
one-to-one mentoring support55
. The remaining 10 businesses had attended a benchmarking/best
practice networking event and/or had attended training; however these businesses were not able to
quantify the impact that the support had had on their revenue/sales. For prudence, the Evaluation
Team has therefore excluded these businesses from the analysis and has instead based that analysis
solely on those businesses that have commenced and completed, at a minimum, a one-to-one
engagement with the PIT56
.
Of the 26 businesses that had received one-to-one mentoring support and stated that they had derived
an increase in revenue, 15 businesses stated that they were willing and able to quantify the impact on
their annual revenue. These businesses suggested that their annual revenue had increased by c. £4.6m
for, on average, a two year period. The total increase in revenue derived by these businesses was c.
£8.9m since receiving support from the PIS.
54
Feedback provided by those businesses that engaged in the telephone consultations, case study visits, or online
survey. Proportions relate to those businesses that were willing and able to provide a response in relations to any change
in key outcome metrics. 55
The majority of these businesses had also attended a benchmarking/best practice networking event and/or had
attended training. 56
Please note, at the request of Invest NI, the Evaluation was requested to solely focus on those businesses that had
commenced and completed their respective one-to-one engagement during the period under review i.e. the 87 of the 137
businesses.
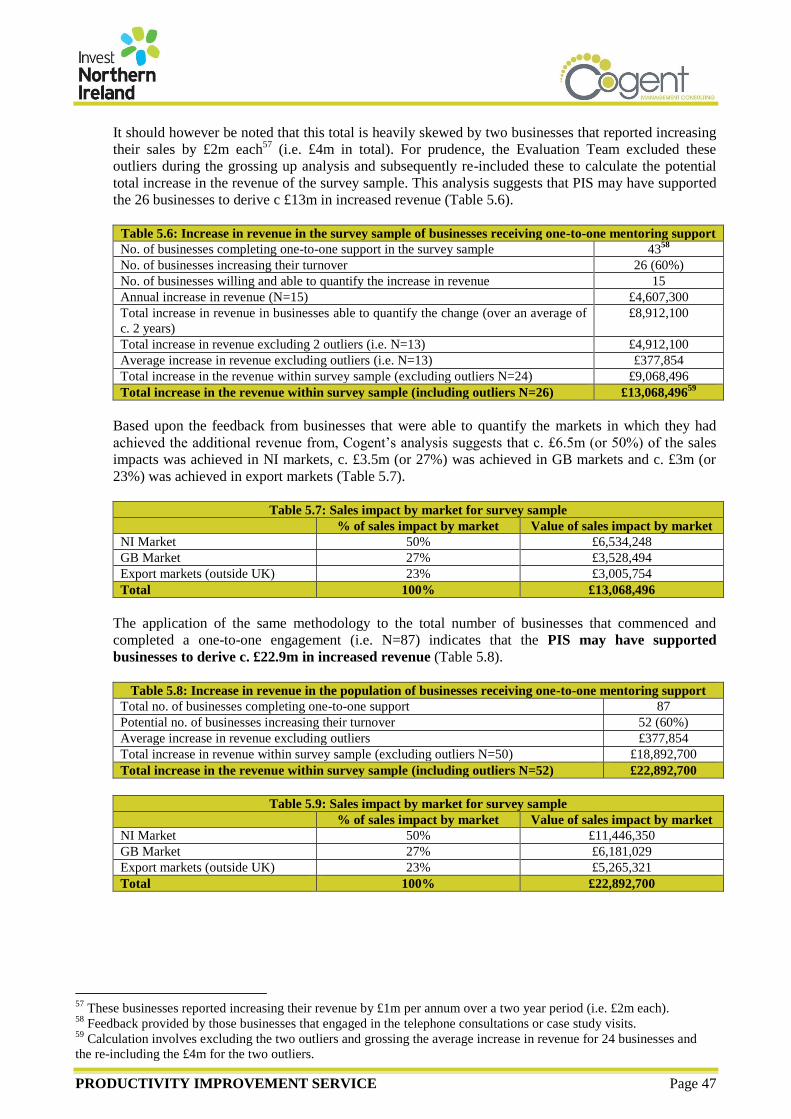
PRODUCTIVITY IMPROVEMENT SERVICE Page 47
It should however be noted that this total is heavily skewed by two businesses that reported increasing
their sales by £2m each57
(i.e. £4m in total). For prudence, the Evaluation Team excluded these
outliers during the grossing up analysis and subsequently re-included these to calculate the potential
total increase in the revenue of the survey sample. This analysis suggests that PIS may have supported
the 26 businesses to derive c £13m in increased revenue (Table 5.6).
Table 5.6: Increase in revenue in the survey sample of businesses receiving one-to-one mentoring support
No. of businesses completing one-to-one support in the survey sample 4358
No. of businesses increasing their turnover 26 (60%)
No. of businesses willing and able to quantify the increase in revenue 15
Annual increase in revenue (N=15) £4,607,300
Total increase in revenue in businesses able to quantify the change (over an average of
c. 2 years)
£8,912,100
Total increase in revenue excluding 2 outliers (i.e. N=13) £4,912,100
Average increase in revenue excluding outliers (i.e. N=13) £377,854
Total increase in the revenue within survey sample (excluding outliers N=24) £9,068,496
Total increase in the revenue within survey sample (including outliers N=26) £13,068,49659
Based upon the feedback from businesses that were able to quantify the markets in which they had
achieved the additional revenue from, Cogent’s analysis suggests that c. £6.5m (or 50%) of the sales
impacts was achieved in NI markets, c. £3.5m (or 27%) was achieved in GB markets and c. £3m (or
23%) was achieved in export markets (Table 5.7).
Table 5.7: Sales impact by market for survey sample
% of sales impact by market Value of sales impact by market
NI Market 50% £6,534,248
GB Market 27% £3,528,494
Export markets (outside UK) 23% £3,005,754
Total 100% £13,068,496
The application of the same methodology to the total number of businesses that commenced and
completed a one-to-one engagement (i.e. N=87) indicates that the PIS may have supported
businesses to derive c. £22.9m in increased revenue (Table 5.8).
Table 5.8: Increase in revenue in the population of businesses receiving one-to-one mentoring support
Total no. of businesses completing one-to-one support 87
Potential no. of businesses increasing their turnover 52 (60%)
Average increase in revenue excluding outliers £377,854
Total increase in revenue within survey sample (excluding outliers N=50) £18,892,700
Total increase in the revenue within survey sample (including outliers N=52) £22,892,700
Table 5.9: Sales impact by market for survey sample
% of sales impact by market Value of sales impact by market
NI Market 50% £11,446,350
GB Market 27% £6,181,029
Export markets (outside UK) 23% £5,265,321
Total 100% £22,892,700
57
These businesses reported increasing their revenue by £1m per annum over a two year period (i.e. £2m each). 58
Feedback provided by those businesses that engaged in the telephone consultations or case study visits. 59
Calculation involves excluding the two outliers and grossing the average increase in revenue for 24 businesses and
the re-including the £4m for the two outliers.
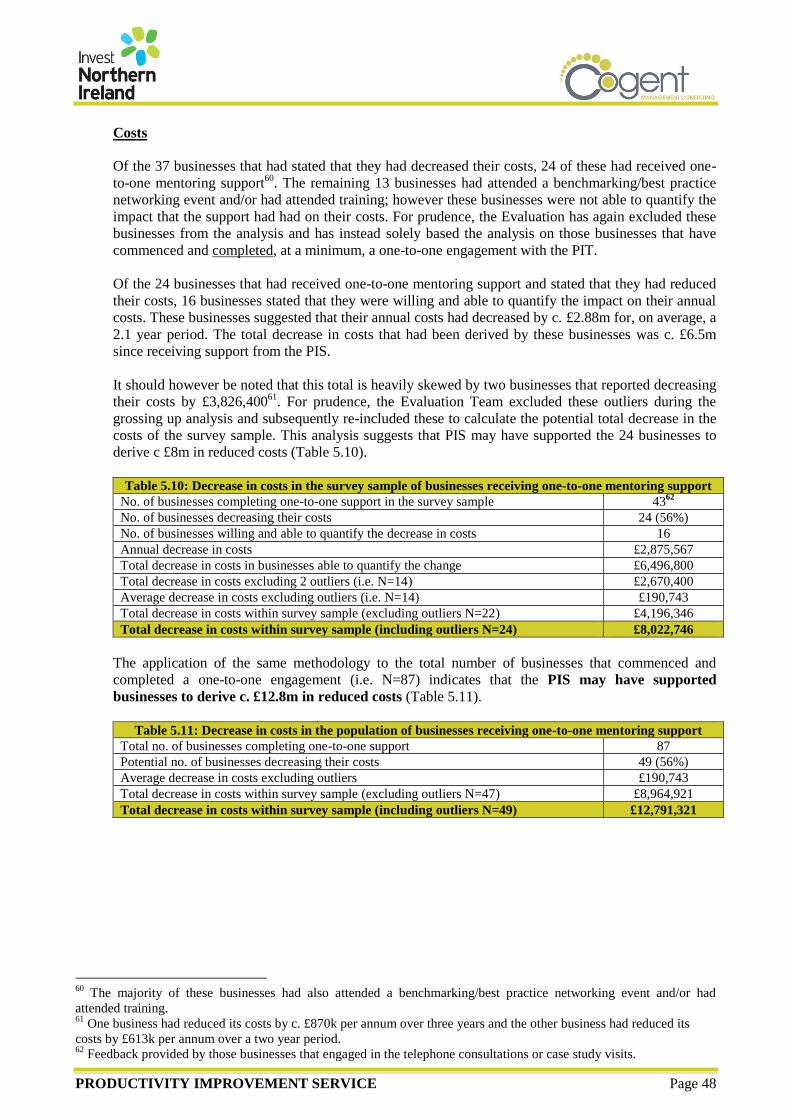
PRODUCTIVITY IMPROVEMENT SERVICE Page 48
Costs
Of the 37 businesses that had stated that they had decreased their costs, 24 of these had received one-
to-one mentoring support60
. The remaining 13 businesses had attended a benchmarking/best practice
networking event and/or had attended training; however these businesses were not able to quantify the
impact that the support had had on their costs. For prudence, the Evaluation has again excluded these
businesses from the analysis and has instead solely based the analysis on those businesses that have
commenced and completed, at a minimum, a one-to-one engagement with the PIT.
Of the 24 businesses that had received one-to-one mentoring support and stated that they had reduced
their costs, 16 businesses stated that they were willing and able to quantify the impact on their annual
costs. These businesses suggested that their annual costs had decreased by c. £2.88m for, on average, a
2.1 year period. The total decrease in costs that had been derived by these businesses was c. £6.5m
since receiving support from the PIS.
It should however be noted that this total is heavily skewed by two businesses that reported decreasing
their costs by £3,826,40061
. For prudence, the Evaluation Team excluded these outliers during the
grossing up analysis and subsequently re-included these to calculate the potential total decrease in the
costs of the survey sample. This analysis suggests that PIS may have supported the 24 businesses to
derive c £8m in reduced costs (Table 5.10).
Table 5.10: Decrease in costs in the survey sample of businesses receiving one-to-one mentoring support
No. of businesses completing one-to-one support in the survey sample 4362
No. of businesses decreasing their costs 24 (56%)
No. of businesses willing and able to quantify the decrease in costs 16
Annual decrease in costs £2,875,567
Total decrease in costs in businesses able to quantify the change £6,496,800
Total decrease in costs excluding 2 outliers (i.e. N=14) £2,670,400
Average decrease in costs excluding outliers (i.e. N=14) £190,743
Total decrease in costs within survey sample (excluding outliers N=22) £4,196,346
Total decrease in costs within survey sample (including outliers N=24) £8,022,746
The application of the same methodology to the total number of businesses that commenced and
completed a one-to-one engagement (i.e. N=87) indicates that the PIS may have supported
businesses to derive c. £12.8m in reduced costs (Table 5.11).
Table 5.11: Decrease in costs in the population of businesses receiving one-to-one mentoring support
Total no. of businesses completing one-to-one support 87
Potential no. of businesses decreasing their costs 49 (56%)
Average decrease in costs excluding outliers £190,743
Total decrease in costs within survey sample (excluding outliers N=47) £8,964,921
Total decrease in costs within survey sample (including outliers N=49) £12,791,321
60
The majority of these businesses had also attended a benchmarking/best practice networking event and/or had
attended training. 61
One business had reduced its costs by c. £870k per annum over three years and the other business had reduced its
costs by £613k per annum over a two year period. 62
Feedback provided by those businesses that engaged in the telephone consultations or case study visits.

PRODUCTIVITY IMPROVEMENT SERVICE Page 49
Employment
Of the 12 businesses that had stated that they had increased their employment, 9 of these had received
one-to-one mentoring support63
. The remaining 3 businesses had attended a benchmarking/best
practice networking event and/or had attended training; however these businesses were not able to
quantify the impact that the support had had on their employment. For prudence, the Evaluation has
again excluded these businesses from the analysis and has instead solely based the analysis on those
businesses that have commenced and completed, at a minimum, a one-to-one engagement with the
PIT.
The 9 businesses that had received one-to-one mentoring support and stated that they had increased
their employment as a result of PIS support suggested that they had increased their employment by 44
FTE employees (or c. 5 employees per business) (Table 5.10). The feedback from businesses indicated
that 34 of these jobs (77%) had salaries in excess of the current NI median (of £18,933).
Table 5.12: Decrease in costs in the survey sample of businesses receiving one-to-one mentoring support
No. of businesses completing one-to-one support in the survey sample 4364
No. of businesses increasing their employment 9 (21%)
No. of businesses willing and able to quantify the increase in employment 9
Total increase in FTE jobs 44
Number of jobs with salaries in excess of the NI median 34 (77%)
Average increase in FTE jobs 5
The application of grossing up analysis to the total number of businesses that commenced and
completed a one-to-one engagement (i.e. N=87) indicates that the PIS may have supported the
creation of 90 FTE jobs (Table 5.11). Potentially, 69 of these jobs had salaries in excess of the NI
median.
Table 5.13: Increase in employment in the population receiving one-to-one mentoring support
Total no. of businesses completing one-to-one support 87
Potential no. of businesses increasing their employment 18 (21%)
Average increase in FTE jobs 5
Total increase in employment 90
Number of jobs with salaries in excess of the NI median 69
Gross GVA impacts
By way of calculating the gross GVA impacts associated with the PIS, the Evaluation Team applied
the current average NI sectoral GVA (of 29.7%65
) to the calculated increase in turnover and added the
calculated decrease in costs that were potentially derived by businesses66
.
Table 5.14: Calculation of Gross GVA
Monetary Impact Conversion ratio Gross GVA
Increase in revenue £22,892,700 29.7% £6,799,132
Decrease in costs £12,791,321 N/A £12,791,321
Total £35,684,021 £19,590,453
Based on the preceding findings, the Evaluation Team’s analysis suggests that the support delivered
by the PIS may have contributed £19.6m in gross GVA to the NI economy.
63
The majority of these businesses had also attended a benchmarking/best practice networking event and/or had
attended training. 64
Feedback provided by those businesses that engaged in the telephone consultations or case study visits. 65
Source: Northern Ireland Annual Business Inquiry 2012 (December 2013). 66
GVA can be calculated by summing business EBITDA (calculated by summing operating profit, depreciation and
amortisation) and wages and salaries. The analysis assumes that a pound of cost saving is equivalent to a pound of GVA
on the basis that it will typically provide a direct impact on a business’ operating profits. The approach to calculating
GVA impacts was agreed in conjunction with Invest NI.

PRODUCTIVITY IMPROVEMENT SERVICE Page 50
Gross labour productivity impacts
The Evaluation Team’s analysis suggests that the PIS may have contributed to increasing productivity
(GVA/FTEs), on average, by £5,533 per FTE.
Table 5.15: Gross Productivity impacts (N=23)
67
Increase in GVA Total FTEs Productivity
£8,614,332 1,557 £5,533
On the basis that businesses suggested that they had derived their respective turnover and costs
benefits for, on average, c. 2 years suggests that the average annual productivity impact was £2,767
per FTE.
Other benefits derived
Positively, business indicated that they had derived a number of other benefits as a result of the
support provided through the PIS, with the most frequently cited including:
Increased workforce skills (84%) both by those that had directly received the support and through
the subsequent transfer of knowledge between employees (66%); and/or
Increased competiveness (66%); and/or
Increased sustainability (60%); and/or
The safeguarding of jobs (37%). The feedback from businesses indicates that the support
contributed to safeguarding, at a minimum, 330 FTE jobs.
Table 5.16: Other impacts derived by businesses in receipt of PIS support (N=82)
Impact % of businesses realising benefit68
Increased the skills of business’ workforce 84%
Transfer of knowledge between businesses or individuals 66%
Increased competitiveness 66%
Increased sustainability 60%
Other 49%
Impact on your business’ survival 46%
Safeguarding of jobs 37%
In addition, based upon the positive outcomes that had been achieved, almost half of businesses (46%
- N=82) indicated that the support provided through the PIS had contributed to embedding a cultural
shift towards continuous productivity improvement across their respective organisations.
“Following the attendance of training, I was able to relay the information to other staff members who fed this
down to their teams”.
“Prior to receiving support, I think our company was a bit entrenched in its operational practices…there was a
mind-set that ‘we’ve done well so far, so why do we need to change?’ However, those that were resistant to
change have been won-over by the results that have been delivered and I think that they would be happier to
make similar changes in future if they were required”.
“You can’t underestimate the challenge of trying to make change, especially with those that are set in their
ways. This support has definitely helped and I hope that further changes that will be made as a result of the
support will foster changes in mind-sets from senior through to operational levels.”
PIS Recipients of support
67
Please note that the number of respondents reflects the number of businesses that were willing and able to provide
both GVA and employment impacts. Feedback provided by those businesses that engaged in the telephone
consultations or case study visits. 68
Responses will not sum to 100% on the basis that businesses were able to select more than one response. Feedback
provided by those businesses that engaged in the telephone consultations, case study visits, or online survey.

PRODUCTIVITY IMPROVEMENT SERVICE Page 51
Anticipated impacts
In addition to the actual outturns achieved to date, businesses also provided an indication of the
aggregate anticipated turnover, costs savings and employment impacts that they anticipate occurring
over the next three years as a result of the PIS support (Table 5.17).
Table 5.17: Anticipated business outturn over the next three years (N=24)
Turnover Cost Savings Employment
£20,434,100 £6,977,100 148
Consultation with businesses indicated that they anticipated the above impacts to be realised on the
basis that they would continue to realise benefits as a result of the operational efficiencies that had
been embedded within their respective organisations69
.
Whilst caution should be taken in terms of placing reliance on the above figures (given their
speculative nature), any positive change in the above metrics will reflect positively on the return-on-
investment and associated VFM provided by the Service during the period under review.
5.6.2 Calculation of Net Additional Impacts
Impact Additionality
The net impact of the PIS support (i.e. its additionality) on recipient businesses’ sales, costs,
employment or other outturns can only be measured after making allowances for what would have
happened in the absence of the intervention. That is, the impact must allow for deadweight.
‘Deadweight’ refers to outcomes that would have occurred without the intervention.
Please note that given that most evaluations are undertaken some time after an activity is implemented,
the Evaluation Team does not consider it appropriate to apply ‘activity additionality’ to impact
measures. The reason being that, in the intervening period any variety of factors (and support
interventions) may have had an impact on a business. Therefore, an impact additionality measure was
used to ascertain the level of deadweight/additionality relating to business outturns.
The analysis of individual survey responses and application of the same ‘participant self-assessment’
methodology used to assess ‘activity additionality’, results in the following levels of ‘impact
deadweight and additionality’70
:
Table 5.18: Impact Additionality/deadweight
71
Deadweight Additionality
41% 59%
The Evaluation Team notes that the level of ‘impact additionality’ (59%) is broadly the same as the
level of ‘activity additionality’ (61%) suggesting that the Service has been of equal importance in
encouraging businesses to undertake the productivity improvement activities as it has in supporting
them to ultimately realise any business related outcomes.
Positively, as detailed in the Table 5.19, the Evaluation Team’s benchmarking of the Service’s level of
‘impact additionality’ with other similar interventions shows that the Programme is performing better
than these. For example, the level of PIS impact additionality is 8.1 percentage points higher than for
‘Promotion & development of science, R&D and innovation infrastructure’ interventions across the
69
A number of other businesses indicated that, at the time of surveying, they had only recently completed their one-to-
one mentoring support in conjunction with the PIT and hence were only likely to realise benefits in the coming years. 70
See Appendix VI for further details. 71
Feedback provided by those businesses that engaged in the telephone consultations, case study visits, or online
survey.
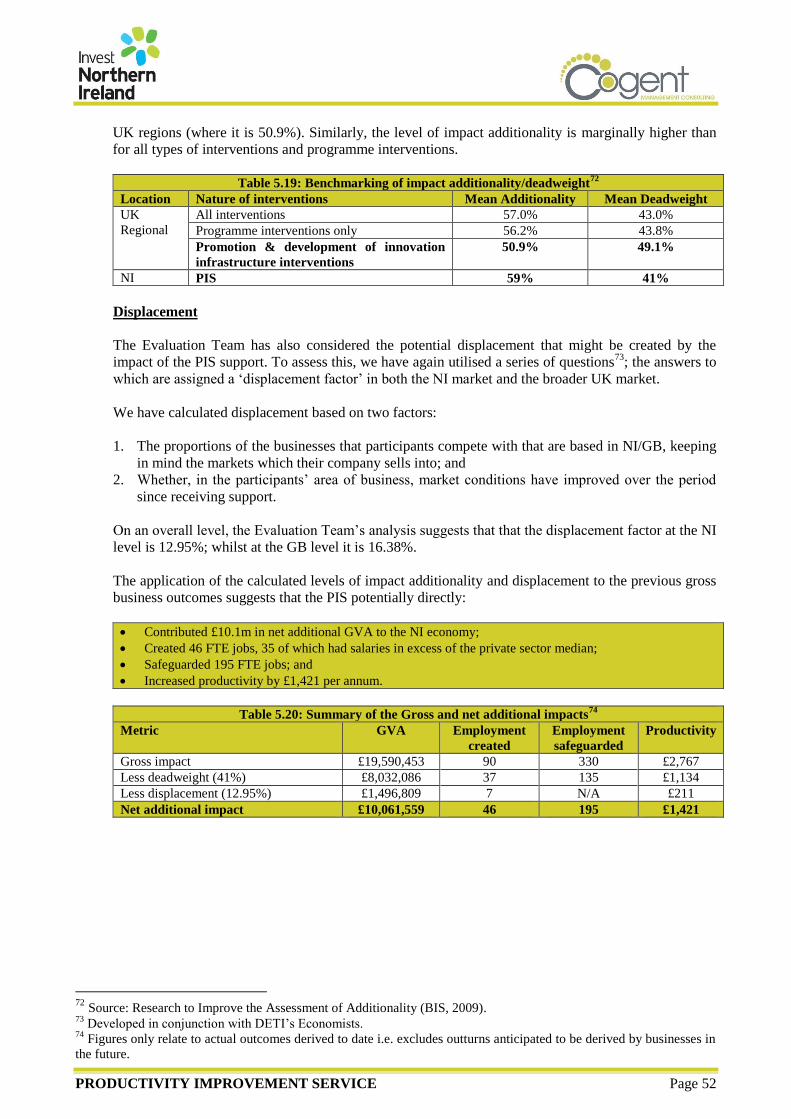
PRODUCTIVITY IMPROVEMENT SERVICE Page 52
UK regions (where it is 50.9%). Similarly, the level of impact additionality is marginally higher than
for all types of interventions and programme interventions.
Table 5.19: Benchmarking of impact additionality/deadweight
72
Location Nature of interventions Mean Additionality Mean Deadweight
UK
Regional
All interventions 57.0% 43.0%
Programme interventions only 56.2% 43.8%
Promotion & development of innovation
infrastructure interventions
50.9% 49.1%
NI PIS 59% 41%
Displacement
The Evaluation Team has also considered the potential displacement that might be created by the
impact of the PIS support. To assess this, we have again utilised a series of questions73
; the answers to
which are assigned a ‘displacement factor’ in both the NI market and the broader UK market.
We have calculated displacement based on two factors:
1. The proportions of the businesses that participants compete with that are based in NI/GB, keeping
in mind the markets which their company sells into; and
2. Whether, in the participants’ area of business, market conditions have improved over the period
since receiving support.
On an overall level, the Evaluation Team’s analysis suggests that that the displacement factor at the NI
level is 12.95%; whilst at the GB level it is 16.38%.
The application of the calculated levels of impact additionality and displacement to the previous gross
business outcomes suggests that the PIS potentially directly:
Contributed £10.1m in net additional GVA to the NI economy;
Created 46 FTE jobs, 35 of which had salaries in excess of the private sector median;
Safeguarded 195 FTE jobs; and
Increased productivity by £1,421 per annum.
Table 5.20: Summary of the Gross and net additional impacts
74
Metric GVA Employment
created
Employment
safeguarded
Productivity
Gross impact £19,590,453 90 330 £2,767
Less deadweight (41%) £8,032,086 37 135 £1,134
Less displacement (12.95%) £1,496,809 7 N/A £211
Net additional impact £10,061,559 46 195 £1,421
72
Source: Research to Improve the Assessment of Additionality (BIS, 2009). 73
Developed in conjunction with DETI’s Economists. 74
Figures only relate to actual outcomes derived to date i.e. excludes outturns anticipated to be derived by businesses in
the future.
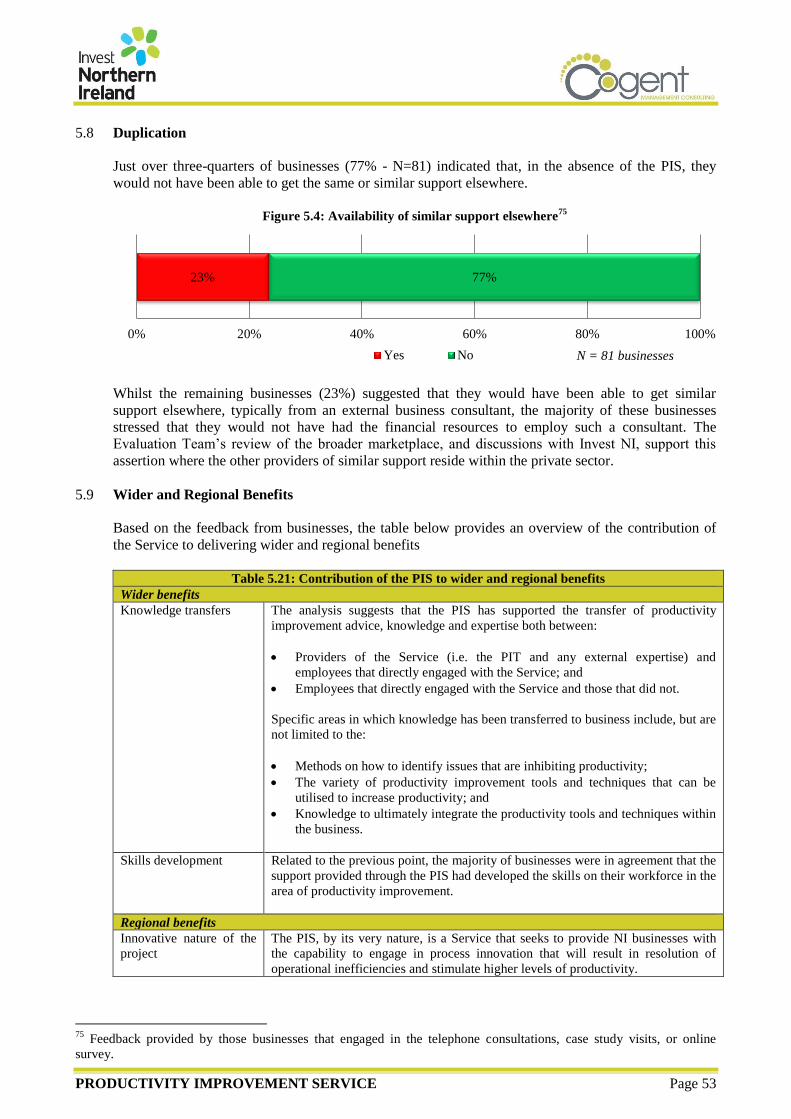
PRODUCTIVITY IMPROVEMENT SERVICE Page 53
5.8 Duplication
Just over three-quarters of businesses (77% - N=81) indicated that, in the absence of the PIS, they
would not have been able to get the same or similar support elsewhere.
Figure 5.4: Availability of similar support elsewhere
75
Whilst the remaining businesses (23%) suggested that they would have been able to get similar
support elsewhere, typically from an external business consultant, the majority of these businesses
stressed that they would not have had the financial resources to employ such a consultant. The
Evaluation Team’s review of the broader marketplace, and discussions with Invest NI, support this
assertion where the other providers of similar support reside within the private sector.
5.9 Wider and Regional Benefits
Based on the feedback from businesses, the table below provides an overview of the contribution of
the Service to delivering wider and regional benefits
Table 5.21: Contribution of the PIS to wider and regional benefits
Wider benefits
Knowledge transfers The analysis suggests that the PIS has supported the transfer of productivity
improvement advice, knowledge and expertise both between:
Providers of the Service (i.e. the PIT and any external expertise) and
employees that directly engaged with the Service; and
Employees that directly engaged with the Service and those that did not.
Specific areas in which knowledge has been transferred to business include, but are
not limited to the:
Methods on how to identify issues that are inhibiting productivity;
The variety of productivity improvement tools and techniques that can be
utilised to increase productivity; and
Knowledge to ultimately integrate the productivity tools and techniques within
the business.
Skills development Related to the previous point, the majority of businesses were in agreement that the
support provided through the PIS had developed the skills on their workforce in the
area of productivity improvement.
Regional benefits
Innovative nature of the
project
The PIS, by its very nature, is a Service that seeks to provide NI businesses with
the capability to engage in process innovation that will result in resolution of
operational inefficiencies and stimulate higher levels of productivity.
75
Feedback provided by those businesses that engaged in the telephone consultations, case study visits, or online
survey.
23% 77%
0% 20% 40% 60% 80% 100%
Yes No N = 81 businesses
PRODUCTIVITY IMPROVEMENT SERVICE Page 54
5.10 Case studies
By way of illustrating the impact made by the PIS, the Evaluation Team undertook a number of case
study visits with businesses that had received, at a minimum, one-to-one mentoring support. Whilst
individual case study information can be found in the tables overleaf and Appendix VII76
, the research
indicates:
The PIT provided a tailored suite of support to address the specific operational inefficiencies being
faced by businesses. Key lean and supply chain tools and techniques utilised as part of the one-to-
one mentoring engagements included Value Stream Maps, TPM, 7 Quality Tools, A3 etc.;
Businesses were of the view that the support provided by the PIT was of a high standard and had
enabled them to successfully embed the operational changes being recommended through the
support;
Businesses indicated that the productivity improvement activities that had been taken forward had
resulted in key operational improvements including (but not limited to) increased output,
reductions in waste, improved space utilisation and enhanced management capabilities;
As a result of the aforementioned operational improvements, businesses reported realising a range
of monetary and non-monetary outcomes including reduced costs, increased turnover, enhanced
knowledge and skills etc.; and
Importantly, businesses indicated that the support provided by the PIT had enabled them to
develop and embed a culture of continuous improvement within the business from senior
management level through to more operational levels.
76
Please note that the business names have been removed to preserve their anonymity.

PRODUCTIVITY IMPROVEMENT SERVICE Page 55
Case Study 1: Company A
Company
Overview
Company A is one of the leading packaging producers in Europe with production plants in 16 countries, including the UK plant based in Northern Ireland. The
company provides expertise in the development, design, production and decoration of polymer (plastic) food packaging. There is a keen focus on innovation
and the company continually seeks to introduce new and bespoke package designs for productions using the latest sleeving and printing techniques.
The operation within Northern Ireland currently employs c. 260 FTEs and has an annual turnover in excess of £35m. The company’s direct competitors are
based in Great Britain.
Productivity
Issues faced
Prior to the Productivity Improvement Services support received, Company A faced the following productivity issues:
Company A has a varied product range including many design options. Therefore machine changeovers are frequent and can be complex in nature.
However, the company had never fully investigated the time required to undertake a simple/ complex machine changeover. As such, there was reportedly
significant wastage in the process during set-up and changeover stages. This was impacting on the overall production capacity of the plant, resulting in
Company A turning down order opportunities from within its Group and externally;
There was poor communication between management, shift leaders and operatives and within employees groups;
Management and shift leaders had a daily meeting set away from the shop floor which lasted over one hour per day which was considered to be inefficient;
Machines and processes were not standardised so resources were not readily transferable to fulfil changing orders;
There was excess wastage throughout the production process e.g. defects and damaged materials;
The company was paying for external storage space to hold excess levels of inventory; and
Product quality was variable with high numbers of complaints from customers.
Nature of
support
delivered
Staff from Company A attended a number of benchmarking/ best practice events to learn the principles of lean manufacturing and continuous improvement
(Beyond Operational Excellence, Hoshin Kanri, University of Kentucky, Lean Product Development, Continuous Improvement and Simulated Work
Environments). They were very satisfied with these events and felt they offered good opportunities for learning and networking, although they acknowledged
that there were limited opportunities to increase their understanding of sector-specific issues as they were the only company from their sector represented at the
events.
Employees attended a range of training including Lean Fundamentals Training, Total Productive Maintenance and Practical Problem Solving using A3. On-
site/ in-house training was also provided to further embed Lean Fundamentals and SMED throughout the wider workforce (86 employees). The company
reported high levels of satisfaction with all aspects of the training provided.
Company A received one-to-one support from Invest NI through a Lean Engagement between August 2012 and January 2014. The company also received
Supply Chain Management support, although it was noted that the vast majority (80%) of all supplies come from two suppliers, so this component of the
support was not deemed to be as essential to the company. The productivity improvement tools which were implemented included:
A full diagnostic review of parts, processes and people to identify the key productivity issues;
Implementation of 5S principles across the site;
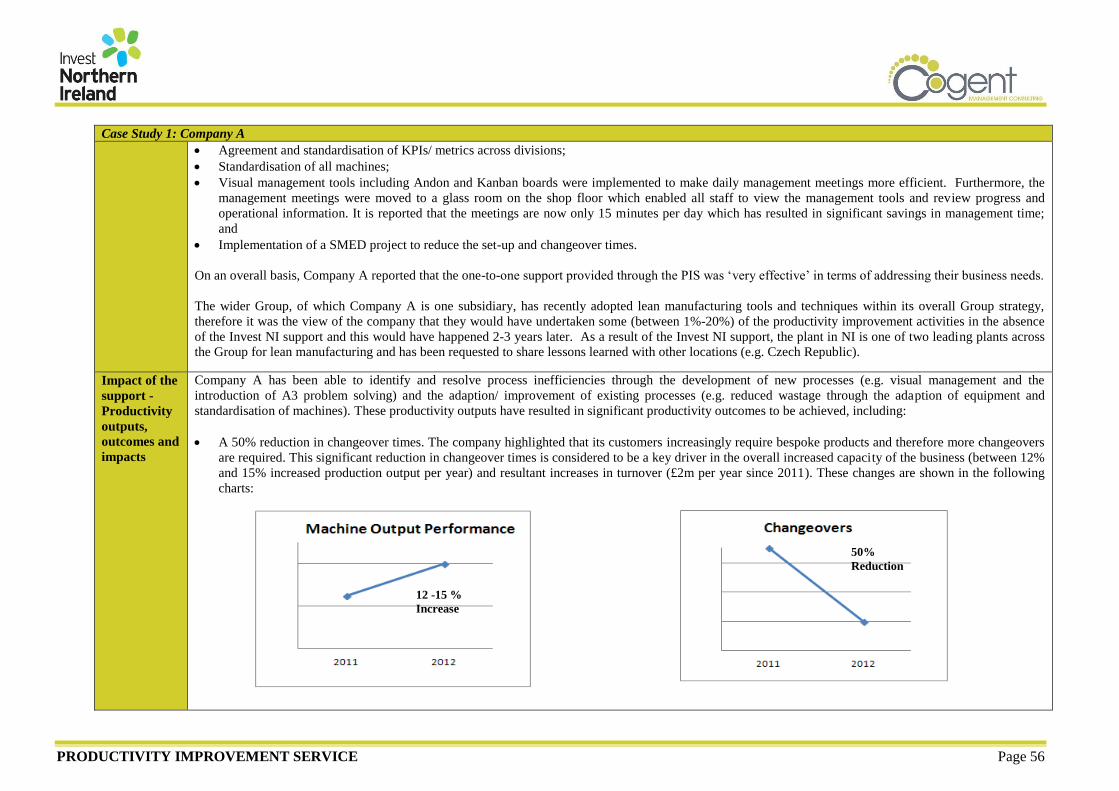
PRODUCTIVITY IMPROVEMENT SERVICE Page 56
Case Study 1: Company A
Agreement and standardisation of KPIs/ metrics across divisions;
Standardisation of all machines;
Visual management tools including Andon and Kanban boards were implemented to make daily management meetings more efficient. Furthermore, the
management meetings were moved to a glass room on the shop floor which enabled all staff to view the management tools and review progress and
operational information. It is reported that the meetings are now only 15 minutes per day which has resulted in significant savings in management time;
and
Implementation of a SMED project to reduce the set-up and changeover times.
On an overall basis, Company A reported that the one-to-one support provided through the PIS was ‘very effective’ in terms of addressing their business needs.
The wider Group, of which Company A is one subsidiary, has recently adopted lean manufacturing tools and techniques within its overall Group strategy,
therefore it was the view of the company that they would have undertaken some (between 1%-20%) of the productivity improvement activities in the absence
of the Invest NI support and this would have happened 2-3 years later. As a result of the Invest NI support, the plant in NI is one of two leading plants across
the Group for lean manufacturing and has been requested to share lessons learned with other locations (e.g. Czech Republic).
Impact of the
support -
Productivity
outputs,
outcomes and
impacts
Company A has been able to identify and resolve process inefficiencies through the development of new processes (e.g. visual management and the
introduction of A3 problem solving) and the adaption/ improvement of existing processes (e.g. reduced wastage through the adaption of equipment and
standardisation of machines). These productivity outputs have resulted in significant productivity outcomes to be achieved, including:
A 50% reduction in changeover times. The company highlighted that its customers increasingly require bespoke products and therefore more changeovers
are required. This significant reduction in changeover times is considered to be a key driver in the overall increased capacity of the business (between 12%
and 15% increased production output per year) and resultant increases in turnover (£2m per year since 2011). These changes are shown in the following
charts:
12 -15 %
Increase
50%
Reduction

PRODUCTIVITY IMPROVEMENT SERVICE Page 57
Case Study 1: Company A
Reduction in the process time by 10%;
Improved product quality resulting in a 35% reduction in quality complaints from customers each year;
Waste levels reduced by 55% (from 9% to 4% of total production output). By way of example, Company A changed the end of the fork attached to the
fork-lift truck which it uses to lift rolls of plastics throughout the plant to prevent tearing and damage. Now each roll of plastic produces significantly
more products with less wastage;
A 25% reduction in inventory levels. The company has not yet reduced inventory to an extent that it does not require external storage, but this is an
ongoing objective of continuous improvement;
A reduction in inventory turnover of 20% from 35 days to 28 days. The company now considers the inventory turnover to be in line with industry
standards;
Improved human capital utilisation;
Enhanced utilisation of physical capital;
Enhanced management capabilities and improved employee engagement, morale and communication;
Improved skills of the workforce;
Transfer of knowledge within the Group;
Deferred capital expenditure;
Increased competitiveness through lower costs (thereby contributing to increased turnover as new business has been acquired, as well as contributing to
the survival of the company as market conditions have become increasingly competitive on a global scale); and
Increased sustainability by reducing the number of kilowatt hours for each kilogram of plastic consumed from 2.6 in 2012 to 1.65 in 2014 (37%
reduction). Whilst this was not a direct objective of the PIS, it is the view of Company A that the PIS support put structures in place which enabled them
to address sustainability issues.
Impact of the
support –
Business
Outcomes
As a result of the productivity outputs, outcomes and impacts there have been significant financial outcomes for Company A. On average the company has
increased its turnover by £2m per annum since 2011 (from c. £29 in 2011 to c. £35m in 2014). Whilst the company has confirmed that there have been
positive impacts to the turnover across the period under consideration, it was unable to quantify the proportion of the increased turnover which is directly
attributable to the productivity improvements/ lean processes rather than any other factors which impact on its turnover figures.
Company A reported that costs have decreased into two separate areas as a result of the productivity improvement activities undertaken, discussed as follows:
1. Savings in labour costs
Company A monitors the contribution made by each employee to turnover, as an indication of labour efficiency. It is reported that the average contribution to
turnover for each employee increased from £115,000 in 2011 to £128,000 in 2013. Based on turnover and employee levels across the period, Company A
estimated that it achieved £1,800,000 in labour cost savings through the improvements in productivity of its employees, thereby resulting in greater overall
profitability.
PRODUCTIVITY IMPROVEMENT SERVICE Page 58
Case Study 1: Company A
2. Savings via transfer of business from a sub-contract supplier
As previously noted, the productivity improvement activities (and in particular the SMED project to reduce set-up and changeover times) have resulted in
greater production capacity within the Northern Ireland plant. This has enabled Company A to purchase semi-finished materials from a supplier within the
wider Group and finish the production in-house, where it previously was purchasing finished packaging products and only completing the sleeving and printing
in-house. As such, Company A can purchase the materials at a lower overall cost and achieve greater value-added on the completion of the process. The
representatives from Company A estimated that there has been £800,000 of cost savings through the transfer of business from the supplier since 2011.
In summary, Company A estimates that £2.6m of cost savings have been realised since 2011 as a result of the productivity improvement activities undertaken.
The company reported that some of the overall benefits/ impacts (i.e. between 21% - 40%) would have been achieved by the company in the absence of the
Invest NI support but that these impacts would have been achieved 2-3 years later. Company A is of the view that the cost savings achieved will continue over
the next three years i.e. a further £2.6m of cost savings versus the position if the productivity improvement activities had not been undertaken.
The company has increased its total number of FTEs by 42 from 219 FTEs prior to the PIS support to 261 FTEs now. This increase in employment has
primarily been as a result of increased customer demand, rather than productivity improvements.
Case Study 2: Company B
Company
Overview
Company B is a global manufacturer of carpet tiles for government, education providers, offices and hospitality businesses. Company B has over 60 plants
worldwide including three in the UK (including one in Northern Ireland) and one in the Republic of Ireland. The Northern Ireland manufacturing plant has just
under 200 FTEs and it competes on a global scale. Very few of its competitors are reported to be based in the UK.
Productivity
Issues faced
Prior to the Productivity Improvement Services received, Company B faced the following productivity issues:
The workplace was not well-organised and structured;
There was poor communication between management, shift leaders and operatives and within employee groups;
Customer orders have become increasingly bespoke, which requires more changeovers (c. 50-60 per week). Set-up and changeover times were considered
to be excessive which had a significant negative impact on overall production capacity;
There was considered to be excessive wastage throughout the production process through staff and machine inefficiencies;
Delays and blockages meant that only c. 50% of orders were delivered on-time and in-full which was impacting on repeat business potential;
Machines and processes were not standardised so resources were not readily transferable between processes; and
There are many long-standing staff within Company B, some of who were reportedly resistant to changes.
Nature of
support
Staff from Company B attended Lean Fundamentals, Supply Chain Management and Practical Problem Solving using A3 training. On-site/ in-house training
was also provided to the majority of both managerial and operative staff within Company B. The company was ‘very satisfied’ with the training delivered
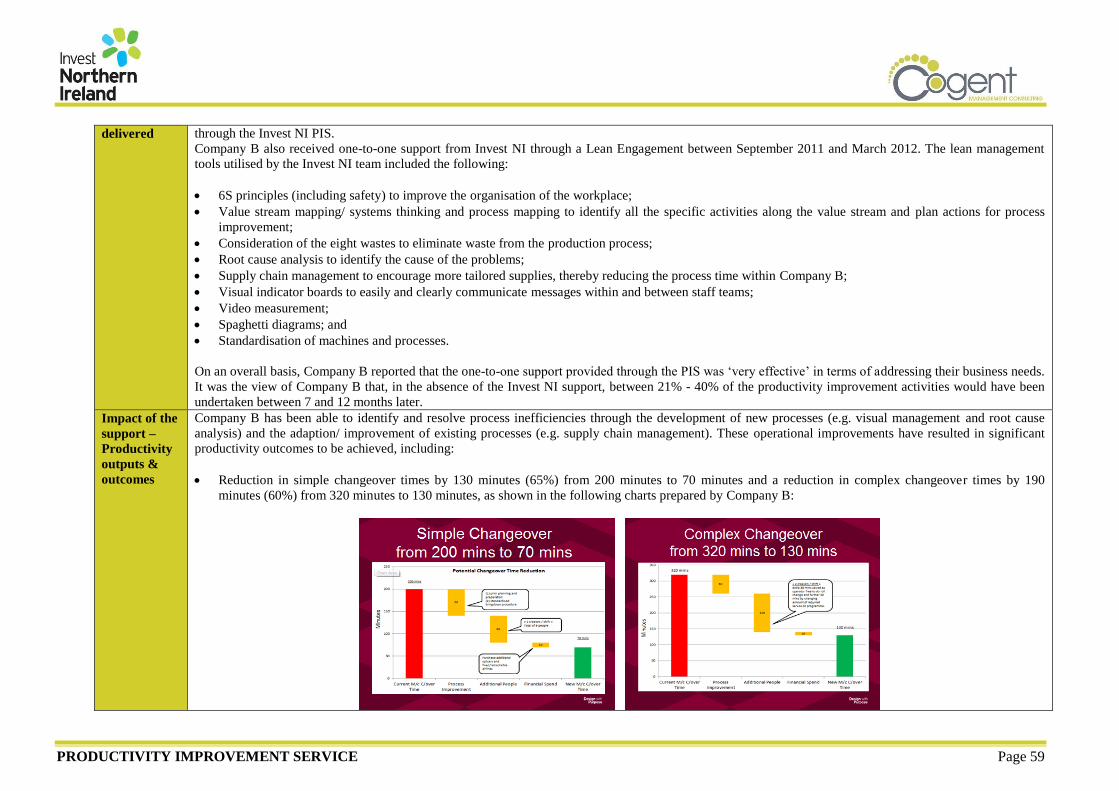
PRODUCTIVITY IMPROVEMENT SERVICE Page 59
delivered through the Invest NI PIS.
Company B also received one-to-one support from Invest NI through a Lean Engagement between September 2011 and March 2012. The lean management
tools utilised by the Invest NI team included the following:
6S principles (including safety) to improve the organisation of the workplace;
Value stream mapping/ systems thinking and process mapping to identify all the specific activities along the value stream and plan actions for process
improvement;
Consideration of the eight wastes to eliminate waste from the production process;
Root cause analysis to identify the cause of the problems;
Supply chain management to encourage more tailored supplies, thereby reducing the process time within Company B;
Visual indicator boards to easily and clearly communicate messages within and between staff teams;
Video measurement;
Spaghetti diagrams; and
Standardisation of machines and processes.
On an overall basis, Company B reported that the one-to-one support provided through the PIS was ‘very effective’ in terms of addressing their business needs.
It was the view of Company B that, in the absence of the Invest NI support, between 21% - 40% of the productivity improvement activities would have been
undertaken between 7 and 12 months later.
Impact of the
support –
Productivity
outputs &
outcomes
Company B has been able to identify and resolve process inefficiencies through the development of new processes (e.g. visual management and root cause
analysis) and the adaption/ improvement of existing processes (e.g. supply chain management). These operational improvements have resulted in significant
productivity outcomes to be achieved, including:
Reduction in simple changeover times by 130 minutes (65%) from 200 minutes to 70 minutes and a reduction in complex changeover times by 190
minutes (60%) from 320 minutes to 130 minutes, as shown in the following charts prepared by Company B:
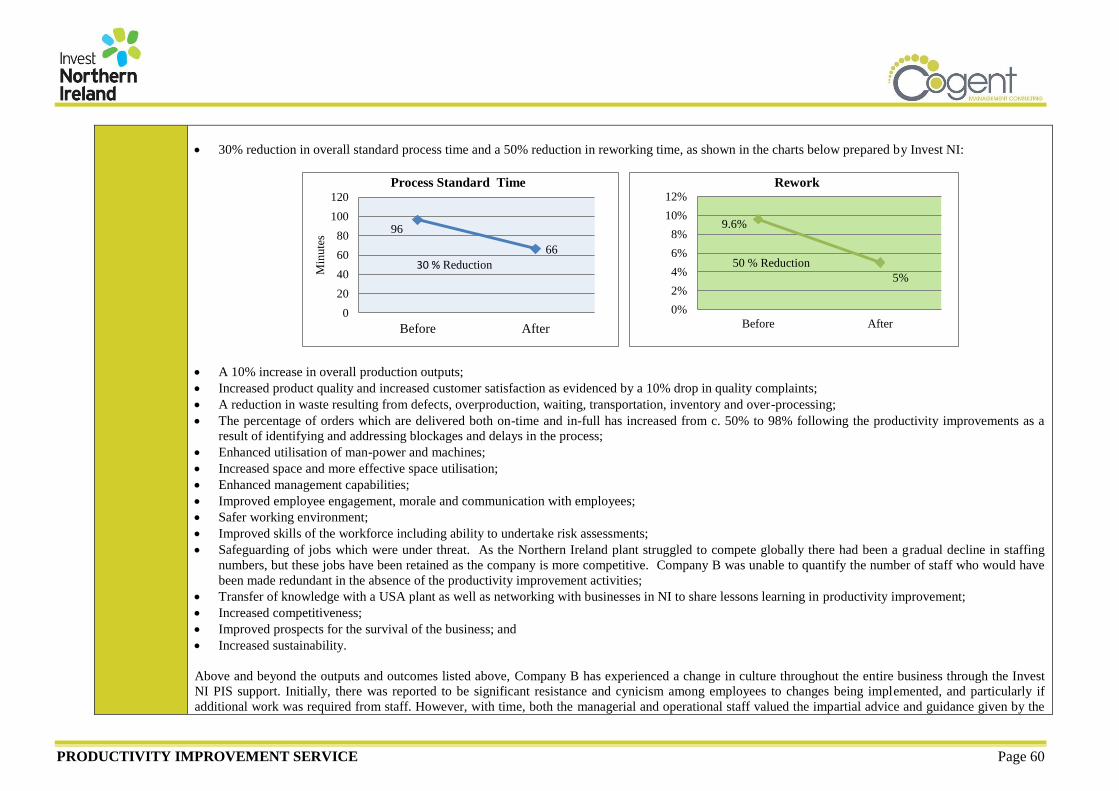
PRODUCTIVITY IMPROVEMENT SERVICE Page 60
30% reduction in overall standard process time and a 50% reduction in reworking time, as shown in the charts below prepared by Invest NI:
A 10% increase in overall production outputs;
Increased product quality and increased customer satisfaction as evidenced by a 10% drop in quality complaints;
A reduction in waste resulting from defects, overproduction, waiting, transportation, inventory and over-processing;
The percentage of orders which are delivered both on-time and in-full has increased from c. 50% to 98% following the productivity improvements as a
result of identifying and addressing blockages and delays in the process;
Enhanced utilisation of man-power and machines;
Increased space and more effective space utilisation;
Enhanced management capabilities;
Improved employee engagement, morale and communication with employees;
Safer working environment;
Improved skills of the workforce including ability to undertake risk assessments;
Safeguarding of jobs which were under threat. As the Northern Ireland plant struggled to compete globally there had been a gradual decline in staffing
numbers, but these jobs have been retained as the company is more competitive. Company B was unable to quantify the number of staff who would have
been made redundant in the absence of the productivity improvement activities;
Transfer of knowledge with a USA plant as well as networking with businesses in NI to share lessons learning in productivity improvement;
Increased competitiveness;
Improved prospects for the survival of the business; and
Increased sustainability.
Above and beyond the outputs and outcomes listed above, Company B has experienced a change in culture throughout the entire business through the Invest
NI PIS support. Initially, there was reported to be significant resistance and cynicism among employees to changes being implemented, and particularly if
additional work was required from staff. However, with time, both the managerial and operational staff valued the impartial advice and guidance given by the
0
20
40
60
80
100
120
Before AfterM
inu
tes
Process Standard Time
30 % Reduction
96
66
0%
2%
4%
6%
8%
10%
12%
Before After
Rework
5%
50 % Reduction
9.6%
PRODUCTIVITY IMPROVEMENT SERVICE Page 61
Invest NI team, and particularly appreciated the industrial background of the Invest NI staff involved. As such, the employees began to trust the process and
cooperate. Indeed, members of the staff have delivered presentations of their lessons learned to other plants within the Group and to Invest NI and a number of
operational staff have volunteered to take on additional roles and responsibilities for health and safety and training. The consultees within Company B
emphasised to the Evaluation Team that this is very much the start of a long journey for the company, but that they now have confidence that there is buy-in
amongst the staff and there should be significant benefits in future.
Impact of the
support –
Business
Outcomes
Company B reports that it has achieved total cost savings of between £100,000 and £200,000 as a result of the productivity improvement activities supported
through the Invest NI PIS. As above, it is the view of Company B that the impact had only begun to be realised towards the end of the period under
consideration and it anticipates that there will be £1m of cost savings over the next 3 years (i.e. £333,333 per annum) as a result of the productivity
improvements implemented along with Invest NI.
In the absence of Invest NI’s support, Company B proposes that it would have achieved between 1% and 20% of the impacts realised to date, and these would
have been realised between 12 and 24 months later.
PRODUCTIVITY IMPROVEMENT SERVICE Page 62
5.11 Summary Conclusions
Based on the feedback from businesses in receipt of support, the following key conclusions can be
drawn with regards to the impact made by the PIS during the period under review:
The Service has stimulated process innovation amongst recipient businesses by enhancing
(amongst other things) their:
Ability to identify the issues that were inhibiting their productivity;
Understanding of the productivity improvement tools and techniques that can be employed to
improve their productivity; and
Ability and confidence to ultimately integrate the productivity tools and techniques within the
business.
Levels of activity (61%) and impact (59%) additionality should be viewed positively (especially
when benchmarked against other programmes/interventions) indicating that the Service has played
a strong role in encouraging business to undertake productivity improvement activities and
subsequently realise benefit from the support;
Market failure, typically in the form of asymmetric information, has played a strong role in
preventing businesses from taking forward similar productivity improvement activities
independent of support;
The Evaluation Team’s analysis suggests that that the displacement factor at the NI level is
12.95%; whilst at the GB level it is 16.38%;
Positively, from a monetary perspective the analysis suggests that the PIS has:
Contributed £19.6m in gross or £10.1m in net additional GVA;
Supported the creation of 90 gross or 46 net additional FTE jobs;
Safeguarded 330 gross or 195 net additional jobs; and
Delivered £5,533 in gross or £2,842 in net additional productivity per FTE.
The feedback from businesses also suggests that the support has assisted them to realise a number
of non-monetary benefits including (but not limited to) increasing competitiveness and
sustainability and embedding a cultural shift towards continuous productivity improvement across
organisations.
The majority of businesses suggests that they would not have been able to get similar support
elsewhere; and
The Service has contributed to providing the NI economy with a number of other wider (including
knowledge transfers and skills development) and regional (including the innovative nature of the
project) benefits.
PRODUCTIVITY IMPROVEMENT SERVICE Page 63
6. ACHIEVEMENT OF OBJECTIVES
6.1 Introduction
Section 6 examines the progress made towards the SMART objectives that were established for the
Service.
6.2 Overview and progress towards PIS targets
During the period under review, the PIT used a Balanced Scorecard approach to managing and
reviewing its performance by setting annual targets and tracking performance against these targets.
The scorecard lists targets in four areas:
Finance;
Customer;
Process; and
Learning & Growth.
During consultation Invest NI indicated that the main target established for the PIS related to the
anticipation that the Service would deliver £10m GVA for the period of the Corporate Plan (i.e. £2.5m
per year)77
. Therefore, on a pro rata basis, it was anticipated that the activity supported through the
Service would deliver c. £6.5m in GVA during the period under review.
However, the Evaluation Team understands that a decision was undertaken to increase the Year 3
(2013/14) target to £3.5m on the basis of the positive outcomes that had been derived during the initial
two years. As such, the revised target for the period under review was c. £7.5m (Table 6.1).
Table 6.1: Revision of PIS monetary targets
Year Initial anticipated impact Revised anticipated impact
2011-12 (7 months) £1,458,333 £1,458,333
2012-13 £2,500,000 £2,500,000
2013-14 £2,500,000 £3,500,000
Total £6,458,333 £7,458,333
During discussions with Invest NI on the progress of the Service towards this target, uncertainty arose
as to whether:
‘GVA’ related to gross value added (in the true economic sense) or the monetary value that had
been provided to businesses in the form of, for example, increased turnover and/or reduced costs
as a result of the Service. Consultation with the PIT and the Evaluation Team’s review of
monitoring information suggests that, at an operational level, the target appears to have been
interpreted in relation to the monetary value that had been provided to businesses;
The figure related to the gross or net additional impact of the Service (i.e. taking deadweight and
displacement into account); and
The annual impact related to activity that had solely been delivered during that year or whether it
included the outcomes from activity delivered in previous years.
Notwithstanding this uncertainty, the Evaluation Team’s analysis indicates that the activity supported
during the period under review has contributed £10.1m in net additional GVA to the NI economy, and
hence the Service has exceeded the target under each of these interpretations.
77
The target was documented within the ‘Finance’ area of the scorecards.
PRODUCTIVITY IMPROVEMENT SERVICE Page 64
Appendix VIII provides a high level overview of the progress that was made towards the internal
Balanced Scorecard targets that were established by the PIT to monitor its effectiveness during the
period under review78
. Whilst outside the remit of this Evaluation, the Evaluation Team’s review of
these targets suggests that:
The PIT took appropriate action to refocus its internal performance targets across the period under
review. Notwithstanding this, the Evaluation Team recommends that that any future Economic
Appraisal focuses upon establishing a more appropriate mix of SMART activity, output and
outcome targets which are more intrinsically focused and linked with the overarching aims and
anticipated outcomes of the Service. The outcomes of this evaluation should be used to inform all
future target setting; and
A number of activity targets (primarily relating to the number of RDS’ being raised, the
development of new Service materials and attendance by business at event/training) were not
achieved during the period under review. However, as noted previously the main outcome targets
that were established for the Service were achieved.
78
All information informing the progress towards these targets was provided by Invest NI.

PRODUCTIVITY IMPROVEMENT SERVICE Page 65
7. BENCHMARKING
7.1 Introduction
As part of the research process, the Evaluation Team has benchmarked the support provided through the Invest NI PIS against similar programmes delivered by
Scottish Enterprise (i.e. the Scottish Manufacturing Advisory Service and Lean Management Thinking) and Enterprise Ireland (i.e. the Company Health Check
and the Lean Business Offer). This section provides a summary of the Invest NI PIS with the benchmark programmes, with a detailed description of each
programme79
attached as Appendix IX.
Table 7.1: Benchmarking Analysis
Category Invest NI Scottish Enterprise (SE) Enterprise Ireland (EI)
Productivity Improvement Service
(PIS)
Lean Management Thinking
(LMT)
Scottish Manufacturing
Advisory Service (SMAS)
Company Health Check (CHC) Lean Business Offer
Established 2009 2000 2006 2008 2008
Support
Available Visit, contact and advice
Diagnostics and action
planning
Awareness, networking and
training
One-to-one mentoring support
Information/ signposting
It should be noted that the
Skills and Strategy Division of
Invest NI offers the Business
Health Check which is
comparable with the CHC.
One-to-many classroom-based
workshops including lean
management theory, time for
one-to-one support and sharing
of best practice.
Enquiry support
Business improvement
manufacturing review
(diagnostic and action
plan)
Manufacturing
improvement project
(one-to-one mentoring
support)
Best practice activities
and visit programme
A CHC measures a company’s
performance on qualitative and
quantitative measures compared
to the competition to identify
priority areas for improvement.
LeanStart: Short-term (up to 7
days) one-to-one lean project
focused on value-adding.
LeanPlus: Medium-term (3-6
months) one-to-one lean
project focused on performance
improvement.
LeanTransform: Long-term
large-scale, extensive and
holistic company
transformation programme
carried out by external
consultancy team.
Eligibility The PIS is available to all Invest NI
clients regardless of size80
and
sector.
All Scottish companies with 20 or
more staff. Whilst manufacturing
companies are not excluded, they
should be referred to the SMAS in the
first instance.
All manufacturing companies
throughout Scotland (both SE
client companies and the wider
business base), as well as both
SMEs and large enterprises81
.
Enterprise Ireland clients
including manufacturing and
eligible internationally traded
services companies.
EI clients/ potential clients who have
been trading for at least 5 years
engaged in manufacturing or eligible
internationally traded services.
LeanStart is aimed at SMEs and
LeanTransform is aimed at large
enterprises.
Participation
Costs/ Grant
Available
Free of charge £1,500 (plus VAT) for SMEs and
£2,000 (plus VAT) for large
enterprises for the programme,
An annual Manufacturing
Review is free. SMAS
practitioners are charged at
Free-of-charge LeanStart: Maximum of 7
days of consultancy support at
79
Along with secondary benchmarks for the BIS Manufacturing Advisory Service (MAS) in England and the Manufacturing Extension Partnership (MEP) in the USA. 80
Albeit there is a particular emphasis on providing support to small and medium size enterprises (SMEs). 81
Albeit more than 80% of Manufacturing Improvement Projects should be completed with SMEs.

PRODUCTIVITY IMPROVEMENT SERVICE Page 66
Table 7.1: Benchmarking Analysis
Category Invest NI Scottish Enterprise (SE) Enterprise Ireland (EI)
Productivity Improvement Service
(PIS)
Lean Management Thinking
(LMT)
Scottish Manufacturing
Advisory Service (SMAS)
Company Health Check (CHC) Lean Business Offer
regardless of how many employees
attend.
£600 p/d for one-to-one support
with up to 50% subsidised for
SMEs. Large enterprises are not
subsidised.
€900 p/d with max of €5,000
(80%) funded by EI.
LeanPlus: Maximum of 50%
of consultancy costs up to
€35,000 (i.e. €70,000 project)
based on up to 20 days at €900
p/d, 20 days at €700 p/d and
any other days at €600 p/d.
LeanTransform: Maximum of
50% of consultancy fees (at
rates as per LeanPlus) and up to
€1,000 per week of employee
training costs. No maximum
level but typically 22 days of
support.
Duration of
one-to-one
support
Typically between 5 and 10 days of
general guidance for the one-to-one
mentoring projects although several
projects have extended beyond 10
days.
6 half-day sessions over a 6 month
period.
8-10 days over a 6 month
period.
One-day of support including a
half-day of one-to-one with the
company.
Staffing
Resource
The PIS is delivered by between 6
and 7 FTEs per year (see Appendix
X). The Invest NI Business Health
Check is delivered by 1 FTE.
1 FTE to manage the LMT
Programme and a framework for 3rd
party consultants to deliver LMT
services.
30 FTEs (22 SMAS
practitioners and 8 admin staff)
and a framework for 3rd
party
contractors (7 FTEs)
2 FTEs to manage the CHC
Programme and undertake the
benchmarking reviews.
2 FTEs within EI to manage/oversee
LeanStart and LeanPlus and 2 FTEs
to manage/ oversee LeanTransform.
EI has a dedicated database of
specialist external consultants who
are responsible for supporting
implementation of Lean projects.
Levels of
activity
Across the Sept 2011 to March 2014
period the following activity
occurred:
341 RDS
224 visits to 211 unique
businesses
Advice provided to 93
businesses
47 diagnostic plans
24 benchmarking events
delivered to 665 employees
from 231 unique businesses
105 training sessions with
1,739 employees from 213
businesses
137 businesses commenced
one-to-one mentoring
Generally two programmes are
facilitated each year with
approximately 4 companies
participating in each.
Estimated annual activity of:
840 enquiries
350 Manufacturing
Reviews
200 Manufacturing
Improvement Projects
40 Best Practice Events
15 in-company benchmarks
(including both quantitative and
qualitative measures) and a
further 150 financial benchmarks
(using quantitative data only) are
undertaken per annum.
640 Lean Projects since 2009
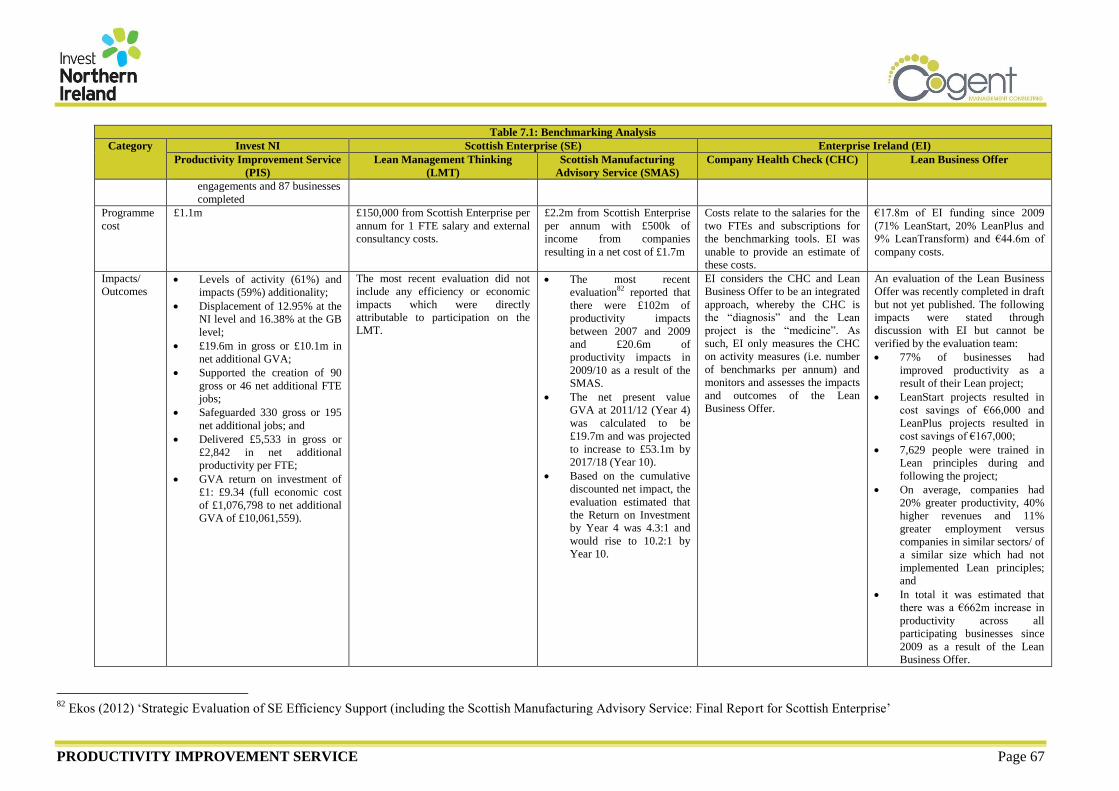
PRODUCTIVITY IMPROVEMENT SERVICE Page 67
Table 7.1: Benchmarking Analysis
Category Invest NI Scottish Enterprise (SE) Enterprise Ireland (EI)
Productivity Improvement Service
(PIS)
Lean Management Thinking
(LMT)
Scottish Manufacturing
Advisory Service (SMAS)
Company Health Check (CHC) Lean Business Offer
engagements and 87 businesses
completed
Programme
cost
£1.1m £150,000 from Scottish Enterprise per
annum for 1 FTE salary and external
consultancy costs.
£2.2m from Scottish Enterprise
per annum with £500k of
income from companies
resulting in a net cost of £1.7m
Costs relate to the salaries for the
two FTEs and subscriptions for
the benchmarking tools. EI was
unable to provide an estimate of
these costs.
€17.8m of EI funding since 2009
(71% LeanStart, 20% LeanPlus and
9% LeanTransform) and €44.6m of
company costs.
Impacts/
Outcomes Levels of activity (61%) and
impacts (59%) additionality;
Displacement of 12.95% at the
NI level and 16.38% at the GB
level;
£19.6m in gross or £10.1m in
net additional GVA;
Supported the creation of 90
gross or 46 net additional FTE
jobs;
Safeguarded 330 gross or 195
net additional jobs; and
Delivered £5,533 in gross or
£2,842 in net additional
productivity per FTE;
GVA return on investment of
£1: £9.34 (full economic cost
of £1,076,798 to net additional
GVA of £10,061,559).
The most recent evaluation did not
include any efficiency or economic
impacts which were directly
attributable to participation on the
LMT.
The most recent
evaluation82
reported that
there were £102m of
productivity impacts
between 2007 and 2009
and £20.6m of
productivity impacts in
2009/10 as a result of the
SMAS.
The net present value
GVA at 2011/12 (Year 4)
was calculated to be
£19.7m and was projected
to increase to £53.1m by
2017/18 (Year 10).
Based on the cumulative
discounted net impact, the
evaluation estimated that
the Return on Investment
by Year 4 was 4.3:1 and
would rise to 10.2:1 by
Year 10.
EI considers the CHC and Lean
Business Offer to be an integrated
approach, whereby the CHC is
the “diagnosis” and the Lean
project is the “medicine”. As
such, EI only measures the CHC
on activity measures (i.e. number
of benchmarks per annum) and
monitors and assesses the impacts
and outcomes of the Lean
Business Offer.
An evaluation of the Lean Business
Offer was recently completed in draft
but not yet published. The following
impacts were stated through
discussion with EI but cannot be
verified by the evaluation team:
77% of businesses had
improved productivity as a
result of their Lean project;
LeanStart projects resulted in
cost savings of €66,000 and
LeanPlus projects resulted in
cost savings of €167,000;
7,629 people were trained in
Lean principles during and
following the project;
On average, companies had
20% greater productivity, 40%
higher revenues and 11%
greater employment versus
companies in similar sectors/ of
a similar size which had not
implemented Lean principles;
and
In total it was estimated that
there was a €662m increase in
productivity across all
participating businesses since
2009 as a result of the Lean
Business Offer.
82
Ekos (2012) ‘Strategic Evaluation of SE Efficiency Support (including the Scottish Manufacturing Advisory Service: Final Report for Scottish Enterprise’
PRODUCTIVITY IMPROVEMENT SERVICE Page 68
Salient points to note from the benchmarking analysis include:
Caution should be applied in drawing comparison between the PIS and the benchmark offerings,
as none of the other regions considered are directly comparable in the nature of their offering. For
instance, non-manufacturing companies are not eligible for the Scottish Enterprise SMAS and can
only access the LMT, whereas all Invest NI client companies are eligible for PIS support.
Otherwise, the types of support offered through the SMAS (i.e. enquiries, diagnostics, one-to-one
supports and best practice events) are quite similar to those offered through the PIS;
Enterprise Ireland has separated the CHC diagnostic offering from the Lean Business mentoring
support offering whereas the PIS and the SMAS offer both diagnostic and project implementation
support. However, it should be noted that Invest NI’s Skills and Strategy Division offers the
Business Health Check which is comparable with the CHC. The Business Health Check is
available in several formats and is managed by 1 FTE. Whilst the PIT does not manage the
Business Health Check Programme, they are directly involved in supporting the service;
The Lean Business Offer includes LeanTransform initiative which supports long-term
transformation projects which are outside the scope of the PIS;
Participant businesses are required to contribute towards the one-to-one support provided through
the SMAS (50% for SMEs and full consultancy cost for large enterprises) and the Lean Business
Offer (20% for LeanStart and 50% for LeanPlus and LeanTransform);
The duration of the PIS one-to-one mentoring support (i.e. 5-10 days83
) is in line with the duration
offered for SMAS projects (typically 8-10 days) and the LeanStart initiative (up to 7 days).
Both benchmark regions use internal staff and 3rd
party specialists to deliver their productivity
improvement offer. In the case of Enterprise Ireland, all one-to-one projects are delivered by
external contractors which allowed Enterprise Ireland to upscale activity. Furthermore, the
database of consultants provides companies with a breadth of specialists to choose from depending
on the nature of the project/ sector involved. A similar model has been used in previous Invest NI
programmes;
Scottish Enterprise employs 30 FTEs associated with the SMAS including 22 FTEs who are
responsible for supporting the implementation of 75% of one-to-one projects. Third party
consultants are used in more specialised projects (equating to a further 7 FTEs). Scottish
Enterprise report that this structure provides sufficient capacity and flexibility to deliver 200
projects per year (as well as enquiries, diagnostics and events) and upskills staff in specialist areas.
Scottish Enterprise provides c. £2.2m towards the SMAS per annum and receives c. £500k in
company income resulting in an annual net cost of c. £1.7m. Enterprise Ireland reported that it
invested €17.8m in the Lean Business Offer between 2009 and 2013; and
The most recent SMAS evaluation84 estimated that by Year 4, the net present value GVA was
£19.7m which was projected to increase to £53.1m by year 10. The evaluation also estimated that
the Return on Investment by Year 4 was 4.3:1 and would rise to 10.2:1 by Year 10. However,
these figures should be considered with caution as the impacts which were monitored and
measured by SMAS changed during the period under review and the low level of calculated
additionality.
83
Albeit this duration is for general guidance and several projects have extended beyond 10 days. 84
Ekos (2012) ‘Strategic Evaluation of SE Efficiency Support (including the Scottish Manufacturing Advisory Service:
Final Report for Scottish Enterprise’

PRODUCTIVITY IMPROVEMENT SERVICE Page 69
7.2 Summary Conclusions
In summary, the Invest NI PIS provides a similar offer (in terms of content, levels of support and
duration of projects) as the SMAS in Scotland and the LeanStart initiative in the Republic of Ireland
but provides support to a wider range of businesses (including those of any size and any sector).
Based on the levels of activity achieved by the benchmark programmes, there appears to be potential
for Invest NI to consider charging companies a contribution towards one-to-one mentoring support to
reduce the overall costs to Invest NI, whilst maintaining free events, training and diagnostics. Invest
NI could potentially consider increasing employee numbers and/or appointing third-party consultants
in order to increase the scale of activity possible under the PIS, in line with the benchmark regions.
Whilst it is the Evaluation Team’s view that it is difficult to draw direct comparisons with the
benchmarks in terms of impacts and outcomes, it is clear that productivity improvement support
initiatives are effective in achieving cost savings and enhancing the competitiveness of participating
businesses and should be continued to be supported in the future.
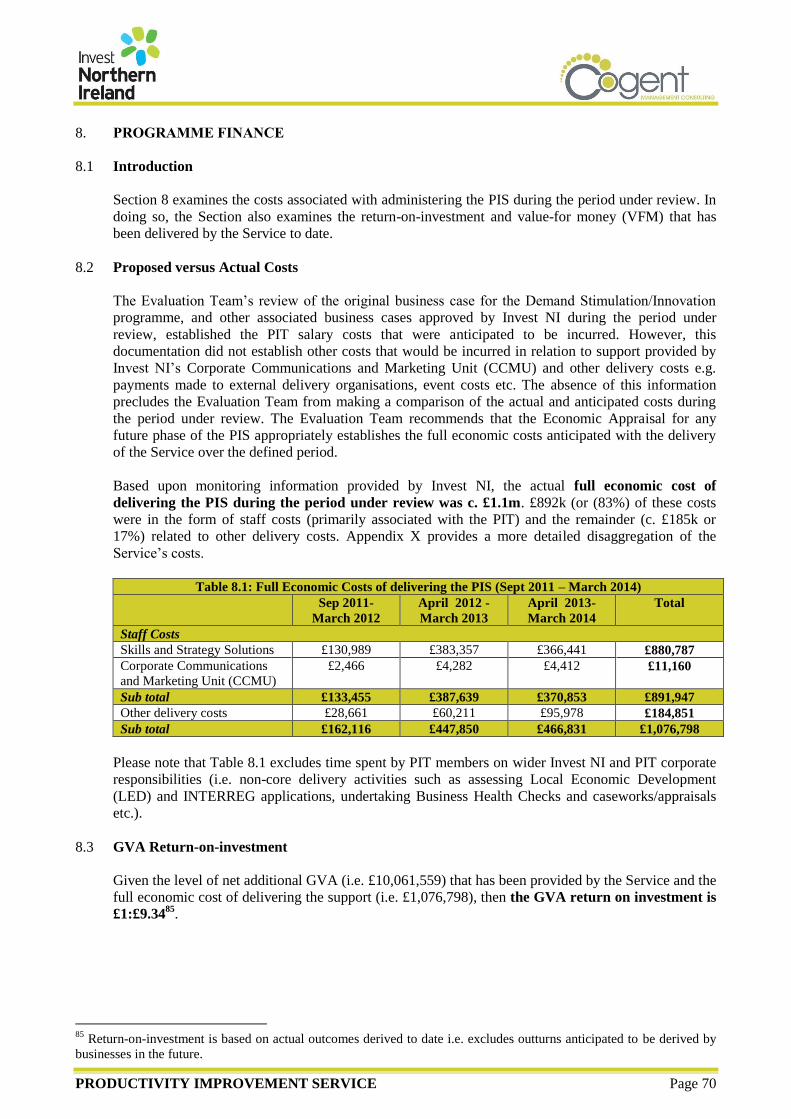
PRODUCTIVITY IMPROVEMENT SERVICE Page 70
8. PROGRAMME FINANCE
8.1 Introduction
Section 8 examines the costs associated with administering the PIS during the period under review. In
doing so, the Section also examines the return-on-investment and value-for money (VFM) that has
been delivered by the Service to date.
8.2 Proposed versus Actual Costs
The Evaluation Team’s review of the original business case for the Demand Stimulation/Innovation
programme, and other associated business cases approved by Invest NI during the period under
review, established the PIT salary costs that were anticipated to be incurred. However, this
documentation did not establish other costs that would be incurred in relation to support provided by
Invest NI’s Corporate Communications and Marketing Unit (CCMU) and other delivery costs e.g.
payments made to external delivery organisations, event costs etc. The absence of this information
precludes the Evaluation Team from making a comparison of the actual and anticipated costs during
the period under review. The Evaluation Team recommends that the Economic Appraisal for any
future phase of the PIS appropriately establishes the full economic costs anticipated with the delivery
of the Service over the defined period.
Based upon monitoring information provided by Invest NI, the actual full economic cost of
delivering the PIS during the period under review was c. £1.1m. £892k (or (83%) of these costs
were in the form of staff costs (primarily associated with the PIT) and the remainder (c. £185k or
17%) related to other delivery costs. Appendix X provides a more detailed disaggregation of the
Service’s costs.
Table 8.1: Full Economic Costs of delivering the PIS (Sept 2011 – March 2014)
Sep 2011-
March 2012
April 2012 -
March 2013
April 2013-
March 2014
Total
Staff Costs
Skills and Strategy Solutions £130,989 £383,357 £366,441 £880,787
Corporate Communications
and Marketing Unit (CCMU)
£2,466 £4,282 £4,412 £11,160
Sub total £133,455 £387,639 £370,853 £891,947 Other delivery costs £28,661 £60,211 £95,978 £184,851
Sub total £162,116 £447,850 £466,831 £1,076,798
Please note that Table 8.1 excludes time spent by PIT members on wider Invest NI and PIT corporate
responsibilities (i.e. non-core delivery activities such as assessing Local Economic Development
(LED) and INTERREG applications, undertaking Business Health Checks and caseworks/appraisals
etc.).
8.3 GVA Return-on-investment
Given the level of net additional GVA (i.e. £10,061,559) that has been provided by the Service and the
full economic cost of delivering the support (i.e. £1,076,798), then the GVA return on investment is
£1:£9.3485
.
85
Return-on-investment is based on actual outcomes derived to date i.e. excludes outturns anticipated to be derived by
businesses in the future.

PRODUCTIVITY IMPROVEMENT SERVICE Page 71
It is the Appraisal Team’s view that this return-on-investment level should be viewed positively on the
basis that:
The analysis is based upon the monetary benefits that were derived from businesses that had
commenced and completed a one-to-one mentoring engagement (N=87) during the period under
review. However, the Evaluation Team notes that:
A number of businesses had only recently completed their one-to-one engagements and hence
sufficient time had not passed for them to fully embed the productivity improvement changes
and/or realise monetary impacts;
A number of businesses that had only attended a benchmarking/best practice event and/or
training indicated that they had derived monetary benefits from the support they received.
However, for prudence, these businesses were excluded from the grossing-up analysis on the
basis that they were not able to quantify the extent of these impacts on their businesses;
A further 50 businesses that commenced one-to-one mentoring support during the period
under review were continuing to receive support at the Evaluation and hence were excluded
from the analysis.
As such, the full monetary impact of the support that was delivered by Service during the period
under review may be higher and hence provide a higher return-on investment.
Anecdotal feedback provided during the benchmarking research suggested that Scottish
Enterprise’s SMAS, which delivers similar support to Scottish businesses, presently achieves a
return-on-investment of c. £1:£8 in net additional GVA86
; and
We also note that business anticipate receiving substantial monetary benefits in the next three years as
a result of the support that was provided through the PIS.
8.4 Cost Effectiveness
Other indicators of cost effectiveness include:
Cost per business supported (N=459) is £2,346.
8.5 Value-for-Money
Based on the preceding analysis, it is the Evaluation Team’s view that the PIS delivered value-for-
money during the period under review. More specifically, this view is based on each of the
following inter-related factors.
Table 8.2: Summary of Value for Money
VFM Indicator Conclusion
Strategic Fit In-line with the strategic imperative of NI Government, the Evaluation Team’s analysis
indicates that the PIS has positively contributed to supporting NI businesses to
Address barriers to business growth;
Increase innovation in its widest sense including encouraging businesses to transform
creative thinking into new and improved processes (i.e. engage in process innovation);
Embed a culture of change in approach and behaviours within NI businesses and their
leaders; and
Increase business’ understanding of innovation and facilitate the exchange and
exploitation of knowledge by supporting businesses with high growth and export
potential to apply the use of Productivity Improvement Tools and Techniques in order
86
We do however note that Scottish Enterprise adopts a different methodology for calculating the level of net additional
GVA and associated return-on-investment.

PRODUCTIVITY IMPROVEMENT SERVICE Page 72
Table 8.2: Summary of Value for Money
VFM Indicator Conclusion
to leverage competitive advantage from the innovation process.
In doing so, the Evaluation Team concludes that the Service has appropriately “stimulated
action and interventions to increase productivity and competitiveness, and enable local
companies to grasp opportunities.”
Need & Market
Failure
The research suggests that there was a clearly defined need for Invest NI to provide
support to NI businesses to engage in process innovation activities to address their
operational inefficiencies and stimulate their productivity and growth. Specifically:
At the time of approval, there was a need for Government to provide support to
encourage greater levels of innovation in order to facilitate business growth and
reduce the productivity gap with other UK regions;
A number of market failure (including asymmetric information and co-ordination
failures) and non-market failure factors (e.g. constraints relating to capacity and
throughput, businesses utilising inefficient and ineffective equipment etc.) were
preventing businesses from implementing measures to address operating inefficiencies
and improve productivity independent of receiving support;
Based upon the research findings the Evaluation Team concludes that there is sufficient
evidence to indicate that there is a continued need for Invest NI to provide support to NI
businesses through the PIS.
Additionality Levels of activity (61%) and impact (59%) additionality should be viewed positively
(especially when benchmarked against other programmes/interventions) indicating that the
Service has played a strong role in encouraging business to undertake productivity
improvement activities and subsequently realise benefit from the support.
Duplication and
complementarity
The Evaluation Team concludes that the risk of the PIS duplicating other support was
minimal. This is supported by the feedback from recipients of support; the majority of
whom suggested that, in the absence of the PIS, they would not have been able to get
similar support elsewhere.
Economy
Efficiency and
Effectiveness
Indicator Evaluation Team’s Commentary
Economy measures are
concerned with showing
that the appropriate inputs
(i.e. the resources used in
carrying out the project)
have been obtained at least
cost
As noted in Section 1, internal business cases identified
the majority of project inputs that perceived to be
required at the time of approval. Corporate recruitment
processes were utilised to identify and subsequently
recruit the appropriate levels of resources that were
perceived to be required at that time.
As such, it is the Evaluation Team’s view that Invest NI
made appropriate efforts to ensure that project inputs
were obtained at least cost to the NI economy.
The preceding analysis clearly indicates that the support
that was delivered by the PIT was of a high standard and
has supported businesses to realise significant monetary
and non-monetary benefits.
Efficiency relates to
measures that are
concerned with achieving
the maximum output from
a given set of inputs
As noted previously, the PIT established an engagement
process model which supported it to both identify the
needs of businesses and subsequently deliver tailored
solutions to address these needs.
Based upon the significant number of businesses
supported (albeit at differing levels of intensity), the high
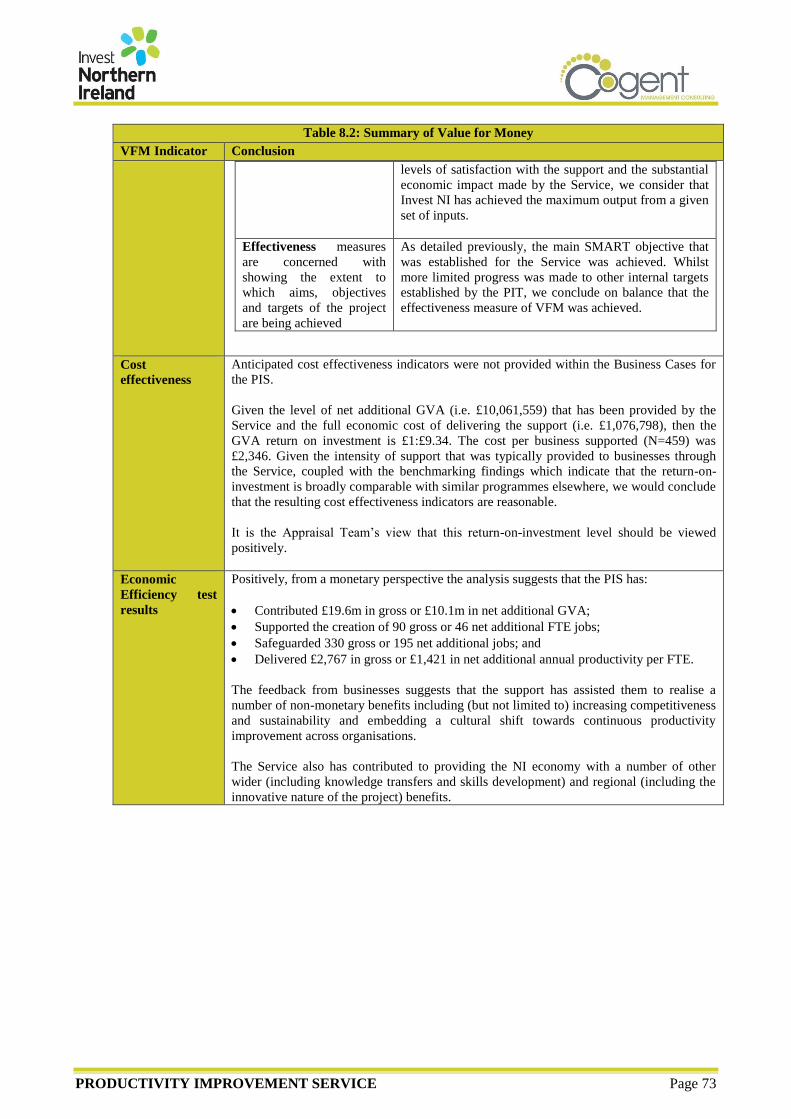
PRODUCTIVITY IMPROVEMENT SERVICE Page 73
Table 8.2: Summary of Value for Money
VFM Indicator Conclusion
levels of satisfaction with the support and the substantial
economic impact made by the Service, we consider that
Invest NI has achieved the maximum output from a given
set of inputs.
Effectiveness measures
are concerned with
showing the extent to
which aims, objectives
and targets of the project
are being achieved
As detailed previously, the main SMART objective that
was established for the Service was achieved. Whilst
more limited progress was made to other internal targets
established by the PIT, we conclude on balance that the
effectiveness measure of VFM was achieved.
Cost
effectiveness
Anticipated cost effectiveness indicators were not provided within the Business Cases for
the PIS.
Given the level of net additional GVA (i.e. £10,061,559) that has been provided by the
Service and the full economic cost of delivering the support (i.e. £1,076,798), then the
GVA return on investment is £1:£9.34. The cost per business supported (N=459) was
£2,346. Given the intensity of support that was typically provided to businesses through
the Service, coupled with the benchmarking findings which indicate that the return-on-
investment is broadly comparable with similar programmes elsewhere, we would conclude
that the resulting cost effectiveness indicators are reasonable.
It is the Appraisal Team’s view that this return-on-investment level should be viewed
positively.
Economic
Efficiency test
results
Positively, from a monetary perspective the analysis suggests that the PIS has:
Contributed £19.6m in gross or £10.1m in net additional GVA;
Supported the creation of 90 gross or 46 net additional FTE jobs;
Safeguarded 330 gross or 195 net additional jobs; and
Delivered £2,767 in gross or £1,421 in net additional annual productivity per FTE.
The feedback from businesses suggests that the support has assisted them to realise a
number of non-monetary benefits including (but not limited to) increasing competitiveness
and sustainability and embedding a cultural shift towards continuous productivity
improvement across organisations.
The Service also has contributed to providing the NI economy with a number of other
wider (including knowledge transfers and skills development) and regional (including the
innovative nature of the project) benefits.
PRODUCTIVITY IMPROVEMENT SERVICE Page 74
9. CONCLUSIONS & RECOMMENDATIONS
9.1 Introduction
The section presents the Evaluation Team’s key conclusions and recommendations arising from the
evaluation process.
9.2 Conclusions
9.2.1 Strategic Context and Rationale (TOR Points 32b-32d)
At the time of approval, there was a need for Government to provide support to encourage greater
levels of innovation in order to facilitate business growth and reduce the productivity gap with other
UK regions. Research suggested that a number of market failures (including asymmetric information
and co-ordination failures) and non-market failure factors (e.g. constraints relating to capacity and
throughput, businesses utilising inefficient and ineffective equipment etc.) were preventing businesses
from implementing measures to address operational inefficiencies and improve productivity
independent of receiving support.
Reflecting this market need, the NI Government (including DETI and Invest NI) placed a strong
emphasis on the need for support to be provided to encourage businesses to:
Address barriers to business growth;
Increase innovation in its widest sense including encouraging businesses to transform creative
thinking into new and improved processes (i.e. engage in process innovation);
Embed a culture of change in approach and behaviours within NI businesses and their leaders; and
Increase business’ understanding of innovation and facilitate the exchange and exploitation of
knowledge by supporting businesses with high growth and export potential to apply the use of
Productivity Improvement Tools and Techniques in order to leverage competitive advantage from
the innovation process
It is the Evaluation Team’s view that there was, and continues to be, clear alignment between the aims
and objectives of the PIS and the strategic imperatives of the NI Government (including with DETI
and Invest NI’s Corporate Plans).
Indeed, based upon the outcomes derived by recipients of support, the Evaluation team concludes that
the PIS made a positive contribution to realising these strategic imperatives.
9.2.2 Operation and Delivery (TOR Points 32e-32h)
The PIS is based around the delivery of tailored one-to-one and/or one-to-many support to assist
businesses to introduce ‘Lean Thinking’ and effective supply-chain management approaches in order
to enhance their operational efficiency and productivity. The Service was managed and delivered
internally within Invest NI (by the PIT) who drew upon external expertise, as and when required.
A total of 459 unique businesses received support through the PIS during the period under review. The
intensity of the support that was ultimately delivered was tailored to business’ specific needs. For
example, the analysis suggests that:

PRODUCTIVITY IMPROVEMENT SERVICE Page 75
The PIT visited and provided advice to 211 NI businesses on 224 separate occasions;
47 businesses received a productivity diagnostic plan;
There were 665 employee attendances from 231 unique businesses at the benchmarking / best practice
networking events;
There were 1,739 employee attendances from 213 unique businesses at 105 training sessions during the
period under review; and
137 businesses commenced one-to-one mentoring engagement during the period, the majority of which
sought to assist them to implement lean thinking and principles within their business. Just under two-thirds
of businesses (64% - N=138) have completed their one-to-one mentoring engagements with the PIT, with
the remainder of businesses (36% - N=138) continuing to receive support within their respective areas.
It is Invest NI’s view, and shared by the Evaluation Team, that a level of latent demand presently
exists for PIS support. This assertion is based on the fact that:
Despite the broadly equal split in Invest NI’s client base between manufacturing and service-based
businesses, monitoring information provided by Invest NI indicates that circa four-fifths of the
RDS’ raised were for businesses from the manufacturing sector. It is Invest NI’s view, and shared
by the Evaluation Team based on its discussions with a number of CEs and businesses that did not
engage with Service, that this is likely to reflect the fact that there continues to be a misconception
(both amongst a number of CEs and within the NI business base) that productivity improvement
tools and techniques are more overtly focused on supporting manufacturing rather than service-
based businesses.
It is the PIT’s view that, while progress has been made in working with businesses from a more
diverse range of sectors, further work is required to support businesses such as those operating in
the ICT, financial/transactional services, and legal sectors. In addition to the misconception that
may exist amongst these businesses with regards to the applicability of lean concepts to non-
manufacturing sectors, consultation with Invest NI indicates that there may be additional issues
relating to the perceived credibility and technical ability of the PIT to provide support to these
sectors;
Latent demand is likely to exist within Invest NI’s manufacturing client base which the PIT has
thus far not been able to address (e.g. due to the availability of resource, a perceived view amongst
some businesses that they do not require support and/or do not feel that the Service can provide
the support that they require). The Evaluation Team’s consultation with a number of
manufacturing businesses, that had not received support through the Service, provides weight to
this view with a number of businesses expressing strong interest in receiving support from the
Service moving forward;
Whilst noting that considerable work has been undertaken to provide productivity support in the
area of supply-chain management, it is Invest NI’s view that additional work could be undertaken
in this area. It was noted that the Wrightbus supply-chain intervention model could potentially be
rolled out to a number of strategically important NI businesses;
Consultation with the PIT indicates that the majority of effort has been placed on the delivery of
support to businesses facing operational instability or stability. However, it is Invest NI’s view
that additional work is required to support businesses operating at the managed improvement stage
which are seeking to implement strategic change management practices and more formally embed
a culture of continuous improvement; and
Moving forward it is the PIT’s view that additional work should be undertaken to address the
needs of high growth businesses.
It will be essential that a holistic Corporate-wide strategy is developed to address this demand
(assuming that appropriate levels of resourcing are made available). We have identified a number of
recommendations for Invest NI’s consideration in this regard.

PRODUCTIVITY IMPROVEMENT SERVICE Page 76
Based upon the feedback from businesses, we consider that the Service was, in general, managed and
delivered in a proactive and efficient manner by Invest NI, with the Service’s content, structure and
delivery model being appropriately developed on reflection of evolving client need. This has, in the
Evaluation Team’s view, contributed to support being channelled in an effective and efficient manner
to address the needs of NI businesses.
The feedback from businesses in receipt of PIS support during the period under review also suggests
that (amongst other things):
The content, structure and duration of support is, on the whole, appropriate to meet the needs of
businesses;
The PIT, and any supporting external expertise, transferred relevant knowledge and advice in a
timely manner; and
Recipients of one-to-one mentoring support welcomed the tailored nature of support that was
provided and the range of practical productivity improvement tools that were adopted by the PIT.
Reflecting the quality of the support received and subsequent impact that it made on recipients of
support, the vast majority of businesses suggested that the support was effective in meeting their needs
and this was reflected in (amongst other things) the high proportion of businesses that had taken
forward the process innovation activities based on the advice provided by the PIT.
Given the levels of demand for the PIS, business’ high levels of satisfaction with the support and the
positive contribution of the Service to the NI economy, the Evaluation Team would suggest that Invest
NI’s overall approach to risk management was robust and proportionate.
Based upon monitoring information provided by Invest NI, the actual full economic cost of delivering
the PIS during the period under review was c. £1.1m. £892k (or (83%) of these costs were in the form
of staff costs (primarily associated with the PIT) and the remainder (c. £185k or 17%) related to other
delivery costs.
9.2.3 Performance and Impact (TOR Points 32i-32m)
Based on the feedback from businesses in receipt of support, the following key conclusions can be
drawn with regards to the monetary and non-monetary economic impact made by the PIS during the
period under review:
The Service has stimulated process innovation amongst recipient businesses by enhancing
(amongst other things) their:
Ability to identify the issues that were inhibiting their productivity;
Understanding of the productivity improvement tools and techniques that can be employed to
improve their productivity; and
Ability and confidence to ultimately integrate the productivity tools and techniques within the
business.
Levels of activity (61%) and impact (59%) additionality should be viewed positively (especially
when benchmarked against other programmes/interventions) indicating that the Service has played
a strong role in encouraging business to undertake productivity improvement activities and
subsequently realise benefit from the support;
Market failure, typically in the form of asymmetric information, has played a strong role in
preventing businesses from taking forward similar productivity improvement activities
independent of support;
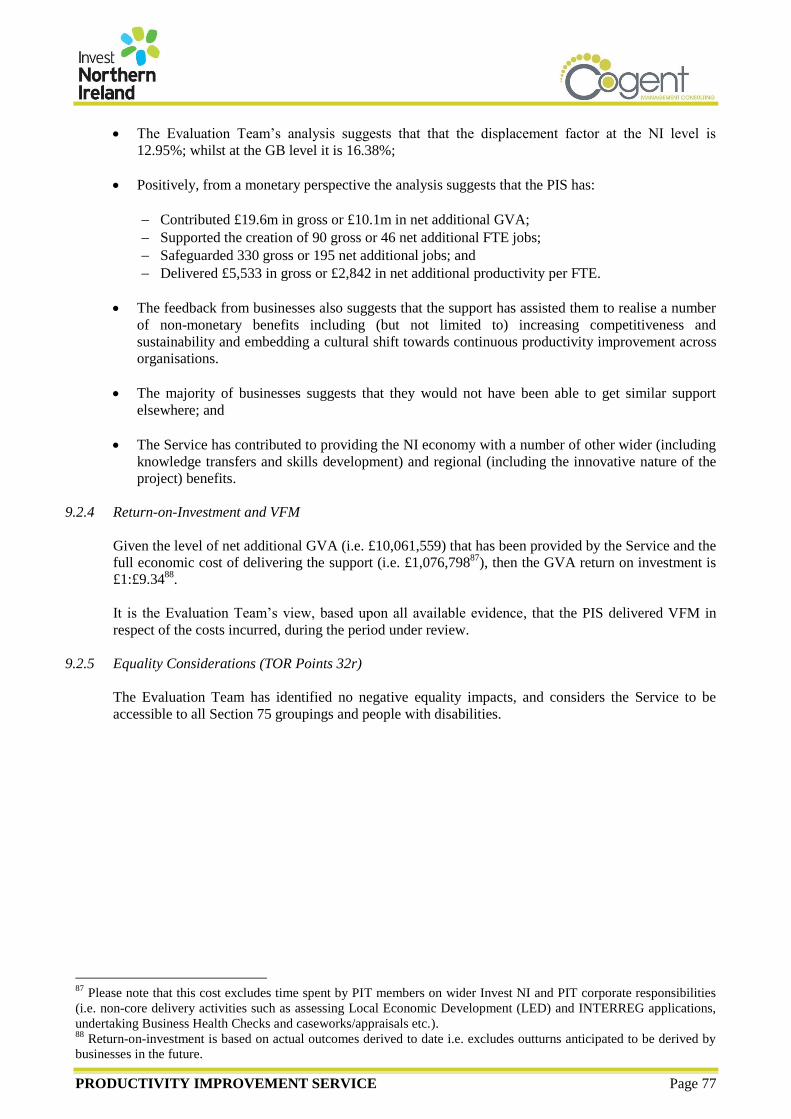
PRODUCTIVITY IMPROVEMENT SERVICE Page 77
The Evaluation Team’s analysis suggests that that the displacement factor at the NI level is
12.95%; whilst at the GB level it is 16.38%;
Positively, from a monetary perspective the analysis suggests that the PIS has:
Contributed £19.6m in gross or £10.1m in net additional GVA;
Supported the creation of 90 gross or 46 net additional FTE jobs;
Safeguarded 330 gross or 195 net additional jobs; and
Delivered £5,533 in gross or £2,842 in net additional productivity per FTE.
The feedback from businesses also suggests that the support has assisted them to realise a number
of non-monetary benefits including (but not limited to) increasing competitiveness and
sustainability and embedding a cultural shift towards continuous productivity improvement across
organisations.
The majority of businesses suggests that they would not have been able to get similar support
elsewhere; and
The Service has contributed to providing the NI economy with a number of other wider (including
knowledge transfers and skills development) and regional (including the innovative nature of the
project) benefits.
9.2.4 Return-on-Investment and VFM
Given the level of net additional GVA (i.e. £10,061,559) that has been provided by the Service and the
full economic cost of delivering the support (i.e. £1,076,79887
), then the GVA return on investment is
£1:£9.3488
.
It is the Evaluation Team’s view, based upon all available evidence, that the PIS delivered VFM in
respect of the costs incurred, during the period under review.
9.2.5 Equality Considerations (TOR Points 32r)
The Evaluation Team has identified no negative equality impacts, and considers the Service to be
accessible to all Section 75 groupings and people with disabilities.
87
Please note that this cost excludes time spent by PIT members on wider Invest NI and PIT corporate responsibilities
(i.e. non-core delivery activities such as assessing Local Economic Development (LED) and INTERREG applications,
undertaking Business Health Checks and caseworks/appraisals etc.). 88
Return-on-investment is based on actual outcomes derived to date i.e. excludes outturns anticipated to be derived by
businesses in the future.
PRODUCTIVITY IMPROVEMENT SERVICE Page 78
9.4 Recommendations
1. Given the reported positive impacts that the PIS has had on businesses and the wider NI economy,
and evidence of continued need for support, Invest NI should continue to provide support through
its PIS. In doing so all appropriate approvals should be sought in a timely manner to ensure the
continuity in the provision of support to NI’s business base.
2. Invest NI should develop a holistic strategy to addressing the latent demand that is likely to exist
for the Service. It is the Evaluation Team’s view that such a Strategy should include (at a
minimum) consideration of:
a) Undertaking additional internal and external awareness raising activities. These activities
should place focus on clearly articulating (amongst other things) the:
Nature of activity that the Service seeks to support (and importantly the activity that it will
not support);
Nature and levels of support that is available to businesses; and
The wider range of sectors that productivity improvement tools and techniques can
potentially be embedded.
b) Utilising external expertise to support the PIT in building credibility and sector-specific
knowledge/expertise in those non-manufacturing sectors that the Service has had more limited
impact e.g. ICT, transactional services etc. This may involve the external expertise leading
initial business engagements with the PIT providing a supporting role until such times when it
has built a suitable level of credibility and sector-specific knowledge to facilitate these
engagements alone.
c) Linked to Recommendation 2b, by way of fostering demand and buy-in for the Service within
these sectors, Invest NI should seek leverage from its considerable industry linkages e.g. with
ICT businesses through the various collaborative networks that have been established as part
of the Collaborative Network Programme (CNP) and Momentum (the NI ICT Federation).
Invest NI should ensure that suitable marketing/promotional materials (e.g. case studies) are
created from these engagements and distributed to other businesses operating within these
sectors
d) Providing additional resources e.g. through an expansion in the number of PIAs and/or the
wider use of external expertise to support the PIT (as and when required);
e) Reviewing the appropriateness of the range of interventions that are available to support
businesses to implement longer-term strategic cultural and change management practices and
more formally embed a culture of continuous improvement; and
f) How best to integrate the wider range of Invest NI supports/interventions to address
businesses’ productivity improvement needs. Consideration should also be given to including
a formal meeting between the PIT, the business recipient and their CE to identify any further
support required by the business.
3. In line with NIGEAE guidance, Invest NI should ensure that appropriate consideration is given to
identifying the full-economic costs of delivering any future phase of the Service. The Appraisal
should also focus upon establishing a more appropriate mix of SMART activity, output and
outcome targets which are more intrinsically focused and linked with the overarching aims and
anticipated outcomes of the Service. The outcomes of this evaluation should be used to inform all
future target setting.
PRODUCTIVITY IMPROVEMENT SERVICE Page 79
4. Invest NI should undertake a review of its procedures for monitoring the activity delivered by
Service. Ultimately, monitoring information should be collated and retained on a central database
that clearly identifies (at an individual business level) the:
Activity that was delivered (including who the support was delivered to, when it was
delivered, the number of one-to-one mentoring projects completed and the number of days
support provided to each business); and
The impacts and outcomes that were achieved. This will require monitoring to be completed
on a consistent basis and the nature of impact/outcome metrics to be clearly defined.
All information monitored should be, at a minimum, intrinsically linked to the SMART objectives
that are established for the Service.
5. Linked to Recommendation 4, and by way of assisting post programme evaluation, consideration
should be given to establishing (where possible) quantified baselines in relation to key operational
impact (e.g. levels of output cycle times, changeover times, delivery performance) and business
outcome (e.g. turnover, costs) metrics.
6. Whilst the Evaluation Team is not aware of Invest NI’s corporate policies on the storage of
corporate information or its practices in terms of storing information, we recommend that all
Service-related information is saved and filed appropriately in a central repository on Invest NI’s
server. This should include all pertinent programme information including Economic Appraisals
(where completed), casework papers, approval documentation and all programme monitoring
information.
7. Consideration should be given to businesses being required to make a financial contribution to the
receipt of one-to-one mentoring support. The benefits of such as system should be carefully
weighed up against the potential impact on levels of demand and the costs associated with
administering the system.
8. Consideration should be given to establishing a networking forum whereby businesses in receipt
of support can share good practice.