nepal macroeconomic update, august 2015
DESCRIPTION
Nepal Macroeconomic Update, August 2015, Vol.3, No.2TRANSCRIPT

2015-09-03 1
Nepal Macroeconomic Update August 2015, Vol.3, No.2
Chandan Sapkota
Asian Development Bank
Nepal Resident Mission
Press briefing at Nepal Resident Mission, 03 September 2015
2015-09-03 2
The views expressed in this document are those of the author and do not necessarily reflect the views and policies of the Asian Development Bank, or its Board of Governors, or the governments they represent.
2015-09-03 3
Presentation Outline
1. Macroeconomic overview
2. Performance in FY2015
Real sector
Fiscal sector
Monetary sector
External sector
3. FY2016 growth outlook
4. FY2016 inflation outlook
5. Fiscal sustainability and reconstruction

• The April 25 Gorkha earthquake and subsequent aftershocks affected
GDP growth & per capita income
Absolute poverty level
Progress on achieving some of the MDGs
Expenditure performance
Revenue mobilization
Financial sector
Migration & remittance inflows
Exports
Imports
Balance of payments
2015-09-03 4
Macroeconomic overview

2015-09-03 5
Real Sector

2015-09-03 6
GDP growth slowed down
4.3
3.8
4.6
3.8
5.1
3.0
4.6
0
1
2
3
4
5
6
FY2010 FY2011 FY2012 FY2013 FY2014R Post-quake Pre-quake
FY2015P
GDP growth (basic prices)
Agriculture Manufacturing Construction Other industry
Wholesale & retail trade Real estate & renting Other services GDP growth (basic prices)
• Total gross value added loss of $371 million in FY2015
2015-09-03 7
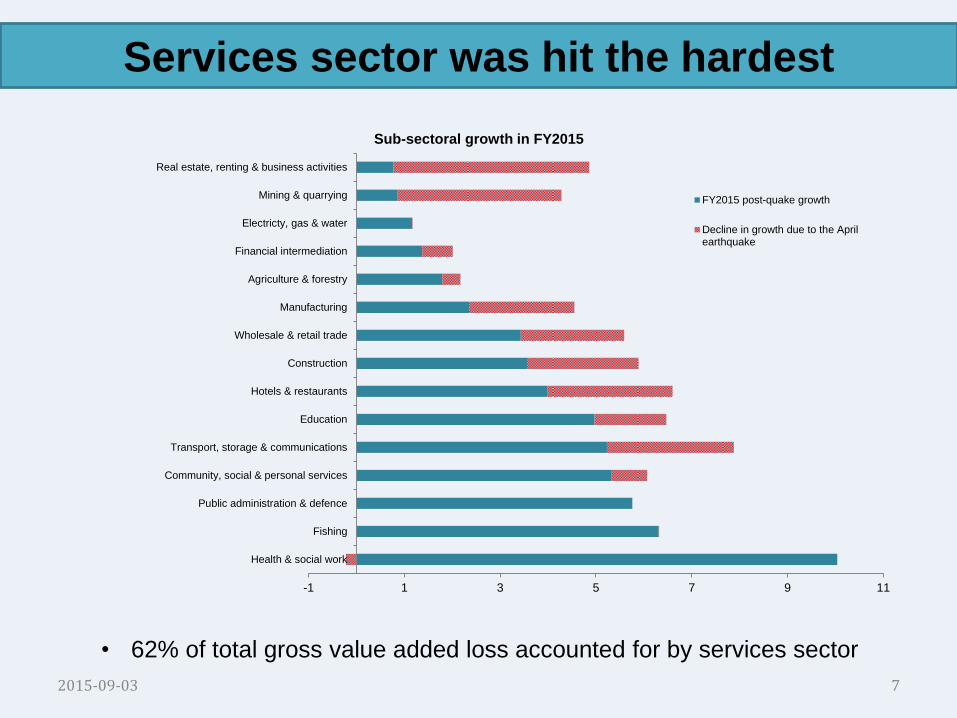
Services sector was hit the hardest
• 62% of total gross value added loss accounted for by services sector
-1 1 3 5 7 9 11
Health & social work
Fishing
Public administration & defence
Community, social & personal services
Transport, storage & communications
Education
Hotels & restaurants
Construction
Wholesale & retail trade
Manufacturing
Agriculture & forestry
Financial intermediation
Electricty, gas & water
Mining & quarrying
Real estate, renting & business activities
Sub-sectoral growth in FY2015
FY2015 post-quake growth
Decline in growth due to the Aprilearthquake

2015-09-03 8
Domestic investment commitment went down
Commitment (% of GDP): • FY2015: 6.3% of GDP
• FY2014: 14.9% of GDP
0
10
20
30
40
50
60
70
80
FY2010 FY2011 FY2012 FY2013 FY2014 FY2015
FDI commitment & actual inflows (NRS billion)
Energy Service
Manufacturing Tourism
Agriculture Mineral
Construction Total FDI commitment
Actual FDI inflows
27 39
90 84
120
289
133
0
50
100
150
200
250
300
350
FY2009 FY2010 FY2011 FY2012 FY2013 FY2014 FY2015
Domestic Investment commitment (NRs billion)
Energy Manufacturing Service
Tourism Agriculture Mineral
Construction Total
• Commitment in FY2015: 3.2% of GDP
• Actual inflows in FY2015: 0.21 % of GDP

2015-09-03 9
Fiscal Sector

2015-09-03 10
Public expenditure performance remained sluggish
• Actual capital spending was about 70% of planned capital spending
0
20
40
60
80
100
120 Expenditure growth
Recurrent Capital Total expenditure
71.8 71.6 70.8
82.6
78.4
69.9
0
20
40
60
80
100
120
FY2009 FY2010 FY2012 FY2013 FY2014 FY2015R
Absorption capacity
Recurrent (% of allocation) Capex (% of allocation)
2015-09-03 11
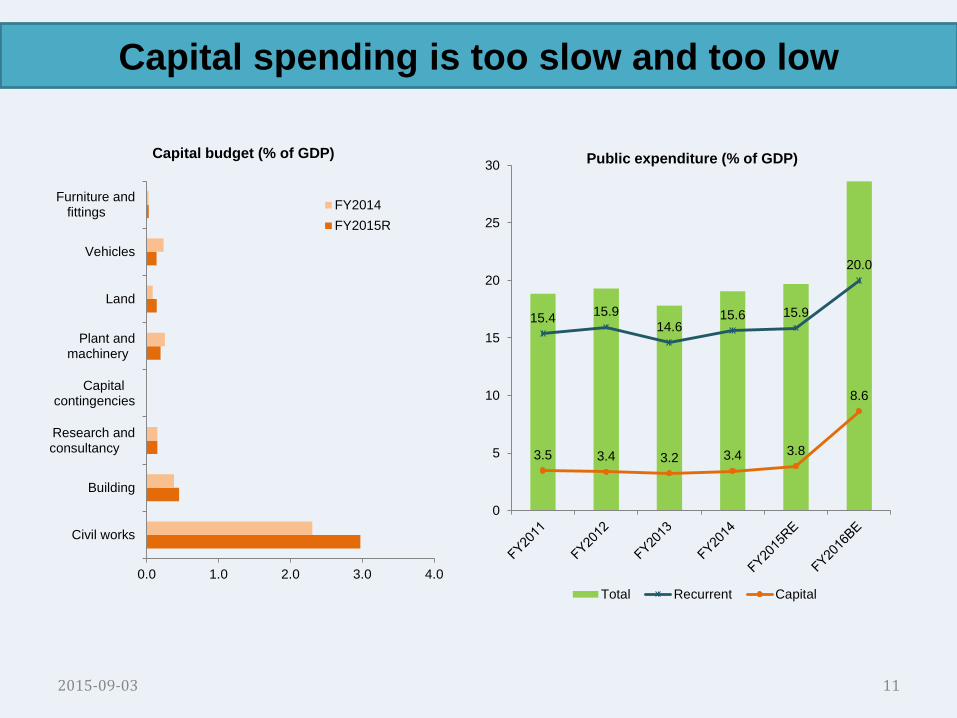
Capital spending is too slow and too low
0.0 1.0 2.0 3.0 4.0
Civil works
Building
Research andconsultancy
Capitalcontingencies
Plant andmachinery
Land
Vehicles
Furniture andfittings
Capital budget (% of GDP)
FY2014
FY2015R
15.4 15.9
14.6 15.6 15.9
20.0
3.5 3.4 3.2 3.4 3.8
8.6
0
5
10
15
20
25
30Public expenditure (% of GDP)
Total Recurrent Capital
2015-09-03 12
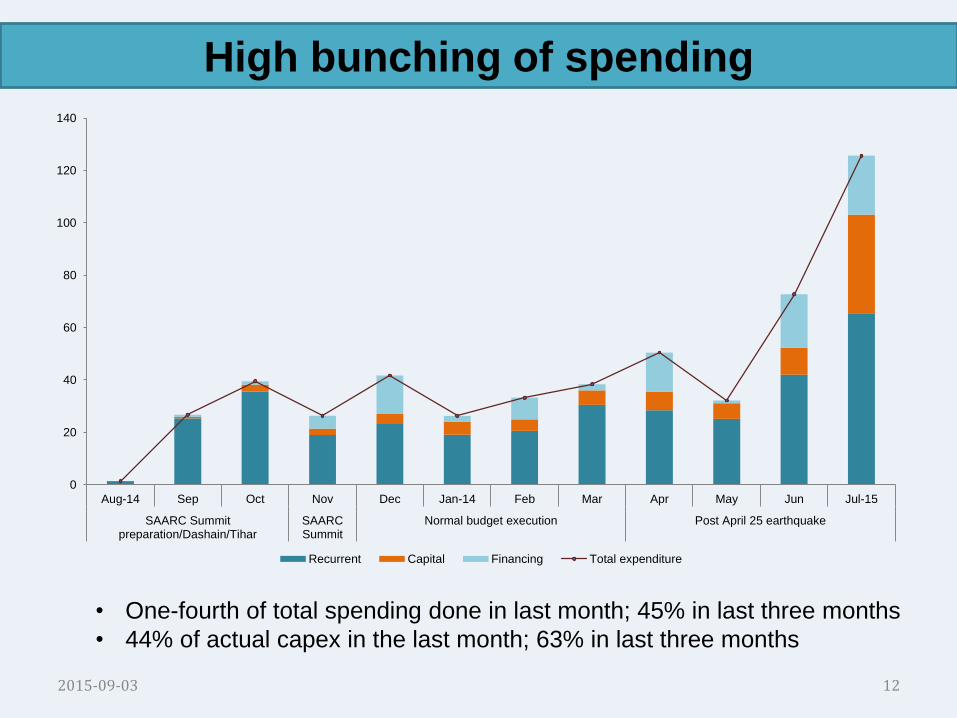
High bunching of spending
• One-fourth of total spending done in last month; 45% in last three months
• 44% of actual capex in the last month; 63% in last three months
0
20
40
60
80
100
120
140
Aug-14 Sep Oct Nov Dec Jan-14 Feb Mar Apr May Jun Jul-15
SAARC Summitpreparation/Dashain/Tihar
SAARCSummit
Normal budget execution Post April 25 earthquake
Recurrent Capital Financing Total expenditure
2015-09-03 13
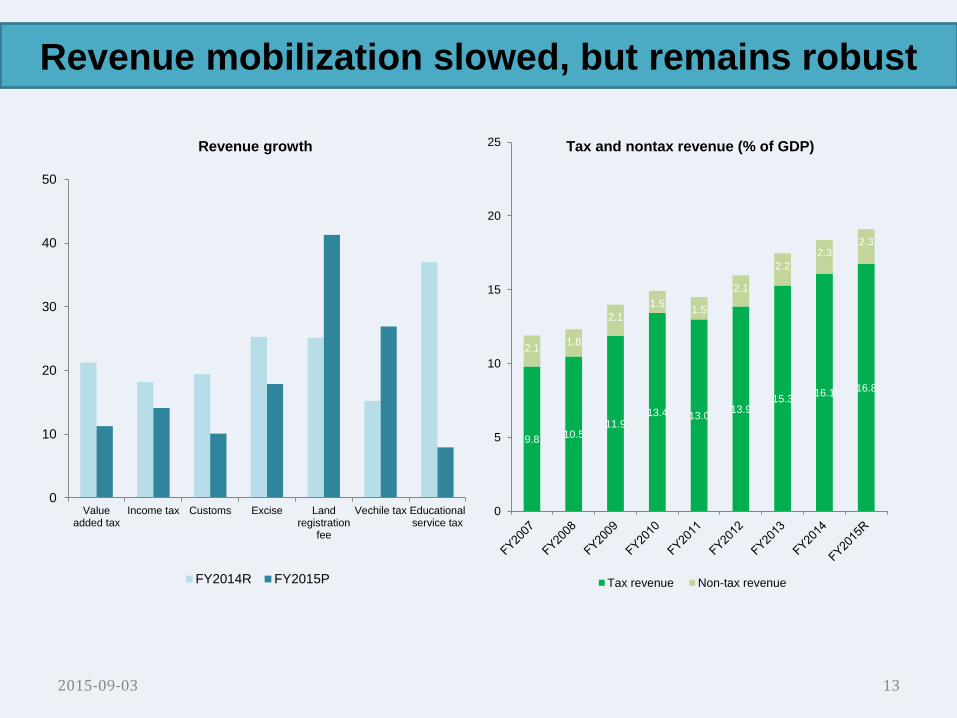
Revenue mobilization slowed, but remains robust
9.8 10.5 11.9
13.4 13.0 13.9
15.3 16.1 16.8
2.1 1.8
2.1
1.5 1.5
2.1
2.2
2.3 2.3
0
5
10
15
20
25 Tax and nontax revenue (% of GDP)
Tax revenue Non-tax revenue
0
10
20
30
40
50
Valueadded tax
Income tax Customs Excise Landregistration
fee
Vechile tax Educationalservice tax
Revenue growth
FY2014R FY2015P

2015-09-03 14
Primary surplus and a marginal fiscal deficit
-5
0
5
10
15
20
25
FY'2009 FY'2010 FY'2011 FY'2012 FY'2013 FY2014 FY2015R
Fiscal indicators (% of GDP)
Domestic revenue Grants Recurrent expenditure
Capital expenditure Fiscal balance
-3
-2
-1
0
1
2
3
FY2010 FY2011 FY2012 FY2013 FY2014 FY2015R
Primary and fiscal balance (% of GDP)
Primary balance Fiscal balance

2015-09-03 15
Outstanding public debt is declining
51.9
44.0
40.5
32.5 32.2
25.6
0
10
20
30
40
50
60 Public debt (% of GDP)
Internal External Outstanding debt
0.0
0.5
1.0
1.5
2.0
2.5
3.0
3.5
4.0
FY2009 FY2010 FY2011 FY2012 FY2013 FY2014 FY2015
Principal and interest payment (% of GDP)
Internal principal repayment External principal repayment
Internal interest payment External interest payment
2015-09-03 16
Monetary Sector
2015-09-03 17
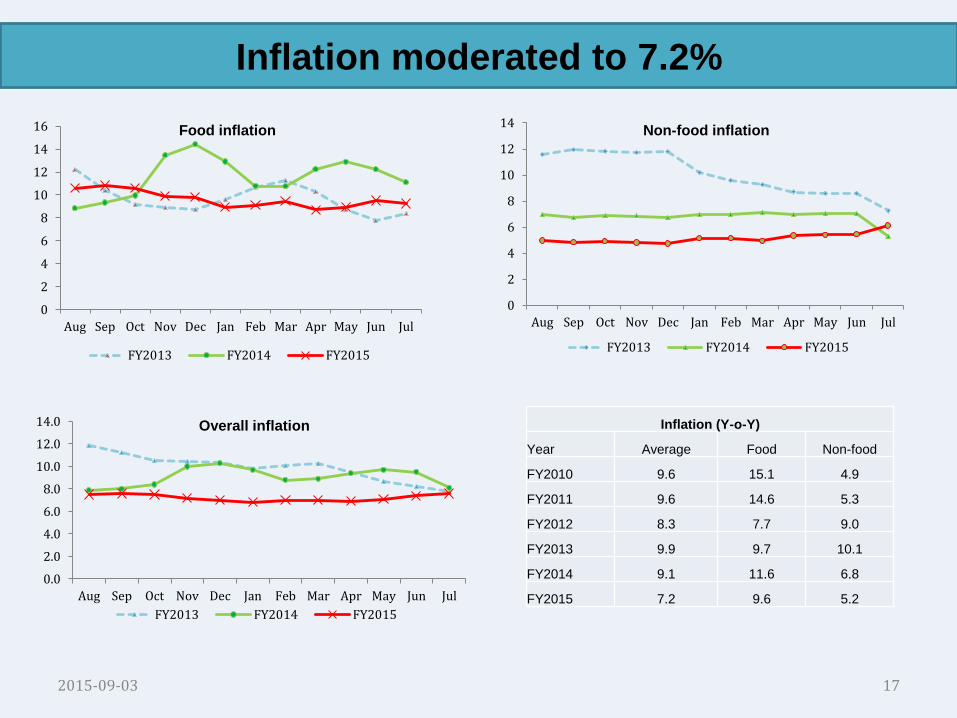
Inflation moderated to 7.2%
0
2
4
6
8
10
12
14
16
Aug Sep Oct Nov Dec Jan Feb Mar Apr May Jun Jul
Food inflation
FY2013 FY2014 FY2015
0
2
4
6
8
10
12
14
Aug Sep Oct Nov Dec Jan Feb Mar Apr May Jun Jul
Non-food inflation
FY2013 FY2014 FY2015
0.0
2.0
4.0
6.0
8.0
10.0
12.0
14.0
Aug Sep Oct Nov Dec Jan Feb Mar Apr May Jun Jul
Overall inflation
FY2013 FY2014 FY2015
Inflation (Y-o-Y)
Year Average Food Non-food
FY2010 9.6 15.1 4.9
FY2011 9.6 14.6 5.3
FY2012 8.3 7.7 9.0
FY2013 9.9 9.7 10.1
FY2014 9.1 11.6 6.8
FY2015 7.2 9.6 5.2
2015-09-03 18
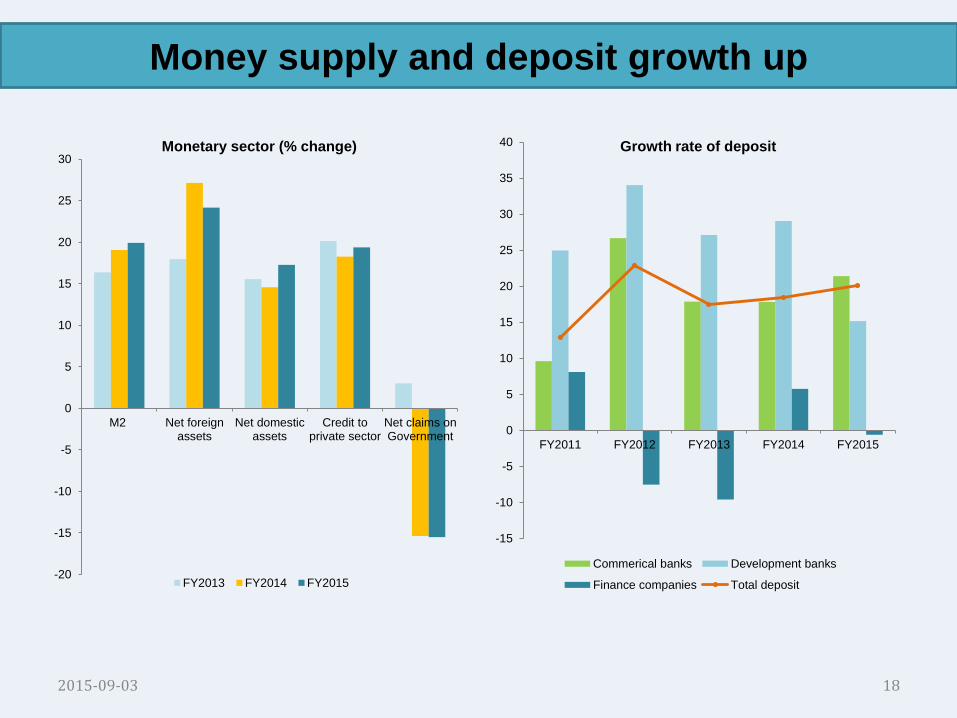
Money supply and deposit growth up
-20
-15
-10
-5
0
5
10
15
20
25
30
M2 Net foreignassets
Net domesticassets
Credit toprivate sector
Net claims onGovernment
Monetary sector (% change)
FY2013 FY2014 FY2015
-15
-10
-5
0
5
10
15
20
25
30
35
40
FY2011 FY2012 FY2013 FY2014 FY2015
Growth rate of deposit
Commerical banks Development banks
Finance companies Total deposit
2015-09-03 19
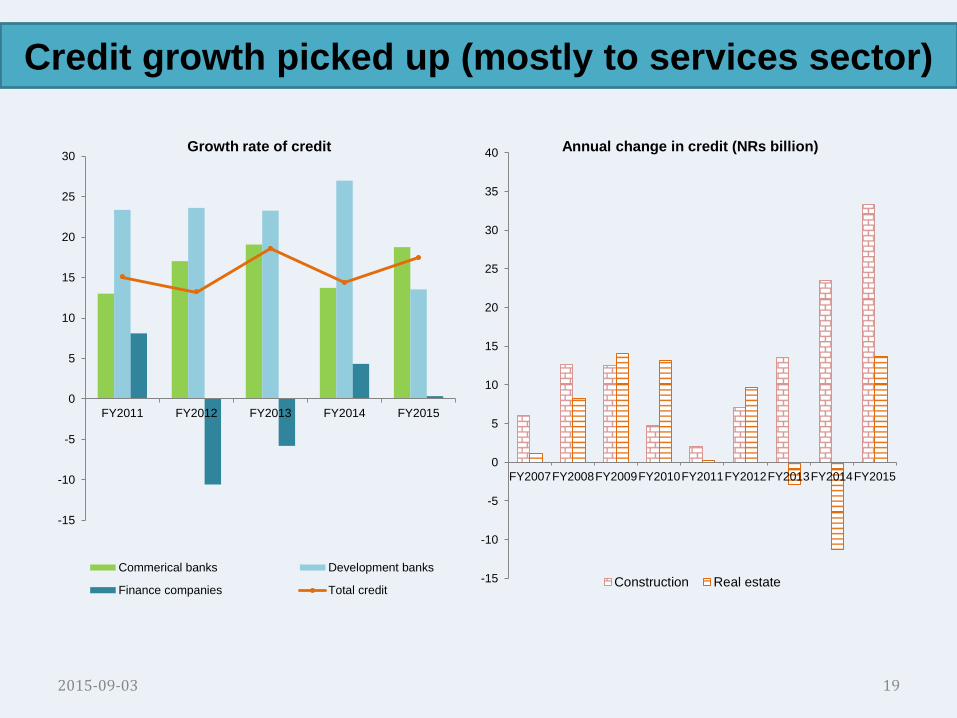
Credit growth picked up (mostly to services sector)
-15
-10
-5
0
5
10
15
20
25
30
FY2011 FY2012 FY2013 FY2014 FY2015
Growth rate of credit
Commerical banks Development banks
Finance companies Total credit-15
-10
-5
0
5
10
15
20
25
30
35
40
FY2007FY2008FY2009FY2010FY2011FY2012FY2013FY2014FY2015
Annual change in credit (NRs billion)
Construction Real estate
2015-09-03 20
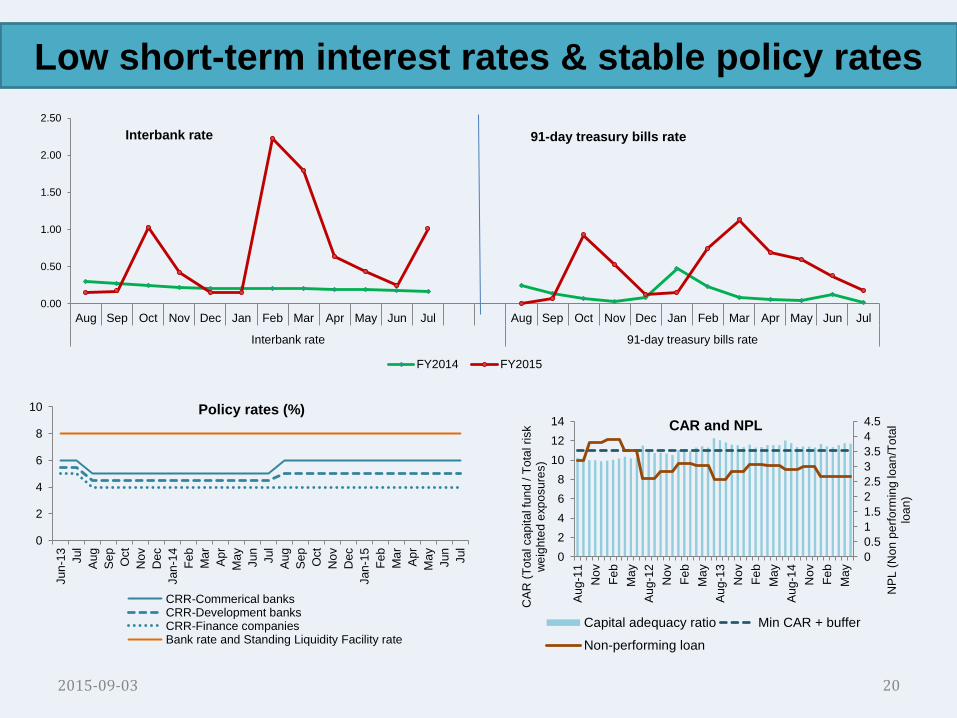
Low short-term interest rates & stable policy rates
0.00
0.50
1.00
1.50
2.00
2.50
Aug Sep Oct Nov Dec Jan Feb Mar Apr May Jun Jul Aug Sep Oct Nov Dec Jan Feb Mar Apr May Jun Jul
Interbank rate 91-day treasury bills rate
FY2014 FY2015
Interbank rate 91-day treasury bills rate
0
2
4
6
8
10
Jun
-13
Jul
Au
g
Se
p
Oct
Nov
Dec
Jan
-14
Fe
b
Ma
r
Ap
r
Ma
y
Jun
Jul
Au
g
Se
p
Oct
Nov
Dec
Jan
-15
Fe
b
Ma
r
Ap
r
Ma
y
Jun
Jul
Policy rates (%)
CRR-Commerical banksCRR-Development banksCRR-Finance companiesBank rate and Standing Liquidity Facility rate
0
0.5
1
1.5
2
2.5
3
3.5
4
4.5
0
2
4
6
8
10
12
14
Au
g-1
1
No
v
Fe
b
Ma
y
Au
g-1
2
No
v
Fe
b
Ma
y
Au
g-1
3
No
v
Fe
b
Ma
y
Au
g-1
4
No
v
Fe
b
Ma
y
NP
L (
Non
pe
rfo
rmin
g lo
an
/To
tal
loa
n)
CA
R (
To
tal ca
pita
l fu
nd
/ T
ota
l ri
sk
we
igh
ted
exp
osu
res)
CAR and NPL
Capital adequacy ratio Min CAR + buffer
Non-performing loan

2015-09-03 21
Stock market volatility persists
10.3
22.0
77.3
65.3
0
10
20
30
40
50
60
70
80
90
FY2012 FY2013 FY2014 FY2015
Turnover (NRs billion)
Trading
Preferred Stock
Manufacturing &Processing
Mutual Fund
Others
Hotel
FinanceCompanies
Promoter Share
DevelopmentBanks
Hydropower
InsuranceCompanies
Commercial Banks
Total
0
200
400
600
800
1000
1200
FY2011 FY2012 FY2013 FY2014 FY2015
Stock market performance
Market capitalization (NRs billion)
Number of listed companies
NEPSE index (closing)
2015-09-03 22
External Sector

2015-09-03 23
Trade deficit marginally up: Growth of imports > exports
Share of GDP FY2013 FY2014 FY2015
TOTAL EXPORTS 4.5 4.7 4.0
To India 3.0 3.1 2.6
To China 0.1 0.1 0.1
To Other Countries 1.4 1.5 1.3
TOTAL IMPORTS 32.8 36.8 36.5
From India 21.7 24.6 23.1
From China 3.7 3.8 4.7
From Other Countries 7.5 8.4 8.6
TOTAL TRADE BALANCE -28.3 -32.1 -32.4
With India -18.6 -21.5 -20.5
With China -3.6 -3.6 -4.6
With Other Countries -6.1 -6.9 -7.3

2015-09-03 24
Overseas migration slowed down, but remittance accelerated
294,094
354,716
384,665
453,543
527,814 512,887
0
100,000
200,000
300,000
400,000
500,000
600,000
FY2010 FY2011 FY2012 FY2013 FY2014 FY2015
Migrants & destination Malaysia
Qatar
SaudiArabia
UAE
Others
Kuwait
SouthKorea
Bahrain
Oman
Japan
Afghanistan
Lebanon
Israel
Total
0
5
10
15
20
25
30
35
0
100,000
200,000
300,000
400,000
500,000
600,000
Work
ers
' rem
itta
nces (
% o
f G
DP
)
Num
ber
of
overs
eas m
igra
nt w
ork
ers
Migration & remittances
Overseas migrant workers
Workers' remittances (% of GDP)
• Remittance inflows reached a record 29.1% of GDP in FY2015

2015-09-03 25
High remittance inflows buoyed external stability
• CAB: 5.1% of GDP and BOP 6.8% of GDP
• Gross forex: $8.3 billion (import cover of 11.2 months)
-40
-30
-20
-10
0
10
20
30
40
50
FY2010 FY2011 FY2012 FY2013 FY2014 FY2015
Balance of payments (% of GDP)
Export (fob) Oil import Non-oil import (cif)
Net services balance Net income balance Grants
Workers remittances Net transfers excl grants & remittances Capital account
Financial account Current account balance Balance of payments

2015-09-03 26
Exchange rate remains weak
• Depreciation of Nepalese rupee 15 July 2011-15 July 2012: 19.9%
15 July 2012- 15 July 2013: 6.7%
15 July 2013- 15 July 2014: 0.9%
15 July 2014- 15 July 2015: 5.4%
70.2
108.4
106.4
60
65
70
75
80
85
90
95
100
105
110
1-J
an-1
14
-Feb
-11
10-M
ar-…
13
-Ap
r-1
117-M
ay-…
20
-Ju
n-1
12
4-J
ul-
11
27-Aug-…
30
-Sep
-11
3-N
ov
-11
7-D
ec-1
11
0-J
an-1
21
3-F
eb-1
218-M
ar-…
21
-Ap
r-1
225-M
ay-…
28
-Ju
n-1
21
-Au
g-1
24
-Sep
-12
8-O
ct-1
211-Nov-…
15
-Dec
-12
18
-Jan
-13
21
-Feb
-13
27-M
ar-…
30
-Ap
r-1
33
-Ju
n-1
37
-Ju
l-1
39
-Au
g-1
31
2-S
ep-1
31
6-O
ct-1
319-Nov-…
23
-Dec
-13
26
-Jan
-14
1-M
ar-1
44
-Ap
r-1
48
-May
-14
11
-Ju
n-1
41
5-J
ul-
14
18-Aug-…
21
-Sep
-14
25
-Oct
-14
28-Nov-…
1-J
an-1
54
-Feb
-15
10-M
ar-…
13
-Ap
r-1
517-M
ay-…
20
-Ju
n-1
52
4-J
ul-
15
27-Aug-…
Exchange rate (NRs/USD)

2015-09-03 27
FY2016 Growth and Inflation Forecast

2015-09-03 28
Cautiously optimistic on growth outlook
• Late and subnormal monsoon
• Scope and pace of post-earthquake reconstruction
• Political uncertainties and supply disruptions
• Net migration, remittances inflows and services sector growth
4.6
3.8
5.1
3.0
4.5
5.5
0
1
2
3
4
5
6
FY2012 FY2013 FY2014R FY2015P FY2016_s1 FY2016_s2
CBS NRM forecast as of Aug 2015
Supply-side contributions to growth
Agriculture Industry Services GDP growth (basic prices)
2015-09-03 29
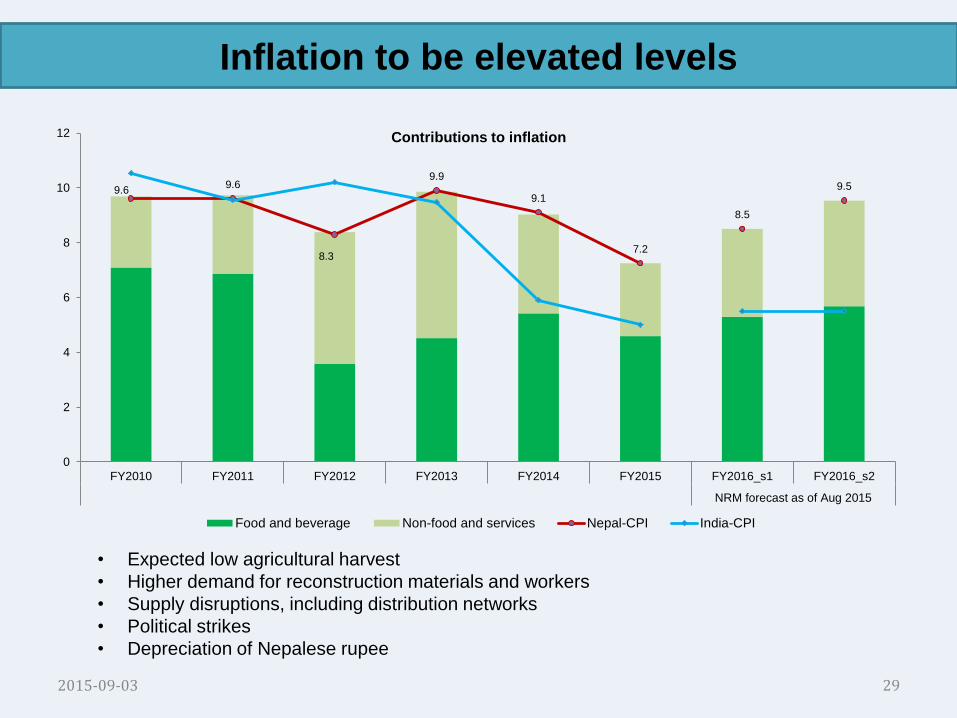
Inflation to be elevated levels
• Expected low agricultural harvest
• Higher demand for reconstruction materials and workers
• Supply disruptions, including distribution networks
• Political strikes
• Depreciation of Nepalese rupee
9.6 9.6
8.3
9.9
9.1
7.2
8.5
9.5
0
2
4
6
8
10
12
FY2010 FY2011 FY2012 FY2013 FY2014 FY2015 FY2016_s1 FY2016_s2
NRM forecast as of Aug 2015
Contributions to inflation
Food and beverage Non-food and services Nepal-CPI India-CPI

2015-09-03 30
Fiscal Sustainability and Reconstruction

• Funds for
reconstruction is not an
issue
– Pledged amount > public
sector needs
• Capacity to accelerate
reconstruction projects
within the given
timeframe is an issue
Adequate fiscal space to
finance (through
borrowing) post-
earthquake reconstruction
2015-09-03 31
Dearth of capacity but not funds!
Debt stabilizing primary balance
Initial debt to GDP level 25.6%
Weighted real interest rate -0.1%
GDP growth rate 5.0%
Required primary balance -1.2%

2015-09-03 32
Fiscal sustainability even with a primary deficit
-5%
0%
5%
10%
15%
20%
25%
30%
35%
40%
45%
2016 2017 2018 2019 2020 2021 2022 2023 2024 2025
Public debt and primary balance estimate (% of GDP)
Public debt_s1 Public debt_s2 Public debt_s3
Primary balance_s1 Primary balance_s2 Primary balance_s3
2015-09-03 33
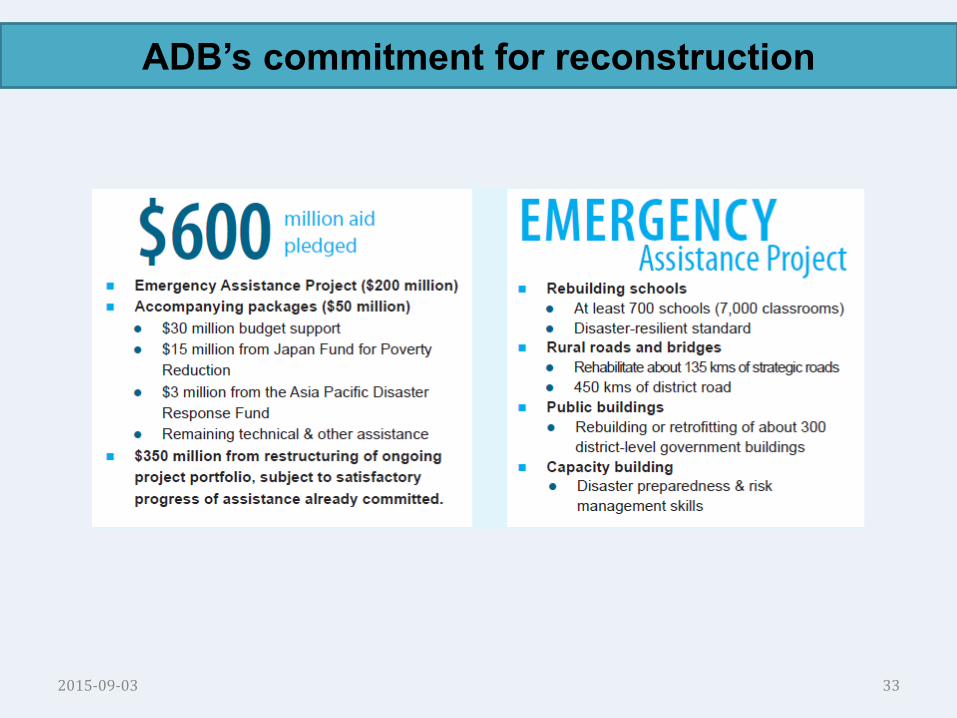
ADB’s commitment for reconstruction

2015-09-03 34
Thank You!
2015-09-03 35