needs and assets report 2010 - first … and assets report 2010 gila river indian community regional...
TRANSCRIPT

Regional Partnership Council
NEEDS AND ASSETS REPORT2010
GILA RIVER INDIAN COMMUNITY

Regional Partnership Council
Council
GILA RIVER INDIAN COMMUNITY
Priscilla Foote, ChairDale Enos, Vice ChairPriscilla AntoneByron DonahuePatricia FosterRita HeltonPamela JohnsonMelissa MadridSandra NasewytewaMary TatumJeff Thornburg
4000 North Central Avenue, Suite 800Phoenix, Arizona 85012Phone: 602.771.4991Fax: 602.274.7040www.azftf.gov

Pascua Yaqui Tribe
Cocopah Tribe
Central Pima
Central Maricopa
South Phoenix
Central Phoenix
North Phoenix
Southeast Maricopa
Gila River Indian Community
Colorado RiverIndian Tribes
Navajo Nation
Cochise
Coconino
Gila
Graham/Greenlee
La Paz/Mohave
Southwest Maricopa
Yavapai
Yuma
Hualapai Tribe
TohonoO’odham
Nation
White MountainApache Tribe
San Carlos Apache Tribe
Navajo/Apache
North Pima SouthPima
Pinal
Santa Cruz
Northwest Maricopa
Coconino
Coconino
Coconino
Salt River Pima MaricopaIndian Community
NortheastMaricopa

ContentsMessage from the Chair ..................................................................................................................................... 1
Executive Summary ........................................................................................................................................... 2
Who are the families and children living in the Gila River Indian Community Region? .............................. 4
Overview of Region: Gila River Indian Community .................................................................................. 4
Regional Child and Family Characteristics ............................................................................................... 4
Regional Population Growth .................................................................................................................................................. 5
Regional Race and Ethnicity .................................................................................................................................................. 6
Language Characteristics ..................................................................................................................................................... 7
Types of Families with Children Birth to Five .......................................................................................................................... 7
Teen Parents ......................................................................................................................................................................... 8
Teen Parent Focus Group Key Findings ................................................................................................................................. 9
Economic Circumstances ...................................................................................................................... 10
Poverty ................................................................................................................................................................................. 10
Unemployment .................................................................................................................................................................... 11
Economic Support Programs ............................................................................................................................................... 12
Educational Indicators ............................................................................................................................ 14
Principals and Administrators Survey .................................................................................................................................. 14
Parent Survey of Kindergarten Readiness ........................................................................................................................... 15
Dynamic Indicators of Basic Early Literacy Skills (DIBELS) ................................................................................................ 16
Arizona’s Instrument to Measure Standards (AIMS) ...................................................................................................... 17
Graduation Rates ................................................................................................................................................................ 17
The Early Childhood System: Detailed Descriptions of Assets and Needs ................................................ 20
Early Care and Education ...................................................................................................................... 20
School-based Preschool ....................................................................................................................................................... 20
Head Start ....................................................................................................................................................................... 20
FACE .................................................................................................................................................................................... 21
Supporting Families ............................................................................................................................... 24
Teen Parents ....................................................................................................................................................................... 24
Teen Parent Focus Group Key Findings .............................................................................................................................. 25
Grandparents Raising Grandchildren ................................................................................................................................... 26
Home Visitation Programs ................................................................................................................................................... 26
Supporting Families in Crisis ............................................................................................................................................... 27
Principal and Administrator Survey Results ........................................................................................................................ 27
Health .................................................................................................................................................... 28
Family and Community Survey ........................................................................................................................................ 28
27th Arizona Indian Town Hall Recommendations ............................................................................................................... 28
Access to Care .................................................................................................................................................................... 28
Pregnancies and Births ........................................................................................................................................................ 30
Health Care Coverage ........................................................................................................................................................ 34

Pediatric Dental Care ......................................................................................................................................................... 34
Immunizations ..................................................................................................................................................................... 34
Diabetes ............................................................................................................................................................................... 35
Infant Mortality ..................................................................................................................................................................... 36
Developmental Screenings and Services for Children with Special Developmental and Health Care Needs ........................ 36
Head Start Enrollees Health Care and Screening ................................................................................................................. 38
Children Birth to 5 Receiving Hearing and Vision Screenings ............................................................................................... 39
Public Awareness & Collaboration .......................................................................................................... 40
System Coordination ......................................................................................................................................................... 40
Summary and Conclusion ............................................................................................................................... 42
Appendix A. Demographics of Mothers, Gila River Indian Community Compared to all Arizona Native American Residents 2007-2008 .............................................................................................. 44
Appendix B. Interview Guide for Case Study with Gila River Indian Community Grandmother ...........45
Appendix C. Gila River Indian Community Focus Group Questions for Teen Parents ............................ 47
Appendix D. School Principal and Other Administrator Survey ............................................................... 48
Appendix E. Parent Survey of Kindergarten Readiness ............................................................................. 53
Appendix F. Parent Survey of Kindergarten Readiness: Results ............................................................. 55
Appendix G. Table of Regional Assets ......................................................................................................... 56
Appendix H. Table of Regional Strategies .................................................................................................. 57
Appendix I. References ............................................................................................................................... 58
List of TablesTable 1. Number of children 0 to 5 years old ................................................................................................. 5
Table 2. Number of young children tribally enrolled, December 2009 ....................................................... 6
Table 3. Children ages 0 to 5 as a percent of total population .................................................................. 6
Table 4. Race and ethnicity of the population, 2009 .................................................................................... 6
Table 5. Language spoken at home, 2000 .................................................................................................... 7
Table 6. Children 0 to 5 living with parents, other relatives, or non-related persons ................................ 8
Table 7. Births to teen mothers as a proportion of total births, 2008 .......................................................... 8
Table 8. Births to teenaged mothers, as a percent of all births .................................................................. 9
Table 9. Poverty status and median household income ............................................................................ 11
Table 10. TANF recipients 2007-2010 ........................................................................................................... 12
Table 11. WIC participation ........................................................................................................................ 13
Table 12. Numbers of children 0 to 5 receiving SNAP benefits, 2007-2010 .............................................. 14
Table 13. Gila River Indian Community schools ........................................................................................ 14
Table 14. DIBELS results, for the beginning and end of a school year .................................................... 16
Table 15. AIMS third-grade test scores ....................................................................................................... 17
Table 16. Educational attainment of persons age 18 to 24 ..................................................................... 18
Table 17. Educational attainment of adults age 25 and up ..................................................................... 18

Table 18. Child care programs and capacity ............................................................................................... 22
Table 19. Available certification, credentialing or degree programs ........................................................ 24
Table 20. Gila River Health Care: Numbers of children and visits, 2009 .................................................. 29
Table 21. Head Start children and dental care ............................................................................................... 34
Table 22. Percent of children with up-to-date immunizations .................................................................. 35
Table 23. Percent of children with up-to-date immunizations .................................................................. 35
Table 24. Special needs by type and age range .......................................................................................... 37
Table 25. Health characteristics of Head Start enrollees ........................................................................... 38
Table 26. Head Start children diagnosed with special needs ..................................................................... 38
Table 27. Hearing and vision screenings 2009 ............................................................................................ 39
Table 28. Screenings 2009-2010 school year for Children aged 0-5 attending pre-k / Head Start ........ 39
Table 29. Data from the Family and Community Survey ......................................................................40
List of FiguresFigure 1. Unemployment rates, 2000 to 2010 .............................................................................................11
Figure 2. Ratio of population to primary health care providers ................................................................ 30
Figure 3. Birth rate per thousand residents (1999-2008 average) ............................................................ 31
Figure 4. Percent of births with prenatal care during the first trimester (1999-2008 average) ............... 31
Figure 5. Percent births with fewer than five prenatal care visits (1999-2008 average) .......................... 32
Figure 6. Teen births per thousand females, ages 14 to 19 (1999-2008 average) .................................... 33
Figure 7. Percent low-birth-weight (5 lb, 8 oz or less) births (1999-2008 average) ................................. 33
Figure 8. Percent of uninsured births (1999-2008 average) ..................................................................... 33

Message from the Chair 1
Message from the Chair
Message from the Chair:
The 2010 Gila River Indian Community Regional Needs and Assets Report is the second in a series of assessments conducted every two years for the First Things First Gila River Indian Community Regional Partnership Council. The assessment provides a snapshot of the current status of children and families in the region. It is a collection of useful data and community information that will be used to help determine how best to invest resources to improve the lives of young children and families in the region.
The Gila River Indian Community Regional Partnership Council takes great pride in the progress made over the past two years. Together with our community partners, we are delivering on our promise to build a solid foundation for young children and their families. During the past year, we have touched the lives of young children and their families by providing support through grant awards and activities addressing teen parenting, early education/child care, native language and literacy and infant mental health.
The Gila River Indian Community Regional Partnership Council is grateful for the support and guid-ance received from the Gila River Indian Community Tribal Council. With the on-going support of tribal leadership, The First Things First Gila River Indian Community Regional Partnership Council will continue to advocate and provide opportunities for healthy growth in the first years of life, parent education on child development, food assistance, and ongoing professional development opportuni-ties for child care providers, teachers, and family caregivers.
Thanks to the dedicated staff, volunteers, and partners, First Things First is making a real difference in the lives of our youngest citizens, not only on the Gila River Indian Community, but throughout the entire State.
Sincerely,
Priscilla D. Foote, Chair
Gila River Indian Community Regional Partnership Council
!

Executive Summary 2
Executive Summary
The Gila River Indian Community is located on 372,000 acres of land in south-central Arizona just south of the cities of Phoenix, Tempe and Chandler. Tribal membership includes the Akimel O’otham (Pima) and Pee Posh (Maricopa) Tribes. The Community is divided into seven districts with the central government seat in Sacaton, Arizona. Each district has its own jurisdiction and maintains one to four seats on the Tribal Council. Language and culture preservation is a priority within the Com-munity, with many tribal programs integrating language and culture into their program planning and curriculum.
Between 2000 and 2009, the number of children aged 0 to 5 years in the Region increased by 79 percent, from 1,429 to 2,556. A majority of the young children (64%) live in households whose annual income is lower than the federal poverty threshold. A large percentage of young children in the Region (40%) were not living with either parent, but with another relative, such as a grandparent.
The number of young children living in single-mother households, and with non-relatives, may be at least partially the result of elevated teen pregnancy rates in some areas of the Region. Births to teen mothers in the Gila River Indian Community Region represented over a quarter of the total births in the Region, which was about twice the rate seen in the state as a whole in 2008 (12%) and six percent higher than the rate for all American Indian tribes across Arizona. Although births to teen mothers may be more common in the Region, so is obtaining timely prenatal care. Pregnant women in the Gila River Indian Community were more likely to begin prenatal care in the first trimester com-pared to American Indians across the state. The growing population of young children in the Region, and the make-up of the households in which they commonly live, suggests a need for additional and expanded services to pregnant and parenting teens and to the relative caretakers of the young children in the Region.
Educational attainment is lower in the Region than in the state as a whole. Roughly two-thirds of adults 25 years of age or older in the Region have at least a high school diploma or equivalent, with approximately one third having some college or a college degree. However, the high school drop-out rate is high: 34 percent of youth age 15-17 were not enrolled in school, according to the 2000 census.
There are a number of early care and education programs within the Gila River Indian Community including child care centers, home-based childcare, school-based preschools, Family and Child Educa-tion (FACE) programs and Head Start. In spite of these considerable assets, it appears that cost and availability of early childhood educational settings may still be an issue, based both on poverty rates in the Community and waiting lists for parents seeking childcare slots.
In addition, a survey of school administrators in the Region showed that while a variety of services seen as valuable to young children and their families exist in the Community, coordination of services and resources among these agencies is viewed as needing strengthening. These results suggest that improving the degree of collaboration and communication among agencies could better serve children aged 0 to 5 and their families.
There is a commitment in the Gila River Indian Community Region to supporting families in crisis. The Thwajik Ke (Healing House) Residential Treatment Center provides inpatient drug and alcohol treatment to community members, and children are allowed to accompany their parents to the inpa-tient facility. In addition, a domestic-violence shelter is currently in the planning stages with a goal to be built this year.

Executive Summary 3
Providing a diverse array of services across federal, state, tribal and local agencies presents chal-lenges in communication and coordination. The Gila River Indian Community is, however, attempting to meet these challenges by leveraging a federally-recognized model of coordination and communica-tion for services for school-aged children, and those transitioning to school. These and other efforts show that the Gila River Indian Community is striving to support the health, welfare and develop-ment of the families and young children who live within the Community.

Who are the families and children living in the Gila River Indian Community Region? 4
Who are the families and children living in the Gila River Indian Community Region?
Overview of Region: Gila River Indian CommunityThe Gila River Indian Community is located on 372,000 acres of land in south-central Arizona. The Community lies south of the cities of Phoenix, Tempe, and Chandler, and north of Casa Grande, and its east to west borders run from Coolidge to Tolleson. An Act of Congress established the Reser-vation on February 28, 1859. Tribal membership includes the Akimel O’otham (Pima) and Pee Posh (Maricopa) tribes. The Community is divided into seven districts with the central government seat in Sacaton, Arizona. Each district maintains one to four seats on the Tribal Council. Agriculture contin-ues to play a prominent economic role. The Community’s farm grows crops such as cotton, wheat, millet, alfalfa, and barley, among others, on 12,000 acres. The Gila River Indian Community owns and operates related agricultural activities, such as a chemical fertilizer plant, cotton gin, and grain storage facilities. The Gila River Indian Community also owns and operates a variety of economic enterprises such as the Gaming Enterprise, which operates three casinos within the Community.
Gila River Telecommunications Inc., is a tribally owned business enterprise, which provides residen-tial, and business phone and internet service to the Community. The Lone Butte Industrial Corpora-tion focused on economic development within the Community.
The Gila River Indian Community is steadily increasing and diversifying its industrial, agricultural, retail and recreational economic base. The Community currently operates three industrial parks that are home to several local and national companies. One park, Lone Butte Industrial Park, is nationally acclaimed as one of the most successful Indian industrial parks in the U.S.
Gaming also continues to be a positive economic development activity for the Community. Wild Horse Pass Hotel and Casino, Vee Quiva Casino and Lone Butte Casino are the three facilities which comprise Gila River Casinos. Gila River Casinos employ approximately 2,000 people, of which approximately 30 percent are Community members.
The Community is served by six elementary schools, which include Blackwater, Casa Blanca, and Gila Crossing Community Schools, one state-funded school, Sacaton Elementary, and one private Catholic elementary school, St. Peter Indian Mission School which serves children kindergarten through eighth grades. There are 4 junior high schools in the Community: Skyline, which is a charter school, Gila Crossing Junior High Sacaton Junior High, and St. Peters Indian Mission School. The Community also has two high schools, VHM Alternative High School and Ira Hayes High School.
Regional Child and Family Characteristics
The well being of children and families in the Region can be explored by examining indicators or factors that describe early childhood health and development issues. Needs assessment data on indicators provide policy makers, service providers, and the Community with an objective way to understand factors that may influence a child’s healthy development, readiness for school and for life.
Data collected for the 2010 Needs and Assets Update includes the following:
• Demographicandpopulationcharacteristics

Who are the families and children living in the Gila River Indian Community Region? 5
• Economicindicators
• Education(includingPre-School,ElementaryandSecondary)
• QualityandAccess–EarlyEducation(FamilyandChildEducation(FACE),HeadStartandPre-School)
• ProfessionalDevelopment–HeadStart
• Health,includingOralHealthCare
• Familysupport,childsafety,childabuseandneglect,fostercareandchildmortality
• Systemcoordination
Census data from 2000 was used throughout this report. It is important to note that while other regions of the state and country are able to access American Community Survey data for more recent years, the sample size is too small in the Gila River Indian Community to enable us to use all of these updated data sets. The 2010 Census will provide more comprehensive updated informa-tion. It should be noted that census forms are not mailed to a home unless the home has a physical address (not a post office box). This means that in rural and tribal areas, there are additional barriers to having a reliable and accurate census count.
Generally speaking, all Tribal enrollment departments have variations in member counts as well. Differences in population estimates may be due to a delay in enrollment of children after birth, or inability to document the specific enrollment criteria for the Tribe/Nation. Additionally Tribal enroll-ment does not separate members living off reservation; therefore, population estimates from Tribal enrollment offices differ from census population counts. Due to these barriers to accurate population counts, where possible we have used the First Things First population estimates.
There are some areas of the report where there is little to no publicly available data such as that which documents services for supporting families, public awareness and dental screenings. As a result primary data collection strategies were utilized (focus groups and surveys) to help to provide fuller developed snapshot of the Region.
Regional Population Growth
The number of children ages 0 to 5 in the Region is growing, and the rate of growth is faster than the statewide rate.
In 2009 there were an estimated 2,556 children ages 0 to 5 in the Region (First Things First, 2010). We can see from the chart below that the number of children ages 0 to 5 in the Region is increasing over time. Between 2000 and 2009, the percentage growth was 79 percent, almost twice the state rate of 40 percent. Table 1 summarizes this trend.
Table 1. Number of children 0 to 5 years old
2000 Census 1,429 459,923
2009 Estimate 2,556 643,783
Increase from 2000 to 2009 79% 40%
Source: First Things First. 2010.

Who are the families and children living in the Gila River Indian Community Region? 6
Table 2. Number of young children tribally enrolled, December 2009
Source: Gila River Indian Community Enrollment/Census Office, 2010
AGETRIBAL
ENROLLMENT
0 145
1 284
2 337
3 357
4 427
5 423
TOTAL 1,973
Not only are the number of children birth to five increasing at a rate faster than the state, they also comprise a far greater percentage of the population compared to those birth through five in the state.
Table 3. Children ages 0 to 5 as a percent of total population
Sources: U.S. Census Bureau, 2000a, First Things First, 2010, Arizona Department of Health Service Bureau of Health Systems Development, 2010.
GILA RIVER INDIAN COMMUNITY ARIZONA
TOTAL POPULATION CHILDREN 0 TO 5 TOTAL POPULATION CHILDREN 0 TO 5
2000 Census 11,257 1,429 13% 5,130,632 459,923 9%
2009 Estimate 21,502 2,556 12% 6,683,129 643,783 10%
The increasing population of children aged zero to five has implications for all programs that have been designed to serve young children and their families. Attention should be paid to the capacity of programs to cope with greater numbers of young children in the future.
Regional Race and Ethnicity
Although Tribal members represent primarily two tribes, the Akimel O’otham (Pima) and the Pee Posh (Maricopa), eligibility for Tribal membership is based on blood quantum, which can include other Indian tribes to achieve quantum.
Table 4. Race and ethnicity of the population, 2009
Source: Arizona Department of Health Service Bureau of Health Systems Development, 2010
GILA RIVER INDIAN COMMUNITY ARIZONA
American Indian 92% 5%
White 4% 76%
Black 0% 3%
Asian/Pacific Islander 0% 2%
Other 4% 15%
Hispanic (of any race) 9% 26%

Who are the families and children living in the Gila River Indian Community Region? 7
Language Characteristics
Traditional languages spoken in the Community are Akimel O’otham and Pee Posh respectively. The languages are linguistically distinct; O’otham is a Uto-Aztecan language and Pee Posh is a Yuman language. O’otham is the third most-spoken language in Pinal County behind English and Spanish (US Census, 2000b). In the 2000 Census, the majority of persons under age 65 reported speaking primarily English at home. Among those 65 or older, two-thirds reported speaking a native North American language at home. (All of these speakers also reported that they spoke English “well” or “very well.”) Spanish was the primary home language for about 5 percent of the population. (Nearly 90 percent of the Spanish speakers reported that they spoke English “well” or “very well.”)
Table 5. Language spoken at home, 2000
Source: US Census 2000b
AGE GROUP ENGLISH SPANISHANY NATIVE
NORTH AMERICAN LANGUAGE
5 to 17 3,205 89% 129 4% 263 7%
18 to 64 3,768 64% 387 7% 1,718 29%
65 and over 144 27% 27 5% 360 67%
Language and culture preservation is a priority within the Community. Many tribal programs integrate language and culture into their program planning and curriculum with support from Community, staff, the Gila River Education Department’s Culture Committee and the Gila River Indian Commu-nity Regional Partnership Council. The Regional Partnership Council is currently funding a Native Language Early Literacy Program, which is being implemented in all four Head Start Centers in the Region. The funding will expand language revitalization and early literacy into Head Start Programs for 266 children throughout the Region. The Head Start Culture Coordinator trains Head Start teaching staff on how to integrate the Akimel O’otham and Pee Posh languages and print into both everyday dialogue and visually throughout classes in the form of labeling of objects. The outcomes that have been achieved through the Head Start Akimel O’otham, and Pee Posh language and culture program include increased use of native language and song within the classroom setting. The intent of the Regional Partnership Council is to expand this program to all 12 early childhood centers in the Region to promote a native-language-rich environment, where traditions and self-identity are cultivated and nurtured.
Types of Families with Children Birth to Five
In 2000, just over half (56%) of Gila River children under age six were reported to be living with one or both parents. (See Table 6.) In the state as a whole, 85 percent of young children were living with at least one of their parents. Nearly 40 percent of the Gila River children were not living with either parent, but with another related person. This percentage is much higher than in the state as a whole (13%). Few children in either the Gila River Indian Community or the state were not living with any relative.
Among the 800 Gila River children who lived with at least one parent, more than half (416) were living with a single mother. Only 285 children were living with both parents (or with one parent and one step-parent). In the state as a whole, a much smaller proportion of the young children were living with their single father or single mother.

Who are the families and children living in the Gila River Indian Community Region? 8
Table 6. Children 0 to 5 living with parents, other relatives, or non-related persons
Source: US Census, 2000c
GILA RIVER INDIAN
COMMUNITY ARIZONA
Children 0 to 5 1,429 100% 459,141 100%
Children 0 to 5 living with one or both parents 800 56% 391,021 85%
Living with married parents or step-parents 285 20% 295,330 64%
Living with single father 99 7% 30,038 7%
Living with single mother 416 29% 65,653 14%
Children 0 to 5 living with relatives other than parents 560 39% 59,688 13%
Children 0 to 5 living with non-relatives 34 2% 7,789 2%
Children 0 to 5 living in group quarters 35 2% 643 0%
From 2006 to 2008 the proportion of total births that were to teen mothers for all Arizona Tribes combined was higher than the State rate; the Gila River Indian Community had rates higher than the average for all Tribes.
Table 7. Births to teen mothers as a proportion of total births, 2008
BIRTHSBIRTHS TO TEENAGE
MOTHERSArizona 99,215 12,161 12%
All Native American Mothers in Arizona 6,362 1,185 19%
Gila River Indian Community 277 72 26%
According to Census data, in 2000 there were 848 grandparents living with one or more grandchil-dren in the Region. Over half of these grandparents (53%) reported being the main caregivers for their grandchildren. Forty three percent of these grandparents had been responsible for their grand-children for five years or more (US Census Bureau, 2000c).
Teen Parents
Teen pregnancy and parenting are important to address because teen mothers and their babies face increased risks to their health and their opportunities to build a future are diminished. Teen mothers are more likely than mothers over age 20 to give birth prematurely (before 37 completed weeks of pregnancy);1 to drop out of high school.2
Adolescents in the United States have one of the highest pregnancy rates in the world and only two states in this country have a higher rate than Arizona’s (New Mexico and Nevada).3 Nationally, Native American teens have significantly higher teen birth rates compared to their non-Hispanic White coun-terparts with the third highest teen birth rate in the United States among the five major racial/ethnic groups.4 From 2006 to 2008 the rates for all Arizona Tribes combined was higher than the State rate; the Gila River Indian Community had rates higher than the average for all Tribes.
1 National Center for Health Statistics, final natality data.2 National Campaign to Prevent Teen Pregnancy. Why It Matters. Accessed 7/2/10.3 Guttmacher Institute. U.S. Teenage Pregnancies, Births and Abortions: National and State Trends and Trends by Race and Ethnicity
20104 Hamilton, BE, Martin, JA and Ventura, SJ (2009). Births: Preliminary Data for 2007. National Vital Statistics Reports, 57(12).

Who are the families and children living in the Gila River Indian Community Region? 9
Table 8. Births to teenaged mothers, as a percent of all births
Source: Health Status Profile of American Indians in Arizona, 2006, 2007, 2008
2006 2007 2008Gila River Indian Community 21% 28% 26%
All Tribal Communities in Arizona 20% 22% 20%
Arizona 13% 13% 12%
In order to obtain more detailed information about this population, focus groups were conducted with teen parents and young adults in the Region. Topics of discussion included perceptions of teen pregnancy in the Gila River Indian Community at large, and the services and support available to teen parents.
The focus groups were conducted during Babypalooza, an event for teen parents that offers a number of services including Readathon, developmental screenings, and diabetes prevention infor-mation held annually at the Vechij Himdag Mashchamakud School. The focus group questions can be found in AppendixC.
Seven fathers and eight mothers participated in two focus groups; one with fathers only and one with mothers only. Most of the teen parents were from Districts 3, 4 or 5, and their ages ranged from 15 to 24 years (there was only one 24 year old father who was in a relationship with a 19 year old mother). Five of the participants reported having at least one other child (sibling or other relative) under age 18 living in their home. In terms of educational attainment and employment, most focus group participants were in grades 9 to 11 and three were high school graduates. Over half of the par-ticipants were students, three were homemakers, and two were unemployed. Key findings follow.
Teen Parent Focus Group Key Findings
• BothteenmothersandfathersbelievedthattheteenpregnancyrateishighintheRegion.Reasons for teen pregnancy cited by both included; a lack of things to do in the region, a lack of information about sex and birth control, early experimentation with sex, and the lack of parental involvement.
• Manyoftheteenparentsalsohadparentswhohadthem,ortheirsiblingsasteens,orhadextended family members who had also had children as teenagers.
• Teenmothersoftenreportedthatinitiallytheythoughtbeingamomwouldbe“cool,”butafter the reality of being a teen parent sunk in, “it wasn’t cool anymore.”
• Whileteenparentswereproudoftheirchildren,manyreportedtheyfelttheyweren’treadyto be parents at the time and worried about being able to financially support their children, and also worried about being able to complete school.
• Whenaskedwhatresourceswouldhelpreduceteenpregnancy,responsesincludedjobsinthe Region, and education about birth control.
• Manyoftheteenswereawareofresourcesavailableinthecommunitythatofferedsexeducation, such as the family planning bus and the clinic at the hospital, but stated that few teens used these resources.
• Childcareatschoolswasmostcommonlymentionedasaneededresource,followedbysupport groups and increased awareness of programs and services that might be available in the Community.

Who are the families and children living in the Gila River Indian Community Region? 10
Economic Circumstances
Poverty
Children living in poverty face a disproportionate number of risk factors that jeopardize their develop-ment and well-being. When compared with children from more affluent families, poor children are more likely to have low academic achievement, to drop out of school, and to have health, behavioral, and emotional problems. These linkages are particularly strong for children whose families experi-ence deep poverty, who are poor during early childhood, and who are trapped in poverty for a long time (Anderson Moore et al, 2009). According to First Things First estimates (First Things First, 2010) in 2009 there were 1,632 children ages 0 to 5 living in poverty in the Gila River Indian Community Region. This represents 64 percent of all the population birth to five in the Region, compared to 23 percent in the State.
The 2010 Poverty Guidelines for the 48 Contiguous States and the District of Columbia
PERSONS IN FAMILY
1
2
3
4
5
6
7
8
POVERTY GUIDELINE
$10,830
14,570
18,310
22,050
25,790
29,530
33,270
37,010
For families with more than 8 persons, add $3,740 for each additional person.
Source: U.S. Department of Health and Human Services, HHS Poverty Guidelines, 2010
Table 9 lists the percent of the population (all ages) and the percent of young children who were living in poverty, according to the 2000 Census. Just over half of the residents of the Gila River Indian Community were reported to be living in poverty. Nearly two-thirds of the young children were in living poverty. These percentages are much higher than we see in the state of Arizona as a whole: 14 percent of all persons and 21 percent of children 0 to 5.
Within the Gila River Indian Community, the easternmost districts have the lowest percentages of persons in poverty. In District 6, to the west, two-thirds of all residents and nearly three-quarters of the young children were estimated to be living in poverty.
Table 9 also lists median household incomes. (A median income is a dollar value which divides the population into two approximately equal groups. Half of the population had incomes above the median, and the other half had incomes below the median.) The median income for the entire Gila River Indian Community ($18,599) is much lower than that of the state as a whole ($40,558). Again, we see that incomes were much higher in the eastern districts.

Who are the families and children living in the Gila River Indian Community Region? 11
Table 9. Poverty status and median household income
Source: US Census, 2000d, 2000e
TOTAL
POPULATION IN 2000
ESTIMATED PERCENT OF POPULATION
LIVING IN POVERTY
ESTIMATED PERCENT OF CHILDREN 0 TO 5 LIVING IN POVERTY
MEDIAN HOUSEHOLD INCOME IN
1999
Gila River Indian Community 11,287 52% 64% $18,599
District 1 (Blackwater) 817 29% 53% $27,426
District 2 (Hashen Kehk) 455 37% 53% $28,558
District 3 (Sacaton) 2,724 45% 51% $18,250
District 4 (Santan) 2,349 50% 66% $18,438
District 5 (Casa Blanca) 2,241 60% 63% $18,036
District 6 (Komatke) 1,963 66% 74% $16,081
District 7 (Maricopa Colony) 738 52% 70% $15,385
Arizona 5,130,632 14% 21% $40,558
Unemployment
From January to August 2010, the average monthly unemployment rate was 10 percent in Arizona as a whole. Earlier this decade, before the economic crisis of 2008, the rates were about half as large. (Unemployment rates in Pinal County are usually one or two percentage points higher than the state as a whole.)
Unemployment rates for the Gila River Community have historically been about three times as high as those for the state as a whole. Rates were relatively low in 2000 and 2007 (about 15%). For the first part of 2010, the unemployment rate was 33 percent. One in three persons who could have
Figure 1. Unemployment rates, 2000 to 2010
Source: Arizona Department of Commerce, Research Administration, CES/LAUS Unit, 2010
ARIZONA
Pinal County
All Reservations in Arizona
Gila River Reservation
Sacaton
0%
15%
30%
45%
2000 2001 2002 2003 2004 2005 2006 2007 2008 2009 2010 (eight
months)
Une
mpl
oym
ent
Rat
e (A
nnua
l Ave
rage
)

Who are the families and children living in the Gila River Indian Community Region? 12
been in the labor force were unemployed. Unemployment rates for the Gila River Community are also high when compared to all Tribes state-wide.
The communities of Blackwater and Santan (not shown in the graph) have unemployment rates very close to those of the entire Community. The community of Sacaton, however, has rates which are even higher than the rest of the Community. For the first eight months of 2010, Sacaton’s unemploy-ment rate was 41 percent. (Arizona Department of Commerce, Research Administration, CES/LAUS Unit, 2010).
Economic Support Programs
Data is also available on economic supports for families with young children in the Region. This includes the Temporary Assistance for Needy Families (TANF) program, the Women, Infants and Chil-dren (WIC) Program and the Supplemental Nutrition Assistance Program (SNAP).
Temporary Assistance for Needy Families (TANF)
In Arizona, the TANF program is administered by the Department of Economic Security. Unfortu-nately, they do not report numbers of recipients by Tribal Community. Data are reported by county of residence and by zip code of the recipient. According to First Things First, two zip code areas repre-sent a large part of the Gila River Indian Community: 85221 and 85147. In this section, those two zip codes will be used in place of the entire Community.
Table 10 shows the number of families with children under the age of six, who received TANF ben-efits in five selected months over the past three years. For some of these families, only the child (or children) were the actual beneficiaries of the TANF benefits. In the remaining families, both the adults and the young children received the benefits.
Cuts to services are evident in the decreases seen from January 2007 to January 2010. There was an overall 19% decrease in TANF recipients in this period.
Table 10. TANF recipients 2007-2010
Source: Arizona Department of Economic Security (2007, 2009). DES Multidata pulled from Database (Unpublished Data).
JANUARY 2007
JUNE 2007JANUARY
2009JUNE 2009
JANUARY 2010
Zip Code 85221 25 37 47 47 37
Zip Code 85147 76 101 91 90 45
TOTAL 101 138 138 137 82
Women, Infants, & Children (WIC)
The Women, Infants and Children (WIC) program provides federal funds to the Gila River Indian Com-munity for supplemental foods, health care referrals, and nutrition education for low-income preg-nant, breastfeeding, and non-breastfeeding postpartum women, and to infants and children up to age five who are found to be at nutritional risk.
Table 11 shows data from the WIC Program for participants in May 2009 and May 20105 . It is esti-mated that more than 1,600 children under six in the Community live in poverty. (See Table 9, above.) It would appear that approximately 300 of these children are eligible but not receiving WIC services.
5 Data provided by Gila River Indian Community Nutrition Program via email correspondence

Who are the families and children living in the Gila River Indian Community Region? 13
Table 11. WIC participation
Source: Data provided by Gila River Indian Community Nutrition Program via email correspondence
MAY 2013 MAY 2014INCREASE
OR DECREASE
Women (pregnant or postpartum) 243 235 -3%
Infants (up to one year old) 275 293 7%
Children (one to five years old) 667 612 -8%
TOTAL WIC PARTICIPANTS 1,185 1,140 -4%
A WIC Health Profile was compiled in 20086 . Key points from the Profile include:
• Almostone-quarter(24%)ofWICmotherswerebetweentheagesof15and19
• Justoverone-halfofWICmotherswereage20-29
• Another21percentwereage30-39
• Twopercentwereage40orolder
• 13.6percentofbirthswerepreterm(comparedtothenationalaverageof12%)
• Womenarebreastfeedingatratesthatareclosetothenationalaverage(58%forCommu-nity women versus 59% nationally)
• Childrenage0-4weretwiceaslikelytobeoverweight(27%)comparedtothenationalaver-age (13%).
• ApproximatelyhalfofthefamilieswithchildrenenrolledintheHeadStartprogramintheRegion are also enrolled in the WIC program.
One important challenge faced by the Gila River Indian Community WIC program is its no show rate of about 20 percent, which is twice as high as the Pinal County rate (10%). Program staff attribute this primarily to a lack of transportation.
Supplemental Nutrition Assistance Program (SNAP)
Benefits from the Supplemental Nutrition Assistance Program (SNAP) are used to buy food and help low-income households in the Region obtain more nutritious diets by increasing the food purchasing power at grocery stores and supermarkets for all eligible participants. As with TANF, SNAP recipients in the Region are most likely to be child-only cases. Again, two zip codes were used as an approxi-mation for the Gila River Indian Community (85221 and 85247). These zip codes account for almost 50% of the population and include Sacaton and Casa Blanca Districts. Data on SNAP was received from the Arizona Department of Economic Security showing SNAP families with children age 5 and under and SNAP Child-only cases where the child or children were age 5 or under. Table 12 shows the detail on the number of cases from January 2007 through January 2010.
6 Data provided by Gila River Indian Community Nutrition Program via email correspondence

Who are the families and children living in the Gila River Indian Community Region? 14
Table 12. Numbers of children 0 to 5 receiving SNAP benefits, 2007-2010
Source: Arizona Department of Economic Security (2007, 2009).
JANUARY 2011
JUNE 2011JANUARY
2013JUNE 2013
JANUARY 2014
Zip Code 85221 131 150 188 207 123
Zip Code 85247 339 362 420 431 307
TOTAL 470 512 608 638 430
In the 2007-08 program year, the Gila River Indian Community Head Start program provided services to 17 homeless families which was eight percent of families served. None of these families were reported as acquiring housing. In 2008-09, the number of homeless people served increased dra-matically to 59 or 25 percent of all families served. Ten of these families were reported as acquiring housing (Gila River Indian Community Head Start, 2009b).
Educational IndicatorsElementary schools in the Gila River Indian Community are either public schools, Bureau of Indian Affairs (BIA) schools or grant schools chartered under the Community. Table 13 lists the schools in the Region and their enrollments.
Table 13. Gila River Indian Community schools
Source: Gila River Indian Community, 2010 (Unpublished Data)
SCHOOL TYPE ENROLLMENTBlackwater Community School BIA Grant School 317
Casa Blanca Community School BIA Grant School 226
Gila Crossing Community School BIA Grant School 500
Sacaton Elementary School ADE Public School 329
Principals and Administrators Survey
In order to obtain more specific information for this Needs and Assets report about school readiness in the Gila River Indian Community, principals and administrators from schools in the Region were asked to complete a survey regarding services that prepare children for kindergarten. The survey also included questions about the respondent’s perception of services available to meet the needs of families with children ages birth to five. See Appendix F for the School Principal and Other Adminis-trator Survey.
Administrators reported that their school systems support parents of children aged 0-5 in the fol-lowing ways; by providing developmental screenings (seven respondents), by providing parenting classes, mental health services and kindergarten classes (five respondents each), by providing literacy programs, health screens and therapeutic services for developmental delays (four respon-dents each), through preschool programs and home and/or school based Head Start programs (three respondents each), through provision of food boxes that include baby formula (two respondents each), and one respondent each cited as supports, the Clothing Closet, family literacy, family/parent meetings, parent and grandparent classes
Assets cited by administrators responding to the survey included:
• Strongkindergartenclasses

Who are the families and children living in the Gila River Indian Community Region? 15
• Goodstudentattendance
• Strongfamilyinvolvement
• 85percentofthekindergartenstudentsareatgradelevelbytheendoftheschoolyear
• Strongstaff
• Textbookavailabilityandallocation
• Nighttimeparentingclasses
In addition, administrators indicated areas of the school system that could or should be strengthened or changed including;
• Improvedcoordinationofservicesthatlinkschoolsandproviders
• Evenstrongerparentalinvolvement,
• Parenteducation,
• Improvedeffectivenessofcommunicationwithparents
• Increasedoutreacheffortstoparentsinformingthemofservicesthatareavailable
School administrators were also asked in which of a number of ways they support families in prepar-ing their children for kindergarten. Most commonly, the schools provide information about kindergar-ten registration and/or host an Open House (six respondents each), as well as talking with children about the transition to kindergarten, having children and families visit a kindergarten class, and/or provide the family with information about kindergarten readiness skills (five respondents each). Other means of supporting parents in preparing their children for kindergarten include, hosting a parent orientation (four respondents), asking about parents about their child’s prior school experiences, inter-ests, concerns, and desires (three respondents), or Child Find (one respondent). Five of nine admin-istrators responding were somewhat or very satisfied with children’s readiness for school in the past year.
Administrators were also asked to respond to a number of issues that may be factors that contrib-ute to a child experiencing difficulty in school. Most commonly cited were attendance issues (five respondents), followed by limited family resources, prenatal substance exposure, family/home life, parental involvement in kindergarten, lack of parental support, low educational levels of parents, low-quality child care or preschool experience, and behavioral issues (three respondents each). A single administrator reported not attending preschool as a factor affecting school readiness. Another cited chronic health conditions as a factor.
Parent Survey of Kindergarten Readiness
A goal of the Gila River Indian Community Regional Partnership Council, when undertaking this needs and assets work, was to better understand the issues parents face when their children are transitioning into kindergarten. As a result the Parent Survey of Kindergarten Readiness was devel-oped and administered to parents whose children will enter kindergarten in the fall of 2010 (See Appendix F for survey). The survey used to assess this transition experience was adapted from several parent surveys administered by elementary schools in the United States including Mililani Waena Elementary School in Mililani, Oahu Hawaii. The survey was developed by the Institute for Native Education and Culture and it was therefore deemed appropriate for use among parents of the Gila River Indian Community. Twenty-seven (27) parents from a single school completed the survey.

Who are the families and children living in the Gila River Indian Community Region? 16
Only five of the 27 parents responding (19%) reported that they had concerns about their child’s adjustment and/or transition to kindergarten. Comments made by parents about these concerns included concerns about communication and worries that their child might not know as much as others.
Parents were also asked whether a number of items would improve the transition experience for their children and themselves. The items that parents most often reported as potentially helpful were; 1) information about kindergarten registration, school Open House, etc (18 parents), 2) having a parent orientation at a time convenient for me (work schedule, child care needs) (14 parents), and 3) having the teacher talk with children about the transition to kindergarten (13 parents). A table of complete survey results can be found in Appendix G.
Dynamic Indicators of Basic Early Literacy Skills (DIBELS)
Dynamic Indicators of Basic Early Literacy Skills (DIBELS) data was received for two schools from the Gila River Indian Community: Sacaton Elementary, a state-funded public school, and Gila Cross-ing Community School, grant-funded through the Bureau of Indian Affairs. Students at both schools are tested at the beginning, middle and end of the year using the DIBELS test. Combined, the DIBELS measures form an assessment system of early literacy development that allows educators to determine student progress. Students who have achieved the goals for their grade level are rated Bench Mark. Students who need additional support programs and interventions are rated Intensive or Strategic7 . DIBELS data was examined over two school years, 2008-2009 and 2009-2010.
The table below shows the results of the DIBELS at the two schools. At both schools, and in both years, kindergarten students performed much better on the tests at the end of the school year, com-pared to how they had done at the beginning of the year.
DIBELS data for the Sacaton Elementary first-graders do not show the same pattern. The percent-ages of children achieving Bench Mark status hardly changed from the beginning to the end of the school year.
Table 14. DIBELS results, for the beginning and end of a school year
Source: Dynamic Indicators of Basic Early Literacy Skills reports; unpublished data
BEGINNING OF YEAR END OF YEAR
GRADE SCHOOL YEAR INTENSIVE STRATEGICBENCH MARK
INTENSIVE STRATEGICBENCH MARK
Kindergarten Gila Crossing 2008-09 36% 43% 21% 11% 11% 78%
Gila Crossing 2009-10 37% 37% 27% 30% 11% 58%
Sacaton 2008-09 39% 22% 12% 7% 5% 87%
Sacaton 2009-10 46% 38% 14% 7% 3% 91%
First grade Sacaton 2008-09 4% 24% 72% 11% 23% 66%
Sacaton 2009-10 4% 24% 72% 13% 20% 68%
7 For more information on the DIBELS, see the University of Oregon, College of Education, Center on Teaching and Learning: https://dibels.uoregon.edu/

Who are the families and children living in the Gila River Indian Community Region? 17
Arizona’s Instrument to Measure Standards (AIMS)
The Arizona’s Instrument to Measure Standards (AIMS) is a criterion referenced test designed to measure each student’s progress in learning the Arizona Academic Standards. Those standards define what students should know and be able to demonstrate at various stages of elementary and secondary education8 . Results for third-grade students at Blackwater Community School, Sacaton Elementary, Casa Blanca Community School, and Gila Crossing Community School are shown for the 2008-09 school year. Blackwater has a higher percentage of students meeting standards, compared to the state as a whole, in all three subjects: reading, writing, and math. Gila Crossing has a higher percentage than the state meeting standards on reading and math, but not writing. Casa Blanca and Sacaton schools have smaller proportions of students meeting standards than the state on all three tests. Both Blackwater and Sacaton schools performed much better on the math test in 2008-09 than they had in 2007-08.
8 For more information on the AIMS test see www.ade.state.az.us/aims/students.asp9 KewalRamani, A., Gilbertson, L., & Fox, M.A. (2007). Status and trends in the education of racial and ethnic minorities. Table 7.2:
Percentage distribution of public elementary and secondary students, by region, state, and race/ethnicity: 2004. Washington, DC: U.S. Department of Education, National Center for Education Statistics
10 Faircloth, Susan C., & Tippeconnic, 2I, John W. (2010). The Dropout/Graduation Rate Crisis Among American Indian and Alaska Na-tive Students: Failure to Respond Places the Future of Native Peoples at Risk.
11 Gila River Community Court, Diversion Coordinator telephone conversation 6/23/10.
Table 15. AIMS third-grade test scores
Source: Arizona Department of Education, 2010
READING WRITING MATH
SCHOOLMEETS
STANDARDSEXCEEDS
STANDARDSMEETS
STANDARDSEXCEEDS
STANDARDSMEETS
STANDARDSEXCEEDS
STANDARDS
Blackwater 59% 3% 72% 3% 62% 3%
Casa Blanca 44% N/A 46% 2% 33% 4%
Gila Crossing 62% 0% 60% 0% 61% 0%
Sacaton 31% 0% 50% 0% 31% 2%
ARIZONA 57% 12% 65% 16% 53% 19%
Graduation Rates
Native Americans represent 6% of the student population in Arizona9. Arizona has an overall gradu-ation rate of 73%. Native Americans in Arizona have a rate of 52% creating a 21% graduation gap. Native American males in Arizona fare more poorly with a graduation rate of 47%. 10 There are a number of reasons for dropping out. The key identifier is poor attendance. The Gila River Indian Community has a Truancy Code but does not have truancy officers. Referrals are made to the Gila River Indian Community Court Diversion Program and Teen Court. Reports from the referring schools indicate that this intervention is successful with a reduction in truancy and an improvement in attendance. One school reported an increase from 83% to 94% in attendance.11 In addition to poor attendance, other reasons for dropping out include:
• Educationaldisengagement-truancy,lackofextracurricularparticipation,poorrelationshipswith teachers and peers
• Academicperformance-fallbehind

Who are the families and children living in the Gila River Indian Community Region? 18
• Lackofsupportfortheireducationfromparents,educators,schools,etc.
• Adultresponsibilitiessuchasbecomingaparent,gettingmarried,work,solesupportfortheirfamilies
• Impersonal,uncaringnatureofsomeschools12
Within the Gila River Indian Community, data from the 2000 Census shows that of 772 youth ages 15 to 17, 66% were enrolled in school. This means that 34% were not enrolled in school (and may have dropped out). Other more recent data indicates a more promising but still concerning dropout rate of 18%.13
The following table shows that in 2000, almost three-quarters of those aged 18-24 were not a high school graduate. Males were more likely than females to have a high school equivalency certificate.
12 Arizona Department of Education, Office of Indian Education, Presentation at the Partnerships for Indian Education Conference Rapid City, SD July, 2008
13 Gila River Indian Community Head Start Program Community Assessment 2008-2011 reporting Data Collection and Statistical Information Gathered by Education Administration For grant application use – ITCA Trust Funds Reported to Education Standing Committee – December 2006
Table 16. Educational attainment of persons age 18 to 24
Source: U.S. Census Bureau, 2000 Census Summary File 3 (Table PCT25)
TOTAL FEMALE MALE
Population ages 18 to 24 1,107 100% 565 100% 542 100%
Not a high school graduate 812 73% 397 70% 415 77%
High school graduate or equivalency 224 20% 110 20% 114 21%
Some college, no degree 51 5% 38 7% 13 2%
Associate or Bachelor’s degree 20 2% 20 4% 0 0%
For those over the age of 25, 37 percent did not have a high-school diploma or its equivalent.
Table 17. Educational attainment of adults age 25 and up
Source: U.S. Census 2000 American Indian and Alaska Native Summary File, Matrices PCT35, PCT36, PCT38, PCT43, PCT45, PCT47, PCT49, PCT61, PCT64, PCT67, and PCT70.
EDUCATIONAL ATTAINMENT PERCENT
Less than 9th grade 10%
9th to 12th grade, no diploma 27%
High school graduate (includes equivalency) 30%
Some college, no degree 19%
Associate degree 5%
Bachelor’s degree 4%
Graduate or professional degree 4%

Who are the families and children living in the Gila River Indian Community Region? 19
Of the 188 Head Start parents for whom recent data are available, one-third has less than a high school diploma. Almost one-half are high school graduates or have a GED. Almost 18% have some college, vocational schooling or an Associates Degree.

The Early Childhood System: Detailed Descriptions of Assets and Needs 20
The Early Childhood System: Detailed Descriptions of Assets and Needs
Early Care and EducationThere are a variety of early care and education options available to parents of young children in the Gila River Indian Community, including child care centers, home-based care, school-based pre-schools, Family and Child Education (FACE) programs and Head Start programs. These options can be separated into three types: School-based preschool, Family and Child Education (FACE) Programs, and off-Tribal Community services.
School-based Preschool
School-based preschool programs include those provided at Casa Blanca Community School and Gila Crossing Community School. These programs enroll children aged three to five years and are funded by the Gila River Indian Community (Gila River Indian Community Head Start Program, 2008). In addition, the Early Education Childcare Center (EECC) is a tribally-licensed program which receives federal funding from the Child Care and Development Fund. The EECC provides childcare to children from birth to 5 years old in Sacaton and in Laveen. The EECC is a not-for-profit center and is currently enrolled in the First Things First Quality First program. The First Things First Quality First program is a statewide quality improvement and rating system for providers of center- or home-based early care and education, with a goal to help parents identify quality care settings for their children. EECC Child ratios in classrooms are low and teachers must possess a Child Development Associate degree to work for the Early Education Childcare Center.
Head Start
The Gila River Indian Community also operates a federally regulated Tribal Head Start Program. Head Start is an early education program that promotes school readiness by enhancing the social and cognitive development of children through the provision of educational, health, nutritional, social and other services to enrolled children and families. Eligibility requirements for the Head Start program include: the child must be three or four years old by September 1st, parents must meet income eligibility guidelines, and priority is given to four year old children with special needs. Services are provided in four centers throughout the Community.
In program year 2008-09, enrollment in Head Start was 266 children. There were eleven classes, giving an average class size of just over 20 children per class. For the past few years, enrollment at the Head Start has been at capacity and turnover is low, 18 percent in the 2008-2009 program year, which results in very few children on a waiting list actually entering the program. There was approxi-mately one classroom staff member for every nine children (Gila River Indian Community Head Start, 2009a, 2009b).
Of the families of Head Start enrolled children, 36 percent were two-parent families and 64 percent were single-parent families. In 35 percent of the two-parent families, neither parent was working. In the single-parent families, 72 percent of those parents were not working (Gila River Indian Commu-nity Head Start, 2009c).
The health services provided to children enrolled in Head Start are a strong resource for families in the Community. In the 2008-2009 program year, nearly 100 percent of those enrolled in Head Start (264 of 266 children) completed all program-specific medical screenings and were up to date on all

The Early Childhood System: Detailed Descriptions of Assets and Needs 21
immunizations by the end of the program year. Twenty-six of the children enrolled in that program year were identified as having special educational needs and had a developed Individualized Educa-tion Plan to support them (Gila River Indian Community Head Start, 2009d, 2009e).
The Gila River Indian Community Head Start program is an important asset for families with young children in the Region. The program, however, works at capacity and is restricted in the number of children that it can accommodate. For those who do not meet eligibility requirements, other afford-able early care and education options can be limited. In addition, it is only available to children aged three to five.
FACE
FACE is an early childhood and parental involvement program for American Indian families in schools funded by the Bureau of Indian Education. The goals of the FACE program include increasing family literacy; strengthening family-school-community connections; promoting the early identification and provision of services to children with special needs; and promoting the preservation of the unique cultural and linguistic diversity of the communities served by the program. FACE has both a center-based and a home-based component. The home-based component includes personal visits and screenings by parent educators and is aimed at families with children from birth to age three. The center-based component includes an early childhood education program for children aged three to five, adult education for the children’s parents, and parent/child time 14. FACE programs operate at Blackwater, Casa Blanca and Gila Crossing Community Schools. All three FACE programs in the Gila River Indian Community have waiting lists ranging from 5 to 37 children.
The table on the following page lists a number of characteristics of child care and early education programs available for children under age six in the Region.
14 For more information about FACE programs, visit http://faceresources.org/

The Early Childhood System: Detailed Descriptions of Assets and Needs 22
PROVIDER
BLA
CKW
ATER
CO
MM
UN
ITY
SCH
OO
L
CASA
BLA
NCA
CO
MM
UN
ITY
SCH
OO
L
GIL
A C
ROSS
ING
CO
MM
UN
ITY
SCH
OO
L
HEA
D S
TART
EARL
Y ED
UCA
TIO
N/
CHIL
DCA
RE C
ENTE
R
MO
NA’
S CO
UN
TRY
DAY
CA
RE
KIN
DER
CARE
PROGRAM TYPE:
Family and Child Education (FACE) P P P
School-Based Preschool P P P P
Off-Tribal Community P P
Number of Centers 1 1 1 4 2 1 2
Location District 1 District 5 District 6
District 3 serving D1-3,
District 4 serving D4&5,
District 5 serving D5&4,
District 6 serving D6&7
District 3 and District 6 Chandler Chandler
Capacity
24 (CB*), 37 (HB** in Dist
1-5)5 (CB), 21
(HB)16 (CB), 35
(HB)203 (funded), 266 (enrolled)
124 (Dist 3) 54 (Dist 6) 59
300 (both sites)
Cost $0 $0 $0 $0
Per 1/2Day/Day Infant: $20/$26 Toddlr: $19/$24 Preschl: $17/$22
$190 per week
Infant: $220/wk
Toddler-2yr: $212/wk
Pre K: $188/wk
Waiting List 37 10 5 D3: 131, D6: 50 0 0
Table 18. Child care programs and capacity
* Center-based ** Home-based Sources: Arizona Child Care Resource and Referral (CCRR) Southern Arizona, April 2010, and FTF Gila River Indian Community Needs and Assets Report, 2008.
In addition to the programs listed above, Vechij Himdag Mashchamakud (VHM) High School will be providing child care services for parenting teens beginning in the 2011 school year through a part-nership with the Early Head Start Program. (Childcare services were previously provided at the Ira Hayes High School, but the grant for the program has ended). Teen pregnancy is a concern among members of the Gila River Indian Community and it is estimated that about 50 percent of the teens attending the VHM High School are parents. The high school child care program is therefore a very important asset in the Community which helps teen parents continue their education. Testimonies from the teen parents who participated in the focus group for this report demonstrate the impor-tance of having such a resource available to them. There have been discussions about opening an Early Head Start site at the Ira Hayes High School to meet the needs of parenting teens, and even though this may not happen in the near future due to space limitations, the school directive is com-mitted to finding some type of other arrangement to support teen parents who want to continue with their education.
A number of factors might exacerbate the need for and availability of child care for Community mem-bers. Blackwater Preschool had funding cuts, which resulted in the Region losing a site that served 20 children with five on its waiting list. In addition, Sacaton Elementary School is an Arizona district

The Early Childhood System: Detailed Descriptions of Assets and Needs 23
school and funding cuts have eliminated all day kindergarten.
The cost of child care can be a major barrier for parents in the Community. Using the median Regional incomes noted in Table 9, median gross weekly incomes in the Region range from about $195/week (for single women) to about $530/week for two-parent families. The childcare costs iden-tified in Table 18 above show that families would need to spend from $110/week to $220/week to place a single child in full-time child care. This represents from about 20 percent to over 100 percent of a family’s gross income for those at the median; it would be an even higher percentage of their take-home pay.
Although there is no cost for Head Start for those families who meet income eligibility requirements, only a limited number of slots are available. The Family and Child Education (FACE) program also does not charge a fee but is limited in its location to only three sites. Additional affordable, high qual-ity early care and education opportunities are needed in the Community.
Professional Development
Academic preparation and professional development are critical in preparing the early childhood workforce to provide developmentally appropriate and stimulating educational activities that meet the needs of all children. Preparation and credentialing lay the ground work and professionalize the learning environment. Professional development exposes the workforce to the latest research and teaching strategies for developmentally appropriate practice.
There are many opportunities in the Community for early care providers to receive professional development. Funding mechanisms for professional development include Tribal Scholarships that are provided to Community members wishing to advance their education; Department of Economic Security (DES) Scholarships; Early Childhood Development Scholarships provided through Central Arizona College; and TEACH Scholarships.
First Things First offers Teacher Education and Compensation Helps (TEACH) Scholarships to support child care providers in their pursuit of their Child Development Associate (CDA) certification or Asso-ciate of Arts (AA) degree. Through participation in TEACH, child care providers, directors and assistant directors, teachers, and assistant teachers working in licensed or regulated private, public and Tribal programs are able to participate in 9-15 college credits of college coursework leading to their CDA, a certificate of completion in Early Childhood Education or their AA degree. A Bachelors Degree model of the TEACH program is also currently being developed.
As of May 2010, there were nine scholarship applications from the Community. Of these, four were awarded and one is on hold. Five of the recipients are of Hispanic decent, two are American Indian and one is Anglo. Of these, five are teachers and two are teacher’s aides. One of the recipients has been in her position for six years, and two each have been in their positions one, three and four years. Three work with newborns and toddlers, two work with 2-3 year olds, and one each work with three, four and five year olds.
Three of the recipients have obtained their Certificate in Early Childhood and two have completed their Associate of Applied Science in Child Development degree. All of the recipients aspire to com-plete their degree in Early Childhood and are committed to a long-term career working with young children. All of the applicants state that without the scholarship, they would not be able to reach their goal of a higher education in the field of early childhood.
The Gila River Indian Community Head Start also offers professional development support to their staff. In the 2008-2009 program year, four out of 11 teachers had an Associate Degree in Early Child-hood Education compared to two in the previous program year. In addition, three teachers were enrolled in Baccalaureate Early Childhood Education or related field degree programs and two others

The Early Childhood System: Detailed Descriptions of Assets and Needs 24
held a Child Development Associate credential (Gila River Indian Community Head Start, 2009f).
Several education and certification programs are available near the Gila River Indian Community. The table below lists some of the available options.
Table 19. Available certification, credentialing or degree programs
SCHOOL DEGREE OR CERTIFICATE
CENTRAL ARIZONA COMMUNITY COLLEGE
Early Care and education (Transfer Pathway)
A.A.S. Early Childhood Education
Certificate in Early Childhood Education
ARIZONA STATE UNIVERSITY - TEMPEB.A.E. Early Childhood Education
B.A.E. Early Childhood Teaching and Leadership
NORTHERN ARIZONA UNIVERSITY (ONLINE PROGRAMS)B.A.S. in Early Childhood Education
M.Ed. in Early Childhood Education
Supporting Families
There are a number ways that families are supported within the Gila River Indian Community. These include family literacy programs, teen parenting programs, home visitation programs and programs offered to support families in crisis.
Family literacy programs are available at a number of locations in the Region. Programs are offered through early education settings such as Head Start and preschool programs, through Community services such as Women, Infants and Children and the Ira Hayes Memorial Library, and through exist-ing programs such as First Things First’s Parents as Teachers Program and Building Blocks for Healthy Children Program.
Teen Parents
Arizona ranks fifth highest nationally for teen births, with a birthrate 23 percent higher than the most recent national estimates; only two states in this country have a higher rate than Arizona’s (New Mexico and Nevada) (Guttmacher Institute, 2010). Teen pregnancy and parenting are important issues to address throughout the state because teen mothers and their babies face increased risks to their health and their opportunities to build a future are diminished. Teen mothers are more likely than mothers over age 20 to give birth prematurely (before 37 completed weeks of pregnancy) and to drop out of high school (National Campaign to Prevent Teen Pregnancy, 2010).15
Although the overall teen birth rate per thousand teenage girls in the Gila River Indian Community Region is comparable to the state rate (see Figure 6), there is a substantially larger proportion of births to teen mothers when compared to the total number of births in the Region (see Table 7). Also, there are portions of the Region (such as Sacaton) where the teen birth rate is far above the state average.
15 See also, Health: Pregnancies and Birth, below

The Early Childhood System: Detailed Descriptions of Assets and Needs 25
In order to obtain more detailed information about the supports for and challenges faced by this population, focus groups were conducted with teen parents and young adults in the Community. Topics of discussion included perceptions of teen pregnancy in the Gila River Indian Community at large, and the services and support available to teen parents.
The focus groups were conducted during Babypalooza, an event for teen parents held annually at the Vechij Himdag Mashchamakud School that offers a number of services including Readathon, devel-opmental screenings, and diabetes prevention information. The focus group questions can be found in Appendix C.
Seven fathers and eight mothers participated in two focus groups; one with fathers only and one with mothers only. Most of the teen parents were from Districts 3, 4 or 5, and their ages ranged from 15 to 24 years (there was only one 24 year old father who was in a relationship with a 19 year old mother). Five of the participants reported having at least one other child (sibling or other relative) under age 18 living in their home. In terms of educational attainment and employment, most focus group participants were in grades 9 to 11 and three were high school graduates. Over half of the participants were students, three were homemakers, and two were unemployed.
Teen Parent Focus Group Key Findings
• BothteenmothersandfathersbelievedthattheteenpregnancyrateishighintheRegion.Reasons for teen pregnancy cited by both included a lack of things for teens to do in the Community, a lack of information about sex and birth control, early experimentation with sex, and a lack of parental involvement in their lives.
• Manyoftheteenparentsalsohadparentswhogavebirthasteens,orhadextendedfamilymembers who had also had children as teenagers.
• Teenmothersoftenreportedthatinitiallytheythoughtbeingamomwouldbe“cool”,butafter the reality of being a teen parent sunk in, “it wasn’t cool anymore.”
• Althoughteenparentswereproudoftheirchildren,manyreportedtheyfelttheywerenotready to be parents at the time and worried about being able to financially support their chil-dren. They also worried about being able to complete school.
• Whenaskedwhatresourceswouldhelpreduceteenpregnancy,responsesincludedjobsinthe Region, and education about birth control.
• ManyoftheteenswereawareofresourcesavailableintheCommunitythatofferedsexeducation, such as the family planning bus and the clinic at the hospital, but stated that few teens used these resources, often because of embarrassment.
• Childcareatschoolswasmostcommonlymentionedasaneededresource,followedbysupport groups and increased awareness of programs and services that might be available in the Community.
Parents as Teachers Program
The “Parents as Teachers” (PAT) program16 is offered by the Gila River Health Care Corporation’s Prevention Department, supported by First Things First state grant funds. The PAT program is an ongoing weekly parenting program for pregnant and parenting teens at the Ira H. Hayes High School
16 Information on this program can be found at http://www.gilariver.org/index.php/news-cols4-colw1240-colw2240-colw3240-colw4240-gila-river-indian-news/121-july-2010-grin/1236-parents-as-teachers

The Early Childhood System: Detailed Descriptions of Assets and Needs 26
and VHM High School. The goal of the program is to support healthy parent and child relationships, while building developmentally appropriate parenting skills. The program also teaches pregnant and parenting teens the skills they need to parent in a positive way and to support the healthy physical and emotional development of their children.
Grandparents Raising Grandchildren
The number of grandparents parenting their grandchildren appears to be increasing across the state as well as within the Region. Grandparents come to care for their grandchildren for a number of rea-sons, including the sickness or death of a parent; substance use by parents; parental incarceration; to allow a child to remain in the community while a parent moves to look for work; and to support a teen parent, among others (Fuller-Thomson and Minkler, 2005; Weibel-Orlando, 1997). In the case of teen parents who are still in school, grandparents often take care of their grandchild to allow teen parents to continue their education.
There are a number of challenges grandparents may face in taking on the caregiving role for their grandchildren. One Community Elder interview 17 stated that if a child is placed in a grandparent’s care, there is nowhere to go for help including emergency diapers, formula and things a young child might need. She added that if there is a place, no one knows about it. Grandparents on fixed incomes may have financial issues with raising young children as well as limited physical abilities due to age and health issues such as diabetes. These grandparents could benefit not only from informa-tion about available services, but also from help with legal processes such as custody in order to qualify for services and benefits, including eligibility for childcare, and other social services.
Home Visitation Programs
Home visiting services can support families by providing timely and tailored parenting information and referrals.18 They can also promote optimal child health by providing screening and care coordina-tion, and by connecting parents with medical providers for prenatal, well baby visits and immuniza-tions. Currently there are several home visiting programs offered to families with young children in the Region.
The Department of Health Resources operates the Genesis Program which provides home visiting parent education and training to pregnant mothers and their children through age six. The program focuses on the prevention of diabetes and obesity and ensuring that children are healthy and ready for school. Genesis collaborates with two other tribal programs, the Purple Prenatal Clinic and Gila Crossing Prenatal Clinic, to identify pregnant mothers.
Through a grant from the Gila River Indian Community First Things First program, the Gila River Indian Community Behavioral Health Services has been able to expand home visitation services to children and families. Gila River Indian Community Behavioral Health Services operates a home visiting program, which offers a number of services to parents with children. In addition, Tribal Social Services provides home visitation services which focus on parent training, ages and stages, age appropriate discipline, and referral to family support programs.
Building Blocks for Healthy Children (BBHC) is offered through the Gila River Health Care Public Health Nursing Department, with a grant from the Gila River Indian Community First Things First Regional Partnership Council. BBHC works within the Community to provide educational material
17 See Appendix B for the interview guide18 The Vision for Early Childhood Home Visiting Services in Arizona, A plan of Action 2010-2015, Early Childhood Home Visiting Task
Force, April 2010

The Early Childhood System: Detailed Descriptions of Assets and Needs 27
and support relevant to child development, parenting skills, and health services as well as referral and service coordination.
Supporting Families in Crisis
The Gila River Community has identified that their proximity to the Phoenix metropolitan area has led to challenges for their youth and families, contributing to high levels of gang activity, juvenile delinquency and substance use (Gila River Indian Community Head Start Program, 2008). The Com-munity has recognized these issues and offers prevention services as well as services to support those in need.
The Department of Human Services provides outpatient addiction treatment services in three loca-tions in the Community with offices in Sacaton (District 3), Casa Blanca (District 5), and Komatke (District 6). In addition, the Community opened the Thwajik Ke (Healing House) Residential Treatment Center, which is located within District 6. The Center, which can house up to 82 residents, offers inpatient drug and alcohol treatment to Community members, and other American Indians, and, allows the children of residents to accompany parents into inpatient treatment. The Center, which provides both a source of treatment and a venue where children need not be separated from parents seeking help for substance abuse issues, is a strong asset in the Community.
Another source of support for families in crisis is in the planning stages. The Community is planning to open a Domestic Violence Shelter in the near future, which will assist families and children dealing with issues of domestic violence.
Tribal Social Services Child Protective Services (CPS) is the Community program mandated for the protection of children alleged to be abused or neglected. Referrals to CPS come from community members, family, schools, via telephone, police reports or walk-ins. Cases are transferred to case management after which a CPS worker monitors the progress of parents to ensure they are suc-cessful in completing court ordered services. Family services provided by CPS include both interven-tion and prevention services, Victims Assistance, foster care services, and parenting programs.
Data from the Gila River Indian Community Department of Tribal Social Services shows 101 children were served in foster care in 2009. Of these, 58 were identified as children with special needs. During the 2008-09 year, the Gila River Indian Community Head Start program reported that 13 of the children they served were in foster care. In 2007-08 this number was five children. The Gila River Indian Community Department of Tribal Social Services reports that the number of children being placed in residential foster care is increasing at a rapid rate. Other tribes are noting the need for foster care placements is growing beyond capacity (Arizona Department of Health Services, 2008).
Principal and Administrator Survey Results
The Principal and Administrator Survey (discussed in more detail in the Educational Indicators section) asked school administrators throughout the Region to report which of a list of services are available in their community to support families with young children. Almost all, 8 of 9 respondents, reported the following resources: WIC, Head Start program, Family and Child Education (FACE) programs (home and/or school based) and health resources. Seven administrators reported that child care programs, preschool programs and developmental screenings support families in their communities, and six indicated that parenting classes, mental health services, therapeutic services for developmental delays, and food boxes that includes baby formula were available in their com-munity to support young children and their families. Five reported family literacy programs as key community programs, four referenced licensed home based child care, and three indicated the Clothing Closet that offers maternity and young children’s clothing as an important support in their communities.
The Early Childhood System: Detailed Descriptions of Assets and Needs 28
Family and Community Survey
The First Things First Family and Community survey included several questions relevant to family support (First Things First, 2009). Question 19 on the survey asked parents in the 31 First Things First Regions about various sources of support they receive for raising children. Because of small sample sizes, First Things First combined all the responses of all participants from the ten Tribal Regions. The total sample for the Tribal Regions combined included 345 parents (it is unknown how many were from the Gila River Indian Community). Compared to the general statewide population, parents living in Tribal Regions reported relying less often on books, friends and neighbors, and spouses. Parents in the Tribal Regions were more likely to rely on telephoning nurses.
27th Arizona Indian Town Hall Recommendations
In 2007, the Arizona Commission of Indian Affairs held the 27th Arizona Indian Town Hall, with the theme of State of Indian Youth 2007: Strength in Youth, which brought together elected and appointed public and Tribal officials, policy advisors, community and business leaders, health and education leaders and youth to identify and build upon the numerous strengths of Indian youth and families, and to utilize these as catalysts for change. These recommendations may be useful to con-sider in the framework of strengthening the assets of the Gila River Indian Community. The recom-mendations from the Town Hall included:
o Train families on how to nurture healthy family behaviors, such as: being available, showing respect, teaching, nurturing, loving, motivating, instilling identity, discipline, listening, com-municating, nourishing, being a role model, protecting, supporting, be understanding, forgiv-ing, cooperating, develop unity, honor and integrity; building awareness of support networks
o Offer more options for parenting and life skills classes for all parents and guardians, with specific programs tailored for young people
o Offer more counseling services and classes from traditional spiritual leaders, elders, and others that focus on behavioral health
o Teach community-oriented native languages, culture, values and traditions, and ask elders to participate in teaching cultural-related activities
o Increase and expand communication between state/tribal/local entities to foster improved collaboration, implementation and planning of family-nurturing programs
Participants in the Town Hall also noted that community programs and events that reflected commu-nity and culture, required family involvement, included incentives and meals, and that were account-able to some entity were the most successful.
Health
Access to Care
The Gila River Indian Community is served by the Hu Hu Kam Memorial Hospital in Sacaton and the Komatke Health Center near Laveen. Both are operated by Gila River Health Care Corporation.
In 1995, the Gila River Indian Community assumed responsibility from IHS for the operation and management of both Hu Hu Kam Memorial Hospital and Gila Crossing Clinic (now the Komatke Health Center). The Gila River Indian Community formed a 501c(3) Tribal Health Corporation. This quasi-private sector model allows a more autonomous and independent relationship with the Tribe,
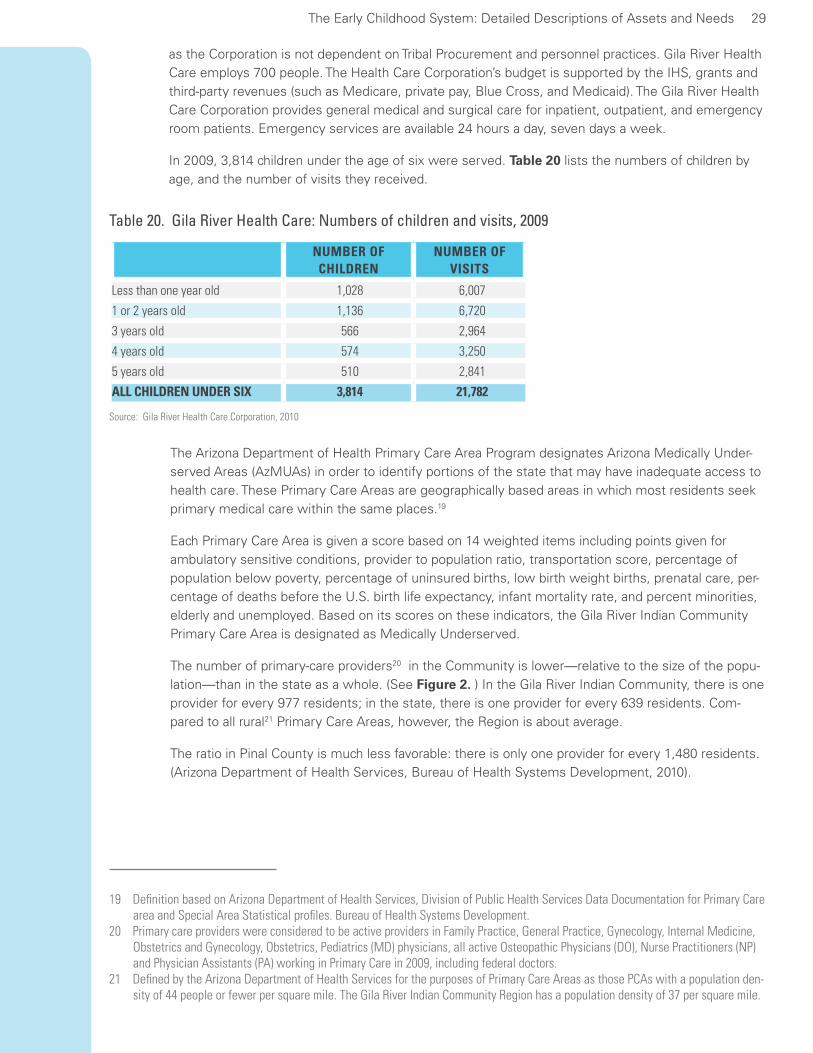
The Early Childhood System: Detailed Descriptions of Assets and Needs 29
as the Corporation is not dependent on Tribal Procurement and personnel practices. Gila River Health Care employs 700 people. The Health Care Corporation’s budget is supported by the IHS, grants and third-party revenues (such as Medicare, private pay, Blue Cross, and Medicaid). The Gila River Health Care Corporation provides general medical and surgical care for inpatient, outpatient, and emergency room patients. Emergency services are available 24 hours a day, seven days a week.
In 2009, 3,814 children under the age of six were served. Table 20 lists the numbers of children by age, and the number of visits they received.
Table 20. Gila River Health Care: Numbers of children and visits, 2009
Source: Gila River Health Care Corporation, 2010
NUMBER OF CHILDREN
NUMBER OF VISITS
Less than one year old 1,028 6,007
1 or 2 years old 1,136 6,720
3 years old 566 2,964
4 years old 574 3,250
5 years old 510 2,841
ALL CHILDREN UNDER SIX 3,814 21,782
The Arizona Department of Health Primary Care Area Program designates Arizona Medically Under-served Areas (AzMUAs) in order to identify portions of the state that may have inadequate access to health care. These Primary Care Areas are geographically based areas in which most residents seek primary medical care within the same places.19
Each Primary Care Area is given a score based on 14 weighted items including points given for ambulatory sensitive conditions, provider to population ratio, transportation score, percentage of population below poverty, percentage of uninsured births, low birth weight births, prenatal care, per-centage of deaths before the U.S. birth life expectancy, infant mortality rate, and percent minorities, elderly and unemployed. Based on its scores on these indicators, the Gila River Indian Community Primary Care Area is designated as Medically Underserved.
The number of primary-care providers20 in the Community is lower—relative to the size of the popu-lation—than in the state as a whole. (See Figure 2. ) In the Gila River Indian Community, there is one provider for every 977 residents; in the state, there is one provider for every 639 residents. Com-pared to all rural21 Primary Care Areas, however, the Region is about average.
The ratio in Pinal County is much less favorable: there is only one provider for every 1,480 residents. (Arizona Department of Health Services, Bureau of Health Systems Development, 2010).
19 Definition based on Arizona Department of Health Services, Division of Public Health Services Data Documentation for Primary Care area and Special Area Statistical profiles. Bureau of Health Systems Development.
20 Primary care providers were considered to be active providers in Family Practice, General Practice, Gynecology, Internal Medicine, Obstetrics and Gynecology, Obstetrics, Pediatrics (MD) physicians, all active Osteopathic Physicians (DO), Nurse Practitioners (NP) and Physician Assistants (PA) working in Primary Care in 2009, including federal doctors.
21 Defined by the Arizona Department of Health Services for the purposes of Primary Care Areas as those PCAs with a population den-sity of 44 people or fewer per square mile. The Gila River Indian Community Region has a population density of 37 per square mile.

The Early Childhood System: Detailed Descriptions of Assets and Needs 30
Figure 2. Ratio of population to primary health care providers
Source: Arizona Department of Health Services, Bureau of Health Systems Development, 2010
Pregnancies and Births
According to the Arizona Department of Health Services (2009) 277 babies were born to women who lived in the Region during 2008.
Most of the mothers were aged 20 to 34 (66%), unmarried (80%), and had 9 to12 years of education (75%). The demographic characteristics of women giving birth in the Gila River Indian Community are similar to those of all Arizona American Indian women who gave birth that year. A detailed table of the demographic characteristics of the new mothers in the Region and across the state can be found in Appendix A.
Because the Gila River Indian Community Region is relatively sparsely populated, data from any one year for rare occurrences (such as births) tend to be unreliable because of small sample sizes. There-fore, the data illustrated below are averages of the rates across a number of years (1999 to 2008). These data are based on the Gila River Indian Community Primary Care Area, described above. For comparison, they include the State average, the Pinal County average, as well as the average for other less populated (rural) areas of the State. Data for the community of Sacaton are shown when available.
The birthrate in the Gila River Indian Community Region is slightly lower than the state as a whole, and equal to the rate in all rural areas combined (Arizona Department of Health Services, Bureau of Health Systems Development, 2010). The community of Sacaton, however, has a rate about three times higher than that for the entire Community.
977
639
889
1,480
Gila River
Arizona
Rural Arizona Pinal
County

The Early Childhood System: Detailed Descriptions of Assets and Needs 31
Figure 3. Birth rate per thousand residents (1999-2008 average)
Source: Arizona Department of Health Services, Bureau of Health Systems Development, 2010
Many of the risk factors for poor birth and neonatal outcomes can be mitigated by good prenatal care, which is most effective if delivered early and throughout pregnancy to provide risk assessment, treatment for medical conditions or risk reduction, and education (Centers for Disease Control and Prevention & Health Resources and Services Administration, 2010b). Care should ideally begin in the first trimester, and the American College of Obstetrics and Gynecology recommends at least 13 prenatal visits for a full-term pregnancy; seven or fewer prenatal care visits are considered an “inad-equate” number (American College of Obstetricians and Gynecologists, 2002).
Expectant mothers in the Gila River Indian Community receive first trimester prenatal care at a slightly higher rate (79%) as all women in the state or in Pinal County (77%). The Community com-pares even more favorably with all rural areas (74%).All of these rates, however, are lower than the Healthy People 2010 target of 90 percent of pregnant women receiving prenatal care in the first trimester.
Figure 4. Percent of births with prenatal care during the first trimester (1999-2008 average)
Source: Arizona Department of Health Services, Bureau of Health Systems Development, 2010
14
47
16
14
16
Gila River Indian Community
Sacaton
Arizona
Rural Arizona
Pinal County
79%
80%
77%
74%
77%
90%
Gila River Indian Community
Sacaton
Arizona
Rural Arizona
Pinal County
Healthy People 2010 Target

The Early Childhood System: Detailed Descriptions of Assets and Needs 32
Although they are more likely to receive first trimester care, expectant mothers in the Gila River Indian Community Region are somewhat less likely to receive an adequate number of prenatal care visits across their entire pregnancy compared to the statewide average. The proportion of those receiving between 0 and four prenatal visits (7.6%) is slightly higher than in state as a whole (6.5%), and comparable to other rural areas in the state (See Figure 5. ). The rate does not exceed the 10 percent Healthy People target for less than adequate numbers of visits, though that target rate is probably somewhat high for the comparison to available data22 .
22 The Healthy People 2010 Maximum shown is based on the Adequacy of Prenatal Care Utilization Index (APNCU) that compares actual prenatal use to the recommended number of visits based on the month of initiation of care and the length of the pregnancy. The target is 90 percent of visits to be in the adequate or adequate plus range, so that only 10 percent of pregnancies are in the intermediate to inadequate range. Ideally, many fewer than 10 percent would fall into the inadequate range alone, but no specific target is provided. The ADHS PCA Statistical Profile indicator rates available and presented here, however, are for four or fewer prenatal care visits per 1000 births, which would fall into the inadequate range.
Figure 5. Percent births with fewer than five prenatal care visits (1999-2008 average)
Source: Arizona Department of Health Services, Bureau of Health Systems Development, 2010
Teenage parenthood is associated with a number of negative outcomes for infants, including neona-tal death, sudden infant death syndrome, child abuse and neglect, as well as putting infants at risk for behavioral and educational problems later (Office of Population Affairs, 2010). In addition, teen-aged mothers are less likely to get or stay married, less likely to complete high school or college, and more likely to require public assistance and to live in poverty than their peers who are not mothers (see also Supporting Families: Teen Parents, above). The rate of births to teen mothers in the Gila River Indian Community, Primary Care Area overall (37 per 1,000 females 14-19 years old) was lower than the rates for Arizona (39 per thousand), Pinal County (41), and all rural areas (38). The rate for Sacaton, however, is nearly five times the rate for the Community as a whole. In addition, the propor-tion of total births in the Community that are to teen mothers is 26 percent, compared to 12 percent in the state as a whole (see Table 7, above). Teen pregnancy and teen birth continues to be a state-wide issue, as well as an issue for the Community.
7.6%
7.4%
6.5%
7.2%
8.1%
10%
Gila River Indian Community
Sacaton
Arizona
Rural Arizona
Pinal County
Healthy People 2010 Target

The Early Childhood System: Detailed Descriptions of Assets and Needs 33
The proportion of low-birth-weight births in the Community is comparable to the proportions seen in the state as a whole. Both, however, are higher than the Healthy People 2010 target of 5 percent. (See Figure 7. )
Figure 6. Teen births per thousand females, ages 14 to 19 (1999-2008 average)
Source: Arizona Department of Health Services, Bureau of Health Systems Development, 2010
Figure 7. Percent low-birth-weight (5 lb, 8 oz or less) births (1999-2008 average)
Source: Arizona Department of Health Services, Bureau of Health Systems Development, 2010
The rate of uninsured births (defined as self pay or ‘unknown’ payee in the Vital Statistics birth record) in the Region (2.3%) was much lower than in the state as a whole (4.3%). This should be considered an asset, especially when compared to the rate in all rural areas: over 5 percent of those births are uninsured.
Figure 8. Percent of uninsured births (1999-2008 average)
Source: Arizona Department of Health Services, Bureau of Health Systems Development, 2010
37
154
39
38
41
43
Gila River Indian Community
Sacaton
Arizona
Rural Arizona
Pinal County
Healthy People 2010 Target
7.2%
7.3%
7.1%
7.1%
6.9%
5%
Gila River Indian Community
Sacaton
Arizona
Rural Arizona
Pinal County
Healthy People 2010 Target
2.3%
1.7%
4.3%
5.2%
3.6%
Gila River Indian Community
Sacaton
Arizona
Rural Arizona
Pinal County

The Early Childhood System: Detailed Descriptions of Assets and Needs 34
Health Care Coverage
Members of the Gila River Indian Community receive health insurance coverage through the Indian Health Service (IHS), the Arizona Health Care Cost Containment System (AHCCCS or Arizona’s Med-icaid) and privately through their employers.
All children who are enrolled members of a federally recognized tribe such as the Gila River Indian Community can have medical coverage through the IHS.
In 2009, 24 percent of Gila River Indian Community residents (of all ages) were enrolled in AHCCCS. (Source: Gila River Indian Community PCA Statistical Profile 2009). This percentage is slightly higher than the 21 percent of all state residents who are covered by AHCCCS.
Pediatric Dental Care
Young children’s oral health is an important component of their physical health. If oral health suffers, children’s ability to learn and grow can be impacted. Early tooth loss from dental decay can result in failure to thrive, speech development impairments, school absence, an inability to concentrate in school and reduced self esteem (Office of Population Affairs, Department of Health and Human Services, 2010)
Children birth to five can access oral health services at the Gila River Health Care. In 2008, 1,388 chil-dren age 1-5 received oral health screenings. In 2009, 774 children received screenings. In addition, 34 children ages 3-5 received fluoride varnish.23
The Gila River Indian Community Head Start program facilitates delivery of dental screening for enrolled preschool children. The table below shows that approximately two-thirds of children enrolled in Head Start completed oral health exams in both program years. Fewer enrolled children had a dental home in the 2008-2009 program year than in the preceding year.
23 Data provided by the Gila River Health Center24 Indian Health Service immunization data for the Region are not included in this report.
Table 21. Head Start children and dental care
Source: Gila River Indian Community Head Start, 2009d
PROGRAM YEAR 2007-2008 2008-2009
Number of children enrolled 245 266
Children with a dental home (with continuous accessible dental care by the end of the enrollment year) 66% (162) 41% (110)
Children completing oral health examination 65% (159) 68% (180)
Immunizations
Maintaining high vaccine coverage rates in early childhood is the best way of preventing the spread of certain diseases in childhood, and provides a foundation for controlling these diseases among adults, as well. Therefore, Healthy People 2010 sets targets of 90 percent vaccination coverage among young children (19-35) and 95 percent for those in childcare and kindergarten (Office of Popu-lation Affairs, Department of Health and Human Services, 2010).
Immunization rates for the Gila River Indian Community are considerably lower than the Arizona rate and the U.S. rate based on data from the Arizona Department of Health Services.24 In Arizona, the rate for childhood immunizations is 73 percent (Arizona Department of Health Services, 2010). The

The Early Childhood System: Detailed Descriptions of Assets and Needs 35
U.S. immunization rate is 78 percent. For the two zip codes used to represent the Community, rates for 2007 and 2009 are shown in Table 22. Based on the data available, children were less likely to have been immunized in 2009 than in 2007.
Table 22. Percent of children with up-to-date immunizations
Source: Arizona Department of Health Services, Bureau of Epidemiology and Disease Control, Arizona Immunization Program Office. Data provided by Arizona First Things First.
CHILDREN 19 TO 35 MONTHS, IN ZIP CODE 85221 OR 85247
CHILDREN IN HEAD START
2007 13% 82%
2009 5% 99%
Data available from the Health Services Program Information Reports for Gila River Indian Com-munity Head Start (in Table 23, below) shows children in Head Start had much higher immunization rates than the general population of Community children (Gila River Indian Community Head Start, 2009d); by 2009 they exceeded the Healthy People 2010 target rates. Head Start children are older than children represented in the data from the Arizona Department of Health Services. The high up-to-date immunization rates among children in Head Start indicate that children who are enrolled in early care and education programs are more likely to catch up with their immunizations. It is hoped that the new Early Head Start programs being planned in the Community will help to increase immu-nization rates for younger children within the Region.
Table 23. Percent of children with up-to-date immunizations
Source: Arizona Department of Health Services, Bureau of Epidemiology and Disease Control, Arizona Immunization Program Office. Data provided by Arizona First Things First.
CHILDREN IN GILA RIVER INDIAN COMMUNITY HEAD START
2007 82%
2009 99%
Diabetes
The prevalence of Type 2 diabetes has increased dramatically in the United States during the later part of the 20th century, particular among American Indians (US Department of Health and Human Services, 2007). The Gila River Indian Community has one of the highest rates of diabetes in the world. Data from 2010 show a total of 19,912 enrolled members of which 7000 (35%) have a diag-nosis of diabetes from the hospital or clinic25 . In addition, 22 children under the age of 18 have a diagnosis of diabetes. Of those 7 (32%) have Type 1 diabetes and 15 (68%) have Type 2. 26
For over 30 years, the Gila River Indian Community has participated in a longitudinal study through the National Institutes of Health. Among numerous findings, the study has identified a non-genetic cause of diabetes, the diabetic intrauterine environment. Children of women with diabetes during
25 Gila River Indian Community Genesis Program, 6/10/1026 Gila River Health Care, 2010

The Early Childhood System: Detailed Descriptions of Assets and Needs 36
pregnancy have a higher risk of becoming obese and getting diabetes earlier in life than those born to mothers who had normal blood sugar during pregnancy but developed diabetes later. Apart from any genetic tendency the children may have inherited, those exposed to high blood sugar in the uterus had an added risk for unhealthy weight and diabetes at a younger age (US Health and Human Ser-vices Department, 2010).
Local efforts to combat the high diabetes rates are in place and include the Genesis Program, which provides diabetes education and prevention services for children under the age of six, their parents, and to pregnant/breast feeding mothers throughout the Gila River Indian Community. Genesis is will-ing to provide these services in a client’s home, their back/front yard, school, district service center, clinic, program, department or whatever other location a client might prefer. The program recently began publishing a newsletter to educate community members about the program, nutrition and exercise. In addition to administration and support, Genesis staff includes Diabetes Prevention Spe-cialists, Lactation Specialists, and a Nutritionist.
There are 1,814 children six and under who are enrolled in the Genesis Program. Parents of children enrolled in the Genesis Program are provided diabetes prevention awareness materials and through hands-on activities, participate in physical exercise classes and nutritional food demonstrations on the schools’ premises. Services are also provided through home visits and parent night meetings. Fifty-eight percent of children under age six enrolled in the Genesis program currently are qualified as overweight or obese, while two years ago, 76 percent were considered overweight or obese.27 For this report it is unclear whether children experiencing a reduction in obesity are the same children.
Infant Mortality
In 2007 within the Gila River Indian Community, there were six deaths of children birth to four, only one of whom was of a child between the ages of one to four. In 2008, five children between the ages of birth to four years died. Causes included conditions that originated in the perinatal period, congenital malformations, sudden infant death, accident, and disease (Arizona Department of Health Services, 2008; 2009).
Developmental Screenings and Services for Children with Special Develop-mental and Health Care Needs
The Arizona Child Find program is a component of the Individuals with Disabilities Education Act (IDEA) that requires states to identify and evaluate all children with disabilities (birth through age 21) to attempt to assure that they receive the support and services they need. Children are identi-fied through physicians, parent referrals, school districts and screenings at community events. The National Survey on Children with Special Health Care Needs estimated that 7.9 percent of children from birth to five in Arizona have special health care needs, defined broadly as “those who have or are at increased risk for a chronic physical, developmental, behavioral, or emotional condition and who also require health and related services of a type or amount beyond that required by children generally” (U. S. Department of Health and Human Services, Health Resources and Services Admin-istration, Maternal and Child Health Bureau, 2008).
The Arizona Department of Economic Security, Division of Developmental Disabilities (DDD) provides screening and services for young children with developmental delays and those “at risk” of delays. According to the DDD, “Children under the age of six years old may be eligible if there is a strongly demonstrated potential he/she has or will have a developmental disability. Any child from birth to
27 Gila River Indian Community Genesis Program, 6/10/10

The Early Childhood System: Detailed Descriptions of Assets and Needs 37
36 months who has a developmental delay or who has an established condition, which has a high probability of resulting in a developmental delay, as defined by the State, may be eligible for supports and services. A child who has a developmental delay is defined as a child who has not reached fifty percent of the developmental milestones expected at his/her chronological age in one or more of the following areas of child development: physical, cognitive, language/communication, social/emotional, and adaptive self-help. An established condition is defined as a diagnosis of a physical or mental condition which has a high probability of resulting in a developmental delay” (Arizona Department of Economic Security, Division of Developmental Disabilities, 2010).
Screening and evaluation for children from birth to three are provided by the Arizona Early Interven-tion Program (AzEIP), who also provide services or make referrals to other appropriate agencies (e.g. for Division of Developmental Disabilities case management). Families who have a child who is determined to be eligible for services work with the service provider to develop an Individualized Family Service Plan, that identifies family priorities, child and family outcomes desired, and the ser-vices needed to support attainment of those outcomes.
AzEIP providers can offer, where available, an array of services to eligible children and their fami-lies, including assistive technology, audiology, family training, counseling and in home visits, health services, medical services for diagnostic or evaluation purposes, nursing services, nutrition, occu-pational therapy, physical therapy, psychological services, service coordination, social work, special instruction, speech-language therapy, vision services and transportation (to enable the child and family to participate in early intervention services). The AzEIP service provider for Pinal County is the Easter Seals Blake Foundation.
The Gila River Indian Community Office of Planning and Evaluation and Early Childhood Special Services shows six percent of all children aged birth to five in the Community have special needs. Across Districts, the percentage of children identified with special needs is from two percent to 12 percent. Of the 81 children with special needs, most have communication delays (see table below).
Table 24. Special needs by type and age range
Source: Gila River Indian Community Head Start Program Community Assessment 2008-2011
AGE RANGE SPECIAL NEED PERCENTLess than two years old Communication Delay 40%
Developmental Delay 30%
Other 30%
Two or three years old Communication Delay 77%
Motor Skills and Communication Delay 11%
Developmental Delay 6%
Other 6%
Four or five years old Communication Delay 75%
Motor Skills and Communication Delay 25%
Screening and therapy services are provided by the Gila River Early Childhood Special Services (ECSS). ECSS is a Community program for families with children birth to five who may have disabili-ties and developmental delays. Early Childhood Special Services provides support to families through educating and providing developmental services to their children to help them reach their full poten-tial. Services for children can include: Hearing and vision checks, physical, occupational, and speech and language therapy, activities geared to help develop learning skills, activities to help social and emotional development, continuing services at age three as the child moves on to school, supportive childcare providers or preschool teachers of enrolled children. Family services can include: Parent

The Early Childhood System: Detailed Descriptions of Assets and Needs 38
trainings, access to support groups, and family services, coordination of district wide agencies that provide social and health services, in home and community settings.
Currently, there are many challenges for the Gila River Indian Community to reach and serve children with special needs. In particular, Speech, Physical, and Occupational Therapists are in short supply and more acutely so in rural areas of the state than others.
Head Start Enrollees Health Care and Screening
For those young children enrolled in the Gila River Indian Community Head Start, data is available on a number of health and screening indicators. The table below provides a summary of health-related information for those children enrolled in Head Start during the 2007-2008 and 2008-2009 program years (Gila River Indian Community Head Start, 2009b). Changes between program years can be seen for a number of health indicators. It is not clear why the number of children enrolled in Head Start with health insurance dropped so steeply between program years. This drop, however, is likely the reason for the decrease in the number of children with a medical home in the 2008-2009 pro-gram year.
Table 25. Health characteristics of Head Start enrollees
Source: Gila River Indian Community Head Start, 2009b
PROGRAM YEAR 2007-2008 2008-2009
Number of children enrolled 245 266
Children up to date on a schedule of preventive and primary health care 56% 100%
Children diagnosed as needing medical treatment 50% 29%
Children with health insurance 83% 42%
Children with a medical home 76% 24%
Children with up-to-date immunizations 88% 100%
Head Start also tracks data on the number of children in the program who have developmental delays and an Individualized Education Plan (IEP). Approximately 10 percent of children enrolled in the Gila River Indian Community Head Start in the last two reporting years available were children with special educational needs and had an IEP. This information for the 2007-2008 and 2008-2009 program years can be found in the table below (Gila River Indian Community Head Start, 2009e). (Please note that some reporting categories changed slightly between reporting years).
Table 26. Head Start children diagnosed with special needs
Source: Gila River Indian Community Head Start, 2009e
PROGRAM YEAR 2007-2008 2008-2009
Number of children enrolled 245 266
Children determined to have disabilities or with an IEP 24 (10%) 26 (10%)
Children determined to have disabilities prior to enrollment 13 (5%) n/a
Children with an IEP and determined eligible for services prior to enrollment year n/a 13 (5%)
Children determined to have disabilities during enrollment 11 (4%) n/a
Children with an IEP and determined eligible for services during enrollment year n/a 13 (5%)
Primary disability: speech impairment 13 (5%) 15 (6%)
Primary disability: non-categorical/developmental delay 11 (4%) 11 (4%)

The Early Childhood System: Detailed Descriptions of Assets and Needs 39
Children Birth to 5 Receiving Hearing and Vision Screenings
Table 26 shows data from Gila River Early Childhood Special Services indicating screenings con-ducted in 2009:
Table 27. Hearing and vision screenings 2009
Source: Gila River Health Care Corporation, 2010
AGE CHILDREN SCREENED
CHILDREN RECEIVING SPEECH OR OCCUPATIONAL
THERAPYBirth to 3 years old 156 0
3 to 5 years old 256 67
Data from Gila River Health Care, School Health Services, shows the following screenings conducted during the 2009-10 school year on children who attended early care centers/preschools/Head Start:
Table 28. Screenings 2009-2010 school year for Children aged 0-5 attending pre-k / Head Start
Source: Gila River Health Care Corporation, 2010
SCHOOLSTUDENTS SCREENED
FOR HEARINGSTUDENTS SCREENED
FOR VISIONBlackwater Elementary School D1 73 73
Casa Blanca Community School D5 25 25
Gila Crossing Community School D6 35 35
Gila Crossing School (preschool kids) D6 41 41
GRIC Head Start D3-6 200 200
St. Peters Indian Mission School D5 18 18
Sacaton Elementary School D3 42 42
Sacaton Middle School D3 0 0
TOTAL 434 434

The Early Childhood System: Detailed Descriptions of Assets and Needs 40
Public Awareness & CollaborationIn order to begin to examine how parents in various Regions of the State understand early childhood development, First Things First included an item on their Family and Community Survey (First Things First, 2009) that asked parents how they perceived the effects of changes in childcare providers. Compared to the general statewide population, relatively more parents for the ten Tribal Regions combined considered changes in childcare providers to have a positive effect on an infant’s develop-ment. Less than half of the parents in the Tribal Regions (compared to nearly three-quarters of the statewide sample) expected frequent changes to harm an infant’s development.
Table 29. Data from the Family and Community Survey
How do frequent changes in childcare providers impact an infant’s development?
NUMBER OF PARENTS AND COMMUNITY
MEMBERS
FREQUENT CHANGES ARE
POSITIVE
FREQUENT CHANGES HAVE NO
IMPACT
FREQUENT CHANGES ARE
NEGATIVE
Ten Tribal FTF Regions 345 26% 16% 48%
All 31 FTF Regions 5,193 9% 9% 74%
Source: FTF Family and Community Survey, 2009
Disseminating information on childhood development and early childhood programs is an important way to educate parents about health development. There are a number of ways that early childhood programs publicize information on early childhood programs in the Gila River Indian Community Region. The Tribal Newspaper, the Gila River Indian News, includes Community news, Community activities, program information and education and other related information. This newspaper is published monthly and is also available online. In addition, the Genesis Program has recently begun publishing a newsletter. The newsletter includes information about the program, program activities, as well as information on upcoming events. The first newsletter was published in June, 2010. Other methods for disseminating information include community bulletins, community groups and commu-nity meetings.
System Coordination
The Principal and Administrator Survey (discussed in more detail in the Educational Indicators sec-tion) asked school administrators throughout the Region to rate existing interagency efforts to col-laborateandcoordinateservicesforchildrenages0–5.Threeofninerespondentsagreedwiththestatement that collaborative efforts are strong, with elements of service coordination. Two of nine instead reported that collaboration is good and with work towards service coordination. Two others report that agencies have a good networking relationship, but that service coordination is very lim-ited, and the final two reported that the collaboration between agencies is very limited. Administra-tors were given the opportunity to provide comments and one indicated that it would be helpful for Tribal Special Services to inform the schools of personnel changes.
These results suggest that there is room for improving the degree of collaboration and communi-cation among agencies to better serve children aged 0-5 and their families. The Gila River Indian Community is currently addressing issues of coordination and communication for services for school-aged children, and those transitioning to school, through implementation of the Coordinated

The Early Childhood System: Detailed Descriptions of Assets and Needs 41
School Health Model, based on the Center for Disease Control and Prevention model28 . Application of this model has the goal of improving coordination and communication across departments with the overarching purpose of creating a school environment that enables students to learn, teachers to teach and principals to lead more effectively. Currently a School Health Advisory Council is working to integrate the components of Health Services, Mental Health Services, Physical Education, Food and Nutrition, Health Education, Community Involvement, and School Environment.
Expanding such a model across agencies that serve younger children in order to coordinate services and communicate information among agencies, could be fruitful.
28 Model overview documents “The Ten Component Coordinated School Health Model” and “Coordinated School Health Benchmarks” provided by the Gila Indian River Community Regional Coordinator.

Summary and Conclusion 42
Summary and Conclusion
This Needs and Assets Report is the second biennial assessment of early education and health ser-vices in the First Things First Gila River Indian Community. Through both quantitative data assembled, and through qualitative work with Community members, it is clear that the Community has substan-tial strengths. These include strong FACE and Head Start programs that provide high quality care and early education services to children in the area; extensive health services including hospital, pedi-atric dental, and diabetes prevention services; and Tribal support services such as home visitation programs and an in-patient substance abuse treatment facility. A table containing a full summary of identified Regional assets can be found in Appendix G.
However, there continues to be substantial challenges to fully serve the needs of young children throughout the Region. Many of these have been recognized as ongoing issues by the Gila River Indian Community Regional Partnership Council and are being addressed by current First Things First-supported strategies in the Community. Some of these needs, and the strategies proposed to deal with them, are highlighted below. A table of Gila River Indian Community First Things First Regional Partnership Council planned strategies for fiscal year 2011 is provided in Appendix H.
• Supporting early care and education–ThreestrategiesintheCommunityarefocusingonthis crucial area. To address the challenge of quality care, one strategy will provide support to increase the numbers of highly skilled and well prepared workers in the early childhood development and health workforce. Another strategy will focus on expanding access to early childhood educational programs and services serving infants and toddlers. The third strat-egy will aim to decrease the number of children on waiting lists through expanding existing summer pre-kindergarten programs.
• Expanding access to prenatal care and health care for children birth to five–Althoughhealth services exist in the Region, increased services targeted towards pregnant women and their young children are still needed. Expanded services planned include preventive, screening and follow-up services for health, dental, vision and hearing care. In addition, increasing access to educational training, referral and follow-up, and resources for high risk populations is a priority.
• Improving coordination of services –Animportantgoalin2011istoincreasecoordinationamong state, federal, and local organizations to improve the coordination and integration of regional programs, services, and resources for young children and their families in the Region.
• Increasing literacy–AnothergoaloftheCommunityistoexpandlanguageandliteracyprograms available to members of the Community.
This report also highlighted some additional needs that could be considered as targets by stakehold-ers in the Region.
• Continue to preserve, strengthen and sustain diabetes-related interventions –Thehighrates of diabetes within the Community and the association between gestational diabetes and the development of diabetes in children, illustrates the need to continue and expand ser-vices that reach out to Community members on issues of proper nutrition, diabetes preven-tion and education. Excellent programs currently exist in the Region that could be expanded to target more parents and children in need.
• Expand services for teen parents–Helpingteenparentsstayinschoolbyproviding

Summary and Conclusion 43
in-school child care would be highly beneficial at increasing graduation rates. The negative impact that unplanned teen births can have on the life of a teen mother and the health and welfare of a child, can be improved if teens are able to stay in school and graduate.
Research shows that without support to stay in school teen mothers are likely to drop out and 1 in 4 teen mothers will have a second child before age 20. Teen pregnancy is closely linked to a host of other critical social issues — welfare dependency and overall child well-being, out-of-wedlock births, responsible fatherhood, and workforce development. Teen childbearing not only has serious conse-quences for teen parents, their children, and society; it also has important economic consequences.
Programs that encourage and provide prenatal care for expectant teen mothers, as well as educa-tion and support to enable them to care well for their infant, continue to be needed. Programs that emphasize involving and educating teen fathers would also help strengthen and stabilize young families. In addition, although teen pregnancy prevention programs are available, these may need to provide more outreach, because teens report being “too embarrassed” to seek them out. There are other programs which may be helpful in decreasing the teen pregnancy rate and include mentorship programs such as Pathways to Heath, lead by School Health Nursing Program and added extracur-ricular activities for teens.
• Child care, screening and services for children from birth to three- Although the avail-ability of quality, collaborating services for children from three to five is a strength of the Region, there are gaps in meeting the needs of infants and children from birth to three. Immunization rates among children in this age range are very low; improving these can help protect against a number of diseases affecting young children. Facilitating the early identification of children with special health and developmental needs and assuring that they have early intervention can better prepare them for preschool development and learning. The planned Early Head Start program is a step in this direction, but additional efforts to reach all young children in the Community may be needed.
• Strengthening supports for families in the child welfare system–Thereisacommitmentin the Region to supporting families in crisis. Additional resources for supporting foster families and other relatives raising children would be helpful in this goal.
Although the dire economic climate in the State presents challenges for families across the rural areas, the Gila River Indian Community has some substantial strengths. Leveraging these strengths through increased coordination and collaboration can help those in the Community respond cre-atively to these challenges and support the health, welfare and development of the families and young children who live there.
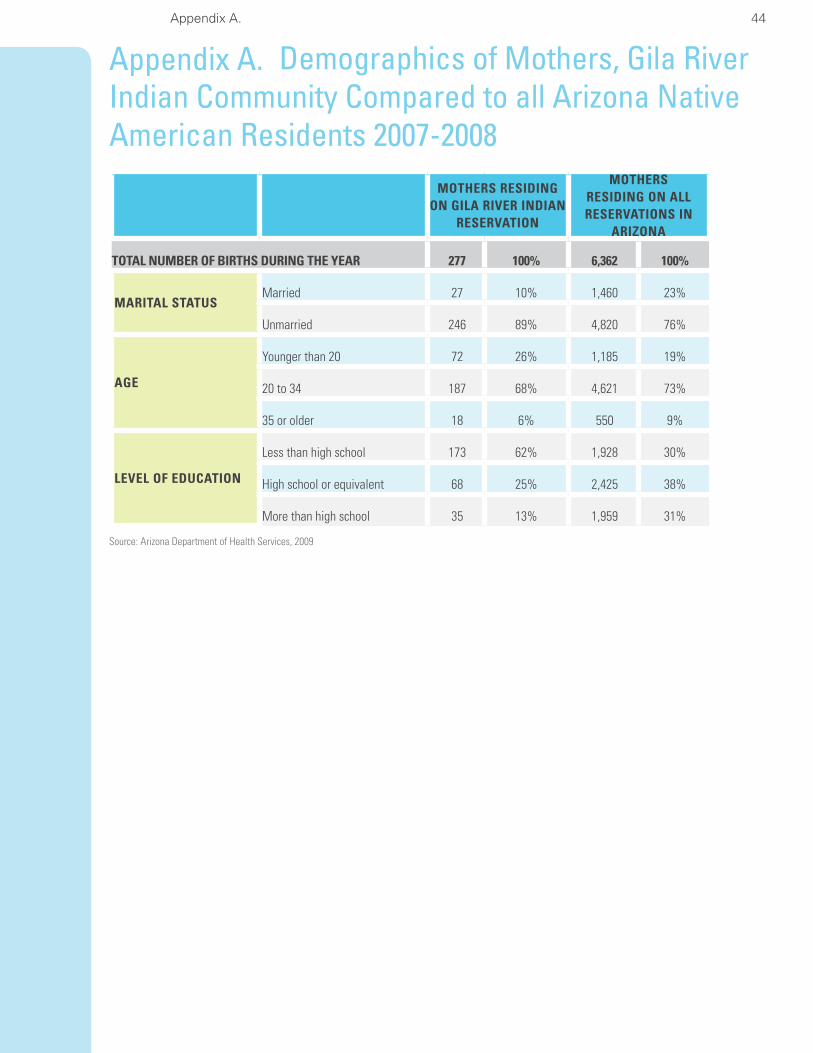
Appendix A. 44
Appendix A. Demographics of Mothers, Gila River Indian Community Compared to all Arizona Native American Residents 2007-2008
Source: Arizona Department of Health Services, 2009
MOTHERS RESIDING ON GILA RIVER INDIAN
RESERVATION
MOTHERS RESIDING ON ALL RESERVATIONS IN
ARIZONA
TOTAL NUMBER OF BIRTHS DURING THE YEAR 277 100% 6,362 100%
MARITAL STATUSMarried 27 10% 1,460 23%
Unmarried 246 89% 4,820 76%
AGE
Younger than 20 72 26% 1,185 19%
20 to 34 187 68% 4,621 73%
35 or older 18 6% 550 9%
LEVEL OF EDUCATION
Less than high school 173 62% 1,928 30%
High school or equivalent 68 25% 2,425 38%
More than high school 35 13% 1,959 31%

Appendix B. Interview Guide for Case Study with Gila River Indian Community Grandmother 45
Appendix B. Interview Guide for Case Study with Gila River Indian Community Grandmother
An interview was conducted with a grandmother who belongs to the Gila River Indian Community to learn about what her thoughts were on teen pregnancy in the community in general and the circum-stances of grandparents taking care of grandchildren in particular.
1. As a grandparent of a young child, in what ways does your community support you and your family?
a. What resources are available for you and your family?
i. What do you find most beneficial about these resources?
ii. What are some of the deficits in these resources?
iii. In an ideal world, what would be available to you?
1. How would these look?
2. How would these resources be delivered?
3. Where would they be located?
4. How would you find out about them?
2. Of the programs designed to meet the needs of young children that exist in your community, what do you like the best about them?
b. Why do you think these programs are working?
c. Likewise, if you could, what changes would you make to these programs?
3. When thinking of the quality of programming your grandchild is exposed to, is there value for your money?
d. What is the cost of care for your child?
e. Is your care subsidized?
f. What percent of income is taken up in child care related costs?
4. For parents and grandparents with young children, what child care opportunities are available for parents who work various shifts?
g. Day shift
h. Swing shift
i. Graveyard shift
5. How are teen parents and their young children supported in your community?
j. What types of services are available for them?

Appendix B. Interview Guide for Case Study with Gila River Indian Community Grandmother 46
i. What do these services offer?
ii. Are they developmentally appropriate and meet the needs of teen parents?
1. How do they meet the needs of the young children?
k. What types of services do teen parents need that are not available in your community?
6. Do you think Gila River has a high teen pregnancy rate?
l. How high do you think the pregnancy rate is in your community?
m. Is this rate normal for this community?
7. Are these pregnancies with other Gila River tribal members?
a. With youth from other tribes?
b. What about youth from the outside community, like Phoenix, Coolidge, Casa Grande, etc?
8. In your opinion, what does the Community think about teen pregnancy?
9. What crossed your mind when you learned your teen would become a parent?
10. In your Community, what do you think would help teens delay having babies?
n. What do teens do to keep busy?
o. At what age do you think teens begin experimenting with sex in your Community?
p. What do teens in your Community think about birth control?
q. Where does a teen in your Community go for accurate information on birth control information?
r. Where does a teen in your Community go for birth control?
11. Are there medical providers or a clinic where teens can access services confidentially?
12. What do you think is the most challenging thing about your teen having a baby?
13. How has having a baby changed your teen’s life?
s. How has it changed your life?

Appendix C. Gila River Indian Community Focus Group Questions for Teen Parents 47
Appendix C. Gila River Indian Community Focus Group Questions for Teen ParentsFocus Group Questions for Teen Parents
1. How do you feel about the number of teen pregnancies in Gila River?
2. Why do you think Gila River has a high teen pregnancy rate?
3. Are these pregnancies with other Gila River tribal members?
• Withyouthfromothertribes?
• Whataboutyouthfromtheoutsidecommunity,likePhoenix,Coolidge,CasaGrande, etc?
4. In your opinion, what does the Community think about teen pregnancy?
5. What do your parents and family say when they learn about a teen pregnancy in your Community?
a. Were your parents teen parents?
b. Do you have siblings who were teen parents?
c. What about your extended family, for example, your aunts, uncles, cousins, were they teen parents?
Probe for a percent
1. If high percent, “that’s a high percentage, do you think becoming a teen parent in your family is normal?”
6. What do teens think about becoming teen parents?
7. In your Community, what do you think would help teens delay having babies?
a. What do teens do to keep busy?
b. At what age do you think teens begin experimenting with sex in your Community?
c. What do teens in your Community think about birth control?
d. Where does a teen in your Community go for accurate information on birth control information?
e. Where does a teen in your Community go for birth control?
8. Are there medical providers or a clinic where teens can access services confidentially?
9. What do you think the most challenging thing is about having a baby?
10. What do you think the best thing is or will be about having a baby?
11. What family and Community supports do GRIC teen parents need?
12. What services are available in your Community for a teen parent?
13. If you could go back to before having a baby, what would you do differently?

Appendix D. School Principal and Other Administrator Survey 48
Appendix D. School Principal and Other Administrator Survey
Date: _______________Organization: ______________________________Title: ____________________
Time in this position: __________________Gender: Male Female
Cathryn V Lore and Associates is the vendor contracted by the Gila River Indian Community First Things First Regional Partnership Council to update their needs and assets First Things First report. As part of this process, you have been identified as an expert in your field and a community leader whose opinion and insight are greatly valued. Your participation in this process is voluntary and feed-back received will be anonymous and reported in aggregate. Thank you in advance for completing this survey.
1. How does your school support families with young children?
Parenting classes
Literacy programs
Preschool programs
Developmental screenings
Head start programs (home and/or school based)
Health screenings
Mental health services
Therapeutic services for developmental delays
Family Resource Center
Food boxes that includes baby formula
Clothing Closet that includes maternity and young children’s clothing
Kindergarten
Other (specify) ____________________________________
2. What are the strengths of your efforts?
3. In your opinion, what efforts could/should be strengthened or changed?
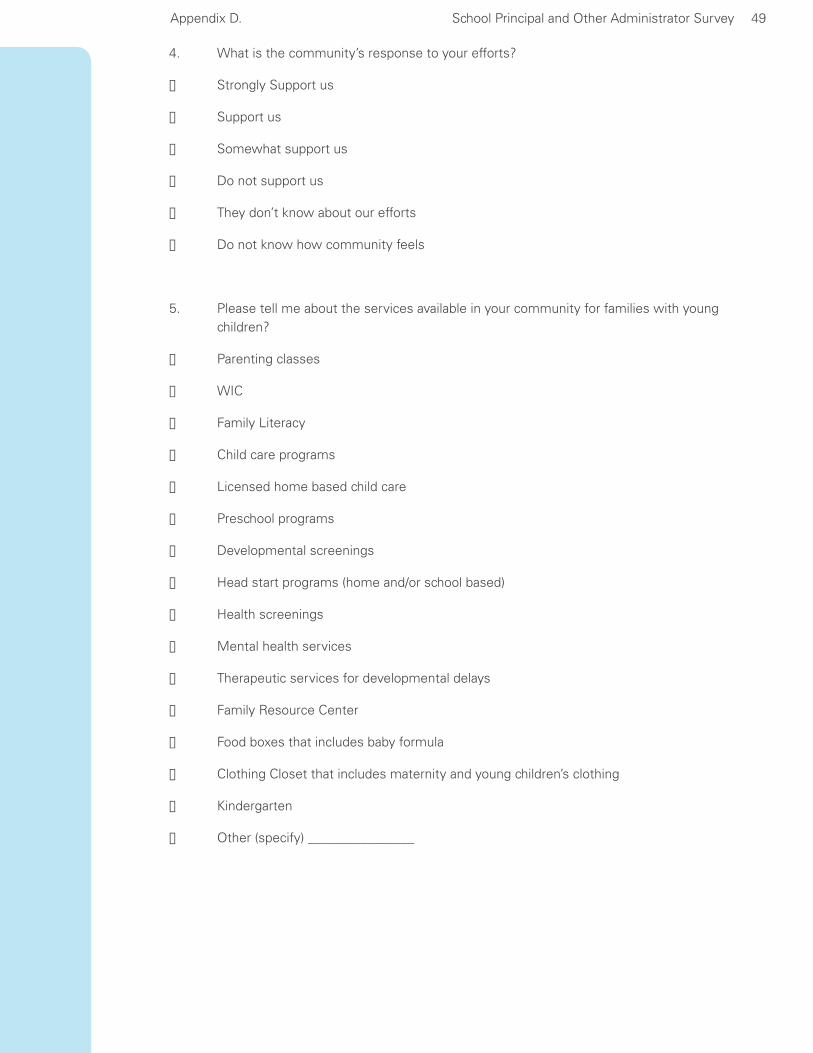
Appendix D. School Principal and Other Administrator Survey 49
4. What is the community’s response to your efforts?
Strongly Support us
Support us
Somewhat support us
Do not support us
They don’t know about our efforts
Do not know how community feels
5. Please tell me about the services available in your community for families with young children?
Parenting classes
WIC
Family Literacy
Child care programs
Licensed home based child care
Preschool programs
Developmental screenings
Head start programs (home and/or school based)
Health screenings
Mental health services
Therapeutic services for developmental delays
Family Resource Center
Food boxes that includes baby formula
Clothing Closet that includes maternity and young children’s clothing
Kindergarten
Other (specify) ________________

Appendix D. School Principal and Other Administrator Survey 50
6. What is your opinion of the existing interagency efforts to collaborate and coordinate ser-vicesforfamilieswithchildrenages0–5?
Very strong collaboration focused at coordinating services
Strong collaboration, with elements of service coordination
Good collaboration, working towards service coordination
Networking relationship amongst agencies with limited coordination
Limited collaboration between agencies
We are thinking about it but not sure how to begin
We are doing a good job and have no need to collaborate at this time
a. How could your efforts to collaborate and coordinate services with others be improved?
7. Do professionals/paraprofessionals who work directly with young children in your institution meet the educational and professional development requirements for those working with young children?
Yes, most definitely for both types of professional
Yes, the majority of the time for both types of professionals
Yes, for professionals only Yes, for paraprofessionals only
I don’t know how we rate I don’t know what the requirements are
8. In your opinion, how is your organization working towards supporting families in getting their children ready for Kindergarten?
______ Provide information about kindergarten registration, school Open House, etc.
_____ Have a parent orientation at a time convenient for parents (work schedule,, child care needs)
_____ Talk with children about the transition to Kindergarten
_____ Tell parents about need for parent involvement and explain you expectations as a teacher.
______ Send an email to parents for the first few days to let them know how their child is doing.
_____ Ask parents about their child’s prior school experiences, interests, concerns, desires.
_____ Provide information regarding kindergarten readiness skills.
_____ Other (Please specify) ___________________________________
_____ Provide opportunities for a child to visit kindergarten.
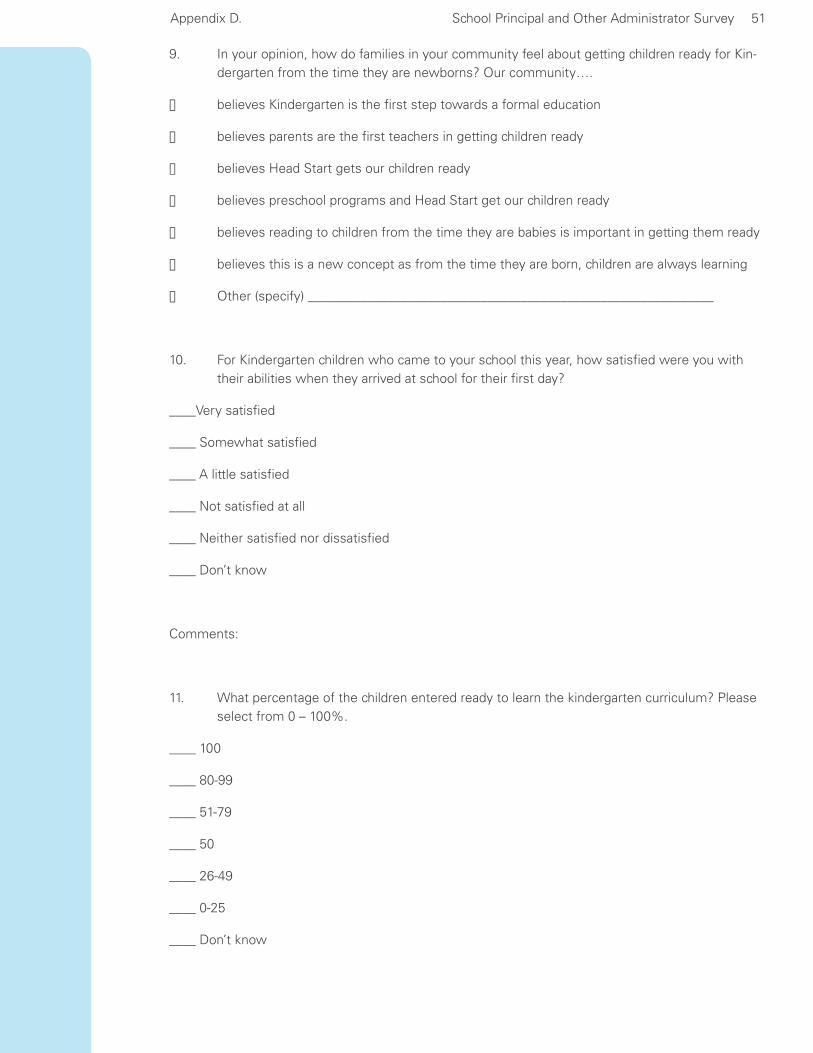
Appendix D. School Principal and Other Administrator Survey 51
9. In your opinion, how do families in your community feel about getting children ready for Kin-dergarten from the time they are newborns? Our community….
believes Kindergarten is the first step towards a formal education
believes parents are the first teachers in getting children ready
believes Head Start gets our children ready
believes preschool programs and Head Start get our children ready
believes reading to children from the time they are babies is important in getting them ready
believes this is a new concept as from the time they are born, children are always learning
Other (specify) _____________________________________________________________
10. For Kindergarten children who came to your school this year, how satisfied were you with their abilities when they arrived at school for their first day?
____Very satisfied
____ Somewhat satisfied
____ A little satisfied
____ Not satisfied at all
____ Neither satisfied nor dissatisfied
____ Don’t know
Comments:
11. What percentage of the children entered ready to learn the kindergarten curriculum? Please selectfrom0–100%.
____ 100
____ 80-99
____ 51-79
____ 50
____ 26-49
____ 0-25
____ Don’t know

Appendix D. School Principal and Other Administrator Survey 52
12. In your opinion, what factors contribute the most to children’s school difficulties? Select the top three.
____ Limited family resources
____ Low educational levels of parent/s
____ Parental involvement in Kindergarten
____ Didn’t participate in preschool program at age three
____ Didn’t participate in preschool program at age four
____ Diagnosed or potential developmental delays and/or special needs
____ Chronic health condition(s)
____ Low-quality child care or preschool experience
____ Prenatal substance exposure
____ Behavioral issues
____ Developmentally or chronically younger than peers
____ Started too far behind academically to “catch up” in one school year
____ Inadequate school or classroom resources
____ Attendance issues
____ Lack of parental support
____ Family/home life
____ other_________________________________
____ Don’t know

Appendix E. Parent Survey of Kindergarten Readiness 53
Appendix E. Parent Survey of Kindergarten Readiness
Thank you filling out this survey. Your input will help us make your child’s transition to kindergarten more successful.
1. Is this your first child to enter Kindergarten? Yes No
2. Do you have concerns about your child’s adjustment and/or transition to kindergarten? Yes No
If yes, please describe your concerns: (use back side of this paper if needed.
3. What would make a good transition experience for you and your child? (Pick the top 3)
____ Information about kindergarten registration, school Open House, etc.
____ Send me an email for the first few days and let me know how my child is doing.
____ Information regarding kindergarten readiness skills.
____ Opportunities for my child to visit kindergarten.
____ Teacher talks with children about the transition to Kindergarten.
____ Have a parent orientation at a time convenient for me (work schedule,, child care needs)
____ Ask me about my child’s prior school experiences, interests, concerns, desires.
____ Other (Please specify) _________________________________
4. Tell us about things your child can do:Almost Always
Sometimes Not Yet
Can tie shoelaces?
Knows how to zip and button?
Puts together simple puzzles?
Can write first name?
Takes care of toileting and self-care needs (e.g. dressing)?
Can be separated from you for up to six hours without becoming upset?
Shows curiosity and interest about school?
Knows how to follow the rules?
Demonstrates cooperative play skills (sharing, taking turns)?
Can sit quietly in a group without being disruptive?
Enjoys being read to?

Appendix E. Parent Survey of Kindergarten Readiness 54
4. Tell us about things your child can do:Almost Always
Sometimes Not Yet
Speech is easily understandable?
Can hold a pencil or crayon/marker properly?
Can use scissors properly?
Pays attention to short stories and can answer simple questions?
Has become accustomed to a routine and structure
Can Count to 10?
Wants you to read to them every day
Anything else you would like us to know that will help make a positive transition to Kindergarten for you child?
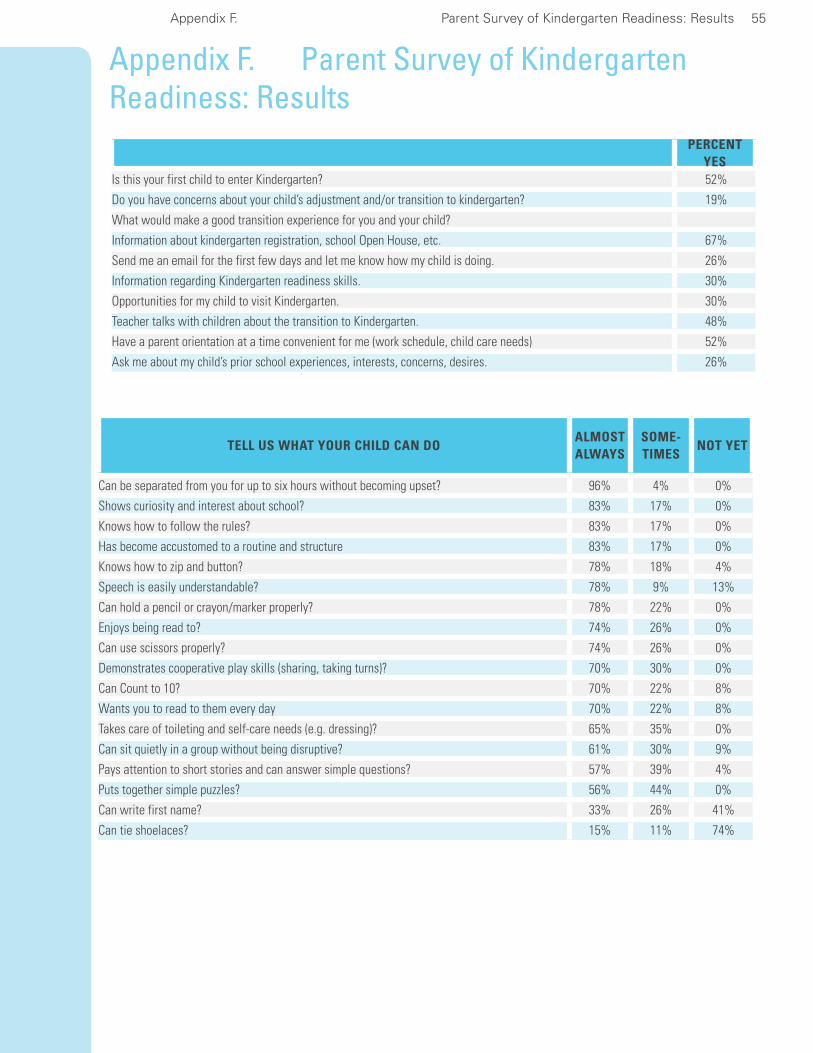
Appendix F. Parent Survey of Kindergarten Readiness: Results 55
Appendix F. Parent Survey of Kindergarten Readiness: Results
PERCENT YES
Is this your first child to enter Kindergarten? 52%
Do you have concerns about your child’s adjustment and/or transition to kindergarten? 19%
What would make a good transition experience for you and your child?
Information about kindergarten registration, school Open House, etc. 67%
Send me an email for the first few days and let me know how my child is doing. 26%
Information regarding Kindergarten readiness skills. 30%
Opportunities for my child to visit Kindergarten. 30%
Teacher talks with children about the transition to Kindergarten. 48%
Have a parent orientation at a time convenient for me (work schedule, child care needs) 52%
Ask me about my child’s prior school experiences, interests, concerns, desires. 26%
TELL US WHAT YOUR CHILD CAN DOALMOST ALWAYS
SOME-TIMES
NOT YET
Can be separated from you for up to six hours without becoming upset? 96% 4% 0%
Shows curiosity and interest about school? 83% 17% 0%
Knows how to follow the rules? 83% 17% 0%
Has become accustomed to a routine and structure 83% 17% 0%
Knows how to zip and button? 78% 18% 4%
Speech is easily understandable? 78% 9% 13%
Can hold a pencil or crayon/marker properly? 78% 22% 0%
Enjoys being read to? 74% 26% 0%
Can use scissors properly? 74% 26% 0%
Demonstrates cooperative play skills (sharing, taking turns)? 70% 30% 0%
Can Count to 10? 70% 22% 8%
Wants you to read to them every day 70% 22% 8%
Takes care of toileting and self-care needs (e.g. dressing)? 65% 35% 0%
Can sit quietly in a group without being disruptive? 61% 30% 9%
Pays attention to short stories and can answer simple questions? 57% 39% 4%
Puts together simple puzzles? 56% 44% 0%
Can write first name? 33% 26% 41%
Can tie shoelaces? 15% 11% 74%
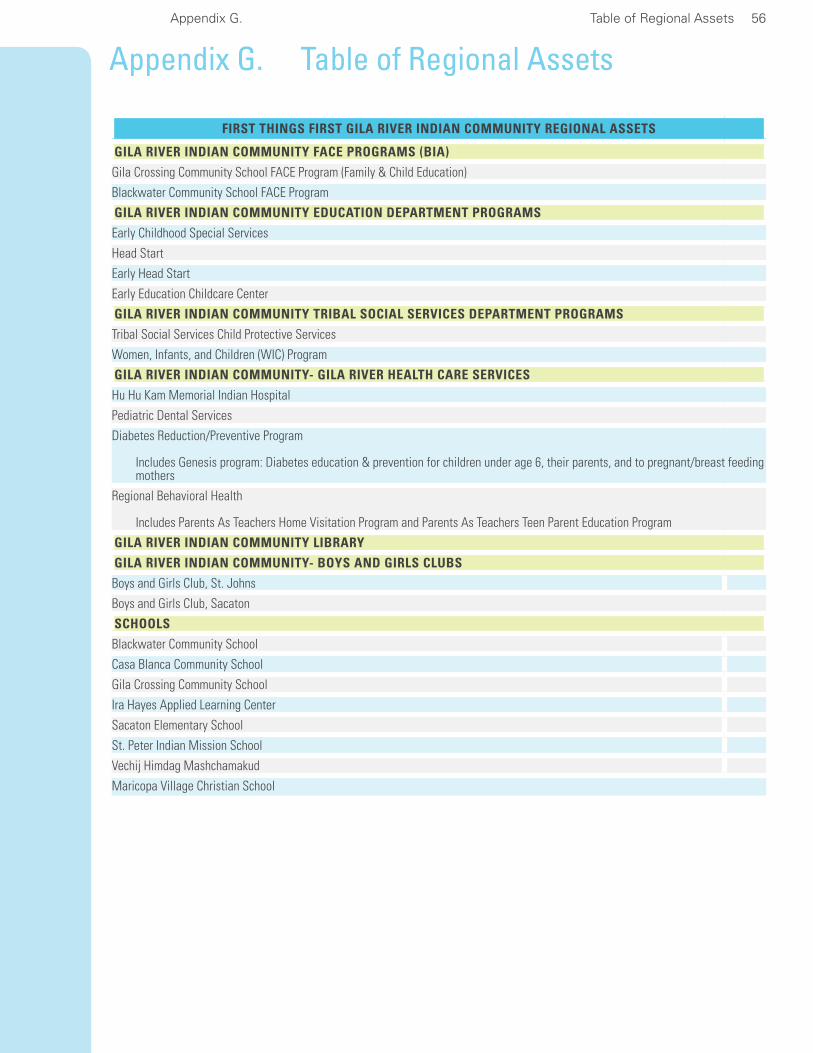
Appendix G. Table of Regional Assets 56
Appendix G. Table of Regional Assets
FIRST THINGS FIRST GILA RIVER INDIAN COMMUNITY REGIONAL ASSETS
GILA RIVER INDIAN COMMUNITY FACE PROGRAMS (BIA)
Gila Crossing Community School FACE Program (Family & Child Education)
Blackwater Community School FACE Program
GILA RIVER INDIAN COMMUNITY EDUCATION DEPARTMENT PROGRAMS
Early Childhood Special Services
Head Start
Early Head Start
Early Education Childcare Center
GILA RIVER INDIAN COMMUNITY TRIBAL SOCIAL SERVICES DEPARTMENT PROGRAMS
Tribal Social Services Child Protective Services
Women, Infants, and Children (WIC) Program
GILA RIVER INDIAN COMMUNITY- GILA RIVER HEALTH CARE SERVICES
Hu Hu Kam Memorial Indian Hospital
Pediatric Dental Services
Diabetes Reduction/Preventive Program
Includes Genesis program: Diabetes education & prevention for children under age 6, their parents, and to pregnant/breast feeding mothers
Regional Behavioral Health
Includes Parents As Teachers Home Visitation Program and Parents As Teachers Teen Parent Education Program
GILA RIVER INDIAN COMMUNITY LIBRARY
GILA RIVER INDIAN COMMUNITY- BOYS AND GIRLS CLUBS
Boys and Girls Club, St. Johns
Boys and Girls Club, Sacaton
SCHOOLS
Blackwater Community School
Casa Blanca Community School
Gila Crossing Community School
Ira Hayes Applied Learning Center
Sacaton Elementary School
St. Peter Indian Mission School
Vechij Himdag Mashchamakud
Maricopa Village Christian School

Appendix H. Table of Regional Strategies 57
Appendix H. Table of Regional Strategies
First Things First Gila River Indian Community Regional Partnership Council Planned Strategies for Fiscal Year 2011
Expand access to prenatal care and birth to five: health, dental, vision, and hearing services, including preventative services, screening services, and follow up services. Increase access to educational training, referral, follow up services, and resources to high risk populations.
Expand language and literacy programs.
Increase numbers of highly skilled and well prepared early childhood development and health workforce.
Expand access to early childhood educational programs and services serving infants and toddlers.
Decrease number of children on waiting lists through expanding existing summer pre-kindergar-ten programs.
Increase coordination among state, federal, and local organization to improve the coordina-tion and integration of regional programs, services, and resources for young children and their families.
Source: Gila River Indian Community Regional Partnership Coordinator

Appendix I. References 58
Appendix I. ReferencesArizona Child Care Resource and Referral Southern Arizona (2010). CCR&R data pulled April 12, 2010 Database (Unpublished Data).
Arizona Commission of Indian Affairs. (July 2007). State of Indian Youth 2007: Strength in Youth. Report of the 27th Arizona Indian Town Hall.
Arizona Department of Commerce, Research Administration, CES/LAUS Unit (2010). Local area unemployment statistics (LAUS), Special unemployment report. Data prepared in cooperation with the U.S. Department of Labor, Bureau of Labor Statistics and retrieved July, 2010, from Arizona Work-force Informer website at: www.workforce.az.gov/?PAGEID=67&SUBID=160.
Arizona Department of Economic Security (2007, 2009). DES Multidata pulled on May 4, 2010 from Database (Unpublished Data).
Arizona Department of Health Services.(2008). Advisory Council on Indian Health Care. Tribal Health Issues Prioritization Review and Strategic Plan. Available online at http://www.azdhs.gov/phs/tribal/pdf/2008TribalHealthPrioritizationReport.pdf
Arizona Department of Health Services (2008b). Health Status Profile of American Indians in Arizona, 2007 Data Book. www.azdhs.gov/plan/report/hspam/indian08.pdf
Arizona Department of Health Services (2009). Health Status Profile of American Indians in Arizona, 2008 Data Book. www.azdhs.gov/plan/report/hspam/indian08.pdf
Arizona Department of Health Services (2010). Bureau of Epidemiology and Disease Control, Arizona Immunization Program Office. Unpublished data provided by Arizona First Things First
Arizona Department of Health Services, Bureau of Health Systems Development. (2010). Gila River Indian Community Primary Care Area Statistical Profile 2009 www.azdhs.gov/hsd/profiles/
Arizona Health Care Cost Containment System (2010). AHCCCS Population by Health Care Contrac-tor Spreadsheet. (Unpublished Data)
Chalk, R., Gibbons, A., & Scarupa, H. J. (2002). The multiple dimensions of child abuse and neglect: New insights into an old problem. Washington, DC: Child Trends. Retrieved April 27, 2006, from www.childtrends.org/Files/ChildAbuseRB.pdf accessed 7/1/10.
First Things First (2008). Needs and Assets Report 2008: Gila River Indian Community Regional Part-nership Council. Available online at www.azftf.gov/ RPCCouncilPublicationsCenter/Gila River Indian Community Need And Assets Report 2008.pdf
First Things First (2010). Final Table IV-Proposed FY 2011 Regional Allocation. Report presented at the meetingofFirstThingsFirst–ArizonaEarlychildhoodDevelopmentandHealthBoard,Flagstaff,AZ.
Fraser, M. W., & Terzian, M. A. (2005). Risk and resilience in child development: principles and strate-gies of practice. In G. P. Mallon & P. M. Hess (Eds.), Child welfare for the 21st century: A handbook of practices, policies, and programs (pp. 55-71). New York, NY: Columbia University Press.
Fuller-Thomson E, Minkler M. (2005). American Indian/Alaskan Native Grandparents Raising Grand-children: Findings from the Census 2000 Supplementary Survey; Social Work, vol 50 no.2 pp 131-139
Gila River Health Care Corporation. (2010). Multiple health services utilization data. (Unpublished data).

Appendix I. References 59
Gila River Indian Community Head Start Program (2008). Community Assessment 2008-2011. (Unpublished Data)
Gila River Indian Community Head Start (2009a). Program Information Report (2008-2009). Enroll-mentStatisticsReport–ProgramLevel.(UnpublishedData)
Gila River Indian Community Head Start (2009b). Program Information Report (2007-2008 and 2008-2009).PerformanceIndicatorsReport–ProgramLevel.(UnpublishedData)
Gila River Indian Community Head Start (2009c). Program Information Report (2007-2008 and 2008-2009). Family Information Report - (Unpublished Data)
Gila River Indian Community Head Start (2009d). Program Information Report (2007-2008 and 2008-2009).HealthServicesReport–ProgramLevel.(UnpublishedData)
Gila River Indian Community Head Start (2009e). Program Information Report (2007-2008 and 2008-2009).DisabilitiesReport–ProgramLevel.(UnpublishedData)
Gila River Indian Community Head Start (2009f). Program Information Report (2007-2008 and 2008-2009) Staff Qualifications Report - Program Level. (Unpublished Data)
Office of Population Affairs, Department of Health and Human Services, (2010a). Focus area 14: Immunization and Infectious Disease, Healthy People 2010. Retrieved on August 13, 2010 from www.healthypeople.gov/document/HTML/Volume1/ 14Immunization.htm
Office of Population Affairs, Department of Health and Human Services, (2010b). Focus area 21: Oral Health, Healthy People 2010. Retrieved on August 13, 2010 from http://www.healthypeople.gov/docu-ment/HTML/Volume2/21Oral.htm
Sokolovsky (Ed.), The cultural context of aging: Worldwide perspectives(2nded.,pp.139–155).Westport, CT: Bergin & Garvey.
Weibel-Orlando, J. (1997). Grandparenting styles: The contemporary American Indian experience. InJ.Sokolovsky(Ed.),Theculturalcontextofaging:Worldwideperspectives(2nded.,pp.139–155).Westport, CT: Bergin & Garvey.
US Census 2001Supplementary Survey C2SS, 2001