near%real’time’cape’east’of’the
TRANSCRIPT

Near-‐real time CAPE East of the Rockies Combining Hyperspectral IR Satellite Sounding and ASOS Surface Stations:
Part II Methodology and Preliminary Results
Callyn Bloch1,2 Robert Knuteson2, Jessica Gartzke1,2, Grace Przybyl2, Steve Ackerman1,2 1. University of Wisconsin-‐Madison Atmospheric and Oceanic Sciences
2. University of Wisconsin-‐Madison Cooperative Institute for Meteorological Satellite Studies
1. INTRODUCTION Near-‐real time satellite data can give forecasters the extra edge they need to issue timely and accurate watches and warnings. The Convective Available Potential Energy (CAPE) is a measure of atmospheric instability computed from vertical profiles of temperature and water vapor. CAPE can give forecasters valuable information about the stability of the atmosphere and therefore the potential for severe weather. The value of using satellite vertical soundings from hyperspectral infrared sensors has been recognized at the NOAA Hazardous Weather Testbed workshops held at the NWS SPC (http://hwt.nssl.noaa.gov/). In addition to more temporal coverage, satellite data can provide spatial coverage between NWS radiosonde launch sites, which are only launched twice a day. Satellite overpass times from EUMETSAT METOP IASI at 10:30am/pm and NASA AQUA AIRS, Suomi-‐NPP CrIS, and JPSS J1 at about 1:30am/pm occur conveniently between the operational 0 and 12 UTC NWS radiosondes. It is very important to include an accurate estimate of the surface temperature and dewpoint for an accurate CAPE calculation. In this study, an investigation of the use of
combined surface station data and satellite data is conducted to create a better estimate of CAPE. Automated Surface Observing System (ASOS) stations currently operate routinely at U.S. airports and provide surface meteorological measurements at 1-‐minute intervals reported in METAR format. The gridded ASOS surface observation and IR sounder profiles will be merged before computing surface CAPE values.
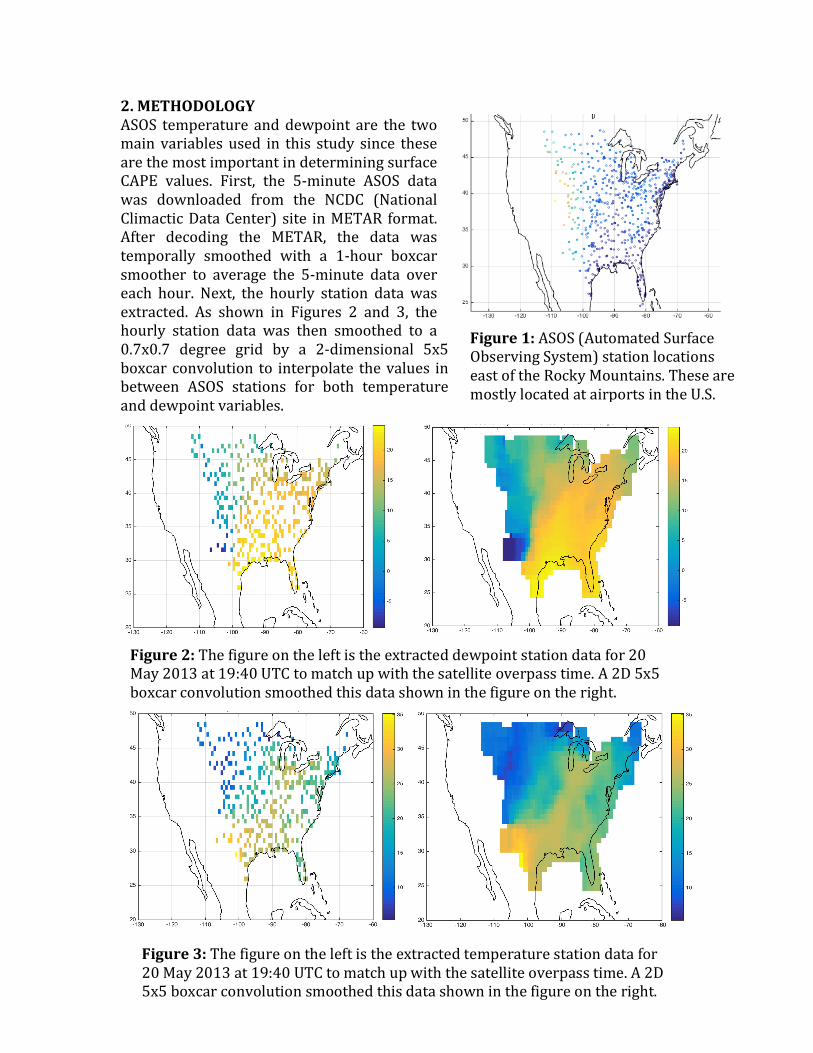
This paper is Part II of a two-‐part study to investigate the utility of satellite derived CAPE in the continental U.S. east of the Rocky Mountains. Part II describes the method used to obtain the surface observations and a verification of the merging of the surface and satellite data using 10 years of observations at the ARM southern Great Plains site. The methodology section describes a 2-‐dimensional interpolation technique to create gridded surface values from the non-‐uniformly spaced ASOS stations. Future work will extend this surface analysis to include the multiple networks contained in the NOAA MADIS data assimilation system. In this study, we restrict our analysis to surface stations east of the Rocky Mountains where severe storms with high CAPE are common in the spring and summer (see Figure 1).
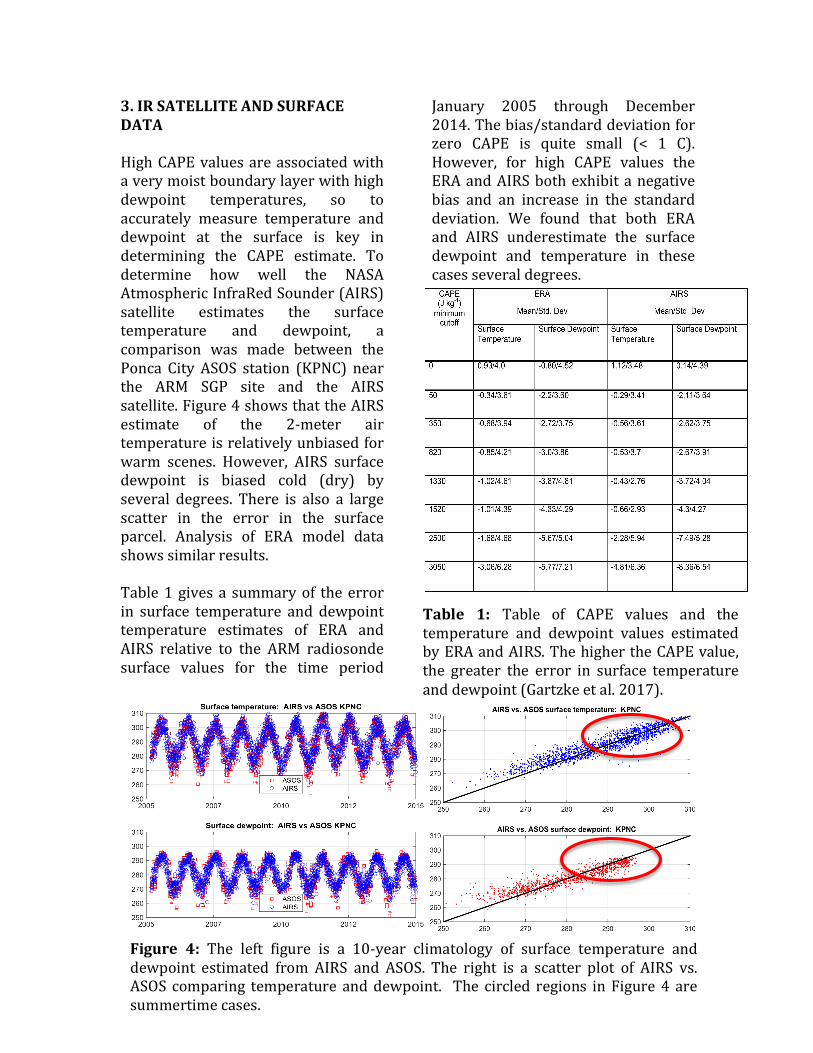
2. METHODOLOGY ASOS temperature and dewpoint are the two main variables used in this study since these are the most important in determining surface CAPE values. First, the 5-‐minute ASOS data was downloaded from the NCDC (National Climactic Data Center) site in METAR format. After decoding the METAR, the data was temporally smoothed with a 1-‐hour boxcar smoother to average the 5-‐minute data over each hour. Next, the hourly station data was extracted. As shown in Figures 2 and 3, the hourly station data was then smoothed to a 0.7x0.7 degree grid by a 2-‐dimensional 5x5 boxcar convolution to interpolate the values in between ASOS stations for both temperature and dewpoint variables.
Figure 2: The figure on the left is the extracted dewpoint station data for 20 May 2013 at 19:40 UTC to match up with the satellite overpass time. A 2D 5x5 boxcar convolution smoothed this data shown in the figure on the right.
Figure 3: The figure on the left is the extracted temperature station data for 20 May 2013 at 19:40 UTC to match up with the satellite overpass time. A 2D 5x5 boxcar convolution smoothed this data shown in the figure on the right.
Figure 1: ASOS (Automated Surface Observing System) station locations east of the Rocky Mountains. These are mostly located at airports in the U.S.
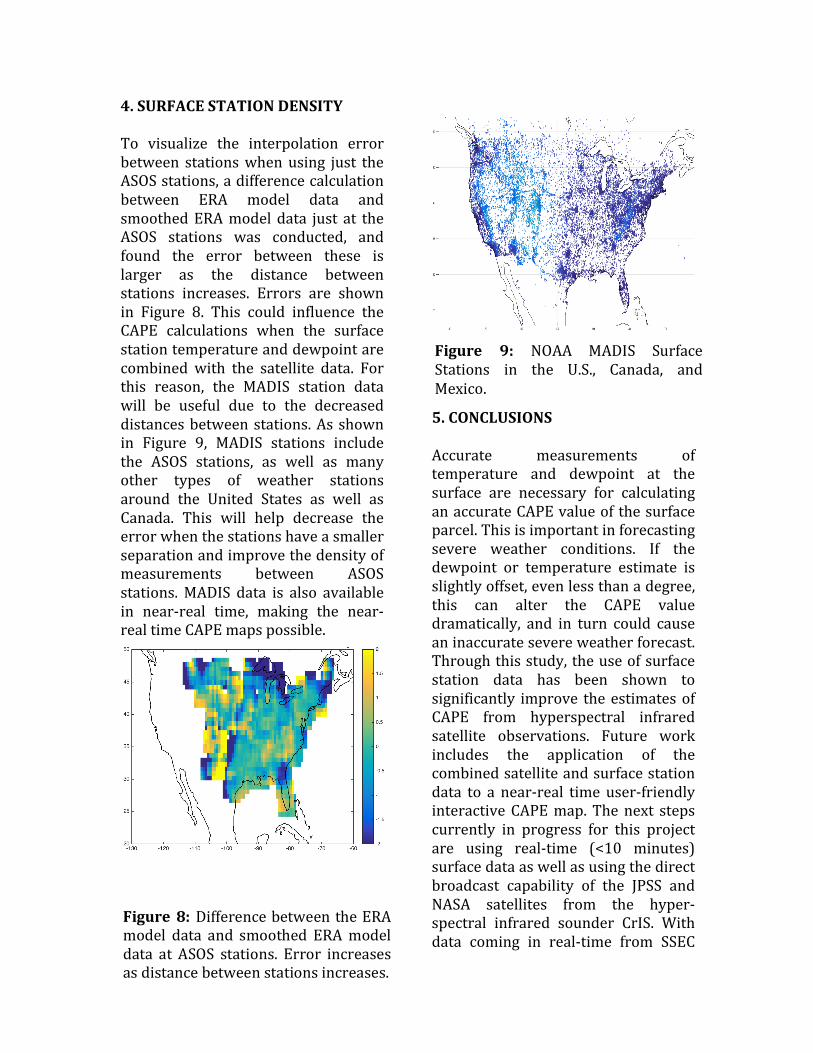
3. IR SATELLITE AND SURFACE DATA High CAPE values are associated with a very moist boundary layer with high dewpoint temperatures, so to accurately measure temperature and dewpoint at the surface is key in determining the CAPE estimate. To determine how well the NASA Atmospheric InfraRed Sounder (AIRS) satellite estimates the surface temperature and dewpoint, a comparison was made between the Ponca City ASOS station (KPNC) near the ARM SGP site and the AIRS satellite. Figure 4 shows that the AIRS estimate of the 2-‐meter air temperature is relatively unbiased for warm scenes. However, AIRS surface dewpoint is biased cold (dry) by several degrees. There is also a large scatter in the error in the surface parcel. Analysis of ERA model data shows similar results. Table 1 gives a summary of the error in surface temperature and dewpoint temperature estimates of ERA and AIRS relative to the ARM radiosonde surface values for the time period
January 2005 through December 2014. The bias/standard deviation for zero CAPE is quite small (< 1 C). However, for high CAPE values the ERA and AIRS both exhibit a negative bias and an increase in the standard deviation. We found that both ERA and AIRS underestimate the surface dewpoint and temperature in these cases several degrees.
Figure 4: The left figure is a 10-‐year climatology of surface temperature and dewpoint estimated from AIRS and ASOS. The right is a scatter plot of AIRS vs. ASOS comparing temperature and dewpoint. The circled regions in Figure 4 are summertime cases.
Table 1: Table of CAPE values and the temperature and dewpoint values estimated by ERA and AIRS. The higher the CAPE value, the greater the error in surface temperature and dewpoint (Gartzke et al. 2017).

To improve the CAPE calculation for the satellite data, Ponca City ASOS surface station data (see Figure 5) was used for the surface parcel temperature and dewpoint. AIRS CAPE with ASOS surface data was then compared to AIRS CAPE estimate without the surface data. It was found that when CAPE is zero, the AIRS estimate of CAPE with and without the surface data is nearly the same, and the surface data has no effect on the CAPE value. However, if CAPE is greater than 0, than AIRS with ASOS CAPE tends to be greater than AIRS only CAPE. For large CAPE values that are associated with severe weather, the use of ASOS surface data can make a large impact on the CAPE estimate, in some cases more than 3000 J/kg (see Figure 6). The AIRS CAPE estimate with the ASOS surface
station temperature and dewpoint was also compared to the CAPE value computed using the Southern Great Plains ARM radiosonde profile with the same ASOS surface station temperature and dewpoint. The correlation found between the two is very high, 0.942 (Figure 7). This implies that the CAPE is strongly dependent on the surface parcel estimate, and even differences of less than a degree can make a large impact on the CAPE value. This
shows that the AIRS upper air profile estimate is equivalent to the vertical profile of the radiosonde. This is validation that the surface station data combined with the upper air profile of the satellite data will provide a more accurate estimate of CAPE.
Figure 6: Distribution of AIRS CAPE estimate with ASOS surface data minus only the AIRS CAPE estimate.
Figure 5: Southern Great Plains ARM site Central Facility surface stations with a radiosonde launched from the center site. These are in close proximity to the Ponca City ASOS station (30 miles).
Figure 7: AIRS CAPE with ASOS station data compared with the ARM radiosonde profile with ASOS station data. Correlation of 0.942.
4. SURFACE STATION DENSITY To visualize the interpolation error between stations when using just the ASOS stations, a difference calculation between ERA model data and smoothed ERA model data just at the ASOS stations was conducted, and found the error between these is larger as the distance between stations increases. Errors are shown in Figure 8. This could influence the CAPE calculations when the surface station temperature and dewpoint are combined with the satellite data. For this reason, the MADIS station data will be useful due to the decreased distances between stations. As shown in Figure 9, MADIS stations include the ASOS stations, as well as many other types of weather stations around the United States as well as Canada. This will help decrease the error when the stations have a smaller separation and improve the density of measurements between ASOS stations. MADIS data is also available in near-‐real time, making the near-‐real time CAPE maps possible.
5. CONCLUSIONS Accurate measurements of temperature and dewpoint at the surface are necessary for calculating an accurate CAPE value of the surface parcel. This is important in forecasting severe weather conditions. If the dewpoint or temperature estimate is slightly offset, even less than a degree, this can alter the CAPE value dramatically, and in turn could cause an inaccurate severe weather forecast. Through this study, the use of surface station data has been shown to significantly improve the estimates of CAPE from hyperspectral infrared satellite observations. Future work includes the application of the combined satellite and surface station data to a near-‐real time user-‐friendly interactive CAPE map. The next steps currently in progress for this project are using real-‐time (<10 minutes) surface data as well as using the direct broadcast capability of the JPSS and NASA satellites from the hyper-‐spectral infrared sounder CrIS. With data coming in real-‐time from SSEC
Figure 9: NOAA MADIS Surface Stations in the U.S., Canada, and Mexico.
Figure 8: Difference between the ERA model data and smoothed ERA model data at ASOS stations. Error increases as distance between stations increases.

Direct Broadcast receivers and NOAA surface data available hourly from MADIS, the combined satellite and surface CAPE calculations can be computed and displayed on RealEarth™, an SSEC visualization tool adapted to mobile devices. The CAPE calculations will be displayed much like the hourly dewpoint maps shown in Figures 2 and 3. ACKNOWLEDGEMENTS The authors acknowledge the support of the JPSS project EOY funds under the CIMSS cooperative agreement NA15NES4320001. REFERENCES Gartzke, J., R. Knuteson, G. Przybyl, S. Ackerman, H. Revercomb, 2017: Comparison of Satellite, Model, and Radiosonde Derived Convective Available Potential Energy (CAPE) in the Southern Great Plains Region, JAMC, in press.