evaluationofqualityparametersofapplejuicesusing near
TRANSCRIPT

Research ArticleEvaluation of Quality Parameters of Apple Juices UsingNear-Infrared Spectroscopy and Chemometrics
Katarzyna Włodarska ,1 Igor Khmelinskii ,2 and Ewa Sikorska 1
1Faculty of Commodity Science, Poznan University of Economics and Business, al. Niepodległosci 10, 61-875 Poznan, Poland2Universidade do Algarve, FCT, DQB and CEOT, Campus de Gambelas, 8005-139 Faro, Portugal
Correspondence should be addressed to Ewa Sikorska; [email protected]
Received 8 March 2018; Revised 12 May 2018; Accepted 26 May 2018; Published 28 June 2018
Academic Editor: Jose S. Camara
Copyright © 2018 Katarzyna Włodarska et al. +is is an open access article distributed under the Creative Commons AttributionLicense, which permits unrestricted use, distribution, and reproduction in any medium, provided the original work isproperly cited.
Near-infrared (NIR) spectra were recorded for commercial apple juices. Analysis of these spectra using partial least squares (PLS)regression revealed quantitative relations between the spectra and quality- and taste-related properties of juices: soluble solidscontent (SSC), titratable acidity (TA), and the ratio of soluble solids content to titratable acidity (SSC/TA). Various spectralpreprocessing methods were used for model optimization. +e optimal spectral variables were chosen using the jack-knife-basedmethod and different variants of the interval PLS (iPLS) method. +e models were cross-validated and evaluated based on thedetermination coefficients (R2), root-mean-square error of cross-validation (RMSECV), and relative error (RE). +e best modelfor the prediction of SSC (R2 � 0.881, RMSECV� 0.277 °Brix, and RE� 2.37%) was obtained for the first-derivative preprocessedspectra and jack-knife variable selection. +e optimal model for TA (R2 � 0.761, RMSECV� 0.239 g/L, and RE� 4.55%) wasobtained for smoothed spectra in the range of 6224–5350 cm−1.+e best model for the SSC/TA (R2 � 0.843, RMSECV� 0.113, andRE� 5.04%) was obtained for the spectra without preprocessing in the range of 6224–5350 cm−1. +e present results show thepotential of the NIR spectroscopy for screening the important quality parameters of apple juices.
1. Introduction
Over the past years, the application of the near-infrared(NIR) spectroscopy coupled with chemometrics has gainedwide acceptance in different fields, including food and ag-ricultural products [1–6].
NIR spectroscopy is based on the absorption of elec-tromagnetic radiation in the range of 12,500–4000 cm−1[2, 7]. +e NIR spectra consist of broad overlapping bandsarising from overtones and combination tones of the fun-damental vibrations involving C-H, O-H, and N-H chemicalbonds. +ese bonds are the primary structural componentsof organic molecules; thus, NIR is very useful for mea-surements of biological and organic systems, includingfoods. Due to the wealth of chemical information providedby the NIR spectra, they allow simultaneous determinationof several constituents and/or of diverse sample properties[4, 7].
One of the main advantages of the NIR technique is itsnondestructive character and simple and rapid measure-ments. Different measurement modes enable direct analysisof both liquid and solid samples without any preparation.Due to its advantages, the NIR technique coupled withchemometrics provides a rapid, effective, and cost-savingalternative to the conventional methods in routine, high-throughput analysis of foods. NIR has been used to assessboth the properties and concentrations of the food com-ponents, being also a well-established tool for processmonitoring.
Using NIR for quality control requires chemometricmethods to extract useful information out of complexspectra of the products studied [8]. Practical applicationsusually require development of multivariate calibration,which define the relationships between the measured spectraand the content of the compound or property of interest,obtained by the respective reference methods. Multivariate
HindawiJournal of SpectroscopyVolume 2018, Article ID 5191283, 8 pageshttps://doi.org/10.1155/2018/5191283
regression methods are used for developing quantitativemodels, with partial least squares (PLS) regression being themost widely used. A lot of factors impact the performance ofthe calibration models, one of the important issues being anappropriate choice and application of chemometricmethods. +e collected spectra are usually preprocessedmathematically to reduce noise and enhance the analyticalinformation. +is improves the results of the subsequentdata analysis and leads to better calibration models [9]. +eregression analysis may be performed using the entire NIRspectra. However, many studies showed improvementswhen calibrations were developed in a selected spectralregion as compared to the full-spectrum model [10]. Severalmethods have been developed to objectively identify theimportant variables (spectral regions), being more efficientthan the traditional approach based on the knowledge of thespectroscopic properties of the sample and/or analysis of theregression results performed on the entire spectra [10, 11].
An important area of NIR application is the analysis offruit and vegetables and products of their processing[5, 12–14]. Considerable attention has been devoted tostudies of the apple properties using NIR [12, 15]. Apples arevery popular due to their pleasant flavour and beneficialhealth effects, being a relevant dietary source of phyto-chemicals, including phenolics [16].
NIR spectroscopy has been successfully used to evaluatea range of intact apple quality attributes such as the solublesolids content, titratable acidity, sugar content, vitamin C,total polyphenols, starch index, chlorophyll content, firm-ness, and mealiness [17–19]. +e feasibility of using variableselection methods for determination of the apple qualityparameters such as soluble solids content was also dem-onstrated [17, 20, 21].
Despite the amount of research carried out to date onusing NIR to evaluate properties of the intact apples, thenumber of published papers that study the apple juice is ratherlimited. Spectroscopy in the NIR range was used to predictsugar content in the apple juice [22], detect adulteration [23],and differentiate between the apple juices on the basis of applevariety [24]. +e combination of NIR spectroscopy andfluorescence enabled detection of quality deterioration of theapple juice during storage and heating [25]. Application of thismethod for determination of the quality parameters of applewine was also reported recently [26].
+e important characteristics of apple juices relateddirectly to their quality are soluble solids content (SSC) andtitratable acidity (TA). +e limits for these parameters inmarketed apple juices are defined by the Code of Practicedeveloped by the European Fruit Juice Association, whichprovides reference for the control of juice quality on the EUmarket. SSC is one of the major characteristics used toindicate sweetness of fresh and processed fruit products [13].Titratable acidity is related to the organic acid contents; thesecompounds contribute to the sour taste and also stabilizecolour and extend the shelf life of fresh fruit and theirprocessed products. +e overall taste of fruit is more closelyrelated to the ratio of SSC and TA than to the individualparameters; therefore, this ratio is used as an index ofsensory acceptability of the fruit taste [27].
+e aim of the present study was to test feasibility of theNIR spectroscopy in developing the calibration models forpredicting the main quality parameters of the apple juices:SSC, TA, and SSC/TA. We also explored the possibilities tooptimize the models using jack-knife variable selection,different variants of the interval PLS variable selection, andpreprocessing methods.
2. Materials and Methods
2.1. Apple Juices. Apple juices that are available on themarket were evaluated in this study. +e samples includedclear and cloudy juices reconstituted from the concentrate,direct juices that were pasteurized, and freshly squeezedjuices. +e total of thirty juices from 15 different producerswas studied; all of these samples were studied in duplicate,using two different production batches.
2.2. NIRMeasurements. +e spectra were collected using anFT-NIR spectrophotometer (MPA; Bruker Optics, Ettlingen,Germany). +e instrument performance was validated be-fore measurements by running automatic tests according tothe manufacturer’s procedure. Spectral acquisition and in-strument control were performed using OPUS software (v. 5;Bruker Optics, Ettlingen, Germany). +e spectra were ac-quired in the range of 12,500–4000 cm−1 with the resolutionof 8 cm−1 and with 64 scans coadded to obtain the averagedspectrum. +e measurements were performed using trans-mittance techniques in cuvettes with the optical pathlengthof 2mm. +e cuvettes were placed into a temperature-controlled cell holder, and measurements were conductedat a constant temperature of 35°C, controlled by the OPUSsoftware. +e spectra were recorded after centrifugation(15,000 rpm for 5min), with six replicated spectra collectedfor each of the juices.
2.3. Determination of the Chemical Parameters. +e solublesolids contents (SSC) of the juices were determined using anAbbe refractometer (model DR-A1’s Conbest) at 20°C,calibrated with distilled water.+e SSCwas expressed as Brixdegrees (°Brix), with all of the measurements carried out intriplicate.
Titratable acidity (TA) was measured using a pH meter(S220 SevenCompact™;Mettler Toledo), by titrating 25ml ofthe juice sample with 0.1MNaOH to the pH endpoint of 8.1.+e results were expressed as grams of malic acid per litre ofthe juice (g/L). +ese measurements were performed intriplicate.
2.4. Data Analysis
2.4.1. Regression Methods. Partial least squares (PLS) re-gression was used to establish the calibration models be-tween the NIR spectra (the X matrix) and the qualityparameters of the apple juices (the Y matrix). +e PLSmethod models both the X- and Y-matrices simultaneously,finding the latent variables in X that best predict the latentvariables in Y [28]. We used all thirty juice samples for
2 Journal of Spectroscopy
developing and optimizing the calibration models. +eaverage spectra were used in the analysis.
2.4.2. Validation of the RegressionModels. Full leave-one-out(LOO) cross-validation was applied to all of the regressionmodels. +e regression models were evaluated using the de-termination coefficient (R2), the root-mean-square error ofcross-validation (RMSECV), and the relative error (RE),calculated as the percentage ratio of RMSECV to the averagevalue of the studied parameter in the calibration set. +eoptimal number of components was chosen as the minimumon the plot of the RMSECV as a function of the number ofcomponents.
2.4.3. Spectral Preprocessing. We used different pre-processing methods in order to remove noise, baseline, andscattering effects from the spectra. Savitzky–Golaysmoothing with the filter width of 15 data points was used toremove spectral noise, while the baseline was corrected usingthe baseline offset and the first and second derivatives. +ebaseline offset involved linear offset subtraction, whichshifted the spectra in order to set the minimum value to zero.+e first-order derivative is normally used to eliminateconstant baseline shifts, and the second-order derivative alsoeliminates the baseline slope [9]. +e derivatives were cal-culated using the Savitzky–Golay algorithm, with the filterwidth of 15 data points. Multiplicative scatter correction(MSC) and standard normal variate (SNV) were applied forthe correction of the light-scattering effects [9]. +e MSCestimates the correction coefficients for additive and mul-tiplicative scattering effects by regressing the spectrum to becorrected on a reference spectrum [9].+e average spectrumof the calibration set was used as a reference. +e SNVcorrects the spectra by first calculating the mean spectrumand subsequently subtracting this mean from the spectrumto be corrected. +en, that value is divided by the standarddeviation of the spectrum [9].+e spectra were preprocessedusing each of the single methods and/or their followingcombinations: smoothing and baseline, smoothing andSNV, smoothing and MSC, MSC and the first-order de-rivative, MSC and the second-order derivative, SNV and thefirst-order derivative, and SNV and the second-order de-rivative. +e order of application of the different pre-processing methods was as indicated in the precedingdescription.
+e preprocessing was performed on the average NIRspectra. Prior to PLS analysis, all of the spectra were mean-centred.
2.4.4. Variable Selection. +e variable selection methodsapplied in this work include the jack-knife method anddifferent variants of the interval PLS (iPLS) [29].
+e jack-knife is a method used for calculating thestandard errors of the regression coefficient estimated in thePLS regression model [30]. +e regression coefficients arethen divided by their estimated standard errors, giving thet-test values to be used for testing the significance of the
variables used in the model [11]. +ese calculations werecarried out using +e Unscrambler v. 9.8 software (CAMO,Norway).
+e iPLS method subdivides the data into non-overlapping sections, obtaining a local PLS model in eachsection, in order to determine the most useful variable range.+e comparison between all of the local models is usuallybased on the RMSECV values, obtained from the validation[11]. An optimal data range may be found by reducing orincreasing the existing trial ranges, or by removing or addingnew variables [20]. Presently, we used different variants ofthe iPLS method as implemented in the OPUS software forselection of the optimal variable ranges [31].
+e iPLS (NIR) variant used an NIR spectrum (with the12,500–11,263 cm−1 and 5349–4779 cm−1 ranges excluded)that was divided into five frequency ranges, each corre-sponding to specific absorption bands. +e local PLS modelswere tested in each of the selected ranges on their own and inall of their possible combinations. +is procedure coincideswith the synergy interval PLS (SiPLS) [10].
+e iPLS (A) and iPLS (B) variants used the entire NIRspectrum (in the 12,500–4000 cm−1 range, with the5349–4779 cm−1 range excluded) divided into ten subranges.+e iPLS (A) started the calculation with all of the 10subranges and next successively excluded one of the sub-ranges. +is procedure continued until the RMSECV valuedid not improve any further. +is procedure coincides withthe backward iPLS (BiPLS) [10].
+e iPLS (B) starts the calculation to find the optimumspectral range with one of the subranges. After finding thebest subrange, a second subrange is added. After the bestcombination of the two subranges is found, a third subrangeis added, and so on. +e best combination of the subrangeswas thus searched by adding and leaving out further sub-ranges. +is procedure coincides with the forward iPLS(FiPLS) [10].
+e selection of variables was performed on differentlypreprocessed spectra. +e algorithm implemented in theOPUS software enables automatic searching for the optimalcombinations of the preprocessing method with the spectralrange based on the minimum value of the RMSECV cri-terion. +e 5349–4779 cm−1 spectral range was excludedfrom the calculations due to the high absorbance values,clearly exceeding the useful range of the instrument.
Finally, all of the PLS models with different combina-tions of the preprocessing methods and the variable rangeswere calculated using +e Unscrambler v. 9.8 (CAMO,Norway).
3. Results and Discussion
3.1. NIR Spectra of Apple Juices. +e thirty apple juicesamples studied included different juice categories availableon the market. +ey included juices reconstituted from theconcentrate, both clear and with added fruit pulp, and directjuices, pasteurized and freshly squeezed.
Figure 1 shows the NIR absorbance spectra collected forthe apple juices studied.
Journal of Spectroscopy 3
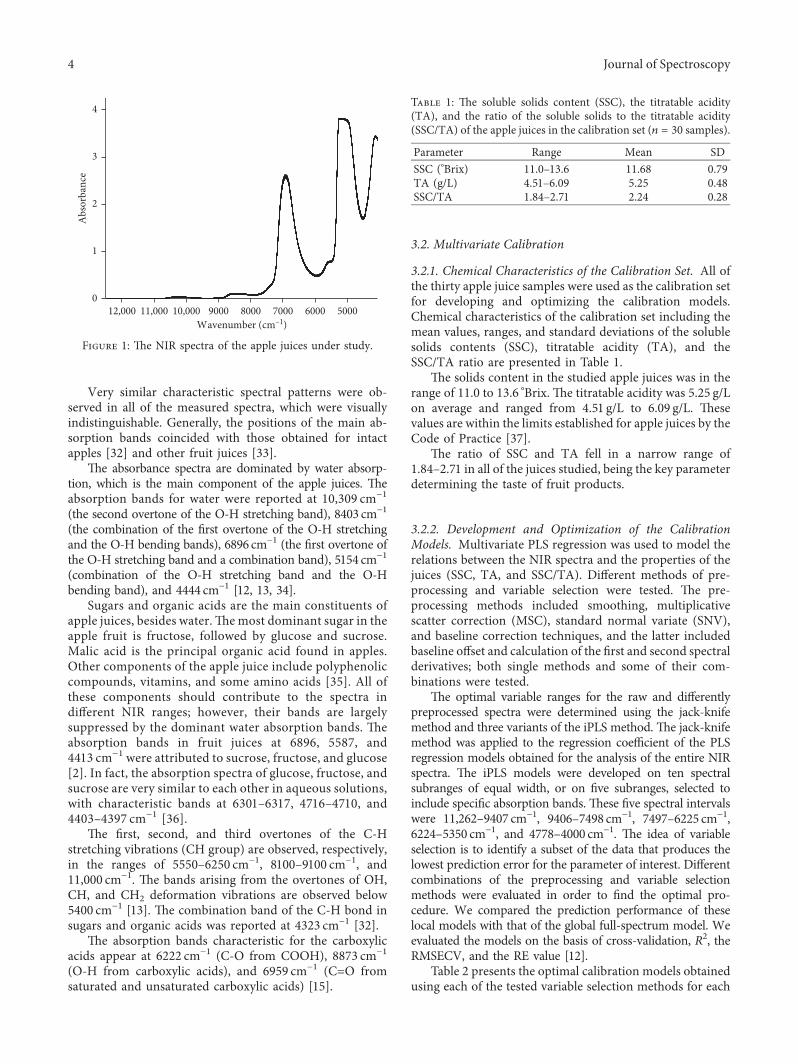
Very similar characteristic spectral patterns were ob-served in all of the measured spectra, which were visuallyindistinguishable. Generally, the positions of the main ab-sorption bands coincided with those obtained for intactapples [32] and other fruit juices [33].
+e absorbance spectra are dominated by water absorp-tion, which is the main component of the apple juices. +eabsorption bands for water were reported at 10,309 cm−1
(the second overtone of the O-H stretching band), 8403 cm−1
(the combination of the first overtone of the O-H stretchingand the O-H bending bands), 6896 cm−1 (the first overtone ofthe O-H stretching band and a combination band), 5154 cm−1(combination of the O-H stretching band and the O-Hbending band), and 4444 cm−1 [12, 13, 34].
Sugars and organic acids are the main constituents ofapple juices, besides water.+emost dominant sugar in theapple fruit is fructose, followed by glucose and sucrose.Malic acid is the principal organic acid found in apples.Other components of the apple juice include polyphenoliccompounds, vitamins, and some amino acids [35]. All ofthese components should contribute to the spectra indifferent NIR ranges; however, their bands are largelysuppressed by the dominant water absorption bands. +eabsorption bands in fruit juices at 6896, 5587, and4413 cm−1 were attributed to sucrose, fructose, and glucose[2]. In fact, the absorption spectra of glucose, fructose, andsucrose are very similar to each other in aqueous solutions,with characteristic bands at 6301–6317, 4716–4710, and4403–4397 cm−1 [36].
+e first, second, and third overtones of the C-Hstretching vibrations (CH group) are observed, respectively,in the ranges of 5550–6250 cm−1, 8100–9100 cm−1, and11,000 cm−1. +e bands arising from the overtones of OH,CH, and CH2 deformation vibrations are observed below5400 cm−1 [13]. +e combination band of the C-H bond insugars and organic acids was reported at 4323 cm−1 [32].
+e absorption bands characteristic for the carboxylicacids appear at 6222 cm−1 (C-O from COOH), 8873 cm−1(O-H from carboxylic acids), and 6959 cm−1 (C�O fromsaturated and unsaturated carboxylic acids) [15].
3.2. Multivariate Calibration
3.2.1. Chemical Characteristics of the Calibration Set. All ofthe thirty apple juice samples were used as the calibration setfor developing and optimizing the calibration models.Chemical characteristics of the calibration set including themean values, ranges, and standard deviations of the solublesolids contents (SSC), titratable acidity (TA), and theSSC/TA ratio are presented in Table 1.
+e solids content in the studied apple juices was in therange of 11.0 to 13.6 °Brix. +e titratable acidity was 5.25 g/Lon average and ranged from 4.51 g/L to 6.09 g/L. +esevalues are within the limits established for apple juices by theCode of Practice [37].
+e ratio of SSC and TA fell in a narrow range of1.84–2.71 in all of the juices studied, being the key parameterdetermining the taste of fruit products.
3.2.2. Development and Optimization of the CalibrationModels. Multivariate PLS regression was used to model therelations between the NIR spectra and the properties of thejuices (SSC, TA, and SSC/TA). Different methods of pre-processing and variable selection were tested. +e pre-processing methods included smoothing, multiplicativescatter correction (MSC), standard normal variate (SNV),and baseline correction techniques, and the latter includedbaseline offset and calculation of the first and second spectralderivatives; both single methods and some of their com-binations were tested.
+e optimal variable ranges for the raw and differentlypreprocessed spectra were determined using the jack-knifemethod and three variants of the iPLS method. +e jack-knifemethod was applied to the regression coefficient of the PLSregression models obtained for the analysis of the entire NIRspectra. +e iPLS models were developed on ten spectralsubranges of equal width, or on five subranges, selected toinclude specific absorption bands. +ese five spectral intervalswere 11,262–9407 cm−1, 9406–7498 cm−1, 7497–6225 cm−1,6224–5350 cm−1, and 4778–4000 cm−1. +e idea of variableselection is to identify a subset of the data that produces thelowest prediction error for the parameter of interest. Differentcombinations of the preprocessing and variable selectionmethods were evaluated in order to find the optimal pro-cedure. We compared the prediction performance of theselocal models with that of the global full-spectrum model. Weevaluated the models on the basis of cross-validation, R2, theRMSECV, and the RE value [12].
Table 2 presents the optimal calibration models obtainedusing each of the tested variable selection methods for each
12,000 11,000 10,000 9000 8000 7000 6000 50000
1
2
3
4
Abs
orba
nce
Wavenumber (cm–1)
Figure 1: +e NIR spectra of the apple juices under study.
Table 1: +e soluble solids content (SSC), the titratable acidity(TA), and the ratio of the soluble solids to the titratable acidity(SSC/TA) of the apple juices in the calibration set (n � 30 samples).
Parameter Range Mean SDSSC (°Brix) 11.0–13.6 11.68 0.79TA (g/L) 4.51–6.09 5.25 0.48SSC/TA 1.84–2.71 2.24 0.28
4 Journal of Spectroscopy
of the parameters studied. +e characteristics of the modelsdeveloped using the full raw spectra are also presented forcomparison.
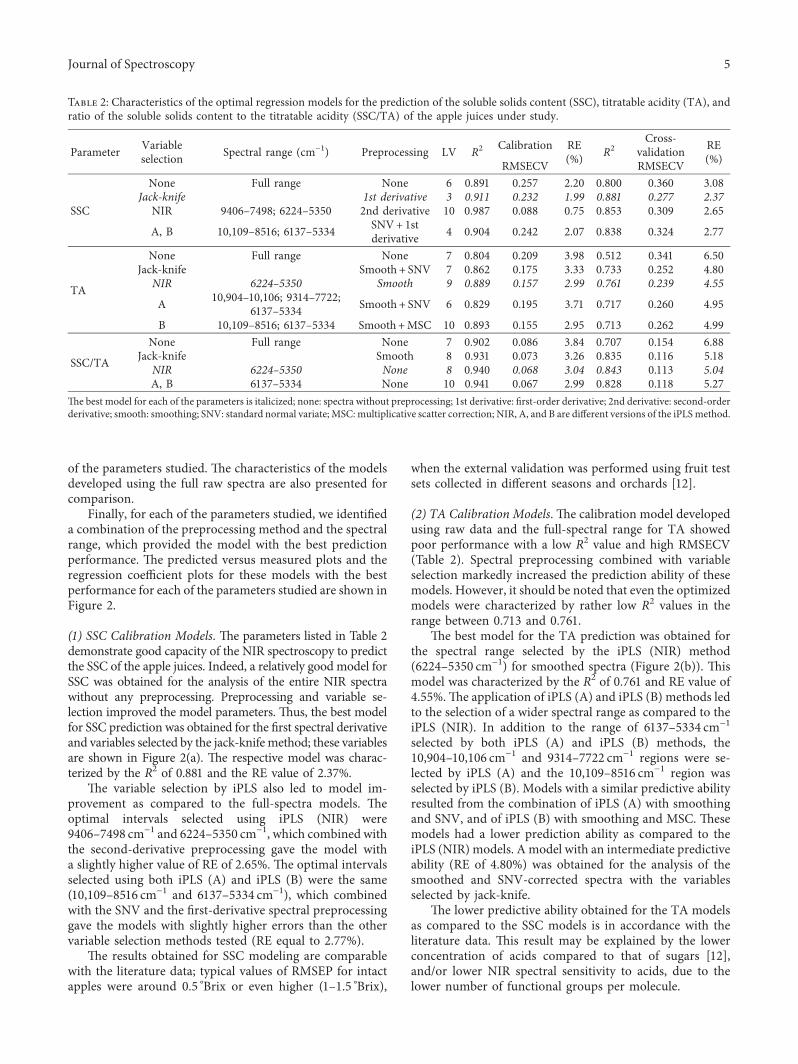
Finally, for each of the parameters studied, we identifieda combination of the preprocessing method and the spectralrange, which provided the model with the best predictionperformance. +e predicted versus measured plots and theregression coefficient plots for these models with the bestperformance for each of the parameters studied are shown inFigure 2.
(1) SSC Calibration Models. +e parameters listed in Table 2demonstrate good capacity of the NIR spectroscopy to predictthe SSC of the apple juices. Indeed, a relatively good model forSSC was obtained for the analysis of the entire NIR spectrawithout any preprocessing. Preprocessing and variable se-lection improved the model parameters. +us, the best modelfor SSC prediction was obtained for the first spectral derivativeand variables selected by the jack-knifemethod; these variablesare shown in Figure 2(a). +e respective model was charac-terized by the R2 of 0.881 and the RE value of 2.37%.
+e variable selection by iPLS also led to model im-provement as compared to the full-spectra models. +eoptimal intervals selected using iPLS (NIR) were9406–7498 cm−1 and 6224–5350 cm−1, which combined withthe second-derivative preprocessing gave the model witha slightly higher value of RE of 2.65%. +e optimal intervalsselected using both iPLS (A) and iPLS (B) were the same(10,109–8516 cm−1 and 6137–5334 cm−1), which combinedwith the SNV and the first-derivative spectral preprocessinggave the models with slightly higher errors than the othervariable selection methods tested (RE equal to 2.77%).
+e results obtained for SSC modeling are comparablewith the literature data; typical values of RMSEP for intactapples were around 0.5 °Brix or even higher (1–1.5 °Brix),
when the external validation was performed using fruit testsets collected in different seasons and orchards [12].
(2) TA Calibration Models. +e calibration model developedusing raw data and the full-spectral range for TA showedpoor performance with a low R2 value and high RMSECV(Table 2). Spectral preprocessing combined with variableselection markedly increased the prediction ability of thesemodels. However, it should be noted that even the optimizedmodels were characterized by rather low R2 values in therange between 0.713 and 0.761.
+e best model for the TA prediction was obtained forthe spectral range selected by the iPLS (NIR) method(6224–5350 cm−1) for smoothed spectra (Figure 2(b)). +ismodel was characterized by the R2 of 0.761 and RE value of4.55%.+e application of iPLS (A) and iPLS (B) methods ledto the selection of a wider spectral range as compared to theiPLS (NIR). In addition to the range of 6137–5334 cm−1selected by both iPLS (A) and iPLS (B) methods, the10,904–10,106 cm−1 and 9314–7722 cm−1 regions were se-lected by iPLS (A) and the 10,109–8516 cm−1 region wasselected by iPLS (B). Models with a similar predictive abilityresulted from the combination of iPLS (A) with smoothingand SNV, and of iPLS (B) with smoothing and MSC. +esemodels had a lower prediction ability as compared to theiPLS (NIR) models. A model with an intermediate predictiveability (RE of 4.80%) was obtained for the analysis of thesmoothed and SNV-corrected spectra with the variablesselected by jack-knife.
+e lower predictive ability obtained for the TA modelsas compared to the SSC models is in accordance with theliterature data. +is result may be explained by the lowerconcentration of acids compared to that of sugars [12],and/or lower NIR spectral sensitivity to acids, due to thelower number of functional groups per molecule.
Table 2: Characteristics of the optimal regression models for the prediction of the soluble solids content (SSC), titratable acidity (TA), andratio of the soluble solids content to the titratable acidity (SSC/TA) of the apple juices under study.
Parameter Variableselection Spectral range (cm−1) Preprocessing LV R2 Calibration RE
(%) R2Cross-
validation RE(%)RMSECV RMSECV
SSC
None Full range None 6 0.891 0.257 2.20 0.800 0.360 3.08Jack-knife 1st derivative 3 0.911 0.232 1.99 0.881 0.277 2.37
NIR 9406–7498; 6224–5350 2nd derivative 10 0.987 0.088 0.75 0.853 0.309 2.65
A, B 10,109–8516; 6137–5334 SNV+ 1stderivative 4 0.904 0.242 2.07 0.838 0.324 2.77
TA
None Full range None 7 0.804 0.209 3.98 0.512 0.341 6.50Jack-knife Smooth + SNV 7 0.862 0.175 3.33 0.733 0.252 4.80
NIR 6224–5350 Smooth 9 0.889 0.157 2.99 0.761 0.239 4.55
A 10,904–10,106; 9314–7722;6137–5334 Smooth + SNV 6 0.829 0.195 3.71 0.717 0.260 4.95
B 10,109–8516; 6137–5334 Smooth +MSC 10 0.893 0.155 2.95 0.713 0.262 4.99
SSC/TA
None Full range None 7 0.902 0.086 3.84 0.707 0.154 6.88Jack-knife Smooth 8 0.931 0.073 3.26 0.835 0.116 5.18
NIR 6224–5350 None 8 0.940 0.068 3.04 0.843 0.113 5.04A, B 6137–5334 None 10 0.941 0.067 2.99 0.828 0.118 5.27
+e best model for each of the parameters is italicized; none: spectra without preprocessing; 1st derivative: first-order derivative; 2nd derivative: second-orderderivative; smooth: smoothing; SNV: standard normal variate; MSC: multiplicative scatter correction; NIR, A, and B are different versions of the iPLSmethod.
Journal of Spectroscopy 5

(3) SSC/TA Calibration Models. +e regression analysis forSSC/TA performed on raw spectra in the full-spectral rangegave a model with the R2 equal to 0.707 and RE equal to 6.88%(Table 2). Also, in this case, PLS models were significantly
improved by applying an appropriate combination of spectralpreprocessing and variable selection methods. +e perfor-mances of optimized models for the SSC/TA prediction wereintermediate as compared to those of the SSC and TAmodels.
11 12 13 14
11
12
13
14
1
23
4
5
6
78 9
101112
1314
1516
17 18
19
20
2122
2324
2526
2728
29
30
Mea
sure
d SS
C (°
Brix
)
Predicted SSC (°Brix)12,000 10,500 9000 7500 6000 4500
–300
–200
–100
0
100
Regr
essio
n co
effic
ient
s
Wavenumber (cm–1)
Samples 30Slope 0.868Offset 1.54Correlation 0.934R2 0.881RMSECV 0.277
(a)
4.0 4.5 5.0 5.5 6.0 6.5
4.0
4.5
5.0
5.5
6.0
6.5
12
3
4
5
6
7
8
9
10
1112
13
14
1516
1718
19
20
2122
23
24
2526
27
282930
Mea
sure
d TA
(g/L
)
Predicted TA (g/L)6150 6000 5850 5700 5550 5400
–300
–150
0
150
300
Regr
essio
n co
effic
ient
s
Wavenumber (cm–1)
Samples 30Slope 0.831Offset 0.889Correlation 0.868R2 0.761RMSECV 0.239
(b)
1.5 1.8 2.1 2.4 2.7
1.5
1.8
2.1
2.4
2.7
12
3
4
56
7
8
910
1112
13
14
1516
17
18
19
20
2122
23
24
2526
2728
29 30
Samples 30Slope 0.872Offset 0.283Correlation 0.913R2 0.843RMSECV 0.113
Mea
sure
d SS
C/TA
Predicted SSC/TA 6150 6000 5850 5700 5550 5400
–150
–100
–50
0
50
100
Regr
essio
n co
effic
ient
s
Wavenumber (cm–1)
(c)
Figure 2: +e results of PLS regression analysis for (a) SSC, (b) TA, and (c) SSC/TA. Left panel: predicted versus measured plots for thecross-validation. Right panel: regression coefficients.
6 Journal of Spectroscopy

+e best model was obtained for the analysis performed onspectra without preprocessing, using the variables selected bythe iPLS (NIR) method, in the range of 6224–5350 cm−1(Figure 2(c)).+ismodel was characterized by the RE of 5.04%.A slightly inferior performance was produced by the modelsthat used spectra without any preprocessing and variablesselected using the iPLS (A) or iPLS (B) method in the range of6137–5334 cm−1. +e combination of smoothing and variableselection using the jack-knife method provided a model withintermediate performance (R2 of 0.835 and RE of 5.18%).
Summing up, preprocessing and variable selection hadamarked effect on themodel performance.+e two variants ofthe iPLSmethod, versions (A) and (B), each based on the sameten intervals, selected similar spectral ranges and provided PLSmodels with a similar performance. On the contrary, for theparameters studied, using the intervals based on the chemicalknowledge of the NIR spectrum of the iPLS (NIR) variantproduced better performing models as compared to iPLS (A)or iPLS (B). Application of the jack-knife method enabledselection of variables that gave models with a similar or betterperformance as compared to the iPLS method.
+e iPLS-basedmodels with the best performance for eachof the chemical parameters studied used the 6224–5350 cm−1range (or a similar 6137–5334 cm−1 range), indicating thatspectral bands containing chemically significant informationon the parameters studied are present in this spectral region.+e models for TA and SSC/TA using this range only gavegood calibration results, while the calibration model for SSCrequired additional spectral ranges.
4. Conclusions
In the present study, we developed and optimized the cal-ibration models for the prediction of characteristic pa-rameters in apple juices. We demonstrated that NIR coupledwith multivariate calibration is a suitable method for de-termination of the parameters, which are crucial for qualityassessment (SSC and TA) and additionally for sweet-sourtaste (SSC/TA) evaluation of apple juices. An optimalcombination of the mathematical preprocessing of thespectra and selection of the variable range had to be foundindividually for each of the parameters studied, leading toa significant improvement of the model performance. +eusage of an objective variable selection method may speedup the process of model optimization, identifying thespectral ranges with significant chemical information. +eidentification of the important spectral variables may con-tribute to the development of NIR screening sensors for thequality and sensory-related properties of apple juices. Suchapplications require further studies on extended sample sets.
Data Availability
+e data are available upon request from [email protected].
Conflicts of Interest
+e authors declare that they have no conflicts of interest.
Acknowledgments
Grant 2016/23/B/NZ9/03591 from the National ScienceCentre, Poland, is gratefully acknowledged.
References
[1] J. T. Alander, V. Bochko, B. Martinkauppi, S. Saranwong, andT. Mantere, “A review of optical nondestructive visual andnear-infrared methods for food quality and safety,” In-ternational Journal of Spectroscopy, vol. 2013, Article ID341402, 36 pages, 2013.
[2] H. Cen and Y. He, “+eory and application of near infraredreflectance spectroscopy in determination of food quality,” Trendsin Food Science and Technology, vol. 18, no. 2, pp. 72–83, 2007.
[3] J. U. Porep, D. R. Kammerer, and R. Carle, “On-line appli-cation of near infrared (NIR) spectroscopy in food pro-duction,” Trends in Food Science and Technology, vol. 46, no. 2,pp. 211–230, 2015.
[4] H. Huang, H. Yu, H. Xu, and Y. Ying, “Near infrared spec-troscopy for on/in-line monitoring of quality in foods andbeverages: a review,” Journal of Food Engineering, vol. 87,no. 3, pp. 303–313, 2008.
[5] L. Wang, D.-W. Sun, H. Pu, and J.-H. Cheng, “Qualityanalysis and classification and authentication of liquid foodsby near-infrared spectroscopy: a review of recent researchdevelopments,” Critical Reviews in Food Science and Nutri-tion, vol. 57, no. 7, pp. 1524–1538, 2017.
[6] T. Woodcock, C. O’Donnell, and G. Downey, “Review: betterquality food and beverages: the role of near infrared spec-troscopy,” Journal of Near Infrared Spectroscopy, vol. 16, no. 1,pp. 1–29, 2008.
[7] M. Manley, “Near-infrared spectroscopy and hyperspectralimaging: non-destructive analysis of biological materials,”Chemical Society Reviews, vol. 43, no. 24, pp. 8200–8214, 2014.
[8] D. Cozzolino, W. U. Cynkar, N. Shah, and P. Smith, “Mul-tivariate data analysis applied to spectroscopy: potential ap-plication to juice and fruit quality,” Food ResearchInternational, vol. 44, no. 7, pp. 1888–1896, 2011.
[9] J. Engel, J. Gerretzen, E. Szymanska et al., “Breaking withtrends in pre-processing?,” TrAC Trends in AnalyticalChemistry, vol. 50, pp. 96–106, 2013.
[10] Z. Xiaobo, Z. Jiewen, M. J. W. Povey, M. Holmes, andM. Hanpin, “Variables selection methods in near-infraredspectroscopy,” Analytica Chimica Acta, vol. 667, no. 1-2,pp. 14–32, 2010.
[11] C. M. Andersen and R. Bro, “Variable selection in regression—atutorial,” Journal of Chemometrics, vol. 24, no. 11-12, pp. 728–737, 2010.
[12] B. M. Nicolaı, K. Beullens, E. Bobelyn et al., “Nondestructivemeasurement of fruit and vegetable quality by means of NIRspectroscopy: a review,” Postharvest Biology and Technology,vol. 46, no. 2, pp. 99–118, 2007.
[13] L. S. Magwaza, U. L. Opara, H. Nieuwoudt, P. J. R. Cronje,W. Saeys, and B. Nicolaı, “NIR spectroscopy applications forinternal and external quality analysis of citrus fruit—a review,”Food and Bioprocess Technology, vol. 5, no. 2, pp. 425–444, 2011.
[14] J.-L. Li, D.-W. Sun, and J.-H. Cheng, “Recent advances innondestructive analytical techniques for determining the totalsoluble solids in fruits: a review,” Comprehensive Reviews inFood Science and Food Safety, vol. 15, no. 5, pp. 897–911, 2016.
[15] H. Wang, J. Peng, C. Xie, Y. Bao, and Y. He, “Fruit qualityevaluation using spectroscopy technology: a review,” Sensors,vol. 15, no. 5, pp. 11889–11927, 2015.
Journal of Spectroscopy 7

[16] V. I. Candrawinata, J. B. Golding, P. D. Roach, andC. E. Stathopoulos, “From apple to juice—the fate of poly-phenolic compounds,” Food Reviews International, vol. 29,no. 3, pp. 276–293, 2013.
[17] S. Fan, B. Zhang, J. Li, W. Huang, and C. Wang, “Effect ofspectrum measurement position variation on the robustnessof NIR spectroscopy models for soluble solids content ofapple,” Biosystems Engineering, vol. 143, pp. 9–19, 2016.
[18] M. Schmutzler and C. W. Huck, “Simultaneous detection oftotal antioxidant capacity and total soluble solids content byFourier transform near-infrared (FT-NIR) spectroscopy:a quick and sensitive method for on-site analyses of apples,”Food Control, vol. 66, pp. 27–37, 2016.
[19] A. Peirs, N. Scheerlinck, K. Touchant, and B. M. Nicolaı,“Comparison of Fourier transform and dispersive near-infrared reflectance spectroscopy for apple quality measure-ments,” Biosystems Engineering, vol. 81, no. 3, pp. 305–311,2002.
[20] Z. Xiaobo, Z. Jiewen, H. Xingyi, and L. Yanxiao, “Use of FT-NIR spectrometry in non-invasive measurements of solublesolid contents (SSC) of ‘Fuji’ apple based on different PLSmodels,” Chemometrics and Intelligent Laboratory Systems,vol. 87, no. 1, pp. 43–51, 2007.
[21] X. Zou, J. Zhao, and Y. Li, “Selection of the efficient wave-length regions in FT-NIR spectroscopy for determination ofSSC of ‘Fuji’ apple based on BiPLS and FiPLS models,” Vi-brational Spectroscopy, vol. 44, no. 2, pp. 220–227, 2007.
[22] T. Temma, K. Hanamatsu, and F. Shinoki, “Measuring thesugar content of apples and apple juice by near infraredspectroscopy,” Optical Review, vol. 9, no. 2, pp. 40–44, 2002.
[23] L. Leon, J. D. Kelly, and G. Downey, “Detection of apple juiceadulteration using near-infrared transflectance spectroscopy,”Applied Spectroscopy, vol. 59, no. 5, pp. 593–599, 2005.
[24] L. M. Reid, T. Woodcock, C. P. O’Donnell, J. D. Kelly, andG. Downey, “Differentiation of apple juice samples on thebasis of heat treatment and variety using chemometricanalysis of MIR and NIR data,” Food Research International,vol. 38, no. 10, pp. 1109–1115, 2005.
[25] D. Zhu, B. Ji, Z. Qing, C. Wang, and M. Zude, “+e detectionof quality deterioration of apple juice by near infrared andfluorescence spectroscopy,” in Computer and ComputingTechnologies in Agriculture IV: 4th IFIP TC 12 Conference,CCTA 2010, Nanchang, China, Selected Papers, Part III, D. Li,Y. Liu, and Y. Chen, Eds., pp. 84–91, Springer, Berlin, Ger-many, 2011.
[26] M. Ye, T. Yue, Y. Yuan, and Z. Li, “Application of FT-NIRspectroscopy to apple wine for rapid simultaneous de-termination of soluble solids content, pH, total acidity, andtotal ester content,” Food and Bioprocess Technology, vol. 7,no. 10, pp. 3055–3062, 2014.
[27] N. Abu-Khalaf and B. S. Bennedsen, “Near infrared (NIR)technology and multivariate data analysis for sensing tasteattributes of apples,” International Agrophysics, vol. 18,pp. 203–211, 2004.
[28] S. Wold, M. Sjostrom, and L. Eriksson, “PLS-regression:a basic tool of chemometrics,” Chemometrics and IntelligentLaboratory Systems, vol. 58, no. 2, pp. 109–130, 2001.
[29] L. Nørgaard, A. Saudland, J. Wagner, J. P. Nielsen, L. Munck,and S. B. Engelsen, “Interval partial least-squares regression(iPLS): a comparative chemometric study with an examplefrom near-infrared spectroscopy,” Applied Spectroscopy,vol. 54, no. 3, pp. 413–419, 2000.
[30] F. Westad and H. Martens, “Variable selection in near in-frared spectroscopy based on significance testing in partial
least squares regression,” Journal of Near Infrared Spectros-copy, vol. 8, no. 2, pp. 117–124, 2000.
[31] Opus. Spectroscopy Software, Version 6. User Manual. Quant,Bruker Optik GmbH, Ettlingen, Germany, 2006.
[32] G. Giovanelli, N. Sinelli, R. Beghi, R. Guidetti, andE. Casiraghi, “NIR spectroscopy for the optimization ofpostharvest apple management,” Postharvest Biology andTechnology, vol. 87, pp. 13–20, 2014.
[33] L. Xie, X. Ye, D. Liu, and Y. Ying, “Quantification of glucose,fructose and sucrose in bayberry juice by NIR and PLS,” FoodChemistry, vol. 114, no. 3, pp. 1135–1140, 2009.
[34] A. F. Omar, H. Atan, and M. Z. MatJafri, “Peak responseidentification through near-infrared spectroscopy analysis onaqueous sucrose, glucose, and fructose solution,” SpectroscopyLetters, vol. 45, no. 3, pp. 190–201, 2012.
[35] J. Wu, H. Gao, L. Zhao et al., “Chemical compositionalcharacterization of some apple cultivars,” Food Chemistry,vol. 103, no. 1, pp. 88–93, 2007.
[36] F. J. Rambla, S. Garrigues, and M. de la Guardia, “PLS-NIRdetermination of total sugar, glucose, fructose and sucrose inaqueous solutions of fruit juices,” Analytica Chimica Acta,vol. 344, no. 1, pp. 41–53, 1997.
[37] European Fruit Juice Association, AIJN Code of Practice for theEvaluation of Fruit and Vegetable Juice, European Fruit JuiceAssociation, Brussels, Belgium, 2012, in Polish.
8 Journal of Spectroscopy

TribologyAdvances in
Hindawiwww.hindawi.com Volume 2018
Hindawiwww.hindawi.com Volume 2018
International Journal ofInternational Journal ofPhotoenergy
Hindawiwww.hindawi.com Volume 2018
Journal of
Chemistry
Hindawiwww.hindawi.com Volume 2018
Advances inPhysical Chemistry
Hindawiwww.hindawi.com
Analytical Methods in Chemistry
Journal of
Volume 2018
Bioinorganic Chemistry and ApplicationsHindawiwww.hindawi.com Volume 2018
SpectroscopyInternational Journal of
Hindawiwww.hindawi.com Volume 2018
Hindawi Publishing Corporation http://www.hindawi.com Volume 2013Hindawiwww.hindawi.com
The Scientific World Journal
Volume 2018
Medicinal ChemistryInternational Journal of
Hindawiwww.hindawi.com Volume 2018
NanotechnologyHindawiwww.hindawi.com Volume 2018
Journal of
Applied ChemistryJournal of
Hindawiwww.hindawi.com Volume 2018
Hindawiwww.hindawi.com Volume 2018
Biochemistry Research International
Hindawiwww.hindawi.com Volume 2018
Enzyme Research
Hindawiwww.hindawi.com Volume 2018
Journal of
SpectroscopyAnalytical ChemistryInternational Journal of
Hindawiwww.hindawi.com Volume 2018
MaterialsJournal of
Hindawiwww.hindawi.com Volume 2018
Hindawiwww.hindawi.com Volume 2018
BioMed Research International Electrochemistry
International Journal of
Hindawiwww.hindawi.com Volume 2018
Na
nom
ate
ria
ls
Hindawiwww.hindawi.com Volume 2018
Journal ofNanomaterials
Submit your manuscripts atwww.hindawi.com