near-road air quality monitoring network: status and data · near-road air quality monitoring...
TRANSCRIPT
Near-road Air Quality Monitoring Network: Status and Data
Nealson Watkins U.S. EPA
Office of Air and Radiation Office of Air Quality Planning and Standards
2016 National Monitoring Conference 1
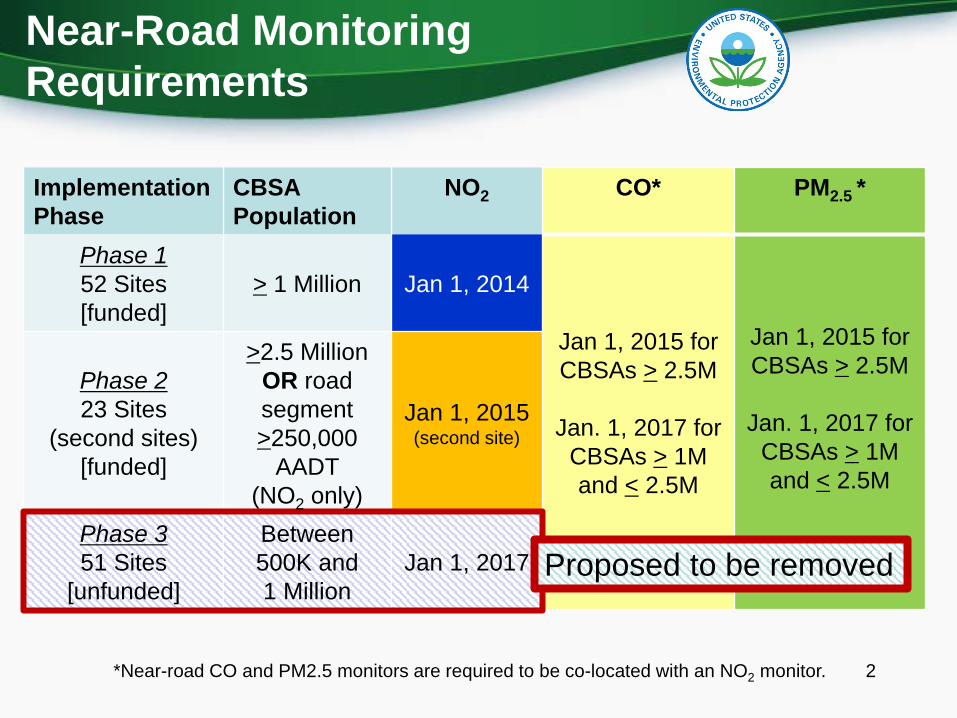
Near-Road Monitoring Requirements
Implementation Phase
CBSA Population
NO2
Phase 1 52 Sites [funded]
> 1 Million Jan 1, 2014
Phase 2 23 Sites
(second sites) [funded]
>2.5 Million OR road segment >250,000
AADT (NO2 only)
Jan 1, 2015 (second site)
Phase 3 51 Sites
[unfunded]
Between 500K and 1 Million
Jan 1, 2017 Proposed to be removed
CO*
Jan 1, 2015 for CBSAs > 2.5M
Jan. 1, 2017 for CBSAs > 1M and < 2.5M
PM2.5 *
Jan 1, 2015 for CBSAs > 2.5M
Jan. 1, 2017 for CBSAs > 1M and < 2.5M
*Near-road CO and PM2.5 monitors are required to be co-located with an NO2 monitor. 2
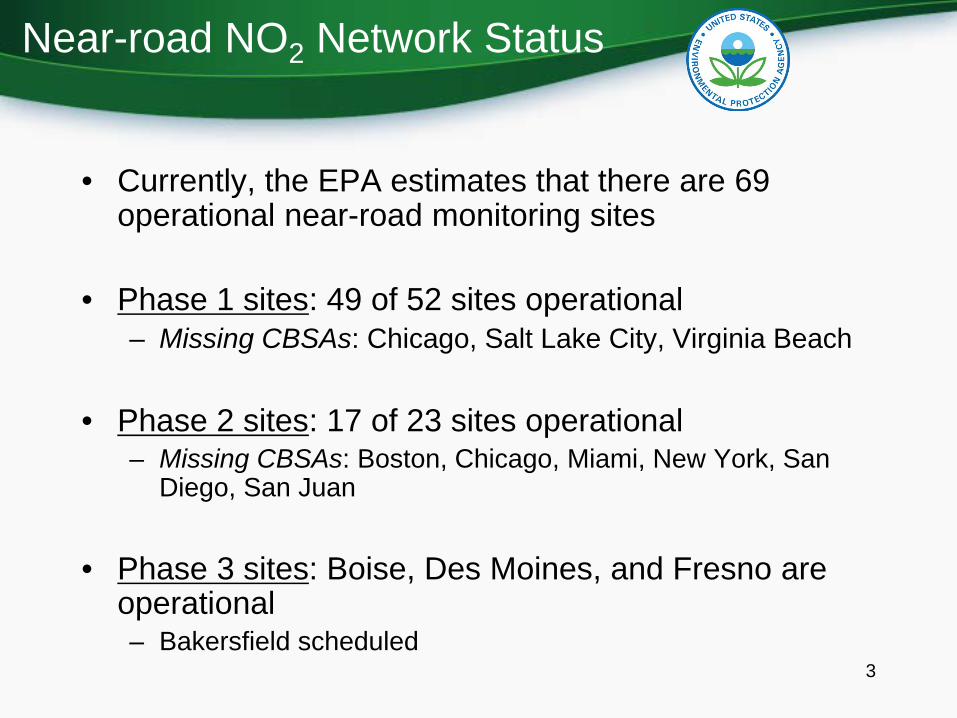
Near-road NO2 Network Status
• Currently, the EPA estimates that there are 69 operational near-road monitoring sites
• Phase 1 sites: 49 of 52 sites operational – Missing CBSAs: Chicago, Salt Lake City, Virginia Beach
• Phase 2 sites: 17 of 23 sites operational – Missing CBSAs: Boston, Chicago, Miami, New York, San
Diego, San Juan
• Phase 3 sites: Boise, Des Moines, and Fresno are operational – Bakersfield scheduled
3
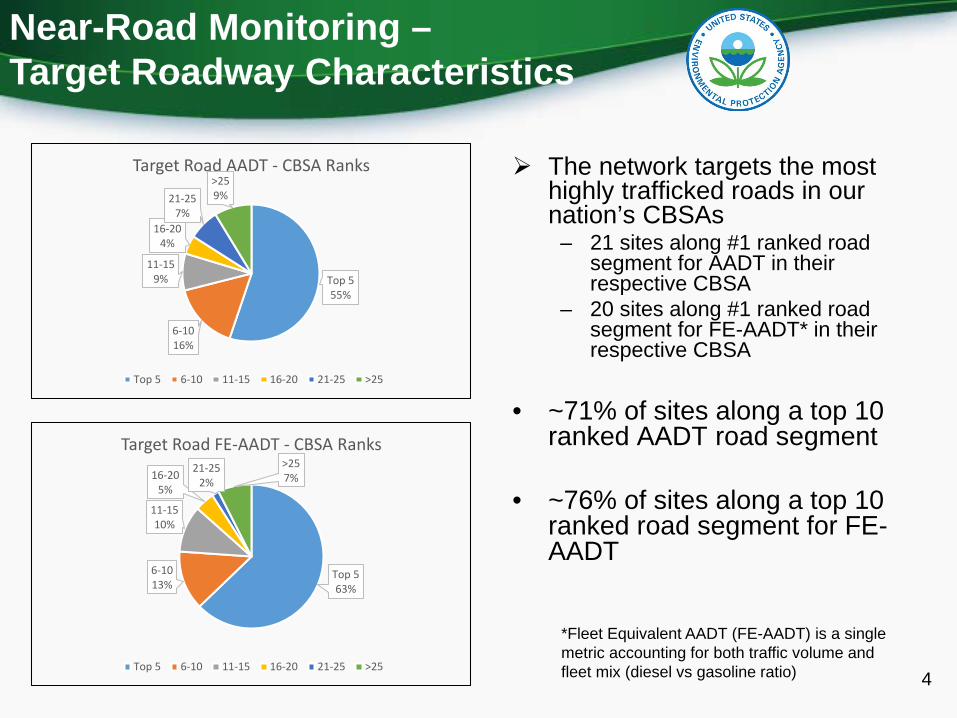
Near-Road Monitoring – Target Roadway Characteristics
Target Road AADT - CBSA Ranks
Top 5 55%
6-10 16%
11-15 9%
16-20 4%
21-25 7%
>25 9%
The network targets the mosthighly trafficked roads in ournation’s CBSAs
– 21 sites along #1 ranked road segment for AADT in theirrespective CBSA
– 20 sites along #1 ranked road segment for FE-AADT* in their respective CBSA
Top 5 6-10 11-15 16-20 21-25 >25
• ~71% of sites along a top 10Target Road FE-AADT - CBSA Ranks ranked AADT road segment
• ~76% of sites along a top 10ranked road segment for FEAADT
*Fleet Equivalent AADT (FE-AADT) is a single metric accounting for both traffic volume and
Top 5 6-10 11-15 16-20 21-25 >25 fleet mix (diesel vs gasoline ratio)
Top 5 63%
6-10 13%
11-15 10%
16-20 5%
21-25 2%
>25 7%
4
35
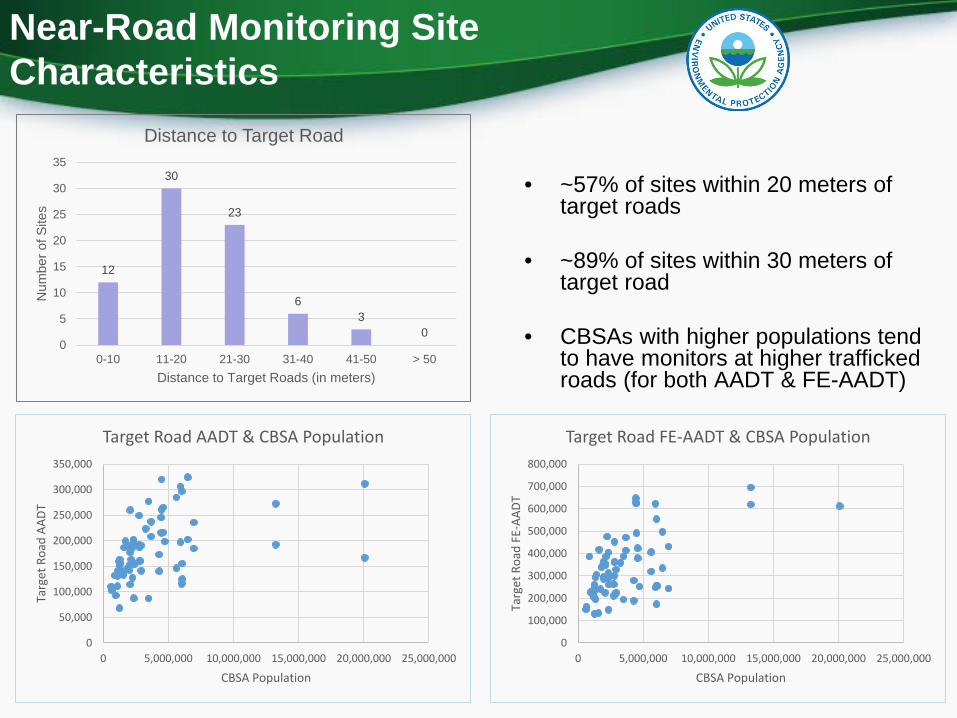
Near-Road Monitoring Site Characteristics
Distance to Target Road
• ~57% of sites within 20 meters of
12
30
23
6 3
0 0
5
10
15
20
25
30
Num
ber o
f Site
s target roads
• ~89% of sites within 30 meters of target road
• CBSAs with higher populations tend 0-10 11-20 21-30 31-40 41-50 > 50 to have monitors at higher trafficked
Distance to Target Roads (in meters) roads (for both AADT & FE-AADT)
0
50,000
100,000
150,000
200,000
250,000
300,000
350,000
0 5,000,000 10,000,000 15,000,000 20,000,000 25,000,000
Targ
et R
oad
AADT
CBSA Population
Target Road AADT & CBSA Population
0
100,000
200,000
300,000
400,000
500,000
600,000
700,000
800,000
0 5,000,000 10,000,000 15,000,000 20,000,000 25,000,000
Targ
et R
oad
FE-A
ADT
CBSA Population
Target Road FE-AADT & CBSA Population
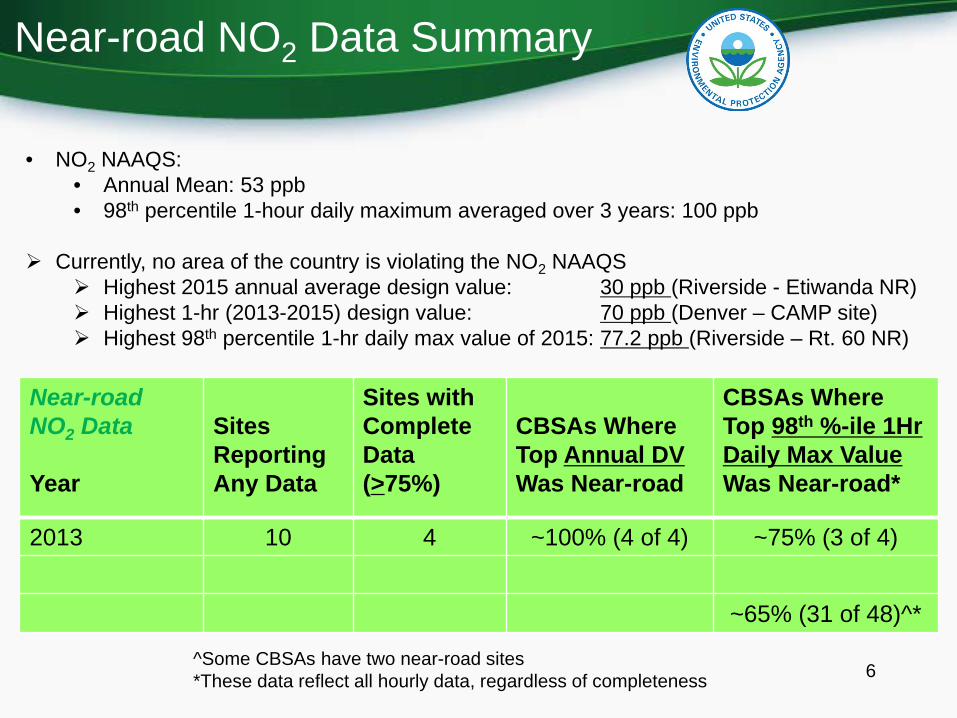
Near-road NO2 Data Summary
• NO2 NAAQS: • Annual Mean: 53 ppb • 98th percentile 1-hour daily maximum averaged over 3 years: 100 ppb
Currently, no area of the country is violating the NO2 NAAQS Highest 2015 annual average design value: 30 ppb (Riverside - Etiwanda NR) Highest 1-hr (2013-2015) design value: 70 ppb (Denver – CAMP site) Highest 98th percentile 1-hr daily max value of 2015: 77.2 ppb (Riverside – Rt. 60 NR)
2014 42 22 ~86% (19 of 22) ~50% (21 of 42)* 2015 60 43 ~84% (36 of 43)^ ~65% (31 of 48)^*
^Some CBSAs have two near-road sites 6*These data reflect all hourly data, regardless of completeness
Near-road NO2 Data
Year
Sites Reporting Any Data
2013 10
Sites with Complete Data (>75%)
4
CBSAs Where Top Annual DV Was Near-road
~100% (4 of 4)
CBSAs Where Top 98th %-ile 1Hr Daily Max Value Was Near-road*
~75% (3 of 4)
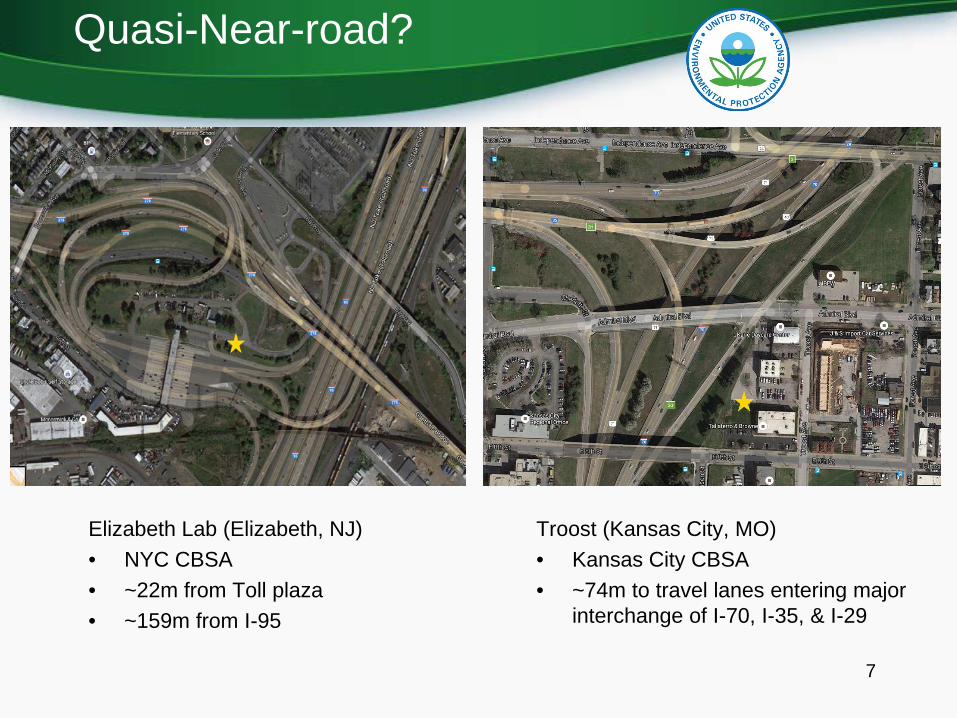
Quasi-Near-road?
Elizabeth Lab (Elizabeth, NJ) Troost (Kansas City, MO) • NYC CBSA • Kansas City CBSA • ~22m from Toll plaza • ~74m to travel lanes entering major • ~159m from I-95 interchange of I-70, I-35, & I-29
7
8
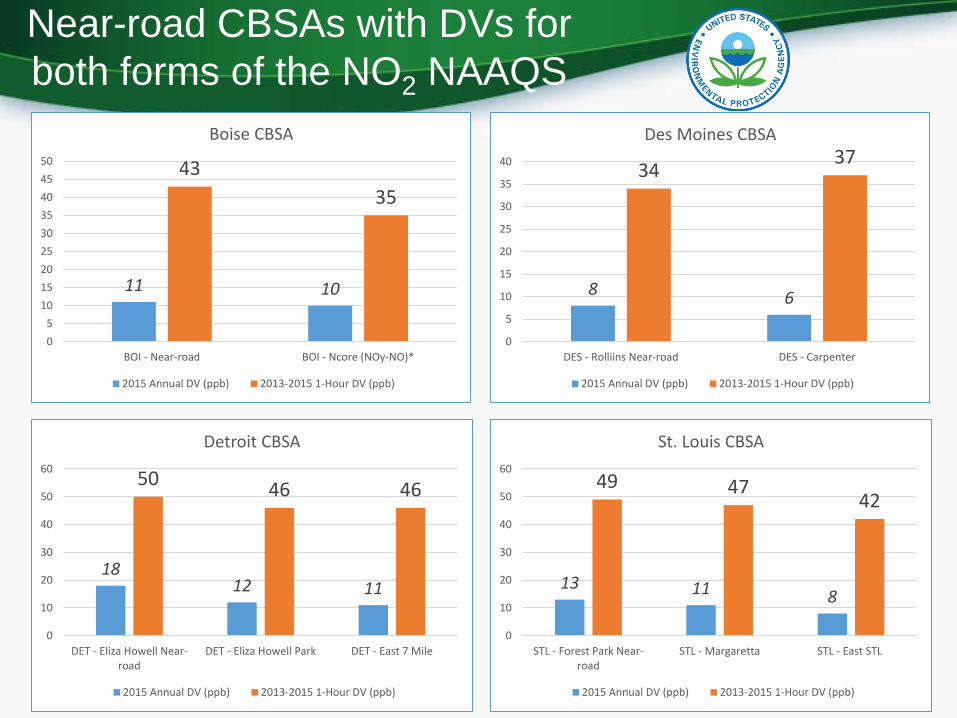
Near-road CBSAs with DVs for both forms of the NO2 NAAQS
11 10
43 35
0 5
10 15 20 25 30 35 40 45 50
Boise CBSA
8 6
34 37
0
5
10
15
20
25
30
35
40
Des Moines CBSA
Detroit CBSA 60 50
St. Louis CBSA 60
49 47
13 11 8
42
0
10
20
30
40
50
18 12 11
46 46
0
10
20
30
40
50
BOI - Near-road BOI - Ncore (NOy-NO)*
2015 Annual DV (ppb) 2013-2015 1-Hour DV (ppb)
DES - Rolliins Near-road DES - Carpenter
2015 Annual DV (ppb) 2013-2015 1-Hour DV (ppb)
DET - Eliza Howell Near- DET - Eliza Howell Park DET - East 7 Mile road
STL - Forest Park Near- STL - Margaretta STL - East STL road
2015 Annual DV (ppb) 2013-2015 1-Hour DV (ppb) 2015 Annual DV (ppb) 2013-2015 1-Hour DV (ppb)
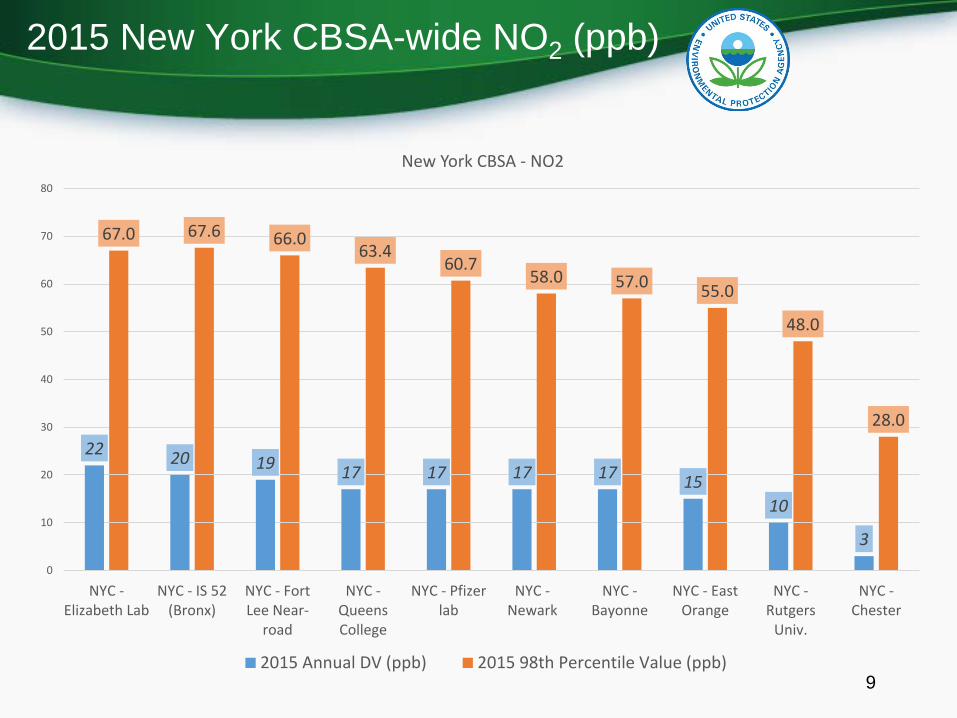
2015 New York CBSA-wide NO2 (ppb)
80
New York CBSA - NO2
50
60
70 67.0 67.6 66.0 63.4
60.7 58.0 57.0 55.0
48.0
40
22 20 19 17 17 17 17 15 10
3
28.0
0
10
20
30
NYC -Elizabeth Lab
NYC - IS 52 (Bronx)
NYC - Fort Lee Near-
road
NYC -Queens College
NYC - Pfizer lab
NYC -Newark
NYC -Bayonne
NYC - East Orange
NYC -Rutgers
Univ.
NYC -Chester
2015 Annual DV (ppb) 2015 98th Percentile Value (ppb) 9
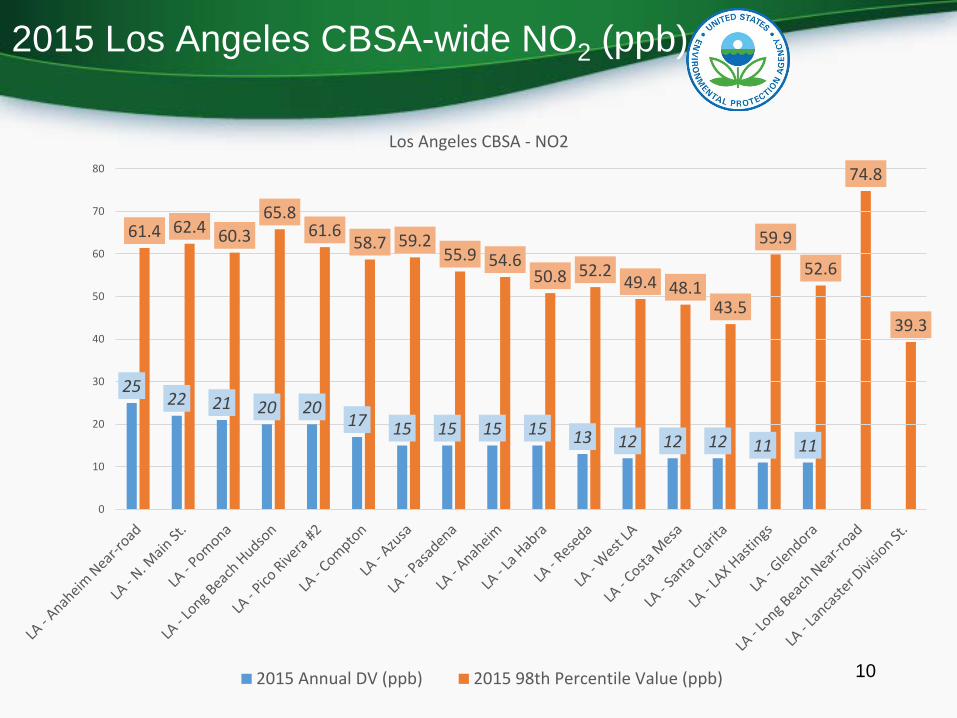
2015 Los Angeles CBSA-wide NO2 (ppb)
Los Angeles CBSA - NO2 80 74.8
70
60
50
40
30
20
10
0
10
25 22 21 20 20
17 15 15 15 15 13 12 12 12 11 11
61.4 62.4 60.3 65.8
61.6 58.7 59.2
55.9 54.6 50.8 52.2
49.4 48.1 43.5
59.9
52.6
2015 Annual DV (ppb) 2015 98th Percentile Value (ppb)
39.3
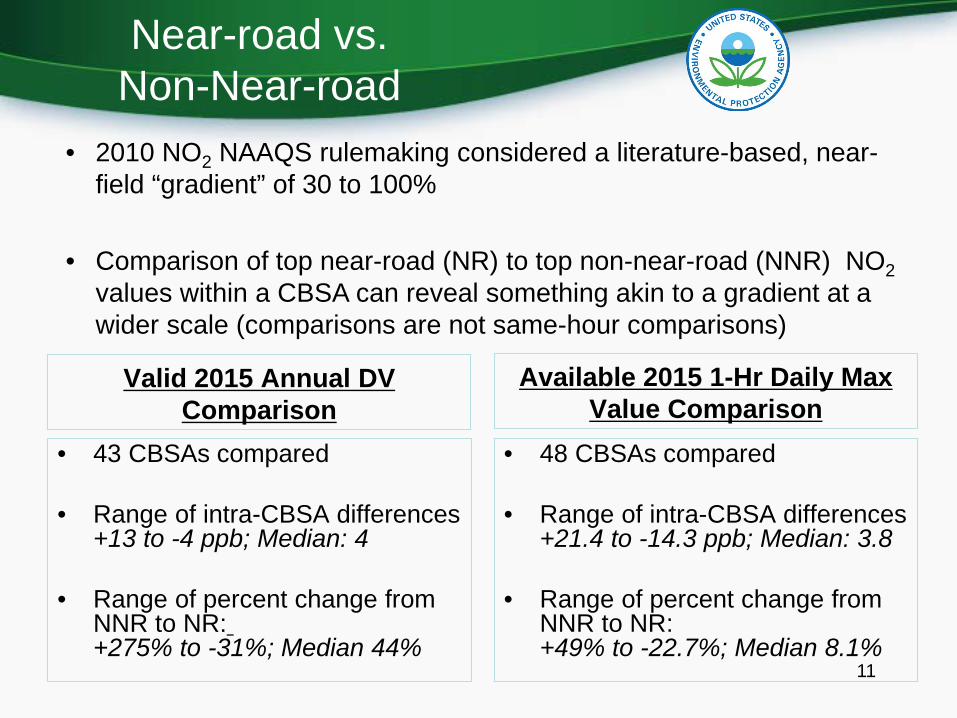
Near-road vs. Non-Near-road
• 2010 NO2 NAAQS rulemaking considered a literature-based, near-field “gradient” of 30 to 100%
• Comparison of top near-road (NR) to top non-near-road (NNR) NO2 values within a CBSA can reveal something akin to a gradient at a wider scale (comparisons are not same-hour comparisons)
Valid 2015 Annual DV Comparison
Available 2015 1-Hr Daily Max Value Comparison
• 43 CBSAs compared
• Range of intra-CBSA differences+13 to -4 ppb; Median: 4
• Range of percent change fromNNR to NR: +275% to -31%; Median 44%
• 48 CBSAs compared
• Range of intra-CBSA differences +21.4 to -14.3 ppb; Median: 3.8
• Range of percent change from NNR to NR: +49% to -22.7%; Median 8.1%
11
Near-road Sites: Multi-pollutant
• Near-road sites have always been envisioned to be multipollutant
• In addition to NO2 at all Near-road sites, we currently estimate: – 38 sites with PM2.5 instrumentation – 49 sites with CO instrumentation – 20 sites with black carbon instruments
• For a complete listing of current near-road site metadata, visit http://www.epa.gov/ttnamti1/nearroad.html
12
Near-road PM2.5 & CO
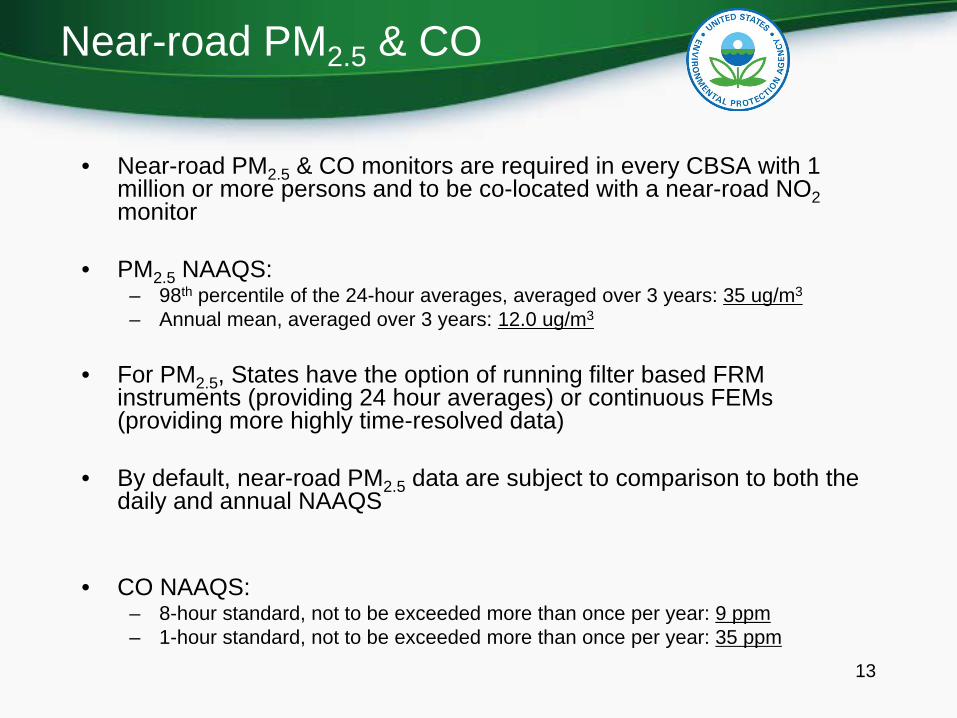
• Near-road PM2.5 & CO monitors are required in every CBSA with 1 million or more persons and to be co-located with a near-road NO2monitor
• PM2.5 NAAQS: – 98th percentile of the 24-hour averages, averaged over 3 years: 35 ug/m3
– Annual mean, averaged over 3 years: 12.0 ug/m3
• For PM2.5, States have the option of running filter based FRMinstruments (providing 24 hour averages) or continuous FEMs(providing more highly time-resolved data)
• By default, near-road PM2.5 data are subject to comparison to both the daily and annual NAAQS
• CO NAAQS: – 8-hour standard, not to be exceeded more than once per year: 9 ppm – 1-hour standard, not to be exceeded more than once per year: 35 ppm
13
HighNest
ear Near
--rroad Poad PM2.5 Co
Mncent
Daratio
tans (1 year snapshot of complete data only)
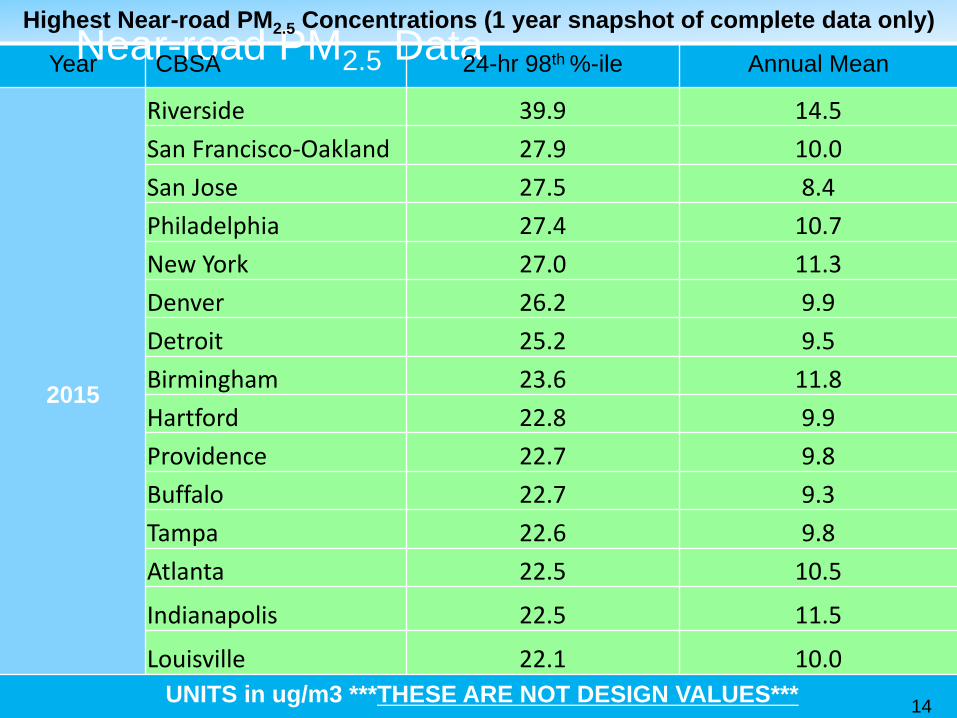
Year CBSA 2.5 24-hr 98th %-ile Annual Mean
Riverside 39.9 14.5 San Francisco-Oakland 27.9 10.0 San Jose 27.5 8.4 Philadelphia 27.4 10.7 New York 27.0 11.3 Denver 26.2 9.9 Detroit 25.2 9.5 Birmingham 23.6 11.8 Hartford 22.8 9.9 Providence 22.7 9.8 Buffalo 22.7 9.3 Tampa 22.6 9.8 Atlanta 22.5 10.5
Indianapolis 22.5 11.5
Louisville 22.1 10.0
2015
UNITS in ug/m3 ***THESE ARE NOT DESIGN VALUES*** 14
Near-road CO Data
15
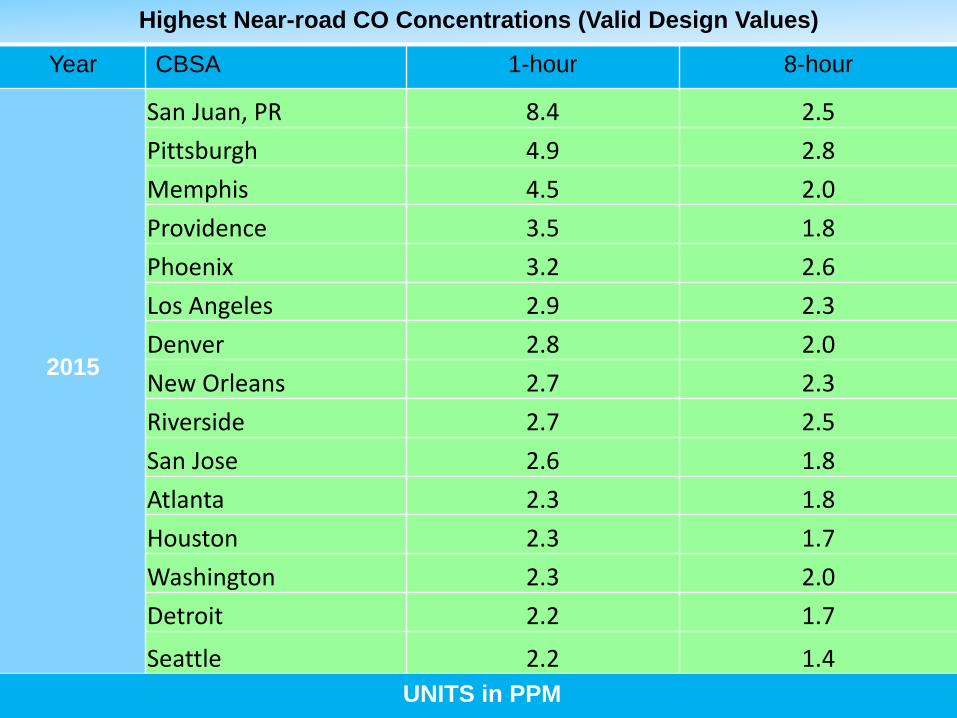
Highest Near-road CO Concentrations (Valid Design Values)
Year CBSA 1-hour 8-hour
2015
San Juan, PR 8.4 2.5 Pittsburgh 4.9 2.8 Memphis 4.5 2.0 Providence 3.5 1.8 Phoenix 3.2 2.6 Los Angeles 2.9 2.3 Denver 2.8 2.0 New Orleans 2.7 2.3 Riverside 2.7 2.5 San Jose 2.6 1.8 Atlanta 2.3 1.8 Houston 2.3 1.7 Washington 2.3 2.0 Detroit 2.2 1.7
Seattle 2.2 1.4 UNITS in PPM
Proposal: Remove Phase 3 of Near-road Network
• Proposed rule signed Thursday May 5th and published May 16th
– 81 FR 30224; EPA-HQ-OAR-2015-0486 – 45 day public comment period – closed June 30, 2016
• The EPA is proposing to remove requirements for near-road NO2monitoring in CBSAs having populations between 500,000 and 1,000,000 persons (also known as Phase 3)
• This proposal is based on current data and an evaluation of therelationship between CBSA populations, traffic, and measured NO2concentrations
– Current near-road NO2 data being measured in our larger urban areas indicate air quality levels in the near-road environment are generally well below the NAAQS for NO2
– The EPA expects measured near-road NO2 concentrations in relatively smallerCBSAs would exhibit similar and, more likely, lower concentrations that what is being measured in larger urban areas
– This action would relieve states of installing an estimated 53 new near-road sites
• This action does not impact Phase 1 or 2 of the near-road NO2network, nor does it impact requirements for monitoring PM2.5 and CO in the near-road environment.
16
Proposal: Remove Phase 3 of Near-road Network (cont.)
• 22 Public comment submissions received – 14 State, local, tribal, or multi-agency organizations – 4 Industry – 3 Public health or environmental organizations – 1 Anonymous public comment
• 18 Support the proposed rule • 3 Provided adverse comment • 1 Comment outside scope of proposal
• The Notice of Final Rulemaking is currently beingdrafted. – The EPA hopes to have a signed NFR no later than the
end of the calendar year – Waiting on OMB significance determination 17
Near-road Next Steps… • Complete the rulemaking action where we proposed the revision
to the near-road NO2 monitoring requirements
• Oversight on remaining installation of required sites – EPA Regions and HQ are tracking installations & are available to assist
• Continue updating near-road site metadata – Characterizing the sites is critical to data analyses
• Data reporting – Real-time reporting
• Continue analyzing data as it is reported – NO2 NAAQS Review is utilizing the new NO2 data – Prepare for near-road data use in future NAAQS reviews – Continue providing periodic updates to stakeholders – Promote and track near-road data use in health and science research 18