nchrp report 551 – performance measures and … · targets for transportation asset management...
TRANSCRIPT
Performance Measures andTargets for Transportation
Asset Management
NATIONALCOOPERATIVE HIGHWAYRESEARCH PROGRAMNCHRP
REPORT 551

TRANSPORTATION RESEARCH BOARD EXECUTIVE COMMITTEE 2005 (Membership as of November 2005)
OFFICERSChair: John R. Njord, Executive Director, Utah DOTVice Chair: Michael D. Meyer, Professor, School of Civil and Environmental Engineering, Georgia Institute of TechnologyExecutive Director: Robert E. Skinner, Jr., Transportation Research Board
MEMBERSMICHAEL W. BEHRENS, Executive Director, Texas DOTALLEN D. BIEHLER, Secretary, Pennsylvania DOTLARRY L. BROWN, SR., Executive Director, Mississippi DOTDEBORAH H. BUTLER, Vice President, Customer Service, Norfolk Southern Corporation and Subsidiaries, Atlanta, GAANNE P. CANBY, President, Surface Transportation Policy Project, Washington, DCJOHN L. CRAIG, Director, Nebraska Department of RoadsDOUGLAS G. DUNCAN, President and CEO, FedEx Freight, Memphis, TNNICHOLAS J. GARBER, Professor of Civil Engineering, University of VirginiaANGELA GITTENS, Vice President, Airport Business Services, HNTB Corporation, Miami, FLGENEVIEVE GIULIANO, Director, Metrans Transportation Center, and Professor, School of Policy, Planning, and Development,
USC, Los AngelesBERNARD S. GROSECLOSE, JR., President and CEO, South Carolina State Ports AuthoritySUSAN HANSON, Landry University Professor of Geography, Graduate School of Geography, Clark UniversityJAMES R. HERTWIG, President, CSX Intermodal, Jacksonville, FLGLORIA JEAN JEFF, Director, Michigan DOTADIB K. KANAFANI, Cahill Professor of Civil Engineering, University of California, Berkeley HERBERT S. LEVINSON, Principal, Herbert S. Levinson Transportation Consultant, New Haven, CTSUE MCNEIL, Professor, Department of Civil and Environmental Engineering, University of DelawareMICHAEL R. MORRIS, Director of Transportation, North Central Texas Council of GovernmentsCAROL A. MURRAY, Commissioner, New Hampshire DOTMICHAEL S. TOWNES, President and CEO, Hampton Roads Transit, Hampton, VAC. MICHAEL WALTON, Ernest H. Cockrell Centennial Chair in Engineering, University of Texas, AustinLINDA S. WATSON, Executive Director, LYNX—Central Florida Regional Transportation Authority
MARION C. BLAKEY, Federal Aviation Administrator, U.S.DOT (ex officio)JOSEPH H. BOARDMAN, Federal Railroad Administrator, U.S.DOT (ex officio)REBECCA M. BREWSTER, President and COO, American Transportation Research Institute, Smyrna, GA (ex officio)GEORGE BUGLIARELLO, Chancellor, Polytechnic University, and Foreign Secretary, National Academy of Engineering (ex officio)J. RICHARD CAPKA, Acting Administrator, Federal Highway Administration, U.S.DOT (ex officio)THOMAS H. COLLINS (Adm., U.S. Coast Guard), Commandant, U.S. Coast Guard (ex officio)JAMES J. EBERHARDT, Chief Scientist, Office of FreedomCAR and Vehicle Technologies, U.S. Department of Energy (ex officio)JACQUELINE GLASSMAN, Deputy Administrator, National Highway Traffic Safety Administration, U.S.DOT (ex officio)EDWARD R. HAMBERGER, President and CEO, Association of American Railroads (ex officio)DAVID B. HORNER, Acting Deputy Administrator, Federal Transit Administration, U.S.DOT (ex officio)JOHN C. HORSLEY, Executive Director, American Association of State Highway and Transportation Officials (ex officio)JOHN E. JAMIAN, Acting Administrator, Maritime Administration, U.S.DOT (ex officio)EDWARD JOHNSON, Director, Applied Science Directorate, National Aeronautics and Space Administration (ex officio) ASHOK G. KAVEESHWAR, Research and Innovative Technology Administrator, U.S.DOT (ex officio) BRIGHAM MCCOWN, Deputy Administrator, Pipeline and Hazardous Materials Safety Administration, U.S.DOT (ex officio)WILLIAM W. MILLAR, President, American Public Transportation Association (ex officio) SUZANNE RUDZINSKI, Director, Transportation and Regional Programs, U.S. Environmental Protection Agency (ex officio)ANNETTE M. SANDBERG, Federal Motor Carrier Safety Administrator, U.S.DOT (ex officio)JEFFREY N. SHANE, Under Secretary for Policy, U.S.DOT (ex officio)CARL A. STROCK (Maj. Gen., U.S. Army), Chief of Engineers and Commanding General, U.S. Army Corps of Engineers (ex officio)
NATIONAL COOPERATIVE HIGHWAY RESEARCH PROGRAM
Transportation Research Board Executive Committee Subcommittee for NCHRPJOHN R. NJORD, Utah DOT (Chair)J. RICHARD CAPKA, Federal Highway Administration JOHN C. HORSLEY, American Association of State Highway
and Transportation Officials
MICHAEL D. MEYER, Georgia Institute of TechnologyROBERT E. SKINNER, JR., Transportation Research BoardMICHAEL S. TOWNES, Hampton Roads Transit, Hampton, VA C. MICHAEL WALTON, University of Texas, Austin

T R A N S P O R T A T I O N R E S E A R C H B O A R DWASHINGTON, D.C.
2006www.TRB.org
NATIONAL COOPERATIVE HIGHWAY RESEARCH PROGRAM
NCHRP REPORT 551
Research Sponsored by the American Association of State Highway and Transportation Officials in Cooperation with the Federal Highway Administration
SUBJECT AREAS
Planning and Administration • Pavement Design, Management, and Performance • Maintenance
Performance Measures andTargets for Transportation
Asset Management
CAMBRIDGE SYSTEMATICS, INC.Chevy Chase, MD
WITH
PB CONSULT, INC.New York, NY
TEXAS TRANSPORTATION INSTITUTE
College Station, TX

NATIONAL COOPERATIVE HIGHWAY RESEARCH PROGRAM
Systematic, well-designed research provides the most effectiveapproach to the solution of many problems facing highwayadministrators and engineers. Often, highway problems are of localinterest and can best be studied by highway departmentsindividually or in cooperation with their state universities andothers. However, the accelerating growth of highway transportationdevelops increasingly complex problems of wide interest tohighway authorities. These problems are best studied through acoordinated program of cooperative research.
In recognition of these needs, the highway administrators of theAmerican Association of State Highway and TransportationOfficials initiated in 1962 an objective national highway researchprogram employing modern scientific techniques. This program issupported on a continuing basis by funds from participatingmember states of the Association and it receives the full cooperationand support of the Federal Highway Administration, United StatesDepartment of Transportation.
The Transportation Research Board of the National Academieswas requested by the Association to administer the researchprogram because of the Board’s recognized objectivity andunderstanding of modern research practices. The Board is uniquelysuited for this purpose as it maintains an extensive committeestructure from which authorities on any highway transportationsubject may be drawn; it possesses avenues of communications andcooperation with federal, state and local governmental agencies,universities, and industry; its relationship to the National ResearchCouncil is an insurance of objectivity; it maintains a full-timeresearch correlation staff of specialists in highway transportationmatters to bring the findings of research directly to those who are ina position to use them.
The program is developed on the basis of research needsidentified by chief administrators of the highway and transportationdepartments and by committees of AASHTO. Each year, specificareas of research needs to be included in the program are proposedto the National Research Council and the Board by the AmericanAssociation of State Highway and Transportation Officials.Research projects to fulfill these needs are defined by the Board, andqualified research agencies are selected from those that havesubmitted proposals. Administration and surveillance of researchcontracts are the responsibilities of the National Research Counciland the Transportation Research Board.
The needs for highway research are many, and the NationalCooperative Highway Research Program can make significantcontributions to the solution of highway transportation problems ofmutual concern to many responsible groups. The program,however, is intended to complement rather than to substitute for orduplicate other highway research programs.
Published reports of the
NATIONAL COOPERATIVE HIGHWAY RESEARCH PROGRAM
are available from:
Transportation Research BoardBusiness Office500 Fifth Street, NWWashington, DC 20001
and can be ordered through the Internet at:http://www.national-academies.org/trb/bookstore
Printed in the United States of America
NCHRP REPORT 551
Price $42.00
Project 20-60
ISSN 0077-5614
ISBN 0-309-09847-5
Library of Congress Control Number 2006922152
© 2006 Transportation Research Board
COPYRIGHT PERMISSION
Authors herein are responsible for the authenticity of their materials and for obtainingwritten permissions from publishers or persons who own the copyright to anypreviously published or copyrighted material used herein.
Cooperative Research Programs (CRP) grants permission to reproduce material in thispublication for classroom and not-for-profit purposes. Permission is given with theunderstanding that none of the material will be used to imply TRB, AASHTO, FAA,FHWA, FMCSA, FTA, or Transit Development Corporation endorsement of aparticular product, method, or practice. It is expected that those reproducing thematerial in this document for educational and not-for-profit uses will give appropriateacknowledgment of the source of any reprinted or reproduced material. For other usesof the material, request permission from CRP.
NOTICE
The project that is the subject of this report was a part of the National CooperativeHighway Research Program conducted by the Transportation Research Board with theapproval of the Governing Board of the National Research Council. Such approvalreflects the Governing Board’s judgment that the program concerned is of nationalimportance and appropriate with respect to both the purposes and resources of theNational Research Council.
The members of the technical committee selected to monitor this project and to reviewthis report were chosen for recognized scholarly competence and with dueconsideration for the balance of disciplines appropriate to the project. The opinions andconclusions expressed or implied are those of the research agency that performed theresearch, and, while they have been accepted as appropriate by the technical committee,they are not necessarily those of the Transportation Research Board, the NationalResearch Council, the American Association of State Highway and TransportationOfficials, or the Federal Highway Administration, U.S. Department of Transportation.
Each report is reviewed and accepted for publication by the technical committeeaccording to procedures established and monitored by the Transportation ResearchBoard Executive Committee and the Governing Board of the National ResearchCouncil.
NOTE: The Transportation Research Board of the National Academies, theNational Research Council, the Federal Highway Administration, the AmericanAssociation of State Highway and Transportation Officials, and the individualstates participating in the National Cooperative Highway Research Program donot endorse products or manufacturers. Trade or manufacturers’ names appearherein solely because they are considered essential to the object of this report.

The National Academy of Sciences is a private, nonprofit, self-perpetuating society of distinguished schol-ars engaged in scientific and engineering research, dedicated to the furtherance of science and technology and to their use for the general welfare. On the authority of the charter granted to it by the Congress in 1863, the Academy has a mandate that requires it to advise the federal government on scientific and techni-cal matters. Dr. Ralph J. Cicerone is president of the National Academy of Sciences.
The National Academy of Engineering was established in 1964, under the charter of the National Acad-emy of Sciences, as a parallel organization of outstanding engineers. It is autonomous in its administration and in the selection of its members, sharing with the National Academy of Sciences the responsibility for advising the federal government. The National Academy of Engineering also sponsors engineering programs aimed at meeting national needs, encourages education and research, and recognizes the superior achieve-ments of engineers. Dr. William A. Wulf is president of the National Academy of Engineering.
The Institute of Medicine was established in 1970 by the National Academy of Sciences to secure the services of eminent members of appropriate professions in the examination of policy matters pertaining to the health of the public. The Institute acts under the responsibility given to the National Academy of Sciences by its congressional charter to be an adviser to the federal government and, on its own initiative, to identify issues of medical care, research, and education. Dr. Harvey V. Fineberg is president of the Institute of Medicine.
The National Research Council was organized by the National Academy of Sciences in 1916 to associate the broad community of science and technology with the Academy’s purposes of furthering knowledge and advising the federal government. Functioning in accordance with general policies determined by the Acad-emy, the Council has become the principal operating agency of both the National Academy of Sciences and the National Academy of Engineering in providing services to the government, the public, and the scientific and engineering communities. The Council is administered jointly by both the Academies and the Institute of Medicine. Dr. Ralph J. Cicerone and Dr. William A. Wulf are chair and vice chair, respectively, of the National Research Council.
The Transportation Research Board is a division of the National Research Council, which serves the National Academy of Sciences and the National Academy of Engineering. The Board’s mission is to promote innovation and progress in transportation through research. In an objective and interdisciplinary setting, the Board facilitates the sharing of information on transportation practice and policy by researchers and practitioners; stimulates research and offers research management services that promote technical excellence; provides expert advice on transportation policy and programs; and disseminates research results broadly and encourages their implementation. The Board’s varied activities annually engage more than 5,000 engineers, scientists, and other transportation researchers and practitioners from the public and private sectors and academia, all of whom contribute their expertise in the public interest. The program is supported by state transportation departments, federal agencies including the component administrations of the U.S. Department of Transportation, and other organizations and individuals interested in the development of transportation. www.TRB.org
www.national-academies.org

COOPERATIVE RESEARCH PROGRAMS STAFF FOR NCHRP REPORT 551
ROBERT J. REILLY, Director, Cooperative Research ProgramsCRAWFORD F. JENCKS, Manager, NCHRPEILEEN P. DELANEY, Director of PublicationsBETH HATCH, Assistant Editor
NCHRP PROJECT 20-60Field of Special Projects
SANDRA STRAEHL, Montana DOT (Chair)CARL CHASE, JR., South Carolina DOTDAVID S. EKERN, Idaho Transportation DepartmentMICHAEL J. GOODALE, Ontario Ministry of TransportationHAROLD C. ROGERS, JR., Pennsylvania DOTPETER STEPHANOS, Maryland State Highway AdministrationMARSHALL L. STIVERS, Infrastructure Corporation of America, Tallahassee, FLSCOTT A. YOUNG, Colorado DOTVICKI MILLER, FHWA LiaisonJAMES T. MCDONNELL, AASHTO LiaisonTHOMAS PALMERLEE, TRB Liaison
AUTHOR ACKNOWLEDGMENTSThe authors wish to thank the following individuals, who pro-
vided much valuable information on their current practices in per-formance measurement and their perspectives on asset manage-ment, as part of the agency interviews conducted for this study.
• Colorado DOT—Scott Young, Investment Analysis Unit Man-ager; and David Busby, Investment Analysis Unit.
• Florida DOT—Bob Romig, Director, Office of Policy Planning;Dave Lee, Office of Policy Planning; and Brian Watts, Office ofPolicy Planning.
• Idaho Transportation Department—Dave Ekern, Director;Jim Ross, Chief Engineer and Administrator, Division of High-ways; Charlie Rountree, Administrator, Division of Transporta-tion Planning; and Julie Pipal, Manager, Office of Budget Policyand Intergovernmental Relations.
• Iowa DOT—Stuart Anderson, Systems Planning; Ronald Beane,Office of Maintenance; Jon Ranney, Program Management; andWill Zitterich, Office of Maintenance.
• Maryland DOT—Marsha Kaiser, Director of Planning andCapital Programming; and Ed Strocko, Office of Planning andCapital Programming.
• Maryland State Highway Agency (SHA)—Neil Pedersen,Administrator; Jock Freedman, Bridge Development; Tom Hicks,Traffic and Safety; Joe Miller, Bridge Development; Doug Rose,Deputy Administrator/Chief Engineer; John Scally, Maintenance;Douglas Simmons, Deputy Administrator/Finance, IT andAdministration; Dennis Simpson, Planning and PreliminaryEngineering; Peter Stephanos, Materials and Technology; RajaVeeramachaneni, Planning and Preliminary Engineering; CarlVogel, Operations; Mike Wetzel, Highway Design; and RussellYurek, Maintenance.
• Michigan DOT—Susan Mortel, Deputy Director of Planning;William Tansil; Ron Vibbert; John Friend; Polly Kent; RickLilly; Susan Gorski; and Craig Newell.
• Minnesota DOT—Randy Halvorson, Division Director, Pro-gram Management; and Mark Larson, Director, PerformancePlanning and Measurement.
• Montana DOT—Sandra Straehl, Administrator, Rail, Transit,and Planning Division; Dick Turner, Chief, Multimodal PlanningBureau; Bill Cloud, Chief, Data and Statistics Bureau; Gary Lar-son, Chief, Project Analysis Bureau; and Mary Gayle Padmos,Civil Engineering Specialist, Project Analysis Bureau.
• New York State DOT—Tim Gilchrist, Director, Policy and Strat-egy Group; John Shufon, Director, Data Analysis and ForecastingBureau; Jerry Cioffi, Director, Corridor Management Bureau;Steve Wilcox, Associate Director, Transportation MaintenanceDivision; Lou Adams, Technical Manager, Modeling and Fore-casting Section; and Joy Chiu, Management Systems Analyst.
• Ohio DOT—Leonard Evans, Administrator of the Office of Sys-tems Analysis Planning; Cash Misel, Chief Engineer; and MattSelhorst, Deputy Director for Planning.
• Ontario Ministry of Transport—Mike Goodale, Director ofProgram Management; Alison Bradbury, Head of InvestmentPlanning and Programming; Noris Bot, Manager of InvestmentPlanning and Programming; Jamie Carr, Asset Management.
• Pennsylvania DOT—Gary Hoffman; Hal Rogers; Scott Christie;Craig Reed; Danny Dahlwood; Mary Gilardi; Steve Grimme; andDennis Lebo.
• South Carolina DOT—Jim Feda, Director of Maintenance; CarlChase Jr., Transportation Assets Manager; Terecia Wilson,Director, Safety; William Bloom, Data Analyst; Lee Floyd,Bridge Maintenance Engineer; William Beck, Chief Data Ser-vices; and Tom Shea, Pavement Manager.
• Tennessee DOT—Neil Ham, Finance Director; and Gerald Gre-gory, Maintenance Director.
• Virginia DOT—George Gardner; Charles Miller; Quinton Elliot;Mina Lockwood; Chad Tucker; Larry Caldwell; Steve Carey; andSteve Brich.
• Washington State DOT—Enrico Baroga, Maintenance ProgramDelivery Manager; Daniella Bremmer, Director of StrategicAssessment; Aaron Butters, Systems Analysis and Program Devel-opment Manager; John Conrad, Engineering and Regional Opera-tions; Greg Hilstad; Roger Horton, General Manager, Transporta-tion Data Office; DeWayne Wilson, Bridge Office; Marcy Yates,Accounting Chief.

The two volumes of this report—Volume I, Research Report, and Volume II,Guide for Performance Measure Identification and Target Setting—will help trans-portation agencies apply the concepts of performance management to their asset man-agement efforts. Volume I describes the research effort and provides the current stateof practice on the use of performance measures, principally in the context of transporta-tion asset management. Volume II introduces a framework for identifying performancemeasures and setting target values, and its appendixes contain examples of performancemeasures and targets. Performance measures and target values are critical to the prin-ciples of asset management to analyze tradeoffs, make investment decisions, and mon-itor intended effects. The report will be of interest throughout transportation agenciesas an aid to effective decision making and the optimization of resources.
Many transportation agencies have developed system-level performance measuresto help track the impacts of program investments, maintenance, and operationsimprovements. These performance measures are usually technical in nature, capturingan engineering or operational attribute of the transportation system. A review of thesemeasures was needed to assess their usefulness for asset management (e.g., their appli-cation in tradeoff analyses and investment decisions). Development of measures fornontraditional (e.g., security, social, environmental, and economic) issues affectingtransportation decisions was also needed.
Some DOTs define targets with which current conditions can be objectively com-pared to determine whether the transportation system is performing acceptably. Thebasis on which these targets are set varies, and there is no generally accepted method-ology for their establishment and use in asset management. Guidance for a methodol-ogy to establish targets for use by transportation agencies was also needed.
Therefore, the objectives of this research were to (1) investigate performance mea-sures suitable to asset management and (2) develop a framework for establishing per-formance measures and setting targets for use in asset management. The emphasis wason highway infrastructure assets.
This research project specifically complements two other NCHRP projects.NCHRP Project 20-24(11), “Asset Management Guidance for Transportation Agen-cies,” produced a first-generation asset management guide that has been adopted byAASHTO and is available at http://assetmanagement.transportation.org/tam/aashto.nsf/home. NCHRP Project 20-57, “Analytic Tools to Support Transportation AssetManagement,” produced two software tools, one for analyzing investments acrossinfrastructure categories and another for demonstrating the impacts of investmentchoices on short-term programs of projects. Both of these software tools will be furtherdeveloped and maintained as AASHTOWare products. Results were published asNCHRP Report 545: Analytical Tools for Asset Management, which contains a CDwith the software products and user guides.
FOREWORDBy Crawford F. Jencks
Staff OfficerTransportation Research
Board

Along with the FHWA, the NCHRP (under Project 20-36) sponsored an interna-tional scan on transportation asset management to Australia, Canada, England, and NewZealand. Scan results have been published by the FHWA in report FHWA-PL-05-019.At the time of this publication, plans were being made for a domestic scan of transporta-tion asset management practices in the United States as part of NCHRP Project 20-68.
Efforts such as these will continue to support transportation agencies by providingthe concepts, methods, and tools to address the changing demands of the public, legis-latures, and government leaders. Because needs are great and resources are limited, theconsequences of various scenarios can be determined and compared to optimize invest-ments for the intended outcome.

Volume I:
Research Report

Contents
Executive Summary.............................................................................................................................. i
1.0 Introduction .................................................................................................................................. 11.1 Study Context ....................................................................................................................... 11.2 Study Objectives and Scope................................................................................................ 11.3 Contents of Report ............................................................................................................... 3
2.0 Background ................................................................................................................................... 52.1 Transportation Asset Management ................................................................................... 52.2 Performance Measurement................................................................................................. 10
3.0 Current Practice Review ............................................................................................................. 153.1 Objectives of the Current Practice Review ....................................................................... 153.2 Summary of Current Practice............................................................................................. 163.3 Organizational Contexts ..................................................................................................... 223.4 Approaches to Selecting and Organizing Measures....................................................... 253.5 Current Performance Measures ......................................................................................... 293.6 Approaches to Aligning Measures within the Organization ........................................ 323.7 Use of Performance Measures............................................................................................ 353.8 Setting Performance Targets............................................................................................... 37
4.0 Performance Measures for Asset Management: Criteria and Guidelines ........................ 414.1 How Performance Measures Support Asset Management............................................ 414.2 Criteria and Guidelines for Selecting Performance Measures ...................................... 44
5.0 Performance Measures for Asset Management: Design Considerations ......................... 595.1 Addressing Federal Transportation Planning Regulations ........................................... 595.2 Linking Resource Allocation to Policy Objectives .......................................................... 615.3 Aligning Performance Measures Across the Organization (and Beyond) .................. 635.4 Tailoring Measures to Decisions—Ensuring Appropriate Sensitivity ......................... 675.5 Analytic Constructions of Performance Measures to Understand Overall Health,
Critical Deficiencies, and Trends ....................................................................................... 735.6 Providing Solid Foundation Data...................................................................................... 805.7 Structuring Performance Tradeoffs ................................................................................... 815.8 Predicting Performance and Setting Targets Based on Funding .................................. 815.9 Setting Long-Term Performance Goals............................................................................. 865.10 Obtaining Internal and External Buy-In ........................................................................... 87
Volume I: Research Report

6.0 Recommended Framework for Transportation Agencies.................................................... 916.1 Introduction .......................................................................................................................... 916.2 Framework Overview ......................................................................................................... 926.3 Identify Performance Measures ......................................................................................... 926.4 Integrate Performance Measures into the Organization ................................................ 946.5 Establish Performance Targets........................................................................................... 95
Sources.................................................................................................................................................... 96
Cited References ................................................................................................................................... 96
Bibliography.......................................................................................................................................... 98
Volume I: Research Report

i
Volume I: Research Report
Executive Summary
■ Introduction
Asset management and performance measurement are topics of strong interest in the transporta-tion community today. NCHRP Project 20-60 looks to the strengths of both of these concepts in con-sidering what performance measures are best to apply within an asset management context. Indoing this the study considers implications of several relevant trends now influencing U.S. trans-portation industry practice:
• Increased use of performance measurement in transportation policy making, planning, pro-gramming, and system monitoring;
• Formal development of asset management principles through a collaborative effort among TRB,AASHTO, and the FHWA, culminating in the production of AASHTO’s Transportation AssetManagement Guide through NCHRP Project 20-24(11);
• Development and application of maintenance quality assurance programs, which base mainte-nance management on explicit levels of service that, like performance measures, can serve asindicators of both current condition/performance as well as target values for improvement; and
• A renewed focus on analytic tools and other information technology resources that are neededfor performance-based management and, more generally, good asset management.
The objectives of this project were to develop an understanding of what set of performance mea-sures can best serve the principles of good asset management and to recommend procedures thathelp an agency apply this understanding. This study has developed a practical methodology thatenables a transportation agency:
• To identify measures of transportation system performance that are best suited to good assetmanagement, covering a range of investments for system preservation, operations, and capac-ity expansion; and
• To select specific performance measures and set targets for these measures that are consistentwith the needs of the agency and with good asset management practice.
This report is Volume I of a two-volume set presenting the results of research conducted for Proj-ect 20-60. It includes:
• Results of a literature review and interviews with 15 transportation agencies, describing therange of performance measures now used or proposed for use by domestic and internationalagencies, the criteria that now govern performance measure selection, and how performancemeasures are applied in different agencies.

• Criteria for selecting performance measures that are useful to asset management, based on therequirements for this study set by the panel in the scope of work and the principles articulatedin the Transportation Asset Management Guide.
• An in-depth treatment of key considerations in defining and using performance measureswithin an asset management context.
• A description of the framework that has been developed for agencies to use in identifying per-formance measures that are most useful to asset management and to select target values for thesemeasures.
Volume II of this report is a guide to the framework for performance measure identification andtarget setting.
■ Transportation Asset Management
Asset management provides a strategic framework for infrastructure management that gets themost out of performance measurement. It establishes a set of principles, concepts, and techniquesthat can be applied to an agency’s procedures for policy formulation and decisions in resource allo-cation and use. The core principles of asset management, from which performance measure criteriaare derived, are as follows:
• Policy-Driven—Resource allocation decisions are based on a well-defined and explicitly statedset of policy goals and objectives. These objectives reflect desired system condition, level of ser-vice, and safety provided to customers and are typically tied to economic, community, and envi-ronmental goals.
• Performance-Based—Policy objectives are translated into system performance measures thatare used for both day-to-day and strategic management.
• Analysis of Options and Tradeoffs—Decisions on how to allocate resources within and acrossdifferent assets, programs, and types of investments are based on understanding how differentallocations will affect the achievement of policy objectives and what the best options to considerare. The limitations posed by realistic funding constraints also must be reflected in the range ofoptions and tradeoffs considered.
• Decisions Based on Quality Information—The merits of different options with respect to anagency’s policy goals are evaluated using credible and current data. Decision support tools areapplied to help in accessing, analyzing, and tracking these data.
• Monitoring to Provide Clear Accountability and Feedback—Performance results are moni-tored and reported for both impacts and effectiveness. Feedback on actual performance mayinfluence agency goals and objectives, as well as future resource allocation and use decisions.
These principles already are widely understood. Many transportation practitioners would agree thatinvestment decisions for transportation systems should be based on weighing costs against likely out-comes, that a variety of options should be considered and evaluated, and that quality information isneeded for decision making. Many agencies are now pursuing performance-based approaches to plan-ning and programming, monitoring system performance, and developing more integrated data andanalysis tools to evaluate tradeoffs among capital expansion, operations, and preservation activities.
ii
Volume I: Research Report

Most agencies recognize that application of asset management principles is critical in times of con-strained resources, when all investment and budget decisions are subject to increased public scrutiny.
■ Performance Measurement
Performance measurement is a way of monitoring progress toward a result or goal. It is also aprocess of gathering information to make well-informed decisions. Transportation agencies haveused performance measures for many years to help track and forecast the impacts of transportationsystem investments, monitor the condition of highway features, and gauge the quality of servicesdelivered by an agency. Performance measures are valuable and provide several useful benefits:
• Greater accountability to policy-makers, the agency’s customers, and other stakeholders;
• Improved communication of information about the transportation system to customers, politi-cal leaders, the public, and other stakeholders;
• Increased organizational efficiency in keeping agency staff focused on priorities and enablingmanagers to make decisions and adjustments in programs with greater confidence that theiractions will have the desired effect;
• Greater effectiveness in achieving meaningful objectives that have been identified through long-range planning and policy formulation;
• A better understanding of the impacts of alternative courses of action that performance mea-sures can provide; and
• Ongoing improvement of business processes and associated information through feedback.
Performance measures traditionally have been largely technical in nature, capturing an engineeringor operational attribute of the transportation system. Today, however, transportation executives andmanagers must address an increasingly complicated and wide-ranging set of issues regarding the“best” solutions on balance to transportation problems, the cost-effectiveness of proposed projects,and the anticipated impacts of these projects. While measures of technical condition and perfor-mance are still needed, other types of measures are called for as well. The ways in which perfor-mance measures are applied are likewise changing to meet the needs and expectations ofstakeholders.
■ Asset Management Implications for Performance Measures
Performance measures can best support the principles of asset management described above if theyhave the following principles:
• Policy-driven—Performance measures should capture and respond to policy objectives, pro-viding meaningful information about how changes in the transportation system support theseobjectives.
iii
Volume I: Research Report

• Strategic perspective—It should be possible to produce credible forecasts for performance mea-sures (as is done in many current management systems) and to use these forecasts in engineer-ing and economic analyses, including life-cycle cost calculations.
• Consideration of tradeoffs and options—Performance measures should support “what-if”analyses of different scenarios, reflecting a clear relationship between performance and cost.They should also inform decisions about a wide range of investments in preservation, operation,and capacity expansion and in certain cases the results of investments in different modes. Mea-sures need to be sensitive enough to show the “amount the needle moves” as a result of differ-ent investments.
• Decisions based on good information—Performance measures should be supported by anagency’s management systems or other analytic tools and be an integral part of its business anddecision processes. They should be compatible with analytic procedures that are appropriate todifferent organizational levels. Data requirements for performance measures should be realisticand feasible.
• Feedback—Performance measures should provide managers with sufficient information tounderstand problems and suggest solutions. This feedback should help an agency understandthe impacts of its past and potential future actions, as distinct from exogenous influences on per-formance that are beyond the agency’s control. Since feedback is a continual process, periodicmonitoring of performance measures needs to be economical.
• Implementation across organizational units and levels—Performance measures collectivelyshould provide useful information to technical, managerial, and executive levels within theorganization and apply consistent information and definitions of impacts across organizationalunits. The way in which measures are defined and calculated is important in achieving consis-tent information horizontally and vertically.
While these characteristics are the major ones associated with guidelines for good asset management,there are other characteristics of good performance measures in general that need to be met (e.g., theneed for both internal and external buy-in to an agency’s measures and a clear understanding of whatthey mean). The project panel also has developed a complementary set of requirements on the method-ology to be developed in this study (e.g., that it apply to agencies of different organizational structuresand characteristics, that it support the statewide and metropolitan transportation planning provisionsof current federal law, and that it accommodate the requirements of Governmental Accounting Stan-dards Board Statement 34 as well as those of the Transportation Asset Management Guide).
■ Current Performance Measures and Practices
The research team reviewed a wide body of literature on transportation performance measures,including guidebooks on performance measurement and managerial accountability, studies andcompilations of transportation performance measures in the United States and internationally, andspecific reports by agencies (such as for long-range transportation planning, capital program devel-opment, strategic business planning, and performance accountability) that apply performance mea-sures. In addition, interviews were conducted with 15 state transportation agencies across thecountry, distributed by AASHTO region as follows:
iv
Volume I: Research Report

• Northeast Association of State Transportation Organizations (NASTO): Maryland, New York,and Pennsylvania;
• Southeast Association of State Highway and Transportation Organizations (SASHTO): Florida,South Carolina, Tennessee, and Virginia;
• Mississippi Valley Conference of State Transportation Organizations: Iowa, Michigan, Min-nesota, and Ohio; and
• Western Association of State Highway and Transportation Organizations (WASHTO): Colorado, Idaho, Montana, and Washington.
Performance Measures
The literature concluded that performance measures are clearly of growing interest: those agen-cies that use them are continually refining them, and those agencies that have not yet appliedthem to transportation system performance are now exploring their use. Different types of per-formance measures are in use or have been proposed within each category of measurement, asillustrated below. The review organized the large number of identified measures within the fol-lowing categories:
• Preservation of assets,
• Mobility and accessibility,
• Operations and maintenance, and
• Safety.
Table 1 provides examples of performance measures identified in the current practice review thatare suitable for use within an asset management context.
This review emphasizes the “resource allocation” aspects of asset management, consistent with theproject scope. However, agencies that were interviewed stressed the importance of “program deliv-ery” measures as well in achieving the results intended during resource allocation and in strength-ening the credibility of the agency for communicating both resource allocation recommendationsand program delivery accomplishments. While some literature sources emphasize “outcome mea-sures” as the most desirable for communicating accountability for results, the agencies pointed outthat “output” measures also need to be considered, and a blend of output and outcome measuresmay be the most useful. Of course, outputs tend to precede outcomes, so there is a natural relation-ship between the two. Outputs have several advantages:
• They may be easier to communicate to nontechnical audiences;
• They may be easier and less expensive to measure;
• They provide an immediate indication of accomplishment when outcomes of an investment arelong term;
v
Volume I: Research Report

vi
Volume I: Research Report
Measure Category Example Measures Comments
Preservation of Assets
Pavement condition index
Bridge health index
Remaining life
Debt index (ratio of deterioration or lost value to replacement value)
Condition and remaining life measures can be expressed as averages or distributions (e.g., percent of system length or VMT on roads in good, fair, and poor condition).
Mobility and Accessibility
Amount of congested travel (person-miles or VMT under congested conditions)
Travel time index (ratio of peak travel time to free-flow travel time)
Average travel time between major origins and destinations, by mode
Average shipment cost between selectedorigins and destinations
Care must be taken to distinguish results of agency actions from changes due to growth patterns, fuel prices and other factors. This can be accomplished through use of modeling tools, supplemental socioeconomic and traffic monitoring data, and well-designed before-after studies.
Operations and Maintenance
Traffic signal malfunction rate
Average incident clearance time
Time interval after precipitation stops to restore road conditions to defined standard
Sign and pavement marking retroreflectivity
Customer satisfaction rating for different maintenance elements
Maintenance level of service approaches can be used to relate achievement of dif-ferent service levels to budget levels by category of work.
Safety Serious crashes per million VMT
Fatalities per 100 million VMT
Number of work zone crashes
Hazard index (based on crash incidence and severity rates)
Backlog ($) of identified cost-effective safety countermeasures to address high-crash locations
Use of the fatality rate measure is recom-mended for consistency with the U.S. DOT’s national performance target toreduce fatalities to 1.0 per million VMT.
VMT = vehicle-miles traveled
Table 1. Example Performance Measures for Asset Management
• They provide a tangible measure of accomplishment for preventive maintenance; and
• They provide a basis for relating accomplishment to the agency resources needed.
Related Agency Practices
Agency interest in performance measures and target setting is strong, as noted earlier. Agenciesdescribed in their interviews the types of measures they use, how these measures are applied to dif-ferent functions and types of investments, and what aspects of asset management are supported.These descriptions provided a very useful picture of different levels of attainment in asset manage-ment, as well as of the diversity in performance measurement. While it is common to use measuresto track performance over time and set targets for future performance, relating performance to costis less familiar. Analyzing tradeoffs across programs, types of investments, or modes might now becharacterized as the “frontier” of asset management. While the capabilities to relate performance tocost—a prerequisite for tradeoff analyses—are now available in many modern pavement and bridgemanagement systems and certain maintenance management tools, only a few states reported a for-mal, structured consideration of tradeoffs. Practices in applying performance monitoring to feed-back and updating of agency processes also varies, ranging from informal discussions andconsiderations to more formal comparisons and decisions.
Many agencies set performance targets, although the practices differ, ranging from definition ofdesired thresholds based on engineering considerations to establishment of goals based on long-term projections and scenario analyses. Several factors are accounted for by agencies in setting targets:
• Anticipated funding levels;
• Policy goals, statewide priorities, or priorities by route classification;
• Public input;
• Existing condition, historical performance trends, and implications of different proposed con-dition levels;
• Internal and external input, and comparison to other states;
• Discussions with the construction industry; and
• Life-cycle cost analyses, tradeoff analyses, and estimates of the marginal value of additionalinvestment.
■ Overview of Recommended Framework
The framework developed for this study was based on the premise that there is no single, best setof performance measures suitable for every transportation agency. Each agency needs to develop
vii
Volume I: Research Report

or evolve its own set of measures based on its organizational structure, decision processes, and cul-ture and with consideration of the set of measures (and supporting data) already in place. However,there is a set of best practices for implementing performance measures that can help agencies to getthe most benefit out of asset management. There is a need for clear yet flexible guidance as to howto go about identifying performance measures and setting performance targets that is compatiblewith an asset management approach.
The recommended framework was developed in the form of procedurally oriented guidance. Thisprocedural (i.e., step-by-step) guidance is supplemented by the in-depth treatment of key consid-erations presented in this report. This volume describes the framework in summary fashion. Vol-ume II is intended for use by agencies pursuing improvements to performance measurement insupport of asset management.
The guidance is organized into three parts:
1. Identify Performance Measures,
2. Integrate Performance Measures into the Organization, and
3. Establish Performance Targets.
Guidance for identifying performance measures involves the following steps:
1. Inventory existing performance measures and identify how they are being used,
2. Identify gaps to be addressed based on coverage of critical outcome areas for agency goals andobjectives and support for the asset management best practices,
3. Define criteria for selecting new measures (the guidance suggests a set of criteria but presumesthat agencies will tailor criteria based on their needs and priorities),
4. Identify additional candidate measures, and
5. Select a set of measures from the list of candidates for further design and implementation.
Guidance for integrating performance measures into an organization involves the following steps:
1. Engage internal and external stakeholders to achieve buy-in;
2. Identify the different decision contexts where performance measures are to be used (project, cor-ridor, and network levels and for short- or long-range decisions) and refine measures so thatthey are at the appropriate level of sensitivity;
3. Identify opportunities for using measures that are consistent across different organizationalunits responsible for various asset classes, modes, or work types;
4. Identify needs for additional data collection, data management, and analytic tools to supportthe selected measures;
5. Design communication devices with formats appropriate to the target audiences; and
6. Document measure definitions and procedures.
viii
Volume I: Research Report

The guidance for establishing performance targets involves the following steps:
1. Define the context for target setting and establish time horizon(s),
2. Determine which measures should have targets,
3. Develop long-term goals based on consideration of technical and economic factors,
4. Consider current and future funding availability,
5. Analyze resource allocation scenarios and tradeoffs,
6. Consider policy and public input implications for target setting, and
7. Establish targets and track progress.
While the framework is focused on using performance measures in support of asset managementprinciples, it is also understood that agencies use performance measures for a variety of purposes,and it is not necessary (or desirable) to create a separate and distinct “asset management” set of per-formance measures.
ix
Volume I: Research Report
1
Volume I: Research Report
1.0 Introduction
■ 1.1 Study Context
Transportation asset management consists of a set of principles, concepts, and techniques for mak-ing more effective allocation and use of resources to address preservation, operation, and improve-ment of transportation infrastructure. The AASHTO Transportation Asset Management Guide(referred to hereafter as “the Guide”) produced in NCHRP Project 20-24(11) describes these princi-ples and best practices (2). One of the fundamental underpinnings of transportation asset manage-ment, as described in the Guide, is the use of performance measurement to inform decision makingabout how to invest limited resources. From an asset management standpoint, performance mea-sures are used to evaluate a range of solutions for addressing transportation needs, to make trade-offs across different resource allocation options, to communicate the implications of differentinvestment levels, and to establish targets for results to be achieved based on available resources.
Many transportation agencies are using performance measurement to help track the impacts of pro-gram investments and provide accountability to the public. Some agencies define and use perfor-mance targets as an integral part of their performance management approach. However, there is nospecific guidance for what types of performance measures and target-setting approaches work bestin the context of transportation asset management. NCHRP Project 20-60 was undertaken to pro-vide this guidance and to define a framework that agencies can use to identify suitable performancemeasures and to set performance targets. The results of NCHRP Project 20-60 are designed to com-plement the Guide that was developed under NCHRP Project 20-24(11).
■ 1.2 Study Objectives and Scope
The NCHRP 20-60 Research Project Statement included two objectives:
1. To provide an assessment of, and recommendations for, performance measures suitable for anasset management approach that effectively address resource allocation in transportation facil-ity preservation, operation, improvement, and expansion; and
2. To develop a framework that decision-makers can use for selecting suitable performance mea-sures and setting performance targets.
Under Objective 1, the investigation of performance measures suitable to transportation asset man-agement should consider the following features:
a. Utility at various organizational levels in a transportation agency and at network, corridor, andproject levels for short- and long-range decisions;

b. Applicability within the context of an expanding sphere of interest to transportation agencieswith initial emphasis on highway facilities;
c. Methods of collecting measurement data with consideration given to cost, relevance, sensitiv-ity, precision, bias, and consistency across jurisdictional boundaries; and
d. Extent to which performance measures are effective in:
– Evaluating practical and appropriate investment decisions for tradeoff analyses;
– Communicating agency goals and performance to customers (e.g., the public, the legisla-ture, and interest groups);
– Making decisions by top management;
– Supporting underlying agency goals and objectives;
– Making mode-neutral decisions; and
– Measuring social, environmental, economic, and security impacts.
The development of a framework for selecting suitable performance measures and setting targetsunder Objective 2 should consider the following features, with an initial emphasis on highway facil-ity assets:
a. Alignment of performance measures among asset classes, vertically and horizontally, fromplanning through program delivery, operations, and performance tracking;
b. Capability of predicting performance and setting performance targets based on funding;
c. Applicability to agencies with different organizational structures;
d. Linkages to policy development;
e. Usefulness to executive information management systems;
f. Internal and external buy-in;
g. Complexity and resources needed to manage the framework;
h. Accommodation of Governmental Accounting Standards Board Statement No. 34 (GASB 34)“modified approach” (if used) and utility in demonstrating linkage between plans and pro-grams pursuant to Title 23, United States Code, Sections 134 and 135;
i. Ability to demonstrate the overall health and critical deficiencies of infrastructure assets,including:
– Compensating for overall system averaging effects and
– Analyzing trends; and
j. Extent to which actual performance can be attributed to the actions of the transportation agency.
2
Volume I: Research Report

The work program to meet these objectives comprised the following tasks:
Task 1. Existing Information—Review existing national and international literature and practice onthe use of performance measures and approaches for developing performance measurement sys-tems used in asset management.
Task 2. Preliminary Evaluation of Performance Measures—From Task 1, describe the methods forselecting and setting performance targets in use by transportation agencies and develop preliminarycriteria for identifying promising performance measures. Discuss these with representatives of atleast 15 transportation agencies. Develop preliminary approaches for agencies to select performancemeasures appropriate to asset management and to select targets for these measures that meet Objec-tives 1 and 2.
Task 3. Interim Report No. 1—Prepare a technical report on the results of Tasks 1 and 2 and meetwith the NCHRP project panel to discuss.
Task 4. Detailed Evaluation—Based on NCHRP panel comments from Task 3, gather additional,more detailed information to evaluate the selected performance measures, groups of measures, andapproaches. These evaluations should account for the Task 2 criteria and Objectives 1 and 2. Thisdetailed evaluation also will include at least three site visits with transportation agencies.
Task 5. Interim Report No. 2—Submit an interim report that documents Tasks 1 through 4 and pro-poses the plan for finalizing the potential performance measures and framework(s) for selecting andsetting performance targets.
Task 6. Final Framework—On NCHRP approval of the Task 5 Interim Report, finalize the list ofpromising performance measures and the suggested framework for selecting measures and perfor-mance targets.
Task 7. Final Deliverables—Document all tasks and deliver at least the following items:
a. A research final report,
b. An executive summary for top management of transportation agencies that includes the promis-ing performance measures,
c. A guide for using the framework to select performance measures and develop performance targets,
d. Two presentations (as opportunities arise) to the AASHTO and/or TRB Transportation AssetManagement Task Forces in consultation with the NCHRP, and
e. A PowerPoint presentation that communicates the findings of this research project.
■ 1.3 Contents of Report
This report is Volume I of a two-volume final research report, summarizing the results of theresearch and describing the recommended framework. Volume II is a guide for using the recom-mended framework to select performance measures and establish performance targets.
3
Volume I: Research Report

The remainder of Volume I is organized into the following sections:
• Section 2.0 presents background material on transportation asset management, performancemanagement, and the relationship between the two in order to provide a clear context and setof definitions for the research.
• Section 3.0 discusses the state of current practice with respect to performance measurement asit relates to transportation asset management. This summary is based on a literature review andinterviews with 15 agencies, describing the range of performance measures identified fordomestic and international agencies, the criteria that now govern performance measure selec-tion, and the ways in which performance measures are used in different agencies.
• Section 4.0 discusses criteria for performance measures that are useful to asset managementbased on the requirements for this study contained in the scope of work and the principles artic-ulated in the Transportation Asset Management Guide. The asset management Self AssessmentTool from the Guide is revisited to derive guidelines for identifying and using performance mea-sures in an asset management context.
• Section 5.0 provides an in-depth discussion of important considerations in designing andusing performance measures and setting performance targets in support of asset management.This section serves as a detailed technical resource to supplement the procedurally based frame-work described in Section 6.0 and Volume II.
• Section 6.0 outlines the recommended framework for identifying, designing, and using perfor-mance measures for asset management and for setting performance targets.
• References cited in this report and a bibliography are at the end of the report.
4
Volume I: Research Report
5
Volume I: Research Report
2.0 Background
Prior to presenting an analysis of the use of performance measures for asset management, it isimportant to understand how the terms “transportation asset management” and “performance mea-surement” are defined and used for the purposes of this research. Therefore, this background sec-tion begins with a summary of the principles of transportation asset management, as defined in theGuide. This provides an important context for the research in that it defines the specific decisionprocesses to be assisted via more effective use of performance measures. Once this context is estab-lished, a brief overview of performance measurement and its relationship to asset management isprovided.
■ 2.1 Transportation Asset Management
Principles
Asset management is a strategic approach to managing transportation infrastructure that builds onseveral principles described in the Guide:
• Policy-Driven—Decisions on infrastructure management reflect policy goals and objectives thatdefine asset condition, levels of performance, and quality of services to meet customer needs andbroader economic, community, and environmental goals.
• Performance-Based—Goals and objectives must be tied to clear measures of performance. Tar-gets established for these performance measures will guide decisions through the analysis ofoptions, setting of priorities, and program budgeting and implementation.
• Analysis of Options and Tradeoffs—Competition for scarce resources and interrelationshipsamong decisions in different investment areas and affecting different assets all argue for con-sidering options and evaluating the tradeoffs among alternatives.
• Decisions Based on Quality Information—Choices among options during program develop-ment, project selection, and program and service delivery are based on their relative costs andconsequences in meeting performance targets. Objective, high-quality information is applied ateach step, using analytic methods and decision criteria that are consistent with policy goals andobjectives and an agency’s business processes.
• Monitoring to Provide Clear Accountability and Feedback—Performance measures are mon-itored and reported, providing feedback on the effectiveness of transportation investments andservices, work accomplished, and program and service delivery.

Asset management defines a “way of doing business” by applying these principles to an agency’sexisting business and decision processes and its applications of information technology (IT). Assetmanagement is not a separate function or system. It is a way of improving an agency’s existing pro-cedures for resource allocation and use to achieve results cost-effectively, subject to availableresources.
These principles already are widely understood. Many transportation practitioners would agreethat investment decisions should be based on weighing costs against likely outcomes, that a varietyof options should be considered and evaluated, and that quality information is needed for decisionmaking. Many agencies are now pursuing performance-based approaches to planning and pro-gramming, monitoring system performance, and developing more integrated data and analysistools to evaluate tradeoffs among capital expansion, operations, and preservation activities. Mostagencies recognize that application of asset management principles is critical in times of constrainedresources, when all investment and budget decisions are subject to increased public scrutiny.
To be most effective, asset management principles need to be applied comprehensively across all ofan agency’s types of infrastructure expenditures, including preservation, operations, and systemexpansion as represented in capital construction as well as maintenance and operations programs.In concept, asset management should be implemented in as many resource allocation and use processesas possible—policy development, long-range planning, project development, programming andprioritization, delivery of projects, programs and services, maintenance and operations, and systemmonitoring and reporting—although agencies may choose to focus on selected high-priority functionsinitially to gain initial results quickly and affordably.
The Guide envisions asset management principles applied throughout key business processes andin IT support, as shown in Figure 1. Performance monitoring is a critical part of asset management,providing current information on the condition and service levels of the transportation system andserving as the catalyst for feedback on future changes that should be considered in policy formula-tion, planning, programming, and program delivery.
6
Volume I: Research Report
Policy Goals and Objectives
Planning and Programming
Program Delivery
Systems Monitoring andPerformance Results
Qu
ality Information
Figure 1. Asset Management Framework from the Transportation Asset Management Guide

Asset Management Practice
Example Decision Process for Resource Allocation
Figure 2 expands upon Figure 1 to illustrate specific resource allocation and delivery activitiesrelated to performance measurement that embody the asset management principles above. Keypoints include the following:
• Policy Goals and Objectives and associated Performance Measures and Targets are establishedthrough policy formulation and ideally are informed by the agency’s planning process. Policyobjectives and performance targets guide an agency’s overall resource allocation and programdelivery. They also may drive the agency’s strategic business process, if one exists. In additionto expressing statewide policy priorities, the values established for these objectives and targetsshould account for a realistic projection of anticipated funding and for customer needs as deter-mined during public outreach in the agency’s planning process.
• The Transportation Agency makes different Types of Investments in its transportation system.Figure 2 shows these types in terms of System Preservation, Transportation System Manage-ment and Operation, and Capacity Expansion (these are explained in the next section). In prac-tice, agencies organize and manage these investments in many different ways (e.g., by programcategory, type of asset, and level of analysis) whether at a program and subprogram level, cor-ridor level, or project level. The three general types of investments that are shown help explainasset management in a general way, recognizing these differences in agency practices.
• The Transportation Agency manages its transportation system and related investments throughseveral Functions (e.g., planning, programming, construction program delivery, maintenanceand operations, and system monitoring). Again, these general descriptions acknowledge differ-ent ways in which agencies organize these functions across disciplinary lines and through cen-tralized or decentralized relationships between central and field offices.
• A Feedback Mechanism applies the results of system monitoring to assess current policy goalsand objectives and to inform updates in performance targets where needed. Effective feedbackhelps the agency respond to changing conditions, demands, and priorities regarding its trans-portation system.
Types of Investments
Figure 2 shows three types of investment categories—preservation, operations, and capacity expan-sion. These are defined as follows:
1. System Preservation encompasses work to extend the life of existing facilities (and associatedhardware and equipment) and to repair damage that impedes mobility or safety. The purposeof system preservation is to retain the existing value of an asset and its ability to perform asdesigned. System preservation counters the wear and tear of physical infrastructure that occursover time due to traffic loading, climate, crashes, and aging. It is accomplished through both cap-ital projects and maintenance actions.
7
Volume I: Research Report
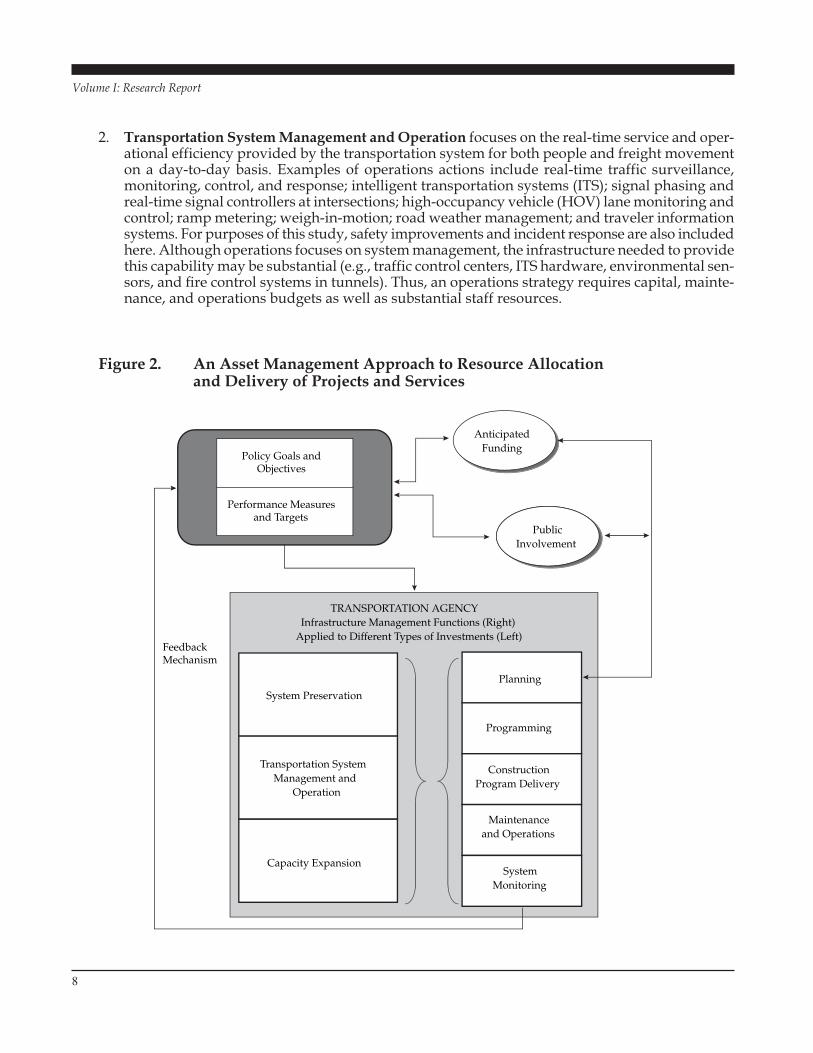
2. Transportation System Management and Operation focuses on the real-time service and oper-ational efficiency provided by the transportation system for both people and freight movementon a day-to-day basis. Examples of operations actions include real-time traffic surveillance,monitoring, control, and response; intelligent transportation systems (ITS); signal phasing andreal-time signal controllers at intersections; high-occupancy vehicle (HOV) lane monitoring andcontrol; ramp metering; weigh-in-motion; road weather management; and traveler informationsystems. For purposes of this study, safety improvements and incident response are also includedhere. Although operations focuses on system management, the infrastructure needed to providethis capability may be substantial (e.g., traffic control centers, ITS hardware, environmental sen-sors, and fire control systems in tunnels). Thus, an operations strategy requires capital, mainte-nance, and operations budgets as well as substantial staff resources.
8
Volume I: Research Report
Policy Goals andObjectives
Performance Measuresand Targets
AnticipatedFunding
PublicInvolvement
TRANSPORTATION AGENCYInfrastructure Management Functions (Right)
Applied to Different Types of Investments (Left)FeedbackMechanism
Capacity Expansion
System Preservation
Transportation SystemManagement and
Operation
Planning
Programming
ConstructionProgram Delivery
Maintenanceand Operations
SystemMonitoring
Figure 2. An Asset Management Approach to Resource Allocation and Delivery of Projects and Services

3. Capacity Expansion focuses on adding physical capacity to an existing asset or acquiring or con-structing a new facility. Capacity expansion can include mainline construction as well as facili-ties for intermodal connections and transfers for passengers or freight. New safety featuresassociated with this construction are also included.
These three categories provide a general representation of an agency’s broad range of transporta-tion infrastructure expenditures, which may be organized in different ways as noted earlier. Pre-senting the investment areas in this way helps for the following reasons:
• The categories show that asset management is not just about preservation of highway networkassets. It is about making investment decisions that address a wide range of policy goals andtransportation system needs.
• The categories provide a simple, useful way for decision-makers to align program investmentcategories and priorities with key policy objectives. For example, many agencies establish a“preservation first” policy or favor maximizing efficiency of operations prior to investing innew capacity.
• The categories may present alternative ways of meeting a policy goal. For example, it may beappropriate to consider operational improvements to address a congestion problem as an alter-native to adding a new lane.
• Decisions about the resources allocated to each category cannot be made independently. Meet-ing many policy goals (e.g., safety) may require a mix of investments across these categories.Similarly, an increase in capacity expansion investments may require increased operations andpreservation expenditures at some point in time.
Asset management emphasizes the need to consider options and evaluate tradeoffs. Realisticfunding scenarios that establish the boundaries of this analysis are critical to this process. Trade-off analysis may be done across investment categories as well as within them. An agency mightwish to define investment areas coincident with the three categories discussed above (preserva-tion, operation, and capacity), or they may define a different set of categories. For example, anagency may have a separate safety investment area and also incorporate consideration of safetywithin expenditures for system preservation (e.g., replacement of damaged guardrails), opera-tions (e.g., maintenance of signs, markings, signalization, and traffic channelization), and capac-ity expansion (e.g., project design features supporting safety, such as wide shoulders). Thisapproach would provide the framework for understanding the best mix of complementary actionswithin the safety area as well as tradeoffs between safety and other objectives. This is but oneexample; others could be developed illustrating tradeoffs in other types of investments and forother policy objectives.
Infrastructure Management Functions
The infrastructure management functions shown in Figure 2 are examples of basic procedures usedby agencies to plan, build, operate, and maintain their transportation systems. While agencies maydefine, organize, and allocate responsibilities for these functions in different ways and across dif-ferent disciplines, the descriptions below suffice as general illustrations of performance measureapplications throughout the resource allocation process.
9
Volume I: Research Report

• Planning encompasses procedures to identify future transportation needs and recommend solu-tions in the long- to midterm timeframes; develop transportation strategies at a statewide, net-work, or corridor level across modes; undertake studies of particular needs that require majortransportation investments (as for capacity or service expansion); and address strategic issuessuch as environmental protection and energy conservation. Forecasts of performance measureshelp to characterize and evaluate alternatives, and to communicate how proposed solutions willmeet policy objectives.
• Programming and budgeting involve allocations of financial, staff, equipment, and other resourcesto the different investment areas. Allocation decisions also may be made within an individualinvestment area across strategies (e.g., preventive versus worst-first preservation), programs(e.g., rural versus urban mobility), asset classes (e.g., pavements versus structures), or projects. Pro-gramming options tend to focus on the prioritization of projects and tradeoffs within and amongprograms and asset classes. Decisions are oriented toward short- to midterm timeframes.
• Construction Program Delivery implements the programs involving construction projects,whether for new facilities or additional capacity on existing facilities, capital preservation, orinstallation of operations infrastructure. Delivery is accomplished in the most cost-effectivemanner, which involves consideration of different delivery options (e.g., work by agencyforces, use of contractors, interagency agreements), as well as a delivery tracking processinvolving recording of actions taken, costs, effectiveness, and lessons learned to guide futureactivity.
• Maintenance and Operations include delivery of routine maintenance and system managementand operations services on existing facilities. Maintenance may include both preservation(e.g., routine and preventive pavement and bridge repair, cleaning of drainage structures, andreplacement of damaged signs and safety appurtenances) and operations (e.g., incident response,installation of signs and delineators, signal timing, and snow and ice operations). System man-agement and operation include monitoring of system traffic operations (e.g., traffic loop sensors,surveillance cameras, on-site reports, and weigh-in-motion devices), ramp metering, monitor-ing and control of HOV lanes, real-time responses to traffic conditions (e.g., variable messagesigns and incident response), and traffic information services.
• System Monitoring tracks system conditions and service levels to determine the extent to whichestablished performance objectives are being addressed. This activity involves data collection,processing, and analysis to compare current values of performance measures with previouslyestablished targets. Through a feedback mechanism, this information is used to refine policygoals and priorities (e.g., put more emphasis on safety in response to an increase in crash rates).
■ 2.2 Performance Measurement
Performance measurement is a way of monitoring progress toward a result or goal. It is also aprocess of gathering information to make well-informed decisions. Performance measures aredefined in this study as indicators of work performed and results achieved. Transportation agen-cies have for many years used performance measures to help forecast and track the impacts of pro-gram investments, maintenance, and operations improvements; monitor the condition of systemassets; and gauge the management and service delivery of the agency. The value of performance
10
Volume I: Research Report
measures, and of performance-based management processes that apply these measures, can be real-ized across several areas of agency activity:
• Greater effectiveness in achieving meaningful objectives that have been identified through legit-imate processes of long-range planning and policy formulation.
• Greater accountability to policy-makers, the agency’s customers, and other stakeholders.
• Increased organizational efficiency in keeping agency staff focused on priorities:
– Externally, performance measures that are aligned with clear policy goals and objectiveshelp to direct resources and actions to accomplish the agency’s mission; and
– Internally, performance measures can help align strategic business objectives of organiza-tional units in a consistent direction, provide greater clarity in tracking results, and enablemanagers to make decisions and adjustments in programs with greater confidence that theiractions will have the desired effect.
• Improved communication of information about the transportation system to customers, politi-cal leaders, other stakeholders, and the public. Explicit and unambiguous goals and objectives,clear and straightforward performance measures, quantitative measures of achievements andidentification of future needs, and trends in performance over time all help to provide contextfor an agency’s actions and to demonstrate tangible results of program investments.
• Ongoing improvement of business processes and associated information through feedback andthe better understanding of the impacts of alternative courses of action that performance mea-sures provide.
Performance measures traditionally have been largely technical in nature, capturing an engineeringor operational attribute of the transportation system. While still important in serving this traditionalfunction within an agency, today transportation executives and managers must address an increas-ingly complicated and wide-ranging set of issues. These issues include identifying the “best” solu-tions on balance to transportation problems and system needs, the cost-effectiveness of proposedprojects, and the anticipated impacts of these projects. The scrutiny of these decisions, and of agencyperformance in meeting stated commitments, also has become more demanding. While measuresof technical condition and performance are still needed, other types of measures are called for aswell. The ways in which performance measures are applied are likewise changing to meet the needsand expectations of stakeholders.
Role of Performance Measures in Asset Management
Since asset management is performance based, performance measures and associated data collec-tion procedures and analytic tools are critical to its successful application. The implementation ofan effective, successful transportation asset management concept within an agency uses perfor-mance measures as the key to a merit-based, data-driven decision support process. Performancemeasures and targets embody good asset management practice at several critical points in theagency’s resource allocation and delivery process:
• As the practical expression of policy objectives that reflect customer expectations and realisticfunding targets.
11
Volume I: Research Report

• As guidance to procedures and criteria used at key decision points in the management functions.For example, performance targets provide a consistent framework for evaluating options inplanning, defining, and valuing prioritization criteria in programming; guiding tradeoff analy-ses in resource allocation; and influencing priorities in delivery of projects and services.
• As the basis for system monitoring to obtain indications of system performance resulting fromSystem Preservation, Transportation System Management and Operation, and Capacity Expan-sion investments.
• As signals of change through feedback to policy formulation.
This view of asset management that is illustrated in Figure 2, as well as the critical roles that perfor-mance measures play in it, will provide a framework for further development throughout this report.
Categories of Asset Management Performance Measures
For the purposes of this study, a set of performance measure categories has been established in orderto (1) clearly delineate the types of performance measures being addressed in this effort and (2) facil-itate the analysis and discussion of performance measurement in the context of asset management.These categories—composites of those defined in NCHRP Report 446 (7) and FHWA report FHWA-OP-03-080 (36)—are based on type of impact so that they can be easily related to policy goals andobjectives as well as type of investment. The categories are as follows:
• Preservation refers to the condition of the transportation system and actions to keep the system ina state of good repair. Measures are often specific to the type of asset. Performance measures maybe expressed, for example, by physical condition (e.g., extent or severity of distress, deviationsfrom nominal track gauge), indices that combine a number of condition measurements or thatrelate to user perceptions of condition (e.g., pavement condition index, present serviceabilityindex, or rideability index for pavements; bridge health index), or other measures, not necessarilytechnical (e.g., financial asset value). For purposes of this study, preservation also includes actionsto maintain a state of good repair in emergency situations other than terrorist attacks (e.g., severestorms, earthquakes, landslides, scour around foundations, and flooding; also see Security below).
• Accessibility refers to the ability of people and goods to access transportation services. Exam-ples of performance measures include a “density” of opportunities enabled by transportationservices (e.g., the number of households within a 30-minute drive of key regional centers, or thenumber of employment opportunities within a 10-minute walk of transit stops) or the ability ofa facility to serve a particular user group (e.g., a particular segment of population or type offreight). Availability of modes and modal choice also can be treated as an accessibility measure.Accessibility is often expressed from a user’s perspective.
• Mobility refers to the time and cost of making a trip and the relative ease or difficulty with whicha trip is made, essentially congestion and the trip measures related to congestion. Some of thesetrip measures reflect a supplier perspective (e.g., volume-capacity ratio, capacity-related level ofservice), while others reflect a user perspective (e.g., speed, travel time, delay, trip reliability, anduser cost).
• Operations and Maintenance refers to the effectiveness of the transportation system in terms ofthroughput and travel costs and revenues from a system perspective and maintenance level of
12
Volume I: Research Report

service, particularly the customer experience of the system. Since throughput is interpreted interms of people or goods as well as vehicles, measures of vehicle occupancy or freight capacitymay be included here. Cost efficiency includes measures such as average cost per mile or perVMT. Systemwide fuel efficiency is also included.
• Safety refers to the quality of transportation service in terms of crashes or incidents that areharmful to people and damaging to freight, vehicles, and transportation infrastructure. Perfor-mance measures also reflect asset conditions that contribute to or detract from safety. Whilesafety is often gauged by the number, frequency, severity, and cost of accidents, recent trendsrecognize a wider sphere of interest in the vehicle- and driver-related causes of crashes, and inharm to agency personnel as well as drivers and passengers, particularly in work zones. Workis also ongoing to predict the risk of future safety problems at candidate locations.
• Environmental Impacts refers to the protection of the environment. Performance measures areassociated with key impact areas, including air quality, groundwater, protected species, noise,and natural vistas. Output-based performance measures may also be defined for actions criticalto mitigating the above impacts (e.g., protecting wetlands, constructing wildlife passages acrosstransportation facilities, using snow and ice chemicals that protect groundwater and air quality,and monitoring and controlling hazardous materials).
• Economic Development refers to direct and indirect impacts of transportation on the economy.Direct impacts are typically related to the cost of transportation experienced by users and ship-pers and are expressed in measures such as economic output (e.g., gross state product), employ-ment (e.g., jobs supported or created), and income. Indirect measures look at transportation’scontribution to the general economy, which can be gauged by a wide variety of measures such astraffic at border crossings, manufacturers/shippers/employers who have relocated for trans-portation purposes, volume of freight originating or terminating in the region, number or percentof employers that cite difficulty in accessing the needed labor supply because of transportation,and measures of truck travel per unit of regional economic activity.
• Social Impacts refers to the effects of transportation on the broader society (e.g., neighborhoodsadjacent to transportation facilities) or on population groups (e.g., disadvantaged). This is in con-trast to “quality of life” impacts that are interpreted by some agencies to mean customer satis-faction specifically. (Note that customer impacts in this study are included in the appropriatecategory of transportation impact. For example, “customer perception of congestion severity”reflects a customer perception of mobility and is classified with other mobility measures. Simi-larly, “present serviceability rating” is a customer perception of road surface condition and isclassified with other preservation measures. While not all agencies follow this convention,grouping customer satisfaction with other measures is very useful in relating performance mea-sures to asset management functions, as will be illustrated later in the report.)
• Security refers to protection of travelers, freight, vehicles, and system infrastructure from ter-rorist actions. Protection of infrastructure and users of this infrastructure against other emer-gencies (e.g., severe storms, earthquakes, landslides, flooding, and scouring of foundations) isincluded in Preservation in this study.
• Delivery refers to the delivery of transportation projects and services to the customer. Key per-formance measures include output-oriented accomplishment measures that complement out-come-oriented measures in the other categories, measures of efficiency and effectiveness in useof resources, and impacts on customers that need to be considered in evaluation of alternativedelivery strategies.
13
Volume I: Research Report

15
Volume I: Research Report
3.0 Current Practice Review
Current practice in performance measurement has been identified through a review of literature andin-depth interviews with 15 state transportation agencies. The literature review builds upon a con-siderable number of recent research studies, surveys of practice, and workshops to avoid duplicatingpast work. The interviews focused on current and planned agency practices in applying performancemeasures and how they relate to functions that are important to asset management. This section out-lines specific objectives for the current practice review, provides a high-level summary of findings rel-evant to this research, and then presents a more focused set of observations based on a review ofagency-specific references and the in-depth interviews.
■ 3.1 Objectives of the Current Practice Review
A review of current practice was conducted to provide an understanding of the current state-of-practice in performance measurement across a number of state, regional, local, and internationalagencies. Review of published sources of information provided a point of departure for the conductof in-depth agency interviews. In conducting the literature review and interviews, the research teamsought to gain answers to the following questions, in support of the study objectives as set forth inSection 1.2:
• What criteria are used by agencies to select performance measures?
• How are current performance measurement frameworks structured, and what kinds of mea-sures do they include?
• How are performance measures being used to gauge the impacts of transportation investments,support resource allocation and use decisions, and assess agency performance in program deliv-ery and cost-effectiveness?
• How are measures being tailored for different levels of transportation organizations?
• How are measures being used to communicate program status both internally and externally?
Given the extensive literature on transportation performance measurement (and the existence ofother reports containing literature reviews), a specific requirement of the literature review was thatit not duplicate recent research on performance measures, but rather build on it. The review there-fore did not seek to develop yet another compilation of performance measures in use, but insteadto apply existing compilations and reports of agency practice to develop a fuller understanding ofhow performance measurement could be applied practically in a comprehensive asset managementenvironment.
■ 3.2 Summary of Current Practice
General Literature on Transportation Performance Measurement
Transportation performance measures and performance monitoring have been documented inmany sources. Indeed, there is a vast literature on the topic of performance measurement in generaland on transportation performance measurement in particular. None of the literature, however, hasapproached the subject fully from the perspective of transportation asset management as developedin NCHRP Project 20-24(11). The recent literature does reflect, though, greater industry apprecia-tion of a broader range of applications than those dealt with historically, even if not fully engagingall aspects of asset management. This interest in more comprehensive applications of performancemeasures throughout an agency’s functions responds to several trends now affecting transportationorganizations:
• A general movement toward more policy- or mission-driven, outcome-influenced, and customer-oriented business approaches in managing programs and delivering services;
• The increasing use of performance measures as a formal component of policy formulation, long-range planning, program budgeting, and program delivery;
• The increase of strategic business planning exercises, in which goals, objectives, performance tar-gets, and tracking of target attainment are applied to key organizational or functional areas ofan agency; and
• A renewed focus on the importance of information and analytic tools in supporting performance-based management.
Several national studies and workshops on transportation performance measures provide broad-based data on current practice. They help establish a context for how performance measures are bestused in an institutional environment influenced by the Intermodal Surface Transportation EfficiencyAct (ISTEA), passed in 1991, and the Transportation Efficiency Act for the 21st Century (TEA-21),passed in 1998. (Key transportation-related provisions of these acts are embodied in Title 23, UnitedStates Code.) The acts identify management needs affecting U.S. transportation agencies, distill cur-rent practice in its ability to meet these needs, and cite emerging trends that will require furtherdevelopments in performance measurement. Selected studies also include suggestions for addi-tional performance measures and ways of organizing or structuring performance measures that con-tributed to the development of the frameworks later in this study.
• NCHRP Report 357 (26). Responding to a high turnover in state DOT executives, the researchersof NCHRP Project 20-24(6)A developed a compendium of 38 program performance measuresand indicators that are commonly used by state DOTs. This list is accompanied by backgroundinformation on performance-based management, descriptions of information on agency servicesand operations that a new chief executive officer (CEO) should be aware of, and explanations ofeach identified measure organized in the following categories: administrative, highway pro-gram performance, public transportation program performance, and motor vehicle programperformance. The report includes a supplement exploring methods for comparing state high-way performance among states as requested by the American Association of State Highway andTransportation Officials (AASHTO).
16
Volume I: Research Report

• NCHRP Synthesis 243 (20). NCHRP Project 20-5 (Topic 27-09) reviewed current program-development and management practices in capital programming and project selection by stateDOTs. Changes in these practices during the past 10–15 years have in some cases been dramatic,driven by a number of trends (e.g., greater competition for funds; changing roles of state,regional, and local agencies; new financing approaches; greater accountability for stewardshipand management of the transportation system; and new analytic tools and approaches to datamanagement), and reinforced by the requirements of ISTEA. The study describes current prac-tice in a number of capital programming functions, several of which are relevant more generallyto good asset management. The study’s findings in performance measurement are that “use ofperformance measures as a means of informing program goals and objectives is not widespread.”Case studies of DOTs in Alaska, California, Florida, Illinois, Kansas, Michigan, Minnesota, Nevada,New York, Pennsylvania, and Washington State describe the types of performance measures thatare applied in capital programming.
• NCHRP Synthesis 238 (25). This compilation of state practices in defining and implementingperformance measures was motivated by several trends that followed the passage of ISTEA(e.g., a strategic decision support, the need for increased accountability, the need to be com-petitive in the face of moves to privatize, and growing customer orientation). The studydescribes measures, techniques, and information used to characterize an agency’s multimodaltransportation functions, based on a nationwide survey of state DOTs. Findings confirm thatwhile there is still wide use of performance measures for “traditional” functions such as high-way maintenance and traffic safety, many innovations are also underway. These new devel-opments are moving performance measures in more strategic directions: more explicit ties topolicy goals and objectives, looking at results or outcomes, and considering quality and cus-tomer service.
• NCHRP Report 446 (7). This report is a guidebook for performance-based transportation plan-ning. One of five related projects undertaken by NCHRP Project 8-32(2), this study (8-32[2]A)focused on the use of performance measurement and monitoring in multimodal transportationplanning. It establishes a rationale for performance-based planning, discusses criteria for per-formance measure selection, and illustrates a number of potential applications through casestudies. It includes a performance measures library that was developed through a literaturereview, case studies of applications, and field visits with client organizations. This library pro-vides a comprehensive, structured inventory of performance measures in several areas: accessi-bility, mobility, economic development, quality of life, environmental and resource conservation,safety, operational efficiency, and system condition and performance.
• TRB Conference Proceedings 26 (4). TRB cosponsored a conference on Performance Measures toImprove Transportation Systems and Agency Operations in Irvine, California, in 2000. Giventhe breadth of performance measurement theory and practice, the conference focused specifi-cally on “using performance measures for transportation investment decisions, but with a clearunderstanding that organizational performance (including program delivery) must be consid-ered.” The application of performance measures to outcomes relative to investment levels wasparticularly of interest. The conference considered all modes and multijurisdictional issues aswell. Sessions included the following topics:
– Linking performance measures with decision making;
– Agency implementation of transportation system performance measures;
– Selection of measures, data needs, and analytic issues;
17
Volume I: Research Report

– Connection of system performance measures to broader goals; and
– Freight performance measures.
There was general agreement among attendees on the use of performance measures, providinga point of departure for discussions on how to integrate performance measures better withinseveral agency functions, how to incorporate multimodal and multijurisdictional considera-tions, results of experiments that had been tried, and a consensus on the need to share infor-mation on the processes and experiences of various agencies.
• Key Transportation Indicators, Summary of Workshop (19). Two National Research Council(NRC) studies (in 1992 and 1997) recommended that the Bureau of Transportation Statistics(BTS) in the U.S. DOT develop a “consistent, easily understood, and useful set of key indicatorsof the transportation system.” This report documents the proceedings of a workshop held inJune 2000 to discuss transportation indicators and to give BTS new ideas for issues to address.Panels of experts were organized to consider indicators in three areas: safety, mobility, and eco-nomic growth and trade. Within each area, the panelists discussed measures now in use, keyissues, potential new measures, and discussions of related topics such as suggested criteria forselecting measures and suggested additional practices in reporting and using measures.
• Performance Management: A “Start Where You Are, Use What You Have” Guide (37). This guidefocuses on performance-based management in the public sector 10 years after passage of theGovernment Performance and Results Act (GPRA). It makes its points by posing issues or posi-tions that have been voiced since passage of the GPRA, which claim that some aspect of perfor-mance measurement “doesn’t or can’t apply to my agency.” It discusses the issue and providesa number of “recommended responses” as guidelines to why performance measurement canand does apply to an agency, and by what rationale. Issues and responses are organized in sev-eral areas: Making the Case for Performance Measurement, Designing Performance Indicators,Aligning Performance Processes, Using Performance Information, and Communicating Perfor-mance Information.
• Performance Measures for Small Communities—Final Report to the FHWA (36). This reporttakes a look at performance measures from the unique perspective of small communities. Agen-cies at this level have smaller road networks and different scales of data collection and analysis,performance reporting, and decision support from those of larger metropolitan planning orga-nizations (MPOs) and state DOTs. In focusing on operational performance measures for smallcommunities, the report discusses several findings (e.g., that despite the large number of poten-tial measures available, few are in use by small communities; that mobility measures likely to beof greatest interest are facility-level congestion measures; that operational strategies focus onmajor signalized arterials; and that there exist data collection strategies that can feasibly supportoperational performance measures for small communities).
• NCHRP Project 20-24(20) final report (33). Project 20-24(20) looks at performance measurementin the context of strategic management, with the objective to provide guidance to state DOT CEOsand senior managers on how to develop strategic performance measures. Strategic managementcomprises activities to identify important agencywide goals and objectives and then work towardachieving them. These activities may range from formal business plans to define vision, mission,goals, objectives, and the actions to achieve these, to more informal approaches. Strategic perfor-mance measurement combines strategic management and performance measurement: It linksstrategic goals and business processes, but without the need to track hundreds of different mea-
18
Volume I: Research Report
sures. The final report is a handbook for agencies to conduct strategic performance measurement,organized around four building blocks: basic principles, selection criteria for measures, examplesof individual measures that agencies can use, and an implementation framework. The report pro-vides examples of strategic performance measures used by state DOTs in Florida, Kentucky,Louisiana, Maryland, Minnesota, New Mexico, Pennsylvania, and Washington State.
• Transportation Performance Measures in Australia, Canada, Japan and New Zealand (34). Thisreport presents the findings of an international scan tour on the use of performance measuresfor transportation planning and decision making. Members of the scan tour identified severalgood examples of the use of performance measures for setting priorities and making investmentand management decisions. Approaches to safety performance measures were observed to beparticularly notable, and the report devotes a separate section providing detailed treatment ofthis topic. It is interesting to note that the innovative practices that were found were related moreto how performance measures were used than to which specific measures were used. One of thestudy’s conclusions was that all of the sites visited use measures that are commonly used inthe United States. However, practices identified—such as the use of before-and-after studiesto document the impacts of implemented actions and provide feedback for future investmentdecisions—are not typically followed in the United States.
Performance Measures for Routine Maintenance
A review of performance measures associated with routine maintenance was included in this study.For those aspects of maintenance that help preserve the transportation system, routine maintenancecan be included in an analysis of capital-maintenance tradeoffs for preservation. Those aspects ofmaintenance that involve service delivery can contribute to operational efficiency, mobility, orsafety.
Performance measures for routine maintenance are not at the same stage of development as those forcapital programs, but the state of the practice is advancing. Several states, including Washington, Col-orado, and Arizona, have implemented maintenance quality or level-of-service approaches to improv-ing accountability and linking maintenance resource allocation decisions to measured and projectedperformance. For example, Colorado DOT defines nine levels of service for each maintenance elementand assigns grades based on annual surveys. The Colorado Transportation Commission reviews thisinformation and decides on target levels of services (linked to budgets) for each element. Colorado col-lects data on expenditures by maintenance element on a quarterly basis, and uses this data to providean indication as to whether they are tracking on their level of service targets.
The issues involved in advancing the state of maintenance management and their implications forperformance measurement were considered in depth at a forum on “Maintenance Management forthe 21st Century” held in Arlington, Texas, March 16–18, 1999. This forum identified six critical areason which agencies needed to focus to become “high-performance maintenance organizations for the21st century” (27):
1. Customer service, focusing on outcomes as perceived by transportation users in all phases ofmaintenance planning, budgeting, and program delivery;
2. Integrated information systems, providing consistent, coordinated, and performance-basedinformation and decision support for executive, operational, and financial decisions across anumber of agency functions;
19
Volume I: Research Report

3. Data collection and processing for condition assessment, emphasizing the need for cost-effectiveleveraging of technology to provide information on the condition of maintained features that isneeded for effective maintenance management;
4. Improved maintenance planning to enable performance-based, customer-oriented develop-ment of maintenance programs and budgets and to link with other management systems andsources of information where needed;
5. Organizational development through training to instill the business, technical, and leadershipskills that maintenance managers will need in the 21st century management environment; and
6. Performance management to develop a management culture within the maintenance organi-zation that takes a strategic approach to delivering high-performance results through a processof continuous improvement.
This workshop was followed by a second workshop focusing on commonly recognized perfor-mance measures for maintenance. Expert practitioners gathered to present ideas on performancemeasures that could serve an outcome-based, customer-oriented approach to maintenance man-agement (5). The AASHTO Highway Subcommittee on Maintenance advanced this idea in a reso-lution to work with the FHWA and TRB to adopt commonly recognized performance measures thatwould help deliver “improved outcome-based maintenance practices” (1). This subcommittee thenconducted a survey of member and affiliate agencies to determine current practice regarding main-tenance performance measurement. The findings showed that heavily used maintenance perfor-mance measures are predominantly input- and activity-based, with output-based measures to aslightly lesser degree. Outcome-based measures are used to some degree, but the trend towardusing them in the future is strongly increasing (3).
Overview of Agency-Specific Practice
Agency-specific information documents performance measures in use and establishes context (i.e.,the relationship of performance measures to policy goals and objectives, the use of performancemeasures at different organizational levels and across agency units, and their application to differ-ent functions and activities [e.g., planning, project justification, program development, and tradeoffanalyses]). Agency-specific information has been obtained from several types of documents, includ-ing long-range plans, strategic business plans, program development reports, comprehensiveannual financial reports prepared in compliance with GASB 34, and reports and compilations ofmeasures prepared for agencies updating their performance-based processes.
As noted above, another source of agency-specific information is a series of interviews conducted forthis study with 15 transportation agencies. The interviews have covered a geographically balancedset of states, as indicated in Table 2. These states also exhibit varying levels of development of, andapproaches to, performance measurement, examples of which are presented later in the report.
The agency interviews revealed several general characteristics of current practice:
• Performance measurement is clearly a matter of continuing interest and attention. Of the agen-cies that already have adopted performance measures, several (e.g., New York, Florida, Colorado,Ohio, and Virginia) have ongoing initiatives to renew, redevelop, or transform their performance
20
Volume I: Research Report

measurement systems; to develop integrated performance measurement at strategic, businessmanagement, and operational levels; or to incorporate performance measurement more stronglyinto an asset management approach. Agencies that do not now use performance measures widely(e.g., Iowa and Tennessee) are taking steps to strengthen their application.
• Although the interviews dealt mostly with highway measures, agencies discussed their multi-modal operations and the performance measures applied in nonhighway modes. Modal pro-grams are typically managed through separate organizational units and/or funding sources(e.g., Idaho and Maryland DOT).
• Although the interviews reflected this study’s focus on resource allocation, several agencies(e.g., Maryland, Michigan, Montana, New York, Virginia, and Washington) stressed the impor-tance of program delivery in external reporting and in contributing to an agency’s credibility in
21
Volume I: Research Report
State AASHTO Regional Association
Colorado 4 – WASHTO
Florida 2 – SASHTO
Idaho 4 – WASHTO
Iowa 3 – Mississippi Valley Conference
Maryland 1 – NASTO
Michigan 3 – Mississippi Valley Conference
Minnesota 3 – Mississippi Valley Conference
Montana 4 – WASHTO
New York 1 – NASTO
Ohio 3 – Mississippi Valley Conference
Pennsylvania 1 – NASTO
South Carolina 2 – SASHTO
Tennessee 2 – SASHTO
Virginia 2 – SASHTO
Washington 4 – WASHTO
NASTO = Northeast Association of State Transportation Organizations
SASHTO = Southeast Association of State Highway and Transportation Organizations
WASHTO = Western Association of State Highway and Transportation Organizations
Table 2. States Interviewed for This Study

performance measurement generally. Montana noted that project delivery targets, letting sched-ules, and the types of work to be done to meet system performance targets were negotiated withthe contractor community. Maryland observed the difficulty of establishing accurate cost esti-mates that could be used in delivery targets because of the ancillary costs associated with proj-ects, a topic that has also been considered in Washington State and Montana.
• Although most agencies have well-defined performance measures for system preservation andmobility that relate to capacity expansion, agencies are now also increasingly working todevelop appropriate performance measures for system management and operation, especiallyoperational efficiency. Florida, Michigan, and Minnesota are examples of agencies that haveinstituted performance measures for operational efficiency, ITS deployment, freeway systemperformance with ITS, effectiveness of snow and ice operations, and incident response.
• Several agencies (e.g., South Carolina, Washington, Ohio, and Iowa) have tied transportationsystem performance to employees’ annual appraisals or assessments.
The information presented in the remainder of Section 3.0 combines findings from general sourceson transportation performance measurement and agency-specific information identified above.Documents contributing information to these presentations are compiled in the bibliography at theend of this report.
■ 3.3 Organizational Contexts
There are clear variations across agencies in their approach to asset management and use of perfor-mance measurement. There is no single set of universal performance measures that will work in everyagency, and there is no single, standard “right way” of implementing them. While transportation assetmanagement rests on several core principles, application of these principles to addressing trans-portation system problems and needs varies across agencies to accommodate their particular systeminventories, organizational structure and responsibilities, and management culture. How performancemeasures are applied and interpreted likewise reflects individual agency characteristics. For example,although asset management and performance measurement are associated with a greater degree ofintegration and coordination of agency objectives across business units, several interviewees (e.g.,interviewees from Idaho and Maryland) stressed the continuing importance of maintaining core busi-ness lines to provide needed technical expertise. In other words, asset management is not inconsistentwith organizational “silos” when the term is used to denote agency units housing important skills andinformation. What asset management tries to address, however, is avoiding a silo-based mentality—thatis, avoiding “working with blinders on.” Methods that agencies use to coordinate and integrate andbusiness processes and decisions among their disciplinary units include:
• Forming cross-functional teams. For example, Colorado DOT is pursuing a core services approachto performance measurement in which teams from multiple units are responsible for action plansin key functional areas (project delivery, system operations, roadway, roadside, etc.). The coreservices approach is intended to promote alignment across organizational units and counteract“stovepipe thinking.”
• Assigning other agency units the specific role to coordinate across the technical units (e.g., plan-ning and strategic policy offices).
22
Volume I: Research Report

• Relying on technological mechanisms to promote integration and coordination through shareddata (e.g., geographic information systems [GIS]).
Some DOTs have in fact implemented asset management approaches that represent a compre-hensive, integrated effort. Two examples for Florida and Ohio are described in accompanyingSidebars 3.1 and 3.2.
23
Volume I: Research Report
Sidebar 3.1: Summary of Florida’s Asset Management Approach
The Florida DOT is decentralized and operated through a central office and eight districts. The agencymanages a system of roadways and bridges and is responsible for motor carrier compliance in the state.The department’s role with respect to public transportation is to provide funding and technical supportto local agencies and private-sector entities that own and operate 14 seaports, 22 commercial airports,3,000 miles of main route rail, 18 local and regional transit systems, and 48 specialized systems servingthe transportation disadvantaged. The department is responsible for 12,000 of the 114,500 centerlinemiles of public roads in the state. The department maintains 6,200 of the 11,000 bridges statewide.
The Florida DOT’s mission is to provide a safe transportation system that ensures the mobility of peo-ple and goods, enhances economic prosperity, and preserves the quality of the environment and com-munities. The department’s asset management process is the holistic approach used for decisionmaking, investment analysis, and management of transportation assets. It encompasses the entireprocess from planning and programming to system preservation. It is characterized by a solid policyframework, measurable objectives, and continuous performance monitoring. It seeks sound invest-ment decisions with a customer focus. The asset management concepts of data-supported decisionmaking, management systems, strong relationships between condition and performance, and anemphasis on tradeoff and investment analysis are integral components of daily business at thedepartment. These concepts are part of the culture and are strongly supported by upper manage-ment. There is no single office responsible for asset management; rather, the department is perme-ated with responsibility for evaluating and reporting the results against goals and objectives.
Asset management is incorporated into a continuous process that links policies with financial plan-ning, programming, and performance monitoring to determine if objectives are met. The perfor-mance measurement then results in appropriate decisions regarding funding levels and adjustmentof plans and policies to begin a new cycle.
Asset management begins with a strong statutory policy framework documented in the FloridaTransportation Plan (FTP). The FTP establishes 20-year goals and objectives and is updated and pub-lished every 5 years. The Short-Range Component of the FTP documents shorter-range (10-year)goals, objectives, and strategies and is published annually. A more detailed Program and ResourcePlan sets forth specific operating polices and performance measures that guide the development ofeach program. The Program and Resource Plan is a 10-year plan containing program funding levelsand financial and production targets that are balanced to anticipated revenues. It is produced annu-ally for the legislature. A 5-year list of projects (called the Work Program) is developed annuallybased on the FTP, the Program and Resource Plan, extensive district and public involvement, andultimately decision making by a strong executive committee at the department. Finally, a perfor-mance report is produced. The performance report is an annual report, including a summary of thefinancial operations of the department and the success in meeting short-term goals.
Florida has made an investment decision that preservation of the system is “taken off the top.” Preser-vation is divided into three categories: pavement, bridge, and routine maintenance. Each of these hasan extensive inventory-driven, performance-based management system that allows for investmentdecisions to be made based on demonstrated needs and priorities.
(continued on next page)

24
Volume I: Research Report
Sidebar 3.2: Summary of Ohio’s Asset Management Approach
Ohio is divided into 12 districts, with District Deputy Directors who report to management at head-quarters. Since 1995, the department has gone through a period of decentralizing, downsizing, andcost-cutting. Recognizing that existing funding was insufficient to meet program needs, in 1999 thedepartment changed to a funding process based on need, taking explicit account of system conditions,to replace the legacy approach built on what programs had received in the past. This approach is sup-ported by strategic plans and performance measures. Ohio DOT (ODOT) produces a District Multi-year Work Plan that identifies preservation projects for 10 years, in addition to a 30-year statewidetransportation plan. An annual ODOT report card is produced.
An organizational performance index (OPI) monitors 65 key measures. These measures include met-rics for pavement and bridge conditions, program delivery, and highway maintenance results. Thesemeasures are reviewed by each division and are rolled up to an index of higher-level measures. Quar-terly executive reports highlight exceptions (i.e., areas that are not meeting goals). Districts are taskedwith developing a plan to correct these failures, and the process is monitored. Monthly reports ensurethat districts currently are meeting goals and are forecasted to meet goals in the future.
Day-to-day business operations are managed by districts. District offices oversee planning, design,and maintenance and manage construction. District Deputy Directors sit in on quarterly ODOT meet-ings and discuss performance. Central headquarters develops policy and training, has Quality Assur-ance Reviews to identify and recommend changes in current policy, and conducts statewide planning.
The department funds preservation and operations needs and then considers funds available forexpansion. Recently, the expansion program has benefited from a revenue increase.
Capacity expansion projects receive separate funding of approximately $500 million per year in a con-gestion relief program, an increase from $300 million annually in the late 1990s. Half of this money is pro-vided by the federal government, and half is derived from a 2-cent-per-year increase in the gas tax overthe next 3 years. This revenue increase, passed by the legislature and signed by the governor, is one ofthe few recent fuel tax increases for transportation in the United States. Competition for these capacityexpansion (i.e., multimodal congestion relief) projects is statewide and includes a systematic, fact-driven
Sidebar 3.1: Summary of Florida’s Asset Management Approach(continued)
Only after all preservation and public transportation dollars have been allocated are capacity dollarsprogrammed. In 2003, the Florida legislature created the Strategic Intermodal System (SIS), a networkof statewide and regionally significant intermodal facilities to help guide transportation investmentsthat are important to Florida’s future economy. The new investment policy has the objective of allo-cating 75 percent of discretionary funds to the SIS. The SIS will increase the emphasis on corridor-based planning and investment, encourage innovative policies and technologies (as in the use ofintelligent transportation systems), and provide key input for the FTP. The remaining 25 percent ofdiscretionary funds go to other, existing capacity programs: Other Arterials, Transit, Rail, Seaport,and Aviation, particularly for facilities that emphasize regional travel.
Decision support systems are available to help analyze investment decisions.
(continued on next page)

25
Volume I: Research Report
Sidebar 3.2: Summary of Ohio’s Asset Management Approach(continued)
application process involving local governments, MPOs, and the review and support of ODOT districts.The applications are reviewed and decisions made by a nine-member statewide Transportation ReviewAdvisory Council chaired by ODOT’s director and members selected by the governor, president of theSenate, and speaker of the House.
• Preservation projects and operations are funded separately from expansion. Legislators did notwant to lower performance in these areas by moving money toward capacity. System preservationand safety are the top priories of the department, and this is reflected in the allocation of funds.
A Funds Management Committee (FMC) recommends funding allocations, which are reevaluatedevery 2 years:
• The FMC recommends to ODOT senior management the mix of performance targets and associ-ated funding levels supported by trend analysis, deterioration projections, and tradeoff analysesamong alternative scenarios.
• Sensitivity scenarios are presented by districts. For example, for $X, Y amount of maintenance canbe performed. For 10 percent more money, 15 percent more maintenance can be performed.
• Based on this information, a negotiating process determines the final funding allocation and bal-ance among projects.
• Central headquarters sets policies on goals and performance metrics statewide and by districts.
• The highway system is considered in tiers, with a priority system composed of all interstates andthe rural multilane National Highway System routes.
• The central office sets allocation targets for bridges and pavement by district, based on need anddeficiencies.
• The central office gives districts goals and the task of choosing projects that will meet those goals.Goals are different for each district, and each district may be at different stages of projects. Dis-tricts must file plans for projects by a certain date.
• District goals are updated every 2 years. For pavements, districts have unique goals for FY 2004that are based upon initial system conditions and funding. By 2008 all districts must have 90-percentacceptable pavements.
■ 3.4 Approaches to Selecting and Organizing Measures
Existing Criteria to Select Performance Measures
Criteria that agencies now use to select performance measures are listed in Table 3. Those most com-monly used include:
• Are easily understood by both technical and nontechnical audiences,
• Can be implemented with current resources (e.g., available data and existing information systems),

26
Volume I: Research Report
Criteria
NCHRP interim
document (6)
Delcan Corp.et al. (13)
TRB Conference Proceedings
(14)
Performance measures report for
San FranciscoBay Area
(16)
Arizona DOT
Planning(24)
NCHRP Synthesis
311 (28)
Mobility Paper
for FHWA
(32)
Easy to understand
Well-defined and quantifiable
Professional credibility
Describes existing condition
Can be predicted
Implemented with current resources
Reasonable accuracy
Reasonable precision
Applies to multiple modes
Changes over time
Varies by transportation alternative
Characteristic can be controlled
Captures user’s experience
Interpreted consistently
Reflects outcomes
Benefits outweigh costs
Supports goals
Applicable across corridors
Compatible with standards
Reliability of source data
Meaningful across geographic scales
Table 3. Criteria Now Used to Evaluate Performance Measures

27
Volume I: Research Report
Source Organizational Approach Categories of Measures
NCHRP 8-32(2) (6)
Type of impact (rel. to policy goals)
Accessibility, mobility, economic development,condition, etc.
Vermont Highway System Policy Plan (9)
Type of impact (rel. to policy goals)
Preservation, safety, mobility, etc.
Level of application Interstate, state system, priority network, etc.
(continued on next page)
Table 4. Examples of Ways to Organize Performance Measures
• Reflect impacts of different transportation alternatives, and
• Reflect characteristic(s) that can be controlled by the implementing agency.
It turns out that many of the criteria in Table 3 are consistent with good asset management practice.It should be recognized, however, that agencies may have good reasons for defining particular per-formance measures that go beyond the recommendations of asset management (e.g., requirementsof state statute or of external reporting). The recommendations of this report, focusing on asset man-agement, may therefore represent a subset of the full range of performance measures that an agencyneeds to apply.
Organizing Performance Measures
Table 4 summarizes different approaches to organizing performance measures. Many of theseapproaches are consistent with the set of performance measure categories established for this study(and presented in Section 2.2). Agency-specific efforts identify performance measures primarily bytype of impact or aspect of performance (e.g., safety, mobility, and preservation), which are typi-cally tied to an agency’s goals and policy objectives. Tying performance measures to types ofimpacts promotes a direct connection between an agency’s policy objectives and the results ofinvestments intended to achieve those objectives. More general national or international studiesorganize performance measures in a way that reflects the particular objectives of the research.
Clearly, there are other ways to define categories of measures. Agencies tailor their own classi-fications of performance measures to respond to policy objectives, programs, managementstyles, and reporting needs. While there is general agreement on preservation as a key category,agency practices vary in how to classify measures of transportation availability and traffic move-ment (i.e., to what degree do accessibility, mobility, trip reliability, and operational efficiencyrepresent separate “categories” of measures as opposed to one being a subset of another). Also,while the organization described in Section 2.2 assumes that “customer-oriented measures” areincluded in each of the respective categories, some agencies treat customer-oriented measures asa separate classification. These are arbitrary distinctions that should not distract from the objec-tives of this study.

28
Volume I: Research Report
Source Organizational Approach Categories of Measures
Ontario Ministry of Transportation (17)
Type of impact (rel. to policy goals)
Preservation, cost efficiency and control, modal integration, etc.
Organizational use Corporate measures (e.g., percent highway length in good condition); and technical measures (e.g.,pavement condition index, maintenance measures)
Maryland DOT (2003) (15) Type of impact (rel. to policy goals)
Preservation, system performance, support ofSmart Growth, etc.
Class of measure Performance indicators (e.g., dollars spent, num-ber of projects advertised) and cost-effectiveness measures (e.g., average age of buses)
San Francisco Bay Area Metropolitan Transportation Commission (16)
Type of impact (rel. to policy goals)
Mobility, safety, economic vitality, etc.
Montana DOT (18) Type of impact (rel. to policy goals)
Pavement, bridge, safety, and congestion
OECD (22) Type of impact (rel. to policy goals)
Mobility, safety, environment, equity, etc.
Stakeholder Government, road administration, and road user
National Research Council (19)
U.S. DOT strategic goals Safety, mobility, economic growth and trade,human and natural environments, etc.
New Zealand (21) Asset type Roads, structures, equipment, etc.
Arizona DOT(24)
Long-range goal Access and mobility, safety, stewardship, etc.
Canada (30)
Measurement type General, macrolevel indicators for road assets; indicators of service quality provided to road user; indicators of productivity and efficiency of providing roads, indicators of sectoral effective-ness, and indicators of institutional effectiveness
Mobility MonitoringProgram (32)
Aspect or type of impact (rel. to policy goals)
Travel time measures, travel rate measures, delay measures, etc.
NCHRP 20-24(20) (33)
Strategic issue Externally driven (e.g., mobility, congestion, safety, etc.) and internally driven (e.g., preserva-tion, operations, project delivery, etc.)
Table 4. Examples of Ways to Organize Performance Measures(continued)

■ 3.5 Current Performance Measures
Performance Measures in Use
There are thousands of performance measures now used or proposed for use in transportation thathave potential applicability for asset management. Appendix A in Volume II of this report consists ofa series of tables presenting sample performance measures, organized by the goal-based categoriesintroduced in Section 2.2 (Preservation, Mobility and Accessibility, Operations and Maintenance,Safety, Economic and Economic Development, Environmental Impacts, Social Impacts, Security andDelivery). These tables are by no means exhaustive—for each measure listed, there are numerous vari-ations with respect to the source data used—for example, pavement condition can be based on rough-ness, rut depth, indexes of surface distress, and/or other factors. There are also many variations withrespect to how a given measure can be formulated—for example, average pavement condition, thepercent of the pavement network above or below a stated threshold value of condition, and a per-centile level of condition (such as the condition level defining the worst 10 percent of pavement). Someof the most common formulations were included in the tables, but each item should be viewed as rep-resentative of a larger set of performance measures that may take slightly different mathematicalforms. By focusing on the essential characteristics of a measure, these abbreviated descriptions makeit easy to distinguish major aspects of performance and identify options for defining measures.
Since the tabulations are composites from many sources and there is significant overlap amongthem, individual sources are not identified in the tables. The reference list and bibliography at theend of this volume include the sources of these example measures.
Measuring Social, Environmental, Economic, and Security Impacts and Concerns
Social, environmental, economic development, and security impacts are increasingly importantaspects of decisions on transportation investments. While these measures are generally less welldeveloped than those for preservation, mobility, and safety, a number of example measures wereidentified in the literature and are included in Volume II Appendix A. Since these impacts tend tobe non-economic in nature, they are often characterized in qualitative rather than quantitative terms.Additional suggestions for incorporating these types of impacts within strategic evaluations oftransportation performance are given in FTA report FTA-GA-26-7000 (38).
Output and Outcome Measures
“Outputs” refers to the agency costs (e.g., the number of staff hours spent or the tons of asphaltused), and “outcomes” refers to the resulting improvements in performance or condition (e.g., theincreased percent of pavement in good condition, improved mobility and safety, and lower travelcosts to customers). The common wisdom today is that it is preferable to measure “outcomes” ratherthan “outputs” (and either of these is certainly better than measuring “inputs”) to achieve results-oriented performance monitoring. This thinking is reflected in sources on performance monitoring(e.g., Wye, 2002 [37]), and in interviews with several agencies acknowledging an intention to movetoward more outcome-based measures. Many interviewees admitted, however, that their state ofpractice is now to look at outputs.
29
Volume I: Research Report

With growing experience in performance measurement, some agencies are beginning to revisit the com-mon wisdom and to believe that a blend of output and outcome measures may be preferable to usingeither type alone. The rationale for this argument builds on the prior experience of the research team inworking with state DOTs and the ideas expressed by agencies in interviews conducted for this study:
• Outputs may be more easily understood by a nontechnical audience, including policy-makersin the legislative and executive branches.
• Outputs are often easier and less expensive to measure than outcomes and therefore can pro-vide interim performance results until outcomes can be gauged. It also may be possible to relateoutcomes to outputs through research, thereby enabling output measures to serve as surrogatesfor outcomes.
• Output measures provide an immediate indication of accomplishment for those activities whosebenefits accrue over the long term (i.e., where “outcomes” are not immediately apparent). Out-comes should still be monitored over the long term, but outputs supplement this informationwith short-term indications of what work has been done.
• As a corollary to the above, output measures provide a tangible indication of accomplishmentfor preventive maintenance. Outcomes of preventive maintenance are the avoidance of damage(which is difficult to measure), cost-effective extension of service life (which is measurable, butonly over the long term), and consequent benefits to customers through sustained levels of goodrideability and lower road user costs (which is also measurable, but only over the long term).Again, outputs fill in the short-term need for information, while confirmation of the benefit ofpreventive maintenance accrues over the long term.
• A blend of outputs and outcomes serves different analytic needs in asset management, particu-larly in life-cycle cost analysis. Both types of measures support better quantification of life-cyclecosts and benefits at different levels of investment and resulting levels of transportation service.
• Examples from agency experience include the following:
– While Minnesota DOT began moving to outcome measures several years ago, it is now start-ing to emphasize output measures at lower levels of the organization to support the out-comes at higher levels.
– The Montana DOT has observed that maintenance and operations performance measurestypically deal with outputs rather than outcomes. It is therefore difficult to coordinate theseactivities with long-term pavement and bridge preservation strategies developed by man-agement systems.
Performance Data Collection
Good data are critical to good performance measurement. The interviews suggest that data avail-ability, quality, and affordability are key issues. Based on the comments received, affordability isseen more as an issue of the amount of data collected rather than the relative costs of different datacollection methods or technologies. Having too much data is not only expensive, but also potentiallyconfusing and lacking in cohesiveness to the public.
30
Volume I: Research Report

Maryland has been partly successful in obtaining approval for a revenue program in 2004. It is nowemploying asset management reasoning to secure a significant share of the increased funding forhighway system preservation (objective: increase from $275 million to $450 million). The case is datadriven with charts, graphs, and so forth. There is a need to overcome the perception that “the sys-tem now looks good—why are additional resources necessary?”
Additional observations on the importance of data include the following:
• Representatives from Montana and Washington said that good, well-presented data havehelped agencies in making their case before their legislatures.
• Maryland makes the point that its small size gives it an advantage in the feasibility of a singleinspection team for statewide data gathering, promoting greater consistency.
• A comment by Tennessee captures the sentiment—“Bad data is worse than no data at all.”
Data Supporting Preservation Measures
• Pavement condition data are typically collected annually for high-classification highways. Themost common data collection methods are windshield surveys and vehicles equipped with auto-mated sensing and recording equipment, such as an automatic road analyzer (ARAN). Othermethods include customer surveys, photo logs, and video logs.
• Bridge condition data are typically collected biannually through field inspections, as requiredby federal regulation.
• Maintenance data are collected through periodic surveys and may employ sampling techniques.
• Some agencies (e.g., Tennessee) may apply their GASB data and targets to preservation.
Data Supporting Operations and Management Measures
DOTs vary widely in the extent to which they collect data to support operations and managementperformance measures. Examples of states that do support these measures include the following:
• Florida DOT tracks several measures gauging incident response and travel time and delay onlimited-access freeways managed by ITS.
• Ohio DOT performs an annual maintenance survey of pavement, drainage, vegetation, signing,guardrail, and litter.
• South Carolina DOT performs an annual sign condition survey.
• Minnesota DOT and Iowa DOT track snow removal using reports filled out by plow operators.
• A common source of accident data are state and local police reports. New York DOT uses anaccident surveillance system.
• Minnesota DOT tracks incident clearance time on the Twin Cities Metro Freeway system usingan incident tracking system and video cameras.
31
Volume I: Research Report

Data Supporting Capacity Expansion Measures
• Traffic data are collected through permanent traffic recorders, weigh-in-motion (WIM) devices,speed detectors, temporary traffic monitors, and video cameras.
• Traffic data are often supplemented with comprehensive traffic studies (e.g., an annual mobilityreport or regional travel model) and individual studies that focus on a specific segment or corridor.
Tracking and Projecting Performance
Trends in performance measures provide useful information for management. Virtually all DOTsthat were interviewed tracked historical levels of performance. Minnesota observed that whiledevices such as “dashboards” are useful in reporting the status of a program, analyzing trends inperformance measures is more meaningful.
Most agencies indicated that they also project at least one category of performance measure into thefuture. Typically these include preservation-related measures, owing to the wide implementationof management systems for pavements, bridges, and maintenance.
Travel demand models are also used to forecast transportation needs, future congestion levels,and the types and locations of capacity expansions and improvements in operational efficiency.In addition to applying analytic models, agencies may extrapolate historical trends. Several agen-cies admitted an inability to predict future safety performance.
■ 3.6 Approaches to Aligning Measures within the Organization
Organizational alignment of performance measures vertically (from top management to technicalstaff) and horizontally (across functional units) was an important topic of discussion in the interviews.From an asset management perspective, top-to-bottom consistency in performance measurement isessential for providing a strong linkage between policy objectives and decision making; horizontalconsistency allows for tradeoffs to be made across different geographic and functional areas.
Vertical Alignment
Vertical alignment enables performance measures to be used in a consistent way by different levelsof an organization. Agencies rely on several approaches to vertical alignment:
• Shared Use—The most basic form of vertical alignment is the shared use of performance mea-sures at different organizational levels, as is done by ODOT and New York State DOT. Thismethod implies the ability of performance measures to apply to networks of different scales (e.g.,at a foreman or area level, districtwide, and statewide) and to “roll-up” results from one level tothe next higher one.
32
Volume I: Research Report

• Summarizing Technical Measures—Technical performance measures may be translated to othermeasures more useful at a higher managerial level by mathematically summarizing performanceresults. For example, the New York State DOT tracks multiple technical measures related tobridge condition, such as a bridge condition index and a maintenance condition index. However,only one number, the percent of deficient bridges, is generally reported to upper management.
• Formal Relationships Among Measures at Different Levels—Some agencies have establishedformalized vertical relationships between measures. For example, the Ohio DOT visualizes a pyra-mid (Figure 3) to illustrate how performance measures are integrated to provide strategic guid-ance. Beginning at the bottom, the organizational performance index (OPI) uses a consistent set of75 measures across the entire organization to evaluate performance across the 12 district officesand central divisions of ODOT. The OPI monitors day-to-day operations; each measure is indexedto complete a balanced scorecard that is used to track monthly changes in divisional performance.“Strategic Initiatives” are process-improvement efforts targeted where significant organizationalperformance gaps exist in meeting “Goals.” “Values” of system condition measures such as pave-ment deficiencies, bridge deficiencies, crashes, and congestion relate “Goals” to the corporate“Mission.” In addition to Ohio’s example, other agencies (e.g., Iowa, Idaho, Minnesota, South Car-olina, and Tennessee) formalize hierarchies of performance measures through strategic businessplanning efforts; other agencies (e.g., Colorado) do so through program investment categories; andother agencies (e.g., Florida and Pennsylvania) do so through similar strategic management tools.
• Shared Data and Data Formats—Storing and reporting performance measures within agencywiderepositories and reporting results in a single, consistent format can promote vertical alignment aswell as horizontal alignment (see the next section). For example, Michigan DOT’s TransportationManagement System (TMS) serves as a repository of over 100 performance measures. This systemprovides decision-makers throughout the agency with access to the same performance data.
33
Volume I: Research Report
Mission
Values
Goals
Strategic Initiatives
Organizational Performance
Figure 3. Vertical Alignment of Performance Measures—Ohio DOT

Horizontal Alignment
Horizontal alignment implies the consistent use of performance measures across agency functionsand programs in meeting the agency’s different goals. This use of performance measures can facil-itate tradeoffs across investments in different program areas and can provide clarity with respect tothe contribution of different organizational functions to a unifying set of goals. The interviewsdemonstrate several ways to achieve horizontal alignment:
• Statutory or Other Statewide Mandate—Agencywide consistency in performance measure-ment can come about in responding to a state government requirement. For example, Michiganand Vermont have state statutes mandating asset management in transportation infrastructure.Michigan DOT and local transportation agencies are members of an Asset Management Coun-cil; one of the responsibilities of this council is to report on infrastructure conditions in a consis-tent way. Vermont’s law requires the Agency of Transportation to report on condition andtrends in its infrastructure according to defined guidelines. South Carolina DOT is required bylegislation to submit monthly reports to the House Ways and Means Committee and the FinanceCommittee regarding progress toward several maintenance objectives. In complying with thismandate, all of the DOT’s districts track the set of measures in a consistent manner. Iowa’sAccountable Government Act requires each Iowa state agency to prepare both a Strategic Planand a Performance Plan. The Strategic Plan outlines the agency’s vision, mission, and core func-tions, provides a brief internal and external assessment, and outlines strategic departmentalgoals. The Strategic Plan is submitted by the governor’s office to the legislature for approval. ThePerformance Plan provides desired outcome measures and targets in each of the core areas.
• Multidisciplinary Involvement—As a practical matter, horizontal alignment is often associatedwith good communication among agency units regarding goals and objectives. For example, theMichigan DOT conducts regular meetings with representatives from the planning, delivery,operations, and financial functions (including field staff) to assess the relationship betweencommitted design and delivery schedules, available revenues, and advancing toward the DOT’sperformance targets. New York State DOT’s goals were developed by a task force comprisingrepresentatives from all major program areas. The resulting targets apply to all functional groups.Idaho DOT facilitates discussions among its core business lines through its Planning, Adminis-tration, and Budget Policy and Intergovernmental Relations units, focusing on a long-range viewof issues rather than tactical or operational matters.
• Statewide Measures and Guidelines—Another approach to horizontal consistency is to estab-lish statewide measures. For example, Florida DOT has established statewide measures that canbe rolled up from the district level. The districts support these statewide efforts and use the result-ing measures because the central office provides consistent guidance and policies. MinnesotaDOT also has a set of “core” measures that tend to be applicable at the system level (such as thoseused in the Statewide Plan) or to priority processes such as those used in project development.
• Central Data Repository—A single source of consistent data, such as Michigan DOT’s TMS, pro-motes horizontal as well as vertical alignment, as noted above.
Challenges in Current Practice
Achieving consistency in performance measure interpretation and use throughout the organiza-tion takes work and attention, and many practical problems can impede full alignment. For
34
Volume I: Research Report

example, Washington State DOT (WSDOT) has found that a major impediment to increasing hor-izontal consistency is data availability. While many of WSDOT’s management systems are theo-retically capable of supporting agencywide performance assessment, associated databases are notfully populated.
Maryland DOT has found that vertical alignment varies among its modal administrations.Whereas the Motor Vehicle Administration has significant vertical alignment, other modes (e.g.,highways, transit, aviation, ports, and toll roads) are less so, and the relationships to decisionmaking are more indirect. In these cases, budget-makers and policy-makers are aware of opera-tional measures and influence their direction, but there is no direct link between this guidanceand day-to-day decisions. On a departmentwide basis, vertical alignment is still at an early stage.While Maryland DOT expects to make improvements in vertically integrated performance mea-surement over the next few years, even then this will be just one tool, not the tool, for managingthe department.
■ 3.7 Use of Performance Measures
Performance measures currently are being used to support high-level policy and resource alloca-tion decisions, to evaluate and compare solutions at a corridor and project level, and to support dailyoperations. Specific ways in which agencies use performance measurement to provide feedback intodecision making are discussed below.
Providing Feedback for Use in Resource Allocation
Existing feedback mechanisms among the agencies interviewed range from discussions of plannedversus actual accomplishments and decisions on the next cycle’s targets to formal, structuredprocesses. Agencies also varied in the degree to which they emphasized public engagement in thefeedback mechanism.
• Structured Feedback Process—An example of a structured approach is contained within FloridaDOT’s asset management process, which is referred to as a “Continuous Cycle Approach” (Fig-ure 4). Plans and policies are established through the Florida Transportation Plan and the Short-Range Component. Financial polices are established in the Program and Resource Plan.Five-year projects are programmed in the Five-Year Work Program, and, finally, performance ismeasured. The results of the performance monitoring affect the development of long- and short-range plans through adjustment of policies.
• Quarterly Management Reviews—Colorado DOT’s executive management team reviews quar-terly performance reports for different business process areas. If performance is below target,responsible staff are expected to offer explanations and suggestions for improvement.
• Public Feedback—Montana DOT conducts public opinion surveys and meets with stakeholdergroups regarding the outcomes of its Performance Programming Process (P3). This approachprovides critical public feedback to its P3 and assists in future policy formulation and long-rangeplanning (refer to the feedback and interactive processes shown in Figure 2).
35
Volume I: Research Report

• Activity Adjustments Based on an Analysis of Trends—Iowa DOT provided examples ofadjustments to its maintenance program based on observed performance measure trends (e.g.,the mowing activity was modified to focus on safety considerations [i.e., sight distance] ratherthan aesthetics, and funds were shifted to address the edge rut problem for safety reasons).
Tradeoff Analysis
Tradeoff analyses lie at the frontier of asset management. Many agencies either (1) are not yet at astage of analytic capability or organizational readiness where they are able to perform systematicproject and program tradeoffs or (2) choose not to perform these tradeoffs even if they have the pre-requisites in place. One agency that described its tradeoff procedures during the interviews is OhioDOT. A Funds Management Committee is charged with recommending how to allocate funds. Allo-cation is reevaluated every 2 years by the following process:
• The committee recommends to ODOT senior management the mix of performance targets andassociated funding levels. These recommendations are supported by trend analysis, deteriora-tion projections, and tradeoff analyses among alternative scenarios.
• Sensitivity scenarios are presented by districts. For example, for $X, Y amount of maintenancecan be performed. For 10 percent more money, 15 percent more maintenance can be performed.
• A negotiation process determines how funds will be allocated to achieve a balance among pro-posed programs of projects.
36
Volume I: Research Report
MeasurePerformance
Establish Policyand Plans
ImplementAdopted Work
Program
DevelopFinancialPolicies
A Continuous Cycle
Figure 4. Florida DOT’s Asset Management Feedback Loop

■ 3.8 Setting Performance Targets
Appendix B in Volume II presents examples of performance targets from several agencies. These tar-gets were identified through a compilation of comprehensive annual financial reports (for FY 2002)used for GASB 34 reporting (conducted by the research team as part of NCHRP Project 19-4), andfrom a Cambridge Systematics report for the Vermont Agency of Transportation (9). The tables in theappendix illustrate the variety of measures, numerical scales, and target values used. The interviewswith state agencies nonetheless highlighted a number of factors commonly considered when DOTsdevelop performance measure targets:
• Anticipated funding level through the forecast horizon (Idaho, Michigan, Minnesota, Montana,Ohio, New York, and Washington);
• Public involvement (Michigan and Montana) and customer-based market research (Minnesota);
• Existing condition (Montana), historical performance trend (Minnesota), limited information onperformance compared with other states (Minnesota), and the implications of different proposedcondition levels (Idaho);
• Input from the DOT director, the transportation commission or board, governor’s office, or statelegislature (Michigan with Ohio);
• Policy goals/guidance and statewide priorities such as “preservation first” (Florida, New York,and Iowa);
• Discussion with the construction industry (Michigan);
• Life-cycle costs (if a model is available), marginal value of additional investment (100-percenttargets are not always advisable) and tradeoff considerations (Minnesota); and
• Priorities by route classification (Iowa).
Practices and levels of attainment in setting targets vary considerably among the agencies. Some(e.g., Iowa, South Carolina, and Tennessee) regard the effort as a work-in-progress, while others(e.g., Florida, Michigan, Minnesota, and Ohio) have developed fairly refined methods. The moreadvanced states tend to see target-setting as a multidimensional process, involving financial con-siderations (current and anticipated funding), technical considerations (current and forecast condi-tions or performance), policy considerations (existing priorities, customer and public involvement,executive and legislative input), and economic considerations (life-cycle cost considerations whereapplicable). Agencies have developed several mechanisms to deal with these multiple considera-tions, including the following:
• Multiple Horizons and Stages of Development—Maryland and Minnesota DOTs recognizetargets in a short-, medium-, and long-range context (Maryland: 2, 6, and 20 years; Minnesota:6, 10, and 20 years). Financial constraints tend to be imposed on the short-term targets, withlatitude allowed for long-term targets. In addition to different timeframes, Minnesota DOT
37
Volume I: Research Report

also defines three “categories” of performance measures and treats each one differently intarget setting:
– Mature—baseline data exist, and targets have been set;
– Emerging—data are available, but targets are not yet established; and
– Developmental—neither data nor targets now exist.
Targets are set only after a baseline data trend has been established. Targets also may be adjustedover time, especially for emerging measures and for those measures that are only indirectly orpartially influenced by the DOT (e.g., Mobility). For mature measures, current (baseline) per-formance is shown, as well as trend-based performance projections and policy-based perfor-mance targets. The future performance gap is also highlighted (see Figure 5). Actual levels ofperformance are monitored and compared with targets to ensure that the targets are achievable.
• Value of a Systematic Process—Montana DOT has adopted a formal process for developing tar-gets. Over time, the state legislature has gained confidence in the process and related fundingrequests because it provides consistent, quantifiable performance information that is fiscallyconstrained. The process is well received by the districts because it sets the type of work neededto meet the targets, but provides flexibility in terms of actual project selection.
38
Volume I: Research Report
PerformanceLevel
CurrentPerformanceLevel
1997 2001 6–YearTarget
10–YearTarget
20–YearTarget
Baseline Performance
20–Year Performance Level
Trend-Based Performance Projections
Current Performance Level
Policy-Based Performance Target
Futu
re P
erfo
rman
ce G
ap
Figure 5. Minnesota DOT’s Performance Target Levels

• Communicating Targets—Florida DOT also focuses on short-term targets (referred to as“measurable objectives”) to define realistic, fiscally constrained commitments. Figure 6 illus-trates a mechanism used by Florida DOT to communicate measurable objectives, in this casefor pavements.
• Conflicts when Setting Targets—While some agencies responded that there were “competing”but not “conflicting” targets, others readily acknowledged that conflicts do occur.
– Ohio DOT noted that the use of multiple measures can often lead to conflicting priorities.District deputy directors review certain performance measures every day, and the agency’sstandard management reports allow for comments regarding conflicting performancerequirements. This information is reviewed on a monthly, quarterly, and annual basis, andperformance measure and target adjustments are made accordingly.
– Michigan DOT identified two major conflicts—preservation work versus capacity projectsand increasing the speed of project delivery versus improving project quality.
– The greatest source of conflict at WSDOT is environmental compliance, since WSDOT has atarget of zero violations. Continual reevaluation of policies and procedures is needed. SouthCarolina DOT also noted that in the event of conflicts, environmental compliance and safetytend to win over other considerations.
39
Volume I: Research Report
Percent Pavement Which Meets Department Standards
100
70
20
1997–1998
2000–2001
2003–2004
-
Fiscal Year
1998–1999
2001–2002
2004–2005
1999–2000
2002–2003
2005–2006
1996–1997
60
10
80
40
0
Actual Planned
30
50
90Objective 80%
Figure 6. Florida DOT Measurable ObjectivePavement Condition

41
Volume I: Research Report
4.0 Performance Measures for Asset Management: Criteria and Guidelines
This section discusses how performance measures are used in the context of transportation assetmanagement and presents criteria and guidelines to be used for identifying performance measuresthat are compatible with and supportive of an asset management approach.
■ 4.1 How Performance Measures Support Asset Management
Using Performance Measures Within an Asset Management Framework
The basic framework of asset management decision making in resource allocation and use (see theGuide) was introduced in Figure 1, and for convenience is repeated in Figure 7. The major compo-nents of the framework include the following:
• Establishment of policy goals and objectives. Performance measures should be identified inresponse to goals and objectives, rather than the other way around, and should be a part of pol-icy formulation and its interaction with long-range planning. Performance measures can help informulating policy and setting realistic objectives. The projected outcomes of proposed policiesand an agency’s ability to produce those outcomes given realistic revenue projections, availablestaffing and other resources, and competing investment needs are ideally analyzed prior to pol-icy adoption. A performance-based approach to policy requires thinking through the prioritiesof all policy goals under consideration and making decisions on the most important goals andobjectives to be met. Performance measures also can be a valuable mechanism to inform andinvolve the public in the policy-setting process.
• Planning and programming, in which performance measures are used to structure the com-parison of different investment options at the network and project levels. In addition, criteriaused for project prioritization should be consistent with policy objectives and associated per-formance measures. The use of performance measures rarely makes decisions easier or auto-matic, but it can inform the decision-making process and communicate more effectively the con-sequences of investment choices. Performance measures also can improve the degree to whichagency managers, staff, and the general public understand how a certain decision is reached andcan contribute objectivity to deliberations about investment choices.

• Program delivery, in which performance measures for tracking the actual versus planned mixof projects provide important information to management. In addition, performance measuresrelated to impacts of construction and maintenance work zones on delays and safety are ofinterest to many agencies, and can be used to influence decisions on work scheduling andpackaging.
• System monitoring and performance results are critical components of performance-basedplanning. Monitoring is based on ongoing inspections or observations of the transportation sys-tem to track performance trends and assess the cumulative impacts of investments alreadyundertaken. System operation and management also can be analyzed on a performance basis,using data collected in real time. These data can be gathered by various sensing devices to trackperformance in terms of traffic movement, transit vehicle location, and locations of transient orrecurring congestion. Feedback to the planning and policy-making stages allows for assessmentof performance trends and identification of need for midcourse adjustments or, potentially,updates to policy objectives or the planning process itself.
While communicating and reporting results is an element of system monitoring and perfor-mance results, its importance deserves special emphasis. The several audiences for performance-based information will encompass agency managers with specific responsibilities for deliveringsystem performance, elected officials, and customers and other stakeholders. While the contentand detail of reports to these groups may differ, collectively they document accomplishment,communicate the benefits of the transportation program, establish management accountabilityfor results, and provide a point of departure for discussion of future revisions to policy goalsand objectives, performance targets, or the set of performance measures themselves.
• Quality information is of course critical for supporting a performance measurement effort. Lim-itations in the scope of existing analytic tools and available data often preclude the ideal of pro-ducing performance measures that are in complete alignment with defined goals and objectives,and compromises must be made. Over time, however, data collection and processing techniquesand analytic tools can evolve to yield a more robust and descriptive set of multimodal perfor-mance measures that support the policy framework established by an agency.
42
Volume I: Research Report
Policy Goals and Objectives
Planning and Programming
Program Delivery
Systems Monitoring andPerformance Results
Qu
ality Information
Figure 7. Asset Management as a Resource Allocation and Utilization Process

Importance of Information and Analytic Tools
The role of information and analytic tools is critical to the effective application of performance mea-sures throughout the asset management cycle. Management systems and other analytic tools needto perform calculations and to report results in terms of applicable performance measures. Infor-mation and analytic capabilities that are needed to support infrastructure management and to reportor predict values of performance measures include the following:
• An inventory of existing transportation infrastructure, including the type, number, and locationof assets. Performance measures for inventory and historical changes can be obtained throughqueries of the inventory data file and retention and accessibility of inventories for multiple timeperiods.
• Measures of current condition and service level or performance, updated periodically throughobservation or inspection surveys. Performance measures for condition or performance and his-torical trends can be obtained through periodic inspections and updates of the current data file,queries of the current data file and retention and accessibility of condition and performance datafor multiple time periods.
• Analytic procedures to forecast the change in condition, service, or performance over time.These forecasts or predictions are critical to evaluation of alternatives and to tradeoff analyses.Results need to be reported in terms of costs to achieve an alternative and the impact on theappropriate performance measures.
• Thresholds or guidelines that indicate, for a given current condition or performance level, theappropriate treatment or fix. Some systems base these guidelines on “decision rules” specifiedby the agency and incorporated within the management system or tool. Other systems employmathematical optimization to determine the preferred strategy, based upon economic, engi-neering, and management criteria. Performance measures need to capture the systemwideeffects of these thresholds or guidelines.
• Treatment and cost models to estimate the cost of each treatment or type of work and the levelto which the facility is repaired or its life extended. Performance measures need to capture thelife extension or change in condition or performance due to each treatment.
• Impact models to forecast the implications of the investments determined above and their effecton system performance and transportation users. Performance measures must be directly incor-porated in analytic tools.
Several types of management systems have been successfully used by DOTs for many years. Sys-tems dealing with infrastructure preservation include pavement, bridge, and maintenance man-agement systems. Systems dealing with improvement or mobility include travel demand and sys-tem planning models. While these tools provide useful information at the technical level, theirapplication to broader policy, program, and tradeoff analysis is more limited, and their usefulnessto executive-level decision making has therefore not been as strong as it could be. Problems alsoexist in data availability and quality in dealing with broader issues and tradeoffs. Agencies recog-nize these needs, and research has been ongoing in recent years to develop, for example, modelsthat estimate cost/benefit information for various multimodal improvement strategies, travel
43
Volume I: Research Report

demand management strategies, operational strategies, and multimodal tradeoffs. Work is alsounderway by these agencies to develop new approaches not only to shared or integrated data, butalso to the organizational responsibilities for data stewardship needed to ensure collection, pro-cessing, storage, and retrieval of data needed by multiple users across the agency.
■ 4.2 Criteria and Guidelines for Selecting Performance Measures
Identifying performance measures suitable for asset management (Objective 1 of this study)requires criteria or guidelines that define what attributes or characteristics performance measuresshould have.
An initial statement of criteria for identifying performance measures was developed based on theprinciples of asset management from the Guide. These criteria were reviewed as part of the in-depthinterviews with 15 agencies. This section begins by presenting the initial criteria and the agencyreview comments. Then, it elaborates upon these criteria through an in-depth look at the series ofasset management best practices articulated within the Self Assessment Tool that was included inthe Guide. The result is a set of final criteria and guidelines for use of performance measures withinan asset management context. These guidelines reflect and reinforce the discussion presented abovein Section 4.1.
Criteria for Performance Measure Identification
The following criteria derive from the basic concepts and principles articulated in the Guide.
Policy Driven
Asset management is policy-driven, informed by the long-range planning process and subject torealistic fiscal constraints. Performance measures should:
• Be sensitive and responsive to policy objectives and
• Convey meaningful information about the transportation system.
Strategic Perspective
Asset management encourages a long-term view of performance, cost, and impacts. Performancemeasures should:
• Be able to be forecast,
• Relate to an economic as well as a technical dimension, and
• Reflect a combination of outputs and outcomes.
44
Volume I: Research Report

Consideration of Options and Tradeoffs
Asset management encourages consideration of options and encourages tradeoff analyses amongcompeting solutions and programs. Performance measures should:
• Be sufficiently sensitive to reflect impacts of a broad range of options and potentially modes;
• Help to relate system impacts to factors under the agency’s control and to identify impacts offactors not under the agency’s control;
• Be applicable to scenario testing or “what-if” analyses;
• Provide a clear indication of changes in impacts due to different proposed investments, fundinglevels, and resource allocations;
• Enable a linkage analytically between budget and performance while considering the require-ments of the GASB 34 modified method; and
• Be able to relate project outcomes to the program level.
Decisions Based on Good Information
Asset management is supported by good information. Performance measures should:
• Be a part of an agency’s routine business processes, supported by management system and otheranalytic tools;
• Meet the criteria described above in terms of how they are incorporated within an agency’s man-agement system and analytic tools;
• Be amenable to analytic procedures appropriate to different organizational levels; and
• Have realistic and feasible data requirements, relying on quantitative measurements wherepossible.
Feedback
Asset management entails a feedback mechanism linked to performance measurement. Perfor-mance measures should:
• Provide information enabling managers to understand problems and suggest solutions;
• Be able to be monitored economically on a periodic basis; and
• For performance measures dealing with system operations and management, be able to be mon-itored and provide useful feedback in real time.
45
Volume I: Research Report

Implementation Across Organizational Units and Levels
Asset management should be applied comprehensively within an agency’s functions, as repre-sented in Figure 7. Performance measures should:
• Be developed for technical as well as managerial and executive levels within the organization and
• Be of a mathematical form that permits aggregation or “rolling up” where appropriate.
Comments by Agencies in Interviews
During the interviews, agencies were presented with the performance measure criteria proposedabove. The agencies were asked to indicate the level of importance of each criterion (high, average,or low) and to discuss the implications (benefits, problems, issues, etc.) of implementing measuresthat meet these criteria. Of 15 agencies interviewed, 11 responded to this portion of the survey. Oneof the 11 respondents provided ratings for all criteria except the one addressing a “long-term view”and the one for “feedback mechanisms.” Highlights from this portion of the interviews are pre-sented in Table 5.
The responses overall reflected a high priority across all of the asset management principles. Threeof the six principles enjoyed a particularly strong level of support: policy-driven, need for goodinformation, and feedback. Supporting comments included the following:
• Policies for the transportation system need to reflect statewide policies of the gubernatorialadministration.
• The wealth of good information potentially available must be screened to identify those data ofhighest quality, usefulness, and affordability, without getting bogged down in needless detail.
• Feedback is important and certainly a cost-effective way to bring about change, but it is alsoimpeded by several organizational and human resource issues.
While the other principles (strategic perspective, consideration of options and tradeoffs, and imple-mentation across organizational units and levels) were also ranked highly, several respondentsraised exceptions to them:
• Asset management criteria may not be applicable to all programs, business processes, anddecisions.
• Developing performance measures for some policy objectives, programs, and functions may bedifficult.
• Existing agency culture, organizational makeup, and legacy systems and methods of analysismay impede asset management application.
Other general comments that were offered by those interviewed include the following:
• Considering options and alternatives—Some agencies felt that this criterion did not apply acrossthe board—it is more relevant to work by in-house employees rather than contractors, andimpacts for capacity alternatives are differentiated only over the long term.
46
Volume I: Research Report

Principles of AssetManagement
Number of Responses
Policy-driven Measures are sensitive to andreflective of policy objectives.
Measures convey meaningfulinformation for decision-makers abouttransportation system performance.
It is important to reflect the governor’s visionfor transportation. This vision will drivedetailed positions.
Cross-business-line performance measuresreflecting policy objectives are needed.
Policy-level measures are not always seen asmanageable at the mid-management level.
Criteria forPerformance Measures High Average Low
9 2 – This criterion should be rated “very high.”
(continued on next page)
Additional Feedback
Table 5. Feedback on Performance Measure Criteria

Criteria forPerformance Measures
Principles of AssetManagement
Number of Responses
Additional FeedbackLowAverageHigh
Strategic perspective Performace measures can be forecast.
Information is collected periodically toreflect changes over time.
Measures can be incorporated in a life-cycle cost analysis of options andtradeoffs.
118 Conditions long-term are so uncertain thattargets are not meaningful. The public and itsrepresentative-elected officials have a muchshorter timeframe.
Long-term consequences of current decisionsneed to be conveyed to decision-makers. Thisextended planning horizon supports morestrategic decision-making.
Barriers in this area include a lack of goodmodels for forecasting, lack of technicalcapability among staff, and constraints oflegacy systems. This is a new area not now in the industry’s culture.
This criterion is imporant at the system levelbut not at the corridor and project levels.
Long-term measures are not alwaysunderstandable to a nontechnical legislature.This issue can be addressed by using bothoutputs and outcomes.
Periodic data collection should not be toofrequent.
Long-term measures for maintenance may bedifficult to implement because conditions areconstantly changing.
Table 5. Feedback on Performance Measure Criteria (continued)
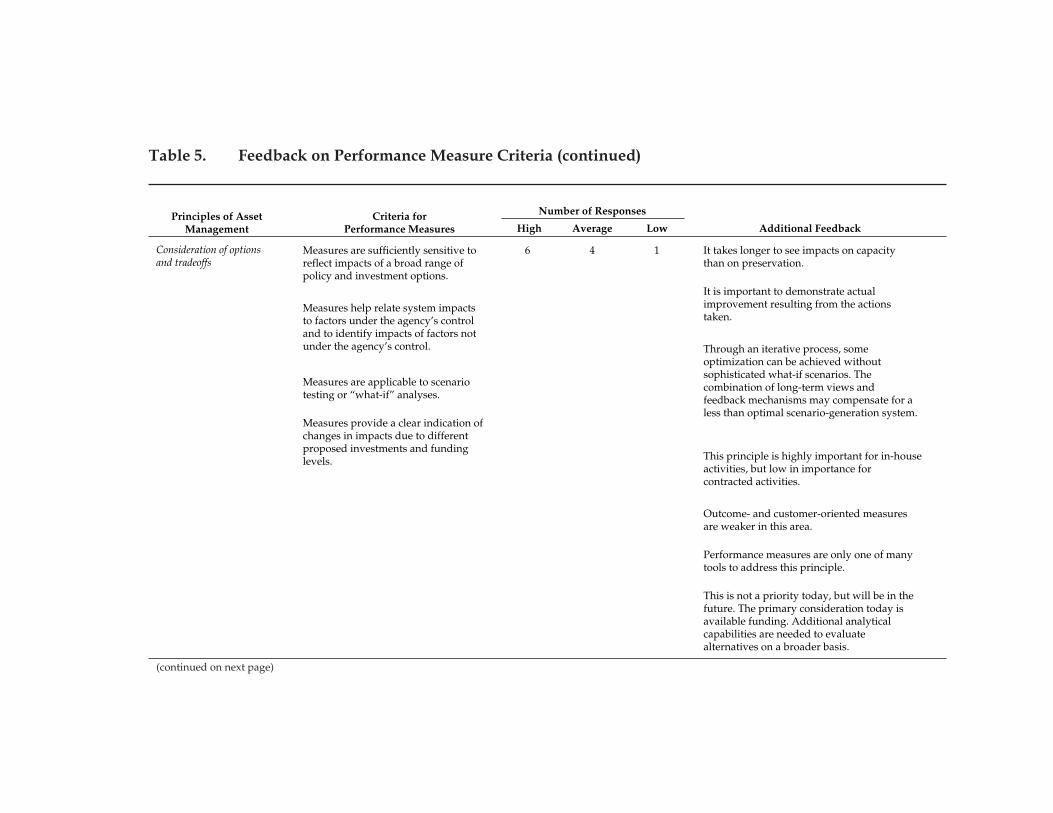
Criteria forPerformance Measures
Principles of AssetManagement
Number of Responses
Additional FeedbackLowAverageHigh
Consideration of optionsand tradeoffs
Measures are sufficiently sensitive toreflect impacts of a broad range of policy and investment options.
Measures help relate system impactsto factors under the agency’s controland to identify impacts of factors notunder the agency’s control.
Measures are applicable to scenariotesting or “what-if” analyses.
Measures provide a clear indication ofchanges in impacts due to different proposed investments and fundinglevels.
It takes longer to see impacts on capacitythan on preservation.
146
It is important to demonstrate actualimprovement resulting from the actionstaken.
Through an iterative process, someoptimization can be achieved withoutsophisticated what-if scenarios. Thecombination of long-term views andfeedback mechanisms may compensate for aless than optimal scenario-generation system.
This principle is highly important for in-houseactivities, but low in importance forcontracted activities.
Outcome- and customer-oriented measuresare weaker in this area.
Performance measures are only one of manytools to address this principle.
This is not a priority today, but will be in the future. The primary consideration today is available funding. Additional analyticalcapabilities are needed to evaluatealternatives on a broader basis.
(continued on next page)
Table 5. Feedback on Performance Measure Criteria (continued)
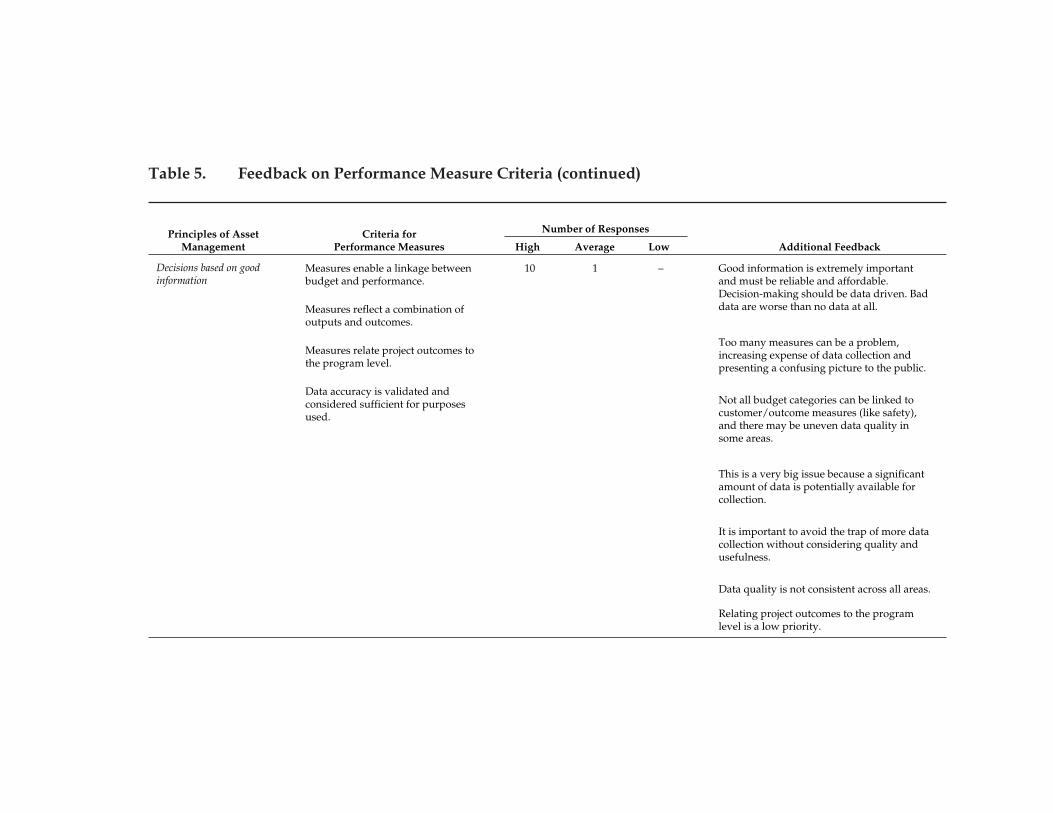
Criteria forPerformance Measures
Principles of AssetManagement
Number of Responses
Additional FeedbackLowAverageHigh
Decisions based on goodinformation
Measures enable a linkage betweenbudget and performance.
Measures reflect a combination ofoutputs and outcomes.
Measures relate project outcomes to the program level.
Data accuracy is validated and considered sufficient for purposesused.
Good information is extremely importantand must be reliable and affordable.Decision-making should be data driven. Baddata are worse than no data at all.
–110
Too many measures can be a problem,increasing expense of data collection andpresenting a confusing picture to the public.
Not all budget categories can be linked tocustomer/outcome measures (like safety),and there may be uneven data quality in some areas.
This is a very big issue because a significantamount of data is potentially available forcollection.
It is important to avoid the trap of more datacollection without considering quality and usefulness.
Data quality is not consistent across all areas.
Relating project outcomes to the programlevel is a low priority.
Table 5. Feedback on Performance Measure Criteria (continued)

Criteria forPerformance Measures
Principles of AssetManagement
Number of Responses
Additional Feedback
Measures assess outcomes withsufficient sensitivity to reflect resultsof system changes.
Measures provide informationenabling managers to understandproblems and suggest solutions.
Measures can be monitoredeconomically on a periodic basis.
Operations measures can bemonitored and provide useful feedback in real time.
Measures are applicable to technical,managerial, and executive levelswithin an organization.
Measures permit aggregation or“rolling up” where appropriate.
LowAverageHigh
–19
137
Feedback mechanisms are important becauseplans are much easier to change than long-term physical assets.
Barriers in this area include insufficient training, lack of aptitude for analyticalthinking, and reporting cycles that are tied to management cycles.
Generating good district feedback and goodanalysis of data can be a challenge.
A large gap in this area is an understandingof how to get the full value out of data.
Information year to year needs to beconsistent. Short-term changes should bemore sensitive than long-term changes.
Monitoring “periodically” is important;monitoring “economically” is not.
An agency’s multimodal nature worksagainst comprehensive application.
Measures need to be realistic. If they are too broad, one can lose sight of actual conditions.
Aggregation and rolling up numerically isnot always seen as the best approach.
Feedback
Implementation acrossorganizational units andlevels
Table 5. Feedback on Performance Measure Criteria (continued)

• Add criteria relating explicitly to public and stakeholder involvement and references to thestatewide long-range plan.
• Add criteria that will result in measures that address (1) financial issues, (2) transit systems, and(3) program delivery.
• Another possible criterion is transportation system efficiency, particularly given rising fuelprices. Example performance measures include gallons of fuel used per capita, VMT per capita,and percent of journey-to-work trips that are drive-alone (single occupancy).
• Performance-based budgeting creates anxiety that funding may be affected and may thereforelead to attempts to “game” the system.
• The process of developing measures, if conducted rigorously, is just as important as reportingresults—it forces an agency to think clearly about its objectives.
• The role and growing importance of operational performance measures needs to be acknowledged.
• The role that fiscal constraints play in setting targets and implementing asset managementshould be reemphasized.
• Measures used by the FHWA and AASHTO and used for GASB 34 reporting should be considered.
• The link between performance monitoring, budgeting, and programming is important. Perfor-mance measures should be able to support decisions related to the actual programming ofimprovements.
• One agency would like to see some type of voluntary consistency among the states, especiallyadjacent states, in targeted conditions, to know what the current state of practice is among neigh-boring agencies.
Many of these observations are addressed below in the development of guidelines for using per-formance measures within an asset management context. They also were considered in develop-ment of the framework presented in Section 5.0 and Volume II.
Guidelines for Using Performance Measures in Transportation Asset Management
Revisiting the Asset Management Self Assessment
An extensively used feature of the Guide is a Self Assessment Tool that helps agencies judge theirprogress in implementing asset management principles and identify opportunities for improvingasset management practice. The Self Assessment Tool presents a series of statements representinggood asset management practice and asks for a rating of how well this matches with current agencypractice. This section revisits this Self Assessment Tool with a focus on understanding the implica-tions of asset management for performance measurement. Over 60 percent of the questions in theSelf Assessment Tool directly relate to performance measures and targets.
52
Volume I: Research Report

The left column of Table 6 shows the core asset management principle(s) as described in Section 2.1of this report. The middle column shows the asset management best practices from the Self Assess-ment Tool. The right column indicates the implications of the best practice(s) for evaluating an exist-ing set of performance measures and selecting new ones.
The result of this analysis is a set of guidelines for identifying and using performance measures ina transportation asset management context. These guidelines were used to develop the frameworkdescribed in Section 5.0 of this report.
Guidelines
1. Performance measures should be selected to cover established goals and objectives.
2. Performance measures should be consistent with the criteria used to make resource allocationdecisions.
3. Predictive models or methods for relating investment levels to future performance should beavailable for each performance measure selected.
4. Performance measures should have appropriate sensitivity to show impacts of decisions aboutresource allocation across program areas, geographic areas, and subnetworks.
5. Performance measures used for initial resource allocation and program development shouldalso be used to assist in determining program adjustments.
6. Performance measures used to guide project selection and resource allocation at the programlevel should include cost-effectiveness and benefit/cost measures, which (where feasible andappropriate) incorporate user costs or benefits.
7. Performance measures used to evaluate investment tradeoffs should reflect life-cycle benefitsand costs, not just immediate impacts.
8. Performance monitoring needs to include tracking of asset condition over time at a sufficientlevel of detail and rigor to support development of performance curves. This is needed to pro-vide the basis for credible prediction tools that analyze investments versus performance.
9. Performance measures should describe not only physical asset condition but also how assetsare serving their intended functions with respect to comfort, convenience, safety, and service.
10. Monitoring of outcome- and output-oriented performance measures needs to be accompa-nied by tracking of actual activity costs in order to provide the basis for credible predictiontools that analyze investments versus performance.
11. Performance measures should be selected with consideration of the cost of data collection andavailable methods for maximizing efficiencies.
12. Performance measures are needed that can serve as the basis for target setting with respect towhat various programs will accomplish. Because actual monitored performance may depend
53
Volume I: Research Report

on factors other than agency actions, the target setting and monitoring processes must accountfor the fact that many performance measures reflect not only results of actions taken by anagency, but external factors as well (e.g., traffic volumes and environmental conditions).
13. Performance measures should be useful for signaling when changes to strategies and priori-ties are warranted—in long-range plan updates and in development of capital, maintenance,and operations program budgets.
14. Performance measures reflecting asset condition and performance should be used consistentlyacross different functional units and at different levels of the organization. This implies thatperformance measures should be amenable to “roll-up” and “drill-down” capabilities to allowthem to be viewed at systemwide, district, corridor, subarea, subnetwork, or location-specificlevels. This roll-up capability may include the need to calculate summary statistics (e.g., “per-cent poor lane-miles”) from more detailed, location-specific condition measurements.
15. To the maximum extent possible, performance measures should be understandable and mean-ingful to political leaders and the general public.
54
Volume I: Research Report

55
Volume I: Research Report
Performance-based
Our agency’s programs are based onrealistic estimates of costs, benefits, andimpacts on system performance.
Our agency uses asset managementdecision-support tools to forecast futuresystem performance given a proposedprogram of projects.
Our agency uses asset management decision support tools to forecast future system performance under different mixes of investment levels by program category.
Projects with significant changes to scope, schedule, or cost are reprioritized to ensure that they are still competitive in cost and performance.
Analysis of options and tradeoffs
Policy guidance encourages resource allocation and project selection based on cost-effectiveness or benefit-cost analysis.
3. Predictive models or methods for relating investment levels to future performance should be available for each performance measure selected.
4. Performance measures should have appropriate sensitivity to show impacts of decisions about resource allocation across program areas, geographic areas, and subnetworks.
5. Performance measures used for initial resource allocation and pro-gram development should also be used to assist in determining pro-gram adjustments.
6. Performance measures used to guide project selection and resource allocation at the program level should include cost-effectiveness and benefit-cost measures, which (where feasible and appropriate) incorporate user costs or benefits.
Our agency estimates the resourcesneeded to accomplish particular objec-tives as part of policy development.
(continued on next page)
Asset Management Principle(s)
Asset Management Best Practice Statement(s)
Implication(s) for Identifying and Using Performance Measures
Policy-driven The agency’s goals and objectives arelinked to specific performance measuresand evaluation criteria for resourceallocation.
Criteria used to set program priorities,select projects, and allocate resources areconsistent with stated policy objectivesand defined performance measures.
1. Performance measures should be selected to cover established goals and objectives.
2. Performance measures should be consistent with the criteria used to make resource allocation decisions.
Table 6. Asset Management Best PracticeImplications for Performance Measurement

56
Volume I: Research Report
Asset Management Principle(s)
Asset Management Best Practice Statement(s)
Implication(s) for Identifying and Using Performance Measures
(continued on next page)
Decisions based on good information
Our agency regularly collects informa-tion on the condition of our assets.
Our agency regularly collects information on the performance of our assets (e.g., serviceability, ride quality, capacity, operations, and safety improvements).
7. Performance measures should describe not only physical asset condition, but also how assets are serving their intended functions with respect to comfort, convenience, safety, and service.
Our agency maintains and uses information on the full unit costs of construction activities.
Information on actual work accom-plishments and costs is used to improve the cost-projection capabilities of our asset management systems.
8. Monitoring of outcome- and output-oriented performance measures needs to be accompanied by tracking of actual activity costs in order to provide the basis for credible prediction tools that analyze investments versus performance.
Our agency continually seeks to improve the efficiency of data collection (e.g., through sampling techniques, use of automated equipment, and other methods appropriate to our transportation system).
9. Performance measures should be selected with consideration of the cost of data collection and available methods for maximizing efficiencies.
Agency managers and staff at different levels can quickly and conveniently obtain information they need about asset characteristics, location, usage, condi-tion, or performance.
10. Performance measures reflecting asset condition and performance should be used consistently across different functional units and at dif-ferent levels of the organization. This implies that performance measures should be amenable to “roll-up” and “drill-down”capabilities to allow them to be viewed at systemwide, district, corridor, subarea, subnetwork, or location-specific levels. This roll-up capability may include the need to calculate summary statistics (e.g., “percent poor lane-miles” frommore detailed, location-specific condition measurements).
Table 6. Asset Management Best Practice (continued)Implications for Performance Measurement

57
Volume I: Research Report
Asset Management Principle(s)
Asset Management Best Practice Statement(s)
Implication(s) for Identifying and Using Performance Measures
(continued on next page)
Monitoring to provide clear accountability and feedback
Our agency regularly communicates to customers and other stakeholders our accomplishments in meeting policy objectives.
Our agency works with political leaders and other stakeholders to present funding options and consequences as part of our budget proposal.
External stakeholders and policy-makers feel that they are sufficiently updated on program delivery status.
performance measures should be understandable and meaningful to political leaders and the general public.
Project selection is based primarily on an objective assessment of relative merits and the ability to meet performance targets.
Our agency monitors actual system per-formance and compares these values to targets projected for its capital preserva-tion, capital improvement, and mainte-nance and operations programs.
12. Performance measures are needed
11. To the maximum extent possible,
that can serve as the basis for target-setting with respect to what various programs will accomplish. The target-setting and monitoring processes must account for the fact that many performance measures reflect not only results of actions taken by an agency, but external factors as well (e.g., traffic volumes and environmental conditions).
Our agency periodically updates its planning and programming methods to keep abreast of current policy guidance, customer expectations, and critical per-formance criteria.
13. Performance measures should be useful for signaling when changes are warranted for strategies and priorities (e.g., in long-range plan updates and in development of capital, maintenance, and operation program budgets).
Table 6. Asset Management Best Practice (continued)Implications for Performance Measurement

58
Volume I: Research Report
Asset Management Principle(s)
Asset Management Best Practice Statement(s)
Implication(s) for Identifying and Using Performance Measures
Monitoring to provide clear accountability and feedback, cont.
Policy guidance considers customer perceptions and expectations.
A maintenance quality assurance study has been implemented to define levels of service for transportation system maintenance.
Our agency regularly collects customer perceptions of asset condition and performance.
We periodically distribute reports of performance measures relevant to customer/stakeholder satisfaction with transportation system and services.
14. Performance measures should reflect how customers perceive the transportation system condition and service.
Our agency has an incentive program for recognizing or rewarding outstanding performance in improving upon sched-ule, quality, and cost objectives.
Our agency uses well-defined program delivery measures to track adherence to project scope, schedule, and budget.
Agency executives and program manag-ers are regularly kept informed of pro-gram delivery status.
15. Performance measures should be used to assess quality, schedule, and budget adherence for program delivery.
Table 6. Asset Management Best Practice (continued)Implications for Performance Measurement

59
Volume I: Research Report
5.0 Performance Measures for Asset Management: Design Considerations
This section discusses key considerations in developing and using performance measures within anasset management context. The in-depth discussion and illustrative examples are intended to serveas resource material for implementation of the framework described in Section 6.0 and Volume II.The following topics are discussed:
• Addressing federal transportation planning regulations;
• Linking resource allocation to policy objectives;
• Aligning performance measures across the organization (and beyond);
• Tailoring measures to decisions—ensuring appropriate sensitivity;
• Analytic constructions of performance measures to understand overall health, critical deficien-cies, and trends;
• Providing solid foundation data;
• Structuring performance tradeoffs;
• Predicting performance and setting targets based on funding;
• Setting long-term performance goals; and
• Obtaining internal and external buy-in.
■ 5.1 Addressing Federal Transportation Planning Regulations
The requirements of Sections 134 and 135 of federal highway legislation are summarized in Side-bar 5.1. These provisions govern long-range planning and capital program development by MPOsand state DOTs, respectively. The provisions of these sections have the following implications forthe definition and use of performance measures:
• The need for performance measures applicable to both long-range planning and transportationimprovement program/state transportation improvement program (TIP/STIP) development;

• The need to address interjurisdictional issues in performance measure definition and relateddata and models used in forecasts;
• The important role of outreach to public and private stakeholders and interest groups to reflectcustomer perspectives in formulating long-range plans and setting performance targets;
• The desirability of mode-neutral measures to evaluate modal alternatives to address trans-portation needs;
60
Volume I: Research Report
Sidebar 5.1: Summary of Provisions of 23 U.S.C. Sections 134 and 135
23 U.S.C. Sections 134 and 135 discuss requirements for metropolitan planning and statewide plan-ning, respectively. Since many provisions of Sections 134 and 135 parallel and reinforce each other,they are discussed together below.
Long-range plans and programs. Both MPOs and state DOTs must develop long-range plans (min-imum 20-year planning horizon) and programs for metropolitan area and statewide transportation,respectively, that address:
• All modes of transportation, including nonmotorized modes;
• Development and integrated management and operation of the transportation system; and
• Coordination among MPOs, state DOTs, and affected public transportation providers.
Scope of planning process. Both MPOs and state DOTs must consider projects and strategies that:
• Support economic vitality through global competitiveness, productivity and efficiency;
• Increase system safety and security;
• Increase accessibility and mobility options for passengers and freight;
• Promote environmental protection, energy conservation, and improved quality of life;
• Enhance system integration and connectivity across modes;
• Promote efficient system management and operation; and
• Emphasize preservation of the existing system.
TIP/STIP development. MPOs and state DOTs will develop metropolitan TIPs and STIPs, respec-tively. These programs must be developed cooperatively between the state and the MPO, with thecooperation of affected transit providers, and with opportunities for comment by public- and private-sector interests and the general public. These programs include a priority list of proposed federallysupported projects and a financial plan citing public and private resources that are reasonablyexpected to be available to fund the projects.
Public outreach. Plans and TIPs/STIPs produced by MPOs and state DOTs should be informed bycomments obtained through public outreach to citizens, public and private providers of transporta-tion to passengers and freight, and other stakeholders.
Transportation management areas and nonattainment areas. Transportation management areas(TMAs) are metropolitan areas with populations exceeding 200,000, or any additional areas request-ing designation as a TMA and approved by the U.S.DOT. TMAs are required to have a continuingand comprehensive planning process, including a congestion management system. Within a TMAthat is also designated as a nonattainment area for ozone or carbon monoxide, federal funds may notbe used for projects that significantly increase carrying capacity in single-occupancy vehicles unlessthe project is part of an approved congestion management system.

• The need to account for transportation system preservation, management, and operation; and
• The awareness of transportation’s broad range of impacts on society, including safety and secu-rity; economic development, productivity, and competitiveness; accessibility and mobilityoptions for passengers and for freight; fuel efficiency; environmental protection; and improvedquality of life.
■ 5.2 Linking Resource Allocation to Policy Objectives
Basing resource allocation decisions on well-defined policy goals and objectives is a central tenet ofgood asset management practice. This principle is illustrated in Figure 2, in which policy objectivesare informed by an agency’s long-range planning process, including the benefit of customer andstakeholder perceptions as expressed through public outreach. Performance measures can be usedto express policy objectives in a very practical way by setting targets for each goal area or categoryof impact at an early stage of system planning, as indicated at the top of Figure 2. In addition to thisdirect link between policy objectives and performance targets, there are several other practical waysin which performance measures assist decision making and reporting (23).
• Agencies can apply performance measures to help guide resource allocation decisions at the pro-gram level in the system planning and programming process. Applications of performance mea-sures in program-level tradeoffs are still in their infancy, however, and only a few agencies haveattempted these types of analyses.
• Agencies can use performance measures at a project or corridor level (e.g., to help screen proj-ects or set project priorities in the development of their transportation improvement program[TIP or statewide STIP]).
• Agencies can implement performance measures in an integrated manner to set policy, allocateresources, and measure and report results, as suggested by the framework in Figure 2. Thesecomprehensive applications of performance measures were the focus of a completed NCHRPstudy of performance-based planning (7) and are consistent with recommendations of the Guide.
• Agencies can institutionalize the linkage between policy and operational decisions throughplanning and programming processes that are based upon the effective use of performance mea-sures throughout. An example is Montana DOT’s Performance Programming Process (P3) (18).
• Performance measures provide the basis for reports on system conditions and performance as acommunication and reporting tool and as a mechanism for feedback to policy formulation, plan-ning, project selection, and resource allocation in subsequent cycles.
These applications of performance measures are not mutually exclusive. Agencies that are interestedin performance-based management can apply these techniques in combination—a strategy thatwould be entirely consistent with good asset management practice. It is also important to objectivesabove regarding selection of measures appropriate to different types of decisions and data collection,since care in selecting measures and periodically updating their values obviously contributes to theirability to reflect underlying goals and objectives.
61
Volume I: Research Report
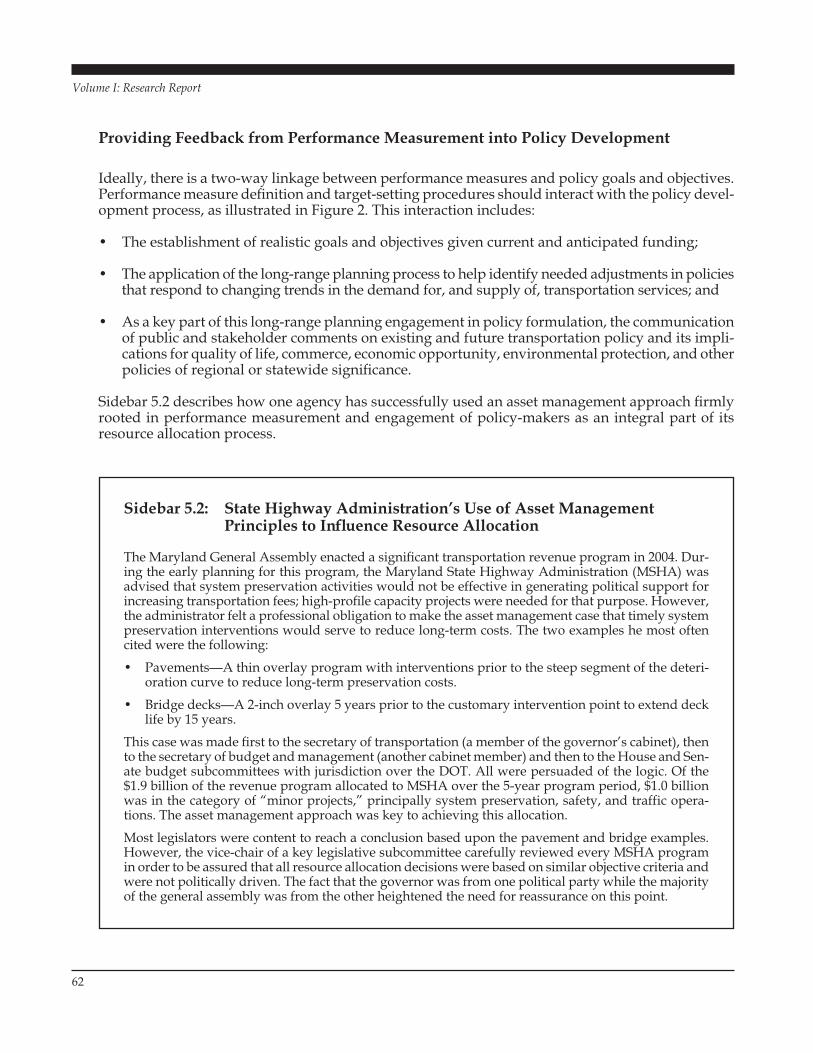
Providing Feedback from Performance Measurement into Policy Development
Ideally, there is a two-way linkage between performance measures and policy goals and objectives.Performance measure definition and target-setting procedures should interact with the policy devel-opment process, as illustrated in Figure 2. This interaction includes:
• The establishment of realistic goals and objectives given current and anticipated funding;
• The application of the long-range planning process to help identify needed adjustments in policiesthat respond to changing trends in the demand for, and supply of, transportation services; and
• As a key part of this long-range planning engagement in policy formulation, the communicationof public and stakeholder comments on existing and future transportation policy and its impli-cations for quality of life, commerce, economic opportunity, environmental protection, and otherpolicies of regional or statewide significance.
Sidebar 5.2 describes how one agency has successfully used an asset management approach firmlyrooted in performance measurement and engagement of policy-makers as an integral part of itsresource allocation process.
62
Volume I: Research Report
Sidebar 5.2: State Highway Administration’s Use of Asset Management Principles to Influence Resource Allocation
The Maryland General Assembly enacted a significant transportation revenue program in 2004. Dur-ing the early planning for this program, the Maryland State Highway Administration (MSHA) wasadvised that system preservation activities would not be effective in generating political support forincreasing transportation fees; high-profile capacity projects were needed for that purpose. However,the administrator felt a professional obligation to make the asset management case that timely systempreservation interventions would serve to reduce long-term costs. The two examples he most oftencited were the following:
• Pavements—A thin overlay program with interventions prior to the steep segment of the deteri-oration curve to reduce long-term preservation costs.
• Bridge decks—A 2-inch overlay 5 years prior to the customary intervention point to extend decklife by 15 years.
This case was made first to the secretary of transportation (a member of the governor’s cabinet), thento the secretary of budget and management (another cabinet member) and then to the House and Sen-ate budget subcommittees with jurisdiction over the DOT. All were persuaded of the logic. Of the$1.9 billion of the revenue program allocated to MSHA over the 5-year program period, $1.0 billionwas in the category of “minor projects,” principally system preservation, safety, and traffic opera-tions. The asset management approach was key to achieving this allocation.
Most legislators were content to reach a conclusion based upon the pavement and bridge examples.However, the vice-chair of a key legislative subcommittee carefully reviewed every MSHA programin order to be assured that all resource allocation decisions were based on similar objective criteria andwere not politically driven. The fact that the governor was from one political party while the majorityof the general assembly was from the other heightened the need for reassurance on this point.

■ 5.3 Aligning Performance Measures Across the Organization (and Beyond)
Performance measures are most effective when there is consistency and alignment in their use—both horizontally (i.e., across functional areas) and vertically (i.e., across executive, line manage-ment, and technical staff levels) within an organization. Alignment does not mean that performancemeasures need to be identical at all levels of the organization, but there should be clear linkagesbetween measures used at different levels.
The concept of groups or “families” of performance measures can be used to address both verticaland horizontal alignment. A “family” can be defined as either:
• Performance measures that are expressed in different ways, but that at their core share the sameproperty of the transportation system (e.g., average pavement condition and the percent of thenetwork in good condition) or
• Performance measures that are similar in their expression, but reflect different related system prop-erties (e.g., the remaining asset value for bridges and the remaining asset value for pavements).
Performance Measure Families for Vertical Alignment
Agencies use different approaches to establish a consistent set of performance measures that areuseful at various organizational levels. One approach is to use measures that can be “rolled up”from field organizations to district and statewide levels. Separate but related sets of “technical” and“corporate” measures such as those defined by the Ministry of Transportation of Ontario (17 ) areanother. A third approach is to use executive-level measures to “take the temperature” of thetransportation system, with technical and midlevel measures providing backup detail. What makesthese approaches work is that each set of performance measures captures some characteristic oftransportation system performance, but can express that characteristic in the different ways neededby executives, midline managers, and technical staff. To illustrate, the performance measures inTable 7 express pavement condition and degree of congestion as they might be used at three orga-nizational levels. While the measures are different in their expression, they are consistent in thatthey are each rooted in the same sources of data and measurements of pavement condition and ofcongestion.
Performance Measure Families for Horizontal Alignment
Horizontal alignment can be promoted through defining families of performance measures thatshare a common form but describe different program areas. For example:
• Percent of pavement mileage rated good;
• Percent of airport pavements rated good;
• Percent of transit track with track geometry rated good.
63
Volume I: Research Report

While each of these measures applies to different modes and assets, they share a common con-struction that is rooted in a preservation type of investment. Similar measures can be defined forother assets by substituting an appropriate measure of condition or performance.
Another example of a family of measures that extends across types of investments and programs is:
• Percent of highway lane-miles rated good in terms of mobility (congestion at Level of Service Eor F occurs, on average, less than 1 hour per day) and
• Percent of intersections rated good in terms of safety (fewer than “x” accidents per year).
These additional members of the “family” can likewise be “rolled up,” as is done in Table 7, to pro-vide measures suitable at different organizational levels, for different functions, and for differentlevels of decisions.
Members of a performance measure “family” also can be qualified to provide greater focus whereneeded. Consider, for example, the related set of preservation measures:
• Percent of pavement mileage rated good,
• Percent of pavement mileage rated good by functional class,
• Percent of trunk line pavement mileage rated good,
64
Volume I: Research Report
OrganizationalLevel
Technical
Midlevel
Executive
Profiles of level of service by hour for specific segments
Ratios of congested travel time to free-flow travel time by hour of day for specific segments
Percent of highways with low, moderate, or high congestion (e.g., based on congested hours times miles)
Rankings of highway segments by congestion index, travel time, or travel time cost
Report card showing improvements in 10 worst congestion bottlenecks
Map illustrating locations of improved, constant, and worsening congestion
Pavement Condition Congestion
roughness, rutting, faulting, etc.
Pavement condition index as a function of above conditions
Poor condition based on pavement condition index
Customer perceptions of pavement condition expressed through surveys
mileage meeting or exceeding pavement performance targets
Map illustrating highway sections with improved, stable, and declining pavement condition
Specific measures of pavement cracking,
Percent of highways in Good, Fair, or
Report card showing percent of highway
Table 7. Examples of Application to Different Organizational Levels
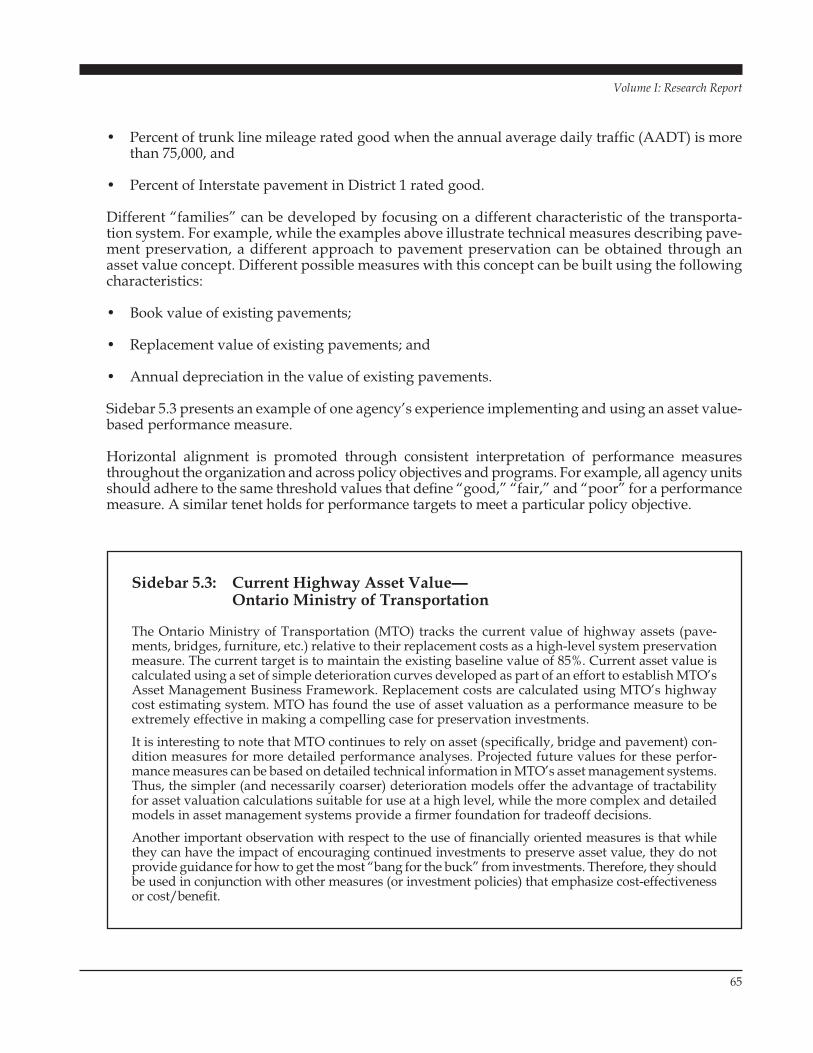
• Percent of trunk line mileage rated good when the annual average daily traffic (AADT) is morethan 75,000, and
• Percent of Interstate pavement in District 1 rated good.
Different “families” can be developed by focusing on a different characteristic of the transporta-tion system. For example, while the examples above illustrate technical measures describing pave-ment preservation, a different approach to pavement preservation can be obtained through an asset value concept. Different possible measures with this concept can be built using the followingcharacteristics:
• Book value of existing pavements;
• Replacement value of existing pavements; and
• Annual depreciation in the value of existing pavements.
Sidebar 5.3 presents an example of one agency’s experience implementing and using an asset value-based performance measure.
Horizontal alignment is promoted through consistent interpretation of performance measuresthroughout the organization and across policy objectives and programs. For example, all agency unitsshould adhere to the same threshold values that define “good,” “fair,” and “poor” for a performancemeasure. A similar tenet holds for performance targets to meet a particular policy objective.
65
Volume I: Research Report
Sidebar 5.3: Current Highway Asset Value—Ontario Ministry of Transportation
The Ontario Ministry of Transportation (MTO) tracks the current value of highway assets (pave-ments, bridges, furniture, etc.) relative to their replacement costs as a high-level system preservationmeasure. The current target is to maintain the existing baseline value of 85%. Current asset value iscalculated using a set of simple deterioration curves developed as part of an effort to establish MTO’sAsset Management Business Framework. Replacement costs are calculated using MTO’s highwaycost estimating system. MTO has found the use of asset valuation as a performance measure to beextremely effective in making a compelling case for preservation investments.
It is interesting to note that MTO continues to rely on asset (specifically, bridge and pavement) con-dition measures for more detailed performance analyses. Projected future values for these perfor-mance measures can be based on detailed technical information in MTO’s asset management systems.Thus, the simpler (and necessarily coarser) deterioration models offer the advantage of tractabilityfor asset valuation calculations suitable for use at a high level, while the more complex and detailedmodels in asset management systems provide a firmer foundation for tradeoff decisions.
Another important observation with respect to the use of financially oriented measures is that whilethey can have the impact of encouraging continued investments to preserve asset value, they do notprovide guidance for how to get the most “bang for the buck” from investments. Therefore, they shouldbe used in conjunction with other measures (or investment policies) that emphasize cost-effectivenessor cost/benefit.
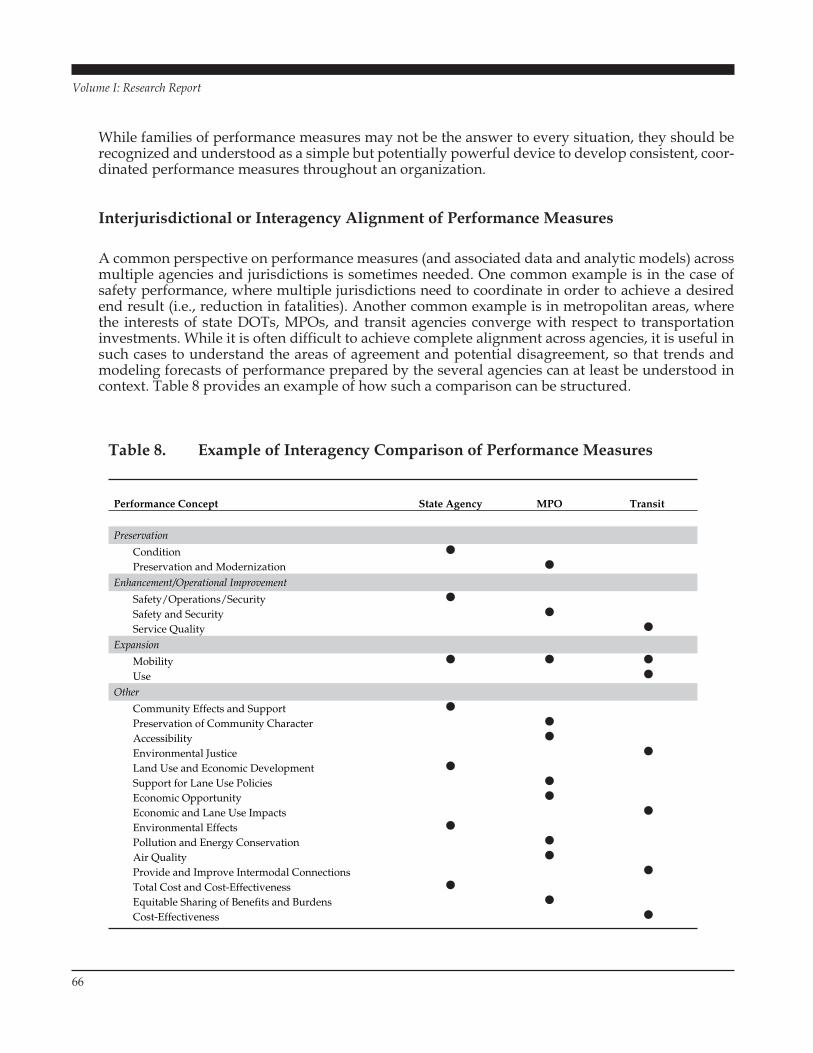
While families of performance measures may not be the answer to every situation, they should berecognized and understood as a simple but potentially powerful device to develop consistent, coor-dinated performance measures throughout an organization.
Interjurisdictional or Interagency Alignment of Performance Measures
A common perspective on performance measures (and associated data and analytic models) acrossmultiple agencies and jurisdictions is sometimes needed. One common example is in the case ofsafety performance, where multiple jurisdictions need to coordinate in order to achieve a desiredend result (i.e., reduction in fatalities). Another common example is in metropolitan areas, wherethe interests of state DOTs, MPOs, and transit agencies converge with respect to transportationinvestments. While it is often difficult to achieve complete alignment across agencies, it is useful insuch cases to understand the areas of agreement and potential disagreement, so that trends andmodeling forecasts of performance prepared by the several agencies can at least be understood incontext. Table 8 provides an example of how such a comparison can be structured.
66
Volume I: Research Report
Performance Concept
Preservation
ConditionPreservation and Modernization
Enhancement/Operational Improvement
Safety/Operations/SecuritySafety and Security Service Quality
Expansion
Mobility Use
Other
Community Effects and Support Preservation of Community Character Accessibility Environmental Justice Land Use and Economic Development Support for Lane Use Policies Economic Opportunity Economic and Lane Use Impacts Environmental Effects Pollution and Energy Conservation Air Quality Provide and Improve Intermodal Connections Total Cost and Cost-Effectiveness Equitable Sharing of Benefits and Burdens Cost-Effectiveness
State Agency MPO Transit
Table 8. Example of Interagency Comparison of Performance Measures

■ 5.4 Tailoring Measures to Decisions—Ensuring Appropriate Sensitivity
Performance measures need to support decisions at different levels and in different timeframes.Desirable characteristics of performance measures in these situations are illustrated in Table 9.
Appropriate Sensitivity
At each stage of decision making, performance measures must be sensitive enough to show thechange in performance that will result from different types and levels of investment. As noted at therecent TRB workshop on performance measurement, “One obvious rule of thumb is that the mea-sure should be just specific enough that a change in decision causes a response in the measure (i.e.,‘moves the needle’)” (23 p. 26). Practical implications are the following:
• Use care in defining sets of performance measures, since substantial improvements in perfor-mance at a project or corridor level may have negligible impact at a network level. Usefulapproaches to avoid this problem include:
– Selecting measures that are inherently more sensitive to changes in networkwide distribu-tions of condition or performance (e.g., using “percent good” and “percent poor” rather than[or in addition to] “average” measures).
– Focusing on specific portions of a network that are susceptible to change. For example, whengauging the impacts of intersection improvements for mobility and operational efficiency,use a measure like “time savings at intersections” rather than more general measures like“overall reduction in total network travel time.”
– Defining performance measures that are more sensitive and meaningful at a network level. Forexample, “percent reduction in intersection delays” likely gives a clearer indication of poten-tial impacts than would “minutes of travel time saved due to intersection improvements.”
• The type of measure used also can affect its sensitivity and, therefore, its suitability for differenttimeframes and levels of decisions. For example:
– Some agencies use generalized measures of system health that capture several aspects of per-formance (e.g., pavement condition and mobility as reflected in rankings produced by theHighway Performance Monitoring System [HPMS]). While such measures are useful inlong-term projections or to characterize networks, more detailed and focused measures areneeded at corridor and project levels and for short-term decisions (e.g., specific pavementcondition and performance measures used in the HPMS, explicit traffic demand and roadsupply characteristics for congestion analyses, and location-specific safety performance).
– In system preservation, asset value can be used as a stable, aggregate measure of network sys-tem condition over the long term. For more detailed decisions at a project and corridor level,or for more technical analyses of network-level situations (e.g., evaluating the potentialimpacts of changes in vehicle sizes and weights), technical condition and performancemeasures—or measures derived from technical observations, such as percent good and per-cent poor—are preferred. They provide a stronger basis for understanding the relative effectsof traffic use, weather, soil conditions, and maintenance; for diagnosing needs and solutions;and for translating network-level targets to specific needs at the corridor and project levels.
67
Volume I: Research Report

68
Volume I: Research Report
Level of Decision
Network Performance measures typically represent rollups of project or corridor measures to show:
• Network-level summaries of performance;
• Evaluation of program accomplishments versus targets, with identification of needed policy adjustments; and
• Tradeoff analyses of program options (e.g., mobility versus preservation, or preventive maintenance versus worst-first strategies).
“Networks” can be interpreted as particular subnetworks (e.g., to report recent congestion trends and near-term forecasts for roads in a metropolitan area).
Issues such as geographic equity should be addressed explicitly.
Measures reflect long-term objectives and strategic directions set by political leadership and senior agency management.
Performance measures typically represent (1) long-term (e.g., 20-year) needs at the system or modal level and (2) impacts of investments as estimated in long-range planning forecasts and predictions of management systems.
Where life-cycle cost analyses can be applied, measures reflect (1) projections of benefits and costs of alternative investments and (2) broad-based tradeoffs among modal, system, loca-tion, and program options.
Requirements of 23 U.S.C. Section 134-135 should be satisfied in statewide and metro-politan planning that are reflected at this level.
Corridor Measures reflect forecasts of needs and cost and performance impacts of investments for 3-6 years in the future.
Data to support measures should describe existing conditions (e.g., asset condition, traffic volume, travel time-speed-congestion profiles, and reliability or variability of travel time along the length of corridor) to assess connectivity and consistency of corridor level of development by mode.
Performance measures should assist in planning the implementation of corridor projects, including the “packaging” of pro-jects, project and work zone length, coordina-tion of detours and alternate routes and modes of travel, and impacts of these options. Performance measures ideally can be “rolled up” from the project level and rolled up to the system or network level.
Measures need to reflect proposed corridor improvements on broader systemwide per-formance. Measures (1) reflect long-term (20-year) needs and investment impacts by mode and (2) meet agency goals and objectives consistent with 23 U.S.C. Sections 134 and 135.
Measures of long-term performance should be mode-neutral where possible. Measures must be specific enough to distinguish between the effect of investment in one mode or another, or between different types of investments (e.g., operational improvements versus capacity expansion).
Management systems can help in (1) developing forecasts of needs and impacts of investments and (2) “rolling up” results from the project level. Data on performance may not be available at every location in the corridor and may require extrapolation, estimation, or special surveys.
Short Term Long Term
Table 9. Different Types and Levels of Decisions
(continued on next page)

• Mobility performance offers many examples of different types of measures suitable to differentdecisions:
– Measures useful at a network level or for long-term decisions: percent of VMT in congestedconditions, congested lane-miles of road, person-miles-traveled (PMT) under congested con-ditions, and centerline-miles of urban roads that are congested. Note that many of these mea-sures presuppose a definition of “congested” in a long-term, network context.
– Measures useful at a corridor or project level or for short-term decisions: commercial trucktravel time between major economic gateways, percent of directional urban freeway milesin a particular region or metropolitan area that are moderately congested (0–2 hours withspeeds below 45 mph), variation in average speed at a selected location, highway LOS, andnumber of hours in which a road segment (or intersection) operates at LOS E or F.
• Similar (and often related) issues apply to the geographic coverage of performance measures.While networkwide measures are appropriate for long-range planning and broad-based evalua-tion of policy objectives, more focused measures are needed at a regional or district level for proj-ect programming and budgeting, and detailed measures are needed at corridor and project levels.
Dealing with Attribution Issues
“Attribution” refers to the extent to which transportation system performance can be attributed tothe actions of the transportation agency as opposed to external trends that are beyond an agency’scontrol. When external factors affect transportation system performance, the issue is how to inter-pret performance targets and trends that may deviate from the original assumptions about these
69
Volume I: Research Report
Level of Decision Short Term Long Term
Project Technical data are generally available, supplemented by site surveys as needed, to quantify performance measures. Project pri-oritization criteria should be consistent with these performance measures. Management systems are useful to organize current data, forecast needs, evaluate project options, and identify preferred solutions.
Performance measures also can be used to assist detailed project planning (e.g., length and configuration of work zone, impacts of detour and construction supply routes, and time-of-day scheduling options). Timeframe for estimates ranges typically from 1 year or less to 3 years for capital and maintenance programs.
Measures reflect forecasts of condition, cost, and performance suitable for program and budget development. Timeframe of forecasts is typically 3-6 years, but may be as long as 10 years.
Major projects (typically in mobility, or those with significant environmental or social impacts) will require long lead-times (5-20 years), performance measures in key impact areas (e.g., environmental protection and neighborhood and population impacts), and transportation performance impacts.
Table 9. Different Types and Levels of Decisions (continued)

factors. Examples are given below for congestion and safety performance, but attribution issues canarise in many other situations of performance measurement:
• Congestion can be mitigated by investments in operational efficiency and capacity expansion.The impact of these investments may be offset, however, by greater-than-estimated growth inpopulation and vehicle registration, demographic shifts, and increased economic activity. Theseadditional factors complicate the interpretation of congestion trends as well as assessments ofthe value of program investments to reduce congestion.
• Safety investments in transportation infrastructure and operations are often targeted to reduceaccident rate and severity. Crashes are also dependent, however, on traffic volume and compo-sition, growth in travel demand, weather conditions, and changes over time in vehicle size andweight and in driver behavior that affect safety performance. These additional factors compli-cate the interpretation of safety performance data and assessments of the value of safety-relatedinvestments in roadways, roadsides, interchanges, and intersections.
The attribution issue is essentially seen as a matter of an agency “not having control over outcomes.”The counterargument has been posed, however, that attribution is less a matter of measurement abil-ity than one of accountability. In this view, managers have a responsibility to citizens to account forhow they have spent public funds and to use the best measurement methods they can for the resourcesavailable, even if these methods are imprecise (37). At a pragmatic level, there are methods that anagency can undertake to reduce the uncertainty caused by the attribution issue, as described below.
One approach to distinguishing agency influence on outcomes—particularly for safety and operationsimprovements—is to use well-designed before-and-after studies as a supplement to monitoring per-formance trends. One of the major findings of a 2004 FHWA/AASHTO/NCHRP international scanon performance measurement (34) was the widespread use of before-and-after evaluation studies todetermine the effectiveness of implemented actions. While the scan team observed that this practiceis far more prevalent outside of the United States, some state DOTs have institutionalized the practiceof before-and-after studies as an integral part of their performance measurement efforts. For example,Colorado DOT tracks standard crash and fatality rates, but supplements this information by con-ducting analyses of its safety improvement projects. These analyses provide an understanding of thereductions in fatalities and injuries that can be attributed to implementation of these projects. Whilethese studies may be costly to conduct, they provide extremely valuable information for understand-ing what types of investments are most cost-effective.
Another approach to distinguishing agency impacts—particularly for operational investments—isto use traffic simulation tools that predict measures such as traveler delay, air quality and energyimpacts. These tools can be used in combination with measured before-and-after implementationcharacteristics to derive reasonable estimates of the performance impacts of agency actions.
Finally, a well-designed performance measurement program will include monitoring of trends in rel-evant data that help explain and interpret system performance measures. Examples of importanttrend data include population, vehicle registrations, economic activity, vehicle occupancy, modalshares, zones of disadvantaged populations, and land use characteristics. Agency long-range plansas well as those produced by MPOs and transit operators are potential sources of information. Thesedata can help the agency to recognize and understand shifts in economic and social trends, driverbehavior, vehicle characteristics, and other external factors that affect travel demand and trans-portation system performance. They also can guide the agency in setting realistic future performancetargets that account for these external shifts and, if necessary, to recommend changes in policy objec-tives that respond to significant changes in external forces. These additional data can sometimes serve
70
Volume I: Research Report

71
Volume I: Research Report
as performance measures themselves (e.g., tracking average vehicle occupancy can provide a mea-sure of the operational efficiency of a highway facility in moving people as well as vehicles).
By monitoring multiple streams of data, an agency can view transportation system performancefrom a number of perspectives. This cross-checking ability is useful even where attribution is notthe main issue (e.g., in analyzing the relative contributions of increased economic activity and oper-ational inefficiency on congestion). At a local level, this analysis helps to identify the most effectivesolutions to congestion choke points; more broadly, it informs future policy to provide improvedmobility in the system.
Analytic Processing and Supporting Data
Measures used for different types or levels of decisions may require different types of data, some ofwhich are more readily available than others. For example, agencies may have ready access to sup-port mobility measures at a project or corridor level (e.g., 24-hour traffic volumes or transit board-ings), but fewer data to support systemwide measures for transportation system planning (23 p. 26).Sidebar 5.4 provides an example of how available analytic tools and data can be used to analyzeoptions for improving corridor mobility.
Sidebar 5.4: Example Analysis of Options for Improving Corridor Mobility
Background
A four-lane arterial street with a two-way, left-turn lane lies in a high-growth area of the city. Devel-opment is occurring throughout the corridor, and traffic volumes are expected to grow at approxi-mately 3 percent annually. Information regarding the signal timing and vehicle volumes is availablefor each signalized intersection along the 5-mile corridor. Signal spacing is at 1-mile intervals. Thecorridor has a light rail line running parallel to the street.
Options to Improve Mobility
• Signal improvements—more green time for the major street• Signal improvements—installation of a raised median, which restricts left-turning traffic• Additional turn lanes• Transit priority• Additional through lanes• Access management
Required Data for Analyzing Performance Impacts (Using Highway Capacity Manual software)
Urban street classification IICapacity: 1,800 (7:00–8:00 a.m. peak hour)Major street volume: 7,200 (average)Major street green time: 60 sec
(continued on next page)

72
Volume I: Research Report
Sidebar 5.4: Example Analysis of Options for Improving Corridor Mobility (continued)
Signal cycle length: 90 secMajor street free-flow speed: 35 mphMinor street free-flow speed: 30 mphAverage vehicle occupancy: 1.25Light rail trains: 10 in the peak hourLight rail free-flow speed: 25 mphLight rail average occupancy: 125 persons per trainLight rail intersection clearance time: 15 secCorridor length: 5 milesMinor street volume: 3,000 (average)Minor street green time: 30 secMajor street average speed: 20 mphMinor street average speed: 20 mphLight rail average speed: 15 mph
Example Performance Comparison
Signal Turn Performance Measure Base Case Improvements RestrictionsV/C Ratio 1.00 1.00 1.00Travel time 15 (auto) 15 (auto) 14 (auto)(minutes) 20 (rail) 20 (rail) 19 (rail)Travel rate 3.0 (auto) 3.0 (auto) 2.9 (auto)(minutes per mile) 4.0 (rail) 4.0 (rail) 3.8 (rail)Total annual delay 241 (auto) 236 (auto) 216 (auto)(thousands of person-hours) 42 (rail) 41 (rail) 37 (rail)
283 (corridor) 277 (corridor) 253 (corridor)Travel time index* 1.75 (auto) 1.74 (auto) 1.67 (auto)
1.67 (rail) 1.65 (rail) 1.60 (rail)1.74 (corridor) 1.73 (corridor) 1.66 (corridor)
Buffer index** 85% (corridor) 85% (corridor) 83% (corridor)
*Travel time index is the average peak travel time to off-peak (free-flow) travel time.**Buffer index is the extra percent of time a traveler needs to allow in order to be on time 95% of the time.
SummaryThis analysis provides an illustration of the use of performance measures for screening-level analy-sis of alternative multimodal corridor mobility improvements. Key elements include use of multipleperformance measures that capture different aspects of mobility, calculations for each mode and forthe corridor as a whole, and comparison of alternatives relative to a base case reflecting a consistentset of growth assumptions for a future year.
The analysis shows that of the two alternatives considered, turn restrictions will have a greater ben-eficial impact on performance of the corridor—both for rail and auto users. However, neither optionwill result in dramatic changes in the average travel time, the average travel rate, the delay experi-enced by travelers, the corridor’s peaking characteristics, or travel time reliability.

73
Volume I: Research Report
Analytic methods are widely available for specific modes and types of investments (e.g., preserva-tion, traffic demand forecasting, and sketch planning for proposed installation of ITS equipment),but are more limited in other areas such as prediction of safety impacts. The precision of these mod-els may limit their use to particular decision-making levels or timeframes.
The capabilities of modern management systems to do scenario testing enables them to supportdecision making at several levels (e.g., in identifying preferred solutions at the project level, inaggregating project costs and impacts and identifying “project windows” for scheduling coordina-tion at the corridor level, and in refining project selection at the network level to account for budgetconstraints). Many modern pavement and bridge management systems have these capabilities.
■ 5.5 Analytic Constructions of Performance Measures to Understand Overall Health, Critical Deficiencies, and Trends
Performance measures can be valuable for demonstrating overall transportation system conditionor “health,” identifying or highlighting critical deficiencies, and understanding trends. A series ofexamples will illustrate how, by defining and displaying measures in different ways, one can obtaininsights to system performance either at an overall level or at a more detailed level to reveal criticaldeficiencies.
Type of Measure and Threshold Value
One way to distinguish between overall health and critical deficiencies is through the type of per-formance measures used and the establishment of critical threshold values.
For individual facilities, overall health can be gauged through indexes based on a set of conditions(e.g., a present serviceability index or a pavement condition index for pavement condition or abridge health index for bridge condition). Critical deficiencies can be identified by establishing athreshold for these indexes, the value of which experience shows is serious enough to threaten thestructural integrity of the facility, dramatically increase user costs, or result in many customer com-plaints. Another approach is to focus on particular conditions that are critical to facility performanceand to define detailed measures and thresholds (e.g., for cracking, rutting, or roughness of pave-ments or for condition states of bridge superstructure and substructure elements). Analogous exam-ples can be defined for mobility in terms of travel time or congestion and for other measures wheredata and experience are available.
Similar approaches can be used at a system level. Some agencies use, for example, rankings gen-erated by the Highway Performance Monitoring System (HPMS) to gauge the relative health oflinks within their highway systems. Measures based on asset value can also be applied as a mea-sure of overall health at a network level. Critical locations can be identified by imposing thresh-old values on these ratings or by considering more detailed measures of pavement condition andcongestion.

74
Volume I: Research Report
Analytic Construction of Measure
The analytic construction of a measure is a second way of varying its view of a transportation sys-tem. Several types of constructions are commonly used in transportation. One set is listed below;additional examples will be given in the following section.
• A number or value—for example, total VMT, total travel time, average travel speed, total num-ber of injury-only crashes, pavement serviceability index, and area of bridge deck cracking.
• A rate—for example, crashes per 100 million VMT, incidents per million passenger-miles trav-eled (PMT), and operating cost (or revenue) per million seat-miles.
• A ratio—for example, fatal to nonfatal accidents, bus ridership to rail ridership, travel time incongested conditions to travel time in free-flow conditions.
Consider the example data in Table 10, showing daily passenger trips for auto and transit modes.
Daily Passenger Trips by Mode, Thousands Regional Data in Thousands
Year Auto Bus Transit Rail Transit Total Transit Auto Plus Transit Population Registered Autos
(1)
1
2
3
4
5
6
7
8
9
10
11
12
13
14
15
16
17
18
19
20
(2) (3) (4) (5) = (3) = (4) (6) = (2) = (5) (7) (8)
1,225.0 45.0 30.0 75.0 1300.0 500.0 131.6
1,234.2 45.2 30.6 75.8 1310.0 502.5 132.5
1,243.4 44.9 31.2 76.1 1319.6 505.0 133.4
1,252.8 45.1 31.8 77.0 1329.7 507.5 134.4
1,262.2 44.8 32.5 77.3 1339.5 510.1 135.3
1,271.6 45.0 33.1 78.2 1349.8 512.6 136.2
1,281.2 44.7 33.8 78.5 1359.7 515.2 137.2
1,290.8 44.9 34.5 79.4 1370.2 517.8 138.2
1,300.5 44.6 35.1 79.8 1380.2 520.4 139.1
1,310.2 44.9 35.9 80.7 1390.9 523.0 140.1
1,320.0 44.5 36.6 81.1 1401.2 525.6 141.1
1,329.9 44.8 37.3 82.1 1412.0 528.2 142.1
1,339.9 44.5 38.0 82.5 1422.4 530.8 143.1
1,350.0 44.7 38.8 83.5 1433.4 533.5 144.1
1,360.1 44.4 39.6 83.9 1444.0 536.2 145.1
1,370.3 44.6 40.4 85.0 1455.2 538.8 146.1
1,380.6 44.3 41.2 85.5 1466.0 541.5 147.1
1,390.9 44.5 42.0 86.5 1477.4 544.2 148.1
1,401.4 44.2 42.8 87.0 1488.4 547.0 149.2
1,411.9 43.9 43.7 87.6 1499.4 549.7 150.2
Table 10. Data for Examples of Performance Measure Construction
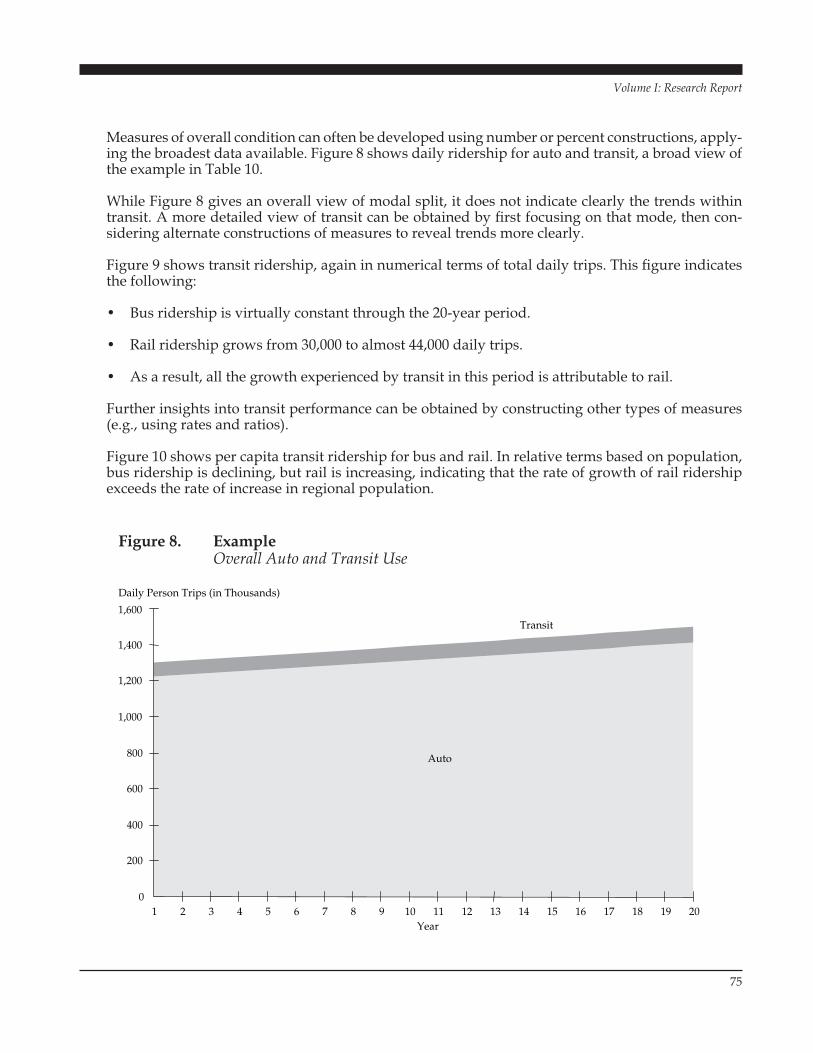
75
Volume I: Research Report
Measures of overall condition can often be developed using number or percent constructions, apply-ing the broadest data available. Figure 8 shows daily ridership for auto and transit, a broad view ofthe example in Table 10.
While Figure 8 gives an overall view of modal split, it does not indicate clearly the trends withintransit. A more detailed view of transit can be obtained by first focusing on that mode, then con-sidering alternate constructions of measures to reveal trends more clearly.
Figure 9 shows transit ridership, again in numerical terms of total daily trips. This figure indicatesthe following:
• Bus ridership is virtually constant through the 20-year period.
• Rail ridership grows from 30,000 to almost 44,000 daily trips.
• As a result, all the growth experienced by transit in this period is attributable to rail.
Further insights into transit performance can be obtained by constructing other types of measures(e.g., using rates and ratios).
Figure 10 shows per capita transit ridership for bus and rail. In relative terms based on population,bus ridership is declining, but rail is increasing, indicating that the rate of growth of rail ridershipexceeds the rate of increase in regional population.
0
200
400
600
800
1,000
1,200
1,400
1,600
Daily Person Trips (in Thousands)
1 3 5 7 9 10 11 12 13 14 15 16 17 18 19 20Year
Auto
Transit
2 4 6 8
Figure 8. ExampleOverall Auto and Transit Use

76
Volume I: Research Report
0
10
20
30
40
50
60
70
80
90
100
1 3 5 7 9 10 11 12 13 14 15 16 17 18 19 20Year
Daily Person Trips (in Thousands)
Bus Transit
Rail Transit
2 4 6 8
Daily Person Trips/Population
.00
.01
.02
.03
.04
.05
.06
.07
.08
.09
.10
1 3 5 7 9 10 11 12 13 14 15 16 17 18 19 20Year
Rail Transit
Bus Transit
2 4 6 8
Figure 9. ExampleBus versus Rail Transit Ridership
Figure 10. ExamplePer Capita Ridership of Bus and Rail Transit

Figure 11 illustrates the ratio of rail ridership to bus ridership. Whereas rail usage at the beginningof the period was barely two-thirds that of bus, at the end of the period rail usage matches bus usage,and if the trend continues, it will exceed bus usage (i.e., the ratio percent will exceed 100 percent).
No one construction of a performance measure is superior to another; rather, each provides partic-ular insights that, when viewed in combination, develop a better picture of what is happening thanany of the measures viewed singly. Construction of measures therefore can be used to develop bothoverall views of performance and more detailed analyses of particular conditions. These examplesalso illustrate the power of displaying trends. Care must be taken, however, to select the trend thatbest illustrates what is intended to be communicated.
Further Examples of Analytic Constructions
Additional ways to distinguish between general condition or health and more detailed views ofcondition and critical deficiencies are to focus on the mathematical function used within perfor-mance measures. Consider the example of a set of assets that is subject to deterioration, as shownin Figure 12. The relative condition of each asset is measured by an index on a scale of 0 to 100;assume that the practical range of this measure extends from 95 to 25.
Assume a network of these assets having a distribution of initial conditions from 95 to 25 (i.e., someare in virtually new condition, and some are failing). Assume further that these assets are allowedto deteriorate with no further preservation or maintenance (to provide a rapidly changing trend for
77
Volume I: Research Report
0%
20%
40%
60%
80%
100%
120%
1 3 7 9 10 11 12 13 14 15 16 17 18 19 20Year
Rail Ridership as a Percent of Bus Ridership
2 4 5 6 8
Figure 11. ExampleRatio of Rail to Bus Transit Ridership

this example). How might this decline in network condition be displayed using different perfor-mance measures? Figures 13 and 14 illustrate various measures based on different mathematicalfunctions. In order of declining generality and increasing detail, the mathematical functions includethe following:
• The average network condition in Figure 13 provides the most general measure of health. While itincludes all assets, its trend line is gradual and does not show dramatic changes. Averages are com-monly used as a general measure of condition for high-level reporting or for long-range forecasts.
• The 10-Percent-Limit-At-Upper-End curve in Figure 13 illustrates the trend of the right “tail” ofthe distribution, tracking the lower limit of the top 10 percent of the asset population (i.e., thosein the best condition). This measure is more focused than the average. It signals critical points insystem condition specifically, the rapid downturn in system condition beginning about year 10—but its scope is limited to a subset of the population. (A corresponding measure could be definedfor the 10 percent of assets in poorest condition, but it would not be an interesting trend in thisexample—it would begin at a value of 25 and remain constant throughout the analysis period.)
• If an agency defines thresholds of good-fair-poor values of condition, the percent of assets withineach of these management categories can be tracked, as shown in Figure 14. Viewed in combi-nation, these measures give a good idea of the overall distribution of conditions, and changes inthe values or slopes of these curves provide useful signals of changing trends and impendingcritical conditions. This type of measure is widely used, since it conveys a meaning that is use-ful to, and understood by, management and often nontechnical audiences as well.
78
Volume I: Research Report
10
20
30
40
50
60
70
80
90
100
00 2 4 6 9 10 11 12 13 14 15 16 17 18 19 20 21 22 23 24 25
Year
Condition
1 3 5 7 8
Figure 12. ExampleDeterioration Curve for an Asset
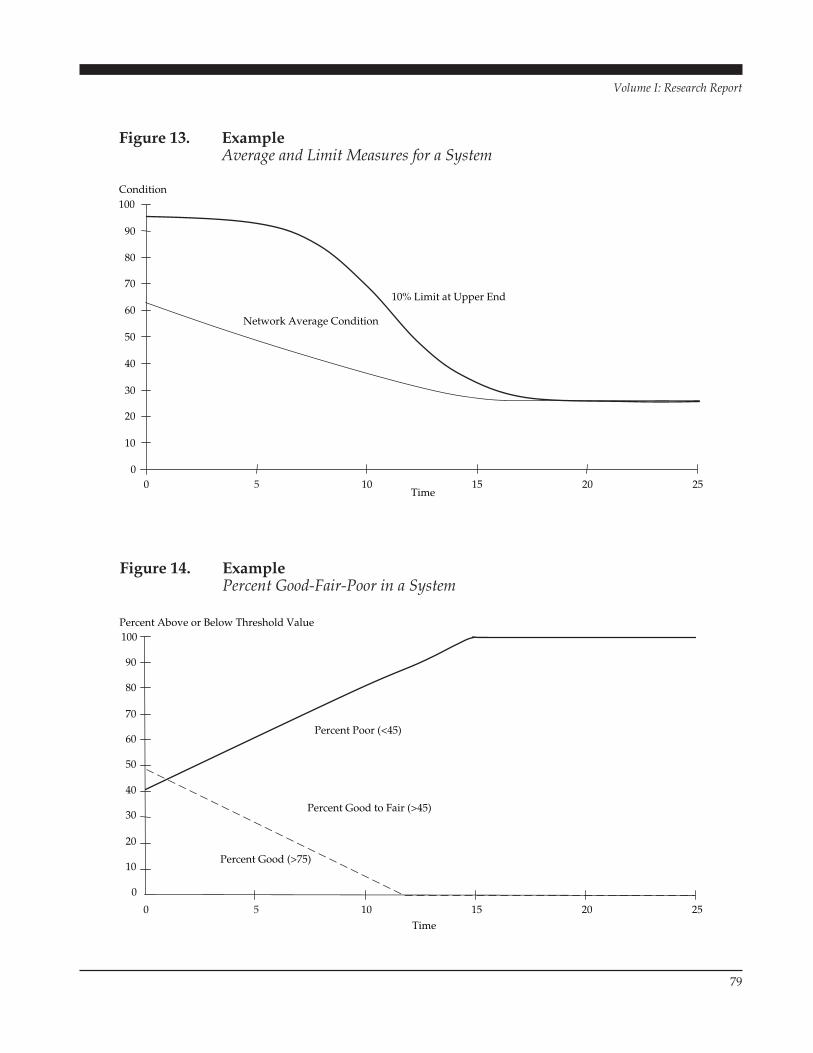
79
Volume I: Research Report
0
10
20
30
40
50
60
70
80
90
100
0 10 15 20 25Time
Condition
10% Limit at Upper End
Network Average Condition
5
0
10
20
30
40
50
60
70
80
90
100Percent Above or Below Threshold Value
0 10 15 20 25Time
Percent Poor (<45)
Percent Good to Fair (>45)
Percent Good (>75)
5
Figure 13. ExampleAverage and Limit Measures for a System
Figure 14. ExamplePercent Good-Fair-Poor in a System

■ 5.6 Providing Solid Foundation Data
Data collection is expensive, and agencies continually search for data sampling techniques, non-destructive testing, and new data collection technology that can reduce this cost. Most comments inthe interviews conducted for this study, however, emphasized data quality and evaluating the use-fulness of data to support performance measures meaningfully, accurately, and reliably. This per-ception is reinforced by other authorities: “Reliable data, intelligently used and presented, areessential for the success of [performance measures]” (12 p. 76). Additional observations from thispaper include the following:
• There is a direct relationship between specific performance measures and the data needed tosupport these measures. “The most common data problems are in ascertaining the quality of thedata and in acquiring it in the exact form desired” (12 p. 78).
• Data that are highly uncertain translate into performance measure values that are likewisehighly uncertain, reducing their management value. “Investments in accurate, high-quality datacollection systems are essential to successful performance measurement and, by extension, toachieving the overall strategic goals of the agency” (12 p. 78).
• Some factors that are important, however, either cannot be measured at all or cannot be mea-sured accurately at an acceptable cost. “Transportation agencies need to consider the uncertaintyintroduced by inaccurate data when taking action based on their system of performance mea-sures” (12 p. 78).
To reiterate a fundamental concept of asset management, data collection should be driven ultimatelyby policy goals and objectives. Internal business process and decision needs will refine data require-ments (e.g., to meet information needs at various organizational levels).
Specific suggestions to improve performance measurement data collection procedures include thefollowing (4):
• Build on what already is in place, considering information and tools now in use at different lev-els of the organization.
• Measure what will be used and use what is measured, basing data collection on needs of thebusiness process for performance-based information, not simply on data availability.
• Assess the need for data quality improvements in terms of accuracy, precision, timeliness, andconsistency. Check for inconsistencies across systems.
• Measure or model the agency’s contribution to improved performance, collecting informationon outcomes as well as outputs. Identify trend data where they are available.
• Manage data as an enterprise asset, with identified responsibilities and schedules for collection,quality checks, documentation, accessibility, and so forth. Adjust data collection proceduresover time to correct for duplication, and update collection procedures to accommodate new dataand new collection technologies.
80
Volume I: Research Report
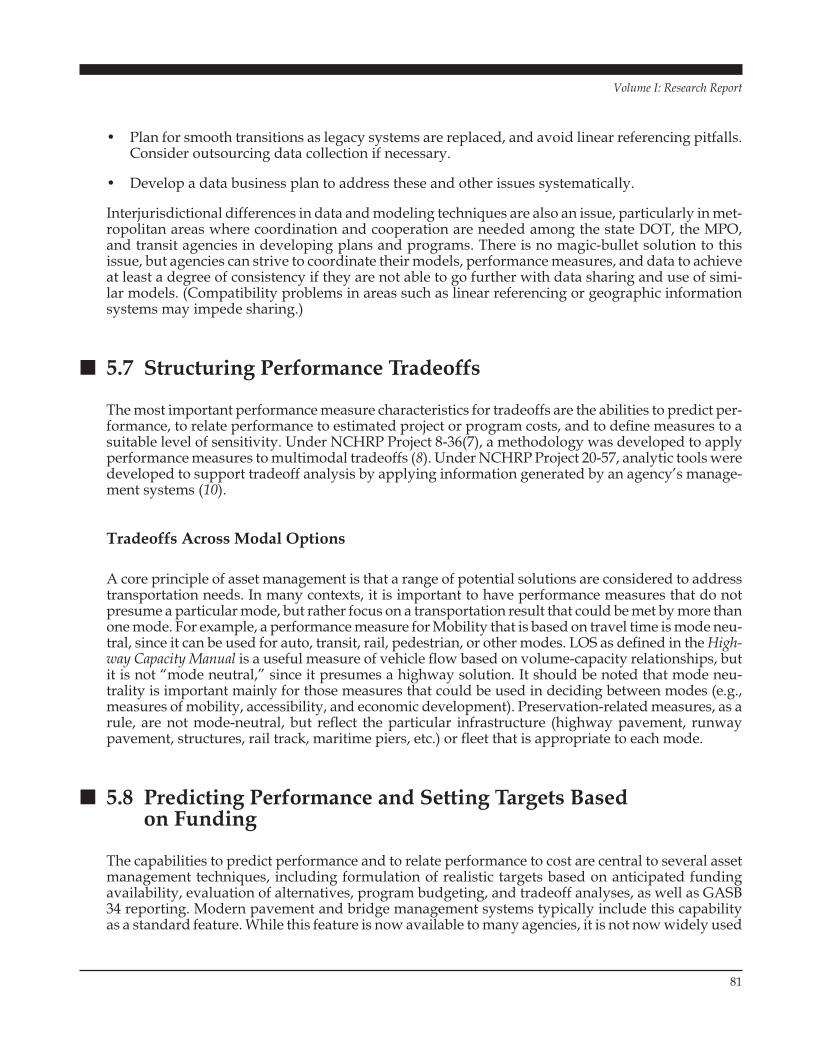
• Plan for smooth transitions as legacy systems are replaced, and avoid linear referencing pitfalls.Consider outsourcing data collection if necessary.
• Develop a data business plan to address these and other issues systematically.
Interjurisdictional differences in data and modeling techniques are also an issue, particularly in met-ropolitan areas where coordination and cooperation are needed among the state DOT, the MPO,and transit agencies in developing plans and programs. There is no magic-bullet solution to thisissue, but agencies can strive to coordinate their models, performance measures, and data to achieveat least a degree of consistency if they are not able to go further with data sharing and use of simi-lar models. (Compatibility problems in areas such as linear referencing or geographic informationsystems may impede sharing.)
■ 5.7 Structuring Performance Tradeoffs
The most important performance measure characteristics for tradeoffs are the abilities to predict per-formance, to relate performance to estimated project or program costs, and to define measures to asuitable level of sensitivity. Under NCHRP Project 8-36(7), a methodology was developed to applyperformance measures to multimodal tradeoffs (8). Under NCHRP Project 20-57, analytic tools weredeveloped to support tradeoff analysis by applying information generated by an agency’s manage-ment systems (10).
Tradeoffs Across Modal Options
A core principle of asset management is that a range of potential solutions are considered to addresstransportation needs. In many contexts, it is important to have performance measures that do notpresume a particular mode, but rather focus on a transportation result that could be met by more thanone mode. For example, a performance measure for Mobility that is based on travel time is mode neu-tral, since it can be used for auto, transit, rail, pedestrian, or other modes. LOS as defined in the High-way Capacity Manual is a useful measure of vehicle flow based on volume-capacity relationships, butit is not “mode neutral,” since it presumes a highway solution. It should be noted that mode neu-trality is important mainly for those measures that could be used in deciding between modes (e.g.,measures of mobility, accessibility, and economic development). Preservation-related measures, as arule, are not mode-neutral, but reflect the particular infrastructure (highway pavement, runwaypavement, structures, rail track, maritime piers, etc.) or fleet that is appropriate to each mode.
■ 5.8 Predicting Performance and Setting Targets Based on Funding
The capabilities to predict performance and to relate performance to cost are central to several assetmanagement techniques, including formulation of realistic targets based on anticipated fundingavailability, evaluation of alternatives, program budgeting, and tradeoff analyses, as well as GASB34 reporting. Modern pavement and bridge management systems typically include this capabilityas a standard feature. While this feature is now available to many agencies, it is not now widely used
81
Volume I: Research Report

for decision making (refer to the agency interviews reported in Section 2.0). Even agencies thatappreciate the value of performance-cost relationships may not yet apply this capability fully. Theymay use it, for example, to set realistic performance targets in light of anticipated funding, but theymay not yet apply the information to conduct tradeoff analyses.
As an example of how management systems can provide performance-cost relationships, Figure 15illustrates three scenarios that have been analyzed for an example network of 500 bridges using theAASHTOWare Pontis® 4.0 bridge management system. Each scenario tests a particular budget levelto preserve the bridge network through a 10-year analysis period. Figure 16 plots the condition ofthe bridge network versus time in years. The network of bridges is assumed to exhibit a uniformdistribution of ages and conditions. The network-average bridge condition is gauged by the percentof bridges with health index (HI) greater than 75 on a scale from 0 (poor) to 100 (excellent). Bridgehealth index is a measure of bridge structural condition, as described by Shepard and Johnson (29).Other measures of condition, such as sufficiency rating, also can be used. The budget levels corre-spond to the following projected annual expenditures:
• A relatively high annual expenditure, which results in improvement of bridge network condi-tion through the 10-year period. This case is illustrated by the top curve in Figure 15.
• A moderate annual expenditure, which is sufficient to maintain the status quo in network bridgecondition through the analysis period. This case is illustrated by the middle curve in Figure 15.
• No annual expenditure, representing a “do-nothing” policy, which results in a decline of net-work bridge condition through the analysis period. This case is illustrated by the bottom curvein Figure 15.
82
Volume I: Research Report
0
20
40
60
80
100
0 1 3 5 7 9 10
Time (years)
Bridges with Health Index >75% (in Percent)
High Expenditures,Increase Over Status Quo
Moderate Expenditures,Maintain Status Quo
No Additional Expenditures,Do Nothing Policy
2 4 6 8
Figure 15. Example of Budget Scenarios and Effects on Infrastructure Condition

The three scenarios each result in a markedly different result at the end of the 10-year analysis periodand together define a range of options in funding bridge preservation. It is possible to plot the con-dition level at the end of 10 years versus the corresponding annual budget or expenditure level. Theresult is the relationship between condition level and needed expenditure, as shown in Figure 16. Fig-ure 16 captures the tradeoff between constant expenditure level and resulting long-term condition.This relationship can be used directly as a guide identifying the expenditure level to meet a specifiedtarget condition level. It also can be used to explore long-term trends in network condition for dif-ferent possible funding scenarios and to discuss these trends with policy-makers in a proactive way.
Performance Targets and GASB Statement 34
Establishment of performance targets for asset condition may be done in conjunction with the GASB34 modified approach. The requirements of the GASB 34 modified approach are summarized inSidebar 5.5. The practical implications of these guidelines for performance measures are the fol-lowing performance measure criteria:
• A focus on preservation;
• A quantitative measure or index of condition or performance (many existing pavement, bridge,rail, and maintenance measures meet this criterion);
• Inspection surveys (at a minimum frequency of every 3 years) to update current performancemeasure values (typical pavement, bridge, rail, maintenance, and other periodic inspections ofinfrastructure can meet this criterion);
83
Volume I: Research Report
0
5
10
15
20
25
0 20 40 60 80 100Percent Bridges with Health Index >75% in 10 years
Relative Budget Dollars (in Millions/Year)
Figure 16. Resulting Relationship Between Infrastructure Condition and Needed Expenditure

• Analytic support of performance measures using tools that relate forecast condition/performanceto preservation budget needs (many modern systems for pavement management, bridge man-agement, capital investment programming, and LOS-based maintenance management have thiscapability);
• Formal establishment of targets for performance measures that are disclosed publicly; and
• Verification that current performance measures meet the intended target for the current year.
These GASB requirements coincide with asset management criteria for a policy-driven and performance-based process, identification and evaluation of options through tradeoff analyses,
84
Volume I: Research Report
Sidebar 5.5: GASB Modified Approach Requirements
GASB 34 requires general purpose state and local governments to report the value of their infra-structure assets in Comprehensive Annual Financial Reports (CAFRs) and to depreciate the value ofthose assets. As an alternative to depreciation, governments are allowed to choose the modifiedapproach for selected asset classes. Under the modified approach, the depreciation requirement iswaived and, in its place, governments establish condition targets and expenditure targets at the startof the fiscal year for these asset classes. These targets are then compared against actual conditions andactual expenditures at the end of the fiscal year, and these comparisons are reported in the CAFR.
There are natural linkages between use of performance measures in asset management and perfor-mance reporting in the modified approach allowed by GASB 34. Guidelines for the modifiedapproach are as follows:
1. “Eligible” infrastructure assets must be part of a network or subsystem of assets,
2. The agency must manage these eligible assets using a management system that has the charac-teristics described below, and
3. The agency must document that these eligible assets are being preserved at or above a conditionlevel disclosed by the agency.
Transportation networks such as highways, roads and streets, railways, and rail transit meet the firstguideline. Since GASB provides agencies flexibility in defining networks and subsystems, facilitiessuch as airports, intermodal transfer points, freight transfer terminals, and port or ferry facilities qual-ify as well.
The second guideline calls for a management system with the following capabilities:
• It must maintain a current inventory of the eligible assets.
• Its data on the condition of eligible assets must be based upon periodic field surveys. These surveysmust be performed at least every 3 years, and they may be based upon statistical samples. They mustbe conducted by or contracted for by the managing agency. The resulting condition assessmentsmust be substantially replicable and should be expressed by a quantitative measure or index.
• It must be able to estimate each year the annual amount needed to maintain and preserve the eli-gible assets at or above the target condition level disclosed by the agency and must report actualexpenditures in comparison with the targeted amount.
The third guideline calls for the agency to document, based upon the most recent series of conditionsurveys and assessments, that the eligible assets are indeed serving at a condition level at or abovethe target disclosed by the agency. This intended condition level must reflect high-level policy estab-lished by administrative or executive decision or by legislative action.

and feedback regarding target attainment and adjustment of either targets or budgets in subsequentperiods if needed. GASB helps promote good asset management, and vice versa.
• If an agency chooses to apply the GASB modified approach and does so correctly, the proce-dures it uses reinforce good asset management practice in preservation.
• Conversely, if an agency follows the asset management criteria described throughout this sec-tion, it is in a position to apply the GASB modified approach if it chooses to do so.
While GASB financial reporting and asset management are two different activities, they relateclosely and can benefit and reinforce each other. See Sidebar 5.6 for a review of initial experiencewith the GASB 34 modified approach.
85
Volume I: Research Report
Sidebar 5.6: Initial Experience with GASB 34 Performance Targets
The initial year of GASB 34’s effectiveness was Fiscal Year 2002, and 23 state DOTs selected the mod-ified approach for some or all of their infrastructure assets. The general attitude among these depart-ments was that the comparison of targeted and actual conditions was a valid exercise that should beof interest to legislators and the public, but that the comparison of targeted and actual expenditureswas of limited value and was compromised by a disconnect between the year of funding authoriza-tion and year of funding expenditure.
There was a divergence in philosophy among many of the state DOTs regarding the relative strin-gency of the targets. Some state DOTs selected very lenient targets (as compared with recent condi-tions) in order to be virtually certain that they would achieve the targets. Others were concerned thatif actual conditions exceeded the targets by too great a margin, this might suggest to some observers,notably legislative budget analysts and committees, that excessive investment was being allocated topreservation and that a reduction was in order. These DOTs selected challenging targets even if thispresented the risk of missing the targets.
Colorado selected a stringent target for pavements, one that permitted no degradation from recentconditions, and a lenient target for bridges, one that it was virtually sure of achieving.
Florida set a pavement condition target that required some improvement from recent conditionswhile the bridge condition target was somewhat less challenging.
Michigan set performance targets that were relatively easy to meet, although in the case of pavementthis was so only because of significant recent improvement.
Minnesota, one of the few states to subdivide its pavement and bridge asset classes by functional clas-sification, selected condition targets that were not especially challenging to meet initially but thatallowed for little margin for deterioration from current conditions, especially for bridges on the prin-cipal arterial system.
Ohio also subdivided its pavement asset class by functional classification. It selected condition tar-gets that were relatively easy to meet.
For these five example states, the approach to bridge condition targeting and assessment was rela-tively uniform and strongly influenced by the National Bridge Inventory program. In contrast, theapproach to pavement targeting and assessment was more varied, reflecting local priorities and dif-ferences in local conditions. This pattern held true through most of the modified approach states.
It should be noted that some of the states using the modified approach used one set of targets for GASB-34 reporting and another (more stringent) set for internal performance management purposes.

■ 5.9 Setting Long-Term Performance Goals
Setting short- to midterm performance targets that are realistic based on funding availability is crit-ical for helping decision-makers make performance-based resource allocation tradeoffs. This is afundamental part of good asset management practice.
However, many agencies want performance targets to be based on goals that stand on their own,independent of resource constraints. They wish to address fundamental questions such as thefollowing:
• What should the condition of our pavements and bridges be?
• What level of congestion should be tolerated on different parts of the network?
• What level of crash reduction is attainable?
General methods for establishing long-term performance goals include the following:
• Measure what the current baseline level of performance is, and then set targets for improvementusing benchmark information about what peer agencies have achieved through focused effortsto improve performance.
• Align agency targets with nationally based targets (e.g., the national target of 1.0 fatality per100 million VMT).
• Use customer surveys and/or tracking of complaint information as a guide to establish “tolera-ble” threshold performance levels.
• Use available models that show how user costs (e.g., travel time, vehicle operating costs, andaccident costs) change with different levels of condition or performance. Examining the slope ofthis curve can show the performance level at which user costs begin to increase rapidly.
• Make use of the law of diminishing marginal returns to identify the point at which additionalinvestments begin to have a declining degree of impact on improvements in performance—in other words, where the slope of the investment-performance curve begins to decline. Curvesof changes in performance measure value per unit of investment (see Figures 15 and 16) can beused for this purpose.
• A corollary to the law of diminishing returns is that caution should be exercised about settingtargets that call for 100-percent achievement of a particular condition or service level, since thebenefit/cost ratio associated with achieving the last 1 percent will typically be quite low. Forexample, setting a target of no structurally deficient bridges could necessitate costly replacementof a bridge that provides a redundant link in the network and that is not heavily used.
• Use a tool such as the Highway Economic Requirements System (HERS) or the Highway Designand Maintenance Standards Model (HDM-4) to identify the performance levels that could beachieved through implementing all improvements with benefits exceeding costs.
86
Volume I: Research Report

• Define a set of minimum standards for infrastructure characteristics and performance (suchstandards already may be in place), and establish a long-term target of meeting these standards.Caution should be exercised in defining standards so that they are feasible and reasonable.
• Related to the standards-based approach, a methodology for defining either deficiencies orneeds (i.e., the cost of addressing the deficiencies) can be applied. This then provides the basisfor setting a long-term target of eliminating all deficiencies or reducing the backlog to 0. Alter-natively, a target of keeping the backlog from growing might be established.
For setting infrastructure condition goals, the following additional types of approaches can be used:
• Establish a threshold for “poor” pavement based on a level of roughness that is noticeable toroad users (particularly trucks) and that is associated with a marked increase in road user costs(due to vehicle wear and tear, increased fuel consumption, or reduced speed). Set a long-termgoal of having minimal travel on poor roads (e.g., less than 5 percent).
• Use capabilities of pavement and bridge management systems to determine a long-term opti-mal network condition distribution, which minimizes life-cycle costs. Use this distribution to settargets for either average condition or percent of infrastructure (number of bridges, deck area,miles, etc.) above a given threshold condition level.
• Base goals on maintaining a steady-state condition distribution in order to avoid future peaksin preservation or replacement costs that would be difficult to address given a relatively con-stant level of funding. These goals would be expressed in terms of the percent of the network indifferent ranges of condition level (or remaining life categories).
Emerging techniques for establishing performance targets for congestion are discussed in Sidebar 5.7.
■ 5.10 Obtaining Internal and External Buy-In
Virtually all authorities agree on the importance of internal and external acceptance of performancemeasures to their successful application as well as public and agency support for the decisions basedupon performance measurement. While there is widespread agreement on the principles to be fol-lowed and the resulting benefits, there are somewhat different takes on the relative number of per-formance measures that best serves this objective.
Performance measures should be designed with the customer in mind whenever possible.
• External customers include users of the transportation system, who themselves represent dif-ferent interests (e.g., passenger versus freight transporters, local versus Interstate transport, andcommercial versus recreational/tourist interests), as well as public and private policy-makersand interest groups. While system end-users may not always exhibit much interest in perfor-mance measures per se, their interest can be stimulated through effective public involvementand public information programs (14 p. 51). Transit agencies have used customer surveys todevelop customer-oriented measures of service quality (31 p. 65). (These points reinforce theimportance of the processes illustrated at the top of Figure 2).
87
Volume I: Research Report

88
Volume I: Research Report
Sidebar 5.7: Setting Performance Targets for Congestion
Congestion and the related concern, reliability, are measured in some way in several cities, but per-formance targets are rarely set. The targets should be connected and related to areawide targets forrelated measures (e.g., population and employment growth, home prices, and education quality).However, the first step is to identify some measurable targets and begin analyzing the trends andmeanings. The range of possible types of targets is very broad, but might desirably contain someindividual mode, program, or activity targets that can affect day-to-day agency practices and tar-gets that relate to system-level performance.
Targets should be based on measures of congestion that are meaningful to individuals, as well asmeasures of the magnitude of the problem. The individual measures might express the amount oftravel time or delay per person or per trip. These measures relate the problem in quantities that arerelevant to travelers, shippers, and citizens. The magnitude values are used in the description of theproblem and the effect of the solutions. These might be expressed in total hours or total dollars, whichare values needed for benefit/cost analyses. The dollar value of congestion, reliability, or travel timeis a useful method to combine passenger travel concerns and freight concerns. The higher value of anhour of delayed freight might be particularly relevant for freight corridor or facility studies.
Many state DOTs and FHWA use some version of free-flow travel conditions or travel at the speedlimit as a standard for comparisons. While these work well in communications with the public, theyare not as relevant to the amount of transportation service that can be provided. The California DOT(Caltrans) has used 35 mph as a standard for addressing an achievable target speed on the freewaysand measured delay relative to that level in the state’s urban areas for many years. Caltrans andWSDOT have recently begun to use the concept of “maximum productivity,” defined as the optimumcombination of speed and volume, as a target. This approach shifts the focus of the targets from astandard of what might be achievable for road additions to a focus on operating efficiency. The max-imum hourly volume occurs when the freeway operates near a speed of 50 mph.
The metropolitan planning organizations and the Texas DOT have cooperated on the developmentof a congestion standard for a statewide needs estimate. The concept uses the elimination of seri-ous congestion as a target for identifying the needs for transportation improvement. Capacityimprovements are made to reduce the volume-to-capacity ratio on all major road segments below1.0 in the planning year (either 2025 or 2030). The capacity additions are used to estimate the costof the actual improvements, which are envisioned as a combination of lane additions, transit proj-ects, operations improvement programs, demand management, and land use changes—all designedto improve congestion. The costs of road additions are easier to estimate; therefore, they are usedas the cost baseline. The performance measure used in this case is the Texas congestion index, theratio of the dollar value of travel time in the peak periods to the dollar value of travel if facilitiesoperated at free-flow speeds. With the needs scenario adding roadway in only those sections withserious congestion, the areawide index target is composed of road sections with a range of con-gestion levels from just below the threshold to free-flow conditions. This results in a different tar-get value for each metropolitan area, depending on the mix of system conditions. The larger areaswith congestion on most of the system tend to have higher target values than the smaller metro-politan areas with more of the roads operating closer to free-flow speeds. “Addressing seriouscongestion problems” is a target that is easy to analyze and communicate and provides data use-ful for a variety of purposes.

• Buy-in by key internal stakeholders and decision-makers, including those who will be heldaccountable for meeting targets (not always the same individuals as the decision-makers), is crit-ical to success. “Those who are expected to use [performance measures] to shape and make deci-sions should be allowed to influence the design of the program from the beginning” (23 p. 25).Internal support is also needed for externally reported measures, particularly among “staffwhose cooperation or resources are needed to gather or summarize measures” (12 p. 41).
The most challenging buy-in efforts may occur among “peers,” particularly in metropolitan areaswhere considerable coordination and cooperation are required among the state DOT, the MPO, pub-lic transit agencies, and other public and private service providers. “The issue here is how to createa mutuality of interest that has a reasonable chance of leading to a cooperative effort and a win-winoutcome” (14 p. 51).
The number of performance measures should be limited to the minimum needed to support deci-sions at the intended level. Fewer, more general measures are generally appropriate to policy for-mulation and planning, while more measures may be needed for programming and projectselection. In all cases, however, the number of measures should not overwhelm decision-makers orbog down the data collection effort (23 p. 25).
Performance measure development is an art, not a science. Executives therefore must be creative infashioning measures that reflect various internal and external interests in a coherent way. Further-more, performance measure development should pay attention to the following guidelines toensure buy-in (12 p. 79):
• Keep the measures few and simple;
• Focus the measures on agency strategic goals, and relate them to the agency’s activities;
• Use the measures as a means to improving system performance and service quality, not as reportcards; and
• Invest the time and effort needed for data collection and processing.
Agencies such as Florida DOT and Minnesota DOT each use hundreds of measures. While it isimportant in these agencies to have a lot of measures, it is also acknowledged that this numerouspool can be boiled down to a few key measures for reporting purposes. The large number of mea-sures is felt to be needed, however, for effective buy-in, since everyone must feel that his or her inter-ests are represented (35 p. 88).
89
Volume I: Research Report

91
Volume I: Research Report
6.0 Recommended Framework forTransportation Agencies
■ 6.1 Introduction
This section outlines a recommended framework that transportation agencies can use to:
• Identify performance measures that are most useful for asset management,
• Integrate these performance measures effectively within the organizations, and
• Set performance targets.
Rather than a single, prescriptive set of measures that might provide a good textbook example butlikely would not be suitable for all agencies, the framework is in the form of guidance on the preferredtypes and forms of measures and the process by which agencies should identify and implement them.The framework is based on the criteria and guidelines for identifying performance measures that werepresented in Section 4.0 and on the design considerations discussed in Section 5.0.
Volume II of this report is a guide to this framework. It reviews some of the key concepts from Sec-tions 4.0 and 5.0 in this volume and presents a step-by-step procedure that agencies can follow toimplement the framework.
The framework was developed with the recognition that each agency will have a different set of cir-cumstances and needs to consider in selecting and implementing performance measures. Further-more, it is presumed that many agencies will already have a number of performance measures inplace, along with supporting data and systems. While some agencies may wish to “start from scratch,”others may simply want to identify incremental steps to supplement their existing set of measuresin certain areas or to make more effective use of measures for decision making.
Many performance measures now used by agencies are compatible with asset management con-cepts, associated data collection efforts, existing management systems, other analytic tools such asgeographic information systems (GIS), and reporting mechanisms. In agencies that have alreadydevoted resources to a results-based, customer-oriented performance measurement system, onlymodest work if any would be needed to support a broad range of asset management functions. Inagencies that are looking to upgrade their performance measurement or wish to include systemmonitoring within a comprehensive asset management process, the framework can help identify themost suitable systems of measures to support various management functions and decisions.
Although the framework focuses on using performance measures in support of asset managementprinciples, agencies use performance measures for a variety of purposes and it is not necessary (ordesirable) to create a separate and distinct “asset management” set of performance measures. There
is also no need to apply the asset management–based criteria for selection of performance mea-sures used for purposes other than the strategic resource allocation approach embodied in assetmanagement.
■ 6.2 Framework Overview
The framework is organized into three separate processes, as shown in Figure 17:
• Identify Performance Measures: assessing existing performance measures that are in place,identifying gaps, and considering new measures to fill gaps.
• Integrate Performance Measures into the Organization: engaging stakeholders to ensure buy-in, designing families of measures that can be used at different organizational levels and for dif-ferent types of decisions, ensuring consistency across measures, identifying needed improve-ments to data collection and analytic tools, designing communication devices, and documentingmeasurement and reporting procedures.
• Establish Performance Targets: establishing both long-term (desired or optimal) goals andshort- to medium-term (funding constrained) targets for performance measures.
While a sequential order is shown in Figure 17, the framework is designed to be flexible. Agenciesmay apply each of these steps sequentially as presented in Volume II; they may follow a differentorder or do some of these steps concurrently, or they may choose to pursue only one of these steps,depending on their situation.
The following three sections provide a summary of the key steps in the framework. Refer to Volume IIfor a more detailed description of each step.
■ 6.3 Identify Performance Measures
Step 1: Inventory existing measures—Take an inventory of performance measures already in usewithin the agency that could be of value for resource allocation decisions. These will be measuresthat relate directly to the performance of the transportation system or the impacts of the system onsociety or the surrounding environment. Obtain an understanding of how existing measures aredefined, how they are now being used, and whether data or other issues limit their current value.
Step 2: Assess gaps—Identify gaps in existing performance measures. There are two types of gapsto be identified: gaps in coverage and gaps in use of measures to guide resource allocation. Gaps incoverage are determined by examining existing measures with respect to the most critical outcomeareas, based on the agency’s stated policy goals. Gaps in use are identified by assessing if and howmeasures are used to influence resource allocation decisions.
Step 3: Define selection criteria—Establishing explicit criteria can provide valuable focus to the per-formance measure development effort and impose a useful discipline on the process, providing the
92
Volume I: Research Report

Figure 17. Guidance for Performance Measures and Targets
TailorMeasures to
Decisions
Design consistentMeasures AcrossProgram Areas
IdentifyImprovements toData and Tools
DesignCommunication
Devices
EngageStakeholders
DocumentDefinitions and
Procedures
InventoryExisting
Measures
ConsiderPolicy and
Public Input
Assess and Select Measuresfor Further Design and
Implementation
DefineContextsand TimeHorizons
Select Scopeof Measuresfor Targets
DevelopLong-Term
Goals
ConsiderFunding
Availability
AnalyzeResource
AllocationScenarios
and Tradeoffs
EstablishTargets and
TrackProgress
AssessGaps
DefineSelectionCriteria
Identify CandidateMeasures/Adjustments
to Existing Measures
Identify Performance MeasuresIdentify Performance Measures
Integrate Performance Measures into the OrganizationIntegrate Performance Measures into the Organization
Establish Performace TargetsEstablish Performace Targets

basis for narrowing down the list of potential candidate measures. Suggested criteria include thoserelated to feasibility of implementation (considering data availability and costs), policy sensitivity(do measures support policy objectives and provide meaningful information to decision-makers),support for a long-term strategic view, usefulness for decision support, and usefulness to differentorganizational levels and to external audiences.
Step 4: Identify candidate measures/adjustments to existing measures—The recommendedapproach is to develop a chart of candidate measures, indicating potential relevance to specificbusiness processes, including long-range planning, performance-based budgeting, project prioriti-zation, daily operations and maintenance management, and delivery monitoring. (Appendix A ofVolume II provides examples upon which agencies can draw.)
Step 5: Assess and select measures for further design and implementation—This step involvestaking the candidate measures identified in Step 4 and applying the criteria developed in Step 3 toidentify measures that are worth pursuing.
■ 6.4 Integrate Performance Measures into the Organization
Step 1: Engage stakeholders—Early involvement of stakeholders is emphasized as a necessaryingredient for successful performance measurement implementation. Buy-in from both consumersor users or performance measures (i.e., decision-makers) and producers of performance measures(i.e., technical staff responsible for providing the information) is needed. This step is listed firstbecause of its importance, but is intended to be an ongoing activity throughout the performancemeasure development effort.
Step 2: Tailor measures to decisions—In this step, each performance measure is examined withrespect to the specific decision-making contexts in which it will be used. Appropriate form(s) of themeasure are designed in order to be meaningful to the intended audience and provide sufficientsensitivity given the timeframe and geographic scope of application. Approaches to “rolling up”measures from detailed levels to higher levels are also determined in this step.
Step 3: Design consistent measures across program areas—This step looks at opportunities toimplement families of measures that can facilitate tradeoffs across program areas. A variety ofapproaches to this are suggested for consideration—for example, using remaining life or value foreach class of asset, or defining a “triage” approach to performance levels for all assets (high risk,minimally tolerable, and desirable).
Step 4: Identify improvements to data and tools—This step is concerned with making sure the nec-essary data (with sufficient quality) and analytic tools are available to enable effective use of eachof the selected performance measures.
Step 5: Design communication devices—This step considers the critical role of communication ina performance measurement effort. Examples of effective performance-reporting approaches andformats are provided to assist agencies in designing their own. In addition, the importance of orga-nizational mechanisms for communication of performance information (e.g., putting performancereports on the agenda at quarterly management meetings) is stressed.
94
Volume I: Research Report
Step 6: Document definitions and procedures—This step emphasizes the importance of clear doc-umentation of the precise definitions of measures and how they are calculated. This documentationshould serve as the basis for auditing performance measurement accuracy and adhering to definedprocedures.
■ 6.5 Establish Performance Targets
Step 1: Define contexts and time horizons—This initial step involves developing explicit statementsabout how targets will be used and what time horizons they will cover (e.g., in long-range plans, inGASB-34 reporting, and in agency annual performance reports).
Step 2: Select scope of measures for targets—Determine which measures should have targets. Thisstep involves identifying the performance measures that are suitable for target development. Somemeasures may not lend themselves to quantitative targets; others may not have sufficient baselineor trend information available for the agency to be comfortable with establishing a target. In addi-tion, consistency across targets for related measures and potential conflicts across targets are con-sidered in this step.
Step 3: Develop long-term goals—A distinction is made between long-term goals about desirableperformance levels and short-term targets that represent the best that can be done given availableresources. The framework stresses the importance of financially constrained performance targets asa fundamental part of good asset management practice. However, goals that are independent ofresource constraints provide an important foundation. No single best approach to developing long-term goals is recommended. Rather, a range of approaches that agencies can follow is described.These approaches include use of benchmarks from peer agencies, reliance on formal or informalcustomer feedback to determine acceptable performance levels, and application of existing analytictools to find performance levels that represent economically efficient conditions.
Step 4: Consider funding availability—This step involves creating realistic estimates of futureresources that can be used as the basis for financially constrained performance targets. A scenarioapproach is recommended to address funding uncertainties.
Step 5: Analyze resource allocation scenarios and tradeoffs—The framework recommends analy-sis of the performance implications of different resource allocations—both within and across pro-gram categories. Use of analytic tools that project future performance as a function of investmentlevel is fundamental to this activity.
Step 6: Consider policy and public input—There should be a two-way communication process,with the agency providing easily understandable information about the implications of differentresource levels and allocations and stakeholders providing their feedback on desired performancelevels and priorities across different measures.
Step 7: Establish targets and track progress—This final step involves selecting target values forperformance measures and putting the procedures in place to track progress toward achieve-ment of the targets. A process of periodic adjustment to performance targets is also recom-mended to reflect changes in policy or priorities or the emergence of new information that wasnot previously available.
95
Volume I: Research Report

Sources
■ Cited References
1. AASHTO Highway Subcommittee on Maintenance, Resolution to Define and Adopt CommonMaintenance Performance Measures, Resolution 01-07 (July 19, 2001).
2. AASHTO, Transportation Asset Management Guide, Washington, D.C. (November 2002).
3. AASHTO Customer Satisfaction and Performance Measures Focus Group, Survey on Perfor-mance Measures, AASHTO Highway Subcommittee on Maintenance (July 7, 2003).
4. Adams, Louis H., Frances D. Harrison, and Anita Vandervalk, “Issues and Challenges in UsingExisting Data and Tools for Performance Measurement,” TRB Conference Proceedings 36: Per-formance Measures to Improve Transportation Systems. Transportation Research Board (2005).
5. Booz Allen Hamilton and Compass USA, “National Workshop on Commonly RecognizedMeasures for Maintenance, Scottsdale AZ, June 5–7, 2000,” prepared for the AASHTO High-way Subcommittee on Maintenance (July 2000).
6. Cambridge Systematics, Inc., Performance-Based Planning Manual, unpublished interim docu-ment for NCHRP Project 8-32(2) (November 1999).
7. Cambridge Systematics, Inc., NCHRP Report 446: A Guidebook for Performance-Based Transporta-tion Planning, Transportation Research Board (2000).
8. Cambridge Systematics, Inc., “Development of a Multimodal Tradeoffs Methodology for Usein Statewide Transportation Planning,” Unpublished Final Report, NCHRP Project 8-36(7)(November 2001).
9. Cambridge Systematics, Inc., Refined Classification System and Minimum Performance Goals, Ver-mont Agency of Transportation (AOT), draft (March 2003).
10. Cambridge Systematics, Inc., PB Consult, and System Metrics Group, Inc., NCHRP Report 545:Analytical Tools for Asset Management, Transportation Research Board (2005).
11. Central Transportation Planning Staff, Program for Mass Transportation, Massachusetts BayTransportation Authority (May 2003).
12. Dalton, Doug, et al., “Transportation Data and Performance Measurement,” TRB ConferenceProceedings 26: Performance Measures to Improve Transportation Systems and Agency Operations,Transportation Research Board (2001).
13. Delcan Corporation, BearingPoint, Inc., KPMG LLP, PB Consult, and Cambridge SystematicsInc., Asset Management Business Framework User Guide and Technical Guide, Ontario Ministry ofTransportation (July 2003).
96
Volume I: Research Report

14. Kassoff, Hal, “Implementing Performance Measurement in Transportation Agencies,” TRBConference Proceedings 26: Performance Measures to Improve Transportation Systems and AgencyOperations, Transportation Research Board (2001).
15. Maryland DOT, 2003 Annual Attainment Report on Transportation System Performance (Janu-ary 2003).
16. Metropolitan Transportation Commission, Performance Measures Report for the 2001 RegionalTransportation Plan for the San Francisco Bay Area (August 2001).
17. Ministry of Transportation of Ontario, Asset Management Business Framework: Technical Guide,St. Catharines, Ontario, Canada (December 2003).
18. Montana DOT, Performance Programming Process: A Tool for Making Transportation InvestmentDecisions (November 2000).
19. Norwood, Janet, and Jamie Casey (Eds.), Key Transportation Indicators: Summary of a Workshop,Committee on National Statistics, National Research Council (2002).
20. Neumann, Lance A., NCHRP Synthesis of Highway Practice 243: Methods for Capital Programmingand Project Selection, Transportation Research Board (1997).
21. New Zealand National Asset Management Steering Group and the Institute of Public WorksEngineering of Australia, International Infrastructure Management Manual (April 2000).
22. Organization for Economic Cooperation and Development (OECD), Performance Indicators forthe Road Sector: Summary of Field Tests (2001).
23. Pickrell, Steven, and Lance Neumann, “Use of Performance Measures in Transportation Deci-sion Making,” TRB Conference Proceedings 26: Performance Measures to Improve TransportationSystems and Agency Operations, Transportation Research Board (2001).
24. Pickrell, Steven, “MoveAZ Plan Strategic Directions: Initial Performance Measures,” memo-randum to John Pein, Arizona DOT Planning (June 2002).
25. Poister, Theodore H., NCHRP Synthesis of Highway Practice 238: Performance Measurement inState Departments of Transportation, Transportation Research Board (1997).
26. Reed, M. F., et al., NCHRP Report 357: Measuring State Transportation Program Performance,Transportation Research Board (1993).
27. Roy Jorgensen Associates, Inc., in conjunction with AASHTO, the FHWA, and the NationalHighway Institute, Maintenance Management for the 21st Century: A Report on Forum Results andProcedures (June 1999).
28. Shaw, Terrel, NCHRP Synthesis of Highway Practice 311: Performance Measures of OperationalEffectiveness for Highway Segments and Systems, Transportation Research Board (2003).
29. Shepard, Richard W., and Michael B. Johnson, “California Bridge Health Index,” 8th Interna-tional Bridge Management Conference, Preprints, Vol. II, Transportation Research Board (1999).
30. Stantec and the University of Waterloo, Measuring and Reporting Highway Asset Value Conditionand Performance, Council of Deputy Ministers Responsible for Transportation and HighwaySafety, Canada (October 2000).
97
Volume I: Research Report

31. Stuart, Darwin, “Role of Customer Input in Implementing and Using Performance Measures,”Panel Discussion of “Agency Implementation of System Performance Measures,” TRB Confer-ence Proceedings 26: Performance Measures to Improve Transportation Systems and Agency Opera-tions, Transportation Research Board (2001).
32. Texas Transportation Institute and Cambridge Systematics, Inc., Mobility Monitoring ProgramOutline, FHWA Operations Core Business Unit, draft (April 2000).
33. TransTech Management, Inc., and AASHTO, Strategic Performance Measures for State Depart-ments of Transportation—A Handbook for CEOs and Executives, AASHTO monograph preparedfor NCHRP Project 20-24(20) (June 2003).
34. MacDonald, Douglas, et al., Transportation Performance Measures in Australia, Canada, Japan andNew Zealand. FHWA report FHWA-PL-05-001 (December 2004).
35. Vandervalk, Anita, “TRB and Florida Examples,” Panel Discussion: Part 1 of “Selecting Mea-sures, Data Needs, and Analytical Issues,” TRB Conference Proceedings 26: Performance Measuresto Improve Transportation Systems and Agency Operations, Transportation Research Board (2001).
36. Vandervalk-Ostrander, Anita, Rich Margiotta, and Jacob Meunier, Performance Measures forSmall Communities—Final Report to the Federal Highway Administration, FHWA report FHWA-OP-03-080 (May 1, 2003).
37. Wye, Chris, Performance Management: A “Start Where You Are, Use What You Have” Guide, Cen-ter for Improving Government Performance, National Academy of Public Administration(October 2002).
38. Meyer, Michael D., Alternative Performance Measures for Transportation Planning: EvolutionToward Multimodal Planning, FTA report FTA-GA-26-7000 (December 1995).
■ Bibliography
1. AASHTO Highway Subcommittee on Maintenance, Resolution to Define and Adopt CommonMaintenance Performance Measures, Resolution 01-07 (July 19, 2001).
2. AASHTO, Transportation Asset Management Guide, Washington, D.C. (November 2002).
3. AASHTO Customer Satisfaction and Performance Measures Focus Group, Survey on Perfor-mance Measures, AASHTO Highway Subcommittee on Maintenance (July 7, 2003).
4. Adams, Louis H., Frances D. Harrison, and Anita Vandervalk, “Issues and Challenges in UsingExisting Data and Tools for Performance Measurement,” TRB Conference Proceedings 36: Per-formance Measures to Improve Transportation Systems. Transportation Research Board (2005).
5. Basilica, J., et al., Workshop Summary of “Linking Performance Measures with Decision-Making,” TRB Conference Proceedings 26: Performance Measures to Improve Transportation Systemsand Agency Operations. Transportation Research Board (2001).
98
Volume I: Research Report
6. Bertini, Robert L., Monica Leal, and David J. Lovell, “Generating Performance Measures fromPortland’s Archived Traffic Management System Data,” 81st Annual Meeting of the Transporta-tion Research Board: Preprint CD-ROM, Transportation Research Board (November 2001).
7. Booz Allen Hamilton and Compass USA, “National Workshop on Commonly RecognizedMeasures for Maintenance, Scottsdale AZ, June 5–7, 2000,” prepared for the AASHTO High-way Subcommittee on Maintenance (July 2000).
8. Booz Allen Hamilton, Applicability of System Performance Measurement to the State Highway Oper-ation and Protection Program, California DOT (December 2001).
9. Busby, David, et al., Workshop Summary of “Agency Implementation of Transportation Sys-tem Performance Measures,” TRB Conference Proceedings 26: Performance Measures to ImproveTransportation Systems and Agency Operations, Transportation Research Board (2001).
10. Cambridge Systematics, Inc., Performance Measures Overview for Michigan DOT (May 1994).
11. Cambridge Systematics, Inc., Suggested Performance Measures for Texas Transportation Plan (Aug1994).
12. Cambridge Systematics, Inc., National Transportation System Performance Measures, final reportfor the Office of the Secretary, U.S. DOT Report DOT-T-97-04 (April 1996).
13. Cambridge Systematics, Inc., Multimodal Transportation Planning—Development of a Performance-Based Planning Process, unpublished Phase I final report for NCHRP Project 8-32(2) (August 1996).
14. Cambridge Systematics, Inc., “Texas Transportation Plan: Objectives and Outcome Measures,”PowerPoint presentation by Arlee Reno (April 1999).
15. Cambridge Systematics, Inc., “Twin Cities Performance Audit: Overview of Performance Mea-sures,” PowerPoint presentation by Arlee Reno (April 1999).
16. Cambridge Systematics, Inc., The Colorado DOT Investment Strategy: A Framework for MakingTransportation Investment Decisions (October 1999).
17. Cambridge Systematics, Inc., Performance-Based Planning Manual, unpublished interim docu-ment for NCHRP Project 8-32(2) (November 1999).
18. Cambridge Systematics, Inc., NCHRP Report 446: A Guidebook for Performance-Based Transporta-tion Planning, Transportation Research Board (2000).
19. Cambridge Systematics, Inc., and David Evans and Associates, ODOT Operations Program Per-formance Measures, draft final report for Oregon DOT (June 2001).
20. Cambridge Systematics, Inc., “Development of a Multimodal Tradeoffs Methodology for Usein Statewide Transportation Planning,” Unpublished Final Report for NCHRP Project 8-36 (7)(November 2001).
21. Cambridge Systematics, Inc., “Operations and Asset Management,” discussion paper pre-pared for the FHWA Office of Operations Technology Services (December 16, 2002).
99
Volume I: Research Report
22. Cambridge Systematics, Inc., Refined Classification System and Minimum Performance Goals, Ver-mont Agency of Transportation (AOT), draft (March 2003).
23. Cambridge Systematics, Inc., PB Consult, and System Metrics Group, Inc., NCHRP Report 545:Analytical Tools for Asset Management, Transportation Research Board (2005).
24. Cambridge Systematics, Inc., Countywide Deficiency Plan—Performance Measures for Santa ClaraCounty, California.
25. Central Transportation Planning Staff, Program for Mass Transportation, Massachusetts BayTransportation Authority (May 2003).
26. Citizens’ Network Benchmarking Initiative, Results of the Common Indicators: Statistical Indica-tors on Local and Regional Passenger Transport in 40 European Cities and Regions, European Com-mission DG Energy and Transport (February 2002).
27. City of Bellevue Transportation Department, “City of Bellevue 2001 Performance Measures.”PowerPoint presentation (April 2002).
28. City of Calgary, Community and Corporate Performance Measures (2002).
29. Dalton, Doug, et al., “Transportation Data and Performance Measurement,” TRB ConferenceProceedings 26: Performance Measures to Improve Transportation Systems and Agency Operations,Transportation Research Board (2001).
30. Delcan Corporation, BearingPoint, Inc., KPMG LLP, PB Consult, and Cambridge SystematicsInc., Asset Management Business Framework User Guide and Technical Guide, Ontario Ministry ofTransportation (July 2003).
31. Delaware DOT, Statewide Long-Range Transportation Plan (September 2002).
32. Department of Geography, New Mexico State University, The Use of Intermodal PerformanceMeasures by State Departments of Transportation, U.S. DOT report DOT-T-96-18 (June 1996).
33. Federal Highway Administration, Monitoring Urban Roadways in 2001: Examining Reliability andMobility with Archived Data, FHWA report FHWA-OP-03-141 (June 2003).
34. Florida DOT, Measures for Performance-Based Program Budgeting as Stated in the General Appro-priations Act for FY 1997–1998 (October 1997).
35. Florida Transportation Commission, Performance and Production Review of the Department ofTransportation: Fiscal Year 2001–2002 (2002).
36. Georgia DOT, Statewide Transportation Plan 2001–2025 (December 2001).
37. Gore, Albert, Serving the American Public: Best Practices in Performance Measurement, National Per-formance Review (June 1997).
38. Idaho Transportation Department, 2004 Strategic Plan (2003).
100
Volume I: Research Report

39. Kassoff, Hal, “Implementing Performance Measurement in Transportation Agencies,” TRBConference Proceedings 26: Performance Measures to Improve Transportation Systems and AgencyOperations, Transportation Research Board (2001).
40. Lomax, Tim, David Schrank, Shawn Turner, and Richard Margiotta, “Selecting Travel Relia-bility Measures,” Texas Transportation Institute monograph (May 2003).
41. MacDonald, Douglas, et al., Transportation Performance Measures in Australia, Canada, Japan andNew Zealand. FHWA report FHWA-PL-05-001 (December 2004).
42. Maine DOT, State of the System Report (2002).
43. Marbek Resource Consultants, Ltd., How Jurisdictions Are Measuring Performance of Transporta-tion Policy and Planning, Ministry of Transportation (Canada) (October 2001).
44. Maryland DOT, “Driven to Excel,” Four-Year Business Plan 2000–2004, FY 2002 update.
45. Maryland DOT, 2003 Annual Attainment Report on Transportation System Performance (January2003).
46. Metropolitan Transportation Commission, Performance Measures Report for the 2001 RegionalTransportation Plan for the San Francisco Bay Area (August 2001).
47. Meyer, Michael D., Alternative Performance Measures for Transportation Planning: EvolutionToward Multimodal Planning, FTA report FTA-GA-26-7000 (December 1995).
48. Meyer, Michael, “Measuring That Which Cannot Be Measured—At Least According to Con-ventional Wisdom,” TRB Conference Proceedings 26: Performance Measures to Improve Trans-portation Systems and Agency Operations, Transportation Research Board (2001).
49. Michigan DOT, Five-Year Road and Bridge Program 2002–2006 (May 2002).
50. Michigan DOT, State Long-Range Plan 2000–2025—Mobility Is Security (2002).
51. Ministry of Transportation of British Columbia, 2003/2004–2005/2006 Service Plan (2003).
52. Ministry of Transportation of Ontario, Asset Management Business Framework: Technical Guide,St. Catharines, Ontario, Canada (December 2003).
53. Minnesota DOT, Performance Measures Summary (January 1999).
54. Minnesota DOT, Moving Minnesota 2003 (July 2002).
55. Montana DOT, TRANPLAN 21—2001 Annual Report (2001).
56. Montana DOT, Performance Programming Process: A Tool for Making Transportation InvestmentDecisions (November 2000).
57. Norwood, Janet, and Jamie Casey (Eds.), Key Transportation Indicators: Summary of a Work-shop, Committee on National Statistics, National Research Council (2002).
101
Volume I: Research Report

58. Neumann, Lance A., NCHRP Synthesis of Highway Practice 243: Methods for Capital Programmingand Project Selection, Transportation Research Board (1997).
59. New Jersey DOT, Transportation Choices 2025 (2001).
60. New Zealand National Asset Management Steering Group and the Institute of Public WorksEngineering of Australia, International Infrastructure Management Manual (April 2000).
61. Oregon DOT, Final Statewide Transportation Improvement Program 2002–2005 (May 2002).
62. Organization for Economic Cooperation and Development (OECD), Asset Management for theRoads Sector, draft (September 2000).
63. Organization for Economic Cooperation and Development (OECD), Performance Indicators forthe Road Sector: Summary of Field Tests (2001).
64. Pennsylvania DOT, PennPlan Moves! Report of Achievements (2000).
65. Pickrell, Steven, and Lance Neumann, “Use of Performance Measures in Transportation Deci-sion Making,” TRB Conference Proceedings 26: Performance Measures to Improve TransportationSystems and Agency Operations, Transportation Research Board (2001).
66. Pickrell, Steven, “MoveAZ Plan Strategic Directions: Initial Performance Measures,” memo-randum to John Pein, Arizona DOT Planning (June 2002).
67. Poister, Theodore H., NCHRP Synthesis of Highway Practice 238: Performance Measurement inState Departments of Transportation, Transportation Research Board (1997).
68. Reed, M. F., et al., NCHRP Report 357: Measuring State Transportation Program Performance,Transportation Research Board (1993).
69. Roy Jorgensen Associates, Inc., in conjunction with AASHTO, the FHWA, and the NationalHighway Institute, Maintenance Management for the 21st Century: A Report on Forum Results andProcedures (June 1999).
70. Sabol, Scott A., NCHRP Synthesis of Highway Practice 300: Performance Measures for Research,Development, and Technology Programs, Transportation Research Board (2001).
71. Schrank, David, and Tim Lomax, The 2002 Urban Mobility Report, Texas Transportation Insti-tute (June 2002).
72. Shaw, Terrel, NCHRP Synthesis of Highway Practice 311: Performance Measures of OperationalEffectiveness for Highway Segments and Systems, Transportation Research Board (2003).
73. Shepard, Richard W., and Michael B. Johnson, “California Bridge Health Index,” 8th Interna-tional Bridge Management Conference, Preprints, Vol. II, Transportation Research Board (1999).
74. Stantec and the University of Waterloo, Measuring and Reporting Highway Asset Value Conditionand Performance, Council of Deputy Ministers Responsible for Transportation and HighwaySafety, Canada (October 2000).
75. Stivers, M. L., K. L. Smith, T. E. Hoerner, and A. R. Romine, NCHRP Report 422: MaintenanceQA Program Implementation Manual, Transportation Research Board (1999).
102
Volume I: Research Report

76. Stuart, Darwin, “Role of Customer Input in Implementing and Using Performance Measures,”Panel Discussion of “Agency Implementation of System Performance Measures,” TRB Confer-ence Proceedings 26: Performance Measures to Improve Transportation Systems and Agency Opera-tions, Transportation Research Board (2001).
77. Tennessee DOT, 2002 Strategic Plan (2002).
78. Texas DOT, Texas Department of Transportation Established Transportation System PerformanceMeasures (undated).
79. Texas DOT, Texas Metropolitan Mobility Plan: Breaking the Gridlock (undated).
80. Texas Transportation Institute and Cambridge Systematics, Inc., Mobility Monitoring ProgramOutline, FHWA Operations Core Business Unit, draft (April 2000).
81. Texas Transportation Institute, Texas Congestion Index Measurement Concept (July 14, 2003).
82. Texas Transportation Institute, Texas Congestion Index: Measurement Concept and Phase 1 Esti-mates (August 15, 2003).
83. Transfund New Zealand, Statement of Service Performance for the Year Ended 30 June 2001 (undated).
84. TransTech Management, Inc., and AASHTO, Strategic Performance Measures for State Depart-ments of Transportation—A Handbook for CEOs and Executives, AASHTO monograph preparedfor NCHRP Project 20-24(20) (June 2003).
85. Turner, Shawn M., Matthew E. Best, and David L. Schrank, Measures of Effectiveness for MajorInvestment Studies, Texas Transportation Institute monograph (November 1996).
86. U.K. Highways Agency, Business Plan 2003–2004 (undated).
87. U.K. Highways Agency, Road User’s Charter 2002–2003 (undated).
88. Vandervalk, Anita, “TRB and Florida Examples,” Panel Discussion: Part 1 of “Selecting Mea-sures, Data Needs, and Analytical Issues,” TRB Conference Proceedings 26: Performance Measuresto Improve Transportation Systems and Agency Operations, Transportation Research Board (2001).
89. Vandervalk-Ostrander, Anita, Rich Margiotta, and Jacob Meunier, Performance Measures forSmall Communities—Final Report to the Federal Highway Administration, FHWA report FHWA-OP-03-080 (May 1, 2003).
90. Washington State DOT, Measures, Markers and Mileposts: The Grey Notebook for the Quarter End-ing December 2002 (February 2003). [Issued quarterly.]
91. Washington State DOT, Transportation Benchmarks Implementation Report (2003).
92. The World Bank Group, Road Sector Performance Indicators for African Countries (March 2000).
93. Wye, Chris, Performance Management: A “Start Where You Are, Use What You Have” Guide, Cen-ter for Improving Government Performance, National Academy of Public Administration(October 2002).
103
Volume I: Research Report

Volume II:
Guide for Performance MeasureIdentification and Target Setting

Contents
Executive Summary.............................................................................................................................. i
1.0 Introduction .................................................................................................................................. 11.1 Background............................................................................................................... 11.2 Using This Document.............................................................................................. 11.3 Document Overview ............................................................................................... 2
2.0 Using Performance Measures for Asset Management ......................................................... 32.1 Definitions................................................................................................................. 32.2 The Benefits of Asset Management ....................................................................... 32.3 The Role of Performance Measures in Asset Management ............................... 42.4 Characteristics of Performance Measures to Support Asset Management ..... 52.5 Designing a Performance Measurement Approach in Support of Asset
Management: Key Considerations ........................................................................ 7
3.0 Framework for Performance Measure Selection and Use.................................................... 113.1 Overview................................................................................................................... 113.2 Identifying Performance Measures ....................................................................... 113.3 Integrating Performance Measures Into the Organization ................................ 203.4 Establishing Performance Targets ......................................................................... 29
Sources.................................................................................................................................................... 37
Appendix A: Performance Measures for Asset Management..................................................... A-1
Appendix B: Example State DOT Performance Targets .............................................................. B-1
Volume II: Guide for Performance Measure Identification and Target Setting

i
Volume II: Guide for Performance Measure Identification and Target Setting
Executive Summary
The objective of NCHRP Project 20-60 was to identify performance measures suitable for asset man-agement and to develop a framework that decision-makers can use for selecting performance mea-sures and setting performance targets. This volume provides a guide for using the performancemeasure selection and target-setting framework that was developed.
This volume begins with an overview of transportation asset management principles and a discus-sion of the implications of these principles for identification and use of performance measures. Froman asset management perspective, performance measures should address key agency goal areas;cover asset condition, service/function, and delivery; and provide a balanced set of perspectives.Implementation of performance measures should consider alignment and integration at differentlevels of the agency for different purposes, support for resource allocation decisions, and supportfor making choices among available options using an objective and unbiased approach.
Based on the analysis of key implications of asset management best practice for performance mea-surement, a framework for performance measure selection and use is presented. This frameworkconsists of step-by-step procedures for three basic activities: (1) identifying performance measuressuitable for asset management, (2) integrating performance measures into the organization, and (3)establishing performance targets. The intent is that guidance for each of these activities can be usedindependently. Guidance for all three activities is designed to be flexible enough for adaptation tovarying agency circumstances.
Guidance for identifying performance measures involves the following steps:
1. Inventory existing measures,
2. Identify gaps to be addressed based on coverage of agency goals and objectives and supportfor the asset management best practices,
3. Define criteria for selecting new measures (the guidance suggests a set of criteria but presumesthat agencies will tailor criteria based on their needs and priorities),
4. Identify additional candidate measures, and
5. Select a set of measures from the list of candidates for further design and implementation.
Guidance for integrating performance measures into an organization involves the following steps:
1. Engage internal and external stakeholders to achieve buy-in;
2. Identify the different decision contexts where performance measures are to be used (project, cor-

ridor, and network levels for short- and long-range decisions) and refine measures so that theyare at the appropriate level of sensitivity;
3. Identify opportunities for using measures that are consistent across different organizationalunits responsible for various asset classes, modes, or work types;
4. Identify needs for additional data collection, data management, and analytical tools to supportthe selected measures;
5. Design communication devices with formats appropriate to the target audiences; and
6. Document measure definitions and procedures.
The guidance for establishing performance targets involves the following steps:
1. Define the context for target setting and establish time horizons,
2. Determine which measures should have targets,
3. Develop long-term goals based on consideration of technical and economic factors,
4. Consider current and future funding availability,
5. Analyze resource allocation scenarios and tradeoffs,
6. Consider policy and public input implications for target setting, and
7. Establish targets and track progress.
The volume ends with a list of performance measures that may be considered for transportationasset management (Appendix A) and examples of performance targets established by a wide rangeof departments of transportation (DOTs) (Appendix B).
ii
Volume II: Guide for Performance Measure Identification and Target Setting

1
Volume II: Guide for Performance Measure Identification and Target Setting
1.0 Introduction
■ 1.1 Background
In November 2002, AASHTO published the Transportation Asset Management Guide (hereafterreferred to as “the Guide”) (1), which describes a set of principles and practices for effective alloca-tion and use of resources to address the preservation, operation, and improvement of transporta-tion infrastructure. A key observation in the Guide is that performance measures play a central rolein “making an asset management approach work in practical terms” (1 pp. 8–18). NCHRP Project20-60, “Performance Measures and Targets for Transportation Asset Management,” was undertakenas a logical next step. This project was initiated in July 2003, with two objectives:
1. To provide an assessment of, and recommendations for, performance measures suitable for anasset management approach that effectively address resource allocation in transportation facil-ity preservation, operation, improvement and expansion; and
2. To develop a framework that decision-makers can use for selecting suitable performance mea-sures and setting performance targets.
This volume addresses the second objective and serves as a guide to the framework developedunder NCHRP Project 20-60.
■ 1.2 Using This Document
This document is directed toward transportation agency staff responsible for implementing orenhancing performance measures in an asset management context. The agency does not need to belabeling this effort as “asset management.” The guidance will be relevant to any agency seeking to:
• Improve the technical basis for resource allocation across and within program areas,
• Ensure consistent approaches to decision making across agency functions,
• Improve capabilities to relate investment decisions to outcomes,
• Establish an improved feedback loop from observed performance to agency action, or
• Improve external accountability for resource allocation decisions.
A step-by-step process is described for identifying performance measures, implementing them withinthe organization, and setting performance targets. Users of this document can refer to Volume I

for more detailed discussion, examples, and substantive guidance for defining and using perfor-mance measures.
For simplicity, the framework is presented as a linear process of identifying performance measures,integrating them into the organization, and establishing performance targets. Some agencies maywish to follow the steps presented in this order. Some may use a different sequence of steps (e.g.,setting the targets in conjunction with selecting measures). Others may use selected sections of thisguide as a source of information or ideas that are relevant to their particular situation at a givenpoint in time.
For example, the study team reviewed draft versions of this guide with three agencies. The firstagency was starting from scratch, working to identify a new set of performance measures in sup-port of a larger asset management initiative. This agency found that Step 1 of the framework, Iden-tify Performance Measures (Section 3.2), provided a useful systematic approach for evaluating alarge set of measures proposed by staff from throughout the organization.
A second agency had already made significant progress in establishing an approach for selectingand organizing measures around its core services. This agency was working to create buy-inthroughout the agency and to make performance-based techniques an integral part of the organi-zation. Step 2 of the framework, Integrate Measures into the Organization (Section 3.3), was highlyrelevant to this situation.
The third agency started with a well-defined set of performance measures that had a long history ofuse within the organization. The agency was working to adjust these measures for use in an assetmanagement context and to set meaningful targets. Step 3 of the framework, Establish PerformanceTargets (Section 3.4), was most relevant to this agency.
■ 1.3 Document Overview
The remainder of this volume consists of two sections:
Section 2.0 discusses the role of performance measures in transportation asset management and theimplications of transportation asset management best practices for the selection and implementa-tion of performance measures.
Section 3.0 presents the framework for selecting performance measures and setting performancetargets.
The appendixes provide performance measures that may be considered for transportation assetmanagement and examples of performance targets established by a wide range of DOTs.
2
Volume II: Guide for Performance Measure Identification and Target Setting

3
Volume II: Guide for Performance Measure Identification and Target Setting
2.0 Using Performance Measures for Asset Management
■ 2.1 Definitions
The Guide defines asset management as “a strategic approach to managing transportation infra-structure” (1 p. G-1). Although transportation officials manage a wide range of assets, the Guidefocuses on the physical infrastructure of the transportation system, such as roads, bridges, andappurtenances.
At the heart of asset management is a performance-based approach to making decisions on how bestto allocate and use resources for managing this infrastructure. The Guide defines resources as inputsinto the infrastructure management process (e.g., human resources, financial capacity, corporateinformation, equipment, and materials).
Performance measurement is a way of monitoring progress toward a result or goal. It is also aprocess of gathering information to make well-informed decisions. Transportation agencies haveused performance measures for many years to help track and forecast the impacts of transportationinvestments, monitor the condition of highway features, and gauge the quality of its services. Gen-eral guidance on transportation performance measures and performance-monitoring concepts isavailable in a wide variety of sources. (Highlights from several of these documents are presented inSection 3.0 of Volume I.) NCHRP Project 20-60 focused on two specific types of measures—(1) trans-portation system performance measures that support resource allocation and (2) program deliv-ery measures that help make the connection between outputs and outcomes.
■ 2.2 The Benefits of Asset Management
As defined in the Guide, the goals of asset management are to:
• “Build, preserve, and operate facilities more cost-effectively with improved performance;
• “Deliver to an agency’s customers the best value for the public tax dollar spent; and
• “Enhance the credibility and accountability of the transportation agency” (1 pp. 1–3).
The principles of asset management can impact nearly every aspect of an agency’s business—policydevelopment, planning, finance, programming, project development, construction, and mainte-nance. Asset management should be viewed as a way of doing business as opposed to a separate

program. It brings a new perspective to how an agency conducts its existing procedures, reachesdecisions, and applies its information technology (IT) capabilities. Asset management suggests prin-ciples and techniques for making better decisions based on better information.
■ 2.3 The Role of Performance Measures in Asset Management
Performance measures represent a critical underpinning of any successful application of trans-portation asset management (hereafter referred to as simply “asset management”). Building on thegeneral asset management framework used throughout the Guide, Figure 1 illustrates that perfor-mance measures and targets are required at several points in an agency’s resource allocation anddelivery process:
4
Volume II: Guide for Performance Measure Identification and Target Setting
Resource Allocation Decisions
Program and Service Delivery
Performance Measures and
Targets… Policy Goals and Objectives
Translate Policy Objectives into Guidance for
Decision Making
Provide a Framework for Evaluating Options to Define the Best Mix of Investments
Within and Between Programs
Help to Define Expectations and
Outcomes for Budget Decisions
Help Track Effectiveness of Program and Service
Project Delivery
Provide a Basis for Monitoring System
Conditions
System Conditions and Service Levels
Funding Levels
Public Input
Financial Staff Equipment Other
Analysis of Options and Tradeoffs
PreservationCapacity Expansion
Operations
Figure 1. Role of Performance Measures and Targets in Asset Management

• As the practical expression of policy objectives that reflect customer expectations and realisticfunding levels;
• As a framework for evaluating options in planning, prioritizing projects in programming, guid-ing tradeoff analyses in resource allocation, and influencing priorities in delivery of projects andservices;
• As a method to provide feedback on the effectiveness of expenditures to decision-makersinvolved in policy formulation and target setting; and
• As the basis for monitoring to obtain indications of system performance over time.
■ 2.4 Characteristics of Performance Measures to Support Asset Management
The following guidelines can be used as a checklist by agencies wishing to assess and improve theiruse of performance measurement in support of asset management best practices. These guidelinesare organized according to key principles of asset management from the Guide.
Principle: There are clear links between policy goals and objectives and decisions at all levels.
1. Performance measures should be selected to cover established goals and objectives.
2. Performance measures should be consistent with the criteria used to make resource allocationdecisions.
Principle: Connections are made between proposed investments and expected results.
3. Predictive models or methods for relating investment levels to future performance should beavailable for each performance measure selected.
4. Performance measures should have appropriate sensitivity to show impacts of decisions aboutresource allocation across program areas, geographic areas, and subnetworks.
Principle: Project selections are linked to an understanding of program-level impacts.
5. Performance measures used for initial resource allocation and program development shouldalso be used to assist in determining program adjustments.
Principle: Project selection and program resource allocation options and tradeoffs are analyzedbased on their technical merits.
6. Performance measures used to guide project selection and resource allocation at the programlevel should include cost-effectiveness and benefit/cost measures, which (where feasible andappropriate) incorporate user costs or benefits.
5
Volume II: Guide for Performance Measure Identification and Target Setting

Principle: A long-term view of asset performance is held.
7. Performance measures used to evaluate investment tradeoffs should reflect life-cycle benefitsand costs, not just immediate impacts.
8. Performance monitoring needs to include tracking of asset condition over time at a sufficientlevel of detail and rigor to support development of performance curves. This is needed to pro-vide the basis for credible prediction tools that analyze investments versus performance.
Principle: Decisions are supported by good information.
9. Performance measures should describe not only physical asset condition but also how assetsare serving their intended functions with respect to comfort, convenience, safety, and service.
10. Monitoring of outcome- and output-oriented performance measures needs to be accompaniedby tracking of actual activity costs in order to provide the basis for credible prediction toolsthat analyze investments versus performance.
11. Performance measures should be selected with consideration of the cost of data collection andavailable methods for maximizing efficiencies.
12. Performance measures are needed that can serve as the basis for target setting with respect towhat various programs will accomplish. Because actual monitored performance may dependon factors other than agency actions, the target setting and monitoring processes must accountfor the fact that many performance measures reflect not only results of actions taken by anagency, but external factors as well (e.g., traffic volumes and environmental conditions).
Principle: There is a feedback loop from observed performance into planning and programmingdecisions.
13. Performance measures should be useful for signaling when changes to strategies and priori-ties are warranted—in long-range plan updates and in development of capital, maintenance,and operations program budgets.
Principle: Decisions at different levels of the organization are made based on consistent criteriaand data.
14. Performance measures reflecting asset condition and performance should be used consistentlyacross different functional units and at different levels of the organization. This implies thatperformance measures should be amenable to “roll-up” and “drill-down” capabilities to allowthem to be viewed at systemwide, district, corridor, subarea, subnetwork, or location-specificlevels. This roll-up capability may include the need to calculate summary statistics (e.g., “per-cent poor lane-miles”) from more detailed, location-specific condition measurements.
Principle: Clear accountability is provided.
15. To the maximum extent possible, performance measures should be understandable and mean-ingful to political leaders and the general public.
6
Volume II: Guide for Performance Measure Identification and Target Setting

■ 2.5 Designing a Performance Measurement Approach inSupport of Asset Management: Key Considerations
The guidelines listed above can be used to address the following questions:
• Content and Scope—Is our current set of performance measures sufficiently broad and inclu-sive to cover important goal areas and perspectives?
• Integration and Alignment—Do we have measures that are suitable for use at different levelsof our organization, and are these measures sufficiently integrated and aligned to ensure con-sistency across units and efficiency in use of performance data?
• Support for Making Choices—Do we have measures that help us make choices among optionsfor addressing transportation needs using an objective and unbiased approach?
• Support for Resource Allocation—Do we have measures that we can use for performance-basedresource allocation and target-setting?
Each of these questions is discussed below.
Content and Scope
Performance measures are needed that:
• Cover key policy goals and objectives, including asset preservation, service to transportation sys-tem users, and (to the extent possible) broader economic, social, and environmental concerns;
• Reflect physical asset condition, the extent to which transportation facilities are serving theirintended functions, and the ways in which customers perceive and value the services that arebeing provided;
• Provide a long-term, facility life-cycle view in order to assist with evaluation of preservationstrategies and capital versus maintenance tradeoffs (e.g., a recently resurfaced and very smoothpavement may actually be at the end of its useful life from a structural point of view; therefore,measures of structural condition, remaining life, or value provide a more long-term perspectivethan roughness); and
• Track program delivery quality, schedule, and budget adherence.
Figure 2 illustrates a structure for assessing the coverage of performance measures in an agency.Columns indicate that performance measures should be in place to cover asset condition; asset ser-vice and function; and the delivery of projects and services to operate, preserve, and improve assets.Rows indicate the different views to be reflected by performance measures. The agency viewincludes measures required for good stewardship of the transportation system—indicators of con-dition, status, critical deficiencies, and needs. These agency measures are defined with considera-tion of both the customer view and the societal view. The customer view reflects what transportation
7
Volume II: Guide for Performance Measure Identification and Target Setting

system users experience as a result of asset condition and service levels and delivery of projects andservices. The societal view reflects broader economic, social, and environmental impacts that arealso impacted by asset condition, service, and delivery. These measures can vary widely, but shouldbe well-aligned with established agency policy goals and objectives.
Integration and Alignment
Effective use of performance measures requires that the measures be tailored to the specific decisioncontexts within which they will be used. Performance measures must be suitable for use by differentaudiences (i.e., external customers and stakeholders, political leaders, agency executives and linemanagers, and agency technical staff) and for different types of decisions (i.e., long-, medium-, andshort-term; systemwide, corridor/subarea, and location-specific). Integration of performance mea-sures within the organization involves tailoring measures for different decision contexts while at thesame time ensuring consistency across different levels.
For any given policy area (e.g., pavement preservation), there is typically a large set of measuresrequired for use at low levels of the organization (e.g., rut depth, roughness, and cracking). This canbe translated into a small set of measures required by managers for making resource allocation deci-sions (e.g., percent poor pavements or percent remaining value). There is also typically a need to“roll up” location-specific measures for use at corridor, district/regional, subnetwork, and sys-temwide levels. Ideally, related measures that are required for different purposes can be derivedfrom a relatively focused set of monitored or predicted data items and nested together to ensure ver-tical consistency. In this way, even though each part of the organization may be looking at a differ-ent technical form of the measure, they all get a consistent picture based on the same underlyingdata, and the overall performance-monitoring costs are kept to a minimum. The overall performance
8
Volume II: Guide for Performance Measure Identification and Target Setting
• Economic Health
• Security
• Environmental Quality
• Equity
Societal View
• Accessibility, Travel Time and Cost, Delay, Reliability, Safety, Comfort, Convenience
• Perception/Understanding/Satisfaction/ValueCustomer
View
• Quality
• Efficiency
• Activity Costs
• Accomplishments
• Schedule and Budget Adherence
• Use of Resources
• Deficiencies
• Efficiency
• Effectiveness
• Benefit-Cost
• Improvement Need/Backlog
• System Health
• Physical Condition
• Remaining Life
• Remaining Value
• Preservation Need/Cost
Agency View
DeliveryAsset Service and
FunctionAsset Condition
Figure 2. Scope and Coverage of Performance Measures for Asset Management

measurement and monitoring program should be designed to maximize efficiencies and provideneeded support information.
Support for Evaluation of Options and Priority Setting
Asset management best practice implies use of performance measures for evaluation of differentoptions for meeting objectives and for prioritization of alternative investments. This kind of analy-sis can take place in the context of a long-range planning effort, a corridor or regional study, a pro-ject development process, or a development process for a capital or maintenance program. Perfor-mance measures should be used to make the following types of tradeoff decisions:
• Alternative preservation strategies—for example, spending more on preventive maintenance atthe right time in a facility’s life cycle to increase asset life and minimize life-cycle costs. This deci-sion implies the need for predicting values of performance measures over the asset life cycle andselecting performance measures that capture the structural capacity, remaining life, or value of theasset, in addition to performance measures that reflect the current level of service to the customer.
• Operational versus capacity options—for example, intelligent transportation systems (ITS)investment versus capacity expansion. This decision implies the need for performance measuresthat focus on travel time, delay, and reliability.
• Modal options—for example, rail versus highway options for improving freight mobility. Thisdecision implies the need for mode-neutral measures focusing on end-to-end shipment cost,time, and reliability.
• Delivery options—for example, packaging multiple projects together within a corridor versustiming work based on other factors. This decision implies performance measures that considerwork zone costs associated with alternative delivery schemes.
In several of these contexts, economic measures (benefit/cost or cost-effectiveness) are appropriateand useful.
Support for Resource Allocation Tradeoff Analysis and Targets
Performance measures must be suitable for use within a resource allocation tradeoff process involv-ing (1) understanding the current or baseline value of the performance measures, (2) projecting howthe values of the measures would change under different investment scenarios (i.e., different allo-cations of a given budget across program categories), and (3) setting performance targets that reflecta realistic and balanced allocation of resources that best meets established objectives. Although truetradeoff analysis requires all three of these items, accurate trend information based on multiplecycles of condition assessments (item 1 above) can greatly improve resource allocation while the sys-tem capabilities required for items 2 and 3 are being developed.
Support for tradeoffs implies that a clear causal link can be established between an allocation ofresources and the observed value of a performance measure and that, for any given allocation of
9
Volume II: Guide for Performance Measure Identification and Target Setting

resources, the resulting value of the performance measure can be credibly forecast. Many perfor-mance measures are impacted by a variety of factors outside of a particular agency’s control. Forexample, congestion levels depend not only on an agency’s investment to widen roads and improveoperations, but also on factors such as overall growth patterns, individual driving patterns, andgasoline prices. Therefore, there is often a need to base performance tradeoff analysis on simulatedresults from analytical tools. Such tools can be used to explore the likely performance impacts of aset of transportation investments under different assumptions about exogenous factors.
Tools and techniques for producing forecasts of performance for a given investment level dependon having good predictive methods that are based on credible data. Therefore, ongoing tracking ofasset condition over time (to support deterioration modeling), actual work activity costs (to sup-port cost modeling), impacts of implemented strategies, and other factors affecting performance(e.g., traffic trends) are important elements of an overall performance measurement program forasset management. When it is not possible to track outcomes (due to expense or difficulty of obtain-ing this information in a timely enough fashion to support decision making), output-oriented per-formance measures can be used as proxies for the outcomes of interest. A mix of output- and outcome-oriented measures can provide useful feedback for both short- and long-range decision making.
The next section of this guide presents a step-by-step process for selecting performance measuresbased on the considerations discussed above and using them to make well-informed resource allo-cation decisions.
10
Volume II: Guide for Performance Measure Identification and Target Setting

11
Volume II: Guide for Performance Measure Identification and Target Setting
3.0 Framework for PerformanceMeasure Selection and Use
■ 3.1 Overview
This framework for selecting and applying performance measures recognizes that each agency willhave a different set of circumstances and needs. Some agencies may already have a solid set of per-formance measures in place and are looking to refine measures in a few specific areas. Other agen-cies may have a large set of measures in place across different units that are not well coordinated orintegrated and are looking to rationalize or streamline the measures in use. Still others may want tostart from scratch and identify a complete new set of performance measures for use in their agency.The framework also acknowledges that an agency’s performance measurement efforts will likelyevolve over time in response to lessons learned. In some cases, targets will be adjusted to accountfor new circumstances; in others, the measures themselves may be modified or completely replacedas new data, system capabilities, and business processes evolve.
The framework is organized into three sections, as shown in Figure 3, which can be used indepen-dently. Section 3.2 provides guidance for identifying performance measures that are in place, identi-fying gaps, and considering new measures. Section 3.3 provides guidance for integrating performancemeasures into the organization, including how to design related measures that can be used at differ-ent levels and for different purposes. Section 3.4 provides guidance for establishing performancetargets within a resource allocation process.
■ 3.2 Identifying Performance Measures
Hundreds of possible performance measures can be useful for asset management, and no single setof measures will work well in every situation. The challenge is to identify a manageable set that canbe effectively implemented and used within a given organization.
Step 1: Inventory Existing Measures
Most agencies have a set of existing performance measures that provide a base from which to begin.A recommended first step is to take an inventory of these measures and create a table, such as theone shown in Table 1. This approach can identify existing measures that are currently not used orthat have issues that impede full implementation. Eliminating these measures can free up resourcesthat can be used for implementation of more useful measures.

TailorMeasures to
Decisions
Design consistentMeasures AcrossProgram Areas
IdentifyImprovements toData and Tools
DesignCommunication
Devices
EngageStakeholders
DocumentDefinitions and
Procedures
InventoryExisting
Measures
ConsiderPolicy and
Public Input
Assess and Select Measuresfor Further Design and
Implementation
DefineContextsand TimeHorizons
Select Scopeof Measuresfor Targets
DevelopLong-Term
Goals
ConsiderFunding
Availability
AnalyzeResource
AllocationScenarios
and Tradeoffs
EstablishTargets and
TrackProgress
AssessGaps
DefineSelectionCriteria
Identify CandidateMeasures/Adjustments
to Existing Measures
Identify Performance MeasuresIdentify Performance Measures
Integrate Performance Measures into the OrganizationIntegrate Performance Measures into the Organization
Establish Performace TargetsEstablish Performace Targets
Figure 3. Guidance for Performance Measures and Targets

Step 2: Assess Gaps
The next step is to decide on the scope of your efforts by conducting a gap analysis of your agency’sexisting measures. Gaps in performance measurement to be addressed include (1) gaps in coverageof key policy goals or result areas, (2) gaps in use of performance measures to guide resource allo-cation, and (3) gaps in alignment of performance measures both vertically and horizontally withinthe agency. Even though measures in some areas may be defined and used to some extent for report-ing, it is important to see where there may be disconnects between (1) information gathered andreported for a particular policy objective and (2) the resource allocation decisions that are made thatimpact achievement of that objective. For example, in Table 1, one might ask if congested vehicle-miles traveled (VMT) is used to help determine priorities for corridor improvements or to supportdecisions on allocation of funds across different operational program areas. It is also important toassess the need for greater horizontal and vertical alignment across measures. Improved horizontalalignment may be needed when existing measures do not adequately support tradeoffs across assetclasses, geographic areas, and/or investment types. Improved vertical alignment may be neededwhen there are inconsistencies in measures used to make decisions related to a given policy objec-tive. For example, if an agency uses pavement smoothness targets as the basis for setting the pave-ment preservation budget level, but then uses structural condition as the basis for identification andprioritization of projects, this reflects a lack of vertical alignment.
A logical way to assess gaps in coverage of performance measures is to review your performancemeasure inventory against your agency’s stated goals and objectives to see where there may be gapsor areas where existing measures need to be improved. Figure 2 may also be helpful in determiningareas where additional measures are needed. The following list of questions can be used as a guidein assessing gaps in performance measures:
• Given your agency’s goals and objectives, what are the most important outcomes to be achieved?Do your existing performance measures adequately cover these outcome areas?
13
Volume II: Guide for Performance Measure Identification and Target Setting
Measure
Percent good pavement
External reporting
District performance targets
Stable and well-accepted
Crash rate
Project prioritization
Only includes serious crashes
Travel rate index center
Internal reporting
Congested VMT center
Internal reporting
Asset value
External performance reporting
Need to improve basis for calculations
External reporting
GASB 34 reporting
Urban freeways only
Urban freeways only
Materials section
Safety office
Traffic management
Traffic management
Finance office
Owner How Used Comments/Issues
Table 1. Performance Measure InventoryExample Format

• Do you currently track the condition of all of your major assets?
• Do you have measures related to the level of service or function provided by these assets?
• Do you have measures that reflect customer perspectives?
• Do your performance measures align with national guidance, statewide priorities, governor’sinitiatives, and so forth?
• Are your performance measures aligned internally?
• Are you tracking program delivery in order to monitor accomplishments and identify whereagency and user costs can be reduced?
• Do your performance measures adhere to federal highway legislation governing long-rangeplanning and capital programming (Title 23 U.S.C. Sections 134 and 135)?:
– Do your performance measures capture the impacts of preservation, management, and oper-ations activities carried out by your agency?
– Do you have performance measures that are applicable to both long-range planning and transportation improvement program/state transportation improvement program(TIP/STIP) development?
– Do you have mode-neutral measures that can be used to evaluate modal alternatives toaddress transportation needs?
– Do you have measures that capture transportation’s broad range of impacts on society,including safety and security, economic development, productivity and competitiveness,accessibility and mobility options for passengers and freight, fuel efficiency, environmentalprotection, and improved quality of life?
There may be too many gaps to address at once. Some gaps may be fundamentally difficult to fill,given the lack of reasonable measures for some types of policy objectives, programs, and functionsor constraints on data collection resources. In deciding where to focus, you will want to considerwhere additional performance measures will have the greatest impact on your agency’s ability tomake better resource allocation decisions, gain public confidence, and secure needed resources.
Step 3: Define Selection Criteria
There are many factors to consider in selecting performance measures for asset management. It istherefore helpful to explicitly define selection criteria that are important to your agency and followa systematic evaluation process in which candidate performance measures are assessed based onthese criteria. Most agencies find that they need to periodically change performance measures inorder to respond to changes in leadership and policy. Having documentation that shows both thealternative measures that were considered and the basis for choosing current measures can providea valuable resource for addressing future questions about why the measures were selected and forinvestigating future changes to measures.
Not all selection criteria are applicable to all measures. Selection criteria should reflect the intendedpurpose, use, and audience for the performance measure. A performance measure to be used for
14
Volume II: Guide for Performance Measure Identification and Target Setting
tracking agencywide progress toward targets needs to meet different criteria than one used to helpprioritize locations for pavement work. A measure to be used to evaluate the progress of a highwaydivision’s ITS program in alleviating congestion does not need to meet criteria for mode neutrality,whereas a measure used to evaluate agencywide efforts to improve mobility likely would.
The following criteria can be used to assess whether a given performance measure is a good candi-date for implementation. You may wish to add other criteria based on your agency’s particularneeds and history. You may also want to ignore criteria that are not relevant given the intended pur-pose of the performance measures.
Criterion 1: Feasible
• Data Requirements. Does the measure have realistic and feasible data requirements? Does theagency currently have the data required for a particular measure?
• Data Quality and Accuracy. Can sufficient data quality, reliability, and accuracy be ensured toprovide credible and usable information?
• Cost Versus Value Added. Would the benefits of having this measure available for decisionmaking outweigh the cost of collecting the data required for it?
Criterion 2: Policy Sensitive
• Reflects Policies. Can the measure be easily related to the agency’s stated policy objectives? Doesit provide a good measure of whether the outcomes intended by the policies are occurring?
• Meaningful. Does the measure convey meaningful information to decision-makers about thetransportation system?
Criterion 3: Supports Long-Term, Strategic View
• Trend Information. Are a baseline value and quality trend information available for this mea-sure? If not, is long-term tracking of trends feasible?
• Forecasts. Are reasonable and defendable methods available to forecast the future value of thismeasure (i.e., how the value of the measure would change in the absence of actions taken by theagency)?
• Life-Cycle Analysis. Is this measure suitable for incorporation into an analysis comparing long-term investment alternatives based on life-cycle costs and benefits?
Criterion 4: Useful for Decision Support
• Feedback. Does the measure provide information that enables managers to understand prob-lems and suggest solutions?
• Responsiveness. Can the measure be tracked and reported in a timely enough fashion to sup-port the needs of decision-makers? (For measures to be used by operational managers, real-timemonitoring may be required.)
15
Volume II: Guide for Performance Measure Identification and Target Setting

• Sensitivity. Is the measure sufficiently sensitive to reflect impacts of agency actions given thelevels at which it will be applied (e.g., network, corridor, and project level and for short-,medium-, and long-range decision making)?
• Linkage to Actions. Are there methods available to predict how the value of this measure wouldchange as a result of:
– A specific project or budget line item (e.g., an intersection improvement project or purchaseof 10 new maintenance trucks)?
– Implementation of a program of defined projects (e.g., capital projects in the STIP)?
– Allocation of a given budget level to a specific program area (e.g., $10 million per year overthe next 5 years to pavement preservation)?
• Scenario Testing. Is this measure amenable to “what-if” analysis, in which the performanceimplications of multiple budget scenarios are estimated? Can predictions be automated so thatwhat-if testing is not overly time consuming?
• Neutrality. Is the measure sufficiently neutral to allow for evaluation of the impacts of a widerange of possible agency investments or actions (e.g., highway versus transit improvements toimprove mobility)? (This question will not be relevant for measures that are used to track per-formance for a particular mode or asset class.)
• Agency Influence. Can this measure be used to help distinguish changes in transportation sys-tem performance that have occurred due to your agency’s actions from changes that haveoccurred due to factors not under your agency’s control?
Criterion 5: Useful Across the Organization and Beyond
• Ease of Understanding. Can this measure be easily understood and interpreted by its intendedaudiences at technical, management, and executive levels of the organization and by outsidestakeholders?
• Vertical Alignment. Can this measure function as part of a family of measures that can be usedto describe performance at different levels of aggregation (e.g., corridor, district, and system), fordifferent time horizons, and for different audiences? Is it consistent with other measures in use?
• Horizontal Alignment. Can this measure be used by multiple horizontal units of the organiza-tion (e.g., across units that manage different classes of assets and/or modes) in order to promoteconsistency in performance measurement and to facilitate investment tradeoffs across areas?
• Cross-Jurisdictional. Can this measure be used at a broad level outside of the organization acrossother jurisdictions in order to enable a consistent regional or statewide view of performance?
Step 4: Identify Candidate Measures/Adjustments to Existing Measures
Appendix A provides a list of performance measures that can be of value for asset management.Performance measures for consideration are organized by goal area: preservation, mobility and
16
Volume II: Guide for Performance Measure Identification and Target Setting

accessibility, operations and maintenance, safety, economic development, environmental impacts,social impacts, and security. A list of delivery-oriented measures is also included at the end. Eventhough there are many performance measures listed, this is not intended to be a comprehensive set.There are a number of other references to consult for additional ideas—see the bibliography at theend of Volume I.
Table 2 provides a sample format for organizing the measures that you select according to theirintended uses and audiences.
17
Volume II: Guide for Performance Measure Identification and Target Setting
Policy Objective/Performance Measure Stra
tegi
c Pl
anni
ng
Lon
g-R
ange
Pla
nnin
g
Cor
rid
or P
lann
ing
Perf
orm
ance
-Bas
ed B
udge
ting
Proj
ect P
rior
itiz
atio
n
Dai
ly O
pera
tion
s/M
anag
emen
t
Del
iver
y
Ann
ual r
epor
ting
SYSTEM PRESERVATION
a Percent Poor Pavements
b Average Bridge Health Index
c Remaining Value
d Backlog
e Customer Ratings
MOBILITY/ACCESSIBILITY
a Travel Time Index (Urban Freeways)
b Annual Change in Travel Time Between Major Cities
c Percent Population Within 10 Minutes of a State Highway
d Time from End of Snow Event to Bare Pavement
e Backlog—System Completion
SAFETY
a Serious Crashes/Million VMT
b Number of Fatalities
c Backlog—Economically Justified Safety Improvements
Table 2. Performance Measures: Uses and AudiencesExample Format

This classification will be of value for evaluating the measures in Step 5. Categories in the chart areas follows:
• Strategic Planning—Describing organizational objectives and establishing annual performancetargets for the agency’s strategic business plan.
• Long-Range Planning—Characterizing current systemwide or subnetwork performance,defining long-term system condition and service objectives, analyzing the impacts of differ-ent investment levels or strategies, and estimating investment needs associated with alter-native performance levels.
• Corridor Planning—Defining condition and service objectives for specific corridors and evalu-ating alternatives for corridor improvements.
• Performance-Based Budgeting—Allocating dollars to program areas in a performance-basedbudgeting process.
• Project Prioritization—Prioritizing and selecting projects for programming.
• Daily Operations/Management—Short-term and real-time decisions by operations and main-tenance program managers with respect to work prioritization and resource allocation acrosscompeting needs to maximize effectiveness.
• Delivery—Assessment of program and project delivery progress and effectiveness and evalua-tion of alternative delivery methods.
• Annual Reporting—Annual system performance reporting for establishing accountability anddemonstrating good stewardship to external stakeholders and to the public at large and/or forinforming transportation policy decisions considered by the agency management team andelected officials.
Note that some measures will fit in several of these categories. For example, the remaining value ofassets can be useful for high-level, strategic, and long-range planning decisions to make the case foradditional investment. It can also be used at a corridor level as part of a study of future corridor devel-opment and management options in order to characterize future preservation needs. In a programdevelopment context, budget amounts for different categories of assets or for different geographicareas might be influenced by looking at the relative remaining value. Similarly, prioritization of reha-bilitation projects within a given program area might also be based on looking at the remaining valuefor candidate projects.
At this point in the process, do not be too concerned about the specific functional form of the per-formance measure—this can be refined later using the process described in Section 3.3.
Step 5: Assess and Select Measures for Further Design and Implementation
Once your criteria are established, you can develop a format such as the one shown in Table 3 toassess each candidate measure. The table rates a variety of measures using the criteria described inStep 3. (Note that the table is meant as an illustrative example and that the ratings may vary based
18
Volume II: Guide for Performance Measure Identification and Target Setting
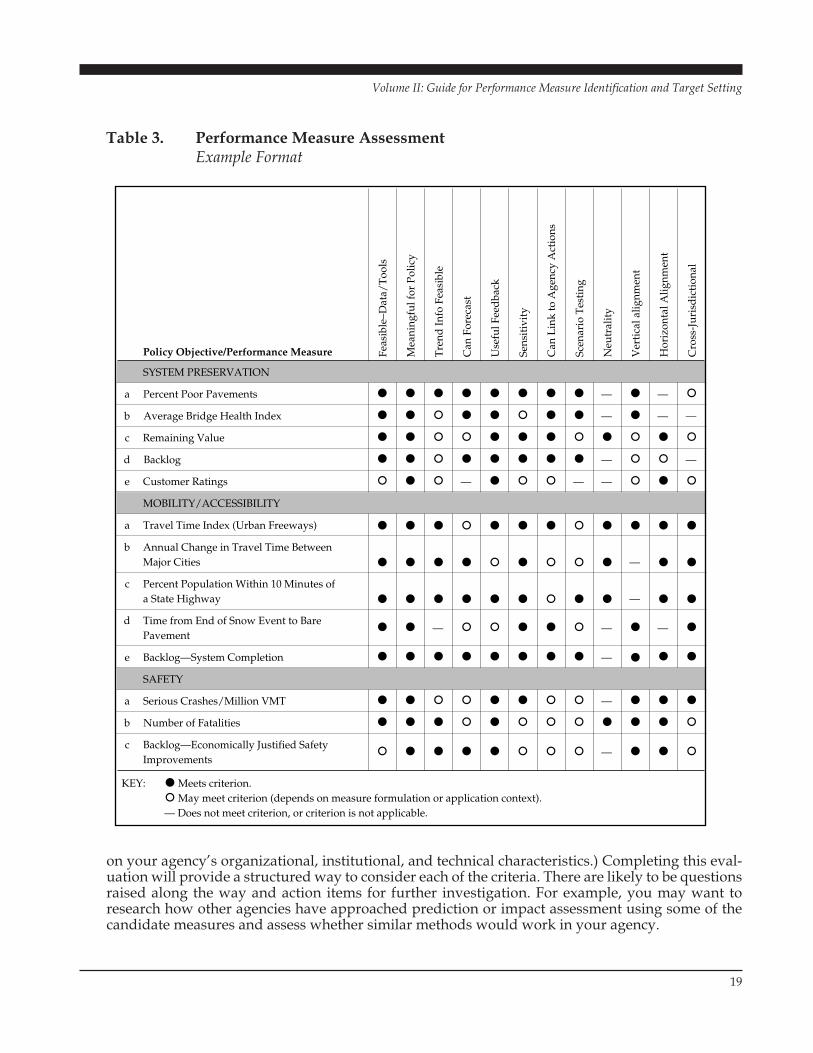
on your agency’s organizational, institutional, and technical characteristics.) Completing this eval-uation will provide a structured way to consider each of the criteria. There are likely to be questionsraised along the way and action items for further investigation. For example, you may want toresearch how other agencies have approached prediction or impact assessment using some of thecandidate measures and assess whether similar methods would work in your agency.
19
Volume II: Guide for Performance Measure Identification and Target Setting
Policy Objective/Performance Measure Feas
ible
–Dat
a/T
ools
Mea
ning
ful f
or P
olic
y
Tre
nd In
fo F
easi
ble
Can
For
ecas
t
Use
ful F
eed
back
Sens
itiv
ity
Can
Lin
k to
Age
ncy
Act
ions
Scen
ario
Tes
ting
Neu
tral
ity
Ver
tica
l alig
nmen
t
Hor
izon
tal A
lignm
ent
Cro
ss-J
uris
dic
tion
al
1 SYSTEM PRESERVATION
a Percent Poor Pavements — —
b Average Bridge Health Index — —
c Remaining Value
d Backlog — —
e Customer Ratings — —
2 MOBILITY/ACCESSIBILITY
a Travel Time Index (Urban Freeways)
b Annual Change in Travel Time Between Major Cities —
c Percent Population Within 10 Minutes of a State Highway —
d Time from End of Snow Event to Bare Pavement
— — —
e Backlog—System Completion —
3 SAFETY
a Serious Crashes/Million VMT —
b Number of Fatalities
c Backlog—Economically Justified Safety Improvements
—
KEY: Meets criterion. May meet criterion (depends on measure formulation or application context).
— Does not meet criterion, or criterion is not applicable.
—
—
Table 3. Performance Measure AssessmentExample Format
Table 3 can also be used as an initial screen to filter out potential measures that may not be feasibleor meaningful from an asset management perspective. This formal evaluation approach can saveyou time by enabling you to focus on measures that are most promising.
It may also be helpful to complete the evaluation as a group process or to give the evaluation to afew different individuals and then get together to compare and discuss the results. This will allowfor a broader set of concerns to be raised and will provide a larger base of knowledge to draw uponthat is relevant to understanding whether a given measure would function well.
Based on the results of your evaluation, you can narrow down the set of candidate measures to thosethat you want to move forward with. It is important at this point to clearly document the definitionsof each measure so that everyone understands what is being measured and how it is to be calcu-lated and reported.
In the next section, you will take these measures and look more closely at where and how they will beused in your organization. This activity will likely result in further refinement to the set of measures.
■ 3.3 Integrating Performance Measures into the Organization
In the previous section, individual performance measures were evaluated and selected to fill gapsin coverage and decision support needs. This section takes a more detailed look at how to integratea set of performance measures into the organization.
Step 1: Engage Stakeholders
Necessary ingredients for a successful performance measurement implementation are:
• Top management support and leadership,
• Stakeholder buy-in and commitment to use the measures,
• Integration of performance measures into existing business processes and decision-makingforums, and
• Clear ownership and responsibility for each measure and associated data and tools.
These ingredients need to be considered during the process of performance measure selection. It isimportant to have active support from people who will be receiving performance measure reportsand who will be asked to make decisions in response to these measures and be accountable for results.It is also important to have buy-in from people whose cooperation or resources are needed to gatheror summarize measures. Stakeholders should be involved early on in the performance measuredevelopment process. Although stakeholders should be given the opportunity to participate in allstages of performance measure identification, evaluation, and implementation, it is important tomake sure that the overall implementation moves forward at a reasonable pace. A strong leader for
20
Volume II: Guide for Performance Measure Identification and Target Setting

the performance management effort is essential for ensuring that the effort does not become stalledor overwhelmed with the need to address too many issues at one time. The right balance of stake-holder involvement will maximize the chances that the resulting measures will be used to improvedecision making and help ensure that they are implemented in a timely fashion.
Depending on the types of performance measures being implemented, stakeholders may all bewithin a single agency, or they may be in several different agencies—for example, a state DOT andthe state’s metropolitan planning organizations (MPOs) (in the case of congestion measures) and astate DOT, Governors Highway Safety Office, state police, and local jurisdictions (in the case ofsafety measures). When stakeholders are dispersed across multiple agencies, extra effort should beanticipated to allow for sufficient communication to achieve buy-in.
Some additional guidelines for working with stakeholders and designing performance measures toachieve buy-in are the following:
• Emphasize the use of performance measures as a means to improve system performance andquality, not as a report card or judgment on productivity or effectiveness.
• Keep the measures focused on the strategic goals and related to the activities of the agencies.
• Keep the measures focused on the customer.
• When multiple agencies are involved and consistency in performance measures can be achieved,work toward identifying mutual interests.
• Depending on the situation, use judgment to determine whether it is best to keep the number ofmeasures limited (to keep things simple and facilitate consensus) or pursue an expanded set ofmeasures that represents the interests and needs of a diverse set of stakeholders.
Step 2: Tailor Measures to Decisions
The purpose of this step is to examine your candidate performance measures in the context ofdecision-making processes in your agency and to design appropriate forms of the measures that areresponsive to the different types and levels of decisions. The more specific you are in thinkingthrough the activities where performance measures would be used, and the units of your organiza-tion that would use them, the better.
The activities defined in Section 3.2, Step 4 (and shown in the columns of Table 2) can provide a goodstarting point for identifying the various decision contexts within which performance measures areto be used. These decision contexts vary by geographic scope (network, corridor, site, or project) andtimeframe (from immediate or real time to a 20-year horizon).
Some categories of performance measures will be applicable to multiple geographic scopes andtimeframes—for example, there is a need to track pavement preservation at the project, corridor,subnetwork, and statewide levels; and this information is valuable for short-, medium-, and long-range decisions. Where this is the case, it is important to ensure that performance measures are con-sistent across different levels and timeframes—for example, the performance measures and targetsestablished in the agency’s long-range plan should be consistent with the performance criteria usedto prioritize projects or activities for the program. This does not mean, however, that the specific
21
Volume II: Guide for Performance Measure Identification and Target Setting
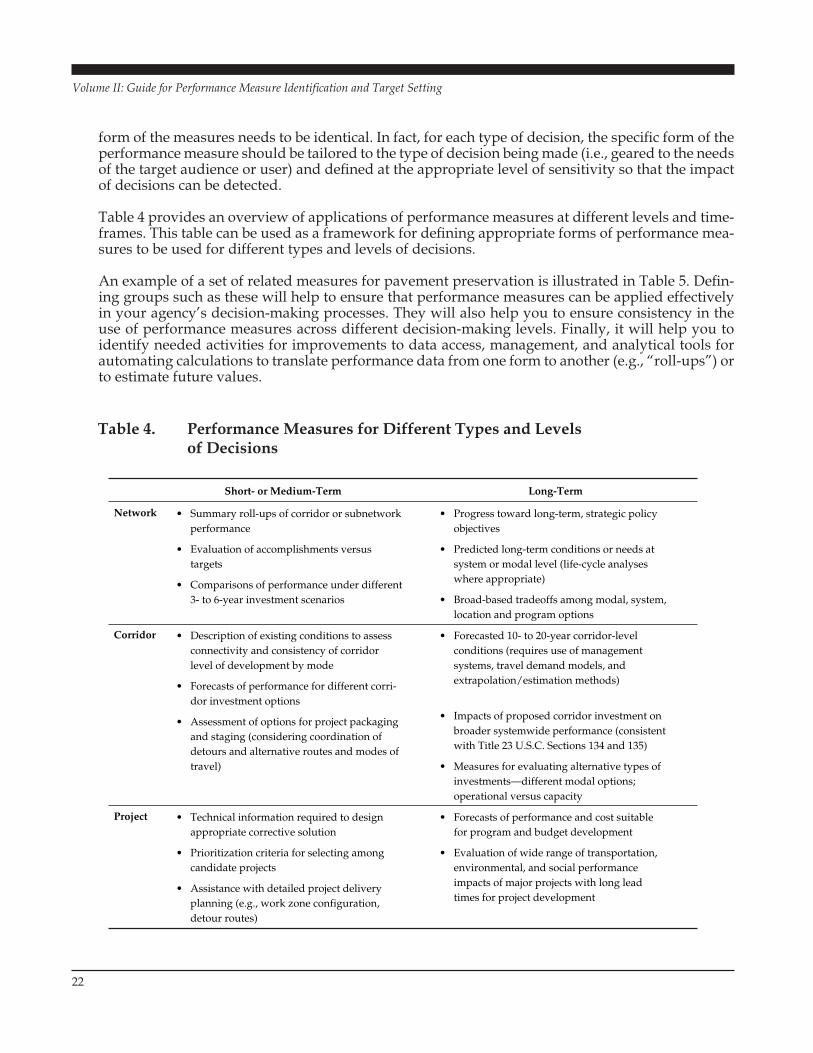
form of the measures needs to be identical. In fact, for each type of decision, the specific form of theperformance measure should be tailored to the type of decision being made (i.e., geared to the needsof the target audience or user) and defined at the appropriate level of sensitivity so that the impactof decisions can be detected.
Table 4 provides an overview of applications of performance measures at different levels and time-frames. This table can be used as a framework for defining appropriate forms of performance mea-sures to be used for different types and levels of decisions.
An example of a set of related measures for pavement preservation is illustrated in Table 5. Defin-ing groups such as these will help to ensure that performance measures can be applied effectivelyin your agency’s decision-making processes. They will also help you to ensure consistency in theuse of performance measures across different decision-making levels. Finally, it will help you toidentify needed activities for improvements to data access, management, and analytical tools forautomating calculations to translate performance data from one form to another (e.g., “roll-ups”) orto estimate future values.
22
Volume II: Guide for Performance Measure Identification and Target Setting
Short- or Medium-Term
• Network Summary roll-ups of corridor or subnetwork performance
• Evaluation of accomplishments versus targets
• Comparisons of performance under different 3- to 6-year investment scenarios
• Progress toward long-term, strategic policy objectives
• Predicted long-term conditions or needs at system or modal level (life-cycle analyses where appropriate)
• Broad-based tradeoffs among modal, system, location and program options
Corridor • Description of existing conditions to assess connectivity and consistency of corridor level of development by mode
• Forecasts of performance for different corri-dor investment options
• Assessment of options for project packaging and staging (considering coordination of detours and alternative routes and modes of travel)
• Forecasted 10- to 20-year corridor-level conditions (requires use of management systems, travel demand models, and extrapolation/estimation methods)
• Impacts of proposed corridor investment on broader systemwide performance (consistent with Title 23 U.S.C. Sections 134 and 135)
• Measures for evaluating alternative types of investments—different modal options; operational versus capacity
Project • Technical information required to design appropriate corrective solution
• Prioritization criteria for selecting among candidate projects
• Assistance with detailed project delivery planning (e.g., work zone configuration, detour routes)
• Forecasts of performance and cost suitable for program and budget development
• Evaluation of wide range of transportation, environmental, and social performance impacts of major projects with long lead times for project development
Long-Term
Table 4. Performance Measures for Different Types and Levels of Decisions
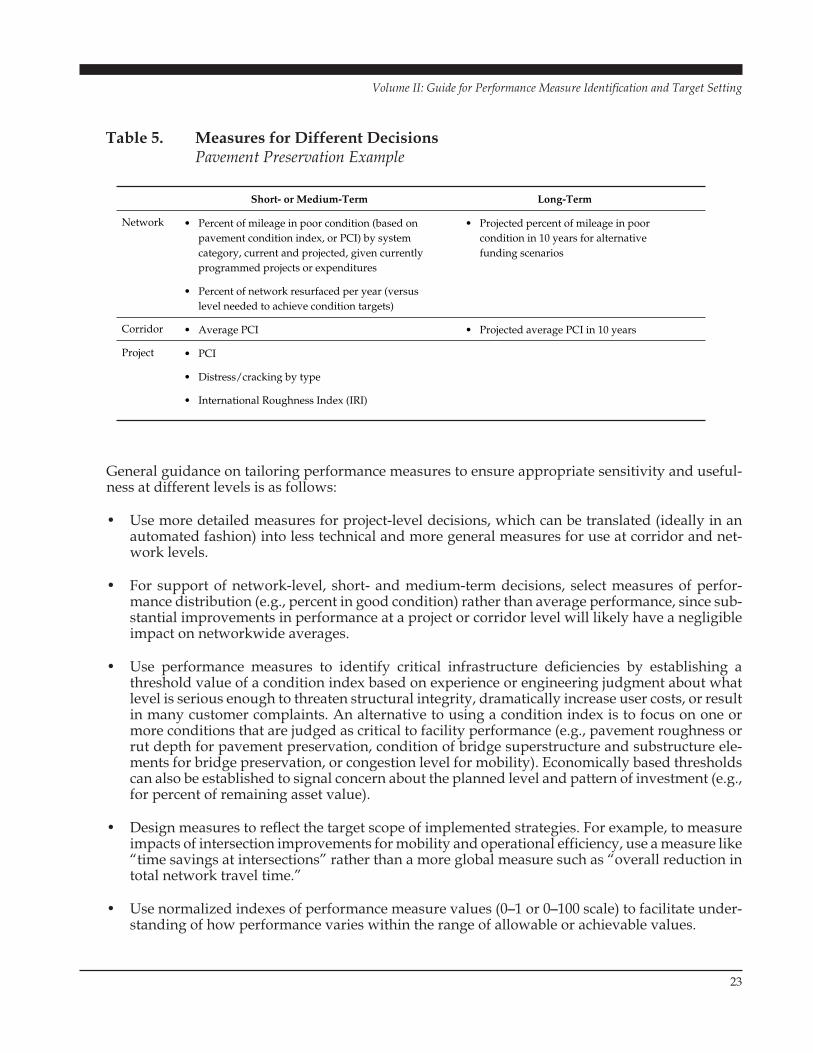
General guidance on tailoring performance measures to ensure appropriate sensitivity and useful-ness at different levels is as follows:
• Use more detailed measures for project-level decisions, which can be translated (ideally in anautomated fashion) into less technical and more general measures for use at corridor and net-work levels.
• For support of network-level, short- and medium-term decisions, select measures of perfor-mance distribution (e.g., percent in good condition) rather than average performance, since sub-stantial improvements in performance at a project or corridor level will likely have a negligibleimpact on networkwide averages.
• Use performance measures to identify critical infrastructure deficiencies by establishing athreshold value of a condition index based on experience or engineering judgment about whatlevel is serious enough to threaten structural integrity, dramatically increase user costs, or resultin many customer complaints. An alternative to using a condition index is to focus on one ormore conditions that are judged as critical to facility performance (e.g., pavement roughness orrut depth for pavement preservation, condition of bridge superstructure and substructure ele-ments for bridge preservation, or congestion level for mobility). Economically based thresholdscan also be established to signal concern about the planned level and pattern of investment (e.g.,for percent of remaining asset value).
• Design measures to reflect the target scope of implemented strategies. For example, to measureimpacts of intersection improvements for mobility and operational efficiency, use a measure like“time savings at intersections” rather than a more global measure such as “overall reduction intotal network travel time.”
• Use normalized indexes of performance measure values (0–1 or 0–100 scale) to facilitate under-standing of how performance varies within the range of allowable or achievable values.
23
Volume II: Guide for Performance Measure Identification and Target Setting
Short- or Medium-Term
Network • Percent of mileage in poor condition (based on pavement condition index, or PCI) by system category, current and projected, given currently programmed projects or expenditures
• Percent of network resurfaced per year (versus level needed to achieve condition targets)
• Projected percent of mileage in poor condition in 10 years for alternative funding scenarios
Corridor • Average PCI • Projected average PCI in 10 years
Project • PCI
• Distress/cracking by type
• International Roughness Index (IRI)
Long-Term
Table 5. Measures for Different DecisionsPavement Preservation Example

• Use rates (e.g., crashes per 100 million VMT or incidents per million passenger-miles traveled,or PMT) to facilitate comparison of performance measures across different portions of the net-work and to allow for meaningful tracking of trends.
• Use ratios (e.g., ratio of travel time in congested conditions to travel time in free-flow conditionsand number of fatal accidents divided by total accidents) to put the measures into perspectiveand to provide useful insights. Both rates and ratios can be helpful in understanding and com-municating the extent to which transportation performance can be attributed to the actions ofthe agency as opposed to external trends that are beyond an agency’s control.
• Use measures of agency activity or “output” in order to provide short-term feedback on plannedversus actual accomplishment. However, also monitor outcomes (where feasible) for longer-term decisions and work toward improving your agency’s ability to predict the relationshipbetween outputs and outcomes using simple models or more sophisticated analytical tools.
• Institutionalize the process of conducting before-and-after studies in order to distinguish per-formance impacts of agency projects.
Step 3: Design Consistent Measures Across Program Areas
Consistency and alignment of criteria for decision making within an organization is a central con-cept of asset management. Developing a consistent set of performance measures will enable anagency to describe asset condition or service level for engineers, administrators, legislative bodies,and the traveling public.
Performance measures that are consistently defined across program areas responsible for differentasset classes and/or functions can be extremely valuable for providing a high-level understandingof performance for upper-level managers and for facilitating tradeoff analysis and target setting.These types of measures can be defined based on the more detailed performance information shownin Appendix A and discussed in Section 3.2.
Implementing consistent measures is often challenging because it requires coordination and agree-ment across different units of the organization on criteria and methods for performance measure-ment calculations. Strong upper management leadership and good communication among agencyunits is a necessary ingredient for their successful implementation. It may be helpful to designate asingle office with specific responsibility for coordination across different parts of the organization.Alternatively, cross-functional teams can be formed, charged with defining and implementing aconsistent package of measures for a given set of agency business functions. Agencywide centralperformance data repositories, reporting tools, and geographic information system (GIS) tools canbe helpful to support implementation of these measures as well. Uniformity and consistency in dataare critical to support tradeoffs across asset classes and across geographic areas.
One straightforward approach to consistency in performance measurement across asset classeswould be to define the following three measures for each major class of asset:
1. Percent of assets (based on quantity or value) operating at “desirable” levels,
2. Percent of assets (based on quantity or value) operating at “minimum tolerable levels,” and
3. Percent of assets (based on quantity or value) designated as “high-risk” (for structural failure, oper-ational failure, or hazard to the traveling public) where immediate action or evaluation is needed.
24
Volume II: Guide for Performance Measure Identification and Target Setting

Each of these performance measures could be defined based on threshold values for physical con-dition, congestion levels, crash rates, design features versus standards, and so forth.
Other examples of performance measures that could be defined consistently across asset classesinclude:
• Percent of assets in “good” or “poor” physical condition,
• Percent of assets (based on quantity or value) in a “state of good repair” (defined based on eithercondition or maintenance records),
• Percent of assets with more than (or less than) X years of remaining life,
• Percent of assets that are more than X percent of their design life,
• Percent of assets that are at the end of their economic life (i.e., maintenance and rehabilitationcost would equal or exceed the replacement cost),
• Remaining asset value (or related measures such as the ratio of remaining value to replacementvalue or the ratio of deteriorated value to replacement value),
• Backlog of need (where need is defined based on specified service or condition thresholds),
• Percent of target work completed or programmed (based on asset quantity, dollars, and num-bers of projects),
• Customer satisfaction or utility measures derived from customer satisfaction and importanceratings, and
• User costs associated with deficiencies or benefits associated with correcting the deficiencies(these measures would be based on available user cost models for pavement condition, bridgecondition, safety, and congestion).
Step 4: Identify Improvements to Data and Tools
Successful integration of performance measures into your organization’s decision-making processeswill depend on the quality of data that you use and the availability of credible analytical methodsand tools for prediction of performance measure values. These were identified as key screening cri-teria for performance measure selection in Section 3.2. The task now is to assess current capabilitiesand develop a detailed plan of data and tool-related work that will be required to implement themeasures that you have selected. As a result of this exercise, you may find that some of your selectedmeasures are infeasible at present or that they can only be used in a limited set of contexts (e.g., theycan be tracked but not yet predicted). For measures that you intend to pursue, the objective is toidentify specific actions that will need to be taken and ensure availability of budget and staff timefor completing them.
The format shown in Table 6 can be used to structure the investigation of data and tool requirementsin support of performance measurement.
25
Volume II: Guide for Performance Measure Identification and Target Setting

This investigation should consider:
• Data collection methods or data sources for all of the inputs required for calculating a given per-formance measure,
• Methods to transform and process the data for different purposes (e.g., assumptions and tech-niques used to calculate asset value from inventory, condition, and financial information), and
• Forecasting and impact assessment tools (automated or manual) for (1) predicting the valueof the performance measure that would result from implementation of a particular project orprogram strategy or from investing a given level of resources and (2) predicting how the valueof the measure (or its components) would change over time assuming no action on the part ofthe agency.
For each of these elements, identify:
• The current methods in use (if any) and the responsible units;
• Known issues, questions, or concerns with respect to data quality, prediction accuracy, reason-ableness of tool inputs, and so forth; and
• A list of specific actions needed to ensure data quality and accuracy (both initially and on anongoing basis), address concerns, and fill gaps in methodologies or tool sets.
In developing the list of required actions, consider the following kinds of activities:
• New data collection efforts.
• Changes in equipment or methods used in existing efforts to obtain better accuracy, reliability,and/or timeliness. This might include investigation of emerging data collection technologiesthat may provide better information at a lower cost.
• Consolidation of existing data collection efforts. For example, instead of separate inspections fordifferent data elements on the highway network, coordinate inspection activity so that all itemsare collected at one time.
26
Volume II: Guide for Performance Measure Identification and Target Setting
Current Method and Owner
Data Sources/ Collection Methods
Data Transformation/ Measure Calculation
Impact Assessment and Forecasting Tools
Known Issues Actions Required
Table 6. Data and Tool Assessment for Performance Measurement
• Changes to data processing procedures to improve data quality and timeliness.
• Collection/reporting of additional supporting data elements in order to better understand fac-tors influencing trends in performance that are outside of the agency’s control (e.g., vehicle reg-istrations, fuel prices, employment, population/demographics, activities of other agencies, andweather monitoring).
• New formal data quality checking procedures, including improved validation based on specifictest criteria (and automation of validation checking where feasible), consistency checks acrossdifferent data sources, and spot verification of inspection data.
• New initiatives to correct known data quality or consistency problems.
• Establishment of standards across different parts of the agency (or across agencies, where appli-cable) to ensure consistency in performance measurement calculations and predictions. Suchstandards could:
– Identify “official” data sources to be used for performance measures that are calculated usingsystem quantities (e.g., mileage by functional class), VMT, annual average daily traffic[AADT], population, employment, and other items;
– Establish common geographic and temporal referencing methods to allow for integration ofperformance data from different sources (geographic referencing would include linear ref-erencing, spatial referencing, and zone systems);
– Establish requirements for documentation of performance data so that data can be properlyinterpreted and consolidated, particularly for performance measurement efforts involvingmultiple agencies;
– Establish parameter values to be used in economically based calculations (e.g., value of time,accident costs, and discount rate);
– Define methodologies for calculating asset value; and
– Establish common time horizons and base years for projections.
• Identification of major agency initiatives that are likely to impact data and tools used for per-formance measurement (e.g., replacement of legacy systems).
• Planning for smooth transitions in order to maintain or improve capabilities and ensure thattracking of trends will not be impacted.
• Improvements to (or a new initiative to implement) performance-monitoring systems to con-solidate performance information from different sources, automate calculations, and providereporting and query capabilities suitable for different users. These improvements may includeupdates or enhancements to existing executive support systems that are in place.
• Identification of needs for new analytical tools (or improvements to tools already in place) to cal-culate or predict performance, including tools that can be used for assessing performance impactsof planned strategies or different investment scenarios.
27
Volume II: Guide for Performance Measure Identification and Target Setting

Step 5: Design Communication Devices
It goes without saying that effective and timely communication of performance results to stake-holders is of critical importance. Communication devices need to be tailored to different audiences:external/public, agency executives, line managers, and technical staff. Once measures are selected,it is important to carefully consider how each measure will be reported and ensure that reportsmatch the needs of the intended users. Report formats should be designed to make the measureseasily understandable (ideally using graphics). In addition, steps should be taken to ensure the time-liness and dependability of reporting.
Internal communication of performance measures will ideally be well integrated into businessplanning, budgeting, and management reporting procedures. For example, regularly communi-cating progress toward targets at quarterly or monthly management meetings can help create a cul-tural shift toward more performance-based operations. In many transportation agencies, there willbe a need for an education process for engineering staff on the fundamentals of performance-basedmanagement.
Devices that have been used successfully by agencies for performance reporting include the following:
• Continual reports of performance such as Washington DOT’s accountability website, includingthe quarterly Gray Notebook: Measures, Markers, and Mileposts (www.wsdot.wa.gov/account-ability/default.htm).
• Public report cards. See, for example, Virginia DOT’s quarterly report card (http://www.virginiadot.org/infoservice/ctb-qtrlyrpt.asp).
• Dashboards that summarize performance in a concise, easy-to-read diagram. See, for example,the Virginia DOT Project Dashboard (http://dashboard.virginiadot.org).
• Regular performance reports linked to annual or biannual business planning and budgetingactivities. See, for example, Minnesota DOT’s Departmental-Level Business Plan Measures andTargets (http://www.dot.state.mn.us/dashboards/pdfs/2year.pdf).
Step 6: Document Definitions and Procedures
Credibility is essential to the success of a performance measurement initiative. The willingness ofpeople to base decisions on performance results depends on their understanding of how the mea-sures are to be interpreted and their level of confidence that the measures were derived from accu-rate data, calculated using a sound technical methodology, and quality-checked to ensure that theyare free from errors.
Good documentation of the performance measures is necessary to provide a common detailedunderstanding of how the measures are defined, how they are calculated, and what steps are to betaken to ensure accuracy. This detailed documentation should be made available to all of the peo-ple responsible for producing the performance data, and to the consumers of the data. It can andshould also provide the basis for periodic audits of performance measurement accuracy and adher-ence to defined procedure.
28
Volume II: Guide for Performance Measure Identification and Target Setting
The basic documentation can be established as the performance measurement program is launched.Updating should occur whenever new measures are added or procedures are modified. Separate doc-umentation (i.e., metadata) should be maintained on specific performance results—for example, tonote special factors that influenced the results (e.g., sharp rise in gas prices or severe weather), or devi-ations from standard procedures (e.g., statistical procedures used to compensate for missing data).
If and when the agency decides to change the performance measures that it uses or to modify thedetails of how a given performance measure is calculated, the documentation for the old measureshould be archived along with the performance results that exist. This documentation will be invalu-able for future construction and interpretation of performance trends.
■ 3.4 Establishing Performance Targets
Setting performance targets involves a mix of considerations:
• Financial—Targets need to reflect a realistic projection of available funding levels.
• Policy—Targets need to reflect current policies and priorities, as well as input from executives,legislators, and customers.
• Technical—Targets need to be achievable based on current and forecast conditions or performance.
• Economic—Targets should be set (where feasible) based on economic efficiency considerations,including minimizing life-cycle costs and maximizing the benefit obtained for a given level ofinvestment.
This section describes steps for establishing performance targets by considering all of these factorsand using them as an integral part of the agency’s resource allocation process.
Step 1: Define Contexts and Time Horizons
The first step is to make sure you have a clear picture of how the performance targets will be usedand what time horizons they will cover. Performance targets may be used in a variety of contexts:
• In long-range transportation plans.
• In regional or corridor plans.
• In short- or medium-range (e.g., 1- to 5-year) internal business planning processes.
• As part of the agency’s capital or operating budget process (including TIP/STIP development)involving communication to legislative bodies and/or transportation commissions.
• As part of fulfilling requirements for the GASB 34 modified approach to asset financial report-ing. If you are setting targets for GASB 34 reporting, you will need to establish targets for thecondition of eligible assets, disclose these targets publicly, and verify each year that the currentperformance values meet the stated targets for the year.
29
Volume II: Guide for Performance Measure Identification and Target Setting

The contexts you identify will help to clarify over what timeframes targets are needed. Manyagencies set both long- and short-range targets, using different processes. Short-range targets aremore firmly based on financial constraints, whereas long-range targets can be based more ontechnical, economic, and policy considerations. However, for targets to be credible, care shouldbe taken to make targets set for different timeframes and in different contexts consistent with oneanother.
Step 2: Select Scope of Measures for Targets
For each of the target-setting contexts identified in Step 1, you will need to identify which measuresare to be included. Not all performance measures are amenable to quantitative target setting becausesome are qualitative in nature and some agencies do not have sufficient control over their value.
Some performance measures may be candidates for quantitative target setting, but do not have suf-ficient baseline or trend data established to allow for reasonable targets at present. Others may havebaseline data available, but tools or methods are not available to reasonably predict their value. Itmay be helpful to label performance measures as “mature” (baseline data and targets exist), “emerg-ing” (baseline data are available, but no target has been set), and “developmental” (neither data nortargets exist yet).
Where targets for multiple measures are being considered for a given policy objective (e.g., pave-ment preservation), technical analysis should be conducted to see if one of the measures acts as a“controlling target.” For example, if targets for both “average condition” and “percent in poor con-dition” are set, it may be the case that achieving one target (average condition) will always auto-matically result in achieving the other (percent in poor condition). In this case, you may want toconsider setting a target for only one of the two measures.
The potential for conflicts or competition across the targets should be anticipated. Some of theseconflicts relate to resource allocation and can be addressed in Step 5—for example, it may not bepossible to achieve targets for both hazard elimination and preservation. Other types of conflicts(e.g., between project delivery speed improvement and project quality improvement) will requirecareful consideration to arrive at a reasonable balance.
Step 3: Develop Long-Term Goals
Setting short- to mid-term performance targets that are realistic based on funding availability is crit-ical for helping decision-makers to make performance-based resource allocation tradeoffs. This is afundamental part of good asset management practice.
However, many agencies want to establish long-term performance goals that stand on their own,independent of resource constraints. In some cases, such performance goals can be established basedon considering the current baseline and the level of improvement that is feasible and desirable basedon public input or benchmark values from peer agencies. However, there are also a host of techni-cal and economic considerations that should be explored that can serve as solid justifications forlong-term goals. Targets based on these goals that are backed up by technical and economic analy-sis can be used as compelling arguments for budget requests.
30
Volume II: Guide for Performance Measure Identification and Target Setting
Approaches to establishing long-term performance goals include the following:
• Measure what the current baseline level of performance is, and then set goals for improvementusing benchmark information about what peer agencies have achieved through focused effortsto improve performance.
• Align agency goals with nationally based targets (e.g., the national highway safety target of1.0 fatality per 100 million VMT).
• Use customer surveys and/or tracking of complaint information as a guide to establish “tolera-ble” threshold performance levels.
• Use available models that show how user costs (e.g., travel time, vehicle operating costs, andaccident costs) change with different levels of condition or performance. Examining the slope ofthis curve can show the performance level at which user costs begin to increase rapidly.
• Use the law of diminishing marginal returns to identify the point at which additional investmentsbegin to have a declining degree of impact on improvements in performance—in other words,where the slope of the investment performance curve begins to decline. Curves of changes in per-formance measure value per unit of investment (see Figures 4 and 5) can be used for this purpose.
• A corollary to the law of diminishing returns is that caution should be exercised about settinggoals or targets that call for 100-percent achievement of a particular condition or service level,since the benefit/cost ratio associated with achieving the last 1 percent will typically be quitelow. For example, setting a goal of no structurally deficient bridges could necessitate costlyreplacement of a bridge that provides a redundant link in the network and is not heavily used.
• Use a tool such as the Highway Economic Requirements System (HERS) or the Highway Designand Maintenance Standards Model (HDM-4) to identify the performance levels that could beachieved through implementing all improvements with benefits exceeding costs.
• Define a set of minimum standards for infrastructure characteristics and performance (suchstandards may already be in place), and establish a long-term goal of meeting these standards.Caution should be exercised in defining standards so that they are feasible and reasonable.
• Related to the standards-based approach, a methodology for defining either deficiencies orneeds (i.e., the cost of addressing the deficiencies) can be applied. This then provides the basisfor setting a long-term goal of eliminating all deficiencies or reducing the backlog to 0. Alterna-tively, a goal of keeping the backlog from growing might be established.
For setting infrastructure condition goals, the following additional types of approaches can be used:
• Establish a threshold for “poor” pavement based on a level of roughness that is noticeable toroad users (particularly trucks) and is associated with a marked increase in road user costs (dueto vehicle wear and tear, increased fuel consumption, or reduced speed). Set a long-term goal ofhaving minimal travel on poor roads (e.g., less than 5 percent).
• Use capabilities of pavement and bridge management systems to determine a long-term opti-mal network condition distribution, which minimizes life-cycle costs. Use this distribution to setgoals for either average condition or percent of infrastructure (e.g., number of bridges, deck area,and miles) above a given threshold condition level.
31
Volume II: Guide for Performance Measure Identification and Target Setting

• Base goals on maintaining a steady-state condition distribution in order to avoid future peaksin preservation or replacement costs that would be difficult to address given a relatively con-stant level of funding. These goals would be expressed in terms of the percent of the network indifferent ranges of condition level (or remaining life categories).
In conjunction with many of these approaches, separate goals can be established for different por-tions of the transportation network to reflect differing degrees of strategic importance (e.g., basedon functional class, truck routes, and trunk line networks).
Step 4: Consider Funding Availability
It can be a challenge to gain consensus on performance targets when levels of performance that aredesirable from an economic, engineering, or customer perspective are not feasible from a financialperspective. However, performance targets need to be achievable in order to be meaningful and toserve a useful purpose in an agency’s decision-making process.
Ideally all performance targets, particularly those that apply to a relatively short time horizon(e.g., fewer than 5–7 years), should be placed within the context of future funding availability.Projections of future funding can be made based on past trends and available information aboutfuture appropriation levels. Historical breakdowns of funding allocation and use to programareas and cost components can provide useful input to future projections.
In many instances, a scenario approach can be used, in which targets are set based on continua-tion of current funding levels, 10–20 percent lower, and 10–20 percent higher. Additional sce-narios for allocation of available funds across program areas can be analyzed, as discussed belowin Step 5.
Step 5: Analyze Resource Allocation Scenarios and Tradeoffs
The ability to meet performance targets depends not only on overall funding availability, butalso on how funds are allocated across and within program areas. Performance targets can pro-vide the basis for determining how resources are to be allocated when there is available flexibil-ity to do so.
The capability to predict performance and relate performance to cost is required for formulation ofrealistic targets based on anticipated funding availability. Many pavement and bridge managementsystems include this capability as a standard feature. Other tools, such as the FHWA Highway Eco-nomic Requirements System—State Version (HERS-ST), can predict a broader set of preservation,safety, and congestion-related performance measures for different resource allocation scenarios.Some agencies have developed in-house tools or informal spreadsheet-based or “back-of-the-envelope”calculation methods to provide this capability as well. Available analytical tools for relating assetperformance to cost were identified in NCHRP Report 545 (2).
Figures 4 and 5 illustrate examples of performance-cost relationships that can be produced by man-agement system tools and used as guides for target setting based on funding and resource alloca-tion scenarios.
32
Volume II: Guide for Performance Measure Identification and Target Setting

33
Volume II: Guide for Performance Measure Identification and Target Setting
0
5
10
15
20
25
0 20 40 60 80 100Percent Bridges with Health Index >75% in 10 years
Relative Budget Dollars (in Millions/Year)
Figure 5. Relationship Between Infrastructure Condition and Needed Expenditure
0
20
40
60
80
100
0 1 3 5 7 9 10
Time (years)
Bridges with Health Index >75% (in Percent)
High Expenditures,Increase Over Status Quo
Moderate Expenditures,Maintain Status Quo
No Additional Expenditures,Do Nothing Policy
2 4 6 8
Figure 4. Example of Budget Scenarios and Effects on Infrastructure Condition
Step 6: Consider Policy and Public Input
For many agencies, target setting is a process that involves engagement with agency executives,transportation commissions or boards, elected officials, and customers. Approaches to obtaininginput can vary, but ideally should involve a two-way communication process in which:
• The agency educates external stakeholders about current baseline performance and trends, fea-sible levels of performance given alternative levels of resources, and technical and economic fac-tors to be considered and
• External stakeholders provide feedback on desired performance levels and priorities across dif-ferent measures.
Public opinion surveys can also be helpful in the target-setting process to understand the relation-ship between different transportation system performance levels and the level of inconvenience ordiscomfort perceived by users.
Step 7: Establish Targets and Track Progress
This final step involves selecting actual target values based on the work accomplished in prior steps,reporting these targets, and tracking progress toward meeting the targets (as discussed in the sec-tion on designing communication devices). Periodic adjustments to targets should be consideredbased on the degree of progress made, changes in policy or priorities, or emergence of informationor factors not previously considered when the initial targets were established (e.g., dramatic rise ingasoline prices or passage of a new transportation finance package).
Examples of targets established by state DOTs are provided in Appendix B. Figures 6 through 8illustrate useful graphical formats for communicating performance measure values with respectto targets.
34
Volume II: Guide for Performance Measure Identification and Target Setting

35
Volume II: Guide for Performance Measure Identification and Target Setting
PerformanceLevel
CurrentPerformanceLevel
1997 2001 6–YearTarget
10–YearTarget
20–YearTarget
Baseline Performance
20–Year Performance Level
Trend-Based Performance Projections
Current Performance Level
Policy-Based Performance Target
Futu
re P
erfo
rman
ce G
ap
Figure 6. Minnesota DOT’s Performance Target Levels
Percent Pavement Which Meets Department Standards
100
70
20
1997–1998
2000–2001
2003–2004
-
Fiscal Year
1998–1999
2001–2002
2004–2005
1999–2000
2002–2003
2005–2006
1996–1997
60
10
80
40
0
Actual Planned
30
50
90Objective 80%
Figure 7. Florida DOT Communication of Performance Targets
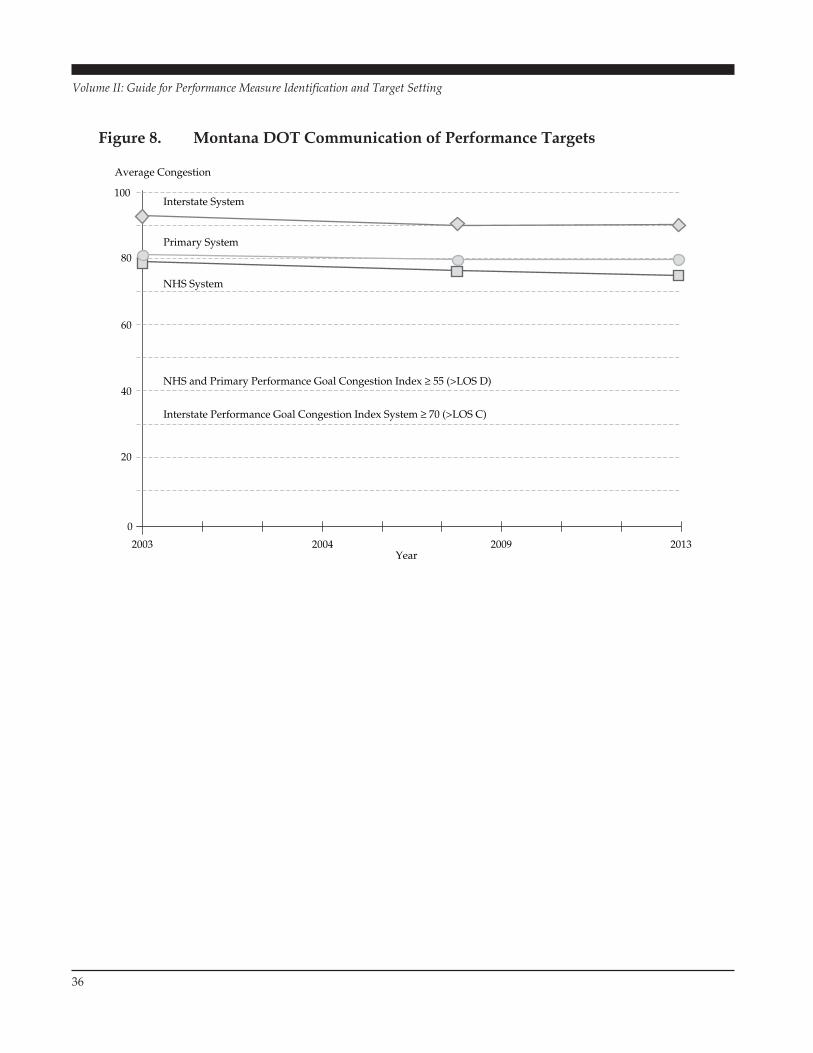
36
Volume II: Guide for Performance Measure Identification and Target Setting
0
20
40
60
80
100
Average Congestion
2003Year
Interstate System
Primary System
NHS System
NHS and Primary Performance Goal Congestion Index ≥ 55 (>LOS D)
Interstate Performance Goal Congestion Index System ≥ 70 (>LOS C)
2004 2009 2013
Figure 8. Montana DOT Communication of Performance Targets

37
Sources
1. AASHTO, Transportation Asset Management Guide, Washington, D.C. (November 2002).
2. Cambridge Systematics, Inc., PB Consult, Inc., and System Metrics Group, NCHRP Report 545:Analytical Tools for Asset Management, Transportation Research Board (2005).
Volume II: Guide for Performance Measure Identification and Target Setting

A-1
Volume II: Guide for Performance Measure Identification and Target Setting
Appendix A. Performance Measuresfor Asset Management
The tables on the following pages provide lists of performance measures that may be considered fortransportation asset management. These measures have not been fully vetted as the best ones forasset management because this distinction depends largely on the characteristics of the imple-menting agency. However, if implemented properly, these candidates have potential for being“good measures.”
Categories used for measures are defined as follows:
• Preservation—Measures the condition of the transportation system and actions to keep the sys-tem in a state of good repair. Measures are often specific to the type of asset. Performance mea-sures may be expressed, for example, by physical condition (e.g., extent or severity of distressand deviations from nominal track gauge), by indexes that combine a number of condition mea-surements or that relate to user perceptions of condition (e.g., pavement condition index, pre-sent serviceability index, or rideability index for pavements or bridge health index for bridges),or by other, not necessarily technical, measures (e.g., financial asset value). For purposes of thisstudy, preservation also includes actions to maintain a state of good repair in emergency situa-tions other than terrorist attacks (e.g., severe storms, earthquakes, landslides, scour around foun-dations, and flooding).
• Mobility and Accessibility—Measures the ease of movement of people and goods. Accessibil-ity is the ability of people and goods to reach desired activities or destinations. Mobility andaccessibility are grouped together here because they are related and share common measures.Mobility measures include the time and cost of making a trip and the relative ease or diffi-culty with which a trip is made, especially congestion and the trip measures related to conges-tion. Some of these trip measures reflect a supplier perspective (e.g., volume-capacity ratio andcapacity-related level of service), while others reflect a user perspective (e.g., speed, travel time,delay, trip reliability, and user cost). Accessibility measures include a “density” of opportuni-ties enabled by transportation services (e.g., number of households within a 30-minute drive ofkey regional centers or number of employment opportunities within a 10-minute walk of tran-sit stops) or the ability of a facility to serve a particular user group (e.g., a particular segment ofpopulation or type of freight). Availability of modes and modal choice can also be treated as anaccessibility measure. Accessibility is often expressed from a user’s perspective.
• Operations and Maintenance—Measures the effectiveness of the transportation system in termsof throughput and travel costs and revenues from a system perspective and maintenance levelof service measures focused on the customer experience of the system. Since throughput is inter-preted in terms of people or goods as well as vehicles, measures of vehicle occupancy or freightcapacity may be included here. Cost efficiency includes measures such as average cost per mileor per VMT. Systemwide fuel efficiency is also included.

• Safety—Measures the quality of transportation service in terms of crashes or incidents that areharmful to people and damaging to freight, vehicles, and transportation infrastructure. Perfor-mance measures also reflect asset conditions that contribute to or detract from safety. Whilesafety is often gauged by the number, frequency, severity, and cost of accidents, recent trendsrecognize a wider sphere of interest in the vehicle- and driver-related causes of crashes and inharm to agency work crews, particularly in work zones. Work is also ongoing to predict the riskof future safety problems at candidate locations.
• Economic Development—Measures direct and indirect impacts of transportation on the econ-omy. Direct impacts are typically related to the cost of transportation experienced by usersand shippers. Indirect measures look at transportation’s contribution to the general economyand are expressed in measures such as economic output (e.g., gross state product), employ-ment (e.g., jobs supported or created), and income. Various proxy measures are often used togauge economic development impacts, including traffic at border crossings, manufacturers/shippers/employers who have relocated for transportation purposes, volume of freight orig-inating or terminating in region, number or percent of employers that cite difficulty in access-ing the needed labor supply because of transportation, and measures of truck travel per unitof regional economic activity.
• Environmental Impacts—Measures effects on the environment, including air quality, ground-water, protected species, noise, and natural vistas. Output-based performance measures mayalso be defined for actions critical to mitigating the above impacts (e.g., protecting wetlands, con-structing wildlife passages across transportation facilities, using snow and ice chemicals thatprotect groundwater and air quality, and monitoring and controlling hazardous materials).
• Social Impacts—Measures effects on broader society (e.g., neighborhoods adjacent to trans-portation facilities) or on population groups (e.g., disadvantaged). This is in contrast to “qual-ity of life” impacts, which are interpreted by some agencies to mean customer satisfactionspecifically.
• Security—Measures protection of travelers, freight, vehicles, and system infrastructure fromcriminal and terrorist actions. Protection of infrastructure and users of this infrastructure againstother emergencies (e.g., severe storms, earthquakes, landslides, flooding, and scouring of foun-dations) is included in preservation.
• Delivery—Measures the delivery of transportation projects and services to the customer. Keyperformance measures include output-oriented accomplishment measures that complementoutcome-oriented measures in the other categories, measures of efficiency and effectiveness inuse of resources, and impacts on customers that need to be considered in evaluation of alterna-tive delivery strategies.
A-2
Volume II: Guide for Performance Measure Identification and Target Setting

A-3
Volume II: Guide for Performance Measure Identification and Target Setting
Measure Type
Pavement Condition/ Ride Quality
• Average condition
• Number of miles below a threshold acceptable condition level (e.g., number of miles with rut depth greater than ¼ inch)
• Percent miles in good/fair/poor condition
Bridge Condition • Average health index (0–100 scale)
• Percent structurally deficient (SD)
• Percent with sufficiency rating less than 50
• Percent of bridges that meet department standards
• Number of posted or restricted bridges
• Number of steel bridges with section loss in a member
• Percent of bridges with deck, superstructure, substructure National Bridge Inventory (NBI) rating 4 or below
Asset Condition (General)
• Percent length/count/area in good/fair/poor condition
• Percent length/count/area in “state of good repair”
Remaining Life/ Structural Capacity
• Percent asset quantity with fewer than 5 years remaining service life (RSL)
• Average RSL
• Percent of design life achieved
• Percent asset quantity forecast to achieve full design life
• Average age or percent asset quantity greater than n years old (age can be a useful proxy for remaining life when data are limited)
• Percent pavement miles with weight restrictions due to structural limitations
• Percent assets eligible for replacement
• Percent asset quantity out of service due to deteriorated condition
Asset Value • Replacement value
• Book value (historical or appreciated to current dollars)
• Ratio of current value to replacement cost
Examples
Table A.1 Preservation Performance Measures
(continued on next page)

A-4
Volume II: Guide for Performance Measure Identification and Target Setting
Measure Type Examples
Backlog or Need • Current value of cost to preserve assets in state of good repair over defined time horizon
• Backlog of deferred maintenance
• Estimated cost to achieve target condition level or eliminate deficiencies
• Ratio of deferred maintenance dollars to replacement value (facility condition index)
• Ratio of deterioration or lost value to replacement value (debt index)
Agency Financial Impacts
• Cost of emergency maintenance due to asset age or poor condition
• Agency cost due to deferred maintenance (present value of deferred mainte-nance minus cost to do it now)
Customer Benefit or Disbenefit (or Surrogates)
• VMT-weighted average pavement condition
• Percent of VMT on roads in poor condition
• Percent of truck VMT or tonnage affected by weight or clearance restrictions
• Number of overload permits rejected due to bridge structural capacity deficiency
• Number of functionally obsolete bridges
• User costs associated with rough roads or detours due to bridge posting or road restrictions
• Hours or days during which asset not in service due to preservation work
Customer Perception • Customer rating of asset condition or agency preservation activities
• Customer satisfaction rating
Table A.1 Preservation Performance Measures (continued)

A-5
Volume II: Guide for Performance Measure Identification and Target Setting
Measure Type Examples
Congestion • Level of service (LOS)—measure of congestion from A–F based on volume-to-capacity ratio (facility-specific measure)
• Volume-to-capacity (V/C) ratio (facility-specific measure)
• Travel time index (ratio of peak travel time to free-flow travel time)
• Travel rate index (amount of additional time required due to congestion)
• Misery index—measurement of the severity of congestion on the worst 20 percent of trips (ratio of average travel rate for the longest 20 percent of trips to average travel rate for all trips)
• Speed reduction index (ratio across different facilities of decline in speeds due to congestion)—used to compare relative congestion levels on different facilities
• Amount or percent (VMT or PMT) of congested travel
• Number or percent of highway-miles (by class of road) operating under capac-ity, approaching capacity, or over capacity (or at particular V/C thresholds for nhours per day)
• Number of intersections congested (e.g., with LOS E or F) during peak hours
• Travel time under congested conditions
• Lane-mile duration index (number of congested lane-miles times the duration of congestion)
• Maximum queue lengths (facility-specific measure)
Speed • Travel rate (e.g., minutes per mile)—for a roadway segment or corridor
• Average speed for given roadway segment or origin-destination pair
• Average annual rate of change in average speed
• Ratio between bus speed and automobile speed
• Percent of time average speed is below (or above) a threshold level
• Percent of high-priority highways with average speed of 60 mph
• Mobility index (VMT, PMT or ton-miles times average speed)
Travel Time • Average travel time (by mode or cross modes) for a given origin-destination pair or trip type
• 95-percent reliable travel time
• Travel time from freight intermodal facilities to highway facilities
• Average shipment time (by commodity, mode, local versus long-distance)
• Changes in average, median, and 90th-percentile travel time over time
• Percent difference in travel time between second fastest emergency route and the fastest route
Table A.2 Mobility and Accessibility Performance Measures
(continued on next page)

A-6
Volume II: Guide for Performance Measure Identification and Target Setting
Measure Type Examples
Travel Time Reliability • Buffer time index—percent of extra time a traveler needs to allow in order to be on time 95 percent of the time
• Variation in average speed (location-specific measure)
• Standard deviation of travel time
• Deviation from average trip time for selected origin-destination pair
• Number of days when peak-period travel time exceeds twice the free-flow travel time on key commuting routes
• Percent on-time shipments (by commodity or mode)
Delay • Total hours of delay (difference between actual travel time and defined standard for acceptable travel time)
• Hours of incident-related delay
• Relative delay rate (difference from target or standard)—used to compare delay on different roadway facilities or modes
• Congestion severity index (hours of delay per million VMT)
• Average delay per peak-period traveler
• Hours of stopped time per traveler
• Percent of peak-period travelers delayed
Travel Cost • Average shipment cost between specified origins and destinations or facilities
• Trip cost by mode for origin-destination pairs
• Vehicle operating cost increases due to congestion
• Travel time cost of congestion
• Annual percent increase in unit costs of transport industries
• Dollar losses due to freight delays
• Economic efficiency/net discounted benefits
Accessibility to destinations
• Percent of target population that can conveniently reach a specific destination (e.g., within X hours, no more than Y-percent circuity, with less than Z minutesof delay)
• Percent of working population within X miles of employment
• PMT per capita
Table A.2 Mobility and Accessibility Performance Measures (continued)

A-7
Volume II: Guide for Performance Measure Identification and Target Setting
Measure Type Examples
Accessibility to facilities and services
• Average time from snow event to bare pavement operations
• Percent of population within X miles or minutes of the state highway system
• Percent of facilities (e.g., rail stations) that are ADA compliant
• Number of driveway cuts per mile (for defined corridors)—both a measure of accessibility and “side friction” impacting corridor mobility
• Percent of urban population with convenient access to public transit (e.g., living within a quarter mile of a transit stop with a non-rush-hour service frequency of 15 minutes or less)
• Access time to passenger or intermodal facilities
Accessibility to differ-ent modes
• Modal split by trip purpose
• Average automobile ownership
• Transit service availability by county
• Ability of shippers to access desired suppliers or markets within specified ser-vice parameters (based on shipment time, cost, and circuity)
• Percent of roadway-miles with bicycle accommodations
• Percent of roadway-miles with pedestrian accommodations
• Percent of planned bike route system implemented
• Number of autos (or taxis) per capita
• Percent of ADA-compliant vehicles
Backlog or Need • Estimated cost to achieve a given performance level or to eliminate deficiencies (e.g., eliminate peak-hour congestion on priority routes or complete bike route system)
• Estimated cost of recommended work with benefit/cost ratio greater than 1
Customer Perceptions • Customer ratings of trip time, reliability, congestion severity, travel cost, travel time, and so forth
• Customer satisfaction with snow and ice removal
Table A.2 Mobility and Accessibility Performance Measures (continued)

A-8
Volume II: Guide for Performance Measure Identification and Target Setting
Measure Type Examples
System operations efficiency
• See mobility measures (e.g., congestion and speed)
• VMT per lane-mile (per capita)
• Passengers per vehicle-mile or hour (transit)
• Percent of road-miles with low speed limits or restrictions
• Average circuity for truck trips between a selected origin-destination pair
• Number of extended breakdowns in travel flow on freeways for a given time period
Incident Response/ Winter Operations
• Average annual incident response time on limited access miles managed by ITS
• Average time to clear incident or percent of incidents cleared in less than X minutes
• Time interval after precipitation stops to restore road conditions to defined standard
• See also Delay measures
Capacity and Availability
• Number of hours (or days) of road closure
• Intermodal terminal capacity
• Bulk material loading rate (number of trucks per hour)
• Number of truck units, railroad cars, or containers that can be stored at intermodal facility
• Railroad grade crossing-related delay time
• Percent of arterials and/or downtown intersections under closed loop control
• Traffic signal malfunction rate
Maintenance Level of Service
• Lineal feet of damaged guardrail
• Number of pieces of roadside litter per mile
• Lineal feet of ditches more than 50-percent full of sediment or other material
• Number of deficient (e.g., clogged) catch basins
• Sign and pavement marking retroreflectivity
Cost Efficiency • Average cost per lane-mile constructed
• Average operations and/or maintenance cost per lane-mile
• Construction and maintenance expenditures per VMT
• Cost per passenger trip (urban versus rural)
• Cost per percent point increase in lane-miles in good condition
• Ratio of oversize/overweight permit fees collected to dollar value of damage caused
Table A.3 Operations and Maintenance Performance Measures

A-9
Volume II: Guide for Performance Measure Identification and Target Setting
Measure Type Examples
Occupancy • Percent or number of multiple-occupant vehicles
• Percent of work trips by single-occupant vehicles (SOVs) or non-SOVs
• Average vehicle occupancy (by peak/off-peak, and location)
Fuel Efficiency • Average fuel consumption per trip by type (or shipment)
• Annual fuel consumption per VMT
• Gallons of wasted fuel
Backlog or Need • Estimated cost to achieve a given performance level or eliminate deficiencies (e.g., bring 80 percent of arterial network under closed-loop control or cut incident response time by 20 percent)
• Estimated cost of recommended operational improvements with benefit/cost ratio greater than 1
Customer perceptions • Customer ratings of facility operations and availability
Table A.3 Operations and Maintenance Performance Measures (continued)

A-10
Volume II: Guide for Performance Measure Identification and Target Setting
Measure Type Examples
Crashes • Number of crashes by type, mode, system, location type, and so forth
• Crash rates—number of crashes (by type) per 100 million VMT
• Percent reduction in crashes (by type)
• Number of crashes involving hazardous materials
• Number of alcohol-related crashes
• Number of crashes in which speed or traffic violation is a factor
• Number of crashes in highway construction zones
Crash Impacts • Number of fatalities (or rate per amount of travel)
• Number of road workers killed
• Number of injuries (or rate per amount of travel)
• Crash costs (total or average)—by type of cost (e.g., property damage or medical)
• Hours of delay related to crashes
• Average incident duration or percent of incidents disrupting traffic for more than X minutes
TransportationInfrastructure
• Hazard index (location-specific measure)
• Number of locations with high crash rates or hazard indexes (exceeding defined threshold)
• Number of roadway sections (or percent of system miles) not meeting safety standards
• Number of roadway sections with excessive curves or grades (e.g., as defined by the Highway Performance Monitoring System)
• Number of roadway locations with identified hazards (barriers, obstacles, and distractions)
• Number of roadway sections (or miles) with identified cost-effective safety countermeasures
Need/Backlog • Cost to implement identified safety countermeasures
Customer Perception • Number of safety-related complaints
• Customer ratings of transportation facility safety or operational response to incidents
• Shipper satisfaction with damage/loss rates
Table A.4 Safety Performance Measures

A-11
Volume II: Guide for Performance Measure Identification and Target Setting
Measure Type Examples
Economic Costs and Benefits
• Number of jobs within X minutes of population centers
• Transportation-related impacts: jobs created, percent of state or regional gross product
• Economic costs of pollution
Direct User Costs • Average cost per trip
• Average cost per ton-mile
TransportationInfrastructure Support for Freight Movement
• Road mileage converted to all-weather surfacing
• Road mileage upgraded to support truck traffic
Support ImprovedService to Existing Urbanized Area
• Extent to which projects fall within census urbanized area
Support of Brownfield or Infill Sites
• Serves one or more Brownfield or infill sites (expressed as Yes/No on project basis; percent or qualitative measure on system basis)
Customer Perceptions • Percent of businesses that cite problems with transportation as a major factor in relocation, productivity, or expansion
Table A.5 Economic Development Performance Measures

A-12
Volume II: Guide for Performance Measure Identification and Target Setting
Measure Type Examples
Vehicle Emissions • Vehicular emissions by type—NOx, VOC, CO2, CO, ozone, fine particulate mat-ter (PM2.5) —can be limited to nonattainment areas and identified by source (e.g.,passenger versus freight)
• Tons of greenhouse gases generated
Air Quality Standard Attainment
• Number of counties that experience isolated transport-related excesses over air quality standards
• Urban areas in nonattainment status
• Population of nonattainment areas
Length or Extent of Air Quality Problem
• Number of days that pollution standard index is in the unhealthful range
• Percent of time air quality is rated good at monitoring stations
• Percent or number of counties meeting transport-related national ambient air quality standards
• Number of days of air quality noncompliance
• Number of infractions where agency is charged
• Number of highway funding sanctions imposed for noncompliance with Clean Air Act
• Percent of permit inspections that result in violations
Water Quality, Wetlands, Aquatic Life
• Acres of wetlands replaced or protected for every acre affected by highway projects
• Level of fish habitat reduction as a result of new construction
Hazmat Impacts • Number of incidents involving hazardous materials (or rate per vehicle-mile of hazmat traffic)
• Number of pipeline spills and accidents
• Quantity of fuel or hazardous materials released, by mode, per transportation incident
• Number of oiled seabirds
Energy Impacts • Percent of vehicles using alternative fuels
• Average fleet-miles per gallon
• Fuel consumption per VMT, PMT, or ton-mile
Noise Impacts • Number of residences or percent of population exposed to highway noise exceeding established standards (or greater than X decibels)
• Number of noise receptor sites above threshold
• Constraints on use due to noise (or water)
• Percent of road network (including concrete sections) with quieter road surface by 2010
Recycling • Amount (or percent) of recycled material used in road construction
Table A.6 Transportation Environmental Impacts Performance Measures
(continued on next page)

A-13
Volume II: Guide for Performance Measure Identification and Target Setting
Measure Type Examples
Completion of Mitigation Steps
• Number of environmental impact analyses, conformity analyses, or environ-mentally friendly partnership projects completed
Customer Perceptions • Customer satisfaction with transportation decisions affecting the environment
• Customer perception of air quality
Table A.6 Transportation Environmental Impacts Performance Measures (continued)
Measure Type Examples
Social, Societal, Neighborhood,Community Quality of Life
• Percent of projects in which community is actively engaged
• Number of archaeological and historical sites that are not satisfactorily addressed in project development before construction begins
• Participation (number of projects and number of communities) in neighborhood conservation program.
• Relative service levels and impacts by community (to address environmental justice considerations)
Customer Perceptions • Customer perceptions of highway project impacts
Table A.7 Transportation Social Impacts Performance Measures
Measure Type Examples
Incident Rates • Number (or rate per capita or number of travelers) of crimes at rest areas, bus stops, highways, and so forth by type or severity
• Value of losses from theft per capita, person-trip, shipment value, ton
Prevention Activity • Percent of facilities with specific security features (e.g., cameras, lighting, and guards)
• Percent of facilities passing security tests
Customer Perceptions • Percent of customers identifying security as a concern
• Change in customer concern about security over time
Table A.8 Transportation Security Performance Measures

A-14
Volume II: Guide for Performance Measure Identification and Target Setting
Table A.9 Transportation Delivery Performance Measures
Measure Type Examples
Accomplishment • Quantity of work completed (e.g., lane-miles of pavement resurfacing and number of bridges reconstructed)
• Dollar value of work completed by type
Quality • Quality index (based on materials testing, pavement smoothness and inspection results)
• Percent of material samples meeting specification
Efficiency • Cost per lane-mile constructed
• Administrative costs as percent of total program
• Preliminary engineering (PE) and construction engineering (CE) costs as percent of construction costs
• Design costs as percent of construction dollars let
• Percent of highway capital costs spent on construction (contractor payments and direct on-site construction oversight)
• Percent of cost of preliminary engineering rework
• Duration of construction (by project type)
Schedule and Budget Adherence
• Unprogrammed costs as percent of total
• Number of projects let versus planned for letting
• Number of projects certified versus scheduled for certification
• Number of consultant contracts executed versus planned
• Percent of contracts (or contract value) completed on-time
• Percent of contracts (or contract value) completed on-budget
Responsiveness • Average response time to emergency work request
• Percent of work requests closed within X hours or days
Backlog • Ratio of work under contract to programmed work
• Backlog of programmed construction work to be let
Customer Impact and Safety
• VMT impacted by work zones
• Lane-hours restricted due to construction
• Hours of delay due to work zones
• Vehicle-miles of detour due to work zones
• Number of work zone-related crashes
• Number of road worker injuries

B-1
Volume II: Guide for Performance Measure Identification and Target Setting
Appendix B. Example State DOTPerformance Targets
This appendix contains sample performance targets documented for illustrative purposes that wereestablished at some point in time by each of the referenced states; they are not necessarily currentand are likely to change over time.
Measure
Distress Rating Alabama ≥75
Highway Adequacy Maine
InternationalRoughness Index (IRI)
Federal
Louisiana
Nevada
Pennsylvania
93% ≤170
<15% >170
I—70% <80 II—65% <80 III—60% <80 IV—40% <80 V—10% <80
94
MaintenanceAssessment Program
Texas Other ≥75%
Maintenance Rating Index
Tennessee
NebraskaServiceability Index
Nebraska
Overall Pavement Condition
≤15% Poor
Pavement Condition Index
Kentucky ≤30% Poor
Pavement Condition Rating
Ohio Other ≥75% ≥55
Description State Target
Overall—60
cracking, rutting, patching, raveling
condition rating, safety, backlog, average daily traffic, posted speed, and shoulder
Index based on vehicle response to roughness (lower = smoother)
1–5 scale based on pavement, traffic operations and roadside
1–100 scale based on pavement, shoul-ders, roadside elements, drainage, and traffic services
0–100 scale based on surface distresses—cracking, patching, roughness, rutting, faulting
0–5 scale based on pavement distress
Good, fair, and poor based on pave-ment smoothness
1–100 scale based on cracking, pot-holes, deterioration, and other
0–100 scale based on roughness,
0–100 scale based on pavement
Delaware
Interstate ≥80%
Overall ≥75
Overall ≥72%
Priority ≥75% ≥65
Table B.1 Examples of State DOT Performance TargetsPavement Preservation
(continued on next page)

B-2
Volume II: Guide for Performance Measure Identification and Target Setting
Measure Description State Target
Pavement Condition Survey
0–10 scale for pavement segments based on ride smoothness, pavement cracking, and rutting
Florida
Pavement Quality Index
0–100 scale based on 3 surface distress factors
Indiana NHS—75Other—65
Pavement Quality Index
0.0–4.5 scale based on smoothness and distress (cracking)
Minnesota Other ≥2.8
Pavement Serviceability Rating
0–5 scale based on ride, rutting, and cracking
Wyoming Other—3.0
Performance Levels maintenance; PL-3: poor condition
Kansas Other ≥75% PL1
Present Serviceability Rating
0–5 scale based on subjective rating by road users
Arizona ≥3.23
Remaining Service Life
Poor (0–5 years), fair (6–10 years), or good (11+ years) based on surface distress
Colorado NHS ≥70%
Other ≥55%
Ride Index roughness with adjustment for pave-ment type
Utah ≤15% ≤1.84
Roughness Index and Cracking Index
Roughness index—0.0 to 5.0 based on public perception
Cracking index—0.0 to 5.0 for each pavement section
Idaho ≤18% <2.5
Sufficiency Rating based on surface distresses
Michigan ≤30% Poor or Very Poor
80% >6 for all 3 criteria
Interstate—75
Principal ≥3.0
NHS—3.5
Interstate ≥80% PL1
Interstate ≥80%
50% ≥2.75
Excellent, good, fair, poor, very poor,
1–5 scale based on vehicle response to
PL-1: good condition; PL-2: requires
Table B.1 Examples of State DOT Performance Targets (continued)Pavement Preservation

B-3
Volume II: Guide for Performance Measure Identification and Target Setting
Measure Description State Target
Bridge Value Index Oregon
GASB 34 Bridge Rating
Alabama ≥5
Health Index Kansas
NBI Appraisal Ratings
Ohio
Delaware
Washington
≥85% of deck area ≥5
75% ≥6<10% ≤4
95% Good or Fair
Number of Closed Bridges
Number of Posted Bridges Pennsylvania
0
Reduce by 30% by 2010
Structural Condition Rating
Minnesota Principal—92% Fair to Good Other—80% Fair to Good
Structurally Deficient (SD) or Functionally Obsolete (FO)
Colorado
Federal
Florida
Georgia
Kentucky
Michigan
Tennessee
Wisconsin
≤25% SD
<20% of NHS either SD or FO
90% ≥5 SD
<5% (based on deck area)
≤7% SD
≤35% SD
>75% neither SD nor FO
≤15% SD
Structures Inventory System
Utah 50% ≥80≤15% ≤49
Sufficiency Rating Indiana
Maine
Wyoming
Interstate—87% NHS—85%Other—83%
Overall—60%
NHS—83%Other—80%
value
0–10 scale assigned to each component-rating category
0–100 scale based on condition of sev-eral elements
0–9 scale based on deck, substructure, and superstructure condition
Bridges closed
Bridges with weight restrictions
Good, fair, or poor based on National Bridge Inventory (NBI) condition and appraisal ratings
SD—FHWA rating that indicates a bridge is restricted to light vehicles, requires immediate rehabilitation to remain open, or is closed
FO—FHWA-defined rating based on deck geometry, load-carrying capacity, clearance, and approach roadway alignment
1–100 scale based on condition of major elements
0–100 scale based on 4 factors reflecting ability to remain in service
Ratio of current value to replacement
Pennsylvania Reduce by 50% by 2010
87–90%
Overall ≥80
Oregon
Table B.2 Examples of State DOT Performance TargetsStructure Preservation

B-4
Volume II: Guide for Performance Measure Identification and Target Setting
Measure Description State Target
Toll Operations Costs
Incident Clearance Time
and
Minnesota
Washington
35 minutes
0
Snow and Ice Removal Time
Minnesota
Average clearance time for incidents on the Twin Cities urban freeway system that occur between 6:00 a.m. and 7:00 p.m. on weekdays
Monthly incidents with clearance times over 90 minutes
Average time required to provide bare pavement on super commuter routes following a weather incident
Operational costs per toll transaction Florida <$0.16
2–5 hours
Table B.3 Examples of State DOT Performance TargetsOperational Efficiency
Measure Description State Target
Congestion Minnesota
Level of Service Washington rural areas
Traffic Density Florida
Maryland
<4%
<32%
Travel speeds Minnesota
regional trade centers that are moder-ately congested (0–2 hours of speeds below 45 mph)
of speed, travel time, and safety
mile on Interstate
and
Freeways with annual ADT (AADT) greater than 20,000 vehicles per lane
where travel speeds met or exceed minimum levels
Percent of urban freeway miles in
Describes operating condition in terms
Annual percent growth in vehicles per
Percent of interregional corridor miles
21%
D for urban areas and C for
90% by 2020
Table B.4 Examples of State DOT Performance TargetsCapacity Expansion

B-5
Volume II: Guide for Performance Measure Identification and Target Setting
Measure Description State Target
Correctable Crash Sites Improved
Montana
Crash Rate
Fatal and Disabling Crashes
Washington year
Fatalities
Pennsylvania
550 (3-year average)
Reduce by 10% by 2010
Fatality Rate Idaho
Injury Rate Idaho
Road Condition–Related Crashes
Florida
Minnesota 0.73
Decrease over previous
Minnesota
Number of correctable crash sites funded for improvement
Percent decrease in number of fatal and disabling crashes since 1990
million VMT)
ries per 100 million VMT)
Percent of crashes on strategic highway system where road-related conditions are a contributing factor
3-year average rate per million VMT
3-year average
5-year fatality rate (fatalities per 100
5-year serious injury rate (serious inju-
1.8
10.22
<1%
Improve over time
Table B.5 Examples of State DOT Performance TargetsSafety
Table B.6 Examples of State DOT Performance TargetsTransportation Environmental Impacts
Measure Description State Target
NOx Emissions Maryland
VOC Emissions Maryland
Impacted Wetlands Replaced
Minnesota
as a percent of total VOC emissions
as a percent of total VOC emissions
Ratio of acres of wetlands replaced to acres impacted
Transportation-related VOC emissions
Transportation-related VOC emissions
<33.9%
<40.2%
1

Abbreviations used without definitions in TRB publications:
AASHO American Association of State Highway OfficialsAASHTO American Association of State Highway and Transportation OfficialsADA Americans with Disabilities ActAPTA American Public Transportation AssociationASCE American Society of Civil EngineersASME American Society of Mechanical EngineersASTM American Society for Testing and MaterialsATA American Trucking AssociationsCTAA Community Transportation Association of AmericaCTBSSP Commercial Truck and Bus Safety Synthesis ProgramDHS Department of Homeland SecurityDOE Department of EnergyEPA Environmental Protection AgencyFAA Federal Aviation AdministrationFHWA Federal Highway AdministrationFMCSA Federal Motor Carrier Safety AdministrationFRA Federal Railroad AdministrationFTA Federal Transit AdministrationIEEE Institute of Electrical and Electronics EngineersISTEA Intermodal Surface Transportation Efficiency Act of 1991ITE Institute of Transportation EngineersNASA National Aeronautics and Space AdministrationNCHRP National Cooperative Highway Research ProgramNCTRP National Cooperative Transit Research and Development ProgramNHTSA National Highway Traffic Safety AdministrationNTSB National Transportation Safety BoardSAE Society of Automotive EngineersSAFETEA-LU Safe, Accountable, Flexible, Efficient Transportation Equity Act: A Legacy for Users (2005)TCRP Transit Cooperative Research ProgramTEA-21 Transportation Equity Act for the 21st Century (1998)TRB Transportation Research BoardTSA Transportation Security AdministrationU.S.DOT United States Department of Transportation