ncd prevention public health strategies hong kong · ncd prevention public health strategies hong...
TRANSCRIPT
NCD Prevention
Public Health Strategies
Hong Kong
Graham A MacGregor
Professor of Cardiovascular Medicine
Wolfson Institute of Preventive Medicine,
Barts and The London School of Medicine & Dentistry,
Queen Mary University of London, UK
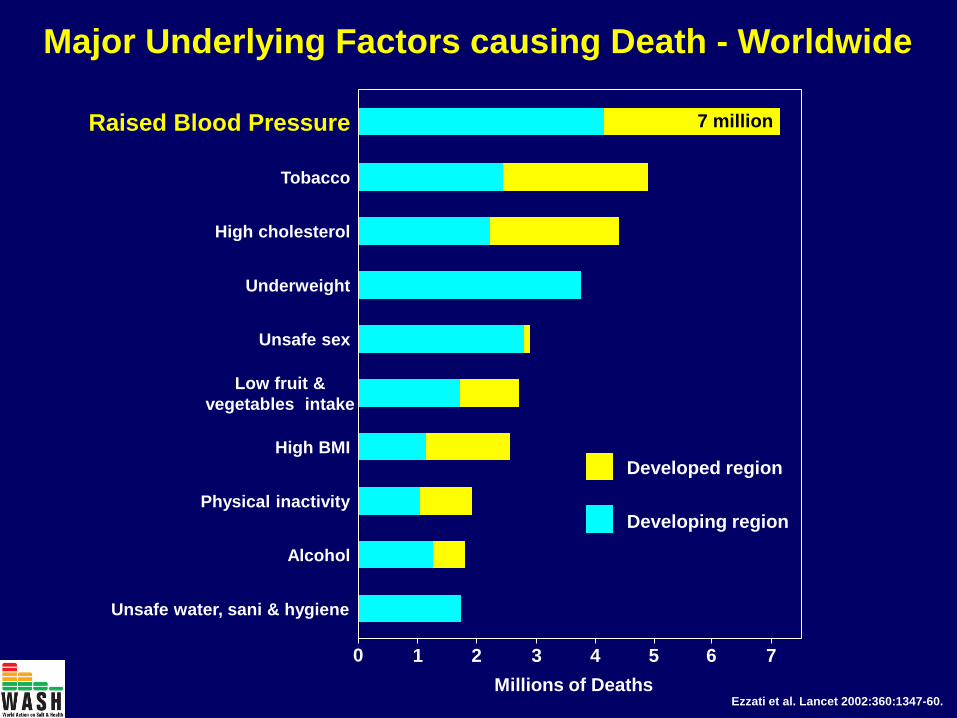
Major Underlying Factors causing Death - Worldwide
Ezzati et al. Lancet 2002:360:1347-60.
Underweight
Unsafe water, sani & hygiene
Alcohol
Physical inactivity
High BMI
Low fruit &
vegetables intake
Unsafe sex
High cholesterol
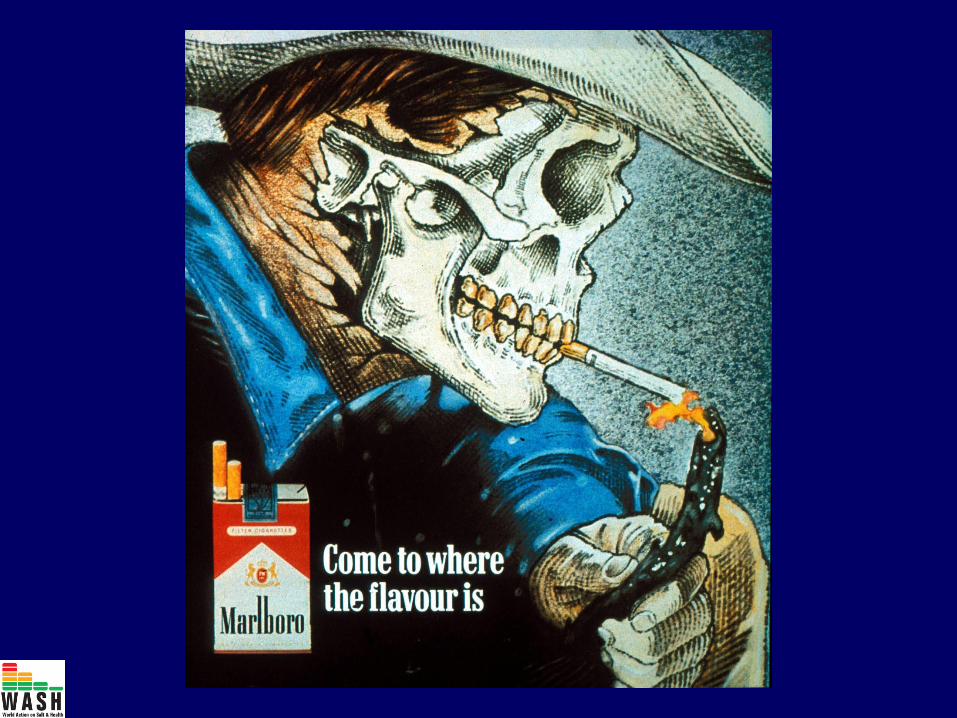
Tobacco
Raised Blood Pressure
0 1 2 3 4 5 6 7
Millions of Deaths
7 million
Developing region
Developed region

Systolic BP and Risk of Death
Systolic Blood Pressure (mmHg)
Heart Deaths 16
8
4
2
1
120 125 135 148 168
Risk
120 125 135 148 168
2
4
8
16
32
Stroke Deaths
The risk starts at systolic 115 mmHg (83% adults)
Risk
MacMahon et al. Lancet 1990;335:765-74
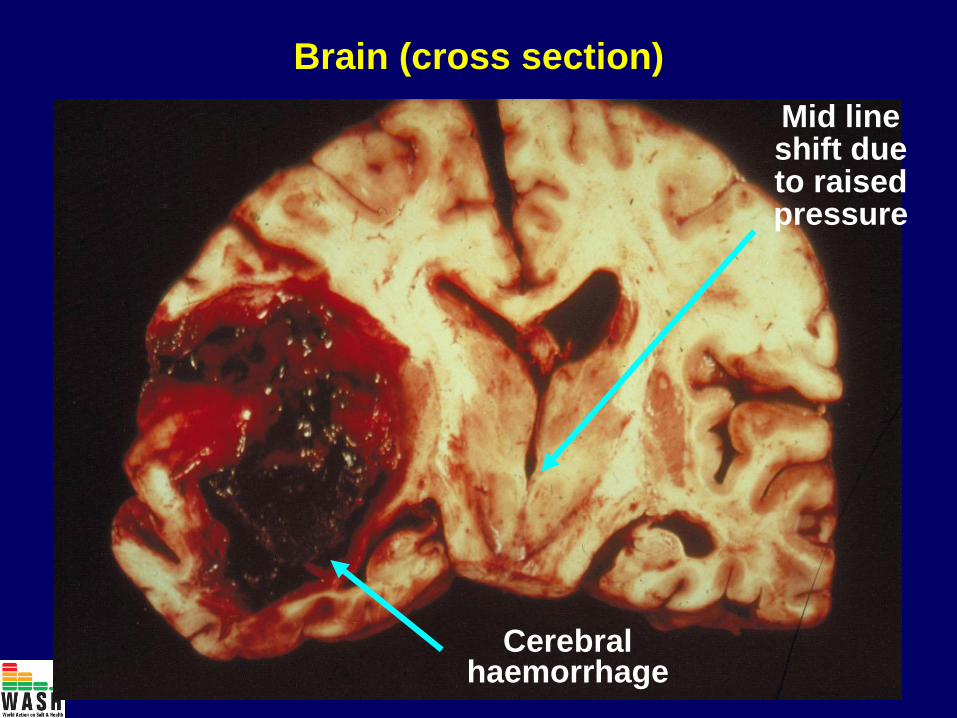
Cerebral haemorrhage
Mid line shift due to raised pressure
Brain (cross section)
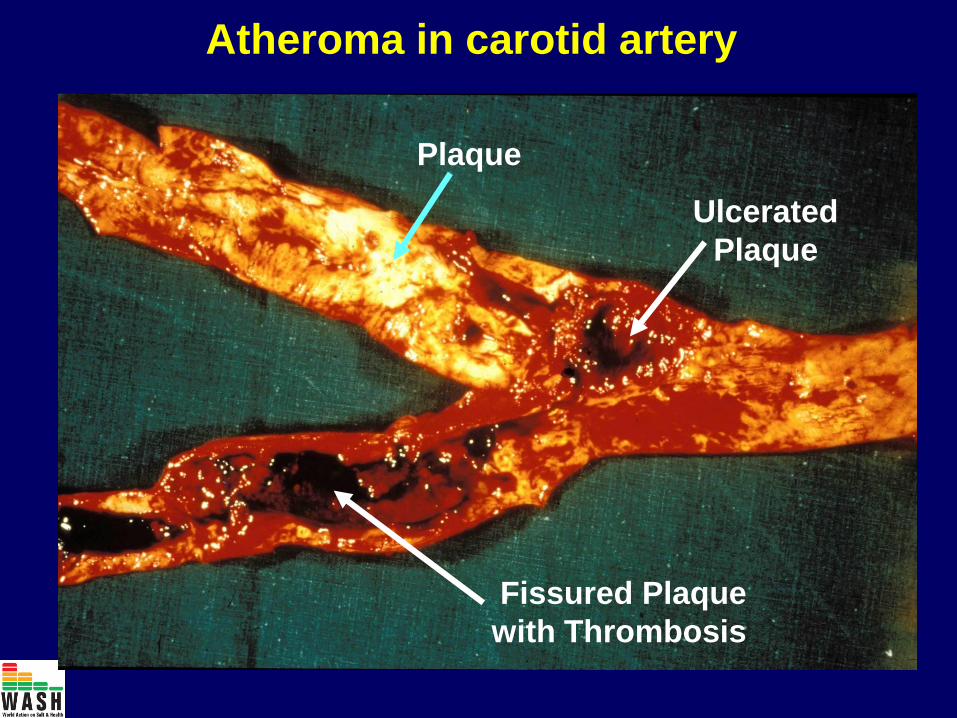
Atheroma in carotid artery
Plaque
Ulcerated
Plaque
Fissured Plaque
with Thrombosis

Johnson et al Am J Clin Nutr 2007
Obesity and Diabetes: The Twin Epidemics
One in three adults are obese
One in nine adults are diabetic
One in 30 adults are obese One in 50,000
adults are diabetic

Obesity Epidemic
11 bananas or 14
apples or 18 oranges
A Big Mac, large
chips and coca cola
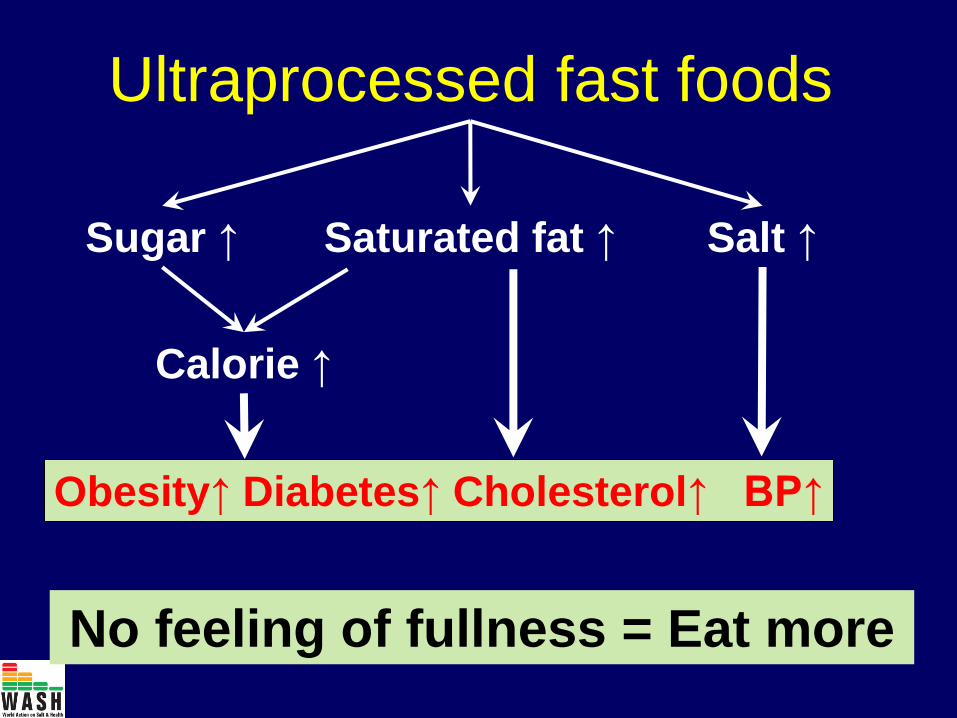
Ultraprocessed fast foods
Saturated fat ↑ Sugar ↑ Salt ↑
Calorie ↑
Obesity↑ Diabetes↑ Cholesterol↑ BP↑
No feeling of fullness = Eat more
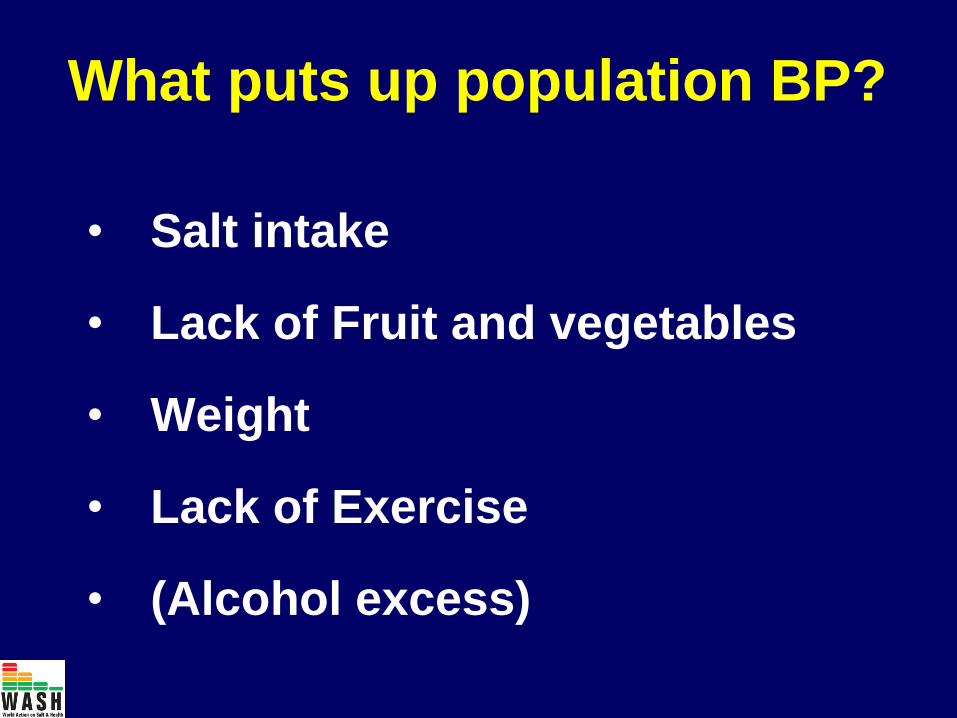
What puts up population BP?
• Salt intake
• Lack of Fruit and vegetables
• Weight
• Lack of Exercise
• (Alcohol excess)
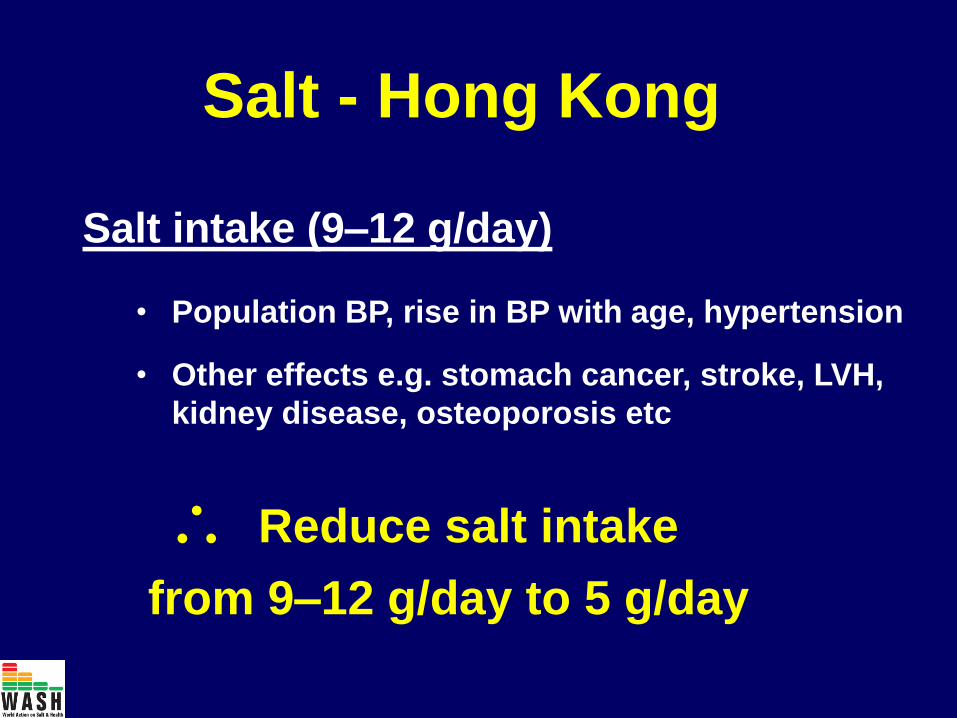
Salt - Hong Kong
Salt intake (9–12 g/day)
Reduce salt intake
• Population BP, rise in BP with age, hypertension
• Other effects e.g. stomach cancer, stroke, LVH,
kidney disease, osteoporosis etc
from 9–12 g/day to 5 g/day
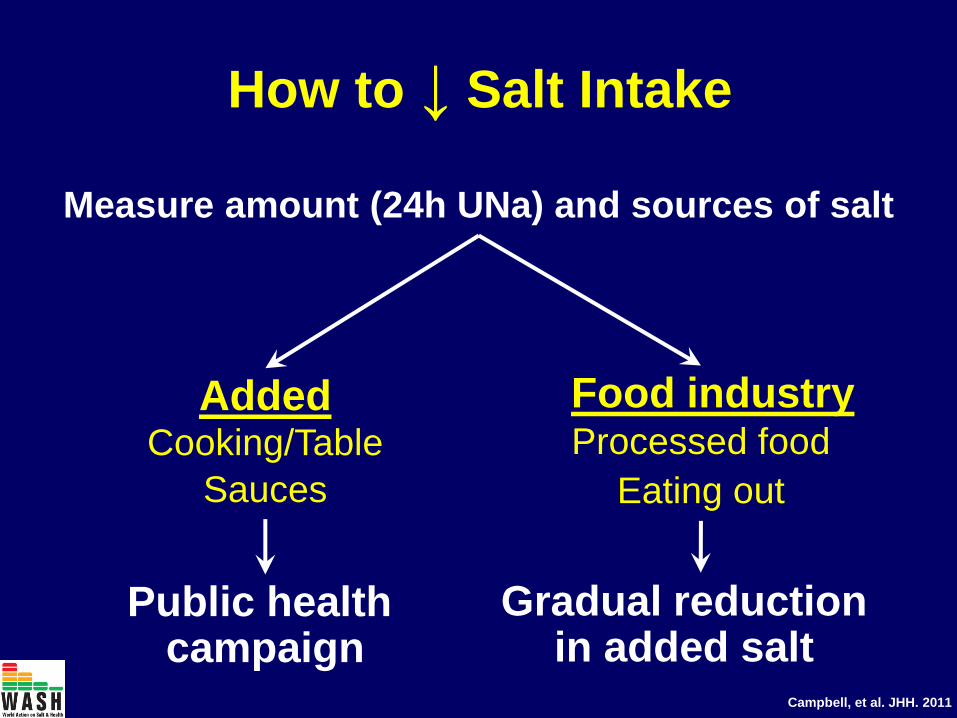
How to ↓ Salt Intake
Measure amount (24h UNa) and sources of salt
Added Cooking/Table
Sauces
Food industry Processed food
Eating out
Public health campaign
Gradual reduction in added salt
Campbell, et al. JHH. 2011
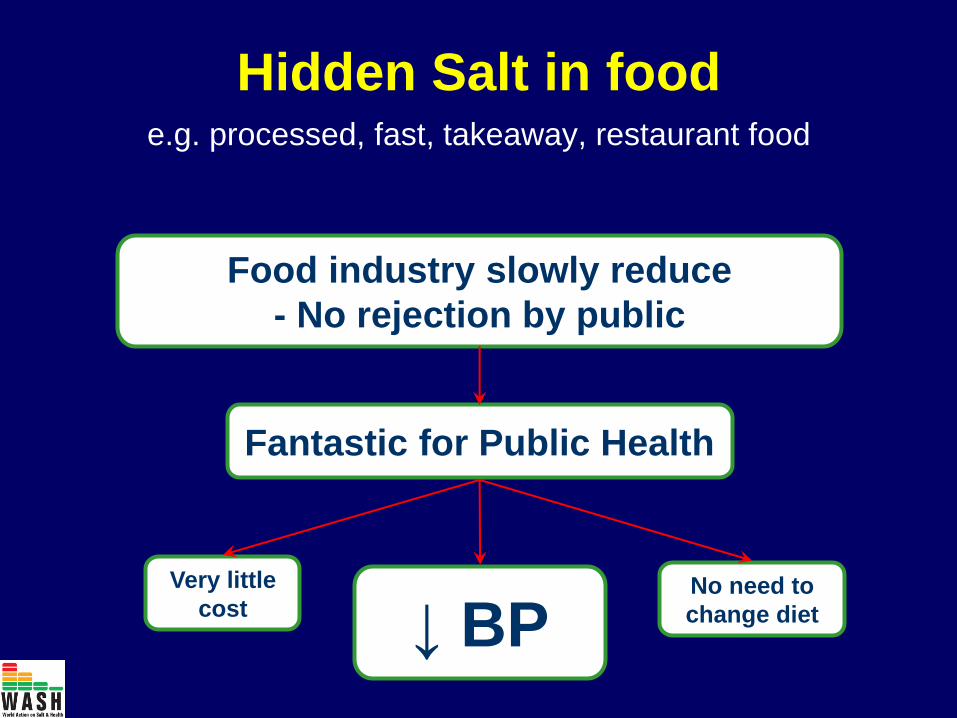
Fantastic for Public Health
Very little
cost
Food industry slowly reduce
- No rejection by public
No need to
change diet
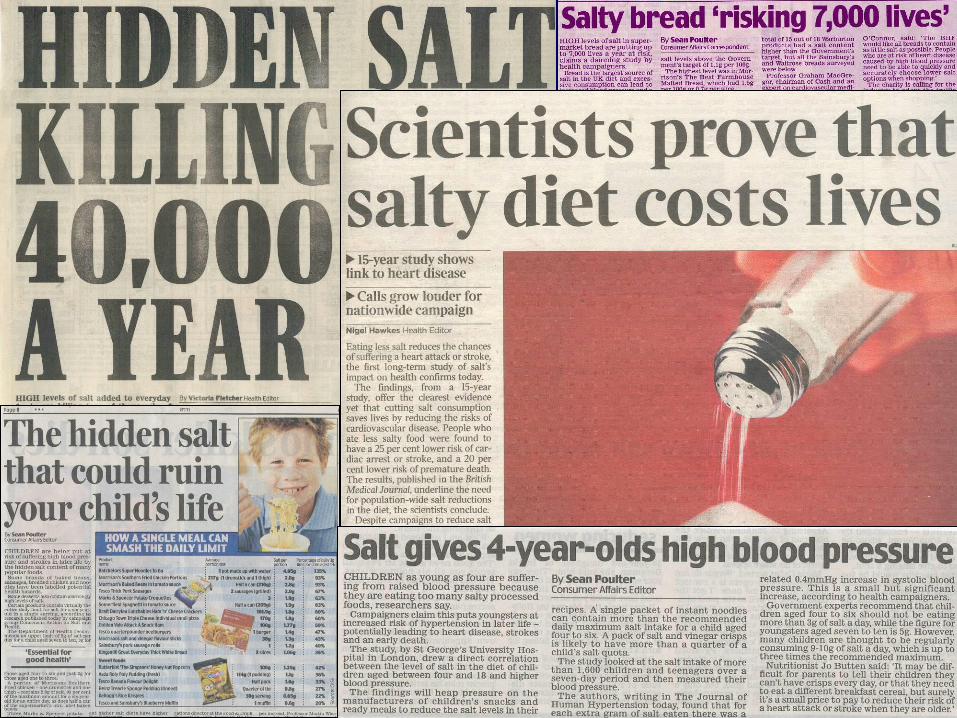
Hidden Salt in food e.g. processed, fast, takeaway, restaurant food
↓ BP
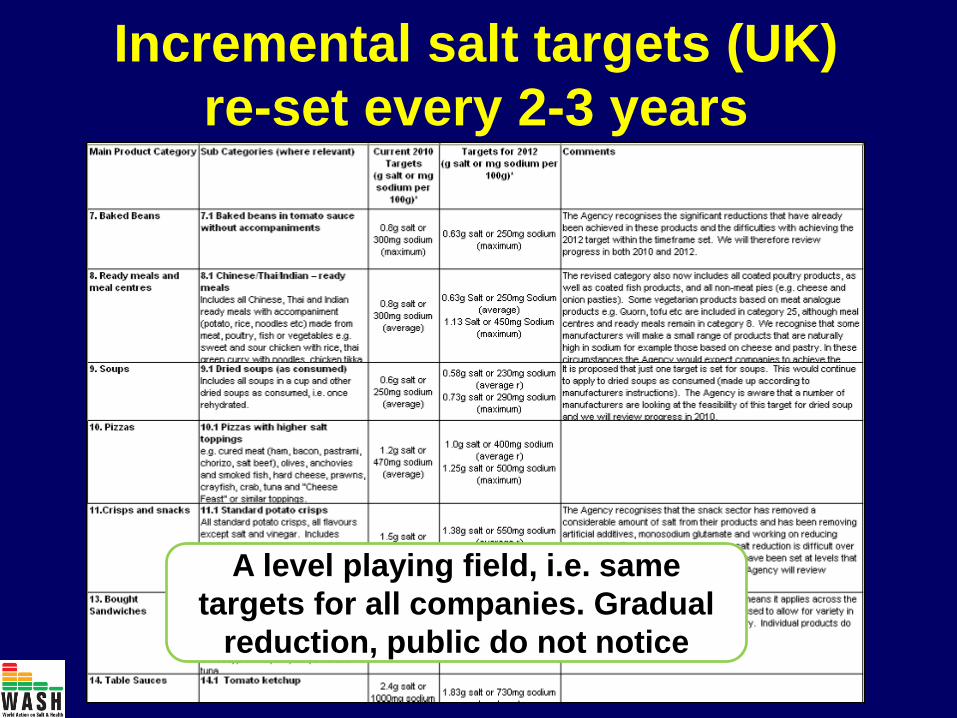
Incremental salt targets (UK)
re-set every 2-3 years
A level playing field, i.e. same
targets for all companies. Gradual
reduction, public do not notice

The voluntary ‘carrot and stick’
approach
food industry
www.actiononsalt.org.uk
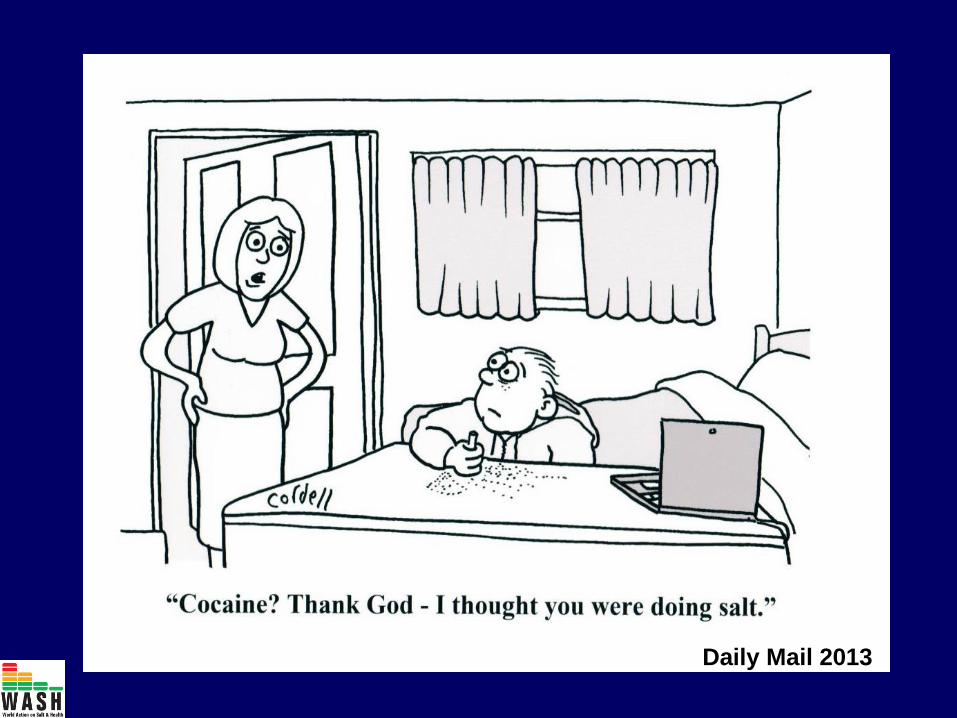
Daily Mail 2013
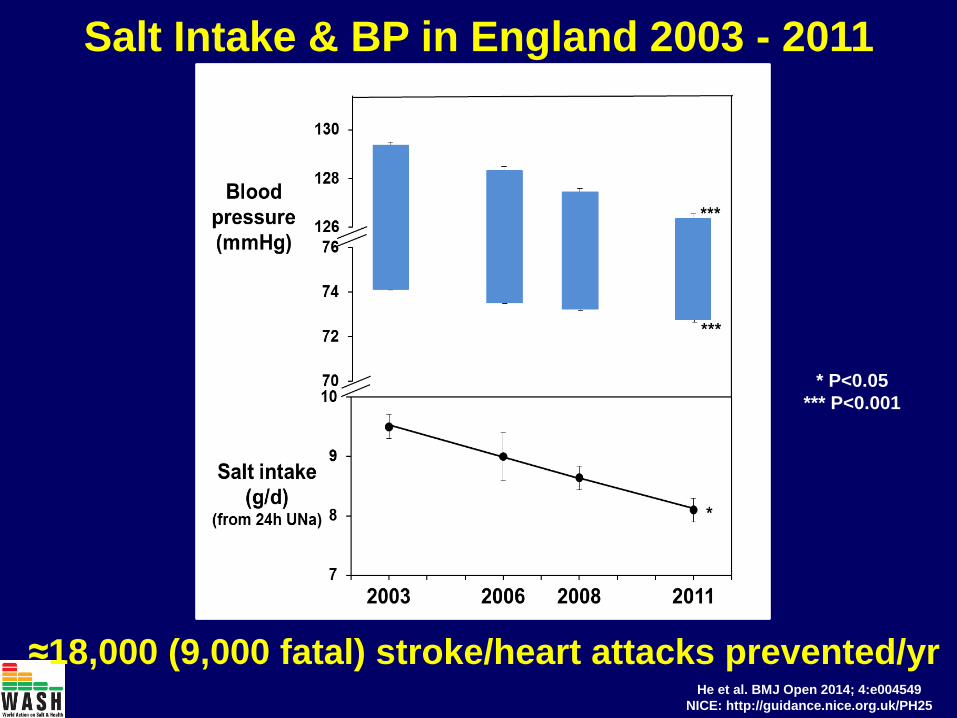
Salt Intake & BP in England 2003 - 2011
He et al. BMJ Open 2014; 4:e004549
NICE: http://guidance.nice.org.uk/PH25
≈18,000 (9,000 fatal) stroke/heart attacks prevented/yr
* P<0.05
*** P<0.001
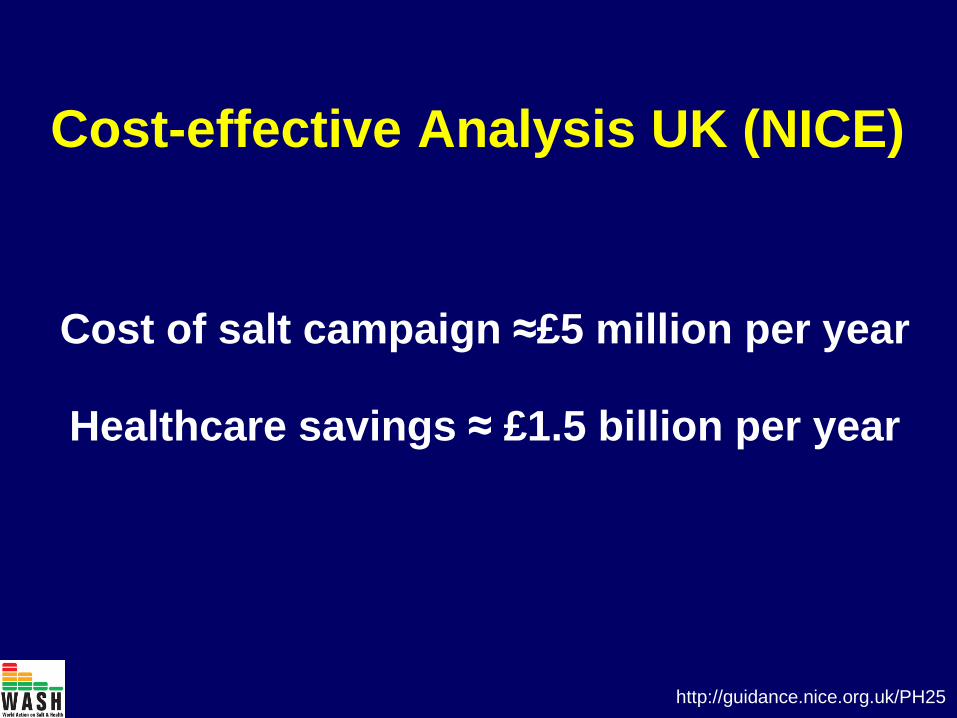
Cost of salt campaign ≈£5 million per year
Healthcare savings ≈ £1.5 billion per year
http://guidance.nice.org.uk/PH25
Cost-effective Analysis UK (NICE)
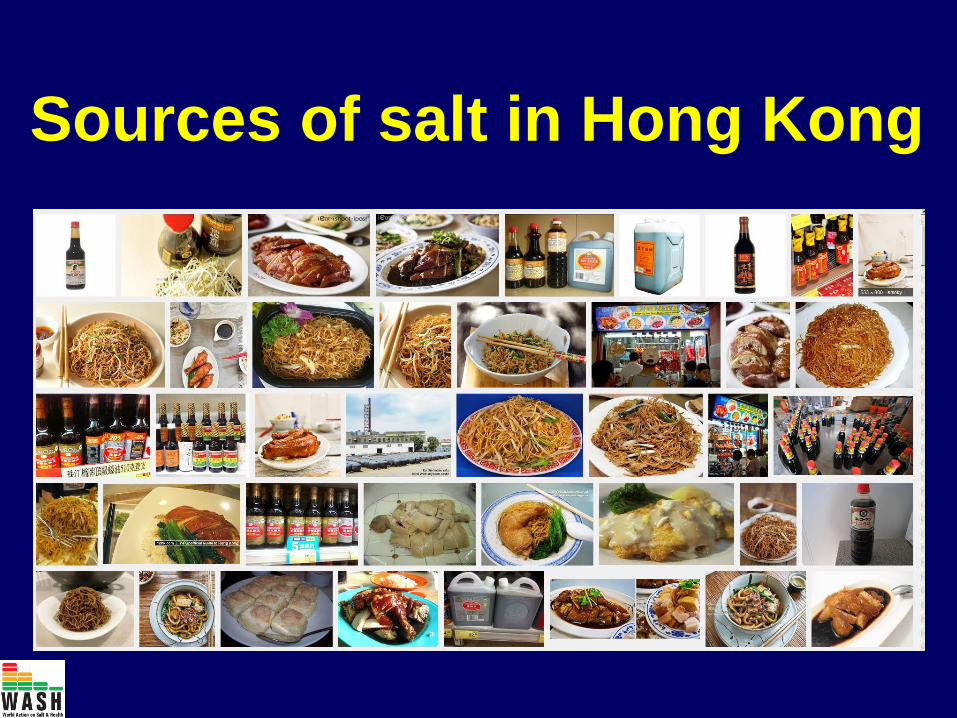
Sources of salt in Hong Kong
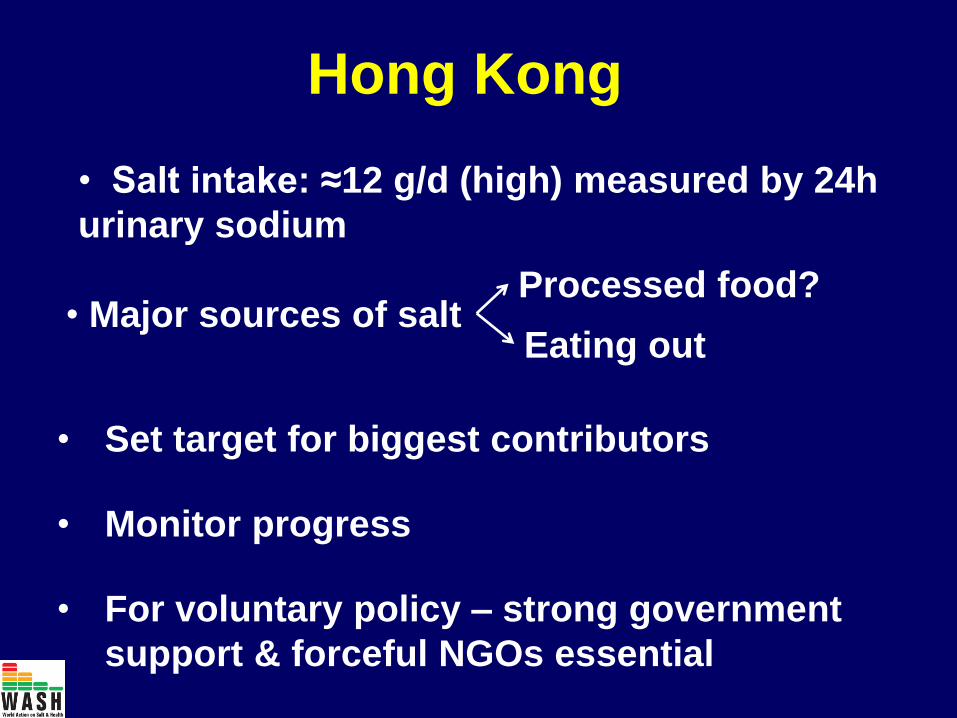
Hong Kong
• Salt intake: ≈12 g/d (high) measured by 24h
urinary sodium
Eating out
• Set target for biggest contributors
• Monitor progress
• For voluntary policy – strong government
support & forceful NGOs essential
Processed food? • Major sources of salt

China's “Little Emperors” Become
New Health Ambassadors

School-EduSalt Results (Cluster randomised trial, 28 primary schools, ≈3.5 months)
(Intervention vs control)
Salt intake ↓ 1.9 g/d in children (27%)
↓ 2.9 g/d in adults (25%)
↓ 0.8 mmHg in children (NS)
↓ 2.3 mmHg in adults (P<0.05)
Systolic BP
He et al. BMJ 2015;350:h770
Conclusion - Salt
• ↓ Salt – very cost-effective in
preventing CVD
• Hong Kong needs
a comprehensive strategy to ↓ salt
• Many thousands of strokes & heart
attacks will be prevented
Added Sugar Similar to Salt
• Pure, white
• Makes inedible food palatable
• Only recently part of human diet
• Sensitivity of taste receptor depends on
intake
• Hidden
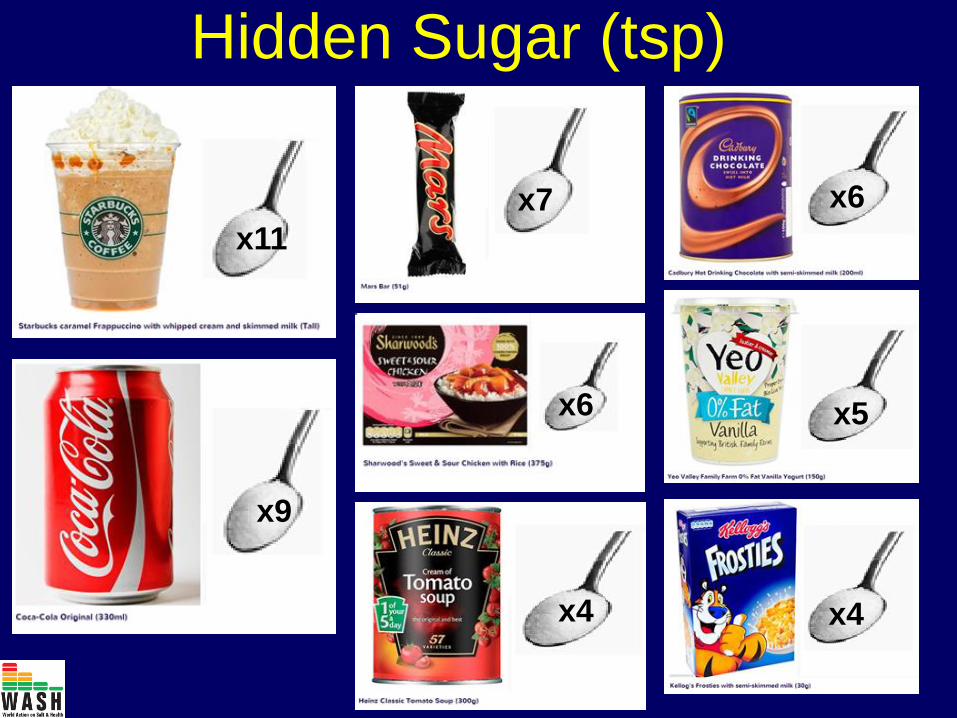
Hidden Sugar (tsp)
x11
x9
x7
x6
x4
x6
x5
x4
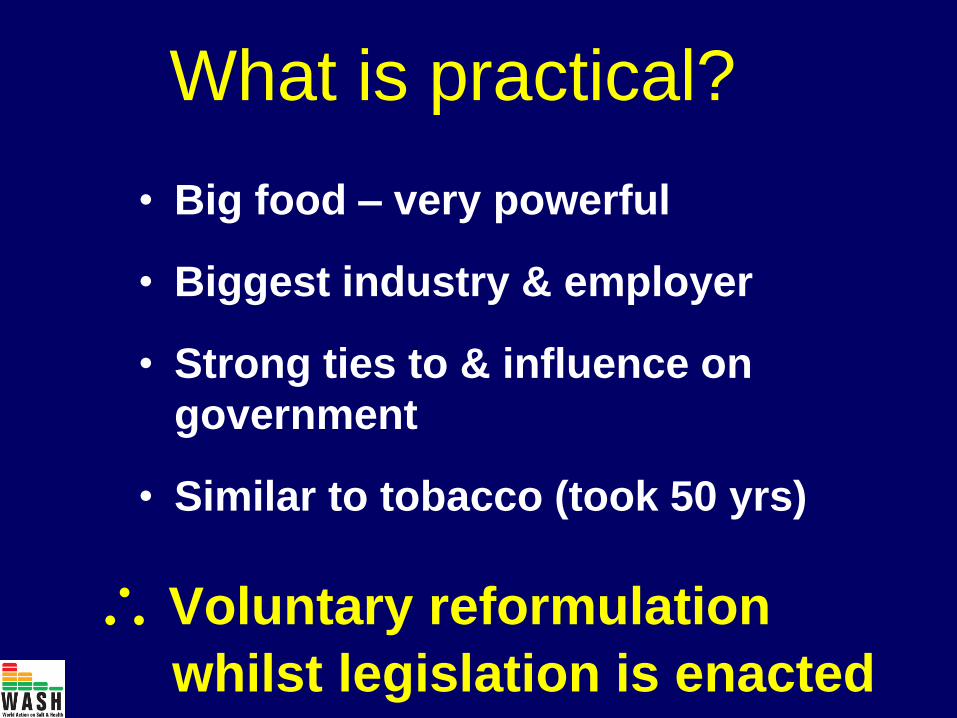
What is practical?
• Big food – very powerful
• Biggest industry & employer
• Strong ties to & influence on
government
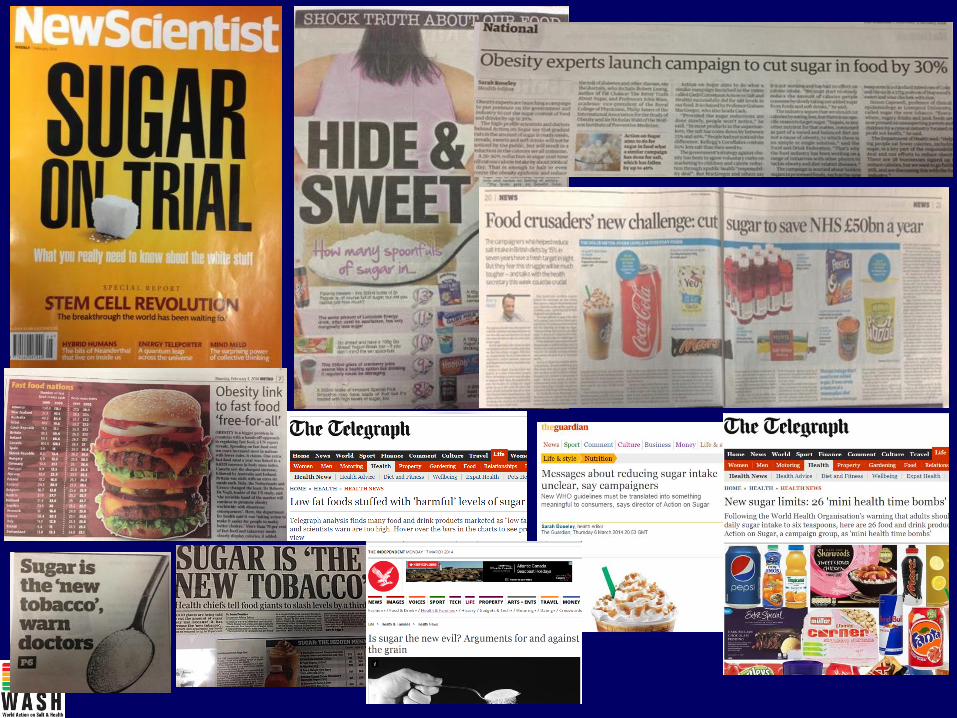
• Similar to tobacco (took 50 yrs)
Voluntary reformulation
whilst legislation is enacted

What else can we do?
• Regulate/legislate/tax - salt, sugar, fat
• Ban advertising unhealthy foods &
drinks
• Restrict availability
• Reduce portion size

What can we do ?
• Salt - UK: Incremental reformulation ongoing
• Sugar - Start incremental reformulation
• Fat - Start incremental reformulation
(sat fat esp. palm oil)

• Sugar-sweetened soft drinks immediately
• Foods with added sugar (NB: No replacement. Solid
foods ↓portion size)
• Incremental targets, i.e. 5% reduction per year
(≈40% reduction within 8 yrs)
• Reduce artificial sweeteners, i.e. ↓sweetness
Incremental sugar targets
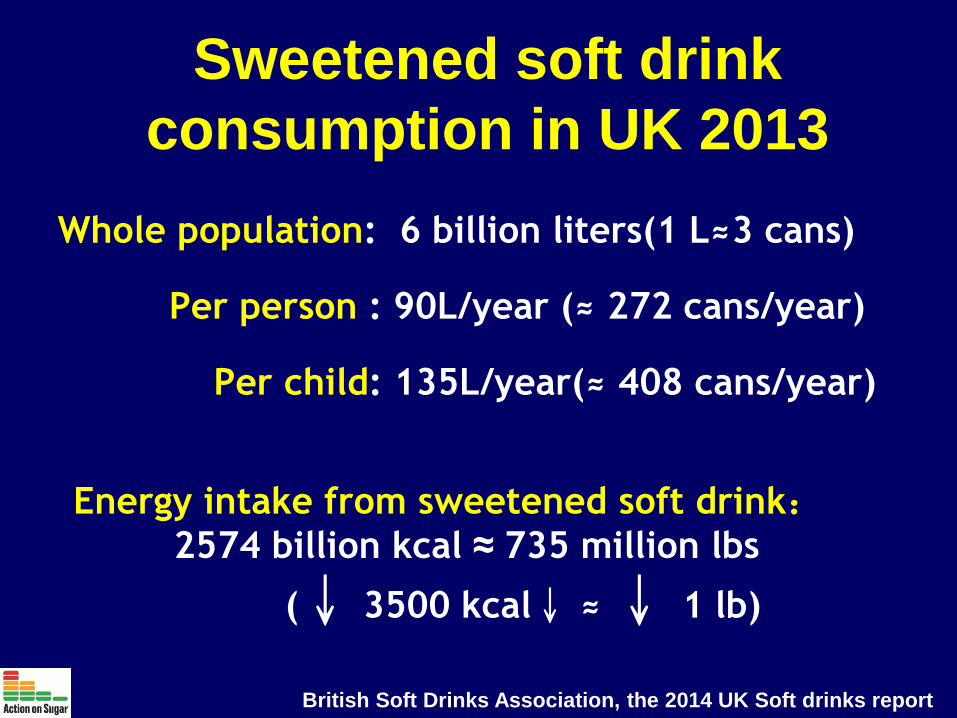
Sweetened soft drink
consumption in UK 2013
Whole population: 6 billion liters(1 L≈3 cans)
Per person : 90L/year (≈ 272 cans/year)
Per child: 135L/year(≈ 408 cans/year)
Energy intake from sweetened soft drink:
2574 billion kcal ≈ 735 million lbs
(↓ 3500 kcal↓ ≈ ↓ 1 lb)
British Soft Drinks Association, the 2014 UK Soft drinks report

Reformulation
5% reduction per year for 4
years(≈18.5%↓)
1224 billion kcal 350 million lbs
19,392 kcal 5.5 lbs
29,088 kcal 8.3 lbs
↓ Calories ↓ Weight
Population:
Per person:
Per child:
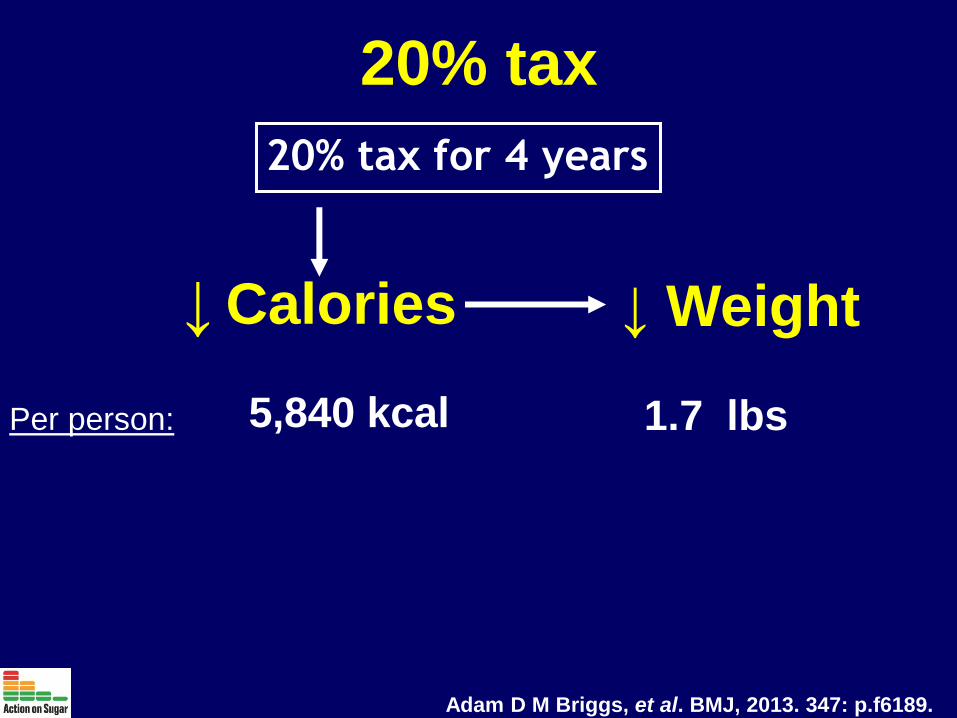
20% tax
20% tax for 4 years
5,840 kcal 1.7 lbs
↓ Calories ↓ Weight
Per person:
Adam D M Briggs, et al. BMJ, 2013. 347: p.f6189.

Tax
Reformulation Tax
Sales No reduction ↓
Cost ↓(∵less sugar) ↑
Profit ↑ ↓
↓ Calories More effective Less effective
Action Voluntary (like salt) Needs legislation
Reformulation v

Actions if food & soft drink
industry don’t act
a) Ban all marketing of unhealthy food
b) Reduce portion size & availability
c) Punitive tax on all soft drinks
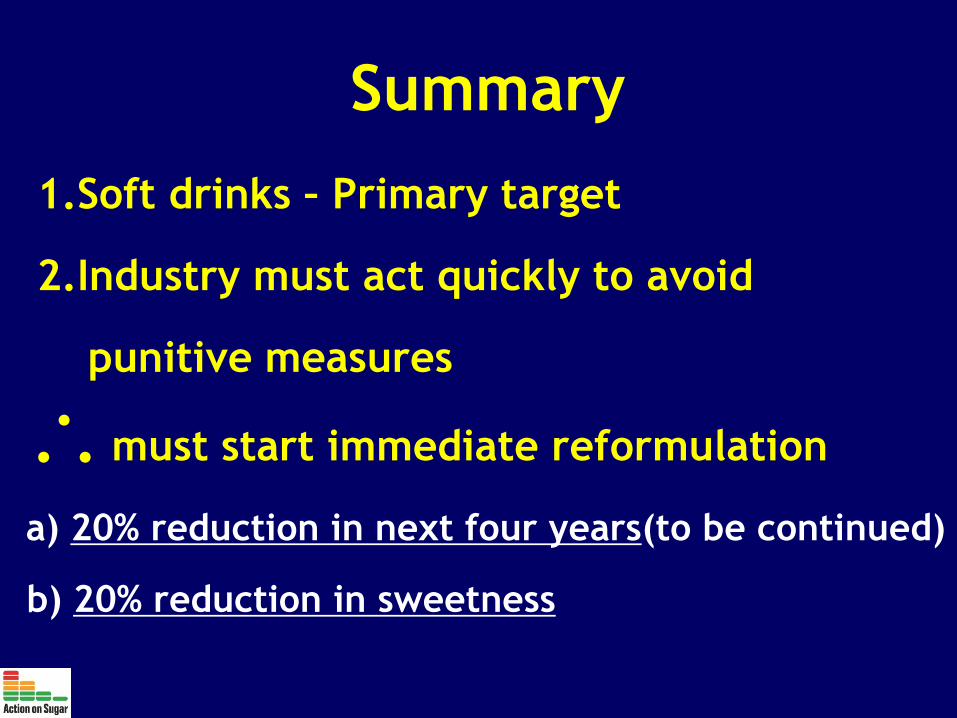
Summary
1.Soft drinks – Primary target
2.Industry must act quickly to avoid
punitive measures
∴ must start immediate reformulation
a) 20% reduction in next four years(to be continued)
b) 20% reduction in sweetness