nber working paper series is a great labor … · is a great labor shortage coming? replacement...
TRANSCRIPT
NBER WORKING PAPER SERIES
IS A GREAT LABOR SHORTAGE COMING? REPLACEMENT DEMAND IN THEGLOBAL ECONOMY
Richard B. Freeman
Working Paper 12541http://www.nber.org/papers/w12541
NATIONAL BUREAU OF ECONOMIC RESEARCH1050 Massachusetts Avenue
Cambridge, MA 02138September 2006
I benefited from the research assistance of Katie Bach.
© 2006 by Richard B. Freeman. All rights reserved. Short sections of text, not to exceed two paragraphs,may be quoted without explicit permission provided that full credit, including © notice, is given tothe source.

Is A Great Labor Shortage Coming? Replacement Demand in the Global EconomyRichard B. FreemanNBER Working Paper No. 12541September 2006JEL No.
ABSTRACT
This paper assesses the claim the the US faces an impending labor shortage due to the impending retirementof baby boomers and slow growth of the US work force, and that the country should orient labor marketand educational policies to alleviate this prospective shortage. I find that this analysis is flawed, bymaking growth of GDP the target of economic policy and by paying inadequate attention to the hugesupply of qualified low wage workers in the global economy. My analysis shows that the projectionsof future demands for skills lack the reliability to guide policies on skill development, and that contraryto the assumption implicit in the shortage analyses, demographic changes have not historically beenconsistently associated with changes in labor market conditions. I argue that if there is to be a shortage,the country should allow the competitive market to raise labor compensation rather than to adopt policiesto keep labor costs low.
Richard B. FreemanNBER1050 Massachusetts AvenueCambridge, MA 02138and [email protected]
The sky is falling down, the sky is falling down ... I must go and tell the king ... A great labor shortage is coming.
In the early 2000s, the business press and media began reporting that the US labor market
was on the verge of a major transformation. The retirement of baby boomers and slow projected
growth of the labor force were going to create a great labor shortage. Policy-makers should
forget about the sluggish real wage growth of the past three decades, the deterioration in
pensions and employer provided health care, the “jobless” recovery from the 2001 recession, and
fears of job loss from off shoring or low wage imports and focus on helping business find
workers in the coming shortage.
The Hudson Institute’s report Beyond Workforce 2020 (Judy and D’Amico, 1997) was
one of the earliest studies to express concern about the possible future shortage of labor, due to
predicted reductions in the growth of labor supply due to the retirement of the baby boom
generation and slackened population growth. Many other groups interpreted government
projections of future labor supplies and employment in a similar manner. The National
Association of Manufacturing warned employers that a gap of 5.3 million skilled workers would
develop by 2010 and expand to 21 million by 2020 (NAM, 2003). The Chamber of Commerce’s
2006 State of American Business Report declared that “We are staring right in the face of a
severe worker shortage as 77 million baby boomers prepare to retire in the next few years— with
a fewer number of younger workers available to replace them.” (U.S. Chamber of Commerce,
2006, p 13). According to Public Power, the magazine for the electrical utility industry “The
coming labor shortage could become the most significant problem the electrical utility industry
will face. BLS estimates shortage of 12 million skilled workers by 2010 and 20 million by
2 2020” (Atkinson, Public Power, 2005). Reporting the consensus from the Aspen Institute’s
Domestic Strategy Group, David Ellwood wrote that: "CEOs, labor leaders, community leaders,
all came to the unanimous conclusion that we will have a worker gap that is a very serious one.“
(cited by Overholt, 2004)
Time Magazine gave the projected labor shortage a positive spin for workers, calling it
The Coming Job: “The help-wanted ads may look thin — but thanks to aging baby boomers,
that's about to change” (Eisenberg, Time, 2002). Going further, one pundit dismissed fears that
off shoring good US jobs overseas would harm workers: “the long term tragedy of off shoring
isn’t that it’s snatching away skilled American jobs but that it isn’t snatching enough of
them”(Kaihla, 2003). The Employment Policy Foundation worried that “if current trends
continue, the labor force will only grow to 165 million by 2030, a shortage of 35 million workers
… (with) serious consequences, slower growth in the standard of living, change in the balance of
payments, “wage-push” inflation, … Inequality, persistent structural unemployment.” (Ed Potter,
Employment Policy Foundation, 2001?). Seemingly concerned that readers would find the
claimed shortage dubious in light of their job market experiences, Fortune headlined its report on
the subject, “Believe It or Not, a Labor Shortage Is Coming” (Fisher, 2003).
In this paper, I assess the shortage claims1 and the labor supply and demand projections
on which they are based. I conclude that there is no more reason to believe that the US faces a
great future labor shortage than that Chicken Little got it right about the sky falling down. The
retirement of baby boomers and slow growth of the US work force, on which the shortage claims
are based, will most likely have modest and hard to detect impacts on the job market. I argue
that increased supplies of skilled labor in low wage countries will impact US workers more than
slower increases in domestic labor supply. If there is to be a great labor shortage in the
1 Economists try to avoid the words shortages and surpluses since in a well-functioning market, prices or wages adjust so that buyers and sellers are in equilibrium, with no one wanting to sell or buy more. One way to interpret the wide use of the terms is that they include changes in prices from long run equilibrium values that could have
3 foreseeable future, it will come from something that the shortage soothsayers ignore – a global
pandemic that kills millions of people – whose implications would go far beyond assuring that
business obtains the labor it may seek 10 or 20 years down the road without incurring higher
wages.
My conclusion is based on three findings
1. The logic of labor shortage analyses is flawed. The most dramatic shortage claims
begin with the premise that labor supply should increase to maintain a fixed rate of growth of
GDP – a cart before the horse policy from the perspective of standard welfare analysis. In
addition, none of the shortage analyses pay adequate attention to the global economy, where the
supply of low wage educated workers in less developed countries creates a labor surplus
worldwide, and where other advanced countries are projected to have greater slowdowns in their
labor supplies than the US.
2. Projections of future demands for skills lack the reliability to guide policies on skill
development. Demand for labor in detailed occupations has historically been more greatly
affected by changes in technology or unexpected changes in the composition of output among
industries than by replacement demand due to retirements. Globalization makes forecasting skill
shortages or surpluses in the US or any specific country more difficult than in the past.
3. Contrary to the assumption implicit in the shortage analyses, demographic changes
have not historically been consistently associated with fchanges in labor market conditions, even
for the young workers whose position is most sensitive to changing market realities. The
employment and earnings of young workers depends more on macro-economic conditions, wage
setting institutions, and technological developments than on demography.
Dissecting Shortage Claims
been avoided if market participants had foreseen the shifts in demand or supply better than they did.

4 The most alarmist claims that a great labor shortage is coming assume that the country
should increase total gross domestic product (GDP) in the future at a rate comparable to the
growth rate in the recent past. From 1980 to 2005, US real GDP grew by 3.1 % annually, with
1.4% due to the growth of labor supply and 1.7% to the growth of labor productivity. Given
projected declines in labor force growth to 0.7% per year, the 3.1% growth of GDP will be
unsustainable absent increases in labor productivity above historical levels.2 To maintain past
growth of GDP with 1.7% growth of labor productivity from 2005 to 2030, the US would need
200 million workers in 2030. This is 30 million workers short of the projected labor supply. The
shortfall between the projected growth of the labor force and the growth necessary for 3.1%
growth of GDP defines the coming labor shortage.
The flaw in this mode of thinking is that it treats GDP rather than GDP per capita as the
touchstone of economic policy, contrary to virtually all analyses of social welfare. As a wealthy
country, the US can increase the rate of growth of GDP whenever it wants. All the US has to do
is to open the borders to additional immigration. Labor supply would increase as much as
desired, raising GDP and returns to capital while reducing wages. Absent an open borders
policy, maintaining a desired growth of GDP in the face of slower growth of labor supply
requires increased labor productivity, which in turn requires additional investment in physical or
human capital or R&D. Since growth of GDP depends on all factors of production, we could
just as well call the likely slower growth of GDP the coming shortage of capital or R&D and
focus policy on ways to create more capital investment and technological advance as well as
ways to increase the quality or quantity of labor.
If macro-calculations based on maintaining a given growth rate of GDP were the sole
argument for the coming labor shortage, I doubt whether many economists or business leaders
2 The data on actual changes in GDP and employment are from the Council of Economic Advisors, Economic Report of the President 2006, tables A-2 and B-36. The projections are from table 1 of this paper.
5 would take the claim seriously. What gives credence to the claim are demographic projections
that the US work force will grow more slowly than in the past half century or so, with the growth
concentrated in minority groups that have historically obtained less education and skills than the
majority population, and a widespread belief that demographic changes have huge discernible
impacts on the economy. Shortage analysts fear that a falling growth rate of skilled labor, in
particular, will produce bottlenecks in production that will reduce growth of GDP per capita.
Many argue that the country could avoid these problems by preventive investment in education
and training directed at likely bottleneck or shortage areas.
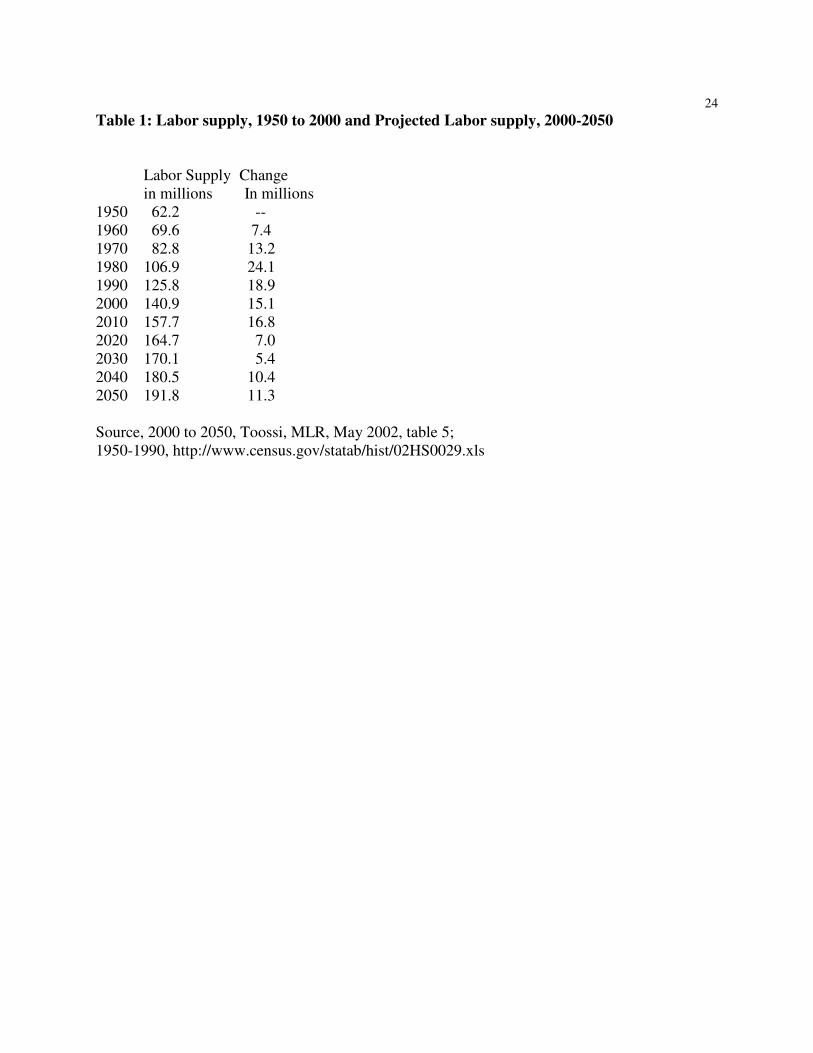
Table 1 examines the magnitude of the projected reduction in the growth of labor supply.
It shows the number of persons in the US labor force in each decade from 1950 to 2000 and the
projected labor force from 2000 to 2050; and the absolute change in labor supply from decade to
decade. From 1950 to 2000 the labor force grew by 78.7 million persons or 127%. From 2000
to 2050, the projected growth of the labor force is 50.9 million persons, or 36%. This
deceleration in the rate of growth is expected to be particularly intense from 2010 through 2030,
when just 12.4 million additional persons are expected to join the labor force. The reason for
this timing is the retirement of baby boomers (those born between 1946 and 1964).
The rapid growth of the work force in the 1950s and 1960s came largely from increased
numbers of woman workers, primarily white women. In the 1970-1990s growth came from
immigration and a continued influx of women into the work force. In the 2000-2050 period
growth of the work force is expected to come disproportionately from Hispanics and blacks –
groups with below average education levels. The share of the US population from disadvantaged
minorities (black, Hispanic, American Indians, Alaska Natives) is projected to rise from 25% in
2000 to 37% in 2050. 3 Some analysts worry that the US work force will become less skilled
3 http://www.census.gov/ipc/www/usinterimproj/natprojtab01a.pdf, table 1, where I estimate the disadvantaged minority group as 1 minus the proportion all white non Hispanic , all Asian, and all other races.
6 unless the country adopts new policies to help these groups improve their educational skills and
attainment. In addition, because the US population will be aging, the number of persons in the
traditional years of retirement will rise relative to the more slowly growing work force,
burdening the work force to produce sufficient output to pay the retirement income and health
costs of the aging population.
The global context
If the US was the only country in which the growth of the potential work force was
projected to decline rapidly or if the US was a closed economic system, with little access to
workers in other countries, this focus on domestic labor supply to the exclusion of supply
developments elsewhere might be justifiable. But in the global economy, demographic
developments and labor conditions in other countries can affect the US labor market.
Globalization gives US firms access to labor overseas through foreign direct investment, off
shoring, or subcontracting and access to foreign-born labor that immigrates to the US. From this
perspective, it is incumbent to assess the claims of a coming labor shortage in a global context,
rather than to treat the US as a closed economy, dependent only on domestic labor to produce
goods and services.
As a first step in placing the shortage projections into a global context, I have examined
the actual and projected change in the populations of young persons (those aged 18-23) and of
the 15-59 year olds that make up most of the work force in the US, Western Europe, Japan, and
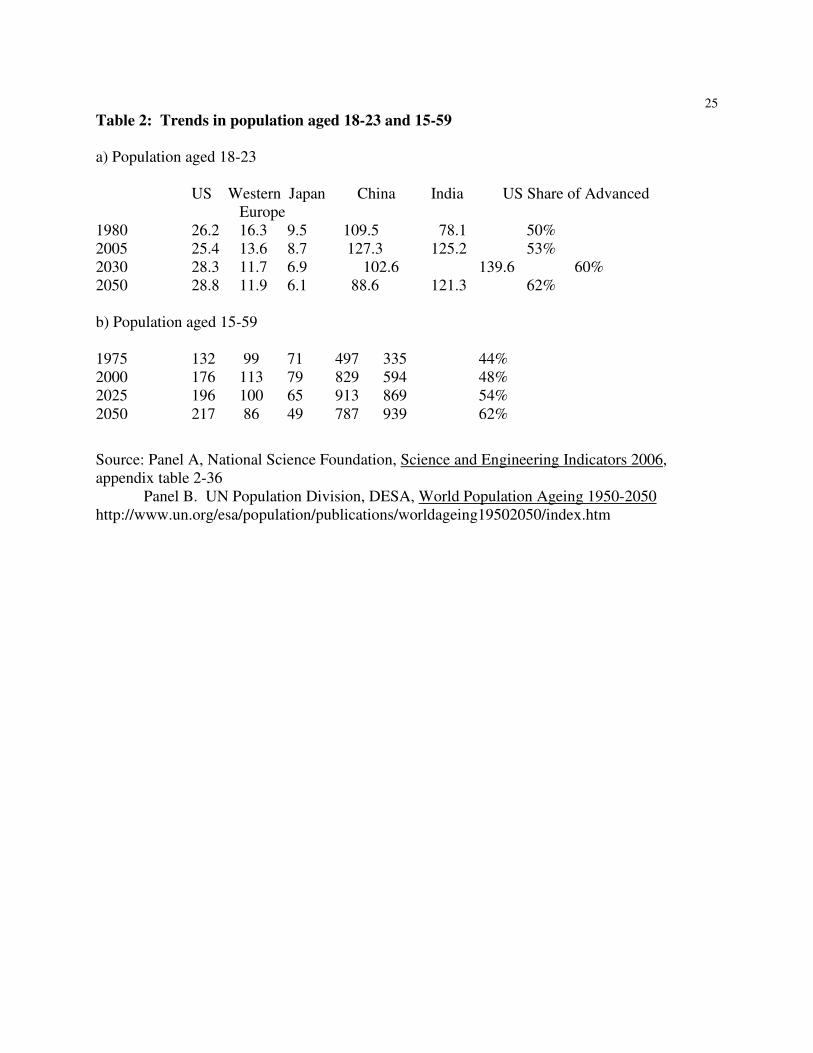
China and India (See table 2). The underlying projections are from the UN, which forecasts an
aging of the world’s population through 2050, (UN, 2005) and a slowdown in population growth
in much of the world outside of Africa.
The figures in Panel A of table 2 show a drop in the number of persons aged 18-23 in the
US from 1980 to 2005 and an expected rise in the numbers to 2030 and 2050. These figures are
consistent with the slower growth of the work force over time. But the figures also show that
7 from 1980 to 2005 the number of young persons in Western Europe and Japan fell more rapidly
than in the US and will continue to drop thereafter. In 2050 the US will have 13% more persons
in this age group than in 2005, whereas Western Europe will have 13% less and Japan 30% less.
The US share of 18-23 year olds in advanced countries will continue to trend up.
But the projected reduction in the supply of young persons is not limited to the advanced
countries. Due to the single child policy, the projections for China also show a drop in the
number of young persons, with the result that the ratio of the number of young Americans to the
number of young Chinese will increase through 2050. Even India is projected to have a
decelerated growth in the number of young people from 2005 to 2030 and a decline thereafter.
In short, panel A shows that the projected change in the US youth population does not stand out
as creating an extraordinary shortfall compared to the projected changes in the number of young
persons in the main countries with which the US is closely tied through the global economy.4
The numbers in Panel B of table 2 for the population aged 15-59 tell a similar story. The
increase in the US population in this age bracket drops from 44 million additional persons in
1975-2000 to 20 million in 2000-2025 and 21 million in 2025 to 2050. The projected changes in
Western Europe and Japan are much greater, with the population in this age bracket predicted to
decline from 2025 to 2050. The US share of the population in advanced countries will thus keep
rising. As for the two major highly populous developing countries, China’s population aged 15-
59 is projected to rise through 2025 and then to fall through 2050 while India’s population is
expected to increase throughout the period. The ratio of the Chinese population to the US
population will barely change from 2005 to 2050. The UN projects that the proportion of the
world’s population in India, Africa, and Latin America will rise.
The doubling of the global work force
4 The UN projections from which these data are based show a huge increase in the youth population in Africa, since the UN does not anticipate a fall in birth rate in that continent to the levels elsewhere.
8 In the global economy, where firms “source” labor worldwide, where consumers buy
goods and services made in countries who are part of the world trading system, and where
immigrants move among countries, labor developments in one country are likely to affect
conditions in other countries. In the 1990s, the global labor market changed greatly when China,
India, and the ex-Soviet bloc joined the world trading system. Before then, these countries had
trade barriers, self-contained capital markets, and only limited immigration to the advanced
western countries, all of which isolated their labor markets from those in the US or in the rest of
the capitalist global world. The collapse of Soviet communism, China’s decision to marketize its
economy, and India’s rejection of autarky, changed all this and brought approximately 1.3 billion
new workers into the global capitalist system (see figure 1). Firms in advanced capitalist
countries could suddenly hire low wage workers in China, India, and the ex-Soviet bloc to do
work that might previously have been done in advanced countries or in other developing
countries. I estimate that this roughly doubled the number of workers in the world economy.
Most important, because these countries had relatively little capital, their entry into global
capitalism reduced the global capital-labor ratio by about 40%, which creates the global
opposite of the labor shortage projected for the US: an excess of labor at the wages paid in
advanced countries. This will impact labor markets in the US, in other advanced economies, and
in other developing countries. Assuming that globalization continues unabated, I expect US firms
to be able to meet potential shortfalls in domestic labor supplies for tradable goods and services
by hiring labor overseas, and to seek immigrant labor to ameliorate potential labor shortages in
the production of non-traded goods or services.
If workers in China, India, and the ex-Soviet bloc had the same mix of skills as American
workers, it would be incontestable that they would compete with American workers and offset if
not overwhelm any future shortage of US workers. But workers in these countries do not have
the same skill set as Americans. A disproportionate number of Chinese and Indians are peasants
9 with limited education and relatively have the university training of Americans. The ex-Soviet
bloc workers are better educated, but less numerous and suffer from having worked under
communist conditions. Perhaps the right way to consider these workers is as complements rather
than substitutes for American workers, who will increase US demand for educated labor relative
to less educated labor, and thus create a greater potential shortage of skills in the US.
This was, after all, the standard assessment of the impact of globalization on the US when
the country was debating the NAFTA treaty with Mexico. Proponents of the treaty argued that
the US would gain good skilled jobs from increased trade with Mexico while exporting low
wage less skilled jobs. This pattern is consistent with the predictions of Heckscher-Ohlin trade
theory, in which comparative advantage is exogenous; and with the principal model that
economists have used to analyze trade between advanced and developing countries – the “North-
South” model in a dynamic context, where the North (=US and other advanced countries) have a
comparative advantage in high tech sectors. The natural policy recommendation from this
analysis is that US workers should invest more in human capital. The workers in China, India,
and other developing countries would never be able to catch up in skills and adversely affect
educated US workers.
This analysis does not seem to characterize the current global labor market. Developing
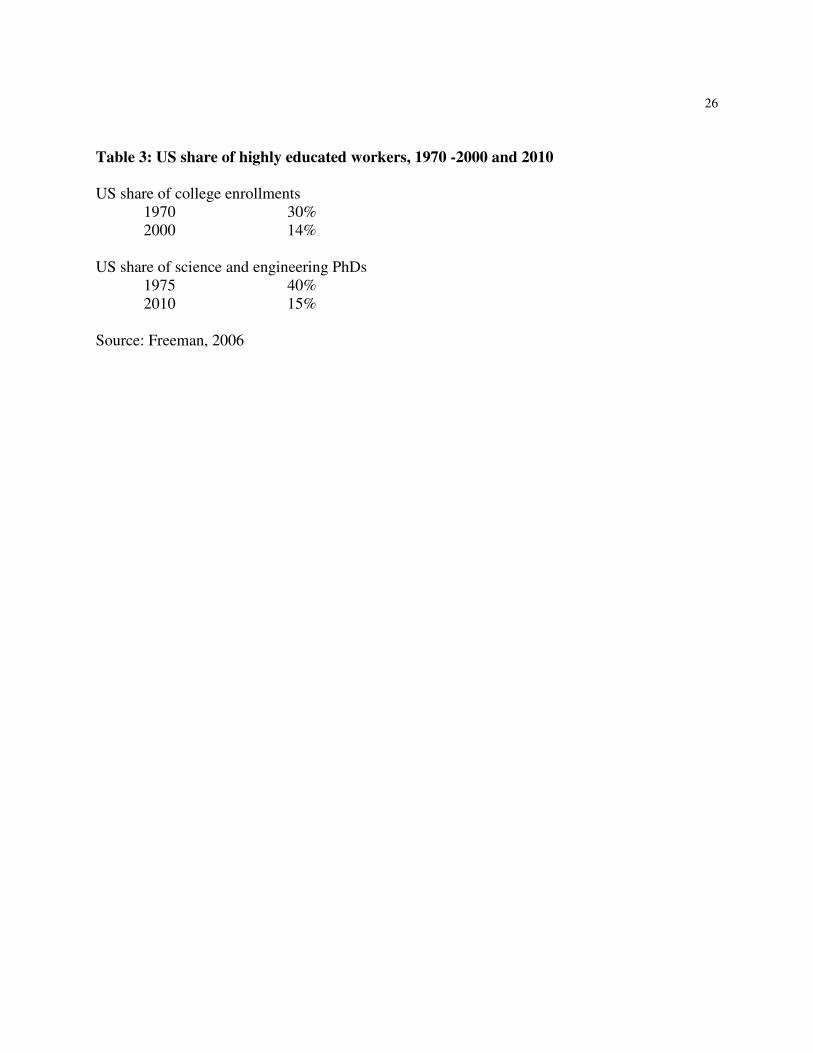
countries, particularly China, are educating their work forces at a rapid pace. Table 3 shows that
the US edge in giving university training to its work force declined dramatically from the 1970s
through the 2000s. In 1970 approximately 29% of university enrollments worldwide were in the
US. By 2000, the US proportion of university enrollments worldwide had fallen to 14%.
Similarly, at the PhD level, the US share of doctorates produced around the world has fallen
from about 50% in the early 1970s to a projected level of 15% in 2010. Some of these trends are
due to the increased proportion of the world’s population in developing countries, but much is
due to the spread of mass higher education to most countries.
10 One consequence of the increase in the supply of highly educated workers around the
world is that US multinational firms “globally source for labor” in ways they could not do three
decades ago. Another consequence is that the US has been able to meet a large proportion of its
rising demands for science and engineering workers through immigration. No readily available
data set measures the increased proportion of foreign-born highly educated workers employed in
US multinational around the world, but standard government surveys document the importance
of immigration of scientists and engineers from overseas.
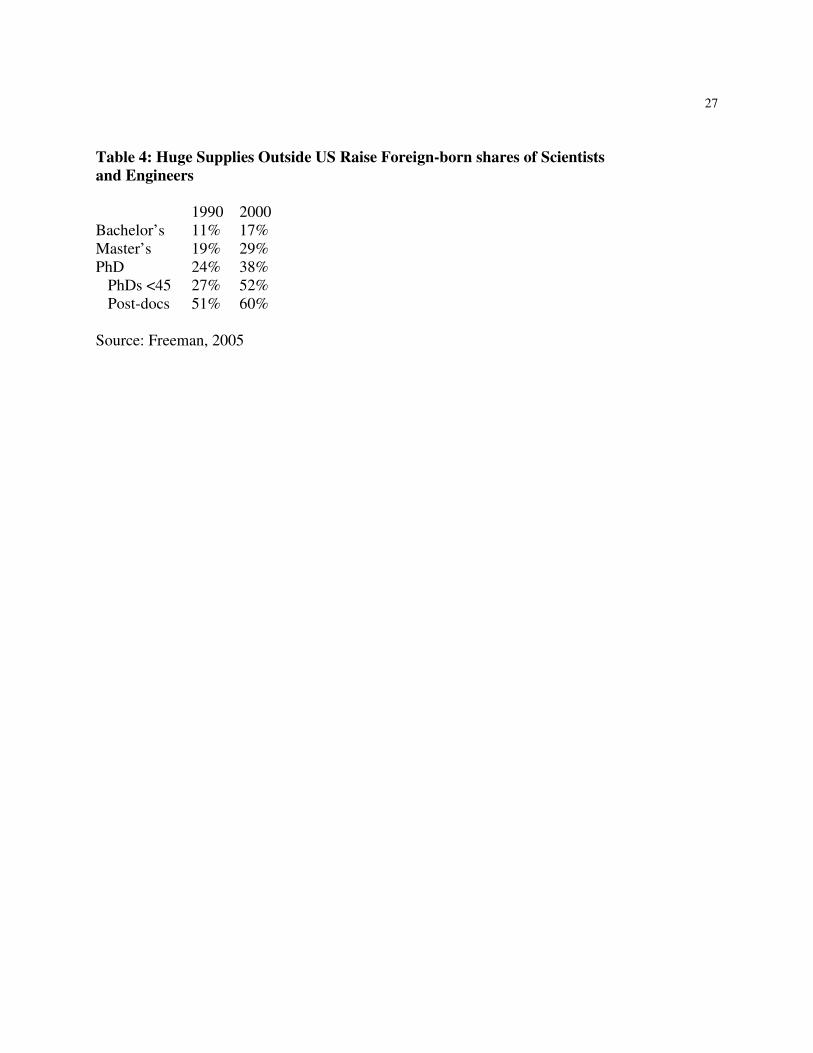
During the 1990s rapid growth of the US economy, the country greatly increased its
employment of scientists and engineers. It did so despite fairly constant numbers of graduates in
these fields among citizens or permanent residents and without markedly raising the salaries of
these workers. As table 4 shows, the US was able to meet increased demands for scientists and
engineers without huge increases in salaries by “importing” foreign born specialists in these
areas. Some of the foreign born obtained their education in the US and remained to work in the
country. But most of those with BS degrees and roughly half of those with higher degrees
graduated overseas and came to fill jobs. If the US economy demands more highly skilled
workers in the period of projected slow labor force growth, it should be able to increase supplies
by admitting more immigrants in areas with rising labor demand, as it did in the 1990s.5
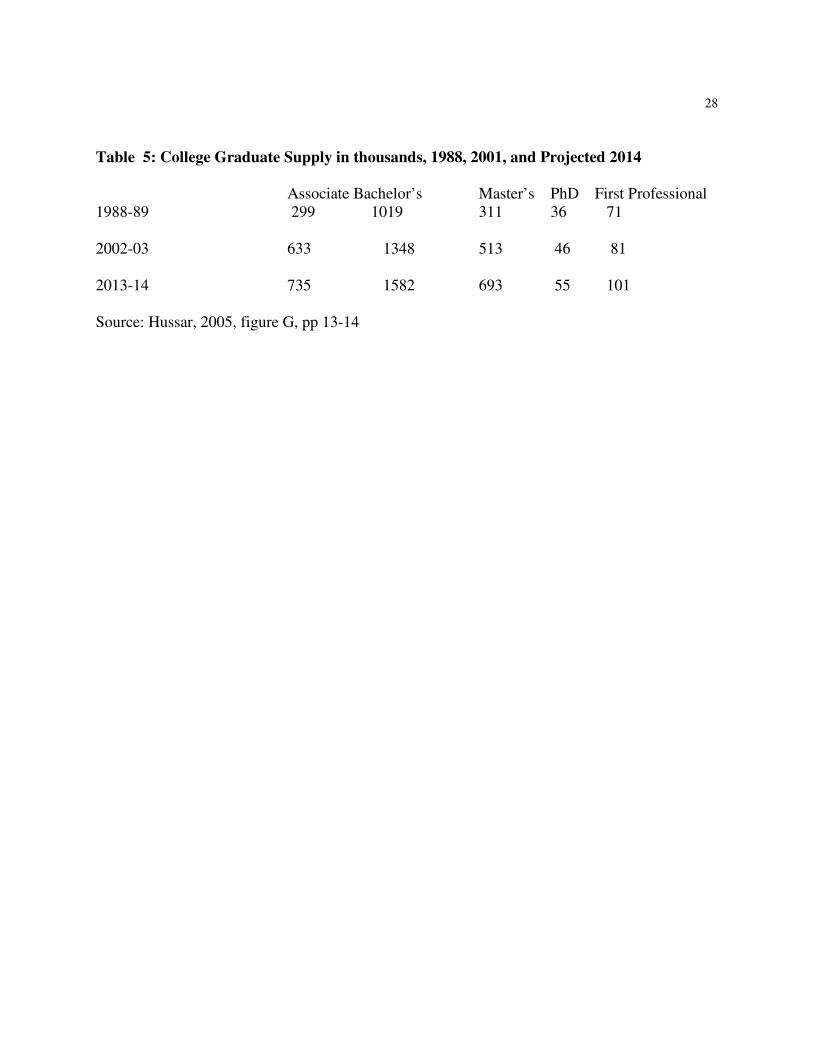
Finally, while the National Center for Educational Statistics does not provide long term
projections of the number of college graduates, master’s or PhDs, the Center’s projections of the
supply of highly educated workers show continued growth in the numbers of persons through
2013 (table 5). In the 1970s-2000s, the growth of the supply of college graduates in the US was
spurred by a large increase in the proportion of women obtaining degrees. The proportion of
young minority persons who obtained bachelors and higher degrees rose as well. Thus, even
5 From the mid 1990s through early 2000s the US doubled the budget of the National Institute of Health. This had little positive impact on the careers of new US bio-scientists, whose pay remained among the lowest among scientists and who had limited career prospects. One reason was the huge supply of post-docs and graduate students
11 though the US edge in higher education will undoubtedly continue to diminish -- OECD data
show that the US no longer leads the world in the proportion of young persons enrolled in higher
education6 – several advanced EU countries have higher rates of enrollment than the US – but
the US will still be producing large and increasing numbers of university graduates.
occupational/skill demand forecasts
Projections of labor shortages require analysts to project labor demands as well as labor
supplies. To be useful for education and training decisions, the projections must have some skill
or occupation dimension. How does the Bureau of Labor Statistics (BLS) project demand for
labor? Are those projections sufficiently precise to guide economic policy?
Every two years, the BLS’s Office of Occupational Statistics and Employment
Projections projects the growth of demand in occupations, which it publishes in the Occupational
Outlook Handbook. At the heart of the BLS’s occupational projections is an economy-wide
fixed coefficient input-output model. This model begins with a set of projections of the growth
of the major components of final demand for economic outputs; and then uses input-output tables
to translate the projected growth of final demands into growths of output in different industries.
The BLS transforms expected outputs into expected levels of employment by industry using
independent projections of productivity growth by sector. Finally, it applies coefficients relating
employment in each occupation to employment in each industry to project the future
occupational “needs” associated with the expansion or decline in employment in that industry.
The key to this step are the employment coefficients, which the BLS bases on historical data on
the employment of workers in a given occupation within an industry, which it adjusts with a
“change-factor” matrix of likely changes in the utilization of workers with different skills within
industries. The BLS gives the example of systems analysts, which it adjusted upward in its
from foreign countries willing to work at low wages in US labs. 6 National Science Foundation, Science and Engineering Indicators 2006.
12 1990s projections because these workers “would be expected to become a greater proportion of
each industry's employment as the number of applications for computer use continues to
increase.”7 Finally, the BLS sums the estimates of employment in an occupation by industry
across all industries to obtain the projected occupational employment. 8
This technique works reasonably well to forecast the growth of highly aggregated
occupations in periods when the economy does not undergo any dramatic changes and when
technological change does not greatly alter the demand for skills. It also works well for detailed
occupations where most persons work in the same industry and where productivity growth and
final demands are reasonably stable. In its assessment of the 1984-95 projections, the BLS
reports that they “captured the majority of the general trends ... (with) the most glaring
inaccuracies in the projections of detailed occupations reflect(ing) the conservative nature of
projected growth rates;”9 and that the principal source of projection error was unexpected
changes in the intra-industry utilization of different occupations. For instance, the 1984-95
projections were highly accurate for cooks in institutions or cafeterias (18.0% projected growth
of employment vs 18.1% actual growth) but under predicted the growth of child care workers,
personnel, training, and labor relations specialists, radiological technologists, and various
computer specialties, among other occupations. Unfortunately projections that are reasonably
accurate for occupations with relatively stable employment but which fail to foresee big changes
in demands for occupations that are likely to involve new skills are of limited value in assessing
future “shortages.”
My analysis of the accuracy of BLS projections of employment, based on a regression
model that links actual changes in occupational employment to the projected changes for the
7 Bureau of Labor Statistics, Occupational Projections and Training Data, 2004-05 Edition, chapter 2, page 42 http://www.bls.gov/emp/optd/optd002.pdf 8 See Daniel Hecker, Occupational Employment Projections to 2014, Monthly Labor Review, November, 2005, volume 128, no 11. 9 Carolyn Veneri, “Evaluating the 1995 occupational employment projections,” Monthly Labor Review, September
13 period 1988 to 2000, tell a similar story. The regression model effectively puts errors in
projecting the overall growth of employment into the constant term in the regression and thus
focuses on the ability of the projections to differentiate employment growth among occupations.
My model takes the change in the ln of actual employment as the dependent variable and the ln
difference between projected employment and actual employment as the independent variable,
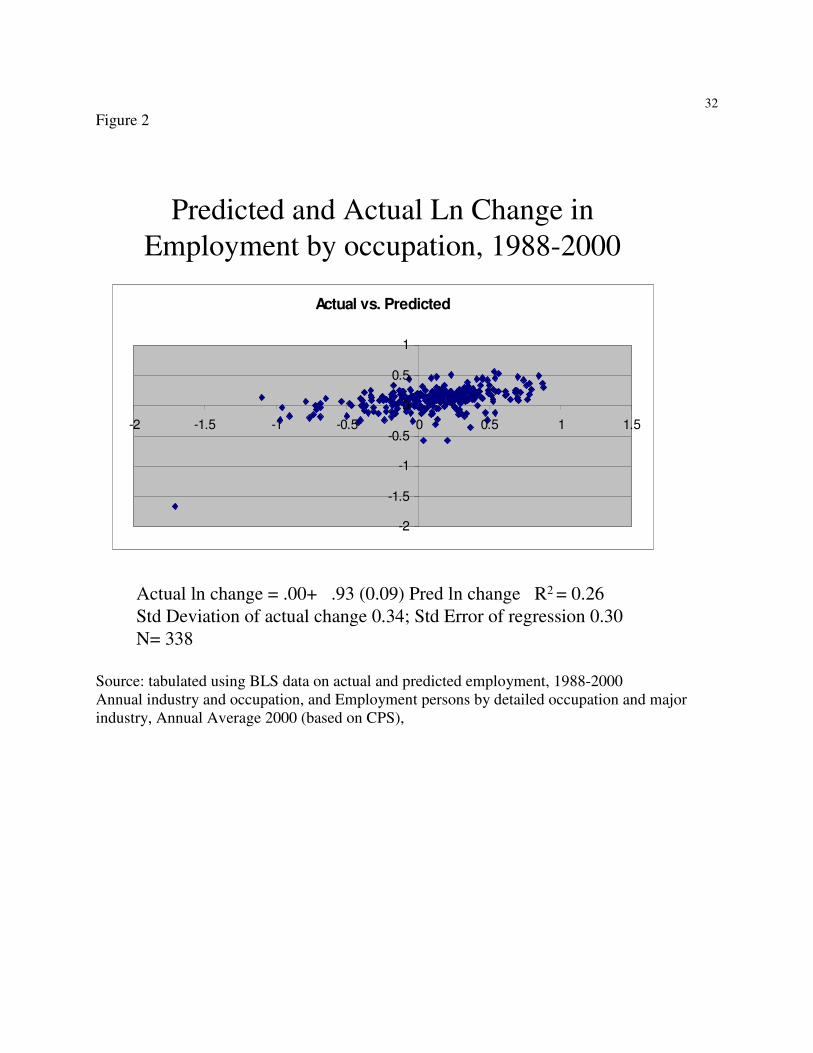
which focuses on relative changes. Figure 2 summarizes the main result. It shows first that the
projected growth rates are positively related to ensuing growth of employment, though with a
wide band of variation. The estimated constant term is near zero, implying that the projections
accurately captured the overall growth of employment. The regression coefficient on the
projected ln change term is 0.93, only modestly below unity. This implies that on average an
occupation where employment is projected to grow or decline by 10% grows or declines at about
9.3%. The problem is in the fit of the equation. The R2 is just 0.26, so that 3/4s of the variation
in the growth of employment among occupations remains unaccounted for in the analysis. The
figure displays this with a wide range of actual growth rates for any predicted growth rate.
Given the variance in the growth of occupations, the standard error for the ln employment
growth predicted by the regression is a relatively high 0.30.
There are three reasons why the projections have a high standard error. First, the industry
mix of output or employment can change in unexpected ways due to changing technology or
market conditions. In the global economy, a given demand that domestic producers once met by
hiring US workers can be met by foreign competitors, while some other domestic sector may
expand to meet foreign demands. Changes like these are not well captured in the input-output
model. Second, technical change alters the coefficients of occupational employment within
industries in ways that are difficult to predict. Third, the input-output framework ignores
substitutions in factor usage due to changes in factor prices. It does not allow for employers to
1997, p 15.
14 substitute against occupations with rapidly rising wages or for occupations where wages are
falling (Freeman, 1980). By focusing solely on demand adjustments, the projection model
ignores possible supply responses to market conditions that can greatly affect input coefficients
(in principle through the effect of supply on wages).
An example: computer and mathematical sciences
Because demand for computer specialists has changed greatly (motivating the BLS’s
adjusting the input coefficients for systems analysts mentioned above) it is particularly insightful
to examine the projections of employment in this area. The BLS has published projections of
future employment in “computer and mathematical sciences” every two years between 1996 and
2002. In each projection, the BLS took as its base actual employment in the year and projected
employment ten years into the future.
Table 6 summarizes the projections. In 1996, BLS projected that over the next decade
employment would double from 1.0 million jobs to 2 million jobs – a growth of 100,000
additional jobs per year. But at the height of the dot.com and high tech boom of the late 1990s,
labor supply increased far more rapidly than the BLS expected. By 1998, just two years after the
BLS projected a growth of employment of 100,000 per year, 1.7 million persons worked as
computer and mathematical scientists – an annual growth of 350,000 employed persons in the
area. Since universities were not graduating those numbers of specialists, the supply came from
persons from other disciplines shifting into the computer occupations in response to a booming
job market. Starting its 1998 projection at 1.7 million, the BLS projected a 92% growth of
employment to 2008 – 1.5 million additional jobs. But in 2000, national statistics showed 3
million computer and mathematical scientists – 50% more than the BLS had projected for 2006
four years earlier. Given the rapid growth of employment, the BLS raised its projected
employment to 5 million by 2010. Then came the dot.com collapse and the off shoring of
computer jobs to India and other low wage countries. The 2002 projection reduced the expected
15 number a decade into the future to 4.1 million – an 18% drop in projected employment compared
to the 2000 projection for 2010.
The wide variation in the number of workers projected in computer and mathematical
sciences reflects the difficulty in foreseeing future demands in an occupation subject to volatile
demand from different economic factors. First, there was the expansion of computer work in the
US market and the huge supply response to new job opportunities. Then came the growing
availability of qualified labor overseas, which allowed firms to offshore work. Over the entire
period employment of computer and mathematical scientists rose sharply, but the market
fluctuates so much that new graduates in some cohorts had difficulty finding work while
experienced programmers and computer specialists could not obtain the type of jobs they
expected. In 2000 programmers had an unemployment rate that was among the lowest in the
country – 1.7% compared to a rate for all workers of 3.9%. But in 2001 the rate of
unemployment of programmers tripled to 5.1% to exceed the national rate, and remained high in
succeeding years.10
Demography and replacement demand
But the projected labor shortage in the US comes from a presumably well-determined
demographic projection based on the retirement of the baby boom generation, rather than from
detailed projections of demand for specialized workers with wide confidence band. It is natural
to think that the coming retirement of the large baby boom generation in the US will inevitably
create job openings and predictable “replacement demand” for new workers. If an occupation
has 100 55 yr olds working in 2010 and these workers retire at 65 in 2020, and if nothing else
changes employers would seek 100 new workers to replace the retirees. If there is any part of a
projection of future labor market balances that would seem likely to prove accurate, projecting
replacement demand would be it.
16 This expectation is wrong. Enough other things change, which labor market models only
imperfectly capture, to make projections of replacement demands more complicated and suspect.
Changes in retirement behavior – the move to early retirement in that latter part of the 20th
century and possible moves to delayed retirement to increase the solvency of social security –
can readily cause divergences between predictions based solely on aging and actual retirements.
In making its projections of replacement demands for labor, the BLS differentiates
between total separations from an occupation, defined as the flow of individuals leaving an
occupation; and net separations, defined to include movements of workers into as well as out of
an occupation over a specific period. In the retirement age group, the two concepts are similar
since few workers will enter an occupation in that age group from another occupation, but they
can differ considerably for younger age groups and across occupations, some of which may
traditionally obtain experienced workers from other occupations and others of which
traditionally send workers to other occupations. An additional complication occurs between
occupations where employment is expected to rise or to fall. For occupations in which
employment has been rising, the BLS estimates net separation rates, by age, to estimate
replacement needs during the projection period, but it cannot use this procedure for occupations
where employment is expected to decline.11
To assess the relation between replacement demand and future job availability for
workers of less than retirement age, I estimated a regression model linking employment in an
occupation in 2000 in different age groups to the number of employed persons 55 and over in
the occupation in 1990 – likely retirees over the decade – and to the number of persons in the age
group in 1990. If replacement demands were important in creating jobs for workers below
retirement age, the number of persons 55 and over working in 1990 would be positively related
10 See NSF, Science and Engineering Indicators 2006, appendix table 3-8. 11 Bureau of Labor Statistics, Occupational Projections and Training Data, 2004-05 Edition, chapter 4 http://www.bls.gov/emp/optd/optd005.pdf7
17 to the number of workers in younger age groups in the occupation in 2000. To give equal weight
to large and smaller occupations, I scaled the variables by total employment in each occupation
in 1990, so that each variable is in a rate form. The second explanatory variable, the number of
persons in the specified age group in 1990, again scaled by employment in the occupation in
1990, is designed to deal with the likelihood that some occupations naturally have more or fewer
workers in different age groups. With this held fixed, replacement demand should show up in
additional employment in that age group.
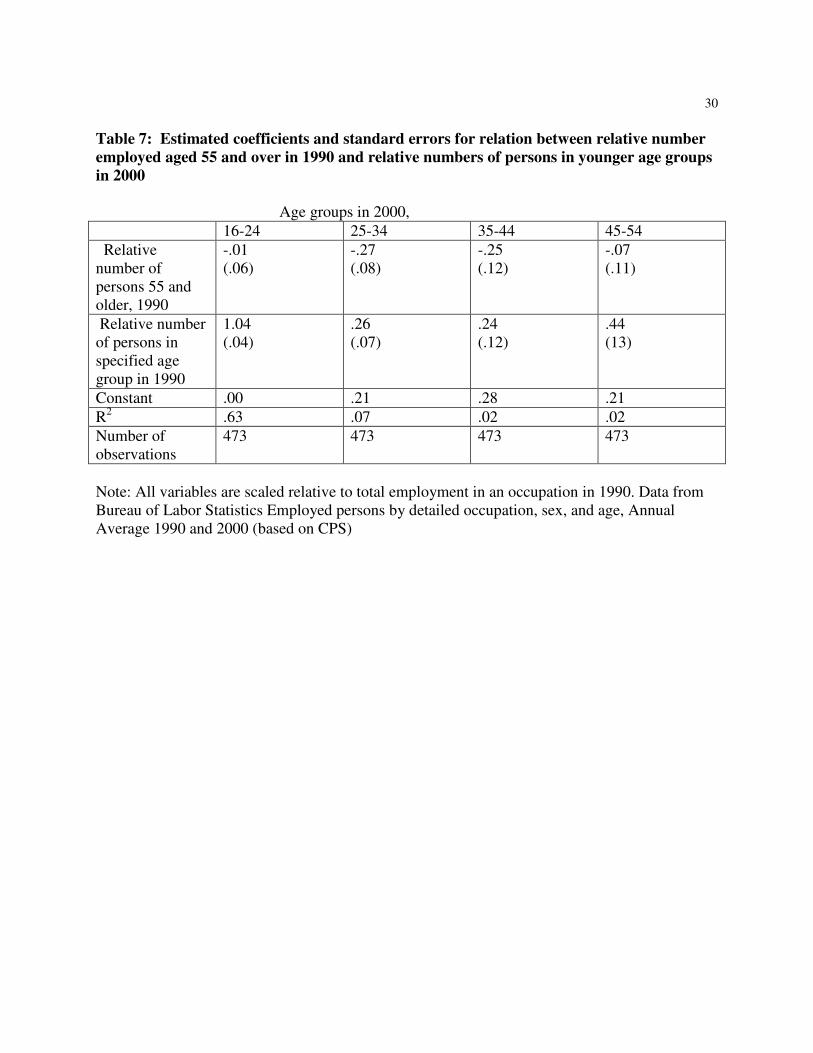
Table 7 gives the regression coefficients and standard errors and related statistics for this
model. The results reject the notion that the rate of likely retirement in an occupation is
associated with growth of employment for persons in younger age groups. The coefficients on
the relative number of persons in the retirement age group are essentially zero for the 16-24 year
olds and for the 45-54 year olds and are negative significant for persons in the other two age
groups. In these simple calculations, replacement demand for workers in given occupations is
negatively rather than positively related to the numbers hired. Why?
The most plausible reason is that older workers tend to be concentrated in older
economic sectors, from which demand is shifting toward newer areas. It is this factor that
induces the BLS to give different replacement demands for growing and declining occupations.
In the 1990s there were many workers of retirement age in the railroad industry and in heavy
manufacturing, but few in the new computer software and e-economy sectors where employment
was growing. If labor economists had a model that fully accounted for changes in employment
due to all factors, replacement demand would inevitably have a positive impact on employment
of younger persons, but absent such a model, the effects of replacement demand are so dwarfed
by changes in market conditions as to produce the negative relations in table 6. The message is
that economic forecasters should not count on replacement demand for retiring baby boomers to
create a labor shortage in the occupations with lots of boomers.
18 demography and labor market developments
Implicit in the fears that the US will face a great labor shortage in the next decade or two
is a belief that demographic forces have a powerful predictable impact on economic outcomes. In
the past, this has not been the case. Changes in behavior due to changing market incentives often
overwhelm demographic factors. In the 1950s and 1960s analysts projected much smaller
growth in labor supply than actually occurred because they failed to foresee the changing labor
force behavior of women in response to improved employment opportunities and wages. In the
late 1960s-early 1970s, when the baby boom generation reached the job market, the earnings and
employment of young persons worsened relative to the earnings and employment of older
workers due to the demographically driven shift in labor supplies. Indeed, this shift was an
econometrician’s dream exogenous shock for estimating the elasticity of the wages of young
persons relative to older persons to changes in relative supplies (Freeman, 1979; Welch 1979).
But when the number of young entrants fell in ensuing years, the earnings and employment of
the new smaller cohorts of young workers did not improve. The OECD, among others, expected
Western Europe’s youth unemployment problems to disappear over time as the supply of young
persons fell. Instead, other factors, such as national wage policies that affected young workers
and the state of the macro-economy dominated the youth labor market (Blanchflower and
Freeman, 2000). In the early 1970s I projected that the rapidly growing supply of graduates
would create a long run relative surplus of college graduates, albeit around cobweb fluctuations
(Freeman, 1976). Indeed, relative pay of graduates fell in the early and mid 1970s and then
picked up as the growth of supply diminished. But in the ensuing decade relative demand for
graduates began growing more rapidly than relative supply to produce a rising wage gap between
more and less educated workers.
As a final point of caution about forecasting economic developments from supply-based
projections, consider the slow growth of the labor force in advanced Europe and Japan in the
19 1990s through the mid 2000s. The demography implied that these countries would develop
major labor shortages, but they did not. The problem in EU labor markets was quite the
opposite: high unemployment and low employment to population rates. Perhaps the US
economy is so different from those of advanced Europe that the slow projected growth of labor
supply in the US will produce shortages, but perhaps not. The lesson from the historical record
is that there is a huge gap between demographic changes and ensuing economic developments.
conclusion
If the analysis of this paper is correct and the economic sky will not fall down in the face
of a slower growth in the US work force, why have so many persons concerned with the well
being of the US economy warning about the great coming labor shortage?
I suspect that three factors are at work.
The first is that many of those concerned about the possible future shortage do not realize
the historically large gap between demographic developments and economic developments nor
recognize that globalization will further widen that gap.
The second reason is that fears of a coming shortage fit with the concerns of various
groups. Future shortage or not, business will benefit from policies that increase labor supply to
drive down labor costs. Advocates of education and training see the shortage analysis as a way
to gain national support for increased spending on training that will benefit workers. Politicians
can use the shortage analysis to avoid dealing with policies like minimum wages, mandated
health care spending, labor law reform, or enforcement of labor laws, and the like, by endorsing
“win-win” education and training policies while sidestepping the fact that someone must pay for
these investments.
The third reason that I believe the shortage analysis appeals to some is that it offers a
more optimistic framework for analyzing the economic future than the view that the biggest
problem facing US workers is competition from low wage labor overseas is. If the doubling of
20 the global work force has weakened the position of workers in the US, the country has to deal
with issues regarding the rules of the global economy, ways to increase savings and the supply of
capital, ways to retain good jobs and sectors and to distribute the gains from globalization to
labor as well as capital while deterring protectionism.
That the coming labor shortage is more myth than reality does not invalidate some of the
policies that shortage analysts endorse to help the economy progress. More and better schooling
and job training and greater provision of occupational information are potentially critical to the
nation’s preserving comparative advantage in high tech sectors under the global competition
vision of the future. There is arguably greater need for those policies if global competition
places downward pressure on US workers than if a domestic labor shortage puts them in the
catbird seat in the economy and places business under pressure to recruit more workers.
Finally, if my analysis is wrong and the US develops a great labor shortage in the future,
I do not see why the government should intervene to prevent labor costs from rising. If firms
demand more labor than workers supply due to a reduced growth of supply, should not a country
that relies extensively on unfettered markets allow those markets to raise the price of labor, just
as it allowed them to reduce the pay of many in recent decades? There is nothing in economics
that predicts “slower growth in the standard of living, change in the balance of payments,
inequality, persistent structural unemployment,” or any other economic disasters from the normal
functioning of competitive markets in the face of a shift in the supply-demand balance. If there
is going to be a great labor shortage that raises wages and benefits for American workers, should
we not all cheer the workings of the Invisible Hand, rather than seeing this as a disaster that
policy should seek to avoid?
21 References
Alpert, Andrew and Jill Auyer. 2003. “Projections: How Accurate Were They,” Occupational Outlook Quarterly, Spring, pp 3-21. Aspen Institute, Domestic Strategy Group. 2003.“Grow Faster together or Grow Slowly Apart”. http://www.aspeninstitute.org/atf/cf/%7BDEB6F227-659B-4EC8-8F84-8DF23CA704F5%7D/DSGBROCHURE_FINAL.PDF Atkinson, William. 2005. “Confronting the Coming Labor Shortage,” Public Power, American Public Power Association. November-December. http://www.appanet.org/newsletters/ppmagazinedetail.cfm?ItemNumber=14824&sn.Item. Blanchflower, David and Richard Freeman (editors). 2000. Youth Employment and Joblessness in Advanced Countries. Chicago: Univ of Chicago Press for NBER. Braddock, Douglas. 1999. “Occupational Employment Projections to 2008,” Monthly Labor Review, Volume 122, No. 11, November: pp 51-77. Bureau of Labor Statistics. 2006. Occupational Outlook Handbook, 2006-2007 edition. Washington, DC: U.S. Department of Labor, Bureau of Labor Statistics. Bureau of Labor Statistics. 2004. Occupational Projections and Training Data 2004-2005 edition, March, Bulletin 2572. Washington, DC: U.S. Department of Labor, Bureau of Labor Statistics. Carnevale, Tony. 2005. “The Coming Labor and Skills Shortage,” T+D Magazine ASTD, January. <http://store.astd.org/product.asp?prodid=3045&deptid=>. Cappelli, Peter. 2003. “Will There Really Be a Labor Shortage?” Organizational Dynamics Volume 32: Issue 3, August, pp: 221-33. Cappelli, Peter. 2006. “What Looming Labor Shortage?” Featured Reports, Monster.com, The Great Labor Shortage. <http://featuredreports.monster.com/laborshortage/myth>. Dohm, Arlene. 2000. “Gauging the Labor Force Effects of Retiring Baby-Boomers,” Monthly Labor Review, Volume 123: No 7, July, pp 17-25. Eisenberg, Daniel. 2002. “The Coming Job Boom,” Time: Business & Technology, April 29. http://time.com/time/business/printout/0,8816,233967,00.html. Fisher, Anne. 2003. “Believe It or Not, a Labor Shortage Is Coming,” Fortune October 7. http://www.fortune.com/fortune/subs/print/0,15935,493870,00.html. Freeman, Richard B. 1976. The Overeducated American. Academic Press. --------. 1979. "The Effect of Demographic Factors on Age-Earnings Profiles", Journal of Human Resources Vol 14, No. 3, Summer: 289-318. --------. 1980."An Empirical Analysis of the Fixed Coefficient Manpower Requirements Model,
22 1960-1970," Journal of Human Resources XV:2, Spring: pp 176-199. --------. 2005. “Does Globalization of the Scientific/Engineering Workforce Threaten US Economic Leadership?,” NBER WP # 11457, July. --------. 2006. "What Does the Growth of Higher Education Overseas Mean for the U.S.?", presented at the ASGE / ASSA Meetings Session, U.S. Higher Education in Global Perspective, Boston, January 7. Grams, Eloise. 2003. “The Paradox of Coming Labor Shortages and a 6% Unemployment Rate,” Career Bytes Vol 3: Issue 2, October. http://www.career.usf.edu/newsite/careerbytes/Oct03.pdf. Hecker, Daniel E. 2001 “Occupational Employment Projections to 2010,” Monthly Labor Review, Volume 124, No.11, November: pp 57-84. Hecker, Daniel E. 2004. “Occupational Employment Projections to 2012,” Monthly Labor Review, Volume 127, No.2, February: pp 80-104. Hecker, Daniel E. 2005. “Occupational Employment Projections to 2014,” Monthly Labor Review, Volume 128, no 11, November: pp 70-101. Herman, Roger, Thomas G. Olivio, Joyce L. Gioia. 2002. Impending Crisis: Too Many Jobs, Too Few People. Oakhill Press. Hussar. William J. 2005. Projections of Education Statistics to 2014 (NCES 2005-074). U.S. Department of Education, National Center for Education Statistics. Washington, DC: U.S. Government Printing Office. ILO, International Labour Organization. 2006 (downloaded). http://laborsta.ilo.org/ Judy Richard and Carol D'Amico. 1997. Workforce 2020: Work and Workers in the 21st Century Hudson Institute. Kaihla, Paul. 2003. “The Coming Job Boom,” Business 2.0 Magazine, September 1. <http://money.cnn.com/magazines/business2/business2_archive/2003/09/01/348381/index.htm>. Mishel, Lawrence and Ruy Teixeira. 1991. “The Myth of the Coming Labor Shortage,” American Prospect Online Issue Date September 21. http://www.prospect.org/web/printfriendly-view.ww?id=5266>. Monthly Labor Review. 1997. Issue Topic: Evaluating the 1995 BLS Projections. Monthly Labor Review, Volume 120: No 9. National Association of Manufacturing, NAM. 2003. Keeping America Competitive. http://www.nam.org/s_nam/bin.asp?TrackID=&SID=1&DID=226411&CID=84&VID=2 NSF, National Science Foundation, Division of Science Resource Statistics. 2006. Science and Engineering Indicators 2006.
23 Onrec.com. 2002. “Results of the Talent 10 Symposium,” Online Recruitment, Management Issues, October 10. http://www.onrec.com/content2/news.asp?ID=1680. Overholt, Alison. 2004. “The Labor Shortage Myth” Fascompany, issue 85, August, p 23. (www.fastcompany.com/magazine/85/essay.html) Peterson, Thad. 2006. “Outlook: More Jobs, Not Enough Workers,” Featured Reports, Monster.com, The Great Labor Shortage. <http://featuredreports.monster.com/laborshortage/forecast/>. Potter, Edward E. 2001. Employment Policy Foundation, 2001 (website, no longer functional). Rosenthal, Neal H. 1991. “Evaluating the 1990 Projections of Occupational Employment,” Monthly Labor Review, Volume 115: No 8, pp 32-48. Rosenthal, Neal H. 1999. “The Quality of BLS Projections: A Historical Account,” Monthly Labor Review, Volume 122: No 5, pp 27-35. Rossheim, John. 2006. “Job Creation, Job Destruction and Globalization,” Featured Reports, Monster.com, The Great Labor Shortage. <http://featuredreports.monster.com/laborshortage/globalization>. Silvestri, George T. 1997.“Occupational Employment Projections to 2006,” Monthly Labor Review, Volume 120, No. 11, November: pp 58-83. Stensgaard, Anne-Birte. 2003. “What Labor Shortage? Debunding a Popular Myth. The Coming Labor Shortage,” AME Info, December 3. <www.ameinfo.com/31798.html>. Toosi, Mitra. 2002. “A Century of Change: US Labor Force, 1950-2050” Monthly Labor Review, May: pp 15-28. http://www.bls.gov/opub/mlr/2002/05/art2full.pdf UN, United Nations, DESA (Department of Economic and Social Affairs), Population Division. 2002. World Population Ageing 1950-2050 http://www.un.org/esa/population/publications/worldageing19502050/index.htm University of Chicago. 2003. “Managing for the Future: What You Need to Know (and Do) Now,” In the Know, University Human Resources Management Newsletter, Volume v: Issue 12, December. <http://hr.uchicago.edu/newsletter/itk-20031201/wgo1.html>. U.S. Chamber of Commerce. 2006. The State of American Business 2006. Washington, DC. Veneri, Carolyn. 1997.“Evaluating the 1995 occupational employment projections,” Monthly Labor Review, September, p 15 Welch, Finis. 1979. “Effects of Cohort Size on Earnings: The Baby Boom Babies’ Financial. Bust,” Journal of Political Economy 87(5), October, pp. S65-S97.
24 Table 1: Labor supply, 1950 to 2000 and Projected Labor supply, 2000-2050 Labor Supply Change in millions In millions 1950 62.2 -- 1960 69.6 7.4 1970 82.8 13.2 1980 106.9 24.1 1990 125.8 18.9 2000 140.9 15.1 2010 157.7 16.8 2020 164.7 7.0 2030 170.1 5.4 2040 180.5 10.4 2050 191.8 11.3 Source, 2000 to 2050, Toossi, MLR, May 2002, table 5; 1950-1990, http://www.census.gov/statab/hist/02HS0029.xls
25 Table 2: Trends in population aged 18-23 and 15-59 a) Population aged 18-23 US Western Japan China India US Share of Advanced Europe 1980 26.2 16.3 9.5 109.5 78.1 50% 2005 25.4 13.6 8.7 127.3 125.2 53% 2030 28.3 11.7 6.9 102.6 139.6 60% 2050 28.8 11.9 6.1 88.6 121.3 62% b) Population aged 15-59 1975 132 99 71 497 335 44% 2000 176 113 79 829 594 48% 2025 196 100 65 913 869 54% 2050 217 86 49 787 939 62%
Source: Panel A, National Science Foundation, Science and Engineering Indicators 2006, appendix table 2-36 Panel B. UN Population Division, DESA, World Population Ageing 1950-2050 http://www.un.org/esa/population/publications/worldageing19502050/index.htm
26 Table 3: US share of highly educated workers, 1970 -2000 and 2010 US share of college enrollments 1970 30% 2000 14% US share of science and engineering PhDs 1975 40% 2010 15% Source: Freeman, 2006
27 Table 4: Huge Supplies Outside US Raise Foreign-born shares of Scientists and Engineers 1990 2000 Bachelor’s 11% 17% Master’s 19% 29% PhD 24% 38% PhDs <45 27% 52% Post-docs 51% 60% Source: Freeman, 2005
28 Table 5: College Graduate Supply in thousands, 1988, 2001, and Projected 2014 Associate Bachelor’s Master’s PhD First Professional 1988-89 299 1019 311 36 71 2002-03 633 1348 513 46 81 2013-14 735 1582 693 55 101 Source: Hussar, 2005, figure G, pp 13-14
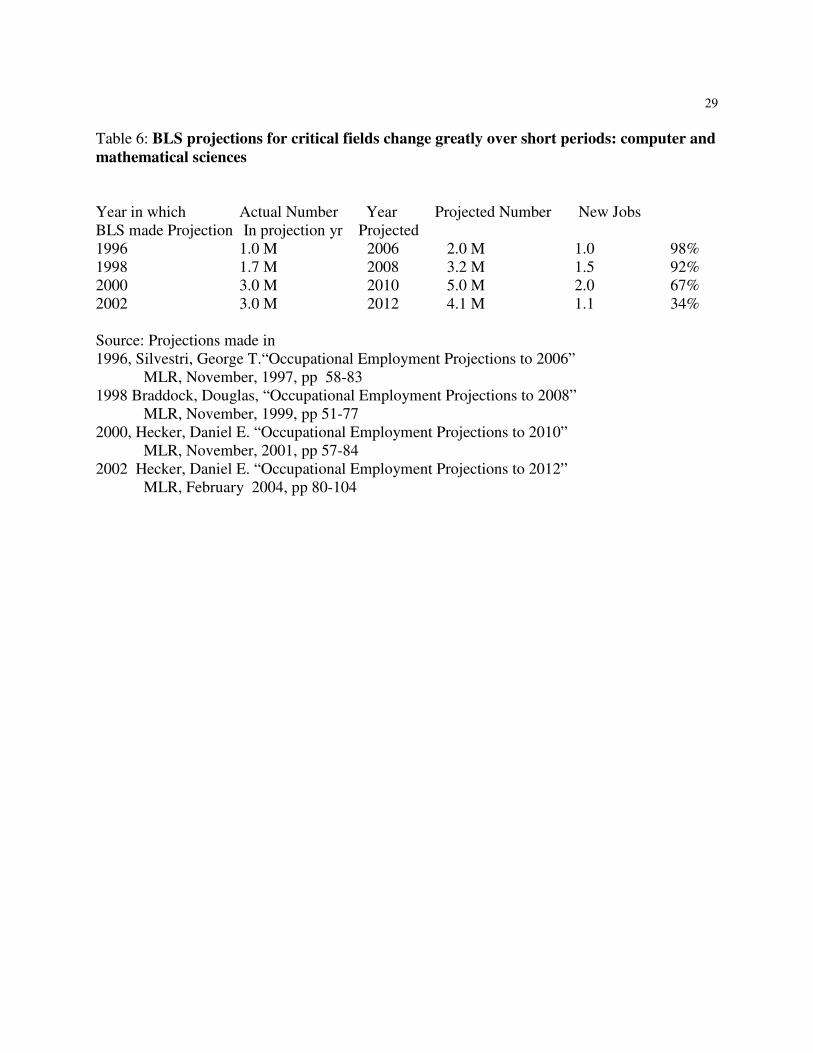
29 Table 6: BLS projections for critical fields change greatly over short periods: computer and mathematical sciences Year in which Actual Number Year Projected Number New Jobs BLS made Projection In projection yr Projected 1996 1.0 M 2006 2.0 M 1.0 98% 1998 1.7 M 2008 3.2 M 1.5 92% 2000 3.0 M 2010 5.0 M 2.0 67% 2002 3.0 M 2012 4.1 M 1.1 34% Source: Projections made in 1996, Silvestri, George T.“Occupational Employment Projections to 2006” MLR, November, 1997, pp 58-83 1998 Braddock, Douglas, “Occupational Employment Projections to 2008” MLR, November, 1999, pp 51-77 2000, Hecker, Daniel E. “Occupational Employment Projections to 2010” MLR, November, 2001, pp 57-84 2002 Hecker, Daniel E. “Occupational Employment Projections to 2012” MLR, February 2004, pp 80-104
30 Table 7: Estimated coefficients and standard errors for relation between relative number employed aged 55 and over in 1990 and relative numbers of persons in younger age groups in 2000 Age groups in 2000, 16-24 25-34 35-44 45-54 Relative number of persons 55 and older, 1990
-.01 (.06)
-.27 (.08)
-.25 (.12)
-.07 (.11)
Relative number of persons in specified age group in 1990
1.04 (.04)
.26 (.07)
.24 (.12)
.44 (13)
Constant .00 .21 .28 .21 R2 .63 .07 .02 .02 Number of observations
473 473 473 473
Note: All variables are scaled relative to total employment in an occupation in 1990. Data from Bureau of Labor Statistics Employed persons by detailed occupation, sex, and age, Annual Average 1990 and 2000 (based on CPS)
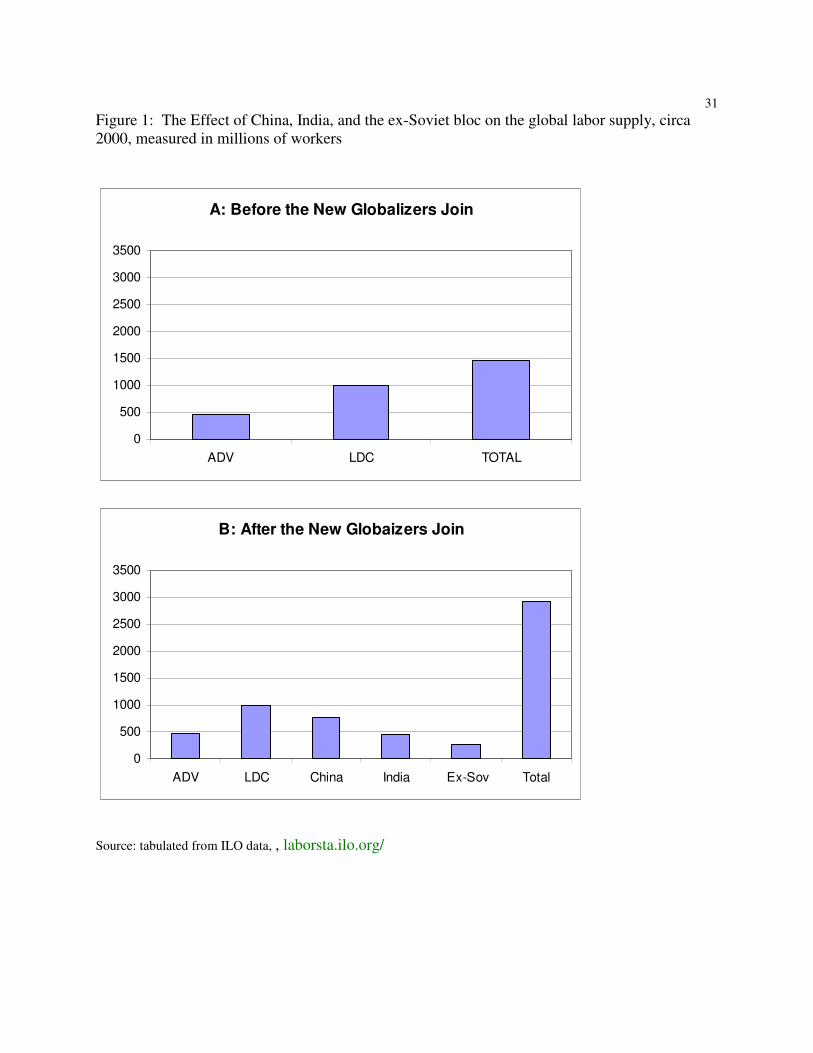
31 Figure 1: The Effect of China, India, and the ex-Soviet bloc on the global labor supply, circa 2000, measured in millions of workers
A: Before the New Globalizers Join
0
500
1000
1500
2000
2500
3000
3500
ADV LDC TOTAL
B: After the New Globaizers Join
0
500
1000
1500
2000
2500
3000
3500
ADV LDC China India Ex-Sov Total
Source: tabulated from ILO data, , laborsta.ilo.org/
32 Figure 2
Predicted and Actual Ln Change in Employment by occupation, 1988-2000
Actual vs. Predicted
-2
-1.5
-1
-0.5
0
0.5
1
-2 -1.5 -1 -0.5 0 0.5 1 1.5
Actual ln change = .00+ .93 (0.09) Pred ln change R2 = 0.26Std Deviation of actual change 0.34; Std Error of regression 0.30N= 338
Source: tabulated using BLS data on actual and predicted employment, 1988-2000 Annual industry and occupation, and Employment persons by detailed occupation and major industry, Annual Average 2000 (based on CPS),