nber working paper series firm dwersification and ceo ... › papers › w4723.pdf · nber working...
TRANSCRIPT

NBER WORKING PAPER SERIES
FIRM DWERSIFICATION ANDCEO COMPENSATION: MANAGERIAL
ABILITY OR EXECUTIVEENTRENCHMENT?
Nancy L. RoseAndrea Shepard
Working Paper No. 4723
NATIONAL BUREAU OF ECONOMIC RESEARCH1050 Massachusetts Avenue
Cambridge, MA 02138April 1994
We are grateful to the National Science Foundation, the MiT Center for Energy andEnvironmental Policy Research, and the Alfred P. Sloan Foundation for financial support ofthis project This research was undertaken while Rose was a fellow at the Center forAdvanced Study in the Behavioral Sciences. We thank Severin Borenstein, Ben Hermalin,Paul Joskow, Richard Lambert, Edward Lazear, James Poterba, Garth Saloner and MarkWolfson, and participants in the Stanford Brown Bag Lunch and the NBER IndustrialOrganization program for helpful discussions, and Justin Adams for data assistance.This paper is part of NBER's research program in Industrial Organization. Any opinionsexpressed are those of the authors and not those of the National Bureau of EconomicResearch.
NBER Working Paper #4723April 1994
FIRM DIVERSIFICATION ANDCEO COMPENSATION: MANAGERIAL
ABILITY OR EXECUTIVEENTRENCHMENfl
ABSTRACF
Data for a sample of 558 CEOs over 1985-1990 suggest substantial compensation premia
for managers of diversified firms. The CEO of a firm with two distinct lines of business
averages 10 to 12 percent more in salary and bonus and 13 to 17 percent morn in total
compensation than the CEO of a similar-sized but undiversifled firm, all else equal. This
corresponds to average 1990 salary gains of $115,000 to $145,000 per year for our sample.
Diversification may raise pay because the CEO's job requires higher ability or because it is
associated with CEO entrenchment, If ability explains the correlation, we would expect the
diversification premium to be invariant to tenure. Entrenchment models suggest higher premia
for more experienced (more entrenched) CEOs, and an increase in compensation when the CEO
diversifies the firm, The data support an ability model over an entrenchment explanation. The
diversification premium is unaffected by tenure, and increasing diversification reduces
compensation for incumbent CEOs, all else equal.
Nancy L. Rose Andrea ShepardMIT Sloan School Stanford GSB50 Memorial Drive, E52-434 Stanford UniversityCambridge, MA 02142 Stanford, CA 94305and NBER arid NBER
I. INTRODUCTION
The economics and strategic management literatures of the past decade
have grown increasingly skeptical about the value of combining several lines
of business within a single firm. The positive literature has noted the
negative response of the stock markets to diversifying mergers in the 1 980s
(e.g., Morck, Shleifer and Vishny, 1990) and the relatively poor
performance of diversified firms (e.g., Lang and Stulz, 1993). Thenormative literature has shifted from an enthusiasm for portfolio
management within diversified firms in the 1 970s to a more tempered
discussion of how corporate managers might make the diversified whole
more valuable than the sum of its parts (e.g., Porter, 1985).
The effort to understand why diversification failed to produce the
performance gains anticipated during the 1 960s conglomerate merger wave
has produced two sharply divergent classes of explanations. One focuses
on the difficulty of managing diversified enterprises, the other on managerial
entrenchment. Both imply a connection between CEO compensation and
firm diversification. This study uses information on 558 CEOs in 418 firms
over 1985-1990 to explore this connection. We find evidence of significant
compensation premia for managers of diversified enterprises. We use
patterns in these premia to distinguish entrenchment explanations from
those based on managerial ability.
Ability-based explanations focus on the difficulty of managing a diversified
firm. Diversification is undertaken if it increases the expected value of the
firm through some type of synergy or spillover across the lines of business.
Realizing the potential value of these synergies depends on the ability of top
management. If diversification increases the value the firm places on
managerial talent, more diversified firms will hire more able CEOs. Because
1

ability earns a premium in the market for corporate talent, CEOs at
diversified firms will be more highly compensated than are their
counterparts at less diversified firms. Ability models imply that the
diversification premium will be invariant to CEO tenure, and that incumbent
CEOs who diversify their firms will be paid less than CEOs who are
optimally matched to the firm's new, higher level of diversification.
Proponents of managerial entrenchment explanations argue thatdiversification frequently is undertaken by self-serving managers to increase
the value of their compensation packages, even when diversification
reduces the value of the firm. One simple story is that diversification is an
easy way to increase firm size when antitrust constraints restrict
acquisitions within a firm's existing lines of business. If Boards of Directors
reward CEOs for firm size, CEOs may have an incentive to diversify even
when it does not contribute to shareholder wealth. A more subtle
argument, and the one on which we focus here, is that top executives
change the scope of the firm to match their particular talents. If
diversification creates a uniquely good match between top executives and
the firm, it creates managerial rents that may be captured by the CEO
(Shleifer and Vishny, 1989). These models predict compensation increases
for incumbent CEOs who diversify their firms, a positive correlation
between compensation and diversification in .the cross-section, and smaller
diversification premia for new CEOs than for incumbent CEOs.
Both entrenchment and ability explanations imply a positive cross-sectional
correlation between compensation and firm diversification, holding constant
firm scale and other variables known to affect compensation. This is
confirmed in our sample of 480 "experienced" CEOs— those who have been
in the position for more than two years. These results, which are
dominated by interfirm variation, suggest economically and statistically
2
significant diversification premia in CEO compensation. Firms with two
distinct lines of business pay, on average, 10 to 12 percent more in salary
and bonus and 13 to 18 percent more in total compensation than do similar
but undiversified firms. Compensation increases further, but in smaller
increments, with diversification into additional business segments.
The power to distinguish between ability and entrenchment explanations
comes from examining diversification premia for new CEOs and from
estimating first-difference specifications to isolate the response of
compensation to changes in diversification initiated by incumbent CEOs.
We find that the diversification premium for our sample of 172 first-year
CEOs is roughly equal to that earned by the panel of experienced CEOs.
The first-diflerence results suggest that increasing diversification tails to
increase compensation. Indeed, the data suggest a premium for reducing
diversification, all else equal. These patterns provide strong support for
ability-based explanations over managerial entrenchment explanations of
diversification premia.
The paper is organized as follows: In section Il, we discuss the two
competing explanations of the connection between CEO compensation and
firm diversification. The data and empirical specification used to test these
views are described in section III. Results are presented in section IV,
followed by a brief conclusion.
II. DIVERSIFICATION AND EXECUTIVE COMPENSATION
There are two general views of the relationship between diversification and
compensation. The first is predicated on a belief that market mechanisms
effectively align the interests of the CEO with those of the firm's
stakeholders. Given this, compensation will reflect the CEO's contribution
to the value of the firm. If diversification affects compensation, it is
3

because diversification changes the value of managerial input. We refer to
models taking this general perspective as managerial input or "ability"
models. The opposing view is that CEOs have considerable latitude to
pursue their own objectives at the expense of shareholders' interests.
These objectives may include diversification if it enables CEOs to increase
their compensation, or if CEOs have a taste for diversification itself. We
refer to models based on this view as "entrenchment' models. We discuss
below the implications of these competing explanations for the relationship
between executive compensation and firm diversification.
Diversification and CEO Ability
A common justification for diversification is potential synergies or spillovers
across lines of business. Broadly interpreted, these include spillovers from
R&D activities, synergies from capabilities applicable to multiple lines of
business, economies of scope from slack resource constraints or
amelioration of market power in upstream or downstream markets through
vertical integration. These potential gains may be offset by an increased
load on limited managerial inputs. In particular, the demand for managerial
input at the CEO level is likely to increase with firm diversification.
Diversification may increase the complexity of the CEO's job (Finkelstein
and Hambrick. 1989); at a minimum, it increases the complexity of the
resource allocation decision. Operating in more than one industry requires
the CEO to understand several, potentially quite disparate, product markets.
A CEO of a firm in multiple lines of business must evaluate competitive
strategies for product lines that may have different customers, different
industry structures, and different competitors. Managing diverse lines of
business may require deploying a broad variety of resources and
capabilities. Finally, realizing potential synergies involves facilitating
coordination and communication across business groups within the firm.
4

All these factors suggest that the firm's marginal return to executive talent
will increase with diversification.
In an efficient market for managerial talent, this higher return will lead to
higher compensation at more diversified firms. Equilibrium effects of
diversification on compensation can be illustrated in a simple matching
model, where managers with higher ability are matched with positions in
which the marginal return to ability is higher (Rosen 1982, Waldman 1984).
In these models, managers contribute to the productivity of all workers
below them in the firm's hierarchy, and more able managers make a larger
contribution than less able managers. The marginal return to ability realized
by the firm is the increment to productivity caused by hiring a person of
higher ability in a given position and is a characteristic of the firm.
Characteristics that increase the marginal return to ability in the position will
have two equilibrium effects: the ability of those selected to fill the position
will be greater, and the compensation associated with the position will be
higher.
This argument implies a positive correlation, ceteds padbus, between firm
diversification and CEO compensation, and a positive coefficient on a
diversification index in cross-sectional compensation regressions. Since the
ability of the CEO in these models is not a function of tenure, the predicted
diversification premia are the same for new and experienced CEOs.'
Matching models provide little guidance on the expected impact of changes
in diversification on the compensation of incumbent CEOs. If CEO
'Compensation empirically tends to increase slightly with tenure inthe position, which may reflect human capital accumulation. Unless theability to manage a diversified firm increases differentially with tenure,this should not affect the diversification premium.
5
replacement were costless, these models imply that changes in
diversification should lead the firm to replace the current CEO with one
whose ability optimally matches the firm's new scope. Because CEO
turnover is costly to both the firm and the CEO, there is value to retaining
the incumbent CEO as long as the mis-match is not too severe. This
suggests that changes in diversification may lead to bargaining between the
CEO and the firm, with both parties sharing the costs of the mis-match. As
a result, the compensation of incumbent CEOs who have increased their
firm's diversification should be less than the compensation that would be
earned by a new, optimally-matched CEO. Similarly, the compensation
earned by incumbents who have reduced their firm's compensation should
be higher than that of the less able, but optimally matched CEO. This
suggests that the correlation between changes in diversification and
changes in compensation for incumbent CEOs will be smaller than the
correlation between compensation and diversification observed in the levels
regressions.
Diversification and Management Entrenchment
An alternative explanation for the relation between firm diversification and
CEO compensation is managerial entrenchment. A growing academic
literature as well as popular press accounts of top management in large
public corporations focuses on possible misalignments betweenshareholders' interests and the CEO's objectives. The primary mechanisms
for aligning incentives L pay-for-performance, monitoring by shareholders
or their representatives, and the market for corporate control — might not
be sufficiently powerful or precise to prevent self-serving decisions that are
good for managers but not for owners. Executive compensation schemes,
it is argued, provide insufficient performance incentivesto make shareholder
wealth maximization the top executive priority (e.g., Jensen and Murphy,1990). Boards of Directorsmay have inadequate information and incentives
6
to monitor and control CEO behavior (Mace, 1971). The market for
corporate control, which may discipline particularly egregious
mismanagement, is at best an imperfect mechanism given the transactions
costs incurred in its use.
Absent effective controls on executive behavior, CEOs may pursue a variety
of objectives (including, perhaps, increased diversification), regardless of
whether. they are consistent with shareholders' objectives. If CEOs can
enforce self-serving decisions, there are a variety of channels through which
diversification and compensation might be linked. Some of these are
indirect: diversification may change the firm's size or risk profile, both of
which directly affect compensation. These explanations suggest no direct
influence of diversification on compensation in the presence of controls for
scale and risk. There are, however, two entrenchment arguments that
imply a relationship between diversification and compensation even when
size and risk are held constant.
The first is a variant on the ability matching model in which the CEO czeates
a good match by diversifying the firm. Shleifer and Vishny (1989) argue
that CEOs may use diversification to increase their value to the firm if
diversification enables the CEO to create an industry mix for which his/her
managerial skills are uniquely well-suited. By increasing the value to the
firm of his/tier specific human capital, the CEO is able to negotiate a higher
wage with the Board of Directors.2 Incumbent CEOs who diversify their
2The compensation increase will depend on the difference betweenthe value to the firm of the. incumbent CEO and the value of the nextbest qualified manager. This can be thought of as the rent value of theincumbent CEO's unique talents. Note that this argument implicitlyassumes that the CEO cannot seek employment with a firm alreadyactive in the areas to which she/he is uniquely well-suited and that it iseasier for the CEO to affect the scope of the firm than the level of CEOcompensation.
7
firms should be rewarded with higher compensation if this is the dominant
source of a diversification-compensation link.3 This will tend to generate
positive correlations between diversification and compensation for
experienced CEOs (those who could have diversified their firms) in the
levels equations. Compensation premia should be much smaller for new
CEOs, who by assumption are discretely less well-qualified to manage the
firm than are the CEOs who created the diversification. In a first difference
specification, changes in diversification and compensation should be
correlated.
A second argument for a linkage between compensation and diversification
is that managers have a taste for both more diversification and higher
compensation.4 CEOs who are more powerful vis-à-vis their Boards are
better able to implement their preferences, leading to both greater
diversification and higher compensation at these firms. This implies a
positive cross-sectional correlation between pay and diversification, and a
positive correlation between changes in diversification and changes in
compensation, both caused by unobserved variations in CEO entrenchment.
Entrenchment is likely to increase with tenure because the CEO has more
opportunity to influence the composition of the Board of Directors and to
31f the rent value of a CEO's human capital were maximized byspcializing the firm, this model suggests that entrenched managerswould reduce diversification. In this case, compensation would benegatively correlated With diversification in both cross-sections and first-differences.
The compensation preference seems clear. CEOs may likediversification because it is a relatively easy way to affect the directionof the firm. GE's 1976 acquisition of a billion dollar mining company,for example, was attributed by the business press to a desire by the CEOto make a 'lasting imprint on his firm' (Fortune, August 1977). Roll(1986) argues that acquisition decisions in general may be the result ofCEO 'hubris", a belief that they are uniquely well qualified to evaluateand/or manage the target firm.
8
build a constituency among managers within the firm. This suggests that
new CEOs should average smaller estimated diversification premia than
those of experienced CEOs.5
Ill. AN EMPIRICAL MODEL OF COMPENSATION
We explore the effects of diversification on CEO compensation by
embedding a measure of diversification in a standard empirical model of
executive compensation (see .Joskow, Rose, and Shepard, 1993).
Compensation is a function of firm characteristics such as size, financial
performance, and the extent of diversification; CEO characteristics such as
age and tenure; and industry norms and economy-wide shifts in managerial
compensation, captured by industry and year fixed effects. The data and
specification of the compensation equation are described below.
Data
This study combines information on CEO compensation and characteristics
from Foites' annual CEO compensation survey with information on firm
characteristics from Standard and Poor's Annual and Industry Segment
COMPUSTAT files and the Center for Research on Security Prices (CRSP)
returns files. We delete firms in financial services or regulated industries,
leaving 1830 CEO-years over 1 985-90 that match across our four data
sources.6 The analysis of "experienced" CEOs is restricted to those with
5Sample selection biases also may induce a positive correlationbetween tenure and unobserved entrenchment: as, for example, if moreentrenched managers are able to stay in the CEO position longer than theaverage CEO.
Firm deletion is based on their primary industry assignment, asrecorded by COMPIJSTAT. Regulated industries during our sampleperiod include electric or gas utilities, gas pipelines, and telephoneservice. Regulated and financial services industries are omitted due tononcomparability in firm data and differences in the structure and level of
9
more than two years of tenure in the CEO position. This yields a panel data
set of 1505 observations on 480 CEOs fri 403 firms. Our analysis of new
CEOs is based on 172 CEOs whom we observe in their first year of office.
Table 1 reports summary statistics for the experienced CEO panel in
columns 1 through 3; summary statistics for the first-year sample are
reported in column 4. Variable descriptions follow below.
Compensation Measures. We use two measures of CEO compensation.
The first is salary and bonus (SALARY), whether current or deferred. This
component of compensation is relatively well-defined and consistently
measured across firms and over time for our sample period. The second,
total compensation (TOTAL), is the most inclusive measure of
compensation reported by Forbes. It includes benefits, long-term and
contingent compensation, and net gains from the exercise of stock options,
stock appreciation rights and stock accrual rights (collectively referred to
below as "options). TOTAL mismeasures current compensation for two
reasons. First, it understates current compensation in years that CEOs
receive substantial options grants; the ex ante value of options is not
recorded as compensation. Second, it overstates current compensation in
years that options are exercised, when the entire ex post gain is attributed
to current compensation. it is, however, the best measure of total
compensation in our data set.7
compensation across these and the remaining industries in our sample(Joskow, Rose, and Shepard, 1993). The short sample period is due tothe restricted span (7 years maximum) of COMPUSTAT's IndustrySegment File.
'Forbes does not provide sufficient information on options awards tosupport a more sophisticated treatment, even if one could solve thevaluation problem for unexercised options.
10
The mean real SALARY in our sample is $1.1 million; mean TOTAL
compensation is $1.9 million (see Table 1, column 11.8 CEOs at
undiversified firms (column 2) earn slightly lower average salaries and total
compensation than their counterparts at diversified firms (column 3),
although the differences are not statistically significant.
Firm Characteristics. We identify three firm characteristics as potentiallyimportant. determinants of executive compensation levels: diversification,
size, and financial performance.
Diversification. Data on a firm's major business activities are reported in
the business segment section of the Securities and Exchange Commission
10-K reports beginning in 1977. The 1976 Financial Accounting Standards
Board standard for reporting these data allows firms considerable latitude
in defining business segments:
[NJo single set of characteristics is universally applicablein determining the industry segments of all enterprises,nor is any single characteristic determinative in all cases.Consequently, determination of an enterprise's industrysegments must depend to a considerable extent of thejudgement of the management of the enterprise. (SFASNo. 14. Paragraph 12)
While the standard rejects common classification schemes as inadequate,
its language encourages identifying those bUsinesses operating in distinct
product markets as segments. Once segments are defined, companies are
required to report segment data for all segments contributing at least 10
percent of the firm's revenue. No firm, therefore, is required to report data
on more than ten segments.
° Dollar amounts are All inflated to. 1990 constant dollars using theimplicit GNP deflator.
11
We obtain business segment data from COMPUSTAT's Industry Segment
Files, which record seven years of segment data for each covered company.
COMPIJSTAT assigns a primary 4-digit SIC code to each reported segment
and records revenues for most reported segments. We use these data to
construct two indices of firm diversification.9 While they have different
characteristics, we obtain qualitatively similar results for both measures.
The simplest diversification index is a count of the number of unique 4-digit
SIC code segments reported for each year (NUMSEG). This index weights
all segments equally. Distributions of firms and observations over NUMSEG
are desOribed in Table 2. Approximately one-third of our observations are
for firms reporting only one segment, and multi-segment firms report 3.4
segments on average.'0
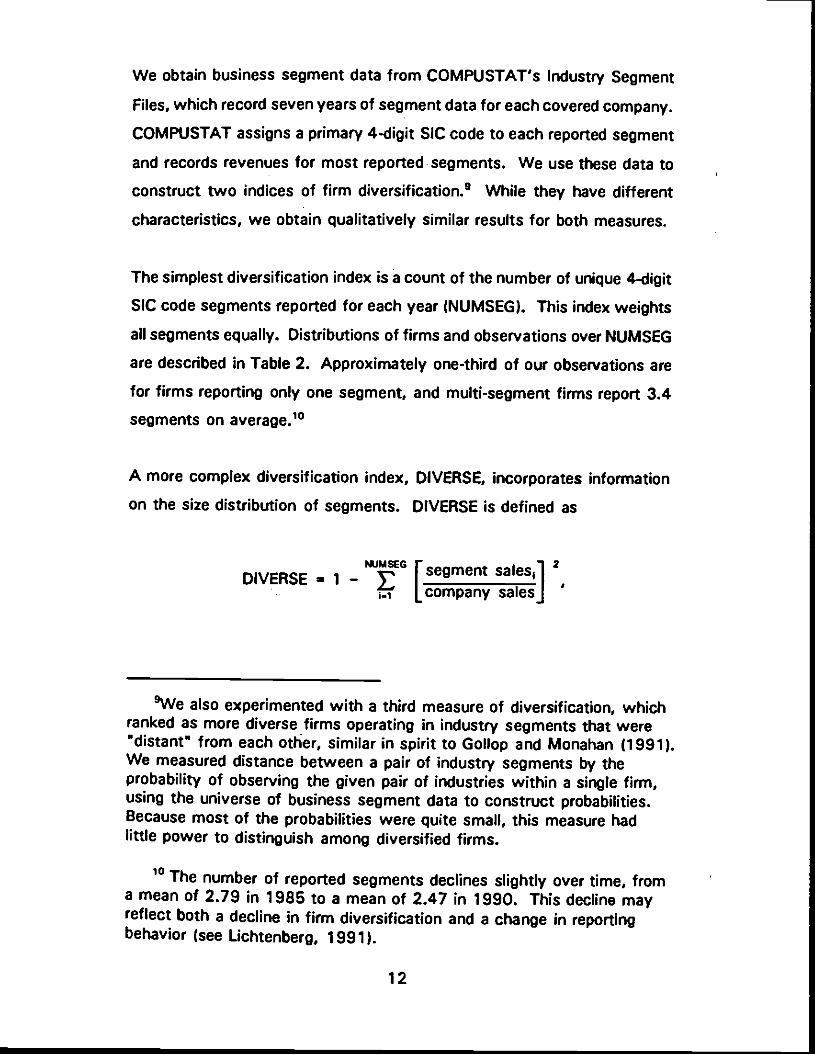
A more complex diversification index, DIVERSE, incorporates information
on the size distribution of segments. DIVERSE is defined as
MJMSEG , p
DIVERSE • 1 — E i segment sa.es1c0mpany salesj
9We also experimented with a third measure of diversification, whichranked as more diverse firms operating in industry segments that were'distant" from each other, similar in spirit to Gollop and Monahan (1991).We measured distance between a pair of industry segments by theprobability of observing the given pair of industries within a single firm,using the universe of business segment data to construct probabilities.Because most of the probabilities were quite small, this measure hadlittle power to distinguish among diversified firms.
'° The number of reported segments declines slightly over time, froma mean of 2.79 in 1986 to a mean of 2.47 in 1990. This decline mayreflect both a decline in firm diversification and a change in reportingbehavior (see Lichtenberg, 1991).
12
where segment sales are the sales reported for the business segment, and
company sales is the sum of segment sales for the firm. This measure,
which is one minus a Herfindahl index for the firm's business segments,
increases (nonlinearly) in the number of segments, holding constant the
variance of segment size, and declines in the variance of segment sales
shares, holding constant the number of segments." Thus, a firm with
two equal-sized segments is ranked as more diversified than a firm with two
unequal segments. As a result, this index can be sensitive to the fact that
a firm with two equal-sized segments may require different managerial
inputs than a two-segment firm in which the larger segments represents 90
percent of sales. By construction, DIVERSE has a lower bound of zero (for
single segment firms) and an upper bound of 0.90 (for a ten-segment firm
with 10 percent of sales in each segment). The -sample mean for DIVERSE
is 0.32, and the mean for firms with multiple segments is 0.48. Because
it is sensitive to both the number and size distribution of business
segments, our initial analysis focuses on DIVERSE.
Ran Size. Measures of firm scale are included to account for the well-
documented relationship between compensation and firm size.12 Most
studies measure scale by total company revenues (SALES); we also
" Similar measures have been used in a few earlier studies ofdiversification; see Ravenscraft and Scherer (1987). Gollop and Monahan(1991), and Comment and Jarrell (1992).
'2The positive relationship between firm size and executivecompensation is one of the more robust empirical regularities in the largeliterature on top executive pay. The formal ability matching models,beginning with Rosen (1982), have been motivated in part by a desire toexplain this cross-sectional relationship. Others (e.g., Baker, Jensen andMurphy, 1988) have argued that the tendency of Boards of Directors toreward firm size may be an artifact of rule-of-thumb heuristics fordetermining CEO pay popularized by executive compensationconsultants.
13
consider controlling for the number of employees (EMPLOY). These two
measures are highly correlated and, as the data reported in Table 1 show,
the firms in our sample are quite large in both dimensions. Annual revenues
average over $6 billion in constant 1990 dollars, and the average firm has
40,000 employees. Diversified firms are larger on average than
undiversified firms for both scale measures.13
Thm Financial Performance. While the theoretical and empirical literature
suggests a positive correlation between firm financial performance and CEO
pay, there is little consensus on the functional form of the relationship or
the correct measures of profitability. Fortunately, our empirical analysis
suggests that the diversification estimates are relatively robust to how we
control for performance.
We consider two measures o firm profitability: the stock market rate of
return on common equity (MKTROR) and the accounting rate of return on
book equity (ACCROR). Despite the similarity in overall mean returns (.18
for market and .15 for accounting), the correlation between these variables
is only .24. While we report results from several performance
specifications, the data appear to prefer a specification that includes current
and lagged market and accounting returns in the determination of CEO
compensation. Following Joskow and Rose (1994), we include one- and
two-year lags in market return and one-year lags in accounting return. This
implies that we can estimate the full model only for "experienced" CEOs,
i.e., those who have held the office for more than two years.
' All noted differences in raw means between the diversified andundiversified subsamples are significant at the .01 level or better, unlessotherwise noted.
14
The full return specification includes a measure of stock price volatility to
control for differences in compensation due to differential riskiness of firms'
profit streams. Lower return variance may lessen the probability of large
negative retums that could lead the Board to replace the CEO (Amihud and
Lev, 1981) or lead to bankruptcy that terminates employment (Rose, 1992).
Diversification also may reduce agency costs by improving the information
available to the Board of Directors about the CEO's quality, thereby
reducing the CEO's compensation risk (Aron, 1988, Hermalin and Katz,
1993). If the base salary includes an 'insurance component that reflects
risk-return trade-off s, it should fall with reduced variance. Financial risk is
indexed by the standard deviation of the firm's weekly stock market return
over the fiscal year, SDRET.
Consistent with previous research (e.g., Montgomery and Wernerfelt, 1988;
tang and Stulz, 1993), average profitability is higher at the undiversified
firms in our sample. The average market return is six percentage points
higher at undiversified firms (22% versus 16% for diversified firms); the
average accounting return is two percentage points higher for these firms
(16% versus 14% for diversified firms). The higher mean returns at
undiversified firms are associated with higher return variance. SDRET
averages 4.6 percentage points for undiversified firms, compared to 4.1
percentage points for diversified firms.
CEO Characteristics. Prior work suggests that CEO age, tenure, and
background may have significant effects on compensation levels. We use
Forbes data to construct variables recording. the chief executive's age when
appointed CEO (AGE), years of tenure as a CEO (CEOTEN), a dummy
variable equal to one if the CEO was hired from
15
outside the firm (OUTSIDE), and a dummy variable equal to one if the CEO
was the firm's founder (FOUNDER).'4
There are notable differences in the distributions of CEO characteristics
between diversified and undiversified firms. While most CEOs are promoted
from within the firm, diversified firms are even less likely to hire outsiders
than are undiversified firms (14% versus 1 8%).15 Diversified firms' CEOs
are on average four years older when they assume the CEO position than
are those at undiversified firms. Perhaps because of this age difference,
CEOs at diversified firms also have a shorter average tenure as CEOs (10.4
years versus 12.7 years for undiversified firms).'6 There are very few
founders in the sample, but the probability that the CEO is a founder is
larger for single segment firms. This may reflect more specialized expertise,
a greater commitment to the original line of business by founding CEOs, or
differences in firm age.
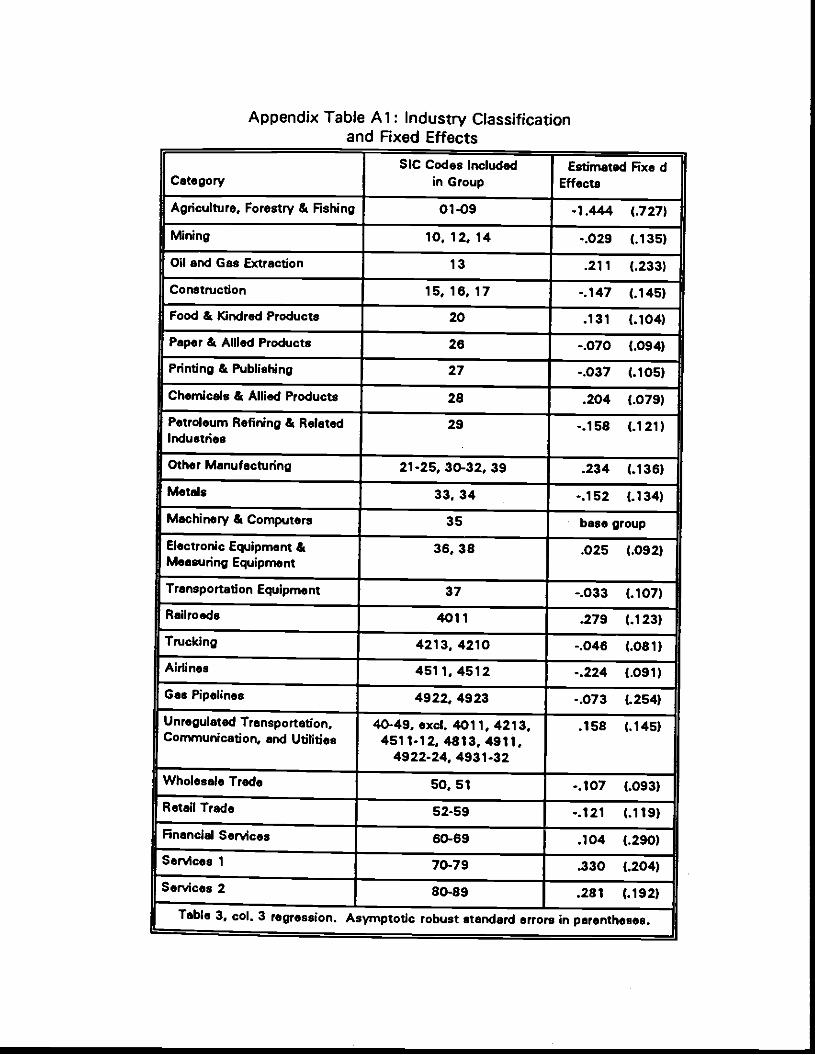
Industry and Time Effects. CEO compensation is strongly influenced by
industry norms and economy-wide movements in executive pay. (see
Joskow, Rose, and Shepard, 1993). We introduce year fixed effects
to control for aggregate shifts in real compensation levels over time. To
accommodate differences in mean compensation levels across industries,
we first classify similar two-digit SIC code industries into "industry groups"
14OUTSIDE is set equal to one for a CEO who was employed by thefirm fewer than four years before appointment as CEO and who was notthe firm's founder. The results are not sensitive to the fouryear cutoff.
' Significantly different at the .09 level.
10 Recall that these means are conditional on the CEO having morethan 2 years of tenure, which is a criterion for inclusion in theexperienced CEO panel.
16

(see Appendix Table Al).
revenues derived from each
segment sales in that year.
weighted average of effects
shares as weights:'7
We then calculate the share of the firm's
industry group for which it reports business
The fixed effect for each observation is the
for each industry group, using these revenue
K
WTGROUP E ;SHAR,
where SHAREI,(Jt is the proportion of sales firm j has attributed to business
segments in industry group k in year t, and 0k is the industry fixed effect
for a firm operating only in industry k.
Econometric Specification
For the full panel of experienced CEOs we estimate the following basic
compensation equation:
ln(CEO COMPENSATION1J fi,DIVERSE + p21n(SALES1J + flRETURN+ fi4SDRET + P5CEOTEN + PØAGE1
+ fi OUTSIDER + fl FOUNDER1
+ WTGROUP + 6 +
where i denotes the CEO, j denotes the firm, and t denotes the year. The
CEO subscript has been added because we observe multiple CEOs for some
firms!. RETURN is a vector of firm performance measures (ACCROR,
'7Some previous work has assigned each observation to a singleindustry group based on the primary SIC code for the firm (as recordedby CRSP or COMPUSTAT). If compensation at a diversified firm is basedon the set of industries in which it operates rather than its primaryindustry only, this procedure could mis-estimate the diversificationcoefficient. When we estimate our model with only a primary industryeffect, the diversification coefficients are slightly higher than, butotherwise qUite similar to, those we report below.
17

MKTROR and lags of these variables); fi' is the corresponding parameter
vector.
This specification assumes a constant elasticity of compensation with
respect to firm size, consistent with most previous studies. DIVERSE. CEO
tenure, age at appointment, and financial performance all are assumed to
have a constant proportional impact on compensation. OUTSIDE,
FOUNDER, WTGROUP, and year effects (6j shift the compensation curve
up or down. The reported regressions adjust the standard error estimates
for possible heteroskedasticity and within-CEO correlation in the error,
E.
IV. RESULTS
Results for several variants of the basic compensation equation are reported
below. We first describe models of compensation estimated on our panel
of 1505 observations on 480 experienced CEOs over 1985-1990. We then
investigate whether the patterns we observe in this panel of experienced
CEOs also apply to CEOs in their first year of tenure. This allows us to
distinguish diversification effects due to job characteristics from those due
to actions a CEO undertakes after assuming the top management position.
Our third set of estimates analyzes the response of compensation to
"Both the ability model and some versions of the entrenchmentmodel imply that the error contains a CEO-effect that is correlated withboth diversification and compensation. In the case of ability models, thisCEO-effect ("unobserved ability") is what drives the predicted positivecross-sectional correlation. Entrenchment effects ("CEO power") play asimilar role in the "taste for diversification" explanations. The first-difference specifications can be thought of as implicitly conditioning on(or removing) the CEO- or firm-specific component of the error. Theimplications of this conditioning vary across the ability and entrenchmentexplanations as described in section II. This is what gives the datapower to distinguish empirically between the explanations.
18
j
changes in diversification. These examine whether CEOs can raise their
compensation by increasing the diversification of their firms. Finally, we
explore alternative measures of diversification to identify the precise form
of the compensation-diversification relationship.
Panel Estimates of Diversification Premia
Table 3 reports parameter estimates for variants of the compensation
equation using our panel data set of 1505 CEO-years. In specifications
reported here and the broad range of alternative specifications explored in
preliminary analysis, CEO compensation increases with the level of
diversification reported by the firm. This effect is both statistically and
economically significant. Consider, for example, the effect of moving from
an undiversified, single segment firm to the same size firm with two equal-
sized business segments, a move that increases DIVERSE from 0.0 to 0.5,
or about tWo standard deviations. An increase of this magnitude in
DIVERSE is estimated to raise SALARY by about 12% (standard error of the
estimate, 3%; columns 2 through 4), and to raise TOTAL compensation by
13% (standard error, 5%; column 5)19 These proportions correspond to
an increase of roughly $140,000 in predicted salary and an increase of over
$250,000 in predicted total compensation, holding alt else constant at the
sample means.2° The point estimates of the DIVERSE coefficient
generally are stable, although they tend to increase slightly with more
° To calculate the effect of this move in percentage terms, wecompute exp (0.5 ) - 1.0.
20 If the, error in our log-linear model of compensation is normallydistributed, predicted compensation in dollars will be log-normal, andcalculated as exp(Xfi + WTGROUP + J + variance(E)/2). Thecorresponding compensation increases for a one standard deviation (.27)increase in DIVERSE are $75,000 to $82,000 in SALARY and over$143,000 in TOTAL compensation.
19
complete controls for firm financial performance; compare column 1 with
column 2, which adds current accounting return and lagged return variables
to the model.
The other coefficients reported in Table 3 are consistent with earlier studies
and largely unaffected by the inclusion of diversification measures. The
elasticity of compensation with respect to firm size, measured by SALES,
is about .25 (.01) for SALARY and .33 (.02) for TOTAL compensation.
Including employees as an additional scale variable in column 4 adds lithe
explanatory power and has no effect on the estimated diversification
coeflicient. This suggests the diversification premium is not due to
simple differences in labor scale or intensity across diversified and
undiversified firms.
CEO pay varies directly with both accounting and market returns1 and the
estimated sensitivity of pay to firm performance is much larger once lags
in performance are included, consistent with results in ,Joskow and Rose
(1994). In column 3, for example, increasing market return in the current
year by 10 percentage points implies a SALARY increase of 1.2% (0.5%)
in the current year, 1.7% (0.5%) in the next year, and 1.2% (0.4%) in the
third year. An increase of 10 percentage points in current accounting return
implies a 5.7% (1.6%) increase in current SALARY and a 3.5% (1.4%)
increase in next year's SALARY. The estimated performance sensitivity is
21 We have experimented with specifications that replace SALESwith book assets and employees, as in Joskow, Rose, and Shepard(1993). The size elasticity of .25 divides between assets andemployees in these equations, and the DIVERSE coefficient tends to beslightly smaller and noisier, though in general within one standard errorof the results in Table 3. We also have experimented with specificationsthat allow 'the coefficient on ln(SALE5) to change as SALES increases.This yielded an almost constant elasticity of .25 across all SALES rangesand no change in the coefficient on DIVERSE.
20
greater for TOTAL compensation (column 5), but the coefficient pattern is
similar to that for SALARY.
The results indicate that compensation also increases with the variability of
firm performance measures. Both SALARY and TOTAL compensation
increase with the standard deviation of weekly market returns for the firm,
SORET. An increase in SDRET from four percentage points to five
percentage points (one standard deviation increase from its sample mean)
raises predicted SALARY by almost 5% (1%) and TOTAL by almost 6%
(1.6%). This is consistent with a pay premium for CEOs who bear more
compensation risk through greater variability in their performance-based
compensation or through an increased probability of termination resulting
from very low performance realizations. Because SDRET is negatively
correlated with diversification, including SDRET increases the estimated
magnitude of the diversification effect slightly.
Finally, compensation varies in expected ways with CEO characteristics.
There are modest age and tenure premiums. An additional year of age
before becoming CEO raises SALARY by 0.4% (0.2%) and each additional
year of tenure as CEO raises SALARY by 0.7% (0.2%; column 3). These
increments are in addition to the underlying upward trend in compensation
over the late 1 980s that is captured in the fixed year effectsP Outside
hires earn a 15% SALARY premium relative to internal hires, and founders
realize SALARY discounts of about 13% relative to non-founders. The point
estimates for the TOTAL compensation equation exhibit a similar pattern
but tend to be somewhat larger in magnitude.
These are reported in Table A2 for the specifications in Table 3,columns 3 and 5.
21

The results in Table 3 generally are consistent with both ability-based and
entrenchment-based explanations of executive compensation. In an
efficient market for executive talent, compensation will be higher at more
diversified and larger firms, assuming the marginal return to ability increases
with diversification and firm size. Compensation is likely to increase with
firm financial performance and with the risk of executive compensation
streams, reflecting the outcome of efficient incentive contracts. Finally,
positive age and tenure effects may be associated with the accumulation
of human capital by top executives.
Positive diversification coefficients also would be expected if diversification
is caused by investment undertaken by self-serving CEOs to increase their
value to the firm, or if powerful CEOs have a taste for both diversification
and compensation. In both these cases, the positive tenure coefficient
might be interpreted as returns to managerial entrenchment that increases
with tenureP
Compensation Equations for First-year CEOs
Information on compensation during the CEO's first year of office may allow
us to distinguish premia for higher ability from pay surpluses resulting from
managerial entrenchment. If the diversification premium is a return to
ability, it should be earned by CEOs in their first and all subsequent years
of office. A positive first-year premium for diversification is less plausibly
explained by the effecis of managerial entrenchment models. First-year
diversification premia should be smaller if the full panel result is due to CEO-
The positive correlation of pay with firm performance neithersupports nor rejects entrenchment hypotheses. Although mostmanagerial entrenchment models suggest reduced pay-for-performancesensitivity relative to optimal contracts, they need not imply zerocorrelation between pay and firmperformance.
22
specific investments, as in the Shlelfer-Vishny model. A CEO may be able
to alter the business mix over time to fit her/his unique abilities. But
because a diversification program is likely to require some lead time, it is
unlikely that new CEOs can alter their firm's business mix rapidly enough
to affect the compensation they earn in their first year as CEO. Instead, the
new CEO will be compensated based on her/his fit with the firm as shaped
by the preceding CEO.24 Since the successor must be distinctly less well-
suited to that business mix for this strategy to raise the incumbent's
compensation, the successor's premiUm from diversification should be
much smaller. First-year premia also are likely to be smaller if the full panel
result arises from the Board's inability to control a CEO who prefers
diversification and high compensation. The Board is likely to have more
bargaining power relative to new CEOs than relative to CEOs who have held
that office long enough to affect the composition of the Board or to build
a base of support among other top managers.
The last column of Table 1 reports descriptive statistics for the 172 CEOs
we observe in their first full year of office. As would be expected, they
earn less in SALARY and total compensation than do experienced CEOs.
They also tend to be employed by slightly larger and more diversified firms
than the average CEO in our experienced panel. This is consistent with
shorter average tenure among diversified firms (compare columns 2 and 3
of Table 1 }, which implies over-representation of these firms in a new CEO
sample.
24 We have estimated equations that take this statement literally, byreplacing the current value of DIVERSE for new CEOs with its valueduring the last year of the preceding CEO's tenure. The coefficient onDIVERSE increases slightly with this substitution, providing even furthersupport for ability interpretations.
23
Estimated compensation equations for this sample are presented in Table
4,25 The coefficient estimates for DIVERSE are quite similar to those
reported for the experienced CEOs in Table 3, although the results are
noisier for this smaller sample. A move from an single-segment firm to The
same size firm with two equal business segments implies an increase of
11% (5%) in first year SALARY and 16% (7%) in first year TOTAL
compensation, all else equal. This provides strong support for an ability
premium interpretation of the diversification effect. These results provide
no support for entrenchment explanations that are based either on actions
the CEO undertakes or on managerial power that is an increasing function
of tenure in position.
Compensation Changes for CEOs
We can directly test the claim that CEOs diversify to improve their
compensation by examining the effect of changes in diversification on
changes in compensation, If CEOs diversify to increase their compensation,
these changes should be positively correlated. If the panel and first-year
CEO results represent payment to ability, however, the correlation between
these changes for an incumbent CEO should be smaller than the correlation
between levels of compensation and diversification
To test these competing hypotheses, we estimate our basic compensationmodel in first differences, We have data on compensation, return, sales
and diversification changes for 1005 CEO-years of the 1505 CEO-years in
The specification is based on column 3, Table 3, with threeexceptions. First, CEO tenure is a constant (1) and therefore omitted.Second, only current performance measures are used because first-yearCEOs have no prior performance. Third, the founder and SDRET havebeen dropped because they are quite noisy and generally estimated asclose to zero.
24
our experienced CEO panel.2° Table 5 reports summary statistics for the
variables included in the first difference model. These include changes in
compensation, DIVERSE, In(SALES), and the rate of retum measures. The
remaining variables in the levels equation are either literally or nearly
constant for a CEO over time and therefore are excluded from the first
difference equations.27 The sample divides fairly evenly among increases,
decreases, and no changes in DIVERSE. While most of the changes in
DIVERSE are due to movements in segment shares rather than changes in
the number of segments, the 147 observations with changes in the reported
number of segments account for more than 80% of the total variation in
DIVERSE.
Results for the first-differenced models are reported in Table 6. Columns
1 (Salary) and 3 (Total) report results for first differences of our basic
specification. The estimated compensation effect of increasing DIVERSE
is negative and relatively substantial for both compensation measures. This
suggests that the Boards rewarded specialization and penalized
diversification during our sample period. The estimates imply that splitting
an undiversified firm into two equal-size business segments (an increase of
0.5 in DIVERSE) would reduce SALARY by 8% (4.6%) and TOTAL
26 Estimated compensation level equations for this sub-sample arequite similar to those for the full 1505 observation dataset, reported inTable 3. The coefficierft on DIVERSE is slightly larger for the 1005observation sub-sample, ranging from .24 (standard error, .08) to .28(.07) in the salary specifications, but within one standard error of theresults reported in Table 3.
27 The model includes year effects but not weighted industry effects.Including changes in the weighted industry fixed effects in the modeldoes not affect the qualitative results but substantially increases thenoisiness of the estimates. The differenced data do not appear to havesufficient power to estimate industry effects as well as the reportedcoefficients.
25
compensation by 17% (12%). The point estimates are noisy, and can be
bounded from zero only at the 0.10 level for the SALARY coefficient and
0.15 for TOTAL. But even a conservative interpretation of these estimates
rejects the interpretation that increasing diversification will increase
compensation, holding all else constant.
This pattern of results is robust to a broad variety of alternative first
difference specifications we have explored, although the precision of the
estimated coefficients declines as we ask more of the data. For example,
we explored whether the negative correlation between diversification and
compensation changes was due to failures of compensation to respond to
size changes when both diversification and sales changed, or due to greater
rewards for CEOs who focus the firm. To test this we allowed the
coefficients on diversification and sales changes to depend on whether
diversification increased, decreased, or remained constant. These results
are reported in columns 2 and 4 of Table 5. While the point estimates are
noisy, they provide little support for these alternative explanations? In
the SALARY regressions (column 2), for example, diversification changes
appear to be associated with somewhat smaller elasticities of compensation
with respect to sales. The penalty for diversifying and reward for focusing
the firm are completely symmetric and unchanged in magnitude from the
results in column 1, however.
These results are difficult to reconcile with managerial entrenchment
explanations of diversification. In contrast to the predictions of the Shlelfer-
Vishny model, there is no premium to the CEO from tailoring the firm to
fit the CEO. Changing the mix of the firm without substantially increasing
° Point estimates in the TOTAL regressions are more sensitive to thissplit and may in part consistent with the alternative explanations. Theirsubstantial standard errors makes interpretation difficult, however.
26
the scale of the firm reduces rather than increases the CEO's compensation.
It is more difficult to empirically falsify the "taste" version of the
entrenchment-based explanations, but our results suggest it may be costly
for a CEO to indulge such a taste.
The implication of these results for overall compensation movements
depends critically on what other changes accompany changes indiversification. The penalty for increases in diversification, for example,
does not necessarily imply actual compensation declines if accompanied by
sufficient increases in firm size. As Table 5 indicates, compensation
increases on average even for CEOs who increase diversification, but by
less than it does for CEOs who reduce diversification.
The negative DIVERSE coefficient indicates that disproportionately high
growth in the firm's primary business (which reduces DIVERSE) is rewarded
more than disproportionately high growth in secondary businesses (which
increases DIVERSE), controlling for overall firm size. Alternatively, consider
a single segment firm that adds a second segment of equal size, increasing
DIVERSE by .50 and ln(sales) by 1. The coefficients in Column 1 imply a
SALARY increment of 13%. The same thought experiment for newly-hired
CEOs (Table 4, Column 1) would imply a 32% salary increase. That is, a
CEO hired by a firm with two equal-sized segments will earn 32% more
than a CEO hired by a firm with one segment and half the sales.2° This
pattern provides additional support for ability-based explanations. We find
that the premium for diversification is much larger when the CEO is
optimally-matched to the firm (i.e., when the estimates allow ability to vary
"Similar calculations can be made for the reverse move: focusingthe firm. A CEO who sells one of two equal-sized business segmentsreduces DIVERSE and ln(SALES) by 0.5. The results in column 1 implythat the incumbent CEO's salary would fall by 2%. The results for newCEOs in table 4 imply a decline of 24%.
2.7
with the level of diversification) than when the incumbent CEO is retained
(i.e., holding the ability of the CEO fixed). This is what we would expect
if ability-matching is the dominant source of the diversification premium.3°
The negative correlation between changes in diversification and executive
compensation is also consistent with market preferences for industrial focus
or specialization over our sample period. Recent empirical research
suggests that greater diversification was on average associated with
reduced shareholder wealth during the late 1 98Os. Studies have concluded
that diversified firms tend to be less profitable than comparable
undiversified firms (Lang and Stulz, 1993; Montgomery and Wemerfelt,
1988); that the stock market reacts less favorably to diversifying
acquisitions than to acquisitions of business closely related to the firm's
existing line of business (Morck, Shleifer and Vishny, 1990)?' If
executive compensation includes a component that rewards improvements
to and penalizes degradation of firm performance beyond the response to
changes in return, pay might adjust to reflect the expected outcomes of
adding or subtracting diverse lines of business. This would imply a
3° For example, because the incumbent CEO has higher ability thanwould be optimal for a newly focused firm, sheihe is paid more than thealternative, well-matched and lower-ability candidate would be. Becausethe incumbent CEO has lower ability than would be optimal for a newlydiversified firm, she/he is paid less than the alternative, well-matchedand higher-ability candidate would be.
31 There is conflicting evidence on the effect of diversification on firmperformance and on the stock market's reaction to diversification overtime. For example, Matsusaka (1993) finds that the stock marketresponded positively to diversifying mergers in the 1 960s, and Morck,Shleifer and Vishny report that the negative reaction to diversifyingmergers is more pronounced in the 1 980s than in the 1970s.. Studiesfinding a positive effect on firm performance from diversification alsotend to be using data for periods prior to 1980. For our sample period,the most common finding is a negative share price reaction todiversification announcements.
28
compensation penalty to increased diversification, as observed in Table 6.
This result echoes Lambert and Larcker (1987). who find that CEOs can
increase their compensation through acquisitions only if the acquisitions
increase the shareholder value of the acquiring firm.
The Form of the Diversification Premium
The specifications estimated above assume that compensation increases
proportionally with DIVERSE. While the qualitative patterns are robust to
alternative measurements of diversification, the numerical estimates depend
on the particular index we use. We have explored many formulations of the
diversification measure and report results for two additional measures
below. The first measure decomposes DIVERSE into two parts: one
reflecting the number of segments and another the variance in segment
size. The second measure is a count of the number of distinct business
segments the firm reports (NUMSEG). Estimated diversification premia
based on these measures are reported in Tables 7A and 78. These
substitutions for DIVERSE have no substantive effect on the remaining
coefficients in the basic compensation equation, which are suppressed to
limit the table size.
We first investigate whether compensation responds similarly to the number
of different business segments and the size distribution of segments within
the firm. This may provide some insight on how the complexity of the
management task varies with diversification. We explore this question by
decomposing DIVERSE, a measure of segment share concentration, into
two terms. The first increases (nonlinearly) in the number of segments, the
second decreases in the variance of segment size:
DIVERSE._!+(1 -no2),n
29

where 2 is the variance of segment revenue shares in the firm.
Table 7A reports results for this decomposition in the basic SALARY and
TOTAL compensation specifications. The estimates suggest that the
number component drives the entire DIVERSE result, with coefficients on
the number component that are identical to those on DIVERSE itself
(compare Table 7A to columns 3 and 5in Table 3). The coefficient on the
number component implies that a firm operating in two industry segments
pays its CEO 12% more on average than an undiversified, single-segment
firm, holding all else constant. Each additional segment is associated with
progressively smaller increments to compensation, with an overall SALARY
premium for a 10-segment firm of 21 %. The data do not suggest any
effect of the variance component on compensation? This seems to imply
that adding business segments increases the complexity of the management
task even if the new activities are small relative to the original line of
business.
We further explore the nonlinearity of compensation with respect to the
number of segments in table 78. In columns 1 (SALARY) and 3 (TOTAL),
we report separate premia, relative to compensation at undiversified single-
segment firms, for each value of NUMSEG (2 through 10 segments).
Because cell counts drop off quite sharply as the number of segments rise
(see Table 2), we also consider estimates that pool across similar NUMSEG
categories. These estimates are reported in columns 2 (SALARY) and 4
(TOTAL).
Detailed investigation of this decomposition suggests that thevariance component may influence compensation during the earlyyearsof CEO tenure, although the point estimates become quite noisy as thesample is subdivided in this way. The coefficient on the numberscomponent is quite stable across tenure categories.
30

While the relationship between diversification and SALARY in Table 78 is
nonlinear, it differs from the form imposed by the construction of DIVERSE.
Diversified firms seem to partition roughly into three categories based on
reported segment counts: two segments, three through five segments, and
six or more segments. these categories form the basis of the estimates in
column 2, Table lB. Moving from a single-segment to a two-segment firm
adds 10% to SALARY. A further move into the 3-5 segment category adds
an additional 7% premium relative to single segment firms, but no
incremental premium for increased segments within this category. CEOs of
the most diversified firms (6 through 10 segments) earn an additional 11 %
premium, implying a SALARY that is almost 30% higher than the SALARY
for CEOs of undiversified firms, all else equal.
The pattern for TOTAL compensation (columns 3 and 4) seems to imply
only two categories of diversified firms: those with two segments and
those with three or more segments. The premium for adding a second
segment to an undiversified firm is estimated at 17%, substantially larger
than the corresponding premium for SALARY. TOTAL compensation
increases by another 3% when a third segment is added, but remains
relatively flat thereafter (column 4). This suggests a smaller TOTAL
compensation premium compared to the SALARY compensation premium
at the most diversified firms. One should not overemphasize this
distinction, however. The estimated diversification effects for TOTAL
compensation are substantially noisier than those for SALARY
compensation, and the point estimates generally are within a standard error
of those we find in the SALARY regressions.
These results suggest that the distinction between diversified and
undiversified enterprises is more significant than most distinctions within
31
the class of diversified firms, with the possible exception of those few firms
with highly diffuse operations (6 or more business segments). This pattern
is consistent with a discrete jump in required managerial inputs when a firm
changes from specialized (one-segment) to diversified. This could reflect
changes in the hierarchical organization of the firm, the need for a
substantively different type of chief. executive, or both. The SALARY
results for the most heavily-diversified firms, while based on small numbers
of companies, suggest a further discrete change in the complexity of
managing large numbers of distinct business segments.
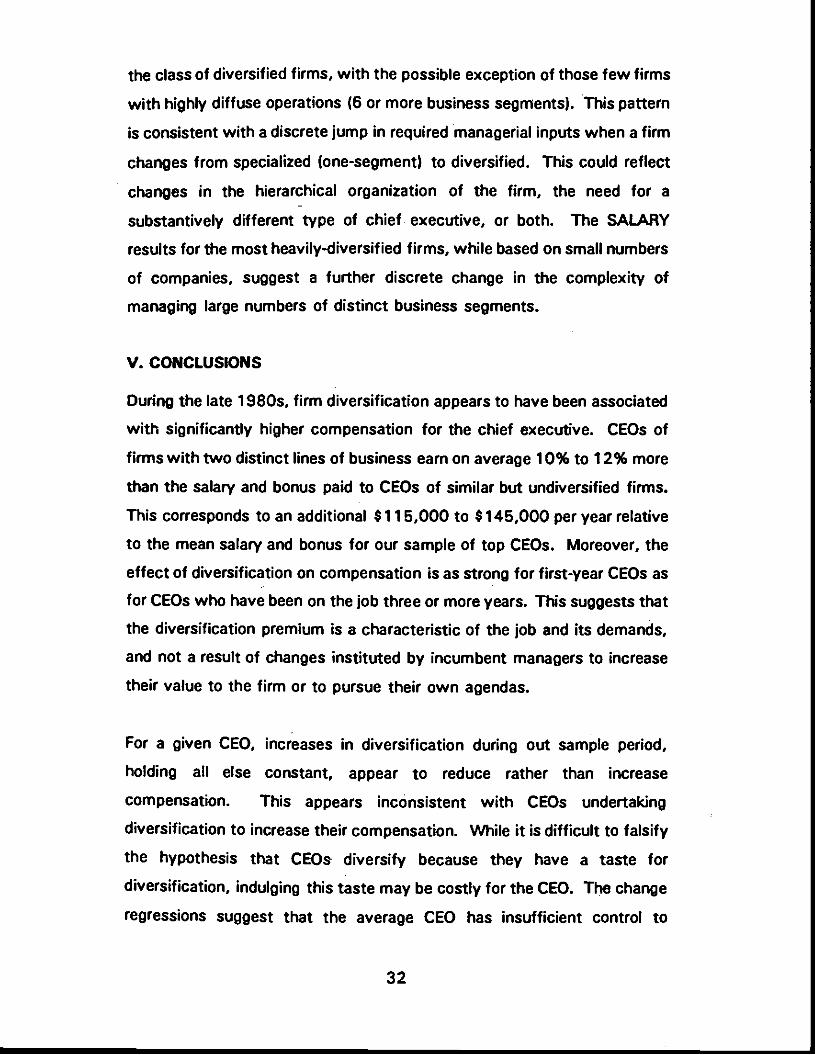
V. CONCLUSIONS
During the late 1 980s. firm diversification appears to have been associated
with significantly higher compensation for the chief executive. CEOs of
firms with two distinct lines of business earn on average 10% to 12% more
than the salary and bonus paid to CEOs of similar but undiversified firms.
This corresponds to an additional $115,000 to $145,000 per year relative
to the mean salary and bonus for our sample of top CEOs. Moreover, the
effect of diversification on compensation is as strong for first-year CEOs as
for CEOs who have been on the job three or more years. This suggests that
the diversification premium is a characteristic of the job and its demands,
and not a result of changes instituted by incumbent managers to increase
their value to the firm or to pursue their own agendas.
For a given CEO. increases in diversification during out sample period,
holding all else constant, appear to reduce rather than increase
compensation. This appears inconsistent with CEOs undertaking
diversification to increase their compensation. While it is difficult to falsify
the hypothesis that CEOs diversify because they have a taste for
diversification, indulging this taste may be costly for the CEO. The change
regressions suggest that the average CEO has insufficient control to
32
diversify the corporation without paying a price in foregone compensation
compared to what could be earned by increasing growth in the core
business.
Our findings support an interpretation of diversification premia as rents
earned by high-ability CEOs. If diversification increases the marginal return
to ability, an efficient labor market will allocate higher ability CEOs to more
diversified firms where they will earn a higher compensation. This is
consistent with the premium observed for experienced CEOs and the equally
high premium for first-year CEOs. The lower increments to changes in
diversification for incumbent CEOs are also consistent with matching
models with turnover costs. Because turnover is costly for both the firm
and the incumbent, bargaining produces an increment that is smaller than
would be observed if the salaries of two well-matched CEOs were
compared.
While this study provides direct evidence only on the relationship between
diversification and executive compensation, it may provide some clues to
the source of the disappointing performance of many diversified firms. If
ability-matching is a critical determinant of compensation patterns across
firms, our results suggest that diversified firms may simply be more difficult
to manage successfully.
33
REFERENCES
Amihud, V. and B. 1ev. "Risk Reduction as a Managerial Motive forConglomerate Mergers." Bell Journal of Economics, Vol. 12 (1981), pp.605-617.
Non, D.J. "Ability. Moral Hazard, Firm Size and Diversification." RandJournal of Economics, Vol. 19(1988), pp. 72-87.
Baker, G.F., Jensen, M.C. and Murphy, K.J. "Compensation andIncentives: Practice vs. Theory." Journal of Finance, Vol. 43 (1988), pp.593-616.
Comment1 R. and Jarrell, G. A. "Corporate Focus, Stock Returns, and theMarket for Corporate Control." Bradley Policy Research Center ManagerialEconomics Research Studies Working Paper MR 91-01, University ofRochester, May 1992.
Finkelstein, S. and Hambrick, D.C. "Chief Executive Compensation: A Studyof the Intersection of Markets and Political Processes." StrategicManagement Journal, Vol. 10 (1989), pp. 121-34.
Gollop, F.M. and Monahan, J.L. "A Generalized Index of Diversification:Trends in U.S. Manufacturing." Review of Economics and Statistics, Vol.xx (1991), pp. 318-330.
Hermalin, B.E. and Katz, M.L. "Corporate Diversification and Agency,"mimeo, 1993, UC Berkeley.
Jensen, M.C. and Murphy, K.J. "Performance Pay and Top ManagementIncentives." Journal of Political Economy, Vol. 98 (19901, pp. 225-64.
Joskow, P.1. and Rose, N.L. "Pay-for-Performance: A Reassessment,"mimeo, 1994, MIT.
Joskow, P., Rose, N. and Shepard, A. "Regulatory Constraints on CEOCompensation." Brookings Papers on Economic Activity: Microeconomics,No. 1, 1993, pp. 1-58.
Lambert, R.A. and Larcker, D.F. "Executive Compensation Effects of LargeCorporate Acquisitions," Journal of Accounting and Public Policy, Vol. 6(1987), pp. 231-242.
Lang, LH.P. and Stulz, R.M. "Tobin's Q, Corporate Diversification and FirmPerformance." NBER Working Paper No. 4376, June 1993.

Lichtenberg, F.R. "The Managerial Response to Regulation of FinancialReporting for Segments of a Business Enterprise." Journal of RegulatoryEconomics. Vol 3 (1991), pp. 241-249.
Mace, M.L. Directors: Myth and Reality. Division of Research. GraduateSchool of Business Administration, Cambridge MA. Harvard University,1971.
Matsusaka, J. C. "Takeover Motives During the Conglomerate MergerWave," Rand Journal of Economics, Vol. 24 (1993), pp. 357-379.
Montgomery, C.A. and Wernerfelt, B. "Diversification, Ricardian Rents, andTobin's q." Rand Journal of Economics, Vol. 19 (1988), pp. 623-632.
Morck, R., Shleifer, A. and Vishny, R.W. "Do Managerial Objectives DriveBad Acquisitions." Journal of finance, Vol 45 (1990). pp. 31-48.
Ravenscraft, D. J. and Scherer, F. M. Mergers, Sell-offs, and EconomicEfficiency. Washington, D. C.: The Brookings Institution, 1987.
Roll, R. "The Hubris Hypothesis of Corporate Takeovers." Journal ofBusiness, Vol. 59 (1986), pp. 197-216.
Rose, D.C. "Bankruptcy Risk, Firm-Specific Managerial Human Capital, andDiversification." Review of Industrial Organization, Vol. 7 (1992), pp. 65-73.
Rosen, S. "Authority, Control and the Distribution of Earnings." Be//Journalof Economics, Vol. 13(1982), pp. 311-323.
Rosen, S. "Contracts and the Market for Executives." In L. Wernin and H.Wijkander, eds., Contract Economics. Oxford: Basil Blackwell, 1992.
Shleifer, A. and Vishny, R.W. Minagement Entrenchment: The Case ofManager-Specific Investments." Journal of Financial Economics, Vol. 25(1989), pp. 123-39.
Waidman, M. "Worker Allocation, Hierarchies and the Wage Distribution."Review of Economic Studies, Vol. 51(1984), pp. 95-1 09.
35
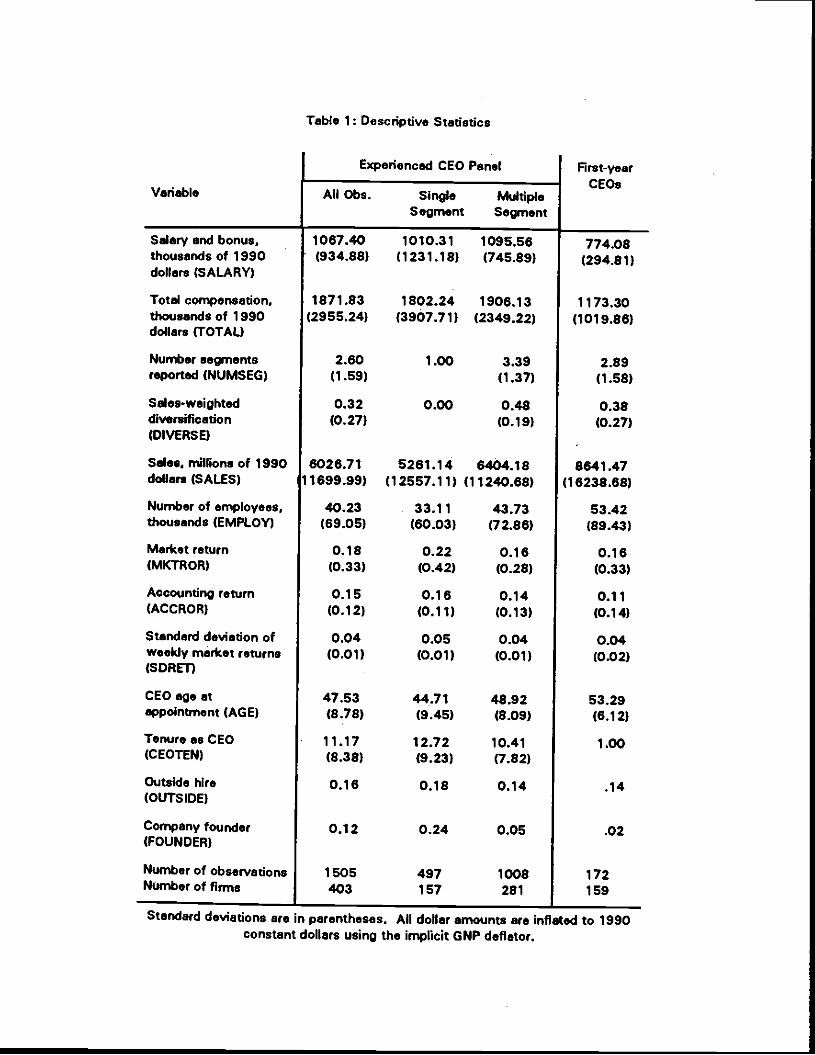
Table 1: Descriptive Statistics
Experienced CEO Panel First-yearCEOs
Variable All Obs. Single MultipleSegment Segment
Salary end bonus, 1067.40 1010.31 1095.56 774.08thousands of 1990 (934.88) (1231.18) (745.89) (294.81)dollars (SALARY)
Total compensation, 1871.83 1802.24 1906.13 1173.30thousands of 1990 (2955.24) (3907.71) (2349.22) (1019.86)dollars (TOTAL)
Number segments 2.60 1.00 3.39 2.89reported (NUMSEG) (1.59) (1.37) (1.58)
Sales-weighted 0.32 0.00 0.48 0.38dIversification (0.27) (0.19) (0.27)(DIVERSE)
Sales, millions of 1990 6026.71 5261.14 6404.18 8641.47dollars (SALES) 11699.99) (12557.11) (11240.68) (16238.68)
Number of employees, 40.23 33.11 43.73 53.42thousands (EMPLOY) (69.OS) (60.03) (72.86) (89.4.3)
Market return 0.18 0.22 0.16 0.16(MKTROR) (0.33) (0.42) (0.28) (0.33)
Accounting return 0.15 0.16 0.14 0.11(ACCROR) (0.12) (0.11) (0.13) (0.14)
Standard deviation of 0.04 0.05 0.04 0.04weekly market returns (0.01) (0.01) (0.01) (0.02)(SDRET)
CEO age at 47.53 44.71 48.92 53.29appointment (AGE) (8.78) (9.45) (8.09) (6.12)
TenureasCEo 11.17 12.72 10.41 1.00(CEOTEN) (8.38) (9.23) (7.82)
Outside hire 0.16 0.18 0.14 .14(OUTSIDE)
Company founder 0.12 0.24 0.05 .02(FOUNDER)
Number of observations 1505 497 1008 172Numberof firms 403 157 281 159
Standard deviations are in parentheses. All dollar amounts are inflated to 1990constant dollars using the implicit GNP deflator.
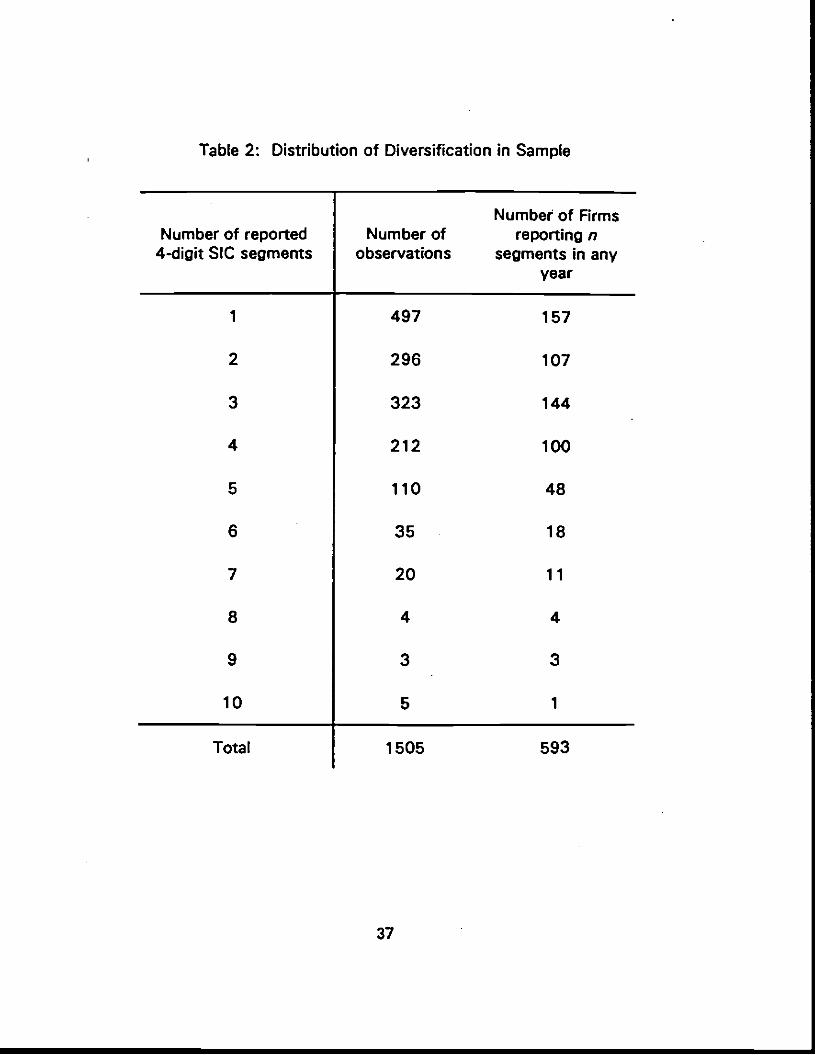
Table 2: Distribution of Diversification in Sample
Number of reported Number ofNumber of Firms
reporting n4-digit SIC segments observations segments in
yearany
1 497 157
2 296 107
3 323 144
4 212 100
5 110 48
6 35 18
7 20 11
8 4 4
9 3. 3
10 5 1
Total 1505 593
37
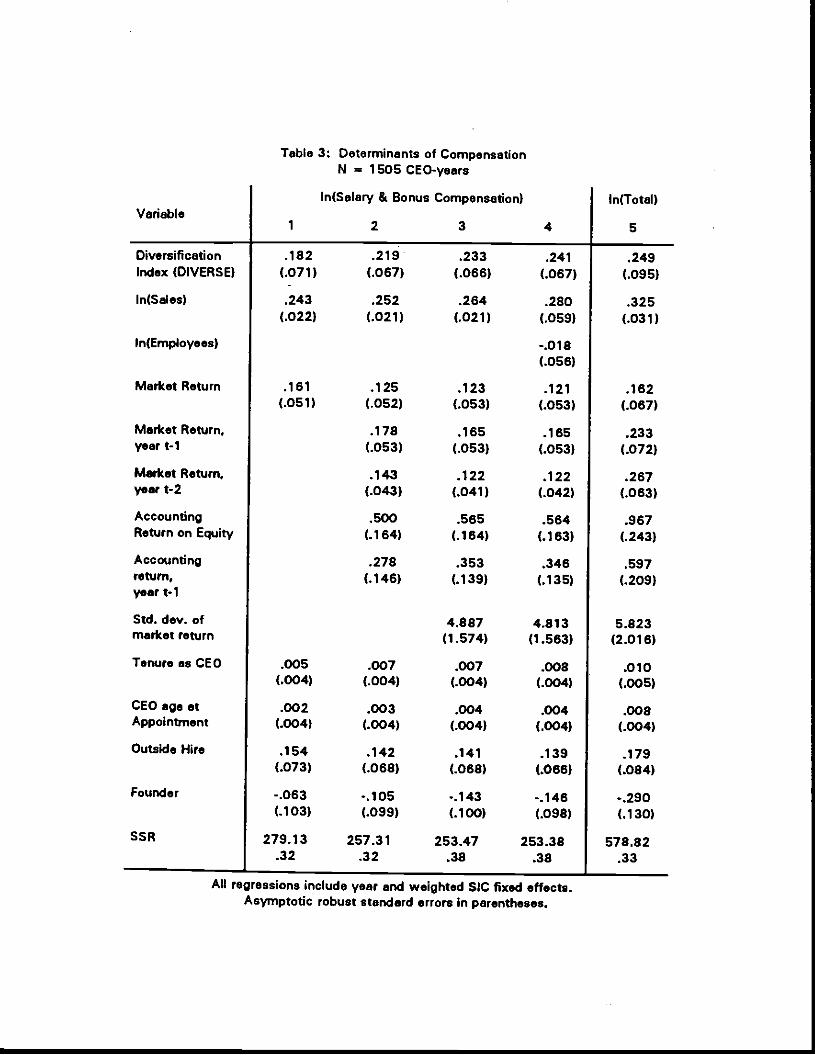
Table 3: Determinants of CompensationN = 1505 CEO-years
ln(Sal8ry & Bonus Compens8tion) In(Total)Variable
1 2 3 4 5
Diversification .182 .219 .233 .241 .249Index (DIVERSE) (.071) (.067) (.066) (.067) (.095)
Jn(Sales) .243 .252 .264 .280 .325(.022) (.021) (.021) (.059) (.031)
ln(Employees) -.018(.056)
Market Return .161 .125 .123 .121 .162(.051) (.052) (.053) (.053) (.067)
Market Return. .178 .165 .165 .233year t-1 (.053) (.053) (.053) (.072)
Market Return, .143 .122 .122 .267year t-2 (.043) (.041) (.042) (.063)
Accounting .500 .565 .564 .967Return on Equity (.164) (.164) (.163) (.243)
Accounting .278 .353 .346 .597return, (.146) (.139) (.135) (.209)year t-1
SW. day, of 4.887 4.813 5.823market return (1.574) (1.563) (2.016)
Tenure as CEO .005 .007 .007 .009 .010(.004) (.004) (.004) (.004) (.005)
CEO age at .002 .003 .004 .004 .008Appointment (.004) (.004) (.004) (.004) (.004)
Outside Hire .154 .142 .141 .139 .179(.073) (.068) (.068) (.066) (.084)
Founder -.063 -.105 -.143 -.146 -.290(.103) (.099) (.100) (.098) (.130)
SSR 279.13 257.31 253.47 253.38 578.82.32 .32 .38 .38 .33
All regressions include year and weighted SIC fixed effects.Asymptotic robust standard errors in parentheses.
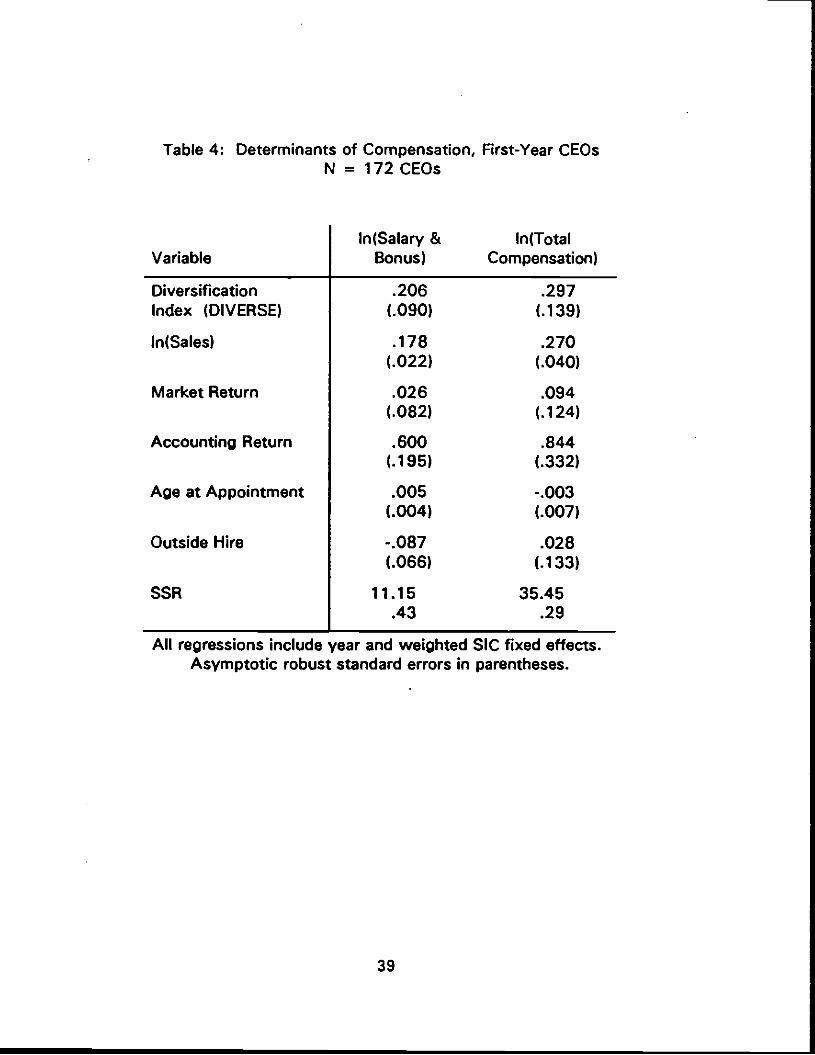
Table 4: Determinants of Compensation, First-Year CEOsN = 172 CEOs
In(Salary & In(TotalVariable Bonus) Compensation)
Diversification .206 .297Index (DIVERSE) (.090) (.139)
ln(Sales) .178 .270(.022) (.040)
Market Return .026 .094(.082) (.124)
Accounting Return .600 .844(.195) (.332)
Age at Appointment .005 -.003(.004) (.007)
Outside Hire -.087 .028(.066) (.133)
SSR 11.15 35.45.43 .29
All regressions include year and weighted SIC fixed effects.Asymptotic robust standard errors in parentheses.
39
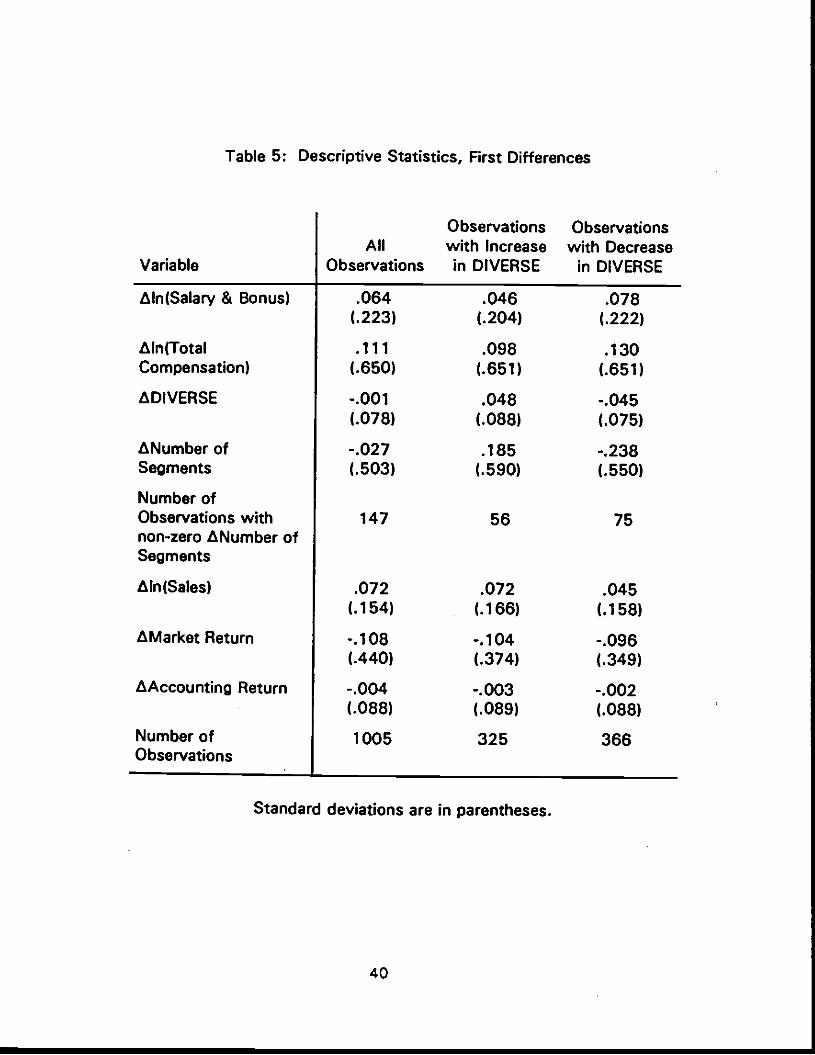
Table 5: Descriptive Statistics, First Differences
Observations ObservationsAll with Increase with Decrease
Variable Observations in DIVERSE in DIVERSE
Aln(Salary & Bonus) .064 .046 .078(.223) (.204) (.222)
Aln(Total .111 .098 .130Compensation) (.650) (.651) (.651)
ADIVERSE -.001 .048 -.045(.078) (.088) (.075)
ANumber of -.027 .185 -.238Segments (.503) (.590) (.550)
Number ofObservations with 147 56 75non-zero ANumber ofSegments
AIn(Sales) .072 .072 .045(.154) (.166) (.158)
AMarket Return -.108 -.104 -.096(.440) (.374) (.349)
AAccounting Return -.004 -.003 -.002(.088) (.089) (.088)
Number of 1005 325 366Observations
Standard deviations are in parentheses.
40
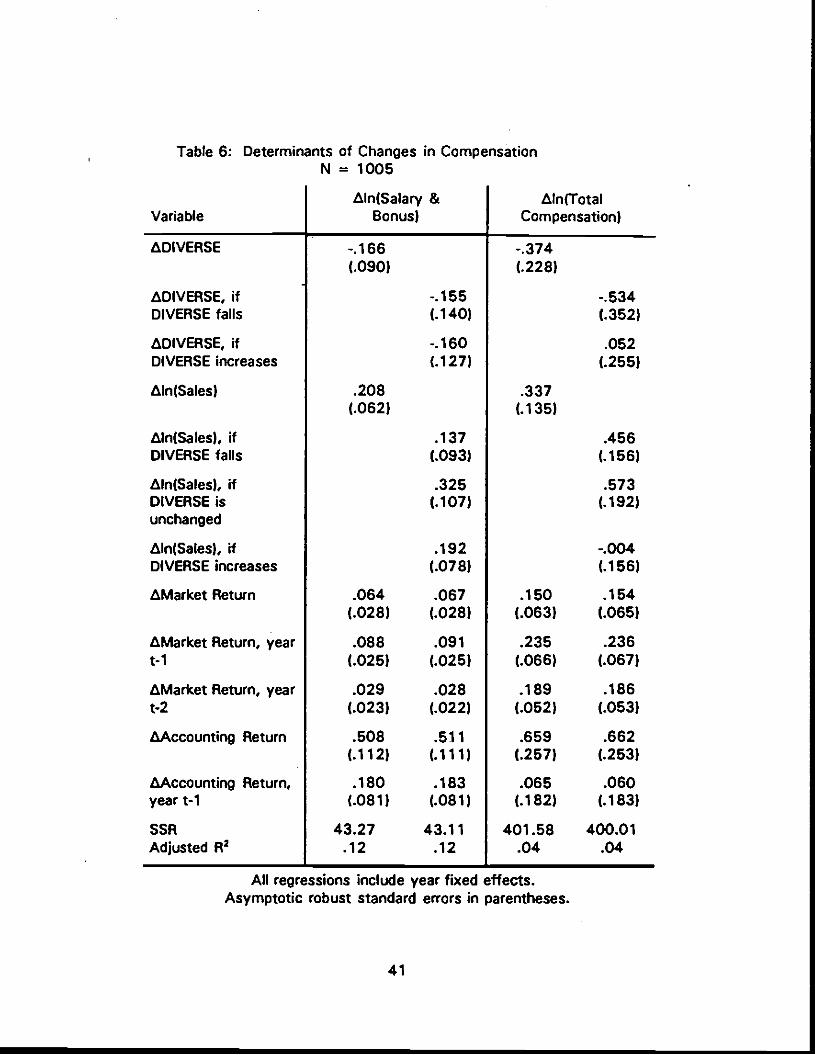
Table 6: Determinants of Changes in CompensationN = 1005
tIn(Salary & Aln(TotalVariable Bonus) Compensation)
tDIVERSE -.166 -.374(.090) (.228)
ADIVERSE,if -.155 -.534DIVERSE faIls (.140) (.352)
ADIVERSE, if -.160 .052DIVERSE increases (.127) (.255)
tIn(Sales) .208 .337(.062) (.135)
ftln(Sales), if .137 .456DIVERSE falls (.093) (.156)
Aln(Sales), if .325 .573DIVERSE is (.107) (.192)unchanged
Aln(Sales), if .192 -.004DI VERSE increases (.078) (.156)
AMarket Return .064 .067 .150 .154(.028) (.028) (.063) (.065)
AMarket Return, year .088 .091 .235 .236ti (.025) (.025) (.066) (.067)
AMarket Return, year .029 .028 .189 .186t-2 (.023) (.022) (.052) (.053)
AAccounting Return .508 .511 .659 .662(.112) (.111) (.257) (.253)
AAccounting Return, .180 .183 .065 .060year t-1 (.081) (.081) (.182) (.183)
SSR 43.27 43.11 401.58 400.01Adjusted R2 .12 .12 .04 .04
All regressions include year fixed effects.Asymptotic robust standard errors in parentheses.
41
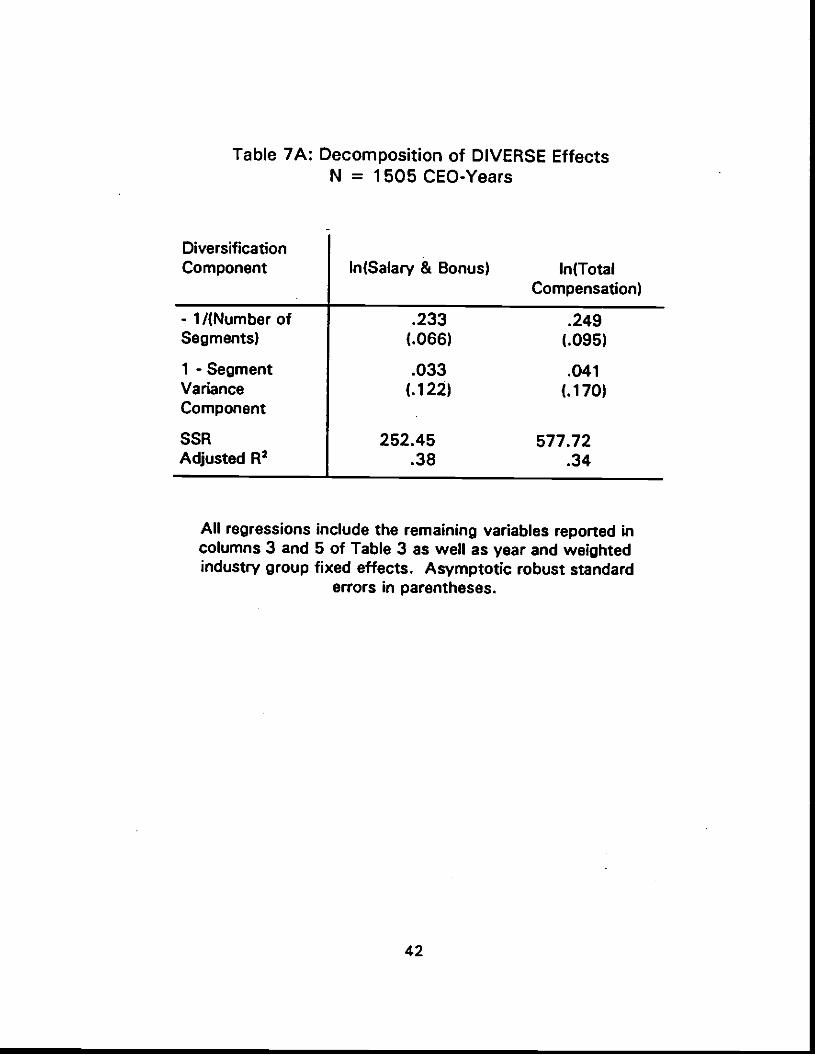
Table 7A:
DiversificationComponent
Decomposition of DIVERSE EffectsN = 1505 CEO-Years
ln(TotalCompensation)
All regressions include the remaining variables reported incolumns 3 and 5 of Table 3 as well as year and weightedindustry group fixed effects. Asymptotic robust standard
errors in parentheses.
42
ln(Salary & Bonus)
Component(.122)
.
(.170)
SSR 252.45 577.72Adjusted R2 .38 .34
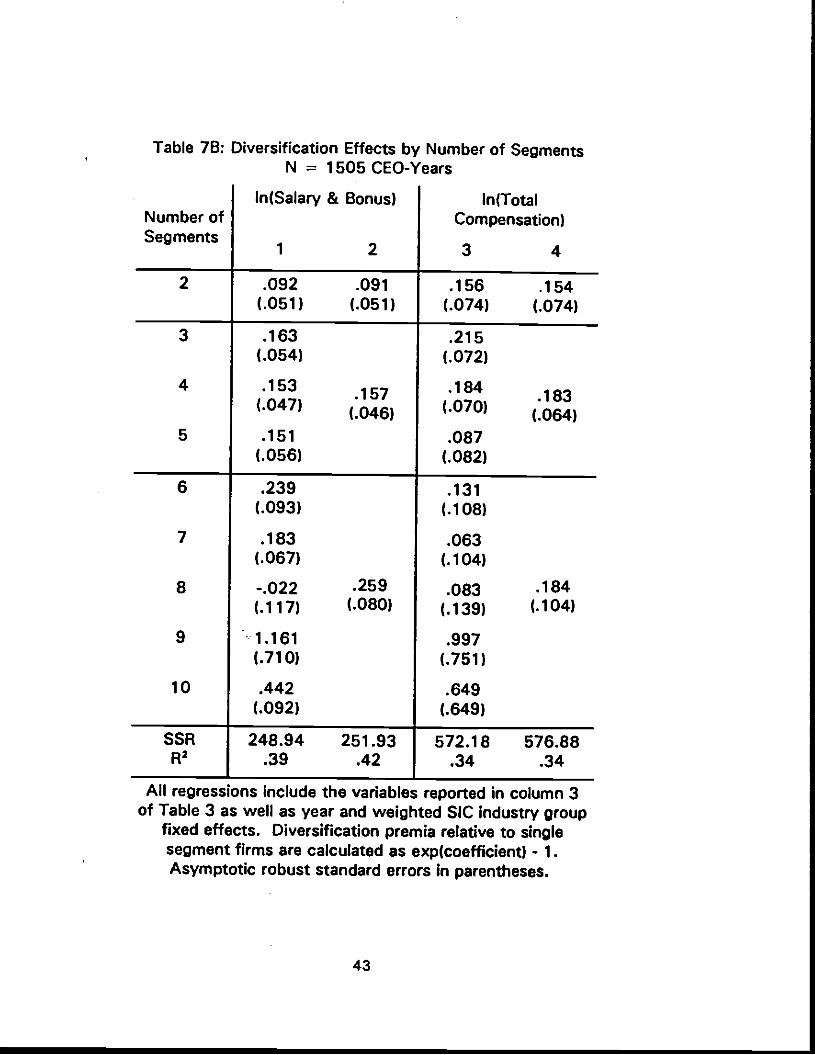
Table 78: Diversification Effects by Number of SegmentsN = 1505 CEO-Years
ln(Salary & Bonus) ln(TotalNumber of Compensation)Segments
1 2 3 4
2 .092 .091(.051) (.051)
.156 .154(.074) (.074)
3
4
5
.163(.054)
.153 .157(.047) (.046).151
(.056)
.215(.072)
.184 .183(.070) (.064).087
(.082)
6
7
8
9
10
.239(.093)
.183(.067)
-.022 .259(.117) (.080)
1.161(.710)
.442(.092)
.131(.108)
.063(.104)
.083 .184(.139) (.104)
.997(.751)
.649(.649)
SSRR2
248.94 251.93.39 .42
572.18 576.88.34 .34
All regressions include the variables reported in column 3of Table 3 as well as year and weighted SIC industry group
fixed effects. Diversification premia relative to singlesegment firms are calculated as exp(coefflcient) - 1.Asymptotic robust standard errors in parentheses.
43
Appendix Table Al: Industry Classificationand Fixed Effects
categorySIC codn Included
in GroupEstimated Fixe d
Effects
Agriculture, Forestry & Fishing 01.09 -1.444 (.727)
Mining 10, 12,14 -.029 (.135)
Oil and Gas Extraction 13 .211 (.233)
ConstructIon 15, 16. 17 -.147 (.145)Food & Kindred Products 20 .131 (.104)
Paper & Allied Products 26 -.070 (.094)
Printing & Publishing 27 -.037 (.105)Chendcals & Allied Products 28 .204 (.079)Petroleum Refining & RelatedIndustries
29.
-.158 (-121)
Other Manufacturing 21-25, 30-32, 39 .234 (.136)Metals 33,34 -.152 (.134)Machinery & Compute 35 base group
Electronic Equipment &Measuring Equipment
36, 38 .025 (.092)
Transportation Equipment 37 -.033 (.107)Railroad, 4011 .279 (.123)TruckIng 4213, 4210 -.046 (.081)Airlines 4511, 4512 -.224 (.091)Gas Pipelines 4922, 4923 ..073 (.254)Unregulated Transportation,Communication, and Utilities
40-49, excl. 4011, 4213.4511-12, 4813, 4911,
4922-24, 4931-32
.158 (.145)
Wholesale Trade so, 51 -.107 (.093)Retail Trade 52-59 -.121 (.119)
Financial Services 60-69 .104 (.290)Services 1 70-79 .330 (.204)ServIces 2 80-89 .281 (.192)
Table 3, col. 3 regression. Asymptotic robust standard errors in parentheses.
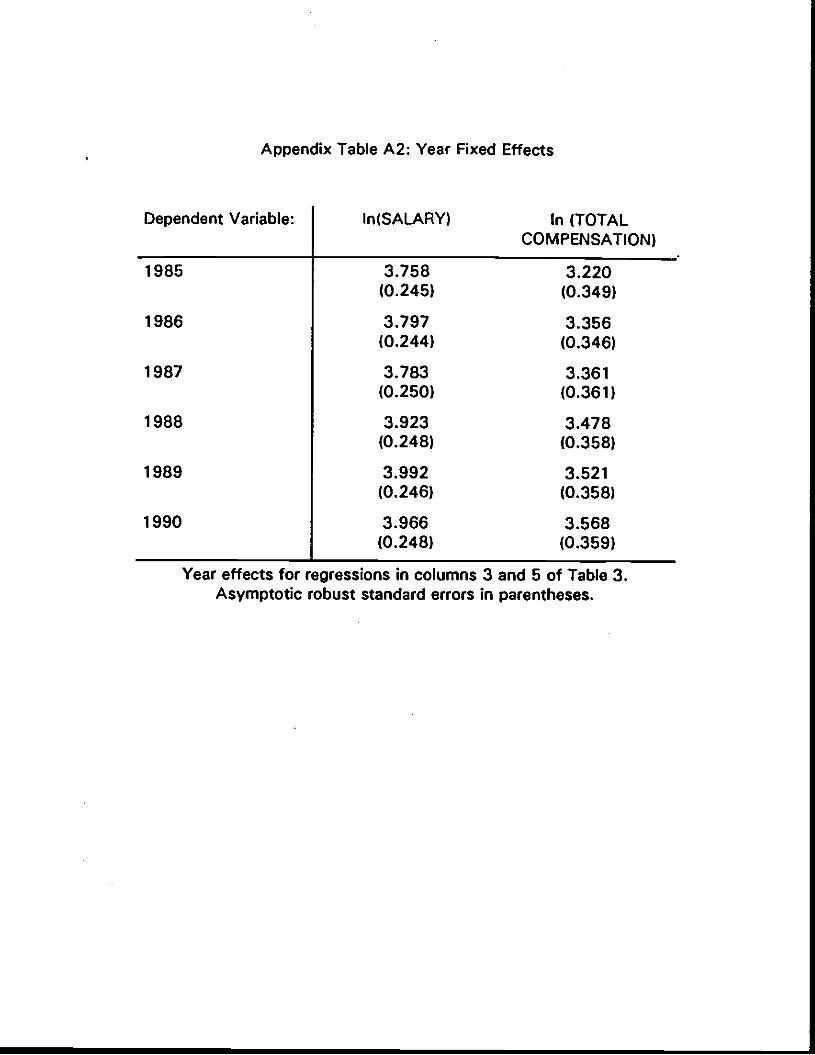
Appendix Table A2: Year Fixed Effects
Dependent Variable: ln(SALARY) In (TOTALCOMPENSATION)
1985 3.758 3.220(0.245) (0.349)
1986 3.797 3.356(0.244) (0.346)
1987 3.783 3.361(0.250) (0.361)
1988 3.923 3.478(0.248) (0.358)
1989 3.992 3.521(0.246) (0.358)
1990 3.966 3.568(0.248) (0.359)
Year effects for regressions in columns 3 and 5 of Table 3.Asymptotic robust standard errors in parentheses.