nber working paper series what determines firm size? krishna b. kumar raghuram
TRANSCRIPT

NBER WORKING PAPER SERIES
WHAT DETERMINES FIRM SIZE?
Krishna B. Kumar Raghuram G. Rajan
Luigi Zingales
Working Paper 7208http://www.nber.org/papers/w7208
NATIONAL BUREAU OF ECONOMIC RESEARCH1050 Massachusetts Avenue
Cambridge, MA 02138July 1999
We thank Eugene Fama, Doug Gollin, Ananth Madhavan, John Matsusaka, Andrei Shleifer, and workshopparticipants at Chicago, Copenhagen, Norwegian School of Management-B1 and USC for comments. Allopinions expressed are those of the authors and not those of the National Bureau of Economic Research.
© 1999 by Krishna B. Kumar, Raghuram G. Rajan, and Luigi Zingales. All rights reserved. Short sectionsof text, not to exceed two paragraphs, may be quoted without explicit permission provided that full credit,including © notice, is given to the source.

What Determines Firm Size?Krishna B. Kumar, Raghuram G. Rajan, and Luigi ZingalesNBER Working Paper No. 7208July 1999JEL No. D23, G30, K40, L20
ABSTRACT
Motivated by theories of the firm, which we classify as "technological" or "organizational,"we analyze the determinants of firm size across industries and across countries in a sample of 15European countries. We find that, on average, firms facing larger markets are larger. At the industrylevel, we find firms in the utility sector are large, perhaps because they enjoy a natural, or officiallysanctioned, monopoly. Capital intensive industries, high wage industries, and industries that do a lotof R&D have larger firms, as do industries that require little external financing. At the country level,the most salient findings are that countries with efficient judicial systems have larger firms, and,correcting for institutional development, there is little evidence that richer countries have larger firms.Interestingly, institutional development, such as greater judicial efficiency, seems to be correlated withlower dispersion in firm size within an industry. The effects of interactions (between an industry'scharacteristics and a country's environment) on size are perhaps the most novel results in the paper,and are best able to discriminate between theories. As the judicial system improves, the difference insize between firms in capital intensive industries and firms in industries that use little physical capitaldiminishes, a finding consistent with "Critical Resource" theories of the firm. Finally, the average sizeof firms in industries dependent on external finance is larger in countries with better financial markets,suggesting that financial constraints limit average firm size.
Krishna B. Kumar Raghuram G. RajanMarshal School of Business Graduate School of BusinessUniversity of Southern California University of ChicagoLos Angeles, California 90089-0001 1101 E 58th Street [email protected] Chicago, Illinois 60637
Luigi Zingales Graduate School of Business University of Chicago1101 E 58th Street Chicago, Illinois 60637and [email protected]

Why is it that a small country like Finland has such large successful firms such as Nokia?This question is not of minor importance. In recent years, a great deal of attention has beenpaid to the process of economic growth. An interesting aspect of growth is that much of it takesplace through the growth in the size of existing organizations. For instance, in the sample of43 countries they study, Rajan and Zingales (1998a) find that 2/3rd of the growth in industriesover the 1980s comes from the growth in the size of existing establishments, and only 1/3rdfrom the creation of new ones. What determines the size of economic organizations? Are thereany constraints to size and, hence, any potential constraints to growth?
Organizational size seems important for various economic phenomena. For example, thework by Gertler and Gilchrist (1994) suggests that small firms account for a disproportionateshare of the manufacturing decline that follows the tightening of monetary policy. Size hasbeen found to be an important influence on stock returns (see Banz (1981)). Similarly, variousphenomena in corporatejinance - the extent to which a firm levers up, the quantity of tradecredit it uses, the compensation its top managers get, all seem related to firm size.1 But whatdetermines firm size?
The data we have on the distribution of firm size across industries in 15 European countriesare particularly useful for answering this question. These are all fairly well-developed countries,so the minimum conditions for the existence of firms such as a basicrespect for property rights,the widespread rule of law, and the educational levels to manage complex hierarchies exist. Anumber of first order factors such as war, economic system, or respect for basic property rightsthat would otherwise affect firm size are held constant in this sample. This enables us to focuson more subtle economic and institutional factors for which there issome variation across thissample of countries. We also have a large number of industries, and the variation between indus-tries in their use of different factors can give us some understanding of the effects of productiontechnology on firm size. Finally, the interactions between institutional and technological effectsgive us perhaps the clearest insights into the determinants of firm size.
We start by documenting broad patterns in firm size across industries and countries. Wefind that, on average, firms facing larger markets are larger. At the industry level, we find firmsin the utility sector are large, perhaps because they enjoy a natural, or officially sanctioned,
monopoly. Physical capital intensive industries, high wage industries, and industries that doa lot of R&D have larger firms, as do industries that require little external financing. While
'For the link, between finn size and leverage see the extensive literature cited in Harris and Raviv (1990) orRajan and Zingales (1995), for size and trade credit see Petersen and Rajari (1997), and forcompensation, seeJensen and Murphy (1990), and the literature cited there.
1

we are not aware of studies that examine these precise correlations, or of studies that examine
these patterns across a number of countries, some of these correlations are not surprising given
the past literature on intra-industry patterns (see Audretsch and Mahmood (1995), Caves and
Pugel (1980), Kiepper (1996), Sutton (1991), for example).
At the country level, the most salient findings are that countries with efficient judicial
systems have larger firms, and, contrary to conventional wisdom, there is little evidence that
richer countries have larger firms. Interestingly, institutional development, such as greaterjudicial efficiency, seems to "level the playing field" and is correlated with lower dispersion in
firm size within an industry. The effects of interactions (between an industry's characteristics
and a country's environment) on size are perhaps best able to discriminate between theories. We
find that the relative size of firms in capital intensive industries diminishes as the judicial system
becomes more efficient. This is in large measure because the average size of firms in industries
that are not physical asset intensive is larger in countries with better judicial systems. Taken
together, our evidence is consistent not only with theories that emphasize the fundamental
importance of ownership of physical assets in determining the boundaries of the firm, but also
with theories that suggest other mechanisms than ownership can expand firm boundaries when
the judicial system improves. Finally, the average size of firms in industries dependent onexternal finance is larger in countries with better financial markets, suggesting that financial
constraints may also keep firms small.
These findings indicate an answer to the question that starts this paper. Assuming our
correlations are indeed evidence of causality, firms in Finland are large despite the country's
small size, probably because it has a very efficient judicial system as compared to say Spain or
Italy, and its financial system, as measured by its accounting standards, is well developed.
A caveat is in order. The theories are not really comprehensive, and since our proxies are
not detailed enough to allow us to devise precise tests, our empirical work should be viewed
as exploratory analysis motivated by theory, rather than actual tests. We do believe this is auseful exercise, for the patterns that are discovered can be used to motivate more comprehensive
theory that is amenable to testing. In section 1, we discuss the theories, in Section 2 wepresent the data used and discuss their broad patterns. We report partial correlations of size
with industry specific characteristics (section 3), country specific variables (section 4), andinteractions between the two (section 5). We discuss the results in section 6 and conclude with
avenues for future research.
2

1 Existing Theories
We classify theories broadly as technological, organizational, and institutional, based on whetherthey focus on the production function, the process of control, or environmental influences.
Clearly, the classification will be somewhat arbitrary because some theories combine elements
of different approaches. Moreover, space constraints do not permit us the luxury of beingexhaustive, and the theories discussed below should only be viewed as representative.
1.1 Technological Theories
Adam Smith (1776) suggested that the extent of specialization was limited by the size of themarket. If a worker needs to acquire task-specific human capital, there is a "set-up" cost incurredevery time the worker is assigned to a new task. It is, therefore, reasonable to expect workers to
perform specialized tasks and to expect a firm to hire more workers when its production processbecomes more specialized. Therefore, one would expect not only the extent of specializationbut also the size of firms to be limited by the size of the market that is being served.
jFrom the perspective of our study, we would expect firm size to be correlated with theoverall size of the market. However, Smith's prediction has not remained unchallenged. Beckerand Murphy (1992) point to the existence of multiple firms serving most markets to arguethat specialization is not limited by the size of the market. In their theory, coordination costsplay a major role in limiting the size of firms before the size of the market becomes binding.2
Given these conflicting predictions, whether market size is relevant for firm size is, therefore,anempirical question.
Lucas (1978) uses a neoclassical model to study the size distribution of firms. He assumesthat the "talent for managing" is unevenly distributed among agents, with firm output increasingin this talent. A firm is identified with a manager, and the capital and labor under themanager'scontrol. The central aspects of the model are the decision an agent faces between becoming amanager or an employee, and the decision a manager faces on the optimal choice of the levels of
employment and capital in her firm. In equilibrium, only the most talented become managers,and the unique size (number of employees) of the marginal manager's firm minimizesaverage
21n a world in which contracts are incomplete, the existence of multiple firms does notnecessarily imply thatthe size of the market is not a constraint on finn size. If employment contracts are incomplete,an individual maynot specialize if he fears being taken advantage of by a monopolist firm. In a manner reminiscent of the literatureon second-sourcing (see Shepard (1987), for example), multiple finns may be required so that an individual inany one of the firms specializes. The degree of specialization may then be constrained by both the necessity forcompetitive alternatives, and the size of the market.
3

cost. If the elasticity of substitution between capital and labor in the production function is less
than one, average firm size increases with per capita wealth — an increase in per capita capital
raises wages relative to managerial rents, inducing marginal managers to become employees,
and increasing the ratio of employees to managers. Lucas finds a regression of firm size on per
capita GNP (a proxy for per capita capital) based on US time series data reveals a positive
relationship between the two variables. The implication for our study is that more capitalintensive technologies would result in larger firms.
Rosen (1982) considers a hierarchical organizational structure, where improved labor produc-
tivity at any given level has effects that successively filter through all lower levels. In particular,
there are three layers in the hierarchy — management, supervision, and production. The processof management involves making discrete and indivisible choices and is therefore subject to scale
economies. However, there are strong diminishing returns in supervision because the manager
loses control as firm size increases. The trade-off between managerial scale economies and the
loss of control results in determinate firm sizes. In equilibrium, persons with the highest skills
are placed in the highest positions of the largest and deepest firms. A key result is that the
multiplicative productivity interactions mentioned above make the equilibrium distribution of
firm size more skewed than the underlying distribution of talent. Rosen notes that this is con-
sistent with data — sizeable concentration ratios are seen even in industries where competitive
conditions might be expected to apply. His result that larger firms have more capable personnel
also suggests a positive correlation between the level of available human capital and firm size.3
Kremer (1993) focuses more directly on human capital, and less on hierarchies. He models
human capital as the probability that a worker will successfully complete a task. Each task is
performed by one worker, so the output of the firm (a sequence of tasks) depends on the product
of the skill levels of all workers. The hierarchy of managers and subordinates in Lucas (1978)
and Rosen (1982) gives way to an equilibrium with sorting of workers with the same human
capital. Kremer shows that firms using technologies that need several tasks will employ highly
skilled workers because mistakes are more costly to such firms. While Kremer admits that his
model is not a fully worked out theory of the firm, he speculates that the number of tasks and
number of workers are likely to be positively correlated, and the model is therefore consistent
with the stylized fact that richer (higher human capital) countries specialize in complicated
3k should be noted that the connection in Rosen's model is between the human capital level of managersandfirm size. However, proxies for human capital are available at the general level rather than at the manageriallevel. The model of Kremer (1993) discussed below, which has no hierarchy, has a more direct connection betweenthe general level of human capital and firm size.
4

products and have larger firms.
Another implication of the model is that firm size should be positively correlated with thewage per worker. This is because a higher wage implies a higher quality worker, and all otherthings constant, implies that more workers can be used in the production process. The lackof a hierarchical structure in Kremer's model makes the relationship between average humancapital of the workforce and average firm size more explicit, unlike the models of Lucas andRosen where the human capital of managers, who typically constitute a small fraction of theworkforce, is what matters. But the absence of hierarchy also makes the theory more relevantto a production process, and less to a firm.
1.2 Organizational Theories
Organizational theories fall into three broad categories. One set of theories often referred toas Contracting Cost theories (see, for example, Alchian and Demsetz (1972) and Jensen andMeckling (1976)) — suggest little difference in the contracts at work 'inside a firm' and in themarket. Instead, the firm is simply a particular configuration of contracts characterized by acentral common party to all the contracts, who also has the residual claim to the cash flows.
Centralization helps mitigate problems of metering inputs and controlling agency costs. Sincethe contracts in a firm are no different from contracts in the market place, these theories aresilent on whether improvements in contractability — for example, because of improvements inthe legal system - have any effect on the size of firms.
A second set of theories, loosely grouped as 'Transaction Cost' theories (see Klein, Crawfordand Alchian 1978) and Williamson (1975, 1985)) offer more guidanceas to whether a transactionshould take place between two arm's length entities or within a firm, where a firm can be looselydefined as an entity with a common governance structure. The advantage of doing a transactionwithin a firm is that the firm brings incentives to bear that cannot be reproduced in an arm'slength market. Unfortunately, factors that typically determine the extent of integration in these
theories, such as asset specificity and informational asymmetry, are hard to proxy for even withdetailed data, let alone in a relatively macro-level study such as ours. We will have little to sayabout these theories.
The third set of theories, which can collectively be described as "Critical Resource" theoriesof the firm (see Grossman and Hart (1986) for the seminal work in this area and Hart (1995) for
an excellent survey of the early literature), however, offer greater grist for empirical mills. Thestarting point of these theories is that transactions can either be fully governed by contracts
5

enforced by courts or by other mechanisms that confer power in non-contractual ways to one
or the other party to the transaction. The non-contractual source of power is usually a critical
resource that is valuable to the production process. A variety of (non-contractual) mechanisms
attach the critical resource to one of the parties in a way that maximizes the creation of surplus.
For example, the Property Rights approach (see Grossman and Hart (1986), Hart and Moore
(1990)) emphasizes physical assets as the primary critical resource, and ownership as the mech-
anism that attaches this resource to the right agent. According to this view, ownership differs
from ordinary contracts because it confers on the owner the residual rights of control over the
asset (the right to decide in situations not covered by contract). The power associated with
the common ownership of physical assets is what makes the firm different from ordinary market
contracting.
More recent developments of this theory (see Rajan and Zingales (1998b, 1998c), for exam-
ple) emphasize, first, that the critical resource can be different from an alienable physical asset
and, second, mechanisms other than ownership can help bonds develop between various agents
who participate in the production process. In general, these mechanisms work by fostering com-
plementarities between agents, and between agents and the critical resource. The agent whocontrols the critical resource can threaten to destroy the complementarities, and thus gets some
power over other agents. This facilitates transactions even when contracts are inadequate. The
firm then consists of the critical resource and the agents who are tied to it via complementari-
ties. Thus these recent developments (also see Holmstrom (1999) and Holmstrom and Roberts
(1998)) suggest a larger boundary for the firm than the set of commonly owned assets.
From an empirical perspective, these theories suggest that the quantity of physical assets
over which ownership can be exerted is one determinant of firm size, but the boundaries of the
firm are also expanded by mechanisms other than ownership, some of which are aided by the
law. In particular, Rajan and Zingales (1998c) analyze a stylized model where an entrepreneur
has a critical resource with which she wants to produce. In order to produce, she has to offer
employees access to the resource and its mode of employ. There are constant returns to scale in
production (so that technology does not limit the size of the firm) but extreme increasing returns
to scale in marketing so that a larger firm captures a disproportionate share of the market. The
problem is that the entrepreneur's property rights to the critical resource are not fully secure.
As a result, she has to limit the number of employees who have access to the resource. The
reason is that while she has a "noyeaux dur" of employees who have specialized to the firm's
business, have high switching costs, and are therefore loyal, new unspecialized employees have
6

low switching costs. If there are a sufficient number of them, they will know that they cancapture a large market share if they band together and make away with a copy of the criticalresource. Thus the entrepreneur can employ only a few new employees, and has to wait untilthey specialize and become loyal before admitting new ones. It turns out that not only doesthis fear of expropriation limit the rate of growth of the number ofemployees in the firm, it alsolimits its eventual size.
The implications of this model are quite stark. So long as the government respects propertyrights broadly, physical assets are hard to make away with. So the entrepreneur is protectedagainst expropriation if the critical resource consists of physical assets. More generally, evena modicum of respect for property rights confers substantial power on the owner of physicalassets, and allows her to exercise control over a large number of employees. Thus physicalcapital intensive firms will typically be larger.
But as legal institutions improve, the entrepreneur gets other forms of protection. Forexample, patent rights protect her intellectual property, while non-compete clauses restrainemployees from departing. Thus firms that rely on other forms of critical resources, such asbrand names, intellectual property, or innovative processes, should become larger as the legalenvironment improves.4
1.3 Institutional theories
There are many channels through which institutions can affect firm size beyond that predicted bythe technological and organizational theories. Wegroup these channels into two main categories:regulatory and financial.
1.3.1 Regulatory theories
Many costly regulations apply only to larger firms (for example the obligation to provide healthinsurance in the United States or Union Laws in Italy). This tilts theplaying field towards small
firms. Other regulations, such as strong product liability laws, favor the creation of separatelegal entities that can avail of the protection afforded by limited liability. This should lead tosmaller firms. For instance, each taxi cab in New York is aseparate firm. This effect has beenfound to be important in explaining the time variation of size of firms in the United States(Ringleb and Wiggins (1990)).
40f course, in the limit if there is perfect enforceability, complete contracts can be written, and there is nodistinction between firm and market. In practice, however, we are probably quite far from thisutopia.
7

High corporate taxes could also drive many economic activities into the informal sector, and
reduce the incentive to create large firms. Some have argued that this is why Italy has so many
small firms (a "fact" we will check).5 Of course, one could also argue that large firms can afford
the staff to indulge in creative tax accounting, thus giving them a comparative advantage in a
high tax environment. This is why the effect of taxes on firm size is potentially ambiguous.
Also some aspects of the extensive literature on industry market structure (see Caves (1998)
and Sutton (1991, 1997) for excellent surveys) falls under the rubric of regulatory theories.
Anti-trust laws could limit the size of firms. Conversely, by restricting entry and conferring
monopolies, other regulation could increase the average size of firms. For example, in most
European countries, railways are Government owned and are huge, with size only limited by
the market.
More generally, barriers to entry could be important in determining average firm size. Hopen-
hayn (1992) develops a dynamic model of firm size based on entry costs and firm-level produc-
tivity shocks. He identifies two conflicting effects. Output price increases with entry cost leading
to higher employment, but the threshold productivity level at which firms exit decreases, which
increases the fraction of firms with lower employment. Whether increased barriers to entry
increases or decreases average firm size is therefore an empirical question.
1.4 Financial theories
A potential obstacle to firm growth is also the availability of external funds. If this is an
important issue, firm size should be positively correlated with financial development and, more
generally, with factors promoting the development of financial markets. La Porta et al. (1997a)
find that a country with a Common Law judicial system, and having strict enforcement of the
law, has a more developed financial system. This would suggest that there is an additional,
indirect, channel through which sound laws and judicial efficiency affect firm size - throughtheir effect on financial market development.
Rajart and Zingales (1998a), however, find that financial market development affects both
the growth in the average size of existing establishments and the growth in the number ofnew establishments in industries dependent on external finance (though disproportionately the
former). Thus, the theoretical effect of the development of financial markets on the average size
of firms is ambiguous. One the one hand, more firms will be born, reducing the average size of
5For example, Pagano, Panetta, and Zingales (1998) argue that this is a reason why so few Italian firms gopublic. By limiting the access to the public equity market, this effect may also limit the size of firms.
8
firms. On the other hand, existing firms will be able togrow faster, increasing the average sizeof firms. Whether the average size of firms in industries that rely on external finance is larger.thus, is ultimately an empirical question, which we will try to resolve.
We have attempted in the preceding paragraphs to describe some important technical, legal,and institutional influences on firm size. Most of these effects are country specific. Given thelarge number of possible effects and the limited number of countries we have datafor, we willnot attempt to capture them all, but we will typically control for them by inserting countryfixed effects.
1.5 Existing Empirical Literature
Much of the evidence we already have comes indirectly from the vast literature on marketstructure. One focus of this literature has been on the distribution of firms and their growthrates in various industries in a country over time. Papers have tried to find evidence for theLaw of Proportional Effects or Gibrat's law, which states that the rate ofgrowth of a firm isindependent of size (in general, the evidence is not consistent with it).
There have also been studies on the cross-sectional determinants of firm size (see Mata(1996), for example) but, more typically, studies have been within industry rather than acrossindustries (Caves and Pugel (1980), for example) or have examined entry and exit (Audretschand Mahmood (1995), for example). More important, there have been few cross-country studiesfocusing on the effects of institutional differences on firm size. The two most relatedpapers hereare Davis and Henrekson (1997) and La Porta et al. (1997b).
Davis and Henrekson study whether the institutional structure in Sweden forces a tilt (rela-tive to the U.S.) towards industries that are dominated by large firms. They find this to be true.Their interest, however, is in the relative distribution of employment across sectors, not in thedeterminants of firm size per Se. In fact, the US establishment coworker mean (number of em-
ployees at the average worker's place of employment) is over twice the corresponding Swedishvalue, even though US employment is more heavily concentrated in industries dominated bysmaller production units.
La Porta et al. (1997b) examine whether an indicator of the level of trust prevailing in a
country affects the share of GDP represented by large organizations (defined as the 20 largest
publicly traded corporations by sales). They find a positive correlation. Their focus, however,is on the relative importance of large organizations, while our focus is on the determinants ofthe absolute size of organizations.
9
2 The Data
In 1988, Directorate-General XXIII of the European Commission and Eurostat launched a
project to improve the collection and compilation of statistics on small and medium enterprises.
This project led to the publication of Enterprises in Europe by the European Commissionin 1994. This data set contains statistics on enterprises, employment, and production for all
economic sectors (except agriculture) in the European Union (EU) and the European Free Trade
Agreement (EFTA) countries.One of the explicit purposes of this effort was to assemble "comparable and reliable statistics
which make it possible to identify the relative importance of different categories of enterprises."
(Enterprises in Europe, Third Report, v.1, p. xxii). In spite of the effort to homogenize thestatistical criteria Eurostat warns that several methodological differences in the classification and
coverage of units remain. Thus, the cross-country analysis should be interpreted with caution,
while the cross-sector analysis or interactions, which control for country fixed-effects, are less
sensitive to this problem. With all its limitations this is the first source we know of that provides
comparable data on firm size across countries.
2.1 The Theoretical Unit of Interest and the Empirical Unit.
A problem in studying firm size is that the theories have different approaches to defining the
firm, and this may be at variance with the available data. As we have seen, technological
theories (e.g., Lucas (1978)) focus on the allocation of productive inputs such as physical capital.
managerial talent, and human capital, across various activities and the effect this has on the
size of the production process. They do not focus on the specifics of how hierarchical control
is exerted. These theories would not, for example, make much of a distinction between Toyota
and its supplier network, and General Motors (a much more vertically integrated firm) and its
supplier network, since both feed into broadly similar production processes. More generally.
since technological theories are primarily concerned with the nature of a firm's activity as
captured by variants of the neoclassical production function, in the words of Lucas (1978),
"what we may hope for is not serious organization theory, but perhaps some insights into why
organization theory matters economically."
Organizational theories (e.g., Aichian and Demsetz (1972), Fama and Jensen (1983), Williamson
(1985), and Grossman and Hart (1986)), on the other hand, focus on how hierarchical control
is exerted. The production function plays, at best, a secondary role in these theories. For ex-
ample, the Property Rights view asserts that control exerted through an arm's length contract
10

(General Motors over its suppliers) is not the same thing as control exerted through ownership(General Motors over its divisions). According to this view, the economic definition of a firmcorresponds to the legal view - a firm is a set of commonly owned assets. More recent devel-
opments (see Rajan and Zingales (1998b,c), for example) go further and suggest that if theeconomic distinction between transactions that are firm-like and market-like turns on whetherhierarchical, non-contractual, control is exerted, common ownership is neither necessary norsufficient to define the economic limits of a firm. Toyota may exert much more control over itssuppliers who are tied to it by a long history of specific investment than General Motors, whichputs supply contracts up for widespread competitive bidding. In other words, Toyota and its
suppliers, although distinct legal entities, could be thought of as a firm in the economic sense.while General Motors and its suppliers are distinct economic and legal entities. In short, withnotable exceptions, the firm described by the theories does not correspond to the legal entity.
The data that are available, however, are for the legal entity. The unit ofanalysis is theenterprise, defined as "the smallest combination of legal units that is an organizational unitproducing goods or services, which benefits from a certain degree of autonomy in decision-making, especially for the allocation of its current resources. An enterprise carries out one ormore activity at one or more location" (Enterprises in Europe, Third Report, v.11,p. 5).
The starting point of the definition, thus, is the legal entity. The emphasis on the "small-est combination of legal units" is important. Conversations with Eurostat managers indicatesthat subsidiaries of conglomerates are treated as firms in their own right, as are subsidiariesof multinationals.6 Some subjectivity, however, is introduced because Eurostat looks also forautonomy in decision making in drawing the boundary of the enterprise. To this extent, theenterprise corresponds to the economic entity discussed above — the economic realm over whichcentralized control is exercised.
The definition used for the enterprise is, therefore, a combination of the "legal" and whatwe call the "economic" firm. To make some headway, we have to assume that it is also a goodproxy for the length of the production process. All we really need is the plausible assumption
that factors that permit a longer chain of production should also increase the average size ofthe autonomous legal entity called the firm.
6Foreign subsidiaries of a multinational with headquarters in a particular country do not, therefore, add tothe enterprise's size in the country of the parent.
11

2.2 What Do We Mean by Average Size?
Enterprises in Europe provides us with the size distribution of firms (number of employees) in
each NACE two-digit industry (we use "industry" interchangeably with "sector") in Europeancountries belonging to the EU and the EFTA.7 We exclude from the analysis Iceland, Luxem-
bourg, and Liechtenstein because of their extremely small size. We also drop Ireland, because
data are not consistently reported. This leaves us with 15 countries. For all these countries.
data are available for either 1991 or 1992. Further details on the data are presented in the data
appendix.
An immediate question is whether we should measure the size of a firm in terms of its output,
its value added, or the number of its employees. Value added is clearly preferable to output,
because the complexity of the organization has to do with the value of its contribution not with
the value of the output sold. Enterprises in Europe reports that value added per employee is
fairly stable across different size-classes. Thus, a measure of firm size based on the number of
employees is likely to be very similar to a measure based on value-added. Yet, coordination
costs, which are present both in the technological and the organizational theories of the firms,
are in terms of number of employees, not their productivity. Thus, a measure based on thenumber of employees is preferable.
We have data on how many firms and employees belong to each firm size bin (e.g.. there are
30,065 employees and 109 firms in the bin containing 200-499 employees in NACE 16 (Electricity)
in Germany).8 There are a number of ways of summarizing the data. Which measure is more
appropriate depends on the purpose.The next question, therefore, has to do with what we are trying to measure. The theories
we have described suggest the determinants of the optimal scale of firms. Yet all the firms in
an industry are not likely to be at that scale. Furthermore, there is entry and exit, firms grow
substantially when young, and there is inter-industry variation in these rates of growth (see
Caves (1998) and Pakes and Ericson (forthcoming)). We have a cross-section, and do not know
how many firms enter or exit from the industry in a typical year. Despite this problem, since we
have countries at relatively similar stages of development, industries should be at similar stages
of the product life cycle across countries (see Klepper (1996) for a formalization of the effects
of the PLC). Hence, the cross-country and interaction effects should indeed re1ect the effects of
7NACE is the general industrial classification of economic activities within the EU. Two-digit NACE industryroughly corresponds to two-digit SIC sectors.
8We use "bin" and "size class" interchangeably.
12
institutional differences on average size. More important, Sutton (1997, p52) argues that mostentry and exit has relatively little effect on the largest firms in the industry (which are likely to
have achieved the optimal scale). Therefore, while we cannot resolve this problem completely,we can minimize its effects by choosing the appropriate measure of firm size.
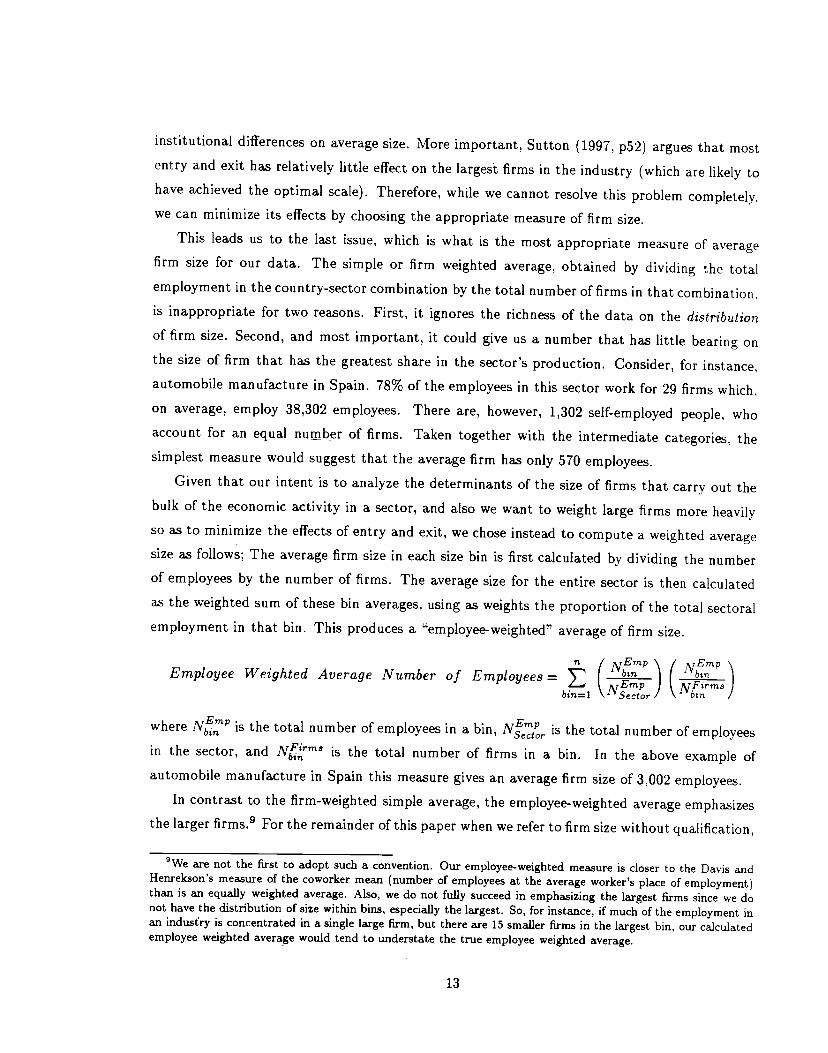
This leads us to the last issue, which is what is the most appropriate measure of averagefirm size for our data. The simple or firm weighted average, obtained by dividing the totalemployment in the country-sector combination by the total number of firms in that combination,
is inappropriate for two reasons. First, it ignores the richness of the dataon the distributionof firm size. Second, and most important, it could give us a number that has little bearing onthe size of firm that has the greatest share in the sector's production. Consider, for instance,automobile manufacture in Spain. 78% of the employees in this sector work for 29 firmswhich,
on average, employ 38,302 employees. There are, however, 1,302 self-employed people, who
account for an equal number of firms. Taken together with the intermediate categories, the
simplest measure would suggest that the average firm has only 570 employees.
Given that our intent is to analyze the determinants of the size of firms that carry out thebulk of the economic activity in a sector, and also we want to weight large firms more heavilyso as to minimize the effects of entry and exit, we chose instead to compute a weighted averagesize as follows; The average firm size in each size bin is first calculated by dividing thenumberof employees by the number of firms. The average size for the entire sector is then calculated
as the weighted sum of these bin averages, using as weights the proportion of the total sectoral
employment in that bin. This produces a "employee-weighted" average of firm size.
n / / NEmPEmployee Weighted Average Number of Employees =
)bin=1 Sector
where NmP is the total number of employees in a bin, N:r is the total number ofemployeesin the sector, and N(trms is the total number of firms in a bin. In the above example ofautomobile manufacture in Spain this measure gives an average firm size of 3,002employees.
In contrast to the firm-weighted simple average, the employee-weighted average emphasizesthe larger firms.9 For the remainder of this paper when we refer to firm size withoutqualification,
°We are not the first to adopt such a convention. Our employee-weighted measure is closer to the DavisandHenrekson's measure of the coworker mean (number of employees at the average worker's place of employment)than is an equally weighted average. Also, we do not fully succeed in emphasizing the largest firms since we donot have the distribution of size within bins, especially the largest. So, for instance, if much of the employment inan industry is concentrated in a single large firm, but there are 15 smaller firms in the largest bin, our calculatedemployee weighted average would tend to understate the true employee weighted average.
13
we mean the employee-weighted average (or the log of the employee-weighted average in the
regressions).
2.3 Cross-Industry Patterns in Firm Size
Table 1 presents the summary statistics on different measures of size by industry. For now, focus
on employee size measured by the number of employees (the first five columns of Table 1). There
are 55 sectors on which we have data, though from the last column indicating the frequency
of countries reporting, we can see that coverage across countries is not uniform: thecoverageis broadest for "Food and Tobacco" (NACE 41) and most sparse for "Public Administration"
(NACE 91). In this table, each measure of size is obtained by averaging the measure for thatsector across all countries reporting that sector.
Note first that the simple average and the employee weighted average can present a very
different picture. For example, "Air Transport" has the third largest firms by the latter measure
with an average of 6335 employees, but has only the twelfth largest firms with an average of135 employees by the former measure. This is because most employees belong to a few large
airlines (hence the higher employee weighted average), but there are also many tiny firms in
the air transport industry providing ancillary services (hence the low simple average). In whatfollows, we focus on employee weighted measures.
The largest sectors, by far, are "Communication", "Railways", "Air transport", and "Elec-tricity". The sizes of the largest firms in these sectors are also significantly higher than those for
the other sectors. Given the typically high degree of Government ownership and intervention
in these sectors, we collectively label them "Utilities" (although they do not correspond exactly
to the definition of utilities in the U.S.) and present country level statistics with and withoutthem in Table 2.
The smallest sectors are "Letting of real estate", "Scrap and waste", "Personal services",
"Repair of consumer goods", and "Renting, leasing". While one might be tempted to conclude
that firms in the service sector are small, this would be incorrect. Firms in financial services
like Banking or Insurance are about the same size as firms in Motor Vehicles, the non-utility
manufacturing sector with the largest firms.
The sixth column of Table 1 presents the mean of residuals across countries from the regres-sion:
log (Employee weighted average size,3) = cons + c . d+
where, d is a vector of cointry dummies. The aim is to study the employee weighted average
14

size when the country effects are purged. A comparison of the ranking of sectors purged ofcountry effects with the ranking of the sectors based on the original average gives us an idea of
the importance of country effects. Spearman's rank correlation coefficient between the averagewith and without country effect is 0.86 when all sectors are included, and 0.95 when the utilitysectors are dropped. The ranking of the largest 4 sectors (which include the utility sectors) ispreserved across both means. These coefficients seem to indicate that while there may well becountry effects, they are likely to be overshadowed by sectoral effects.
Indeed, a two-way analysis of variance of the employee weighted average size on country andsector shows that close to 63% of the total variation in size comes from sectoral effects whileabout 2.5% comes from country effects. The corresponding numbers when thesimple averageis used are 26% and 1.4%.
The simple average (or, equivalently, the firm weighted average) is less than the employeeweighted median for nearly all sectors, suggesting that employees typically belong to larger firmsin a sector — a right-skewness in the distributions of average size across countries.
In Table 1 B, we present the dispersion in firm size in the various sectors. The formulasused in computing this and other statistics are given in the appendix. The weighted coefficientof variation of firm size within a sector (the employee weighted standard deviation across binsdivided by the employee weighted mean averaged for that sectoracross countries) is likely to besmall if the industry is concentrated (so that most of the employment is in a few large firms)or if there is a well-defined optimal scale of operations (so that most firms cluster around that
scale). It is highest for the service industries such as "Personal Services", "Agents", "Hotels
and Catering", "Repair of Consumer Goods" while it is lowest for "Extraction of Solid Fuels",
"Communications", and "Nuclear Fuels". Capital intensive industries seem to be lessdispersed,though it is hard to tell which of the above forces is responsible.'°
Finally, the employee weighted skewness is typically negative (39 of 55 sectors negative)suggesting that even though the mass of employees is concentrated in larger firms, there areenough employees in small firms to bring the weighted mean down. The industries where
weighted skewness is positive are ones such as "Agents" where most employees are intiny firms(most employees are in the bin with firms of average size 2) but there are enough employees inlarge firms to take the employee weighted average up to 107.
'°Yet another possibility is that service industries are less precisely defined - "Agents" could encompass a widevariety of activities. However, "Hotels and Catering" is quite precise, and this sector also hasa high coefficientof variation.
15

2.4 Cross-Country Patterns in Firm Size
In Table 2, we present summary statistics on average size by country. Table 2A presents data
for all the sectors, while Table 2B for different subsamples. The broadest coverage is for Italy
and the sparsest coverage for Austria and Denmark. In this table, the "mean" for a country is
the mean across sectors of the average firm size.
Greece, Portugal, and Austria have firms with the smallest employee weighted average size.
though correcting for industry effects (column six), Norway's firms are also relatively small.
The UK and Italy have firms with the highest average size, in fact, substantially higher than
the remaining countries. Since Italy is reputed to have many small firms, it might come as a
surprise that it has the second highest average size. As we will see, this is partly because of the
composition of industries in Italy.
When we look at the total number of firms in the country, Italy has by far the most firms.
One must be careful, though, because the number of sectors reported differ by country. This
might explain the relatively low number of firms in Austria and Denmark (beyond the size of
the country). The anomalous observation is Greece, which reports a sizeable number of sectors,
but appears to have very few firms. The reason is that only enterprises with more than 10
employees are reported in Greece. While this biases the average size upwards, our employee-
weighted average minimizes the effect. Nevertheless, we will check that none of our resultsdepend on this.
The last column presents the mean of residuals across countries from the regression:
log (Employee weighted average size,3) = COflS + /3 . d3 + Ec,s
where, d3 is a vector of sector dummies. The aim is to study the employee weighted size in
a country when the sector effects are purged. Spearman's rank correlation coefficient between
the means with and without sector effects is 0.45, significantly lower than the figures presented
above for the sector tables. The ranking is preserved only for UK. Interestingly, Finland which
is ranked sixth in average size falls only marginally to seventh after purging industry effects.
Thus Finland's large firms are not simply because of industry effects.
As mentioned earlier, the utilities sectors need to be treated differently. The first column in
Table 2B presents the mean for the country distributions when the utilities sectors are excluded.
The mean drops for several countries, with the drop for Italy being the most dramatic (2244
to 545). Spearman's rank correlation coefficient between the means with and without utilities
16

is 0.78. UK, Germany, and France now have the highest averages, while Greece. Portugal. andAustria continue to have the smallest averages (they do not have coverage for utilities in thefirst place and are therefore unaffected by the exclusion).
Since manufacturing excludes utilities, the means for manufacturing sectors alone are verysimilar to those when utilities are excluded. In fact, the Spearman coefficient between themeanswithout utilities and for manufacturing alone is 0.89.
It is hard to discern any obvious patterns in Table 2B. A rich country like Switzerland hasfirms of very small average size, while small countries like Denmark have large firms. Remark-
ably, UK has the largest firms according to almost any classification considered. While wecannot rule out differences in the definition of firms in the United Kingdom, no other countrypreserves its rank so consistently.
Finally, Table 2C indicates that Italy, Spain and Portugal have the highest employee weighted
coefficient of variation for firm size. Austria, Belgium, and the United Kingdom have relativelylow dispersion of firm size.
2.5 Other Summary Statistics
We present in Table 3 the summary statistics of the explanatory variables used in the subsequentanalysis as well as their cross-correlations. The definitions of all these variables is contained inthe Data Appendix.
Two facts are worth pointing out. First, in spite of the homogeneity of the sample (all thecountries are European and would be classified as developed), there is some variation in most of
the explanatory variables. For example, per capita income varies between $6,783 (Greece) and$16,245 (Switzerland) and the measure for human capital varies between 3.827years (Portugal)and 10.382 (Norway).
The second fact is that some of these measures are highly correlated. For example, judicialefficiency has a correlation of 0.9 with human capital. This can make it difficult to separate theeffect of the two.
3 Cross-Industry Correlations
We start our analysis by examining the correlation between industry-level factors and firm size.
17

3.1 Predictions and Proxies
As a proxy for the size of the actual market we use the log of total employment in the industry
in that country." There are two problems with this measure. First, theories (e.g., Smith
(1776)) obviously refer to the potential market. Second, and following from the first, there
may be spurious correlation between average firm size and our measure of the market size. For
example, in the case of monopolies, there will be a one-to-one correspondence between average
firm size and our proxy for the size of the market. To correct for this, we instrument our measure
of market size with the logarithm of GDP and country population. These country level variables
should be uncorrelated with industry level constraints, but should be correlated with the size
of the potential market, hence they should be good instruments.
While we do not have a direct measure of capital stock in an industry to enable us to
calculate physical capital intensity, we have the gross investment in an industry. Dividing this
by the number of workers in that industry, we have investment per worker. In order to obtain
a more exogenous measure, we take the mean of this variable across all the countries for which
we have this data.'2
The expenditure on Research and Development is not available for the European countries
in our sample; but from Compustat, we obtain the median R&D to sales ratio for U.S. firms
in each industry over the 1980s, and use it as a proxy for R&D investment made by European
firms in the same industry. We calculate wages per worker in the same way as investment perworker above.
Finally, Rajan and Zingales (1998a) compute an industry's dependence on external funds as
the fraction of capital expenditure in that industry in the United States funded from external
sources. We use the Rajan and Zingales measure of external dependence and weight it by the
investment per worker in an industry to get the amount per worker that has to be raised fromexternal sources.
The maintained assumption in using these proxies is that there are technological character-
istics of certain industries that should carry over countries. Of course, since we are primarily
interested in the sign of coefficients, what we really require is that the relative relationship
between industries carry over rather than the precise levels. In other words, if Drugs and Phar-
maceuticals is more research intensive in the United States than Leather goods, it will continue
"Whenever we require the logarithm of a variable, we always add one before taking logs.'2This includes the United States. As we will see, dropping the United States in the calculation does not change
the results qualitatively. Neither does taking medians. All industry variables are winsorized at the 5%and 95%levels to reduce the effects of outliers.
18

to be so in Italy. This is also the maintained assumption in Rajan and Zingales (1998a). While
this assumption allows us to use independent variables that are likely to be truly exogenous.and also overcome the paucity of data, a failure of this assumption means, of course, that someof our independent variables are noise and should have little explanatory power.
3.2 Results
We report in Table 4 the estimates for a regression of log firm size on characteristics of the
industry. In the first column we report the estimates from a regression of log employee weighted
average size on industry characteristics where the size of the market (measured as total sec-
toral employment) is instrumented. Robust standard errors are reported and they correct for
clustering of the residuals at the industry level. The effect of market size is positive and highly
statistically significant (henceforth, "significant" will denote significance at the 10% level or
better). An increase in log employment in the industry from the twenty fifth percentile to the
seventy fifth percentile increases log size by about 27% of the inter-quartile range. Thus the
size of the market does matter, perhaps because it affects the extent of possible specialization.
We also include investment per worker, R&D to sales, wages per worker, and amount financed
externally per worker. The first three explanatory variables are positively correlated with size,
while the amount financed externally is negatively correlated. While we expected investment,
wages, and R&D expenditure to be positively correlated, we had no strong prior on the sign ofthe correlation between the amount financed externally and size.
The magnitudes of the effects are also considerable. According to the estimates in column
I, an increase in investment per worker, R&D to sales, wage per worker, and amount financed
externally from the 25th percentile to the 75th percentile of the variable changes log firm size
by 14%, 13%, 37%, and -29% of its inter-quartile range respectively. The explanatorypower ofthe regression is also considerable (R2 = 0.32).
What do we make of all this? If industries are located in specific areas and there is a high
cost to labor mobility, or if agents have industry specific human capital, then Lucas' model
could be applied industry by industry in a country. The positive partial correlation betweeninvestment per worker and size is consistent with Lucas (1978). It is also consistent with Critical
Resource theories of the firm where a firm of larger size is easier to control when the critical
resource is physical capital. Finally, the correlation may reflect a larger minimum economic
scale for physical capital intensive industries (though we have no theoretical argument for such
19

a conjecture).13
From the perspective of extant technological theories, one would expect investment in R&D
and investment in physical capital to be correlated. Thus we should expect a positive correlation
between size and R&D expenditure. Similarly, from the perspective of Critical Resource theories.
if the critical resource is intellectual property and it is protected to some extent by patent laws.
we should expect such a correlation.14
The positive correlation between wages per worker and size is consistent with the thrust
of Lucas's (1978) notion that the incentive to become an entrepreneur is relatively small when
wages are high. It is also consistent with Kremer's (1993) view that if wages are a proxy for the
quality of a worker, higher wages should be associated with larger firms.
Finally, the negative correlation between the amount financed externally and size suggests
the adverse effects on average size of financial constraints on the growth of existing firms dom-
inate the positive effects on average size of reduced entry by new firms in financially dependent
industries (though, of course, the way we measure size is biased towards minimizing the latter
effect).
The pattern of correlations with size allow us to draw only tentative conclusions about
the effect of entry barriers on firm size. The necessity of large per capita expenditures on
investment and R&D in an industry, which are reasonable proxies for technological barriers to
entry, increase average firm size. One would have expected the cost of externally funding these
investments to also be one of the proxies for barriers to entry. However, the result discussed in
the previous paragraph highlights the weakness of this variable as a proxy —even established
firms are adversely affected by the need for external financing. Thus, based on the quantity of
investment alone we have to conclude that barriers to entry have a positive effect on firm size.
In summary, the partial correlations are consistent with multiple theories. Nevertheless, the
correlations are useful in that they provide a minimum set of patterns that theories should fit.
3.3 Robustness
Before we turn to cross-country correlations, we check the robustness of our findings. We re-
estimate the regression in Table 4 (column I) dropping one variable at a time so as to check that
'3We are not the first to find such a relationship. For example, Caves and Pugel (1980) find that size iscorrelated with capital intensity within industry.
'4The relationship between firm size and total firm R&D investment within an industry is well known (see Cohenand Kiepper (1996) for references). However, our finding is across industries and countries, More important, thecorrelation we find is between the intensity of R&D (i.e., per unit) and size, while it has generally been found(Kiepper (1996), p577) that R&D does not rise more than proportionally with firm size within industry.
20

the specification is robust. The variables never change sign (estimates available from authors)
though the high correlation of capital intensity with amount financed externally and wages per
worker make the magnitude of its coefficient volatile. The next step is to check that the observed
correlations are robust to the introduction of country effects. If they are not, one would suspect
that the estimated effects do not relate as much to the nature of the technology used in an
industry as to the institutional environment in a particular country. So in Table 4 (II), we
introduce country indicators (coefficients of indicators not reported) in the estimated model.
The one problem with introducing country indicators is that we cannot instrument market size
with country level variables such as log GDP because the instruments will become perfectly
collinear with the country indicators. That we do not instrument perhaps explains why the
coefficient estimate for market size in Table 4 (II) is more than twice what it is in Table 4 (I),
even though all other coefficient estimates are much closer in magnitude to their corresponding
values.
Recall that we computed investment per worker and wage per worker by taking means for the
industry across a number of countries including the United States. If we drop the United States,
we lose a number of industries for which we have per-worker data only from the United States.
Therefore, the number of observations in Table 4 (III) is smaller. The coefficient estimates
remain qualitatively similar even with the changed explanatory variable and the lower number
of observations. However, both the coefficient estimate for capital intensity and R&D intensity
are measured much more imprecisely, and they become statistically insignificant. The coefficient
of wage per worker is borderline statistically significant.'5
In summary, the results seems fairly robust. Signs are stable. Using different methods to
calculate the explanatory variables, different dependent variables, or different sub-samples, doesnot alter the results significantly.
4 Cross-country correlations
Let us now examine the partial correlations of country level variables with firm size.
'5We can also compute the median investment and wage per worker for an industry across countries (insteadof the mean). We find that the coefficient estimates are all significant and have the same sign as before.
21

4.1 Proxies
We include the log of per capita income as a measure of a country's wealth, and human capital,
measured as the average years of schooling in the population over age 25 in the year 1985. The
latter comes from the Barro-Lee database. Our measure of judicial efficiency, is an assessment
by Business International Corporation of the "efficiency and integrity of the legal environment
as it affects business" for each country, coded on a scale of zero to ten.
4.2 Results
In Table 5, we present estimates of the effect of cross-country variables. In all the estimations
we include industry fixed effects and the size of the market, which is instrumented by the log
of GDP.16 The standard errors are not only robust to heteroskedasticity but also corrected for
potential clustering at the country level.
We start by examining the effect of log per capita income in column I. Per capita GDP
has a positive and significant correlation with firm size. As we shall soon see, when we include
measures of institutional development, the coefficient turns negative and significant.
In Table 5 (column II), we include human capital. Human capital has a positive and sig-
nificant coefficient, consistent with the theories proposed by Rosen (1982), Becker and Murphy
(1992), and Kremer (1993). Interestingly, the sign on log per capita income becomes negative,
though it is statistically insignificant.
Next we include the efficiency of the judicial system (column III). The coefficient estimate
is positive and highly significant. An increase in judicial efficiency from the 25th percentile to
the 75th percentile changes log firm size by 52% of its inter-quartile range. The large positive
correlation is consistent with Critical Resource theories, legal and financial theories, and co-
ordination cost theories of the firm: An efficient legal system eases management's ability to use
critical resources other than physical assets as sources of power, which leads to the establishment
of firms of larger size (see Rajan and Zingales (1998c)). It also protects outside investors better
and allows larger firms to be financed (see La Porta et al. (1997a,1998)). Finally, an efficient
legal system reduces co-ordination costs and allows larger organizations (Becker and Murphy
(1992)).
Note that the coefficient on log of per capita income is now negative and significant at the
5% level. Therefore the "stylized fact" that richer countries have larger firms seems true only
'60f the two instruments used earlier, log GDP and log population, we can use only one otherwise they wouldbe perfectly collinear with per capita GDP.
22

when we examine the obvious difference between the size of firms in really poor countries wherethere is little industry to speak of, and those in the rich developed countries, and when we donot correct for differences in institutions.17 Within the set of industrialized countries, however,
there seems to be little evidence of a significant positive partial correlation between per capitaGDP and size.18
Recall that the size of firms in Greece is possibly biased upwards. Unlike in Table 4, we
cannot include country indicators in these regressions. Therefore, it is important to check thatour results are robust to excluding Greece. In fact, they are stronger.
We also inserted (not reported) a number of other variables to our basic specification inColumn III, one at a time. We include Ginarte and Park (1997)'s index of the protectiongiven to patent rights in different countries, the statutory corporate tax rate in the countryin 1991, and the quality of accounting standards which Rajan and Zingales (1998a) argue is agood proxy for the extent of financial sector development in a country. We also include proxies
for regulatory constraints and a measure of product liability. It turns out that none of these
variables remains significant when judicial efficiency is included (though accounting standards
comes in positive and significant when on its own, or included with the specification in Column
II), while judicial efficiency always remains positive and highly statistically significant and log
per capita income negative and significant. To some extent, the problem is that some of these
variables are strongly correlated. For example, judicial efficiency has a correlation of 0.90 with
our measure of human capital, 0.65 with accounting standards, and -0.40 with the corporate taxrate. This is a traditional problem with cross-country regressions - all measures of institutional
and human capital development are typically highly correlated, so it is hard to tell their effects
apart. Nevertheless, it is interesting that judicial efficiency seems to dominate the effects ofother variables.
This cross-country analysis should be interpreted with caution because it is most sensitive
to differences in the definition of enterprise across countries. Nevertheless, two results seem
to emerge. First, the correlation between per-capita income and firm size is not as clear as
previously thought and may, in fact, be a proxy for institutional development. Second, judicial
Gollin (1998) for an example of a study that focuses on economic development and firm formation.'8One could argue that our dependent variable is a proxy for labor intensity, and high per capita income
countries could be substituting cheap capital for labor. This would yield a negative correlation between size andper capita income. To check that this is not driving our result, we would need data on sales. Unfortunately, dataon sales present in Enterprsses in Europe are sporadic. Nevertheless, we experimented with the limited sampleavailable. Even with sales weighted average sales as dependent variable, the coeflicient estimate for per capitaincome is never significantly positive.
23
efficiency seems to have the most clear cut correlation with firm size.
5 Interactions
Not only could cross-country regressions be biased by differences in the definition of the en-
terprise, but also we have very few degrees of freedom. Hence, it is hard to estimate anything
with accuracy, and know whether something is really a proxy for what it purports to be. Rajan
and Zingales (1998a) suggest one way to reduce both these problems: they test predictions that
rely on an interaction between country and industry characteristics, after controlling for both
country and industry effects. By doing so, not only do we use more of the information in the
data, but also we test a more detailed implication of the theory, which helps distinguish theories
that have the same prediction for direct or level effects. Organizational theories which model
the micro mechanisms in greater detail are more amenable to such tests.
5.1 Theoretical Predictions
As we have seen, greater judicial efficiency leads to bigger firms. According to Critical Resource
theories this effect is due to the strengthening of control rights. In all the countries in our
sample, basic property rights over physical assets are protected, and guarantee owners a certain
degree of power. However, the increased protection afforded to intellectual property, manage-
ment techniques, firm-client relationships, etc., by a more efficient judicial system should allow
more resources (even inalienable ones) to come into their own as sources of power. Therefore, we
should expect judicial efficiency to particularly enhance management's control rights for firms
with relatively few physical assets resulting in larger firms in such industries. This will imply
the interaction between judicial efficiency and investment per worker should be negatively cor-
related with size. Note that this is not a direct implication of theories like Lucas (1978), which
emphasize the rents created for workers by physical capital but not its control properties, or
Becker and Murphy (1992) who refer to the co-ordination benefits of a better judicial system
without emphasizing specific channels through which it works.
We have seen empirically that the average size of firms is negatively correlated with their need
for external finance. This suggests imperfect financial markets constrain size. The development
of financial markets should alleviate such a con'straint. Therefore, we should expect industries
that have to finance more externally will be larger in countries with better developed financial
markets - a positive, coefficient for the interaction term. Moreover, La Porta et al. (1997a, 1998)
24

suggest that the efficiency of the legal system should affect the financial system. The inclusion of
both the interaction between judicial efficiency and capital intensity, and accounting standardsand external dependence allows us to distinguish the direct effects of judicial efficiency on firmsize (as in the Critical Resource theory) and its indirect effect through financial development
(as in legal and financial theories).
5.2 Results
One of the advantages of looking at interaction effects is that we can include both country andindustry indicators to absorb all the direct effects. Thus we do not need to worry about which
country or industry variables to include. The problem, however, is that we cannot instrument
the size of the market because the instruments are collinear with the country indicators. We
will check that this does not drive the results.
In Table 6, we report estimates for the interaction variables included individually (along
with market size, country indicators, and industry indicators). Capital intensive industrieshave smaller firms in countries with better judicial systems. An increase in judicial efficiency
from its 25th percentile to its 75th percentile causes the difference in log average size between
firms in industries at the 75th percentile of capital intensity and firms in industries at the 25th
percentile of capital intensity to diminish by approximately 12% of the inter quartile range of
size. Put differently, as the legal system improves, the evidence indicates that the difference insize between automobile manufacturers and consulting firms should decrease.
Firms in financially dependent industries are relatively larger when financial markets are
more developed. The estimates in column II suggest that an increase in a country's financial
development from the 25th percentile to the 75th percentile results in the difference in log average
size between firms in industries at the 75th percentile amount-financed-externally and firms in
industries at the 25th percentile of amount-financed-externally to increase by approximately 9%of the inter quartile range of size.
We also include both interaction variables simultaneously. The coefficients on both terms
increase suggesting that each effect is somewhat obscured when only one term is included.
Finally, recall that with country indicators, we cannot instrument market size. To check that
this does not drive the results, we drop the country indicators, include country level explanatory
variables in column IV, and instrument market size. The interactions that were significant in
column III continue to be significant, and their magnitudes are qualitatively similar.19
'9We also estimate the coeffidents when investment per worker is calculated only using European data (not
25

To summarize, the negative correlation between the judicial efficiency/capital intensity in-
teraction and firm size can be explained by the Critical Resource theories of the firm. We also
find evidence that financial development helps firms become larger, in part because it alleviates
constraints on firms dependent on external finance.
The importance of the interaction effects lies in giving us greater assurance that the main
effects (such as the effect of capital intensity or judicial efficiency on firm size) are correlated,
at least in part, for the particular theoretical reasons we attribute to them. Perhaps a greater
reason to focus on interaction effects is their value, in distinguishing otherwise hard-to-disentangle
level effects. Specifically, in the cross-country regressions, judicial efficiency swamped the effects
of accounting standards on size. This is a common feature of cross-country regressions where
most indicators of development are highly correlated with each other. By interacting judicial
efficiency with capital intensity, and accounting standards with financial dependence, not onlyare we able to use the country-sector data to provide information, but also we distinguish the
effects of judicial efficiency from accounting standards better.
5.3 Why Does a Better Judicial System Reduce the Impact of Capital In-tensity on Size?
But we can go still further in evaluating the detailed implications of the Critical Resource
theory. We cannot, as yet, tell whether the interaction effect between judicial efficiency and
capital intensity comes from capital intensive firms becoming smaller, or firms with relatively
few physical assets becoming larger, as judicial efficiency improves. The distinction is important
because it enables us to tell apart some nuances in Critical Resource Theory. We have argued
that improved judicial efficiency will enable management to gain control from legal devices
other than ownership rights over physical assets. This suggests that the effect should largely
come from the increase in size of firms in industries that are not physical capital intensive.
There is, however, another explanation. If the residual rights coming from property rights to
physical assets are what distinguish firms from markets, then as judicial efficiency improves,
contractability improves, and the residual rights associated with physical assets become less
important. Also, physical assets become easier to finance for departing employees, therefore
becoming less unique and well protected, and again residual control rights associated with them
diminish. This implies that capital intensive firms should become smaller with improvements
reported). The interaction coefficients retain their significance and sign even though we lose a number of industriesThe results are qualitatively similar when we use medians to aggregate the per worker industry characteristicsacross countries rather than means.
26
in judicial efficiency, which could also explain the result.
To test this, we replace the interaction variable with judicial efficiency multiplied by indi-
cators if an industry is in the highest or lowest tertile of physical capital intensity in Table 6B.
The coefficient on the interaction between judicial efficiency and the highest tertile indicator is
negative but not significant. Most of the action comes from the lowest tertile indicator which
is positive and significant. This suggests that the effects of improvements in judicial efficiency
come primarily from the growth in the size of firms that are not physical capital intensive.
However, one last check is warranted. Since judicial efficiency is correlated with per capita
income, perhaps what we are measuring is the growth in the tertiary sector as per capita incomes
improve. Of course, there is no obvious reason why the growth in the tertiary sector should
result in the growth in average size of firms in that sector, given that we control for the size
of the sector. Nevertheless, we also include the indicators interacted with log per capita GDP
in Table 6B (II). The ineraction between judicial efficiency and the indicator for low capital
intensity is still positive and statistically significant. The interaction between judicial efficiency
and high capital intensity is still negative, though now almost significant.In sum, we believe that the interaction effect bolsters the explanations Critical Resource
theories offer for the direct influence of capital intensity and judicial efficiency on firm size. While
not conclusive, this suggests these theories are worthy of further investigation. Furthermore,
while Becker and Murphy (1992) do not discuss the precise channels through which increases
in legal efficiency will increase the size of firms, the evidence is broadly consistent with their
theory also.
6 Discussion
This is undoubtedly an exploratory study. Nevertheless, we believe we have uncovered a number
of regularities that can provide some guidance for future empirical and theoretical work. Our
main finding is that firms in capital-intensive industries are larger, as are firms in countries with
efficient judicial systems. More detailed findings can help tell theories apart. In particular, we
find that firms in capital intensive industries are relatively smaller when located in countries
with efficient judicial systems. This suggests that organizational theories may have some hope
of explaining the substantial variation in firm size. Finally, financial constraints do seem to
affect the size of firms.
Our findings suggest another potential answer, other than industry effects (which are, tosome extent, endogenous) to the question that started this paper. Finland's judicial efficiency
27

is rated 10, the highest on the scale (a position shared with a number of other countries). Its
accounting standards are rated 77, which put it third in the sample after Sweden and the U.K.
This may explain why the average size of its firms is larger than that of larger countries such
as Italy (judicial efficiency 6.75, accounting standards 62) or Spain (judicial efficiency 6.25,accounting standards 64) whose standing on these measures places them close to, or in the
bottom quartile.
The cross-industry results are consistent with the technological theories. This fact is of
considerable importance given that the bulk of the variation in size, as indicated by an analysis
of variance, is due to sectoral effects. However, the cross-country evidence is mixed. For example,
log per capita income has, if anything, a negative correlation with firm size after correcting for
institutional variables that should be irrelevant in technological theories. Similarly, the level of
human capital ha.s an insignificant correlation with firm size after we correct for the efficiency
of the judicial system.
This result is to be expected, as technological theories often abstract from institutional
features that vary across countries and affect firm formation. They instead focus on the organi-
zation of a typical sector within a given economy, and are thus most likely to be consistent with
time-series evidence, as in Lucas (1978), or cross-industry evidence, as in part of our study.
One way to get at more detailed implications of technological theories may be to examine the
influences on the dispersion of firm size within industry. For example, Kremer's (1993) results
on assortative matching based on human capital, and higher human capital firms undertaking
more complex processes (larger firms) can be combined to get the implication that greaterinequality in human capital would be correlated with greater dispersion in firm size. Rosen's
(1982) model has a similar implication - with more skilled managers running large firms and less
skilled managers running small firms. As a measure of inequality in human capital we compute
the coefficient of variation in educational attainments.20 In Table 7, we regress the weighted
coefficient of variation of firm size against this measure of inequality. We find, as predicted, the
coefficient on inequality to be positive and highly statistically significant.
One could, however, argue that institutional development could reduce the importance of
factors like talent and incumbency for the exercise of managerial control, and levels the playing
20BaJrO and Lee (1993) have data on the % of population over 25 in 4 categories of educational attainment— none, primary, secondary, higher — for each country. They also have years of education attainment of eachtype — PYR25, SYR25, and HYR25. We assign the following years of education to the four-category frequencydistribution mentioned above: 0, PYR25, PYR25+SYR25, and PYR25+SYR25+HYR25. The coefficient ofvariation is then computed the usual way and used as a measure of human capital inequality. All human capitaldata is for the year 1985.
28

field. For example, greater judicial efficiency could help even small entrants secure their property,
thus ensuring they reach optimal scale for production. Therefore, we would expect measures
of institutional development to be negatively correlated with dispersion. This is. in fact, thecase. When we include judicial efficiency in column II, it is strongly negatively correlated with
the weighted coefficient of variation of firm size, and inequality in human capital. while still
positive, is no longer statistically significant. Finally, the inclusion of per capita in column IIIdoes not change our conclusions.
Given our cross-sectional data, we could have more convincing tests of technological theories
if we could exploit the way differences in institutional environments across countries affect the
use of particular technologies and organizational structures. Tests for interactions, however,
are hard to tease out of the technological theories since they do not model micro mechanisms
in as detailed a way as organizational theories do. Nevertheless, such tests are possible. For
instance, a more subtle implication of Kremer (1993) is that when the value added in a particular
technology is high, human capital will be more important. So for such technologies, firm size
will be larger when the human capital available in the country is better. This suggests a
positive correlation between firm size and the interaction of human capital in the country with
value added per worker. Unfortunately, the correlation is negative and insignificant when we
include only this interaction together with market size, and country and industry indicators
(coefficients not reported). When we include this interaction in the model in Table 6 A, column
III, neither the interaction term, nor human capital is statistically significant (coefficients not
reported). The variables that were found to be significant in that model continue, however, to
be significant. Accompanied by the usual caveats, the prediction is not borne out.
A final caveat is in order. Even if one can devise more careful tests that discriminate between
technological and organizational explanations of the size of firms, it is likely that they will be
biased in favor of the latter. The firm in our dataset is defined as the legal entity, and the
focus of some organizational theories is precisely on that entity. Clearly, they should have
more explanatory power. By contrast, technological theories focus more on the technological
limits to production. The unit of observation to test such theories should be the length of a
production process from raw material input to final output. This may extend across several
firms. Unfortunately, we do not have data on the length of processes, hence the bias.
29

7 Conclusion
It would be overstatement to suggest that we have actually tested theories. What we have done
is found interesting partial correlations. Our search for these correlations has been motivated
by specific theories, and to that extent, we have found evidence consistent with some theories.
In particular, we find that institutional factors such as the efficiency of the judicial system and
the development of financial markets as well as technological factors such as capital intensity
and market size seem to influence the size of firms.
An important question, which we plan to address in future work, is whether size differences
matter for the level and growth of productivity. If, in fact, the policy variables that we have
found correlated with firm size are causal, they might have implications for growth. Rajan and
Zingales (1998a) suggest that financial development does, in fact, facilitate growth. Since asubstantial part of growth comes from the growth in average size of organizations, one channel
through which financial development helps is by making possible the financing of large firms.
One could ask whether increases in judicial efficiency have similar effects. A related point
is that judicial efficiency is highly correlated with human capital, and most likely with other
forms of organizational capital. It is likely that the same underlying process of development is
responsible for increases in the efficiency of judicial enforcement as well as other forms of capital.
If this is the case, one might not be able to influence judicial efficiency, and hence firm size,
without paying attention to the underlying causes. In other words, it might be worth exploring
the true nature of the correlation between human capital and judicial efficiency, as well as the
policy variables that might affect them. More research is clearly needed.
30

Table 1:
Different Measures of Firm Size by Industrial Sector
The Sow-ce of the data is Enterprises in Europe which provides us with the distribution of firm size in each
NACE two-digit industry in a number of European countries in 1991-92. The average number of employees
computed weighting the average number of employees per firm in each bin of the distribution by the fraction of
firms in that bin. The employee-weighted mean is computed weighting the average number of employees in each
bin of the distribution by the fraction of total industry employees present in each bin. Employee-weighted mode
is the average number of employees per firm in the bin that contains the most number of employees. Employee-
weighted median is the average number of employees per firm in the bin that contains the median employee in
the industry. Relative size correcting for country effects is the average residual for that sector obtained after
regressing the logarithm of employee weighted size on country indicators after removing a fixed country effect. It
can be interpreted as the relative deviation of the size of firms in that sector after purging country effects.
A: Different Measures (average across countries)
Employee Employee Employee Relativeweighted weighted weighted size
Average Number of average mode median correctingnumber of firms in the number of number of number of for countryemployees sector employees employees employees effect N
Extraction solid fuels 232 41 987 1,133 1,133 0.09 6Coke ovens 207 5 300 348 348 -1.28 4Extraction petroleum 441 19 1,239 1,399 1,398 -0.28 5Oil refining 216 60 1,075 1,314 1,303 0.82 7Nuclear fuels 116 6 365 418 418 0.04 3Electricity 173 826 4,122 4,749 4,391 1.89 8Water supply 41 538 477 858 369 -0.15 5Extraction-metal 150 244 644 859 728 -0.48 7Production-metal 136 714 1,412 2,012 1,936 1.41 10Extraction-other 15 2,556 183 404 65 -0.93 9Manufacture-non metal 22 4,924 395 685 302 0.07 13Chemical industry 80 2,295 1,087 1,647 1,438 0.99 12Man-made fibers 224 19 927 1,113 1,113 0.74 6
31

Employee Employee Employee Relatiweighted weighted weighted size
Average Number of average mode median correctingnumber of firms in the number of number of number of for countryemployees sector employees employees employees effect N
Manufacture- metal 19 18,972 243 275 68 -0.48 14Mechanical engineering 33 8,861 510 995 286 0.24 14Office machinery 44 743 1,179 1,602 1,574 0.50 10Electrical engineering 41 6,650 960 1,609 1,241 0.91 14Motor vehicles 99 1,218 1,938 2,455 2328 1.31 12Other means transportation 54 1,268 1,414 2,074 1,837 1.32 12Instrument engineering 19 5,006 391 865 165 0.00 10Food and tobacco 26 17,691 493 1,015 419 0.29 15Textile 27 7,761 324 618 273 -0.08 11Leather goods 11 2,416 142 189 51 -1.23 10Footwear and clothing 17 16,012 234 388 89 -0.52 12Timber and furniture 10 21,098 174 130 38 -1.03 12Paper products and publishing 25 11,654 446 939 267 0.16 15Rubber and plastic 29 4,871 477 861 316 0.09 11Other manufacturing 9 8,295 140 10 45 -0.99 10Building and civil engin. 10 112,814 224 10 28 -0.54 12Wholsaje distrib. 8 57,289 160 186 31 -0.78 12Scrap and waste 5 2,269 30 3 13 -2.45 4Agents 3 84,499 107 2 5 -2.42 8Retail distribution 5 254,448 435 2 17 0.07 8Hotels and catering 5 100,698 130 3 10 -0.97 8Repair of consumer goods 7 39,146 64 45 13 -1.81 8Railways 1,536 2,319 16,253 14,625 14,630 3.35 6Other land transport 6 54,156 320 417 26 -0.13 8Inland water transport 21 263 372 788 364 0.02 4Sea transport 82 225 910 1,454 1,051 1.04 4Air transport 135 140 6,335 7,525 7,525 3.09 5Supporting services 23 4,070 849 1,341 937 0.73 6Travel agents 12 5,787 236 550 92 -0.53 8Communication 2,846 443 27,273 28,256 28,256 4.20 5Banking and finance 86 3,929 1,857 2,564 2,564 1.70 7Insurance 155 712 1,224 1,642 1,569 1.25 8Auxiliary services 5 192,325 325 503 33 -0.44 10Renting, leasing 5 6,030 75 135 22 -1.58 7Letting of real estate 3 22,350 46 2 6 -2.31 6Public administration 6 332,215 544 2 24 -0.48 1Sanitary services 18 5,813 508 1,136 166 -0.03 8Education 5 16,953 103 3 17 -1.97 6Research and development 19 881 344 633 182 -0.05 5Medical and others 8 73,263 286 513 291 -0.73 5Recreational services 6 36,150 522 725 64 0.23 7Personal services 3 48,044 58 2 2 -2.11 8
32

B: Dispersion in Firm Size (average across countries)
EmployeeSimple weighted Employee
coefficient coefficient weightedof variation of variation skewness
Extraction solid fuels 1.19 0.12 -0.26Coke ovens 0.69 0.32 -0.54Extraction petroleum 1.53 0.37 -0.61Oil refining 2.02 0.44 -0.56Nuclear fuels 1.49 0.26 -0.32Electricity 4.53 0.58 -0.73Water supply 4.09 0.86 -0.58Extraction-metal 1.72 0.50 -0.53Production-metal 3.36 0.63 -0.74Extraction-other 3.39 1.32 -0.42Manufacture-non metal 3.95 1.18 -0.57Chemical industry 3.44 0.77 -0.84Man-made fibers 1.40 0.37 -0.26Manufacture- metal 3.60 1.53 0.25Mechanical engineering 4.04 1.19 -0.59Office machinery 4.62 0.58 -0.79Electrical engineering 4.70 0.86 -0.90Motor vehicles 4.27 0.68 -0.52Other means transportation 5.21 0.68 -0.71Instrument engineering 4.60 1.19 -0.98Food and tobacco 4.52 1.12 -1.04Textile 3.55 1.14 -0.77Leather goods 3.07 1.34 -0.08Footwear and clothing 3.82 1.55 -0.11Timber and furniture 3.73 1.73 0.32Paper products and publishing 4.45 1.19 -0.99Rubber and plastic 3.94 1.19 -0.29Other manufacturing 3.99 1.55 0.60Building and civil engin. 5.28 1.99 0.49Wholsale distrib. 4.30 1.92 0.09Scrap and waste 2.02 1.56 0.60Agents 3.72 2.57 0.42Retail distribution 9.08 2.19 0.52Hotels and catering 4.86 2.56 0.42Repair of consumer goods 3.03 2.52 0.16Railways 5.10 0.38 -0.08Other land transport 7.15 1.93 -0.07Inland water transport 4.47 0.94 -0.81Sea transport 3.77 0.72 -0.91Air transport 7.07 0.42 -0.43Supporting services 6.09 0.95 -0.68Travel agents 4.16 1.55 -0.62Communication 8.16 0.24 -0.24Banking and finance 5.92 0.59 -0.64Insurance 2.91 0.58 -0.75Auxiliary services 7.21 2.06 0.09
33
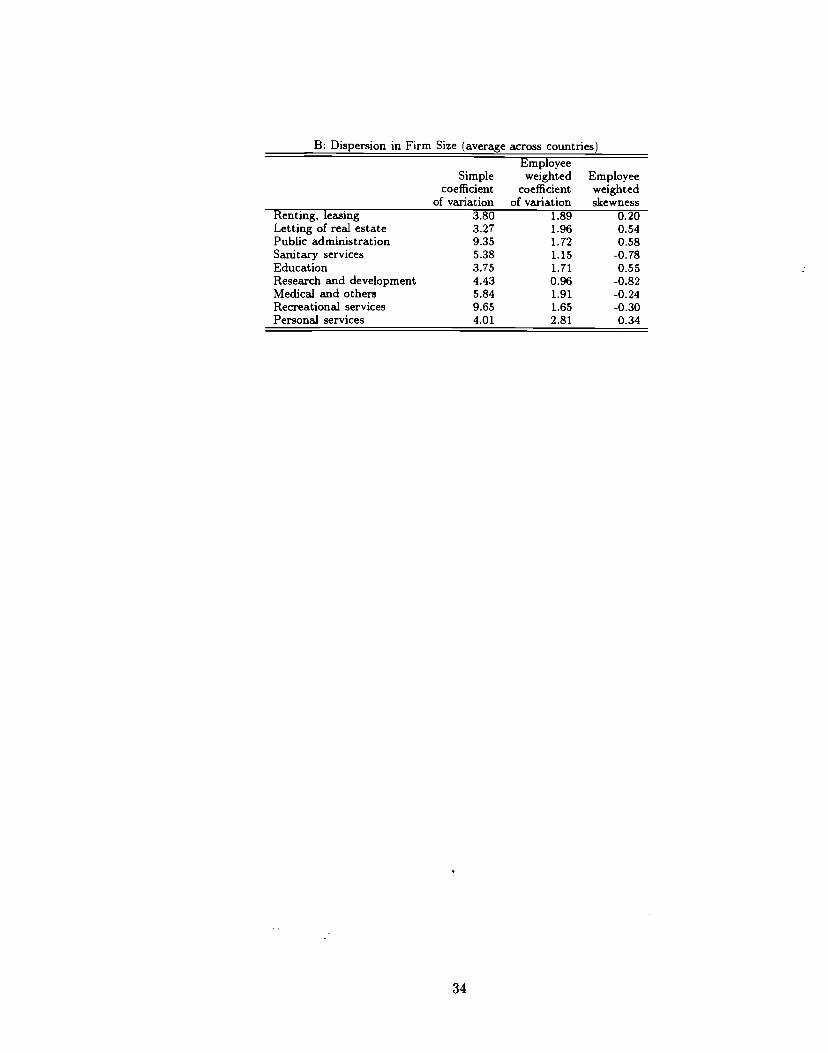
B: Dispersion in Firm Size (average across countries)
EmployeeSimple weighted Employee
coefficient coefficient weightedof variation of variation skewness
Renting, leasing 3.80 1.89 0.20Letting of real estate 3.27 1.96 0.54Public administration 9.35 1.72 0.58Sanitary services 5.38 1.15 -0.78Education 3.75 1.71 0.55Research and development 4.43 0.96 -0.82Medical and others 5.84 1.91 -0.24Recreational services 9.65 1.65 -0.30Personal services — 4.01 2.81 0.34
34

Table 2:
Firm Size by CountryThe source of the data is Enterprises in Europe which provides us with the distribution of firm size in each
NACE two-digit industry in a number of European countries in 1991-92. The simple mean is computed weightingthe average number of employees per firm in each bin of the distribution by the fraction of firms in that bin. Theemployee-weighted mean is computed weighting the average number of employees each bin of the distribution bythe fraction of total industry employees present in each bin. Employee-weighted mode is the average number ofemployees per firm in the bin that contains the most number of employees. Employee-weighted median is theaverage number of employees per firm in the bin that contains the median employee in the industry. Relativesize correcting for industry effects is the average residual for that sector obtained after regressing the logarithmof employee weighted size on industry indicators. It can be interpreted as the relative deviation of the size offirms in that country after purging industry effects. Utilities are defined as NACE sector 16 (Production anddistribution of Electricity), 71 (Railways), 75 (Air Transport), 79 (Communication). Manufacturing is defined asNACE sectors 30 to 49.
A: Different Measures
Employee Employee Employee Relativeweighted weighted weighted size Number
Average Number of average mode median correcting of sectorsnumber of firms in the number of number of number of for industry withemployees country employees employees employees effect data
AUSTRIA 77 8,124 318 427 287 -0.03 8BELGIUM 323 177,973 1,317 1,566 1,367 0.16 53DENMARK 22 53,400 528 1,178 303 0,14 8FINLAND 166 199,942 1,197 1,519 1,235 0.03 47FRANCE 40 1,555,064 1,243 1,510 1,222 0.52 29GERMANY 69 2,159,489 951 1,364 949 0.69 33GREECE 47 8,342 254 320 226 -0.81 22ITALY 101 3,242,062 2,244 2,462 2,346 -0.20 54NETHER 32 154,364 482 842 379 -0.09 17NORWAY 96 83,018 350 520 305 -0.44 33PORTUGAL 21 280,185 299 527 234 -0.60 17SPAIN 71 2,373,379 1,050 1,346 1,136 -0.13 49SWEDEN 28 132,662 614 774 509 0.45 16SWITZ 63 268,653 1,316 1,537 1,378 -0.31 50UK 38 1,165,907 2,525 3,183 2,674 0.84 25
B: Different SubsamplesMean in Mean in Mean in
Mean without manufacturing mechanical food andCountry utilities alone engineering drinkAUSTRIA 318 366 369 194BELGIUM 631 566 615 363DENMARK 528 688 823 904FINLAND 519 555 660 719FRANCE 706 798 NA 376GERMANY 900 1007 751 293GREECE 254 233 73 241ITALY 545 691 292 290NETHER 443 556 105 422NORWAY 347 243 730 403PORTUGAL 299 341 155 216SPAIN 558 750 118 292SWEDEN 576 681 479 635SWITZ 321 242 581 373UK 1041 1087 1187 1486
35

C: Dispersion in Firm Size (average across industries
EmployeeSimple weighted Employee
coefficient coefficient weightedCountry of variation of variation skewnessAUSTRIA 1.68 0.94 -0.20BELGIUM 3.51 0.97 -0.36DENMARK 4.75 1.27 -0.89FINLAND 5.59 1.10 -0.51FRANCE 5.20 1.28 -0.27GERMANY 4.50 1.31 -0.61GREECE 1.72 1.01 -0.07ITALY 4.35 1.70 -0.05NETHER 3.89 1.28 -0.45NORWAY 3.00 1.15 -0.23PORTUGAL 4,18 1.32 -0.33SPAIN 4,69 1.62 -0.25SWEDEN 5.49 1.11 -0.38SWITZ 3.73 1.19 -0.22UK 7.13 0.97 -0.54
36

Table 3:
Summary StatisticsA detailed description of all the variables as well as their sources is contained in the data appendix.
A: Summary statistics
C: Correlation across sectoral variablesSectoral variables log size
of firmsCapital
intensityR&D
intensitySector
wageInvestment per worker 0.135R&D intensity 0.177 -0.130Sector wage 0.270 0.632 0.330External dependence -0.095 0.522 0,236 0.526
37
Country variables Mean Median Std. Deviation Minimum Maximum NPer capita income 12,642 13,281 2,698 6,783 16,245 15Human capital 7.949 8.572 1.905 3.827 10.382 15Inequality in human capital 0.295 0.265 0.135 0.127 0.625 15Judicial efficiency 8.767 9.500 1.616 5.500 10.000 15Accounting standards 64,600 64.000 11.488 36.000 83.000 15Sectoral variablesInvestment per worker 0.009 0.006 0.007 0.002 0.025 36R&D intensity 0.015 0.005 0.023 0.000 0.078 53Sector wage 0.028 0.028 0.010 0.013 0.062 36External dependence 0.004 0.002 0.004 -0.001 0.015 34
Variables that changeby country and sectorLog of size of firms 5.582 5.643 1.454 0.693 9.697 410Size of the market 10.584 10.900 2.246 1.099 14.940 410Judicial efficiency x 0.068 0.049 0.053 0.009 0.254 343investment per workerExternal dependence x 0.220 0.138 0.223 -0.077 1.123 329financial development
B: Correlation across country variablesCountry variables log size Log per
of firmscapita
incomeHumanCapital
Inequality inhuman capital
JudicialEfficiency
Log per capita income 0.423Human capital 0.382 0.715Inequality in human capital -0.145 -0.572 -0.682Judicial efficiency 0.467 0.762 0.901 -0.673Accounting standards 0.553 0.585 0.696 -0.535 0.651

D: Correlation across variables that changeboth by country and sector
Variables that changeby country and sector
log sizeof firms
Marketsize
Jud. eff xcap. mt.
Size of the market 0.349Judicial efficiency x 0.156 -0.379investment per workerExternal dependence x -0.055 -0.344 0.495financial development
38

Table 4:
Cross-Industry Determinants of Firm SizeThe dependent variable is the logarithm of the weighted number of employees per firm in each NACE two-
digit industry in each country. The size of the market is measured as the logarithm of total employment in aNACE two-digit industry in a country. Investment per worker is from OECD's ISIS Database. The averageacross European countries and the US is used. Wage per worker is from the same database, and the averageacross European countries and the US is used. R&D to sales is the median ratio of R&D over sales between 1980and 1989 computed for U.S. public companies in the same NACE two-digit sector. The source is Compustat-Business Segment file. Amount financed externally is the product of capital expenditures that U.S. companiesin the same NACE two-digit sector finance externally (see Rajan and Zingales, 1998) and investment per workercalculated above. Estimates in column I and III have been obtained by instrumental variable estimation, wherethe instruments for the size of the market are the logarithm of population and GDP. Column II reports OLSestimates with fixed country effects. In column III, we compute the per worker explanatory variables using only theindustries for which European data exist. Heteroskedasticity-robust standard errors are reported in parenthesis.The standard errors are also adjusted for the possible dependence of observations in the same industry acrossdifferent countries.
I II IIISize of the market 0.19
( 0.05 )0.35
( 0.08 )0.24
( 0.06 )Investment per worker
R&D intensity
Sector wage
External dependence
40.40( 22.62 )
12.37(5.84)58.03
(19.10 )-140.0450.13 )
46.37( 24.69 )
12.42(5.85)65.20
( 20.38 )-110.29( 55.02 )
28.88( 35.34
9.59(7.10)67.92
( 39.58 )-122.84( 67.48 )
R-squared 0.32 0.43 0.36N 334 334 230
39
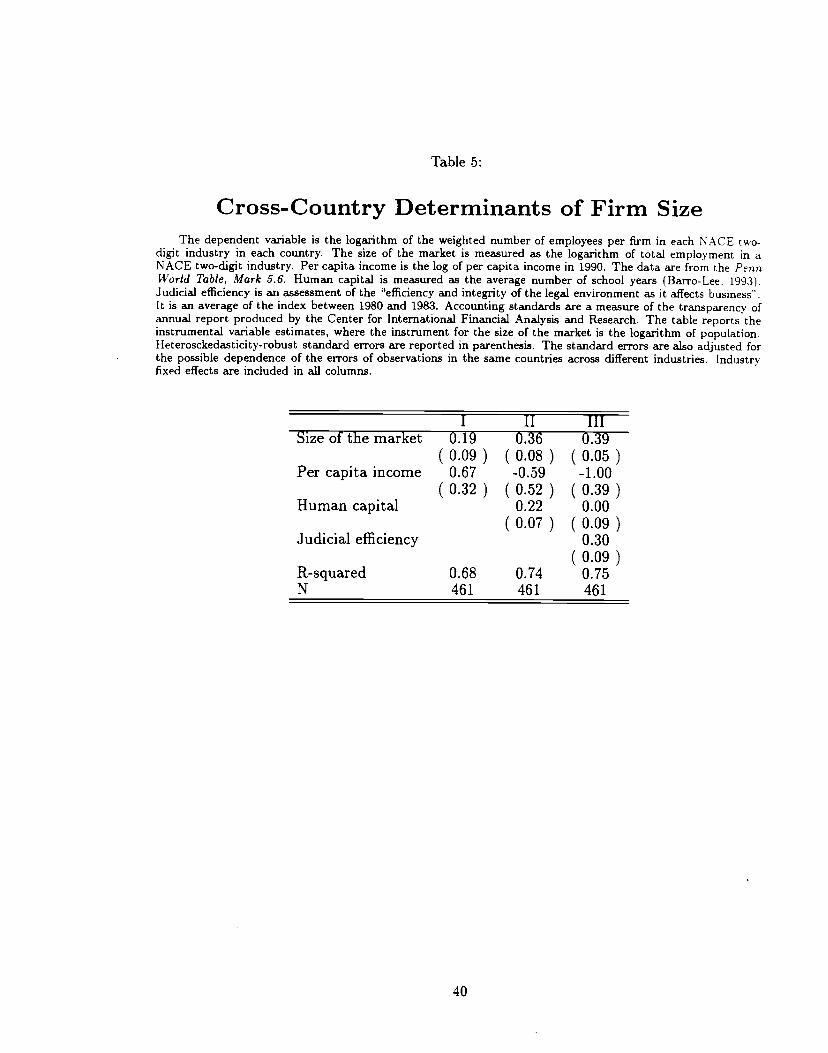
Table 5:
Cross-Country Determinants of Firm SizeThe dependent variable is the logarithm of the weighted number of employees per firm in each NACE two-
digit industry in each country. The size of the market is measured as the logarithm of total employment in aNACE two-digit industry. Per capita income is the log of per capita income in 1990. The data are from the PennWorld Table, Mark 5.6. Human capital is measured as the average number of school years (Barro-Lee. 1993).Judicial efficiency is an assessment of the "efficiency and integrity of the legal environment as it affects business".It is an average of the index between 1980 arid 1983. Accounting standards are a measure of the transparency ofannual report produced by the Center for International Financial Analysis and Research. The table reports theinstrumental variable estimates, where the instrument for the size of the market is the logarithm of population.Heterosckedasticity-robust standard errors are reported in parenthesis. The standard errors are also adjusted forthe possible dependence of the errors of observations in the same countries across different industries. Industryfixed effects are included in all columns.
I II IIISize of the market 0.19
( 0.09 ) (
0.360.08 ) (
0.390.05 )
Per capita income
Human capital
0.67( 0.32 ) (
(
-0.590.52 )0.220.07)
(
(
-1.000.390.000.09
)
)Judicial efficiency
(0.300.09 )
R-squared 0.68 0.74 0.75N 461 461 461
40

Table 6:
Interaction EffectsThe dependent variable is the logarithm of the weighted number of employees per firm in each NACE two-
digit industry in each country. The size of the market is measured as the logarithm of total employment in thatNACE two-digit industry in a country. Per capita income is the log of per capita income in 1990 as reportedby the Penn World Table, Mark 5.6. Judicial efficiency is an assessment of the "efficiency and integrity of thelegal environment as it affects business." Accounting standards are a measure of the informativeness of annualreports in a country as measured by the Center for International Financial Analysis and Research. Investmentper worker is from OECD's ISIS Database. The average across European countries and the US is used. Wageper worker is from the same database, and the average across European countries and the US is used. R&D tosales is the median ratio of R&D over sales computed for U.S. public companies in the same NACE two-digitsector over the period 1980-89. The source is Compustat-Business Segment file. Amount financed externally isthe product of capital expenditures that U.S. companies in the same NACE two-digit sector finance externally(see R.ajan and Zingales, 1998) and investment per worker calculated above. As in Rajan and Zingales (1998a)financial development is proxied for by the accounting standards. Columns I-Ill of Panel A and Panel B areestimated by OLS and contain industry fixed effects and country fixed effects. Column IV of Panel A is estimatedusing IV and does not include country fixed effects. In panel B, low investment per worker is a dummy equalto one for sectors in the lowest tertile of investment per worker. High investment per worker is a dummy equalto one for sectors in the highest tertile of investment per worker. Heteroskedasticity-robust standard errors arereported in parenthesis.
Panel AI II III IV
Size of the market 0.65 0.58 0.59 0.26( 0.06 ) ( 0.07 ) ( 0.07 ) ( 0.06
Judicial efficiency X -12.68 -20.17 -19.03investment per worker ( 5.99 ) ( 5.58 ) ( 6.08External dependence X 3.56 5.95 7.20financial development (1.64 ) (1.59 ) ( 2.08 )Judicial efficiency 0.30
( 0.08Accounting standards -0.02
( 0.01 )R-squared 0.72 0.72 0.74 0.67N 348 334 334 334
41

Panel BI II
Size of the market 0.60 0.60(0.07) (0,07)
Judicial efficiency x -0.09 -0.17high investment per worker ( 0.07 ) ( 0.11 )Judicial efficiency x 0.23 0.18low investment per worker ( 0.07 ) ( 0.10 )GDP per capita x 0.71high investment per worker ( 0.75 )GDP per capita x 0.48low investment per worker ( 0.60 )External dependence x 4.78 4.74financial development ( 1.53 ) (1.53 )R-squared 0.74 0.74N 334 334
42

Table 7:
The Determinants of Dispersion in Firm SizeThe dependent variable is the weighted coefficient of variation of the number of employees per firm in
each NACE two-digit industry in each country. Inequality in human capital is measured as the product of thepercentage of the population with the highest educational achievement and percentage of the population withthe lowest educational achievement. The numbers are from Barro-Lee, 1993. Judicial efficiency is an assessmentof the "efficiency and integrity of the legal environment as it affects business." Per capita income is the log ofper capita income in 1990 as reported by the Penn World Table, Mark 5.6. All estimates are obtained by OLSand contain industry fixed effects. Heteroskedasticity-robust standard errors are reported in parentheses. Thestandard errors are also adjusted for the possible dependence of the errors of observations in the same countriesacross different industries.
I II IIIInequality in human capital
(Judicial efficiency
1.220.51 ) (
(
0.250.56 )-0.120.03)
(
(
0.090.45-0.190.05
)
)GDP per capita 0.60
R-squared 0.68 0.71( 0.24
0.72)
N 463 463 463
43

A Formulas for Statistical MeasuresLet e denote the employment in bin i, and ndenote the number of firms in bin i for any given country-sector combination. Omit country-sector subscripts for convenience. Let E denote the total employmentfor the country-sector and N the total number of firms. The simple average is given by:
—..(n\ (e1'\ Eav=)) 7ç7
The employee-weighted average is given by:
ewav = > () (a).The simple variance is given by:
—fTZ1\ (e\ 2
var = 2.—) I—I—avN \n1Jsd =
The analagous quantity for the employee-weighted variance is:
fe;\ (e\ 12ewvar = (— J ( — J — ewav\EI \n1Jewsd = /ewvar.
The simple coefficient of variation is given by:
sdcv = —.
av
The analagous one for the employee-weighted measure is:
e wsdewcv =ewav
The "employee-weighted mode" is defined by:
(fej\ (e2ewmode = argmax -) —The average size of the modal bin is reported.
The employee-weighted median will be the first i for which () (.) becomes � 0.5.
Pearson's measure for employee-weighted skewness is
B Data AppendixIn this appendix, we discuss the data sources andthe construction of our regression variables, In theinterest of brevity, we present only the main points on the construction of a unified database from dis-parate sources. More comprehensive notes are available from the authors.
Employee-weighted average firm size:
44
• Data source(s): Enterprises zn Europe (1994), which provides us with the distribution of size offirms in each NACE two-digit industry (sector) of selected European countries. Data is availablefor either 1991 or 1992 for all countries.
• Construction of variable: The average firm size (number of employees) in each size class is firstcalculated by dividing the number of employees by the number of firms. The average size for theentire sector is then calculated as the weighted sum of these bin averages, using as weights theemployees in the size class as a fraction of total sectoral employment.
• Scope of Variable: Country-sector• Notes:
— The size classification varies considerably across countries, as does coverage. All sectors forwhich the bin employment does not add up to total employment are eliminated.
— When data for multiple, related sectors are combined in the source, we attribute the combinedfigures to the smallest sector number. For instance combined data for Chemical industry(NACE 25) and Man-made fibres industry (NACE 26) are presented as the former.
— Total employment numbers are used. If data for total employment is either not available orsparsely available, we use salaried employment.
Size of the market:
• Data source(s): Enterprises in Europe (1994).• Construction of variable: The logarithm of the total employment in a NACE two-digit industry
is used.
• Scope of Variable: Country-sector
Investment per worker:
• Data source(s): OECD: Industrial Strvcture Statistics (ISIS) (1997), which provides us withdata on production, value added and investment in each ISIC sector of selected OECD countries.Data is available from 1970 to 1995, though coverage is not uniform. Employment data used tocalculate per worker quantities is also from the same database.
• Construction of variable: The total sectoral investment (gross capital formation) from ISIS isdivided by total employment from Enterprises in Europe to get the investment per worker, andadjusted by the exchange rate to get the figure in US dollars. The average value across all countriesis computed for each sector, to get a sector-level variable.
• Scope of Variable: European & U.S. Sector• Notes:
— The use of investment per worker for capital per worker is based on the assumption thatthe economies studied were at their steady states. Direct data on capital per worker, at thesectoral level, is difficult to obtain for the countries being studied.
— The investment data is for the year closest to the one for employment data.— Data for ISIC — Revision 2 classification is used wherever available; else, the data is for ISIC
— Revision 3. These ISIC codes were translated to NACE codes; the translation used isavailable upon request. The ISIC data is available at the 3-digit level, and sometimes evenat the 4-digit level; this facilitates a fairly complete translation of codes.
— The market exchange rate (average over the year) provided by ISIS is used to convert invest-ment in local currency to US dollars.
Value added per worker:
• Data source(s): OECD: Industrial Structure Statistics (ISIS) (1997).
45

• Construction of variable: The total value added from ISIS is divided by total employment fromEnterprises in Europe to get the value added per worker, and adjusted by the exchange rate to getthe figure in US dollars. The average value across all countries is computed for each sector, to geta sector-level variable.
• Scope of Variable: European & U.S. Sector• Notes:
— While the exact details on how value added is computed for each country varies, the generaldefinition is the difference between gross output and industrial input. Industrial input consistsof industrial materials, industrial services and fuel and power used in the production of output.
— The items on year of data, classification conversion, and the use of market exchange ratesmentioned under "capital intensity" apply here as well.
Wages per worker:
• Data source(s): OECD: Industrial.Strtjcture Statistics (ISIS) (1997).
• Construction of variable: The total wages from ISIS is divided by total employment fromEnterprises in Europe to get the wages per worker, and adjusted by the exchange rate to get thefigure in US dollars. The average value across all countries is computed for each sector, to get asector-level variable.
• Scope of Variable: European & U.S. Sector• Notes:
— The items on year of data, classification conversion, and the use of market exchange ratesmentioned under "capital intensity" apply here as well.
R & D intensity:
• Data source(s): COMPUSTAT - Business Segment File.
• Construction of variable: The median ratio of R & D over sales is computed for the analogueof the NACE 2-digit sectors among publicly traded U.S. companies.
• Scope of Variable: US Sector• Notes:
— We use only single-segment firms and we map three-digit SIC codes into NACE sectors.These data, as well as the program to compute them, are available from the authors.
External dependence:
• Data source(s): COMPUSTAT — Business Segment File, OECD: Industrial Structure Statistics(ISIS) (1997).
• Construction of variable: The fraction of capital expenditures that is financed externally forthe analogue of the NACE 2-digit sectors among publicly traded U.S. companies is multiplied bythe investment per worker in that sector for the European country. In other words, this is anestimate of external financing per worker in the given country-sector combination.
• Scope of Variable: Country-sector• Notes:
— See Rajan and Zingales (1998a) for further details.
Utility & Transport sector:
46

• Data source(s): Enterprises in Europe (1994).• Construction of variable: This is a dummy variable that is set to 1 if the NACE sector is
one of Production and Distribution of Electricity (16), Railways (71), Air Transport (75), orCommunication (79).
• Scope of Variable: Sector dummy
Per capita income:
• Data source(s): Penn World Table (Mark 5.6), which provides us with country level data on realGDP, goverment expenditure, and human capital.
• Construction of variable: The logarithm of per capita GDP ("RGDPCH" in PWT) is used forthe relevant year.
• Scope of Variable: Country
Human capital:• Data source(s): Barro and Lee's dataset for a panel of 138 countries (1994).
• Construction of variable: The average schooling years in the total population over age 25, forthe year 1985, is used ("human85" in Barro and Lee).
• Scope of Variable: Country• Notes:
— This is an attainment variable that changes very slowly over time. Therefore, the use of 1985data is not seen as a serious limitation.
Human capital inequality:• Data source(s): Barro and Lee's dotaset for a panel of 138 countries (1994).
• Construction of variable:Barro and Lee (1993) have data on the
• Scope of Variable: Country
Judicial efficiency:
• Data source(s): Business International Corporation.• Construction of variable: This variable is an assessment of the "efficiency and integrity of the
legal environment as it affects business." Data is found in a scale form, with scores ranging fromzero to ten, where the lower scores mean lower efficiency levels.
• Scope of Variable: Country• Notes:
— It is an average of the index between 1980 and 1983.
Tax rate:
• Data source(s): Corporate Taxes: A Worldwide Summary.
• Construction of variable: This is the corporate tax rate in each country in the year 1991.
• Scope of Variable: Country
Patent protection:• Data source(s): Ginarte and Park (1997).
47

• Construction of variable: This is an index that combines several dimensions of patent protec-tion.
• Scope of Variable: Country• Notes:
— See Ginarte and Park (1997).
Financial development:
• Data source(s): Center for International Financial Analysis and Research.
• Construction of variable: Financial development is proxied by a measure of accounting stan-dards. This variable measures the transparency of annual reports.
• Scope of Variable: Country• Notes:
— See Rajan and Zingales (1998a) for further details.
48

ReferencesAUDRETSCH, DAVID B. AND TALAT MAHMO0D 1995, "New Firm Survival and the Tech-
nological Regime" , Review of Economics and Statistics 77:1, 97-103.ALCHIAN, A. AND H. DEMsETz, 1972, "Production, Information Costs and Economic
Organization", American Economic Review 777-705.BANZ, ROLF W., 1981, "The Relationship Between Return and the Market Value of
Common Stocks", Journal of Financial Economics 9, 3-18.BARRO R. AND J. LEE, 1993, "International Comparisons of Educational Attainment,"
NBER Working Paper.BECKER, GARY S., AND MURPHY, KEVIN M. (1992). "The Division of Labor, Coor-
dination Costs, And Knowledge," The Quarterly Journal of Economics, November1992, 1137-1160. -
CAVES, RICHARD E. (1998). "Industrial Organization and New Findings on the Turnoverand Mobility of Firms," Journal of Economic Literature, December 1998, 1947-1982.
CAVES, RICHARD E. AND THOMAS A. PUGEL (1980). Intra-Industry Differences in Con-duct and Performance Monograph Series, New York University.
C0ASE, R., 1937, "The Nature of the Firm," Economica 4:386-405.CoHEN, WESLEY M. , AND KLEPPER, STEVEN (1996). "Firm Size and the Nature of
Innovation within Industries: The Case of Process and Product R&D," The Reviewof Economics and Statistics
DAVIS, STEVEN J., AND HENREKSON, MAGNUS. (1997). "Explaining National Differ-ences in the Size and Industry Distribution of Employment," Working Paper, August1997, The University of Chicago Graduate School of Business.
FAMA, E. AND M. JENSEN (1983). "Separation of Ownership and Control," Journal ofLaw and Economics , June.
GERTLER, MARK AND SIMON GILCHRIsT (1994). "Monetary Policy, Business Cycles.and the Behavior of Small Manufacturing Firms," Quarterly Journal of Economics,109: 309-341.
GINARTE, JUAN CARLOS AND WALTER G. PARK (1997). "Determinants of Patent Rights:A Cross-National Study," mimeo, American University, Washington D.C.
GOLLIN, DOUGLAS. (1998). "Nobody's Business but My Own: Self Employment andSmall Enterprise in Economic Development," Working Paper, June 1998, WilliamsCollege.
GROSSMAN, S. AND HART, 0. 1986, "The Costs and the Benefits of Ownership: A The-ory of Vertical and Lateral Integration" Journal of Political Economy 691-719.
HARRIS, MILTON AND ARTuR RAVIv 1990, "The theory of capital structure" Journalof Finance 46, 297-355.
Hart, Oliver, Firms, Contracts, and Financial Structure, (Oxford: Clarendon Press,1995).
HART, 0. AND J. MOORE 1990, "Property Rights and the Nature of the Firm" Journalof Political Economy 1119-1158.
HOLMSTROM, BENGT, 1999 "The Firm as a Subeconomy" Journal of Law, Economicsand Organizatiorz,15, no 1, 74-102.
49

HOLMSTROM, BENGT AND J.R0BERTs 1998 "The Boundaries of the Firm Revisited.Journal of Economic Perspectives , 12: 73-94.
HOPENHAYN, HUGO A. (1992). "Entry, Exit, and Firm Dynamics in Long Run Equi-librium," Econometrica, September 1992, vol. 60, no. 5, 1127-1150.
ISLAM, NAZRUL. (1995). "Growth Empirics: A Panel Data Approach," The QuarterlyJournal of Economics, November 1995, 1127-1170.
KLEPPER, STEVEN (1996). "Entry, Exit, Growth, and Innovation over the Product LifeCycle," American Economic Review, 86:3, 562-583.
KREMER, MICHAEL. (1993). "The 0-Ring Theory of Economic Development.' TheQuarterly Journal of Economics, August 1993, 551-575.
JENSEN M. C. AND W. MECKLING. 1976, "Theory of the Firm: Managerial Behavior.Agency Costs and Capital Structure", Journal of Financial Economics 3: 305-360.
JENSEN,M. AND K.J. MURPHY 1990, "Performance Pay and Top-Management Incen-tives", Journal of Political Economy 98, 225-264.
LA PORTA, R., FLORENCIO, LOPEZ DE SILANES, ANDREI SHLEIFER, AND ROBERT VISHNY1997a, "The Legal Determinants of External Finance," Journal of Finance, 52,
113 1-1150.
LA PORTA, R., FLORENCIO, LOPEZ DE SILANES, ANDRE! SHLEIFER, AND ROBERT VISHNY1997b, "Trust in large organizations," American Economic Review, 87:2, 333-338.
LA PORTA, R., LOPEZ-DE-SILANES, F., SHLEIFER, A. AND R. VISHNY , 1998, "Lawand Finance", Journal of Political Economy, 106, 1113-1155.
LUCAS, ROBERT E., JR. (1978). "On the Size Distribution of Business Firms," BellJournal of Economics, vol 9, 508-523.
MATA, JOSE. (1996). "Markets, Entrepreneurs, and the Size of New Firms," EconomicLetters, 52:1, 89-94.
PAGANO, MARCO, AND F. PANETTA AND L. ZINGALES, , 1998, "Why Do CompaniesGo Public? An Empirical Analysis"] Journal of Finance, 53: 27-64
PAKES, ARIEL, AND RICHARD ERICSON, ,forthcoming, "Empirical Implications of Al-ternative Models of Firm Dynamics", Journal of Economic Theory.
PETERSEN, M. AND R. RAJAN, 1997, Review of Financial Studies, 10:1, 661-691.RAJAN, R. AND L. ZINGALES, 1995, "What Do We Know about Capital Structure?
Some Evidence From International Data" Journal of Finance , 50: 142 1-1460.
RAJAN, R. AND L. ZINGALES, 1998a, "Financial Dependence and Growth" The Amer-ican Economic Review 88: 559-586.
RAJAN, R. AND L. ZINGALES, 1998b, "Power in a Theory of the Firm," Quarterly Jour-nal of Economics CXIII: 387-432.
RAJAN, R. AND L. ZINGALEs, 1998c, "The Firm as a Dedicated Hierarchy: A The-ory of the Origins and Growth of Firms," University of Chicago working paper.http: //gsblgz.uchicago.edu.
RAJAN, R. AND L. ZINGALES, 1999, "Politics, Law, and Financial Development," Uni-versity of Chicago working paper. http://gsblgz.uchicago.edu.
RINGLEB AND WIGGINS (1990) "Liability and Large-Scale, Long-Term Hazards," Jour-nal of Political Economy 98.
50

ROSEN, SHERWIN. (1982). "Authority, Control, and the Distribution of Earnings." BellJournal of Economics, Autumn 1982, 3 11-323.
SHEPARD, ANDREA. (1987). "Licensing to Enhance Demand for New Technologies."Rand Journal of Economics, 18, 360-368.
SUTTON, JOHN, 1991, 'Sunk Costs and Market Structure: Price Competition, Advertis-ing, and the Evolution of Concentartion, MIT Press, Cambridge: MA.
SUTTON, JOHN (1997). "Gibrat's Legacy," Journal of Economic Literature, 35:1, 40-59.WILLIAMSON, 0., 1975, 'Market and Hierarchies: Analysis and Antitrust Implications.
The Free Press, New York.
WILLIAMSON, 0., 1985, 'The Economic Institutions of Capitalism, The Free Press, NewYork.
51

</ref_section>