nber working paper series does voting ...technology, touch-screen voting machines seem to have...
TRANSCRIPT

NBER WORKING PAPER SERIES
DOES VOTING TECHNOLOGY AFFECT ELECTION OUTCOMES?TOUCH-SCREEN VOTING AND THE 2004 PRESIDENTIAL ELECTION
David CardEnrico Moretti
Working Paper 11309http://www.nber.org/papers/w11309
NATIONAL BUREAU OF ECONOMIC RESEARCH1050 Massachusetts Avenue
Cambridge, MA 02138May 2005
We are grateful to Ted Miguel for very helpful comments on a previous draft and for sharing his data onpresidential election. We also thank Ken Chay and Alex Mas for useful conversations, Stephen Ansolabeherefor sharing some corrections to our voting technology data, and Daniel Hartley and David Walton foroutstanding research assistance. The views expressed herein are those of the author(s) and do not necessarilyreflect the views of the National Bureau of Economic Research.
©2005 by David Card and Enrico Moretti. All rights reserved. Short sections of text, not to exceed twoparagraphs, may be quoted without explicit permission provided that full credit, including © notice, is givento the source.

Does Voting Technology Affect Election Outcomes? Touch-screen Voting and the 2004 PresidentialElectionDavid Card and Enrico MorettiNBER Working Paper No. 11309May 2005JEL No. H0, J0
ABSTRACT
Supporters of touch-screen voting claim it is a highly reliable voting technology, while a growingnumber of critics argue that paperless electronic voting systems are vulnerable to fraud. In this paperwe use county-level data on voting technologies in the 2000 and 2004 presidential elections to testwhether voting technology affects electoral outcomes. We first show that there is a positivecorrelation between use of touch-screen voting and the level of electoral support for George Bush.This is true in models that compare the 2000-2004 changes in vote shares between adopting and non-adopting counties within a state, after controlling for income, demographic composition, and otherfactors. Although small, the effect could have been large enough to influence the final results insome closely contested states. While on the surface this pattern would appear to be consistent withallegations of voting irregularities, a closer examination suggests this interpretation is incorrect. Ifirregularities did take place, they would be most likely in counties that could potentially affectstatewide election totals, or in counties where election officials had incentives to affect the results.Contrary to this prediction, we find no evidence that touch-screen voting had a larger effect in swingstates, or in states with a Republican Secretary of State. Touch-screen voting could also indirectlyaffect vote shares by influencing the relative turnout of different groups. We find that the adoptionof touch-screen voting has a negative effect on estimated turnout rates, controlling for state effectsand a variety of county-level controls. This effect is larger in counties with a higher fraction ofHispanic residents (who tend to favor Democrats) but not in counties with more African Americans(who are overwhelmingly Democrat voters). Models for the adoption of touch-screen voting suggestit was more likely to be used in counties with a higher fraction of Hispanic and Black residents,
especially in swing states. Nevertheless, the impact of non-random adoption patterns on vote shares
is small.
David CardDepartment of EconomicsUniversity of CaliforniaBerkeley, CA 94720-3880and [email protected]
Enrico MorettiDepartment of EconomicsUniversity of CaliforniaBerkeley, CA 94720-3880and [email protected]

1
1. Introduction The difficulty of counting the ballots in Florida during the 2000 presidential election drew
the nation’s attention to the issue of voting technology. Backed by funding from a new federal law
– the Help America Vote Act of 2002 – many counties across the U.S. responded by installing
touch-screen voting machines.1 Supporters of this new technology (also known as “direct recording
electronic” voting) point to several advantages, including the “instant” availability of vote counts,
accessibility for disabled voters, and ease of implementing last minute ballot changes.2
Nevertheless, before, during and after the most recent presidential election concerns were
raised that touch-screen voting may be vulnerable to fraud.3 Distrust in electronic voting is not
limited to “conspiracy theory” web sites. It is shared by the mainstream press, some
Representatives in Congress, and is substantiated by peer-reviewed academic studies. A recent
technical analysis showed that the software in one brand of touch-screen voting machinery is
insecure, and noted that in the absence of a paper trail vote tampering may be impossible to detect
(Kohno et al., 2004). Critics’ concerns increased when, just prior to the 2004 election, the CEO of a
leading touch-screen manufacturer told Republicans he was “… committed to helping Ohio deliver
its electoral votes to the president.”4 The day after the election some of these concerns seemed
validated by the discovery of an error in electronic voting machinery that gave President Bush more
votes than had actually been cast in one Ohio precinct.5 Reports of voting irregularities prompted a
formal objection to the Ohio election results by a number of Democratic Congressmen.6
Although not all the controversies surrounding the 2004 election are related to voting
technology, touch-screen voting machines seem to have generated the most widespread debate.7 A
recent New York Times editorial summarized the state of public skepticism on this new voting
1 HAVA provides funding for adopting one of two “electronic” voting systems: so called optical scan systems, which rely on a paper ballot marked with a pencil, and “touch screen” systems. See Katz and Bolin (2005). 2 See for example the Customer Comments on the Patriot voting system sold by Unilect Corporation at www.unilect.com/. 3 Reflecting these concerns, California’s Secretary of State published guidelines in December 2003 that required all touch-screen voting systems purchased by cities or counties after July 2005 to include an “accessible voter verified paper audit trail”. Harris (2003) presents a critique of touch-screen voting systems. 4 The Aug. 14, 2004 letter from Walden O'Dell of Diebold Inc. - who was active in the re-election effort of President Bush - prompted Democrats to question the propriety of allowing O'Dell's company to calculate votes in the 2004 presidential election. 5 The error occurred in a precinct in Columbus, Ohio. The original electronic tally showed Bush receiving 4,258 votes to Democrat John Kerry's 260 votes. However, only 638 voters cast ballots in that precinct. The error was later corrected by election officials. 6 Explaining her decision to support the objection, Senator Barbara Boxer (D-CA) commented “We cannot keep turning our eyes away from a flawed system” (San Francisco Chronicle, January 7, 2005). Problems with electronic voting systems have continued after the presidential election. A recent New York Times article (April 1 2005) noted that “… a computer glitch caused Miami-Dade electronic voting machines to throw out hundreds of ballots in a special election on March 8, 2005 and raised questions about votes in five other municipal elections. The problem came to light when officials noticed a large number of undervotes in the election.” 7 Many newspapers articles and web sites alleged voting irregularities in Florida counties that use optical-scan voting machines. These reports were never officially substantiated.

2
technology, concluding that “…these ATM-style machines make a lot of sense for the
manufacturers because they are expensive. But touch screen machines are highly vulnerable to
being hacked or maliciously programmed to change votes.”8 With a narrowly divided electorate,
even minor problems in the accuracy of polling could tip election results for one party or the other.
More generally, the issue of voting technology threatens to erode trust in the democratic process,
leading to voter disengagement and reduced turnout.
One of the reasons why the choice of voting technology is so controversial is that there is
very little systematic empirical evidence on the relationship between voting technology and election
outcomes.9 In this paper we use county-level data on voting technologies in the 2000 and 2004
presidential elections to test whether voting technology affects electoral outcomes. Clearly, due to
its illicit nature, it is difficult to find direct evidence of vote tampering. Instead, following the
approach of other recent studies that have tried to detect illegal behavior, we use publicly available
data on voting outcomes across counties to test for patterns that could be suggestive of
manipulation.10 In particular, we focus on interactions between the use of touch-screen machinery
and the incentives faced by local officials to tip the vote in one direction or the other.
We begin by comparing the change in the Republican two-party vote share between 2000
and 2004 in counties that adopted touch-screen voting technology and counties that did not, relative
to the trends in the same counties between 1996 and 2000. The results suggest that the gain in the
share of votes cast for George Bush between 2000 and 2004 was greater in counties with touch-
screen voting. The gap is fairly large, accounting for 1.2-2.7 percentage points of the 2000-2004
gain in the Republican two-party vote share – enough to have affected the final outcome of the
election.
Of course these results do not necessary prove that voting technology matters. An
alternative explanation is touch-screen voting was more likely to be adopted in counties where
support for Republican presidential candidates was accelerating. We therefore consider models for
the change in the Republican vote share that control for a wide variety of observed election
determinants, including state fixed effects, controls for the Republican and third party vote shares in
the county since 1992, income, church membership, presence of military personnel and racial
composition. In these models the difference in the change in the 2000-2004 Republican two-party
vote share between counties with and without touch-screen voting falls to 0.2-0.3 percentage points,
8 New York Times, March 10, 2005. 9 The only paper that we are aware of that directly studies the effect of technology on election outcomes is Hout et al. (2004). McDonald (undated) presents a critique of this study. Brady et al (2001) and a group at CalTech-MIT (2001) focus on the question of which voting technology generates the lowest fraction of invalid votes. 10 Recent examples include Levitt and Duggan (2002), Fisman and Wei (2004), Jacob and Levitt (2003), Hsieh and Moretti (2005), Di Tella and Schargrodsky (2003), Fisman (2001), and Reinikka and Svensson (2004).
3
but remains marginally significant. Although small, this effect would have been large enough to
influence the final result in some closely contested states, and therefore the final election outcome.
Is the gap in Republican vote share between counties with and without touch screen voting
evidence of systematic irregularities on the part of Republicans election officials, or just a spurious
correlation? To provide further insights we turn to more direct tests based on the notion that
incentives for vote manipulation vary widely across counties. If irregularities did take place, they
would be most likely in counties that could potentially affect statewide election totals, or in counties
where election officials had incentives to affect the results. For example, there are few incentives
for vote tampering in solidly Democratic or solidly Republican states like California or Texas, since
small changes in a county’s vote tally have no effect on the final outcome. On the other hand,
incentives are higher in states like Ohio or Florida, where minor changes in the tallies from a small
number of counties could affect the outcomes under the “winner-take-all” electoral college system.
Similarly, in the presence of irregularities associated with voting technology, one would not expect
touch-screen voting to favor Republicans in states where election officials are Democrats.
In this spirit, we estimate models that include interactions between an indicator for touch-
screen voting and indicators for whether the state was a swing state and whether the Secretary of
State (or the Governor) was Republican. We find no evidence that these interaction effects are
positive. Indeed, if anything, the touch-screen voting effect is smaller in swing states, and in states
with a Republican Secretary of State. These results are inconsistent with the irregularity hypothesis.
As a further check, we estimate a parallel set of models for the change in the share of voters
registered as Republicans. Trends in registration presumably reflect trends in voter sentiment but
should not be affected by voting technology. Thus any relation between touch screen voting and
the change in the Republican share of registered voters suggests a problem with unobserved
heterogeneity that could also bias the relation between touch screen voting and vote shares.11
Results from this investigation suggest that changes in the relative shares of registered voters are
unrelated to use of touch screen voting, although the power of the exercise is limited by the lack of
complete data on county-level voter registration.
If the touch-screen voting effect cannot be explained by voting irregularities, or by omitted
variables, why is there a relationship between touch-screen voting and changes in support for Bush?
One possible link is through voter turnout: if touch screen voting affects the relative turnout of
groups with systematically different voter preferences, it could affect vote share outcomes. We find
that touch-screen voting is associated with lower turnout rates, and that this effect is larger in
counties with a larger fraction of Hispanics. Since Hispanics tend to vote for Democrats, this
11 A similar test could be performed with exit poll data. However, county-level exit poll data are unavailable.

4
turnout effect may ultimately affect the election outcomes. On the other hand, there is no similar
interaction with the fraction of Black residents in a county.
Finally, we present models where technology adoption is the dependent variable.
Controlling for state effects, these models suggest that touch-screen voting was more likely to be
adopted in counties with higher fractions of Black and Hispanic voters. Consistent with a possible
partisan motive, the Hispanic effect is generally stronger in swing states, though not in states with a
Republican governor.
Overall, we reach two main conclusions. First, although there is some evidence that use of
touch-screen voting is correlated with the change in the Republican vote share in a county, caution
is needed in interpreting these patterns. While this evidence would appear superficially consistent
with voting manipulation, more direct tests for systematic voting irregularities show no evidence
that the Republican gains are correlated with local incentives to raise the Republican vote share. We
stress that our empirical strategy is intended to test for systematic voting irregularities, and cannot
detect voting irregularities in only in one or two counties.
Second, touch-screen voting can affect election outcomes indirectly by affecting the relative
turnout of different voter groups. The evidence suggests that touch-screen voting reduces overall
turnout, with a larger effect in counties with more Hispanic residents. The fact that touch-screen
voting seems to have been adopted more quickly in counties with more Hispanics (particularly in
swing states) may point to systematic effort to influence election outcomes, though regardless of
intention the overall effect on election outcome was small.
2. The Relationship Between Voting Technology and Presidential Elections Outcomes
In this section we begin by describing our main data sources and presenting an overview of
trends in county-level vote shares in the presidential elections since 1992. We then present four sets
of empirical results. First, we show some simple difference-in-difference and “triple differenced”
estimates, where we compare the 2000-2004 change in the two-party Republican vote share
between counties with and without touch-screen voting, and these changes relative to the trends
between the 1996 and 2000 elections. We then present estimates from regression models where the
2000-2004 change in the two-party Republican vote share is regressed on an indicator for touch-
screen voting technology and a rich set of covariates. Third, we present models where touch-screen
voting is interacted with a number of state or county characteristics that might be expected to be
associated with irregularities. These models with interactions provide our most direct test of
possible voting irregularities. Finally, we present models where the dependent variable is voter
registration.

5
2.1 Summary Statistics
We begin in Table 1 by showing means for some key variables in counties that are classified
by whether or not they used direct recording electronic (DRE) technology in the 2004 presidential
election. Our use of counties as a unit of analysis is dictated by the fact that in most states, voting
technology is selected by officials at the county level, and is homogeneous within counties.12 Data
on voting technology for the 2004 election were obtained from ElectionOnLine.com. We validated
these data for all swing states and several other states using information collected directly from the
Secretaries of State. We also compared the data with information provided by Election Data
Service. We found relatively few discrepancies between the three data sources. Similar data for the
2000 presidential election were purchased from Touch-screen Voting Technology, and corrected
using information generously provided by Stephen Ansolabehere.13 County data on religious
adherents are from Jones et al. (2002). The remaining data on county characteristics are from the
2000 Census of Population.
The top panel of Table 1 shows the prevalence of different voting technologies. Just over
20% of US counties used DRE technology in the most recent election. When we weight by county
population (in the right-hand set of columns), this fraction increases to 27%, indicating that larger
counties are more likely to adopt DRE. The difference in county size is illustrated directly in the
second last row of the table, which shows that counties with DRE voting had an average population
of about 119,000 in 2000 compared to an average population of 82,000 in non-DRE counties.
The other rows of the top panel in Table 1 show the prevalence of other voting technologies,
including optical scanning technology (used by the 48% of counties), paper ballots (10.5% of
counties), lever voting machines (7.3% of counties) and punch cards (10.5% of counties). Finally,
we show the rates of use of DRE technology in the 2000 election. Between the 2000 and 2004
elections the fraction of counties using DRE roughly doubled. Interestingly, a small number of
counties (116) used DRE in 2000 and not in 2004. (These are the 4.7% of counties in the DRE=0
column that used DRE in 2000).
The next set of panels show election outcomes from the past four presidential elections.
Consistent with the electoral outcomes, the Republican vote share – whether expressed as a fraction
of the two-party vote or as a fraction of all votes case – has risen in recent elections, though the
12 In 8 states – Connecticut, Maine, Massachusetts, Michigan, New Hampshire, New York, Vermont, and Wisconsin – choice of technology is made at a lower level – typically at the township level. Of the 281 counties in these states, 166 had the same voting technology throughout the county in 2004. Thus, there are only 115 counties with multiple technologies. We were able to obtain sub-county data on technology choices for 5 of these counties and use the fraction of townships with DRE technology (instead of an indicator of DRE choice) as a measure in these counties.

6
gains are overstated by looking at the unweighted county tabulations, since smaller (mainly rural)
counties have become more Republican than larger counties. Comparisons of trends by DRE status
point to two key facts. The first is that longer-run trends in vote shares are slightly different in
counties that used DRE technology in 2004 and those that did not. For example, the unweighted
average Republican share of the two-party vote rose by 7.6 percentage points between 1992 and
2000 in counties that used DRE in 2004, versus 8.7 percentage points in counties that did not. A
second fact is that estimated trends in vote shares are sensitive to whether county-level outcomes
are weighted by population. Looking again at the 1992-2000 change in the Republican share of the
two-party vote, the gain was only 1.6 percentage points using population-weighted vote shares in
DRE counties, versus 2.6 percentage points in the non-DRE counties. Interestingly, however, the
relative trends between 1992 and 2000 in DRE and non-DRE counties are about the same using
weighted or unweighted vote tallies.
The lower panels of Table 1 present means of some county level characteristics that may be
correlated with electoral outcomes. DRE technology is more likely to be used in counties with a
higher fraction of black residents, and also in counties with higher income and a lower fraction of
religious adherents. The fractions of Hispanic residents, residents with a college degree, and
residents employed by the military are also somewhat different in DRE and non-DRE counties,
though the direction of the gaps depends on whether the data are weighted or unweighted. Most
striking are the regional differences in the adoption of DRE technology. Southern counties are
disproportionately represented among DRE adopters, accounting for 78% of counties using DRE in
the 2004 election versus 38% of counties using other technologies.
2.2 Graphical Analysis and Difference in Difference Estimates
We now turn to the relationship between use of DRE technology in the 2004 election and
the change in the Republican share of the 2-party vote between 2000 and 2004. Figure 1 plots the
2004 Republican share of the 2-party vote in a given county against the same measure in the 2000
election, using circles for counties that had DRE technology in 2004 and dots for counties that did
not, and varying the sizes of the symbols to indicate the relative sizes of the different counties
(based on 2000 population). While many points in the figure fall very close to the 45 degree line –
indicating little change in the Republican share – there are many counties above and below the line.
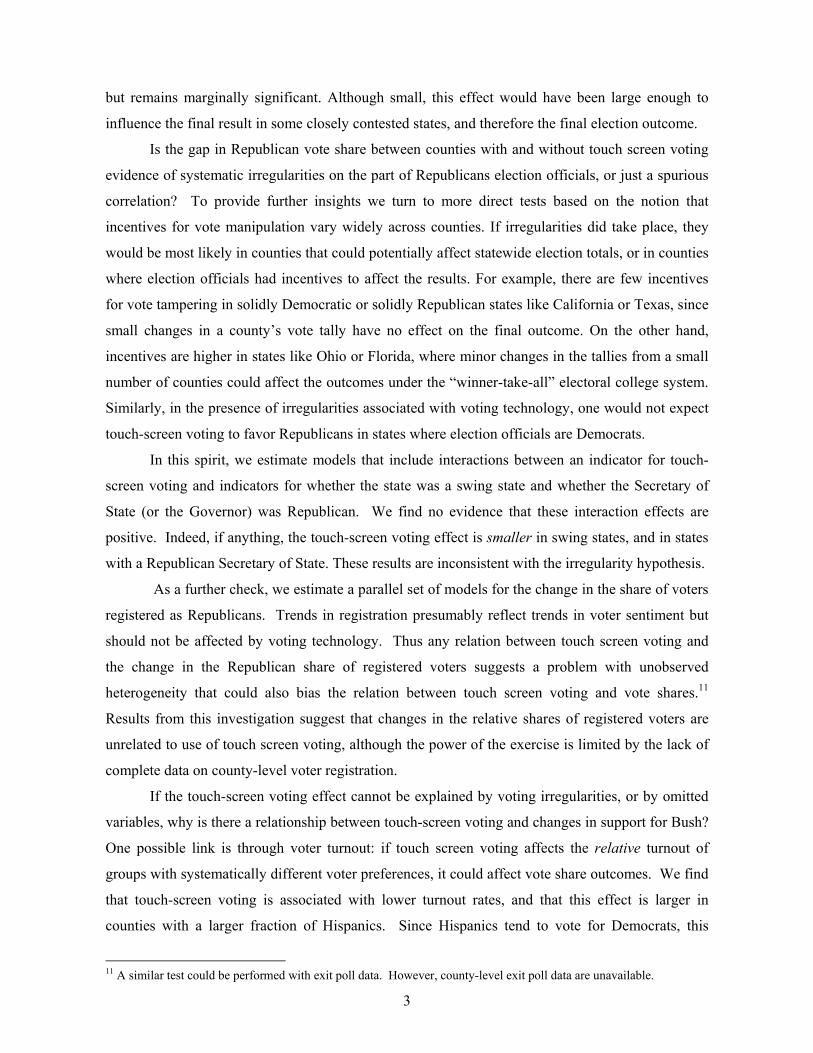
Figures 3-6 show similar plots for some of the main swing states, again using different plot
symbols for DRE and non-DRE counties with scaling to represent the relative populations of
different counties. In Florida there are two large and heavily Democrat counties – Palm Beach and
13 There is some controversy over the reliability of the 2000 technology data – see Brady et al. (2001). Unfortunately,

7
Broward Counties – where the Republican vote share is noticeably higher than what one would
have predicted based on the 2000 share. Both counties used DRE voting in the 2004 election.
Variants of this figure were noted in Hout et al. (2004) and have been widely cited as informal
evidence of a “problem” with touch-screen voting. Data for 7 other swing states with sizeable
numbers of DRE and non-DRE counties (Ohio, Iowa, and New Mexico, Pennsylvania, Wisconsin,
Michigan, and Minnesota) show little or no evidence of a connection between DRE voting and the
change in the Republican vote share. Below, we present some statistical tests aimed at determining
whether DRE adoption had an effect on voting outcomes for the major swing states.
Across all counties in the US, the gain the Republican share of the two-party vote between
2000 and 2004 was larger in counties that used touch-screen voting in 2004 than in other counties.
As shown by the entries in Table 1, the gain was 3.2 percentage points (standard error = 0.2) in
DRE counties versus 1.8 percentage points (standard error=0.07) in non-DRE counties. The
difference in the change in vote shares between DRE and non-DRE counties is illustrated in Figure
2, which plots the histograms for the two groups of counties. The distribution in the DRE counties
appears to be shifted to the right.
A potential problem with the simple comparisons in Figures 1-6 is that counties that adopted
DRE may have had pre-existing trends in voting sentiment that differ from the trends in non-DRE
counties. A standard method for controlling for such trends is to difference the change in the vote
share between 2000 and 2004 from the change between 1996 and 2000. To the extent that county-
specific underlying trend factors tend to persist over time, a comparison of the change in trends
between DRE and non-DRE counties (a “difference-in-difference-in-differences” approach) will
lead to valid inferences about the true effect of touch-screen voting.
Table 2 summarizes the results from this exercise. The entries in column 2 of the top panel
of Table 2 indicate that counties with touch-screen voting in 2004 experienced a 3.18 percentage
point average increase in the Republican share of the two-party vote, and a 4.01 percentage point
gain in the Republican share of all votes. The corresponding gains for counties without touch-
screen voting were 1.79 and 3.22 percentage points (column 3). Thus the difference-in-differences
is 1.39 percentage points, using the Republican share of the two-party vote (column 4), or 0.79
percentage points (using the overall Republican share). The relative gains for Republicans are
substantially smaller using population-weighted averages (in the four right hand columns of Table
2), and are insignificantly different from 0. Consistent with the existence of county-specific trends,
however, the data in the middle panel in Table 2 suggest that counties that used DRE technology in
2004 experienced a decline in support for Republican candidates between 1996 and 2000, relative
we were unable to obtain corrections made by Brady et al.

8
to counties that used other technologies. Interestingly, the magnitude of the 1996-2000 relative
trend is quite similar whether the Republican share is taken over all votes, or only the votes cast for
the two major parties, and whether the individual county vote shares are weighted or not.
The bottom panel shows the difference-in-differences within each of the county subgroups,
obtained by subtracting the 1996-2000 difference from the 2000-2004 difference, as well as the
“triple-differenced” comparisons. Using the two-party vote share the estimated contrast between
DRE and non-DRE counties is 2.71 percentage points (standard error = 0.26) or 1.35 percentage
points (standard error=0.19), depending on whether we weight or we do not weight by population.
Using the overall Republican vote share the relative contrasts are similar.
The “triple differenced” comparisons in Table 2 suggest that relative to longer run trends,
the adoption of DRE voting by a county in the 2004 election was associated with a 1.2-2.7
percentage point increase in votes for the Republican candidate. The estimates are relatively
precise (standard errors in the range of 0.2 to 0.3 percentage points) and highly statistically
significant.
Nevertheless, the interpretation of these estimates is not unambiguous. On the one hand,
this finding is consistent with concerns raised by some Democrats that the adoption of touch-screen
voting helps Republicans. If voting technology is unbiased, we would not expect to observe a
systematic relationship between election outcomes and voting technology, holding other factors
constant. This interpretation is particularly troublesome because the magnitude of the estimated
coefficient is large enough to influence the final result in Ohio and possibly other contested states,
thus affecting the final election outcome.
On the other hand, it is possible that other things are not held constant, and that the adoption
of touch-screen voting is correlated with other determinants of electoral outcomes that are not fully
accounted for by earlier vote trends in the county. Alternatively, it is possible that county-level
trends in vote shares are mean-regressive, rather than fully persistent, so that triple-differencing
“over-controls” for the 1996-2000 trends. This can be addressed by including lagged vote shares as
regressors in a model for the change in vote shares between 1996 and 2000, rather than assuming
that the lagged changes enter with a coefficient of 1.0, as is implicit in the triple-differencing
approach.
2.3 Econometric Specifications.
To try to shed more light on this issue, we now turn to a more formal econometric analysis.
We begin by estimating variants of the following model

9
(1) ∆Vcs = β1 DREcs2004 + β2 Vcs2000 + β3 Vcs1996 + β4 Vcs1992
+ β5 Tcs2000 + β6 Tcs1996 + β7 Tcs1992 + β8 Xcs + ds + ecs
where ∆Vcs is the 2000-2004 change in the Republican 2-party vote share in county c in state s,
DREcs2004 is an indicator for whether county c used touch-screen voting in 2004; Vcst is the 2-party
vote share in county c in year t (t=2000, 1996, or 1992); Tcst is the third party vote share in county c
in year t; Xcs is a vector of county characteristics that might affect electoral outcomes (including
percent in the military, percent who are religion adherents, percent blacks, percent Hispanics,
median income, percent college graduates, percent in agriculture, and county population), and ds is
a vector of state dummies.
By focusing on the change in the Republican vote share, we are differencing out all
permanent differences across counties in voter sentiment. By controlling for state effects, we
absorb any unobserved state-specific shocks that might have affected the 2000-2004 change in vote
shares in that state. Identification of the DRE effect in model (1) comes from the fact that in many
states there is county-level variation in voting technology. Specifically, identification comes from
variation across counties in the subset of 23 states that have both DRE and non-DRE voting
technologies.14 By including lagged Republican and third party vote shares, we control for pre-
existing county-specific trends in voter sentiment that might be correlated with use of touch-screen
voting. Finally, by adding the covariates we hope to account for county-specific economic and
cultural factors that could affect the rate of change in voter sentiment and might also be correlated
with technology adoption. We have also fit all of our models using as a dependent variable the
change in the Republican vote share (rather than the Republican share of the 2-party vote) and
found results that are quite similar to the ones that we report here.
An implicit assumption in model (1) is that the only voting technology that matters is touch-
screen voting. Other possible technology choices (optical scanning, punch cards, level voting
machines, and paper ballots) are combined together as the omitted reference group. Given the
controversy over touch-screen voting we believe this specification is reasonable. It also simplifies
the interpretation of our results, since otherwise one has to specify which of the voting technologies
is used as the baseline for comparing the enumerated choices. Our models identify the effect of
touch-screen voting relative to an average of the other technologies.
14 A total of 5 states used only touch screen voting in 2004 (Delaware, Georgia, Maryland, Nevada). Another 20 states and the District of Columbia had no counties with DRE voting. Two states (New York and Wisconsin) with township-level choice of voting technology had some counties with partial use of DRE, but no counties with full DRE adoption. We have no data on Alaska.

10
Another specification issue in model (1) is the potential effect of touch-screen voting in the
2000 election. Just over a third of counties with DRE in 2004 also used touch-screen voting in
2000. It is unclear whether one should assume that touch screen voting had no effect in the 2000
election, or had the same effect as in 2004. Thus, we estimate a second model where we include
both an indicator for DRE in 2004 and an indicator for DRE in 2000:
(2) ∆Vcs = β1 DREcs2004 + β2 DREcs2000 + β3 Vcs2000 + β4 Vcs1996 + β5 Vcs1992
+ β6 Tcs2000 + β7 Tcs1996 + β8 Tcs1992 + β9 Xcs + ds + ecs
This model encompasses the two possibilities that touch screen voting had no effect in 2000 (β2=0)
or that it had the same effect in both 2000 and 2004, implying an equal and opposite effect of the
DRE indicators for the two years on the change in vote shares (i.e., β2=-β1). When we present
estimates of equation 2, we also test whether β2=-β1.
A final specification issue is that equations 1 and 2 implicitly restrict the effect of touch-
screen voting to be the same across all counties. For a number of reasons this may be an
inappropriate restriction. In particular, if one is concerned about voting irregularities associated
with the adoption of DRE, it is implausible that these irregularities occurred in every county. If
there were such manipulations, we should see them only where they could have made a difference
for the overall election outcome, or in states where elections officials had an incentive and the
opportunity to favor one candidate.
To test this possibility, we estimate models that include interactions of the change in the use
of DRE with state or county characteristics that one would expect to be associated with an increase
the chances of frauds in favor of Republicans:
(3) ∆Vcs = β1 ∆DREcs + β2 ∆DREcs * Zcs + β3 Zcs + β4 Vcs2000 + β5 Vcs1996 + β6 Vcs1992
+ β7 Tcs2000 + β8 Tcs1996 + β9 Tcs1992 + β10 Xcs + ds + ecs
where ∆DREcs is the 2000-2004 change in DRE status and Z is an interaction term. To keep the
specification parsimonious, models with interactions restrict the coefficient on DRE in 2000 and the
coefficient on DRE in 2004 to be the same, with opposite sign. We experiment with many different
interaction terms including: the Republican vote share in 2000; the party affiliation of the governor
or the Secretary of State; whether the state is a swing state; whether the governor is Republican and
the state is a swing state (triple interaction); county population; county income; percent black in the

11
county; percent black in the county interacted with whether the state is a swing state (triple
interaction); percent Hispanic; percent college graduates; and indicators for selected swing states.
2.4 Results.
a. Basic Models
Table 3 present estimates of a number of variants of equation 1. All the models are
estimated by weighted least squares, using as a weight the county’s population in 2000.15 The
model in column 1 regresses the 2000-2004 change in the Republican 2-party vote share on a single
indicator for use of touch-screen voting in 2004. This model yields an estimate that is the same as
the “difference-of-differences” estimate in the top panel of Table 2. As we have noted, the
interpretation of this estimate is potentially problematic. For example, counties in the South were
more rapid adopters of DRE. At the same time, it is possible that Republican party support has
been growing more rapidly in the South than in other regions, leading to a spurious correlation
between DRE and the change in the Republican vote share.
To address this concern, the model in column 2 adds a set of state dummies, which control
for any factors that are common across counties in the same state. The addition of the state effects
reduces the measured effect of DRE, to a negative effect.16 To control for heterogeneity in the
longer-run trends in voter sentiment across counties, the model in column 3 adds the 1992-2000
values of the Republican vote share and the third party vote share in each county. These lagged
vote outcomes – particularly the third-party vote share measures – are very strong predictors of the
changes in Republican support between 2000 and 2004. Interestingly, the addition of these factors
leads to a positive DRE coefficient.
Finally, in column 4 we present our most complete specification, which includes the lagged
vote share variables, state effects, and a total of 8 other county-level control variables, all measured
in 2000: percent black, percent Hispanic, percent with a college degree, percent in the military,
percent religious adherents, percent working in agriculture, mean personal income, and county
population. The addition of the extra controls leads to a small increase in the estimated size of the
DRE coefficient. The estimated DRE effect implies that use of touch-screen technology was
associated with a 0.21 percentage point higher Republican share of the 2-party vote. The estimate is
statistically significant at conventional levels (t=2.1). Estimates from an unweighted model yield a
slightly larger coefficient: 0.28. It is interesting to note that the regression models with unrestricted
coefficients on the lagged vote shares lead to estimated DRE effects that are closer in magnitude to
15 Unweighted models are generally similar. 16 If we add region effects (for 3 of the 4 regions of the country) rather than state effects the weighed estimate falls to 0.02 percentage points.

12
the simple “difference-in-differences” estimates in Table 2 than to the “triple differenced”
estimates. Examination of the coefficients associated with the lagged vote shares suggests that
contrary to the “persistent trends” assumption of a triple-differenced comparison, the regression
estimates show much smaller effects of the lagged Republican vote share variables on future
changes.
Table 4 presents estimates of equation 2, in which we include indicators for use of DRE
voting in both the 2000 and 2004 elections. In general, the coefficients associated with use of
touch-screen voting in 2004 are similar to the ones in Table 1, while the coefficients associated with
touch-screen voting in 2000 are negative. In most cases, we cannot reject that the effects in 2000
and 2004 are “equal and opposite”(i.e., that β1 = -β2). In column 4, where all the controls are
included, the coefficient on DRE in 2004 and 2000 are, respectively, 0.21 percentage points and
0.00 percentage points, but the p-value for the test of equal and opposite coefficients is 0.43.
b. Models with Interactions
Like the models in Table 3, the most fully parameterized models in Table 4 suggest that use of
touch-screen voting is associated with a gain the Republican vote share on the order of 0.2
percentage points. While this is consistent with the allegations of voting irregularities raised by
Democrats during and after the election, the interpretation is unclear because DRE status is not
randomly assigned. To better understand the sources of this effect we turn to models that include
interactions of the change in the DRE indicator with a variety of state and county-level
characteristics. Each row of Table 5 presents an alternative version of equation 3 in which we have
included our full set of control variables, the change in use of DRE voting, and the interaction of the
change in DRE voting with the variable identified in the row heading.17 We use the change in DRE
status, as opposed to DRE status in 2000 and in 2004, for ease of interpretation and because the
tests in Table 4 suggest that in the more general models we cannot reject the differenced
specification.
Inspection of the estimates in column 2 of Table 5 suggests that most of interaction terms
are either zero or negative. For example, the coefficient of the interaction with Republican
Secretary of State is -0.21 percentage points, while the interaction with a Republican governor is
0.23. Neither estimate is statistically different from zero. Similarly, the coefficient of the
interaction between change in DRE and swing state status is -0.62 percentage points. The
coefficient on the triple interaction between change in DRE, Republican governor, and swing state
is also significantly negative. These findings are inconsistent with the hypothesis that touch-screen

13
voting was manipulated by Republican election officials in order to tip the 2004 election in favor of
George Bush.
We also report the interactions between the change in DRE status and various county
characteristics, including county population, county income, the fractions of black and Hispanics in
the county, and the percent of county residents with a college degree. Interestingly, there is no
evidence that the DRE voting effect is larger (or smaller) in counties with more black or Hispanic
residents or college graduates. The interaction with county population is positive, but the interaction
with population* swing state is insignificant.
In the last four rows of the Table, we focus on interactions of the change in DRE voting with
selected swing states. Although we have shown that the effect of DRE is on average negative
when all swing states are considered, it is possible that the effect is different in individual states.
Overall, however, the results for the four selected states confirm the picture from our pooled
national samples. In the case of Florida, for example the estimated interaction coefficient is -0.52
percentage points (standard error=0.33 points). Contrary to the impression conveyed by the data in
Figure 3, a richer model of voting outcomes suggests that Florida counties using touch-screen
voting did not experience larger gains for Bush than non-DRE counties, on average. The
interactions effects for Ohio, Iowa and New Mexico are likewise negative or zero.
To summarize, we find that use of touch-screen voting in a county is associated with a small
gain in the Republican vote share in the 2004 election. The precise magnitude of the gain is
sensitive to which specific model is adopted, but the estimated effect is significant in our richest
specifications which control for state effects, lagged vote shares, and various county-level
characteristics. On closer inspection, however, we find virtually no indication that the gain arose in
counties or states where one could argue that election officials had the greatest incentive to tip the
election in favor of Republicans. Thus, we conclude that it is implausible that the positive
association between DRE voting and the Republican vote share reflects direct manipulation of DRE
machines by Republican officials.
c. Voter Registration
As an further check for the potential influence of unobserved trends in voter sentiment
across counties that happen to be correlated with the adoption of DRE voting, we estimated a series
of models for trends in county-level voter registration. Changes in the fraction of voters registered
as Republicans presumably reflect the same forces that influence trends in vote shares. However,
voter registration patterns are unlikely to be affected by choice of voting technology. Thus, a test
17 Note that the “main effects” of any of the state-level variables used as interactions are absorbed by the state effects

14
for the effect of touch-screen voting on the relative fraction of voters registered as Republicans
provides a specification test of our basic regression framework. In particular, the finding of a
positive effect of touch screen voting on the Republican share of registered voters would suggest a
spurious correlation between underlying voter preferences and technology choice that could also
confound our vote share models.
We collected the data on registration by contacting the secretary of state of each state. A
limitation of these data is that not all the states provided data on registration by party. We have only
been able to assemble 2004 voter registration data by party for a subset of 1123 counties (36% of
our main sample). The number of counties with 2000 and 2004 registration data is even lower
(only 478, or 15% of our main sample).
The regression models in Table 6 take as a dependent variable the fraction of voters
registered as Republicans in a county in 2004, or the change in the Republican share of registered
voters between 2000 and 2004. For simplicity, we present only our richest specifications, which
include state effects, lagged vote shares, and county-level characteristics. The model for the
Republican share of registered voters in 2004 (column 1) shows a positive correlation between use
of touch-screen voting and the share of voters registered as Republicans. In the differenced
specification (column 2), however, the DRE effect drops virtually to zero. Since our vote share
models use the change in vote shares as a dependent variable, we interpret the results in Table 6 as
supportive of our basic framework.
We also fit a set of models similar to the ones in Tables 3 and 4, but taking as a dependent
variable the difference between the change in Republican vote share and the corresponding change
in the Republican share of registered voters in a county. By deviating the vote share from the share
of registered voters, these models potentially eliminate many of the unobserved components of
voter sentiment that could confound the estimated effects of touch-screen voting.18 Unfortunately,
the lack of complete data on voter registration rates presents a problem for this exercise, since
“baseline” models similar to the ones in Table 3 or 4 but restricted to the sub-sample of counties
with 2000 and 2004 voter registration data give rise to estimated DRE effects that are somewhat
different from the estimates over the full sample of counties. Nevertheless, models for the change
in the vote share relative to the change in the Republican share of registered voters show a positive
and marginally significant effect of DRE use in 2000 on the change in the Republican vote share
relative to the change in the Republican share of registered voters between 2000 and 2004.
included in the model. 18 Voters may not necessarily switch their party of registration, even when they have firmly realigned their election preferences. Thus, the level or trend in voter registration is at best only a partial control for voter sentiment.

15
(Estimates available on request.) Given the limitation of the registration data, however, it is difficult
to draw strong conclusions from these estimates.
3. Models of Turnout and DRE Adoption
a. Overview
So far we have focused on the effect of voting technology on the share of Republican votes,
effectively conditioning on the sample of citizens who go to the polls and whose vote is recorded as
valid. We have shown that there is a small positive effect of touch-screen voting technology on the
level of electoral support for George W. Bush. Looking at models that interact the use of DRE with
county-level characteristics, however, we conclude that this finding is unlikely to be explained by
systematic voting irregularities on the part of Republican election officials. If the DRE effect
cannot be explained by voting irregularities, why is there a relationship between DRE and changes
in support for Bush? Part of the explanation may be a spurious correlation between underlying
trends in voter preferences and choice of voting technology, although our results on voter
registration seem to suggest that this effect may be limited. Another, potentially more interesting,
explanation is that the adoption of new voting technology may affect the mix of voters at the polls,
or the mix of voters whose vote is counted as a valid vote.
In this section we investigate whether voting technology has a differential impact on the
turnout rates of different subgroups. If certain subgroups of voters---for example, minorities---are
more or less likely to turn out when balloting is conducted with touch screen machinery, or if their
vote is more or less likely to be counted as valid, there could be an effect on election outcomes. We
also try to assess whether there is evidence of any systematic effort to affect election outcomes
through this channel. Specifically, we test whether the adoption of touch screen voting technology
is higher (or lower) in counties that have more minorities.
What are the channels that would lead the adoption of touch screen voting technology to
affect voter turn out rates of some subgroups? First, it is possible that electronic machines are
perceived as confusing or intimidating by subgroups that have limited familiarity with computers
and ATM machines, or have limited English proficiency. Second, some minorities, especially
African-American, may be particularly suspicious of this new controversial technology, given the
many allegations surrounding DRE technology and the many historical episodes of
disenfranchisement of African-American voters. Third it is possible that the probability of making
mistakes while voting is affected by the technology. Although proponents of electronic voting argue
that it should increase the overall fraction of valid votes, it is possible that the opposite is true for

16
some sub-groups. 19 In the presence of language or cultural barriers, electronic voting may in fact
result in fewer valid votes. In our empirical analysis, we define turn-out broadly, as the ratio of
valid votes cast on county population. Our measured effect of DRE on turn-out therefore includes
both the effect on the number of voters who go to the polls (if any), and the effect on the number of
votes that are counted as invalid (if any). Because we do not have data on number of invalid votes
by county, we can not separate these two margins.
In order to better understand how voting technology may affect electoral outcomes through
its effect on turn out, consider the following simple model. Let V=number of voters in county.
Then
V = Vm + Vo ,
where “m” denotes a particular subgroup of voters whose turn out may be affected by the new
technology (for example, minority voters) and “o” denotes others. Denote Vm/V = gm, the share of
minorities among all voters. If S is the Republican share of votes in a county, and Sm and So are
the vote shares for the two groups, then
S = Sm Vm + So Vo = So + gm (Sm - So) .
A “mechanical” effect of relative turnout on voting outcomes arises if minorities (or some
other group whose turnout is differentially affected by voting technology) tend to vote differently
than other voters (i.e., if Sm…So) If minorities are less likely to vote Republican, for example,
anything that reduces the relative share of minority voters increases the Republican vote share. We
note that there may be another effect too, if the voters who are on the margin of turning out have
different preferences than other voters in the same group. For simplicity we will ignore this
possibility.
Let tm and to denote the turnout rates of minority and non-minority voters, and let fm denote
the fraction of minorities in the voter-eligible population. It is easy to show that
gm = fm + fm × (1- fm ) × (tm !to)/t
where t is the average turnout rate. Finally, note that
19 Indeed, the CalTech/MIT Voting Technology Project (2001) found that DRE voting has about the same error rates as

17
t = fm tm + (1- fm ) to = to + fm (tm - to).
Suppose that voter turnout rates of the two groups are related to a set of county-level covariates X
by a pair of linear regression models of the form: to = ao+ b0X and tm = am+ bmX., where X
includes an indicator for DRE voting. Then the implied regression model for overall turnout is:
t = ao + (am- ao)fm + (bm- bo) fm X + e,
where e represents a residual term. The coefficient on the interaction term fm X in this model
identifies the relative effect of X on the turnout rates of minority and non-minority voters.
Combining the previous results, the “mechanical” effect of X on the Republican vote share in a
county can be written as:
(4) MS/MX = (Sm - So) × fm (1- fm )/t × (bm- bo) .
The first term on the right hand side represents the gap in mean voter preference between the two
groups (i.e., MS/Mgm). The wider is this gap, the larger the impact of any relative turnout effect on
vote shares. The second term is the derivative of the fraction minority voters with respect to the
relative turnout rate of minorities and non-minorities (i.e., Mgm/M(tm!to) ). This mainly reflects the
relative size of the affected group in the population of potential voters (fm). The third term is the
interaction effect between the fraction of minorities and the variable X in the model for voter
turnout (i.e., M(tm!to)/MX) The larger is this effect, the more the variable X affects the relative
turnout of the affected group, and the larger is the potential effect of X on the vote share.
b. Estimates of the Effect of Touch-Screen Voting on Voter Turnout
Table 7 presents a set of models in which the dependent variable is either a measure of voter
turnout in a county in the 2004 election, or the change in the measure between 2000 and 2004.20
For simplicity, we present only our richest specifications, which include state effects, lagged vote
shares, and county-level controls. Note first that the level of turnout is negatively correlated with
use of DRE, with the estimate implying a 1.4 percentage point reduction in turnout in counties that
used DRE in 2004 (column 1). The corresponding estimate from an unweighted model is -1.23
other technologies. 20 We define turnout as the ratio between the total number of valid votes counted and county population. Ideally, turnout should be defined as the ratio of the number of votes cast to the size of the eligible population. By dividing by

18
(0.44). A potential limitation of this cross-sectional estimate is that it may fail to control for
unobserved county-level factors that could affect turnout (such as the age structure of the
population, or the fraction of non-citizen immigrants).
In the model that regresses the change in turnout on the change in DRE use, we also find a
negative and significant effect of DRE use in the weighted model (column 2). This estimate
therefore suggests that adoption of touch screen voting leads to a decline in voter turnout. The effect
is of moderate size. It indicates that turnout in counties that have adopted DRE in 2004 is about 0.7
percentage points lower than in observationally similar counties that have not adopted.
A possible interpretation of this estimate is that the introduction of touch-screen voting
machine reduces participation among some group of voters. We are particularly interested in the
effect for minorities. We therefore estimate a model for the change in voter turnout that includes the
change in DRE status, and its interaction with the fraction of Blacks or Hispanics in the county, as
well as the main effects. As shown in column 3 of Table 7, we find no significant interactions with
the fraction of blacks in a county, but the interaction with the fraction of Hispanics is negative and
significant: -0.04. This effect implies that the turnout rate is reduced by 0.04 percentage points
more by the presence of DRE voting technology in a county where 10% of the population is
Hispanic than in a county where there are no Hispanics. One possible interpretation is that the
introduction of DRE reduces Hispanic participation in presidential elections because it intimidates
potential Hispanic voters or because potential Hispanic voters distrust it. Another interpretation is
that DRE voting reduces the number of valid votes because of limited English proficiency or other
cultural barrier that make it difficult for Hispanics to deal with ATM style machines.21
To sum up: we find that DRE adoption is associated with lower turn out rates, particularly in
counties with a large share of Hispanics. Since Hispanic voters tend to favor Democrats this
interaction effect is potentially important. In particular, exit poll data indicate that in 2004 55%
Hispanic voters supported Kerry, and 45% supported Bush.22 Florida is an exception. Presumably
because of the Cuban vote, exit poll data suggest that Florida Hispanics voted 56% in favor of
Bush. How large is the potential turnout effect on election outcomes? We can use equation (4) to
obtain an approximate answer. Taking the national exit poll estimate of (Sh - So) = -0.10, and
the total population we ignore differences across counties in the fraction of people under the age of 18, and in the fraction of those 18 and older who are ineligible (McDonald and Popkin, 2001). 21 We have also estimated models that include a triple interaction of change in DRE, percent Hispanic and an indicator for swing states, as well as controls for all the pairwise interactions (change in DRE*Hispanic, change in DRE*swing state, swing state*Hispanic). The coefficient on change in DRE*Hispanic does not change very much: -0.037 (0.009), confirming that the negative effect of DRE on turnout is larger for more Hispanic counties. The coefficient on the triple interaction is -.045 (0.036), possibly suggesting that the larger negative effect of the DRE on turnout for more Hispanic counties is magnified in swing states, although the coefficient is not statistically significant.

19
assuming the fraction of Hispanics in the potential voting pool is 6%, and the average turnout rate is
70%, we have to multiply the interaction term by -0.008 to get an implied effect on vote shares.
Based on the estimates in Table 7, the effect on Republican vote share is likely to be very small: on
the order of 0.00032 (= -0.008 × -0.04) or 0.03 percent. If we compare this number with the
coefficient in column 4 of Table 3 (0.21) we conclude that the turnout mechanism can explain only
about 14% (0.03/0.21 = .14) of the overall effect of touch screen voting on the Republican vote
share.
c . Is DRE More Likely to Be Adopted in Counties with More Minorities?
In the previous subsection, we have shown that touch screen voting is associated with lower
turn out rates, particularly in counties with a large share of Hispanics. Given that Hispanics tend to
vote Democrat, the obvious next question is whether there is evidence that this relationship might
have been used strategically to favor the Republican candidate. Specifically, in this subsection we
look at models in which DRE adoption is the dependent variable. The models include the fraction of
Hispanics in a county, interactions of the fraction of Hispanics with indicators for whether the state
was a swing state in 2000, and whether the state governor is Republican, as well as all the other
controls. The idea is that if DRE adoption between 2000 and 2004 was used strategically to help the
Republican candidate, we should see four features in the data. First, we should see that DRE
adoption is more likely in counties with more Hispanics, everything else constant. Second, we
should see that the association between the fraction of Hispanics and DRE adoption is stronger in
states that were swing states in 2000. Third, we should see that the association between the fraction
of Hispanics and DRE adoption is also stronger in states that were controlled by Republicans in
2000. Finally, we should find little relationship between DRE adoption and fraction of Hispanics in
Florida, since Hispanics in Florida are more likely to vote for Republican candidates.
Table 8 presents estimates from models where the dependent variable is the 2000-2004
change in use of DRE technology. All the usual controls are included, although we report only the
coefficients for Hispanics and Blacks. Models with interactions include all main effects. The
estimates in columns 1 and 4 suggest that DRE adoption is higher the higher the fraction of
Hispanics in a county. The coefficient for blacks is not different from zero.
Obviously, we do not know whether the correlation between percent Hispanic and DRE
adoption is accidental or reflects strategic behavior on the part of election officials. But the models
in columns 2 and 5 indicate that when fraction Hispanic is interacted with a dummy for whether the
22 National and state-level exit poll data are reported at http://www.cnn.com/ELECTION/2004/pages/results/states/US/P/00/epolls.0.html. This source also provides estimates of the share of different demographic groups in the pool of voters.

20
state was a swing state in 2000, the coefficient is positive and statistically significant. In column 5,
for example, the Hispanic main effect is 0.21, while the coefficient on the interaction between
Hispanic and swing state is 0.92. This means that for counties located in swing states, the relation
between Hispanics and DRE is 4-5 times larger than for counties not located in swing states. This
finding would appear to be consistent with the notion that touch screen voting was systematically
adopted to reduce swing states voter turn-out rates of a minority that is more likely to vote
democrat.
On the other hand, the results in columns 3 and 6 indicate that the relationship between
minorities and DRE adoption was not systematically stronger in states controlled by Republican
governors. Moreover, when we look at the triple interaction between Hispanic, swing state status
and Republican governor (not in the table), we find an insignificant positive effect (0.27, with a
standard error of 0.65) in our preferred model with state effects. Finally, when we look at Florida,
we find that the coefficient on Hispanic is not statistically significant from zero, although the
standard error is relatively large (0.77) reflecting the modest number of counties in the state.
Overall, we draw three conclusions. First, DRE adoption is significantly negatively related
to turnout rates, with an effect that is larger in counties with a larger share of Hispanic residents.
Second, the net effect on electoral outcomes is small. Our analysis suggests that the relative effect
on Hispanic turnout explains at most a 0.03 percentage point increase in the Republican vote share,
or about 14% of the overall difference in Republican vote shares between DRE and non-DRE
counties. Third, DRE adoption appears to have been more likely in counties with a larger share of
Hispanic residents, particularly in swing states, although not in states controlled by a Republican
governor. Thus, evidence for the hypothesis of strategic DRE adoption is mixed.
4. Conclusions
Touch-screen voting has attracted an enormous amount of attention and controversy.
Numerous allegations have been raised on the reliability of touch-screen voting equipment and the
possibility of vote tampering. The distrust in electronic voting is widespread among the public, the
mainstream press, the Congress, and is substantiated by peer-reviewed academic studies. If
controversy about voting technology continues, one potential consequence may be a further
deepening of the public distrust in the electoral and democratic system.
While there have been many allegations of specific instances of irregularities, there has been
surprisingly little systematic empirical evidence on voting irregularities associated with changes in
voting technology. In this paper, we use county level data on voting technology and election
outcomes in the 2000 and 2004 Presidential elections to try to determine whether there is evidence

21
of systematic voting manipulations associated with electronic voting. Our results suggest that
electronic voting has a small effect on election outcomes, but that the mechanism is not illegal vote
manipulation.
We first show that there is a small positive correlation between adoption of touch-screen
voting technology and the level of electoral support for George Bush. In particular, we find that
between 2000 and 2004, the Republican vote share increased more in counties that adopted touch-
screen voting than in counties that did not. Although small, this effect would have been large
enough to influence the final result in some closely contested states (for example, Ohio), and
therefore the final election outcome.
On the surface this finding would appear to be consistent with some of the allegations of
voting irregularities associated with touch-screen voting technology that were raised at the time of
the 2004 elections. However, a closer examination of the evidence suggests that this interpretation
is implausible. If irregularities did take place, they would be most likely in counties that could
potentially affect statewide election totals, or in counties where election officials had incentives to
affect the results. To test this prediction, we fit a series of models that include indicators for use of
touch screen technology and the interaction of these indicators with indicators for whether the state
was a swing state, or whether the Secretary of State (or the Governor) was Republican. We find no
evidence that these interaction effects are positive. Indeed, if anything, the touch-screen voting
effect is smaller in swing states, and in states with a Republican Secretary of State or Governor.
We also find that voting technology can affect electoral outcomes indirectly, through an
effect on turn-out. Specifically, we find that touch-screen voting is associated with lower turn out
rates, especially in counties with a larger share of Hispanic residents. By changing the mix of
voters who go to the polls, this turnout effect could ultimately influence election outcomes.
Moreover, we find that counties with a larger fraction of Hispanics are more likely to adopt touch-
screen technology, particularly in swing states (although not in states controlled by a Republican
governor). Regardless of the source of this correlation, however, its effect on election outcomes is
small, accounting for only 15% of the apparent gain in the Republican vote share in counties that
used touch screen voting in 2004.

22
Bibliography
Brady, Henry, Bucler, Justin, Matt Jarvis and John McNulty “Counting all the Votes”, Unpublished Monograph, UC Berkeley Department of Political Science, 2001
CalTech/MIT Voting Technology Project “Residual Votes Attributable to Technology: An
Assessment of the Reliability of Existing Voting Equipment”, CalTech-MIT, 2001. Di Tella, Rafael and Ernesto Schargrodsky, ``The Role of Wages and Auditing during a Crackdown
on Corruption in the City of Buenos Aires,'' Journal of Law and Economics, Vol. 46(1), 2003: 269- Duggan, Mark and Levitt, Steven D. ``Winning Isn't Everything: Corruption in Sumo Wrestling.''
American Economic Review, 2002, 92(5): 1594-605. Fisman, Ray, “Estimating the Value of Political Connections,'' American Economic Review, 91 (4),
2001: 1095-1102. Fisman, Ray and Shang-Jin Wei. “Tax Rates and Tax Evasion: Evidence from ‘Missing Imports’ in
China'' Journal of Political Economy, 2004. Harris, Beverly. Black Box Voting: Vote Tampering in the 21st Century. Renton, WA: Talion
Publishing, 2003. Hout, Michael, Laura Mangels, Jennifer Carlson, and Rachel Best, “ Working Paper: The Effect of
Touch-screen voting Machines on Change in Support for Bush in the 2004 Florida Elections”, UC Berkeley, 2004.
Hsieh, Chang-Tei and Enrico Moretti, "Did Iraq Cheat the United Nations? Underpricing, Bribes,
and the Oil for Food Program", UC Berkeley, 2005. Jacob, Brian and Steven Levitt. “Rotten Apples: An Investigation of the Prevalence and Predictors
of Teacher Cheating” ' Quarterly Journal of Economics 118(3), 2003. Jones, Dale E., Sherri Doty, Clifford Grammich, James E. Horsch, Richard Houseal, Mac Lynn, John
P. Marcum, Kenneth M. Sanchagrin, and Richard H. Taylor. Religious Congregations and Membership in the United States, 2000: An Enumeration by Region, State and County Based on Data Reported by 149 Religious Bodies. Nashville TN: Glenmary Research Center, 2002.
Katz, Eddan and Rebecca Bolin. “Electronic Voting Machines and the Standards-Setting Process.”
Paper prepared for the National Research Council Committee on Electronic Voting. Available at http://www7.nationalacademies.org/cstb/project_evoting.html.
Kohno, Tadayoshi, Adam Stubblefield, Aviel Rubin, and Dan S. Wallach. “Analysis of an Touch-
screen voting System.” IEEE Symposium on Security and Privacy 2004. IEEE Computer Society Press, May 2004.
La Porta, Rafael and Francisco Lopez-de-Silanes. “Related Lending” Quarterly Journal of
Economics, February 2003. McDonald, Michael P. “A Critique of the Berkeley Voting Study”. Undated report posted at
http:/elections.gmu.edu/Berkeley.html (retrieved March 10, 2005). McDonald, Michael P. and Samuel L. Popkin. “The Myth of the Vanishing Voter.” American
Political Science Review 95 (4), 2001: 963-974.

23
Reinikka, Ritva and Jacob Svensson, ``Local Capture: "Local Capture: Evidence from a Central Government Transfer Program in Uganda,'' The Quarterly Journal of Economics 119 (2), 2004: 679-705.

Table 1: Means of Key Variables by County and Comparisons by Use of DRE Voting in 2004
Unweighted Means Across Counties: Weighted Means Across Counties:
Overall Mean for Mean for Overall Mean for Mean for Mean DRE=1 DRE=0 Mean DRE=1 DRE=0
Voting Technology -- 2004 Direct Electronic (DRE) 20.7 100.0 0.0 27.2 100.0 0.0 Paper Ballot 10.5 0.0 13.3 1.8 0.0 2.4 Lever 7.3 0.0 9.1 12.4 0.0 17.0 Punch Card 10.5 0.0 13.3 11.8 0.0 16.3 Optical Scan 48.0 0.0 60.6 41.6 0.0 57.0 Unknown 2.9 0.0 3.7 5.2 0.0 7.3
DRE in 2000 11.3 36.4 4.7 12.9 29.6 6.7
Voting Outcomes: Republican Share of 2-Party Vote: 2004 60.9 60.2 61.1 50.9 51.9 50.7 2000 58.8 57.0 59.3 49.3 50.2 49.2 1996 50.5 49.7 50.7 45.2 47.0 44.8 1992 50.4 49.4 50.6 47.0 48.6 46.6 Republican Share of All Votes: 2004 60.3 59.8 60.5 50.5 51.5 50.3 2000 56.9 55.7 57.2 47.6 48.7 47.4 1996 44.7 44.9 44.7 40.8 42.8 40.1 1992 39.8 41.2 39.4 37.7 40.0 36.9 Third Party Share of All Votes: 2004 1.0 0.7 1.0 0.9 0.8 0.9 2000 3.2 2.3 3.5 3.6 3.0 3.9 1996 11.3 9.6 11.8 9.8 8.6 10.2 1992 20.5 16.1 21.7 19.4 17.3 20.2
Voter Turnout Rate 2004 57.7 53.4 58.8 53.2 51.0 53.8 2000 53.3 47.6 54.8 50.0 47.3 51.0
Demographics Percent Black 9.0 15.2 7.3 12.2 16.2 10.4 Percent Hispanic 6.3 5.4 6.5 12.7 13.8 12.4 Percent College Degree 13.5 12.9 13.6 20.4 20.8 20.3 Percent in Military 1.4 1.4 1.4 1.6 1.4 1.7 Percent Adherents 52.5 48.0 53.8 50.2 48.1 51.2 Personal Income ($1000) 21.2 21.6 21.1 27.2 27.9 26.9
Regional Distribution Northeast 7.0 3.4 7.9 19.0 12.2 21.7 South 45.8 77.9 37.6 36.1 61.8 26.9 Midwest 33.8 10.7 39.8 22.8 7.9 27.4 West 13.4 8.0 14.8 22.1 18.1 24.0
County Population, 2000 90,615 118,702 82,261
Number of Counties 3,119 646 2,468 3,119 646 2,468Notes: Overall sample includes 3,119 counties in 50 states (Alaska is excluded) with data on voting outcomesand technology in 2004. There are 5 counties for which DRE is measured as the fraction of townships usingDRE.
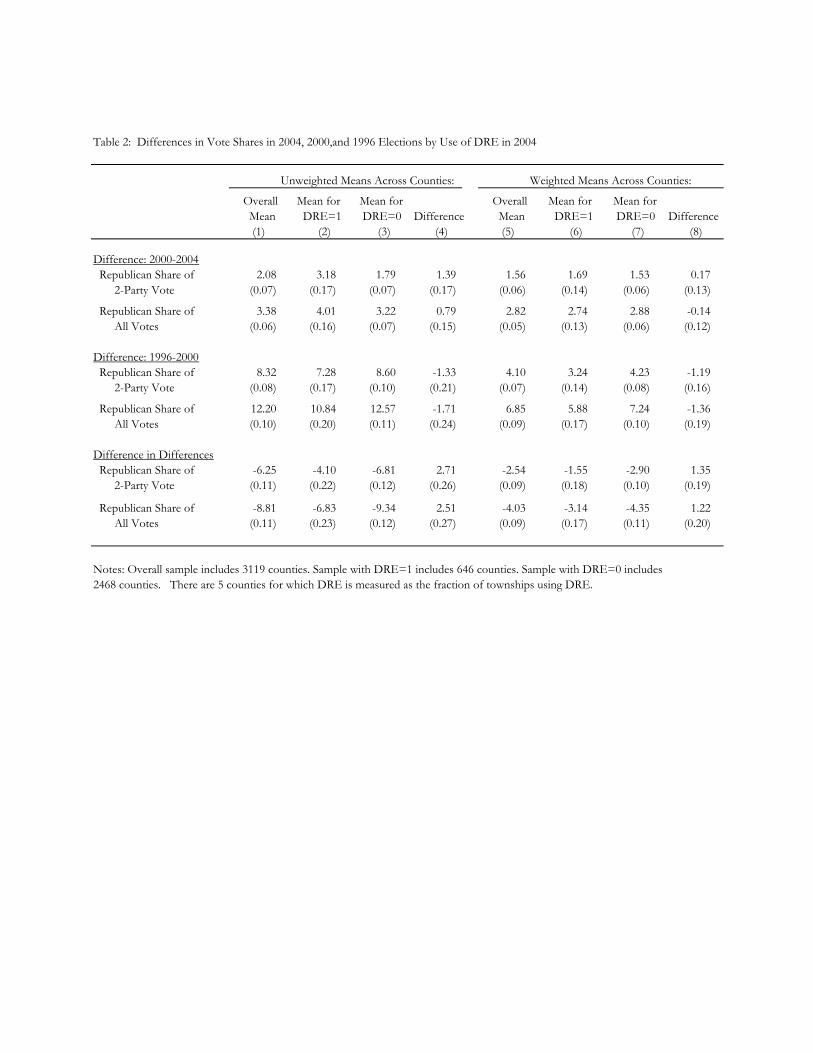
Table 2: Differences in Vote Shares in 2004, 2000,and 1996 Elections by Use of DRE in 2004
Unweighted Means Across Counties: Weighted Means Across Counties:
Overall Mean for Mean for Overall Mean for Mean for Mean DRE=1 DRE=0 Difference Mean DRE=1 DRE=0 Difference (1) (2) (3) (4) (5) (6) (7) (8)
Difference: 2000-2004 Republican Share of 2.08 3.18 1.79 1.39 1.56 1.69 1.53 0.17 2-Party Vote (0.07) (0.17) (0.07) (0.17) (0.06) (0.14) (0.06) (0.13)
Republican Share of 3.38 4.01 3.22 0.79 2.82 2.74 2.88 -0.14 All Votes (0.06) (0.16) (0.07) (0.15) (0.05) (0.13) (0.06) (0.12)
Difference: 1996-2000 Republican Share of 8.32 7.28 8.60 -1.33 4.10 3.24 4.23 -1.19 2-Party Vote (0.08) (0.17) (0.10) (0.21) (0.07) (0.14) (0.08) (0.16)
Republican Share of 12.20 10.84 12.57 -1.71 6.85 5.88 7.24 -1.36 All Votes (0.10) (0.20) (0.11) (0.24) (0.09) (0.17) (0.10) (0.19)
Difference in Differences Republican Share of -6.25 -4.10 -6.81 2.71 -2.54 -1.55 -2.90 1.35 2-Party Vote (0.11) (0.22) (0.12) (0.26) (0.09) (0.18) (0.10) (0.19)
Republican Share of -8.81 -6.83 -9.34 2.51 -4.03 -3.14 -4.35 1.22 All Votes (0.11) (0.23) (0.12) (0.27) (0.09) (0.17) (0.11) (0.20)
Notes: Overall sample includes 3119 counties. Sample with DRE=1 includes 646 counties. Sample with DRE=0 includes2468 counties. There are 5 counties for which DRE is measured as the fraction of townships using DRE.

Table 3: Relation Between 2000-2004 Change in Republican Vote Share and Use of DRE in 2004
(1) (2) (3) (4)
DRE in 2004 (×100) 0.17 -0.48 0.17 0.21(0.15) (0.14) (0.10) (0.10)
Republican Vote Share, 2000 0.22 -0.03(0.02) (0.02)
Republican Vote Share, 1996 -0.20 -0.03(0.02) (0.03)
Republican Vote Share, 1992 -0.04 -0.06(0.02) (0.02)
Third Party Vote Share, 2000 -1.33 -1.03(0.05) (0.05)
Third Party Vote Share, 1996 0.39 0.01(0.03) (0.03)
Third Party Vote Share, 1992 0.11 0.05(0.02) (0.02)
State Effects No Yes Yes YesCounty Controls No No No Yes
Notes: Standard errors in parentheses. The dependent variable is the 2000-2004 change in the Republican share of the two-party vote. Sample sizes are 3024 in columns 1-3 and 2934 in column 4. Estimated by weighted least squares using county population in 2000 as a weight. County controls in column 4 are: fractions of blacks, Hispanics, college graduates, militaryemployees, agricultural workers, and religious adherents in the county, and median county personal income.

Table 4: Relation Between Change in Republican Vote Share and Use of DRE in 2000 and 2004
(1) (2) (3) (4)
DRE in 2004 (×100) 0.15 -0.44 0.18 0.21(0.13) (0.15) (0.11) (0.10)
DRE in 2000 (×100) -0.06 -0.20 -0.05 0.00(0.18) (0.17) (0.13) (0.12)
Republican Vote Share, 2000 0.22 -0.03(0.02) (0.02)
Republican Vote Share, 1996 -0.20 -0.03(0.02) (0.03)
Republican Vote Share, 199 -0.04 -0.06(0.02) (0.02)
Third Party Vote Share, 2000 -1.34 -1.03(0.05) (0.05)
Third Party Vote Share, 1996 0.39 0.01(0.03) (0.03)
Third Party Vote Share, 1992 0.11 0.05(0.02) (0.02)
p-value of test: DRE 2000= 0.27 0.00 0.41 0.43 -DRE 2004
State Effects No Yes Yes YesCounty Controls No No No Yes
Notes: Standard errors in parentheses. The dependent variable is the 2000-2004 change in the Republican share of the two-party vote. Sample sizes are 3024 in columns 1-3 and 2934 in column 4. Estimated by weighted least squares using county population in 2000 as a weight. County controls in column 4 are: fractions of blacks, Hispanics, college graduates, militaryemployees, agricultural workers, and religious adherents in the county, and median county personal income.

Table 5: Relation Between Change in Republican Vote Share, Change in Use of DRE, and Interactions of Change in Use of DRE with State/County Characteristics
Interaction of Change in DRE Change in DRE (Main Effect) With Row Variable (coefficient ×100) (coefficient ×100) (1) (2)
No Interactions 0.15(0.08)
Interacted Variable:Republican Vote Share in 2000 -0.35 0.98
(0.34) (0.64)
Republican Governor -0.02 0.20(0.13) (0.18)
Republican Secretary of State 0.27 -0.27(0.12) (0.17)
Swing State in 2004 0.30 -0.61(0.10) (0.20)
Republican Governor × Swing State 0.25 -0.88(0.09) (0.27)
Population -0.35 0.47(0.12) (0.08)
Population × Swing State 0.17 -0.16(0.09) (0.20)
Median Income/10,000 1.13 -0.34(0.31) (0.10)
Percent Black 0.21 0.00(0.11) (0.06)
Percent Black × Swing State 0.14 0.00(0.09) (0.01)
Percent Hispanic 0.19 -0.02(0.12) (0.01)
Percent with College Degree 0.42 -1.26(0.20) (0.83)
Florida 0.18 -0.55(0.09) (0.33)
Ohio 0.15 -0.57(0.08) (0.80)
Iowa 0.14 -1.43(0.08) (2.46)
New Mexico 0.14 0.21(0.08) (1.28)
Notes: Standard errors in parentheses. The dependent variable in all models is the change in the Republican share of the two party vote. Each row represents a separate model,with change in DRE included as a main effect (coefficient reported in column 1) and interacted with the variable indicated in the row heading (coefficient reported in column 2). All models include the same controls used in column 4 of Tables 3 and 4. Modelsestimated by weighted least squares using county population in 2000 as a weight.

Table 6: Relation Between Use of DRE and Republican Share of Registered Voters
Republican Share Change in Republican in 2004 Share 2000-2004 (1) (2)
DRE in 2004 (×100) 1.49(0.55)
Change in DRE (×100) 0.09(0.50)
State Effects Yes YesRepublican Vote Share Yes Yes 1992-2000Third Party Vote Share Yes Yes 1992-2000County Controls Yes Yes
Number of Counties 1123 478Notes: Standard errors in parentheses. Dependent variable in column 1 is thefraction of registered voters who are registered as Republicans in 2004. Dependentvariable in column 2 is the change in the Republican share of registered voters between 2000 and 2004. Estimated by weighted least squares using county population in 2000 as a weight.

Table 7: Relation Between Direct Electronic Recording Voting Technology and Voter Turnout
Turnout in Change in Turnout 2004 from 2000 to 2004 (1) (2) (3)
DRE in 2004 (×100) -1.40(0.28)
Change in DRE (×100) -0.71 0.02(0.14) (0.24)
Change in DRE × -0.01 Share Black (×100) (0.01)
Change in DRE × -0.04 Share Hispanics (×100) (0.01)
State Effects Yes Yes YesRepublican Vote Share Yes Yes Yes 1992-2000Third Party Vote Share Yes Yes Yes 1992-2000County Controls Yes Yes Yes
Notes: Standard errors in parentheses. Dependent variable in column1 is estimated voterturnout in 2004 (number of votes cast/total county population). Dependent variable in columns2-3 is change in estimated voter turnout between 2000 and 2004. Estimated by weighted least squares using the county population in 2000 as a weight.

Table 8: Determinants of the Adoption of Direct Electronic Recording Voting Technology
Use DRE Change in DRE Use DRE Change in DRE in 2004 2000-2004 in 2004 2000-2004 (1) (2) (3) (4) (5) (6)
Fraction Hispanic 0.17 0.11 0.31 0.28 0.21 0.27(0.07) (0.07) (0.16) (0.07) (0.07) (0.21)
Hispanic × Swing 2000 0.48 0.92(0.21) (0.30)
Hispanic × Republican -0.21 0.01 Governor (0.16) (0.22)
Fraction Black 0.09 -0.02 -0.09 -0.04 -0.25 0.12(0.08) (0.08) (0.10) (0.08) (0.09) (0.11)
Black ×Swing 2000 0.58 0.81(0.16) (0.16)
Black × Republican 0.29 -0.32 Governor (0.13) (0.14)
State fixed effects No No No Yes Yes YesCounty controls Yes Yes Yes Yes Yes Yes
Notes: Standard errors in parentheses. Dependent variable in columns 1 and 4 is an indicator for use of DRE in 2004. Dependent variable in columns 2-3 and 5-6 is the difference in indicators for use of DRE in 2004and 2000. Estimated by weighted least squares using county population in 2000 as a weight. County controlsare the same as included in Tables 3 -5. The models with interactions also include the main effects of anyinteracted variables.

Figure 1: Bush Vote Share in 2000 and 2004, by Voting Technology (All States)
All Statesx
dre no_dre
.1 .5 .9
.1
.5
.9

Figure 2: Distribution of 2000-2004 Changes in Bush Vote Share by Voting Technology (All
States)
y
Dre No Dre
−.4 −.2 0 .2 .4
0
5
10
15
1
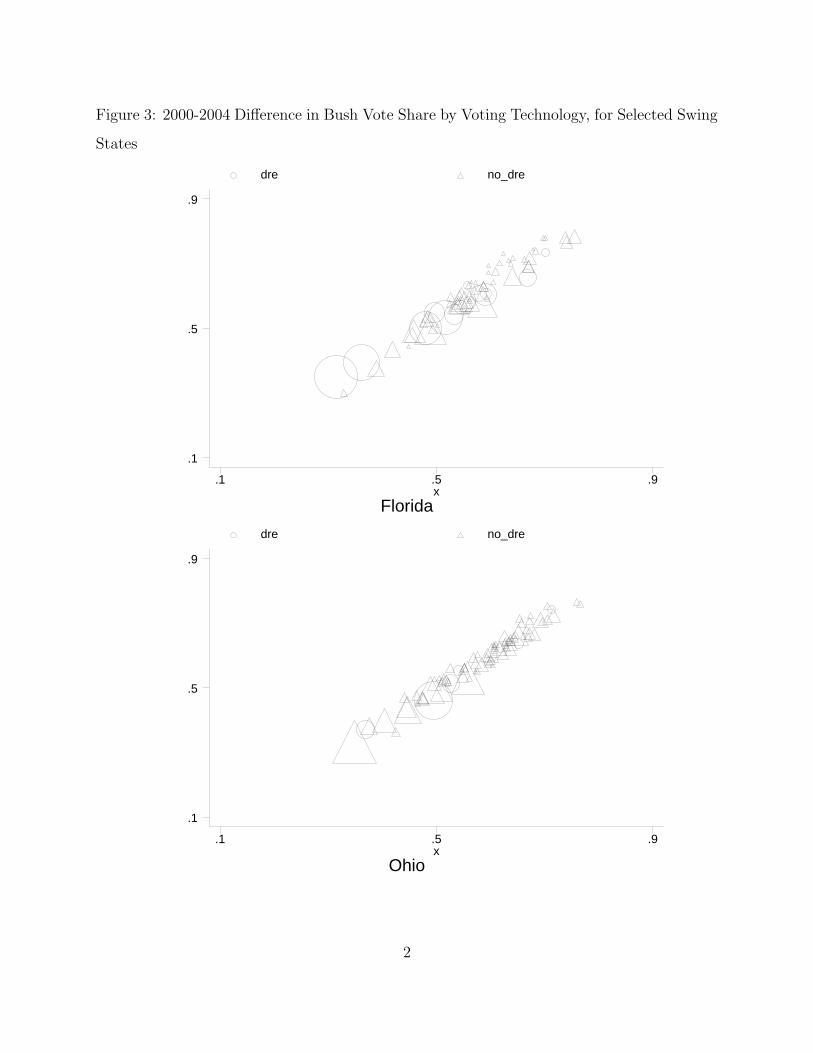
Figure 3: 2000-2004 Difference in Bush Vote Share by Voting Technology, for Selected Swing
States
Floridax
dre no_dre
.1 .5 .9
.1
.5
.9
Ohiox
dre no_dre
.1 .5 .9
.1
.5
.9
2

Figure 4: 2000-2004 Difference in Bush Vote Share by Voting Technology, for Selected Swing
States
Iowax
dre no_dre
.1 .5 .9
.1
.5
.9
New Mexicox
dre no_dre
.1 .5 .9
.1
.5
.9
3
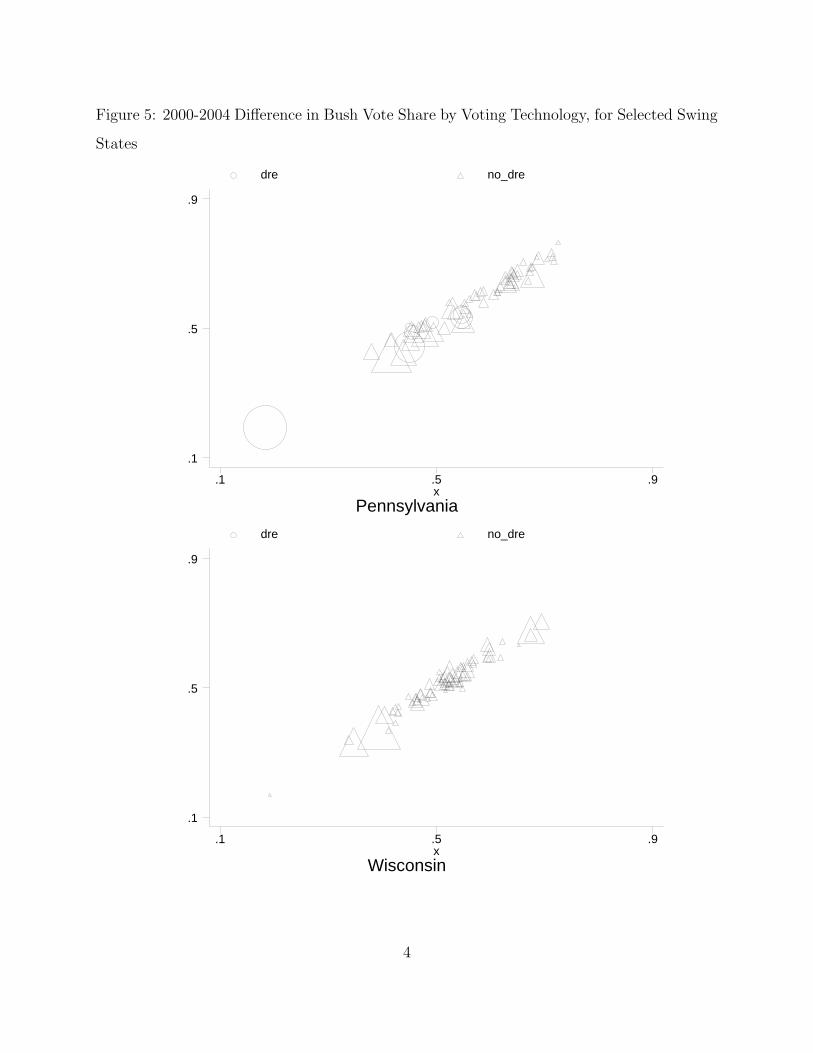
Figure 5: 2000-2004 Difference in Bush Vote Share by Voting Technology, for Selected Swing
States
Pennsylvaniax
dre no_dre
.1 .5 .9
.1
.5
.9
Wisconsinx
dre no_dre
.1 .5 .9
.1
.5
.9
4

Figure 6: 2000-2004 Difference in Bush Vote Share by Voting Technology, for Selected Swing
States
Michiganx
dre no_dre
.1 .5 .9
.1
.5
.9
Minnesotax
dre no_dre
.1 .5 .9
.1
.5
.9
5