navar jose 2004 additive biomass equations for pine species durango
TRANSCRIPT
8/6/2019 NAVAR JOSE 2004 Additive Biomass Equations for Pine Species DURANGO
http://slidepdf.com/reader/full/navar-jose-2004-additive-biomass-equations-for-pine-species-durango 1/12
17 Madera y Bosques 10(2), 2004:17-28
ARTÍCULO DE INVESTIGACIÓN
Additive biomass equations for pine speciesof forest plantations of Durango, Mexico
José de Jesús Návar Cháidez1
Nicolás González Barrientos2
José de Jesús Graciano Luna3
Virginia Dale4Bernard Parresol5
ABSTRACT
Statistical analysis between three weighted additive biomass equations are presented forplanted pine species typical of the coniferous forests of the Western Sierra Madre mountain range ofDurango, Mexico. Statistical and graphical analyses were used to select the best single and multipleindividual biomass component equation. Linear equations better fitted the biomass components.Therefore, three linear additive procedures were tested: (i) the conventional, (ii) a harmonization, and(iii) the seemingly-unrelated regression in two types of equations of component biomass estimationusing both simple regression and multiple regression techniques. These tests were performed at twoscales: (a) each of three pine species and (b) all three species. For both the simple linear and bestmultiple regression equation, the seemingly-unrelated equations provided more precise biomasscomponent estimates, with tendencies consistent with the conventional non-additive non-linear regres-sion procedures, and provided average biomass component estimates when equations were appliedto a data set of 23 sample quadrants.
KEY WORDS:Biomass additivity,P. cooperi , P. durangensis , P. engelmannii , seemingly unrelated regression.
RESUMEN
Se presentan análisis estadísticos entre tres ecuaciones aditivas ponderadas para el cálculo dela biomasa en plantaciones de especies de pino típicas de los bosques de coníferas de la SierraMadre Occidental en el Estado de Durango, México. Se usaron análisis estadísticos y gráficos paraseleccionar las mejores ecuaciones para los componentes de la biomasa, de manera individual omúltiple. Por lo tanto, se ensayaron tres procedimientos aditivos lineales: (i) el convencional, (ii) unaarmonización, y (iii) la regresión generalizada no relacionada en dos tipos de ecuaciones para estima-ción de los componentes de la biomasa utilizando técnicas tanto de regresión simple lineal comomúltiple. Estas pruebas se llevaron a cabo en dos escalas: (a) cada una de las tres especies de pinoy (b) las tres especies en conjunto. Tanto para las ecuaciones de regresión lineal simple como paralas de regresión múltiple, las ecuaciones generalizadas no relacionadas dieron estimaciones másprecisas de los componentes de la biomasa, con tendencias consistentes con los procedimientosconvencionales no aditivos de regresión múltiple no lineal y arrojaron estimaciones promedio de loscomponentes de la biomasa cuando las ecuaciones se aplicaron a un conjunto de datos de unamuestra de 23 cuadrantes.
PALABRAS CLAVE:Aditividad de la biomasa,P. cooperi , P. durangensis , P. engelmannii , regresión generalizada no rela-cionada.
1 Universidad Autónoma de Nuevo León. Facultad de Ciencias Forestales. Km 145 Carretera Nacional.Linares 67700 N.L., México. E-mail: [email protected].
2 Centro de Bachillerato Tecnológico Forestal. Durango, Mexico.3 Instituto Tecnologico Forestal No 1. El Salto, P.N., Durango. Durango, Mexico.4 Environmental Science Division, Oak Ridge National Laboratory. Oak Ridge, TN. E-mail:[email protected] .5 USDA Forest Service Southern Research Station. P.O. Box 2680 Asheville, NC 28802. E-mail:

8/6/2019 NAVAR JOSE 2004 Additive Biomass Equations for Pine Species DURANGO
http://slidepdf.com/reader/full/navar-jose-2004-additive-biomass-equations-for-pine-species-durango 2/12
INTRODUCTION
Estimating the environmentalservices provided by carbon sequestra-tion requires the use of biomass esti-mates (Houghton, 1991; Brown, 1997).Several models estimate biomass orbiomass-related parameters to assess thefate of CO2 in the biosphere ( Mohren andGoldewijk, 1990). Given this importance,biomass equations have been compiledor developed for tropical, temperate,boreal, and semi-arid, sub-tropical trees(Schroederet al ., 1997; Ter-Mikaelian andKorzukhin, 1997; Návaret al. , 2002).
A variety of regression models havebeen used for estimating total treebiomass or tree biomass components(Clutter et al ., 1983), and they fall intothree main forms: linear additive, nonli-near additive, and nonlinear multiplicativeerror (Parresol, 1999). A desirable featureof tree component regression equations isthat the sum of predictions for the compo-nents equals the prediction for the totaltree (Cunia and Briggs, 1984, 1985;Parresol, 1999). Procedures for forcingadditivity have been proposed. Totalbiomass is estimated by (1) using thesame independent variables for estima-ting each component, (2) adding the mostappropriate regression functions of eachbiomass component, and (3) forcing theregression coefficients to estimate totalbiomass (Cunia and Briggs, 1985;Parresol, 1999). These procedures havebeen applied widely for temperate trees(Cunia and Briggs, 1985; Parresol, 1999)and semi-arid, subtropical trees (Návaret al ., 2002). However, biomass componentequations for young pine plantations thatmeet the additive requirements are rare inthe scientific literature, when currentlythere is a wide range of forest plantationsscattered over the Western Sierra Madreof Mexico. For the period between 1993and 1998 approximately 5 000 hectareswere annually planted only in the State of
Durango. Regardless of their importance,no attempts have been made to quantifythe environmental services provided bythese forest plantations. The projection ofcarbon stocks in the early stages of forestplantations requires established additivebiomass equations.
OBJECTIVES
The aim of this study was (1) toselect the best single and multiple regres-sion equation to estimate biomasscomponents, (2) to fit three biomass addi-tivity procedures in two different forms, (2)to compare efficiency in biomass esti-mates between two scales, and (3) tocontrast biomass estimates among addi-tive procedures in 23 planted foreststands of Durango, Mexico.
MATERIALS AND METHODS
This research was conducted inforests managed by the Unidad deConservacion y Desarrollo Forestal No 6
of the Western Sierra Madre mountainrange of Durango, Mexico. Forest planta-tions of several community-based landownership, ejidos, including La Campana,San Pablo, La Ciudad, Los Bancos, LaVictoria, located in the municipality ofPueblo Nuevo, Durango, were sampled.The ejidos are within the coordinates105º36’19’’W and 105º51’48’’W and24º19’05’’N and 24º30’16’’N and liebetween 2 000 meters and 2 900 meters
above sea level (masl). The area ischaracterized by a cold-temperate climatewith average annual long-term precipita-tion and temperature of 900 mm and 15ºC, respectively. Plant cover is dominatedby native, uneven aged, mixed coniferousforests. Pines and oaks are the mostabundant genera in the western SierraMadre mountain range.
18 Aditive biomass equations for pine species. Návar et al.
8/6/2019 NAVAR JOSE 2004 Additive Biomass Equations for Pine Species DURANGO
http://slidepdf.com/reader/full/navar-jose-2004-additive-biomass-equations-for-pine-species-durango 3/12
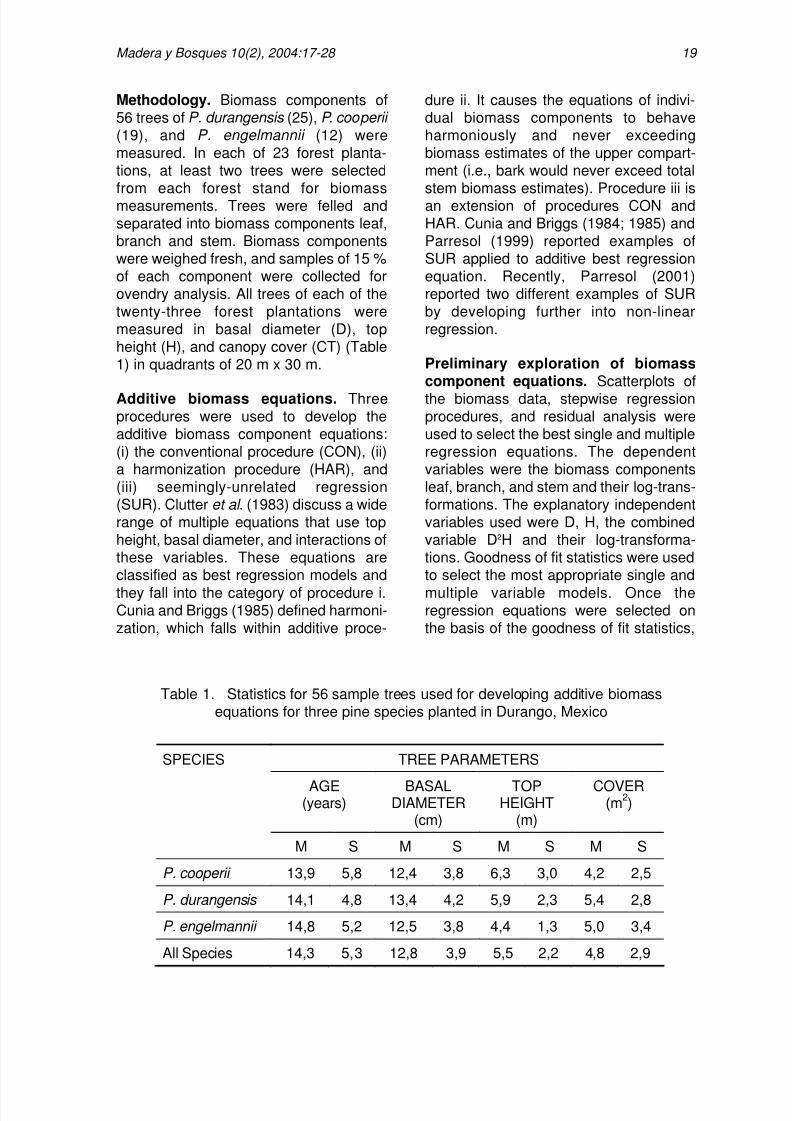
Methodology. Biomass components of56 trees ofP. durangensis (25),P. cooperii (19), and P. engelmannii (12) weremeasured. In each of 23 forest planta-tions, at least two trees were selectedfrom each forest stand for biomassmeasurements. Trees were felled andseparated into biomass components leaf,branch and stem. Biomass componentswere weighed fresh, and samples of 15 %of each component were collected forovendry analysis. All trees of each of thetwenty-three forest plantations weremeasured in basal diameter (D), topheight (H), and canopy cover (CT) (Table1) in quadrants of 20 m x 30 m.
Additive biomass equations. Threeprocedures were used to develop theadditive biomass component equations:(i) the conventional procedure (CON), (ii)a harmonization procedure (HAR), and(iii) seemingly-unrelated regression(SUR). Clutteret al . (1983) discuss a widerange of multiple equations that use topheight, basal diameter, and interactions ofthese variables. These equations areclassified as best regression models andthey fall into the category of procedure i.Cunia and Briggs (1985) defined harmoni-zation, which falls within additive proce-
dure ii. It causes the equations of indivi-dual biomass components to behaveharmoniously and never exceedingbiomass estimates of the upper compart-ment (i.e., bark would never exceed totalstem biomass estimates). Procedure iii isan extension of procedures CON andHAR. Cunia and Briggs (1984; 1985) andParresol (1999) reported examples ofSUR applied to additive best regressionequation. Recently, Parresol (2001)reported two different examples of SURby developing further into non-linearregression.
Preliminary exploration of biomasscomponent equations. Scatterplots ofthe biomass data, stepwise regressionprocedures, and residual analysis wereused to select the best single and multipleregression equations. The dependentvariables were the biomass componentsleaf, branch, and stem and their log-trans-formations. The explanatory independentvariables used were D, H, the combinedvariable D2H and their log-transforma-tions. Goodness of fit statistics were usedto select the most appropriate single andmultiple variable models. Once theregression equations were selected onthe basis of the goodness of fit statistics,
19 Madera y Bosques 10(2), 2004:17-28
TREE PARAMETERS
AGE(years)
BASALDIAMETER
(cm)
TOPHEIGHT
(m)
COVER(m2)
SPECIES
M S M S M S M S
P. cooperii 13,9 5,8 12,4 3,8 6,3 3,0 4,2 2,5
P. durangensis 14,1 4,8 13,4 4,2 5,9 2,3 5,4 2,8
P. engelmannii 14,8 5,2 12,5 3,8 4,4 1,3 5,0 3,4
All Species 14,3 5,3 12,8 3,9 5,5 2,2 4,8 2,9
Table 1. Statistics for 56 sample trees used for developing additive biomassequations for three pine species planted in Durango, Mexico
8/6/2019 NAVAR JOSE 2004 Additive Biomass Equations for Pine Species DURANGO
http://slidepdf.com/reader/full/navar-jose-2004-additive-biomass-equations-for-pine-species-durango 4/12
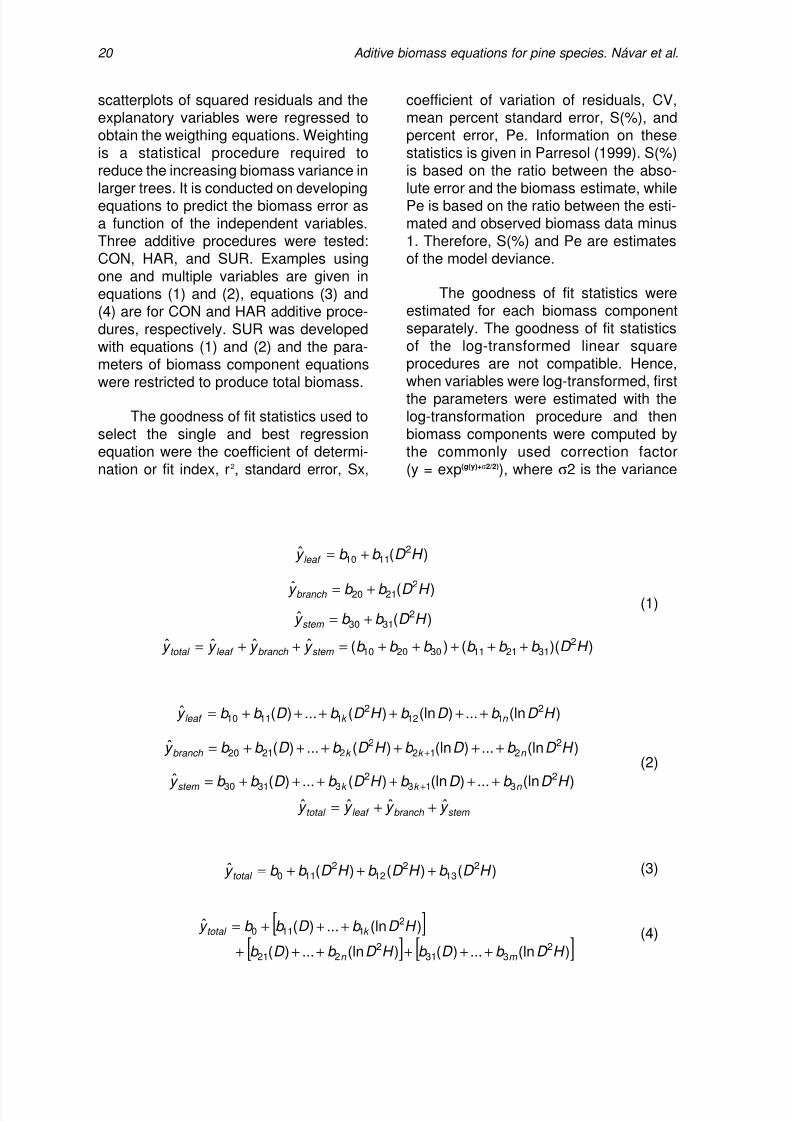
scatterplots of squared residuals and theexplanatory variables were regressed toobtain the weigthing equations. Weightingis a statistical procedure required toreduce the increasing biomass variance inlarger trees. It is conducted on developingequations to predict the biomass error asa function of the independent variables.Three additive procedures were tested:CON, HAR, and SUR. Examples usingone and multiple variables are given inequations (1) and (2), equations (3) and(4) are for CON and HAR additive proce-dures, respectively. SUR was developedwith equations (1) and (2) and the para-meters of biomass component equationswere restricted to produce total biomass.
The goodness of fit statistics used toselect the single and best regressionequation were the coefficient of determi-nation or fit index, r2, standard error, Sx,
coefficient of variation of residuals, CV,mean percent standard error, S(%), andpercent error, Pe. Information on thesestatistics is given in Parresol (1999). S(%)is based on the ratio between the abso-lute error and the biomass estimate, whilePe is based on the ratio between the esti-mated and observed biomass data minus1. Therefore, S(%) and Pe are estimatesof the model deviance.
The goodness of fit statistics wereestimated for each biomass componentseparately. The goodness of fit statisticsof the log-transformed linear squareprocedures are not compatible. Hence,when variables were log-transformed, firstthe parameters were estimated with thelog-transformation procedure and thenbiomass components were computed bythe commonly used correction factor(y = exp(g(y)+ σ 2/2)), where σ2 is the variance
20 Aditive biomass equations for pine species. Návar et al.
)(ˆ 21110 H D b b y leaf +=
)(ˆ 22120 H D b b y branch +=
)(ˆ 23130 H D b b y stem +=
))(()(ˆˆˆˆ 2312111302010 H D b b b b b b y y y y stem branch leaf total +++++=++=
)(ln...)(ln)(...)(ˆ 2112
211110 H D b D b H D b D b b y n k leaf ++++++=
)(ln...)(ln)(...)(ˆ 2212
222120 H D b D b H D b D b b y n k k branch ++++++=
+
)(ln...)(ln)(...)(ˆ2
3132
33130 H D b D b H D b D b b y n k k stem ++++++= +
stem branch leaf total y y y y ˆˆˆˆ ++=
)()()(ˆ 213
212
2110 H D b H D b H D b b y total +++=
[ ][ ] [ ])(ln...)()(ln...)(
)(ln...)(ˆ2
3312
221
21110
H D b D b H D b D b
H D b D b b y
m n
k total
++++++
+++=
(1)
(4)
(3)
(2)
8/6/2019 NAVAR JOSE 2004 Additive Biomass Equations for Pine Species DURANGO
http://slidepdf.com/reader/full/navar-jose-2004-additive-biomass-equations-for-pine-species-durango 5/12
of the log-transformed regression).Observed and computed biomass inoriginal units provided information to esti-mate the goodness of fit statistics incompatible units. Least square techni-ques in nonlinear, linear, multiple regres-sion, multiple regression with dummyvariables, linear and ln-transformedsystem of equation procedures was usedto compute parameters. The Newton’smethod in SAS package was employed inthe nonlinear procedures.
Comparisons between biomass esti-mates of independent data sets. Theperformance of additive procedures hasbeen assessed on the standard error ofthe parameter estimates. In this report thet values were contrasted among additiveprocedures since parameter estimatesalso change with the additive procedure.Additive equations were also applied to allstanding trees of each of the 23 quadrantsto contrast biomass estimates and confi-dence intervals for each biomass compo-nent for each additive procedure for bothspecies scales.
RESULTS
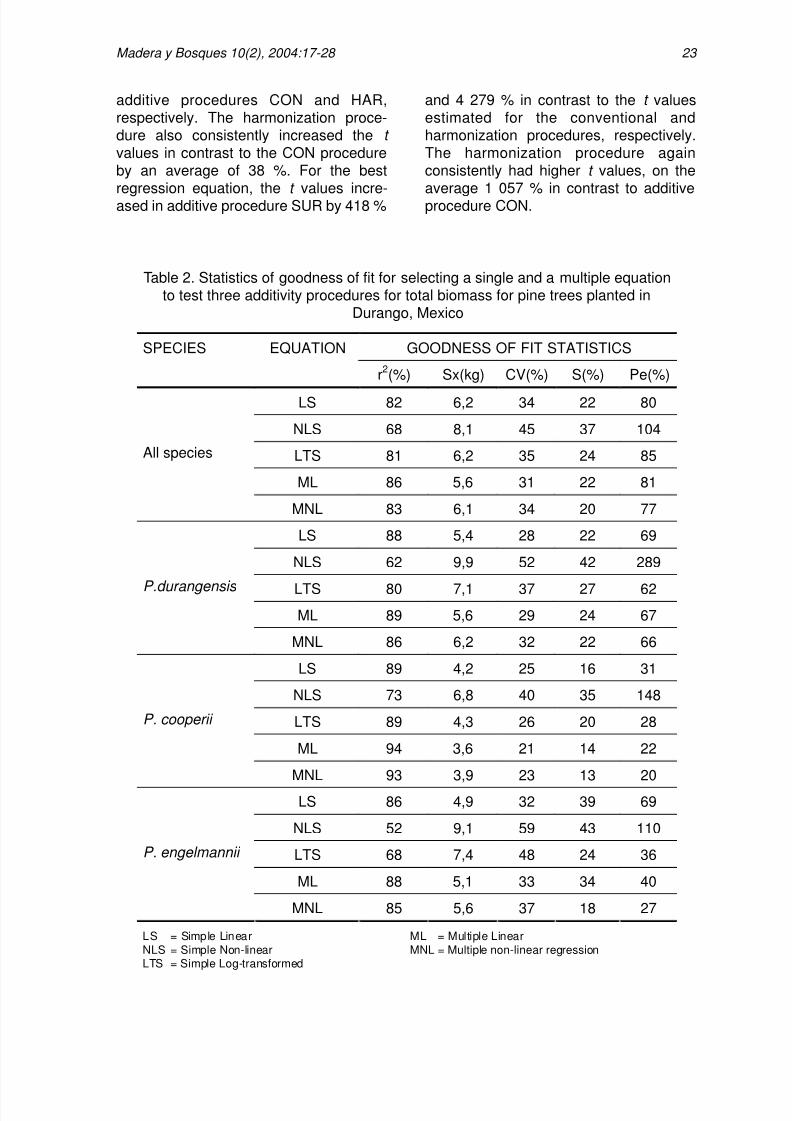
Selection of equations for additiveprocedures. Different goodness of fitstatistics resulted from the regressionprocedures employed to estimatebiomass components in simple andmultiple regression procedures. Clearlythe simple and multiple linear equations fitbetter biomass components and total. The
non-linear (i.e. B =α Dβ
) and the log -transformed (i.e. lnB =α + β ln (D2h))regression equations had the poorestgoodness of fit statistics for branch, stem,and total biomass for all species, as wellas for each species but because of poorperformance the coefficients are notpresented in the manuscript. For thesimple regression approach, the linearequation, using the combined variable
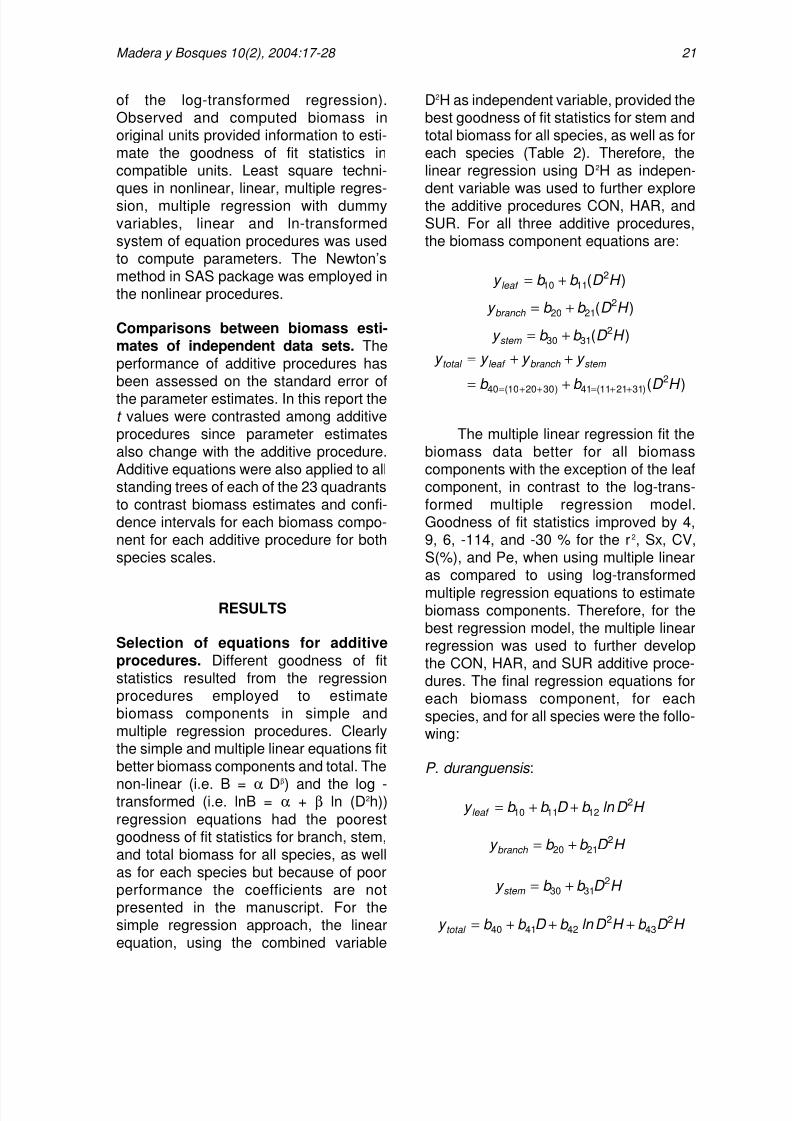
D2H as independent variable, provided thebest goodness of fit statistics for stem andtotal biomass for all species, as well as foreach species (Table 2). Therefore, thelinear regression using D2H as indepen-dent variable was used to further explorethe additive procedures CON, HAR, andSUR. For all three additive procedures,the biomass component equations are:
The multiple linear regression fit thebiomass data better for all biomasscomponents with the exception of the leafcomponent, in contrast to the log-trans-formed multiple regression model.Goodness of fit statistics improved by 4,9, 6, -114, and -30 % for the r2, Sx, CV,S(%), and Pe, when using multiple linearas compared to using log-transformedmultiple regression equations to estimatebiomass components. Therefore, for thebest regression model, the multiple linearregression was used to further developthe CON, HAR, and SUR additive proce-dures. The final regression equations foreach biomass component, for eachspecies, and for all species were the follo-wing:
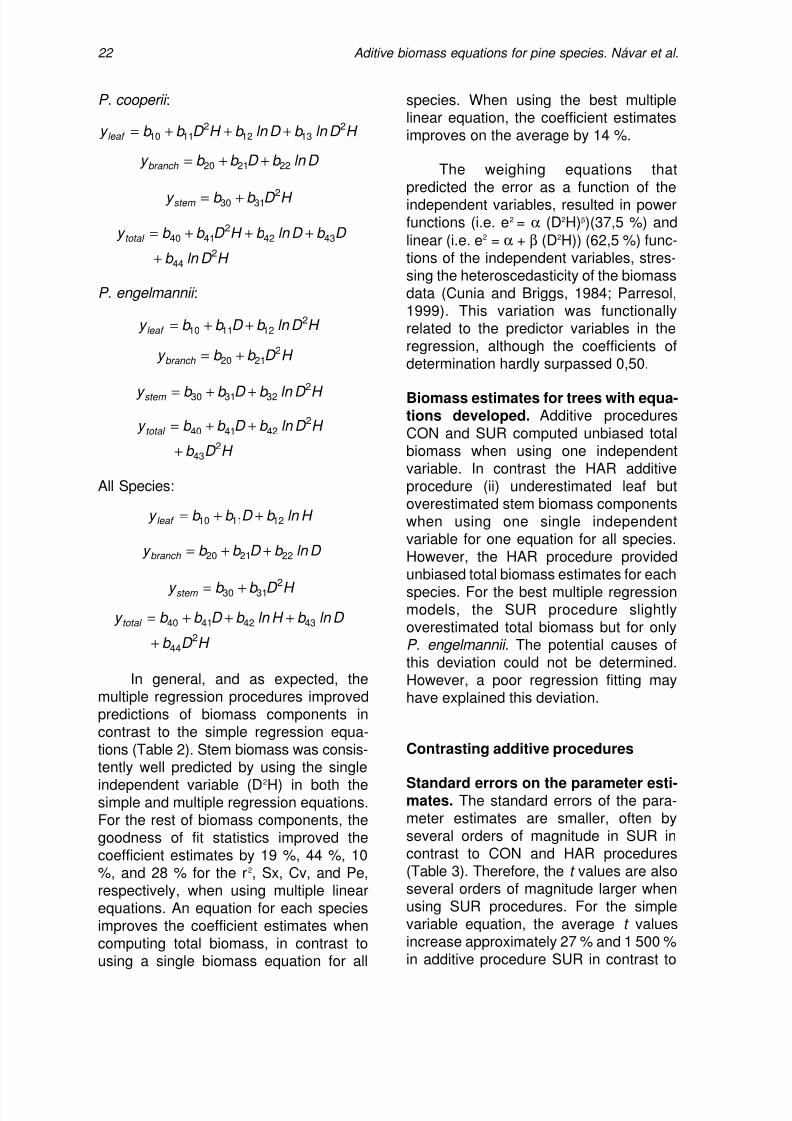
P. duranguensis :
21Madera y Bosques 10(2), 2004:17-28
)( 21110 H D b b y leaf +=
)( 22120 H D b b y branch +=
)( 23130 H D b b y stem +=
)( 2
)312111(41)302010(40H D b b
y y y y stem branch leaf total
++=++=+=
++=
H D ln b D b b y leaf 2
121110 ++=
H D b b y branch 2
2120 +=
H D b b y stem 2
3130 +=
H D b H D ln b D b b y total 2
432
424140 +++=
8/6/2019 NAVAR JOSE 2004 Additive Biomass Equations for Pine Species DURANGO
http://slidepdf.com/reader/full/navar-jose-2004-additive-biomass-equations-for-pine-species-durango 6/12
P. cooperii :
P. engelmannii :
All Species:
In general, and as expected, themultiple regression procedures improvedpredictions of biomass components incontrast to the simple regression equa-tions (Table 2). Stem biomass was consis-tently well predicted by using the single
independent variable (D2H) in both thesimple and multiple regression equations.For the rest of biomass components, thegoodness of fit statistics improved thecoefficient estimates by 19 %, 44 %, 10%, and 28 % for the r2, Sx, Cv, and Pe,respectively, when using multiple linearequations. An equation for each speciesimproves the coefficient estimates whencomputing total biomass, in contrast tousing a single biomass equation for all
species. When using the best multiplelinear equation, the coefficient estimatesimproves on the average by 14 %.
The weighing equations thatpredicted the error as a function of theindependent variables, resulted in powerfunctions (i.e. e2 = α (D2H)β)(37,5 %) andlinear (i.e. e2 = α + β (D2H)) (62,5 %) func-tions of the independent variables, stres-sing the heteroscedasticity of the biomassdata (Cunia and Briggs, 1984; Parresol,1999). This variation was functionallyrelated to the predictor variables in theregression, although the coefficients ofdetermination hardly surpassed 0,50.
Biomass estimates for trees with equa-tions developed. Additive proceduresCON and SUR computed unbiased totalbiomass when using one independentvariable. In contrast the HAR additiveprocedure (ii) underestimated leaf butoverestimated stem biomass componentswhen using one single independentvariable for one equation for all species.However, the HAR procedure providedunbiased total biomass estimates for eachspecies. For the best multiple regressionmodels, the SUR procedure slightlyoverestimated total biomass but for onlyP. engelmannii . The potential causes ofthis deviation could not be determined.However, a poor regression fitting mayhave explained this deviation.
Contrasting additive procedures
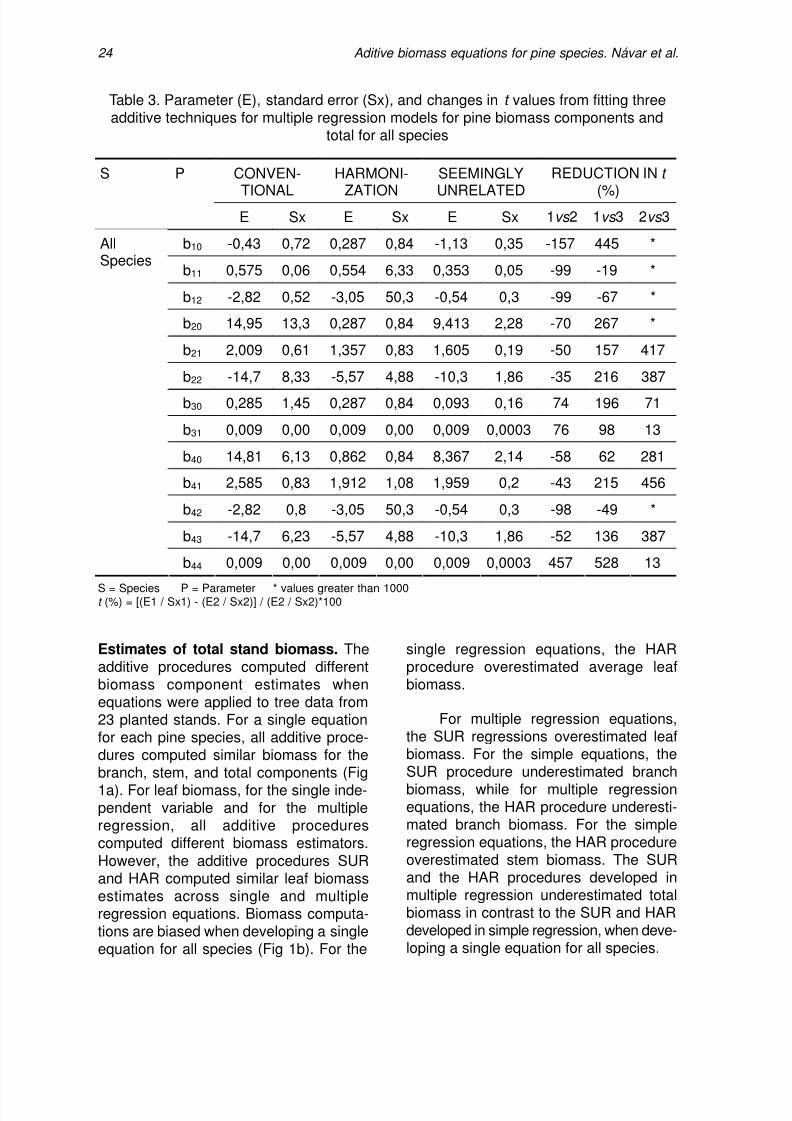
Standard errors on the parameter esti-mates. The standard errors of the para-meter estimates are smaller, often byseveral orders of magnitude in SUR incontrast to CON and HAR procedures(Table 3). Therefore, thet values are alsoseveral orders of magnitude larger whenusing SUR procedures. For the simplevariable equation, the average t valuesincrease approximately 27 % and 1 500 %in additive procedure SUR in contrast to
22 Aditive biomass equations for pine species. Návar et al.
H D ln b D ln b H D b b y leaf 2
13122
1110 +++=
D ln b D b b y branch 222120 ++=
H D b b y stem 23130 +=
H D ln b
D b D ln b H D b b y total 2
44
43422
4140
+
+++=
H D ln b D b b y leaf 2
121110 ++=
H D b b y branch 2
2120 +=
H D ln b D b b y stem 2
323130 ++=
H D b
H D ln b D b b y total 2
43
2424140
+
++=
H ln b D b b y leaf 121110 ++=
D ln b D b b y branch 222120 ++=
H D b b y stem 2
3130 +=
H D b
D ln b H ln b D b b y total 2
44
43424140
+
+++=
8/6/2019 NAVAR JOSE 2004 Additive Biomass Equations for Pine Species DURANGO
http://slidepdf.com/reader/full/navar-jose-2004-additive-biomass-equations-for-pine-species-durango 7/12
additive procedures CON and HAR,respectively. The harmonization proce-dure also consistently increased the t values in contrast to the CON procedureby an average of 38 %. For the bestregression equation, the t values incre-ased in additive procedure SUR by 418 %
and 4 279 % in contrast to thet valuesestimated for the conventional andharmonization procedures, respectively.The harmonization procedure againconsistently had highert values, on theaverage 1 057 % in contrast to additiveprocedure CON.
23 Madera y Bosques 10(2), 2004:17-28
GOODNESS OF FIT STATISTICSSPECIES EQUATION
r2(%) Sx(kg) CV(%) S(%) Pe(%)
LS 82 6,2 34 22 80
NLS 68 8,1 45 37 104
LTS 81 6,2 35 24 85
ML 86 5,6 31 22 81
All species
MNL 83 6,1 34 20 77
LS 88 5,4 28 22 69
NLS 62 9,9 52 42 289
LTS 80 7,1 37 27 62ML 89 5,6 29 24 67
P.durangensis
MNL 86 6,2 32 22 66
LS 89 4,2 25 16 31
NLS 73 6,8 40 35 148
LTS 89 4,3 26 20 28
ML 94 3,6 21 14 22
P. cooperii
MNL 93 3,9 23 13 20
LS 86 4,9 32 39 69
NLS 52 9,1 59 43 110
LTS 68 7,4 48 24 36
ML 88 5,1 33 34 40
P. engelmannii
MNL 85 5,6 37 18 27
Table 2. Statistics of goodness of fit for selecting a single and a multiple equationto test three additivity procedures for total biomass for pine trees planted in
Durango, Mexico
LS = Simple LinearNLS = Simple Non-linearLTS = Simple Log-transformed
ML = Multiple LinearMNL = Multiple non-linear regression
8/6/2019 NAVAR JOSE 2004 Additive Biomass Equations for Pine Species DURANGO
http://slidepdf.com/reader/full/navar-jose-2004-additive-biomass-equations-for-pine-species-durango 8/12
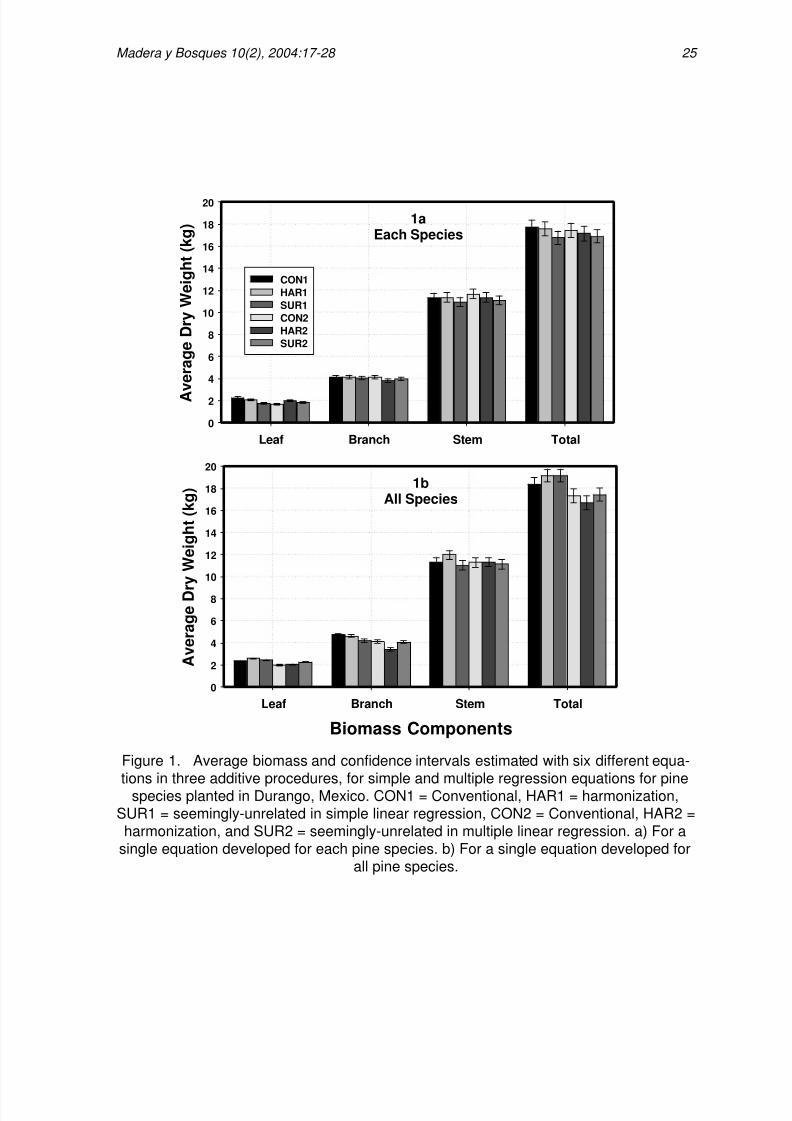
Estimates of total stand biomass. Theadditive procedures computed differentbiomass component estimates whenequations were applied to tree data from23 planted stands. For a single equationfor each pine species, all additive proce-dures computed similar biomass for thebranch, stem, and total components (Fig1a). For leaf biomass, for the single inde-pendent variable and for the multipleregression, all additive procedurescomputed different biomass estimators.However, the additive procedures SURand HAR computed similar leaf biomassestimates across single and multipleregression equations. Biomass computa-tions are biased when developing a singleequation for all species (Fig 1b). For the
single regression equations, the HARprocedure overestimated average leafbiomass.
For multiple regression equations,the SUR regressions overestimated leafbiomass. For the simple equations, theSUR procedure underestimated branchbiomass, while for multiple regressionequations, the HAR procedure underesti-mated branch biomass. For the simpleregression equations, the HAR procedureoverestimated stem biomass. The SURand the HAR procedures developed inmultiple regression underestimated totalbiomass in contrast to the SUR and HARdeveloped in simple regression, when deve-loping a single equation for all species.
24 Aditive biomass equations for pine species. Návar et al.
CONVEN-
TIONAL
HARMONI-
ZATION
SEEMINGLY
UNRELATED
REDUCTION IN t
(%)
S P
E Sx E Sx E Sx 1vs 2 1 vs 3 2 vs 3
b10 -0,43 0,72 0,287 0,84 -1,13 0,35 -157 445 *
b11 0,575 0,06 0,554 6,33 0,353 0,05 -99 -19 *
b12 -2,82 0,52 -3,05 50,3 -0,54 0,3 -99 -67 *
b20 14,95 13,3 0,287 0,84 9,413 2,28 -70 267 *
b21 2,009 0,61 1,357 0,83 1,605 0,19 -50 157 417
b22 -14,7 8,33 -5,57 4,88 -10,3 1,86 -35 216 387
b30 0,285 1,45 0,287 0,84 0,093 0,16 74 196 71
b31 0,009 0,00 0,009 0,00 0,009 0,0003 76 98 13
b40 14,81 6,13 0,862 0,84 8,367 2,14 -58 62 281
b41 2,585 0,83 1,912 1,08 1,959 0,2 -43 215 456
b42 -2,82 0,8 -3,05 50,3 -0,54 0,3 -98 -49 *
b43 -14,7 6,23 -5,57 4,88 -10,3 1,86 -52 136 387
AllSpecies
b44 0,009 0,00 0,009 0,00 0,009 0,0003 457 528 13
Table 3. Parameter (E), standard error (Sx), and changes int values from fitting threeadditive techniques for multiple regression models for pine biomass components and
total for all species
S = Species P = Parameter * values greater than 1000t (%) = [(E1 / Sx1) - (E2 / Sx2)] / (E2 / Sx2)*100
8/6/2019 NAVAR JOSE 2004 Additive Biomass Equations for Pine Species DURANGO
http://slidepdf.com/reader/full/navar-jose-2004-additive-biomass-equations-for-pine-species-durango 9/12
25 Madera y Bosques 10(2), 2004:17-28
1aEach Species
Leaf Branch Stem Total
A v e r a g e
D r y
W e i g
h t ( k g )
0
2
4
6
8
10
12
14
16
18
20
CON1HAR1SUR1CON2HAR2SUR2
1bAll Species
Biomass ComponentsLeaf Branch Stem Total
A v e r a g e
D r y
W e i g
h t ( k g )
0
2
4
6
8
10
12
14
16
18
20
Figure 1. Average biomass and confidence intervals estimated with six different equa-
tions in three additive procedures, for simple and multiple regression equations for pinespecies planted in Durango, Mexico. CON1 = Conventional, HAR1 = harmonization,SUR1 = seemingly-unrelated in simple linear regression, CON2 = Conventional, HAR2 =harmonization, and SUR2 = seemingly-unrelated in multiple linear regression. a) For a
single equation developed for each pine species. b) For a single equation developed forall pine species.
8/6/2019 NAVAR JOSE 2004 Additive Biomass Equations for Pine Species DURANGO
http://slidepdf.com/reader/full/navar-jose-2004-additive-biomass-equations-for-pine-species-durango 10/12
DISCUSSION
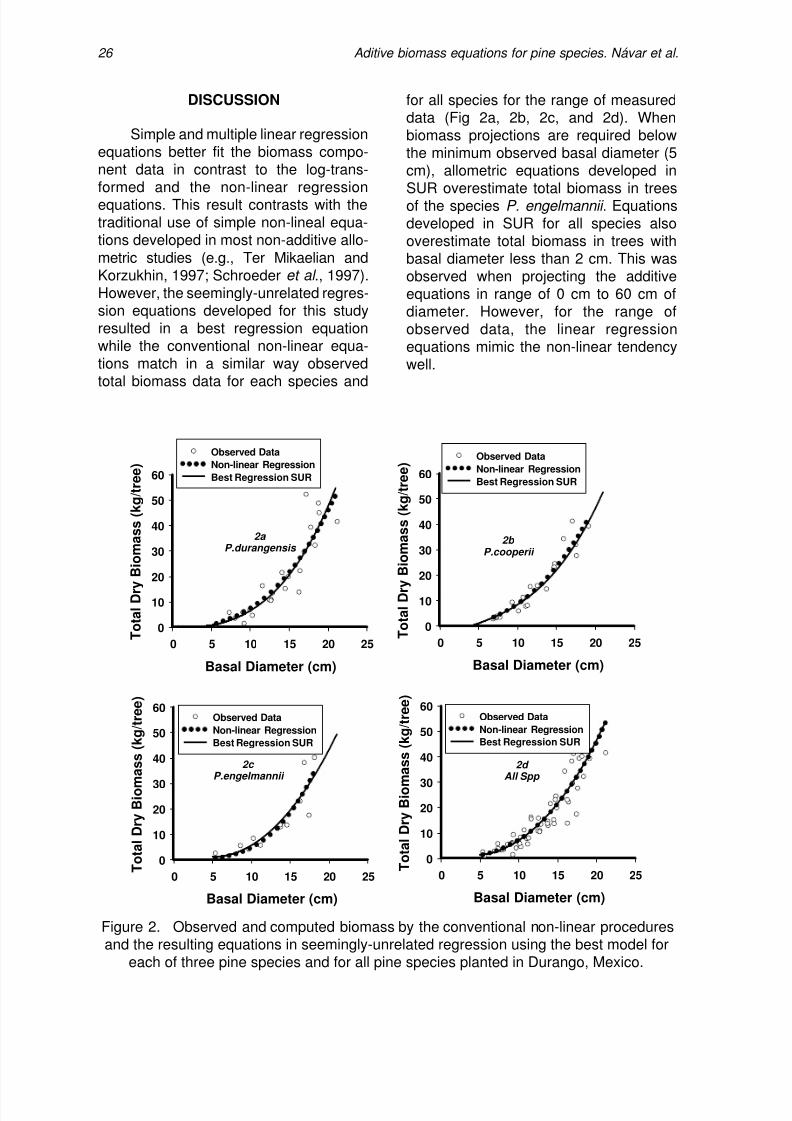
Simple and multiple linear regressionequations better fit the biomass compo-nent data in contrast to the log-trans-formed and the non-linear regressionequations. This result contrasts with thetraditional use of simple non-lineal equa-tions developed in most non-additive allo-metric studies (e.g., Ter Mikaelian andKorzukhin, 1997; Schroederet al ., 1997).However, the seemingly-unrelated regres-sion equations developed for this studyresulted in a best regression equationwhile the conventional non-linear equa-tions match in a similar way observedtotal biomass data for each species and
for all species for the range of measureddata (Fig 2a, 2b, 2c, and 2d). Whenbiomass projections are required belowthe minimum observed basal diameter (5cm), allometric equations developed inSUR overestimate total biomass in treesof the species P. engelmannii . Equationsdeveloped in SUR for all species alsooverestimate total biomass in trees withbasal diameter less than 2 cm. This wasobserved when projecting the additiveequations in range of 0 cm to 60 cm ofdiameter. However, for the range ofobserved data, the linear regressionequations mimic the non-linear tendencywell.
26 Aditive biomass equations for pine species. Návar et al.
Basal Diameter (cm)
0 5 10 15 20 25 T o
t a l D r y
B i o m a s s
( k g / t r e e )
0
10
20
30
40
50
60
Observed DataNon-linear RegressionBest Regression SUR
2a P.durangensis
Basal Diameter (cm)
0 5 10 15 20 25 T o
t a l D r y
B i o m a s s
( k g / t r e e )
0
10
20
30
40
50
60
2b P.cooperii
Basal Diameter (cm)
0 5 10 15 20 25 T o
t a l D r y
B i o m
a s s ( k g / t r e e )
0
10
20
30
40
50
60
2c P.engelmannii
Basal Diameter (cm)
0 5 10 15 20 25 T o
t a l D r y
B i o m
a s s ( k g / t r e e )
0
10
2030
40
50
60
2d All Spp
Observed DataNon-linear RegressionBest Regression SUR
Observed DataNon-linear RegressionBest Regression SUR
Observed DataNon-linear RegressionBest Regression SUR
Figure 2. Observed and computed biomass by the conventional non-linear proceduresand the resulting equations in seemingly-unrelated regression using the best model for
each of three pine species and for all pine species planted in Durango, Mexico.
8/6/2019 NAVAR JOSE 2004 Additive Biomass Equations for Pine Species DURANGO
http://slidepdf.com/reader/full/navar-jose-2004-additive-biomass-equations-for-pine-species-durango 11/12
The seemingly-unrelated regressionclearly is the method of choice for fittingadditive biomass component equations.This additive procedure achieves lowervariance as seen by the confidencebounds of equation coefficients. ThereforeSUR is a more efficient estimator(Parresol, 1999). It is more flexible andtakes into account statistical dependen-cies among sample data by setting cons-traints on the coefficients (Cunia andBriggs, 1985; Parresol, 1999). Otheradvantages of using SUR include (a)predictions of the components add up tothe prediction for the total tree and (b) thecoefficients are more consistent (Cuniaand Briggs, 1984; Parresol, 1999).
Moreover, there is an increasingneed for estimating biomass compart-ments for environmental-related issues,productivity, and economic values.However, this procedure is the most diffi-cult additive method to calculate in thisanalysis, and predictions beyond thecharacteristics of measured trees areuncertain (Cunia and Briggs, 1984).Extrapolation uncertainty is also a featureof all regressions developed in this study.
Should additive procedures be usedto estimate total biomass, attention mustbe paid to selecting the right equationwhen quantifying total biomass at thestand scale. In this research, it is shownthat different additive equations mightprovide different biomass estimates, andthis finding could also apply to non-addi-tive procedures. Indeed, Woods et al .(1991) found that most of the error in esti-mating biomass density was attributed tothe method of parameter estimation.Another potential sources of errorfrequently mentioned is the componentdue to the random selection of the sampleunit (Woodset al ., 1991; Parresol, 1999).It is a function of the sampling design, thesample size, the type of estimator used,and the inherent variation between thesample units. The exploration of the latter
error sources is of paramount importanceand should be addressed accordingly toprovide reliable stand biomass quantifica-tion.
CONCLUSIONS
Equations to estimate aboveground,standing biomass were developed forthree single species and for the set ofthree, typical of small-scale forest planta-tions of Durango, Mexico. Equationsdeveloped using additive procedures inseemingly-unrelated regressions compu-ted biomass components with the largestefficiency and they were consistent withequations developed in non-additive non-linear regression. Since they providedaverage estimates, additive equations inseemingly-unrelated multiple linearregression for each species or all speciesare recommended to quantify biomasscomponents in biomass inventory of theconiferous forest plantations of Durango,Mexico.
ACKNOWLEDGMENTS
The Mexican Foundation for Scienceand Technology and University Fund forScience and Technology funded thisproject through research grants 28536-Band CN 323-00, respectively.
REFERENCES
Brown, S. 1997. Los bosques y el cambioclimatico: el papel de los terrenosforestales como sumideros decarbono. In : Actas del XI CongresoMundial Forestal: RecursosForestales y Arboles. Vol 1. AntalyaTurky 13-22 October of 1997.
Clutter, J.L.; J.C. Forston; L.V. Pienaar;G.H. Brister and R.L. Bailey. 1983.
27 Madera y Bosques 10(2), 2004:17-28
8/6/2019 NAVAR JOSE 2004 Additive Biomass Equations for Pine Species DURANGO
http://slidepdf.com/reader/full/navar-jose-2004-additive-biomass-equations-for-pine-species-durango 12/12
Timber management: A quantitativeapproach. Wiley, New York. 333 p.
Cunia, T. and R.D. Briggs. 1984. Forcingadditivity of biomass tables - someempirical results. Canadian Journalof Forest Research 14: 376-384.
Cunia, T. and R.D. Briggs. 1985. Forcingadditivity of biomass tables - use ofthe generalized least-squaremethod. Canadian Journal of ForestResearch 15: 23-28.
Houghton, R.A. 1991. Tropical deforesta-tion and carbon dioxide. ClimateChange 19: 99-118.
Mohren, F. and K. Goldewijk. 1990. CO2Fix Model. Institute of Forestry andNature Research. Wageningen,Holanda.
Návar C., J.J.; J. Nájera, and E. Jurado.2002. Biomass estimation equationsin the Tamaulipan thornscrub of
northeastern Mexico. Journal of AridEnvironments 52:167-179.
Parresol, B. 1999. Assessing tree andstand biomass: a review with exam-ples and critical comparisons. For.Sci. 45:573-593.
Schroeder, P.; S. Brown; J. Mo; R. Birdseyand C. Cieszewski. 1997. Biomassestimation for temperate broadleafforest of the United States usinginventory data. For. Sci. 43:424-434.
Ter-Mikaelian, M.T. and Korzukhin, M.D.1997. Biomass equations for sixtyfive North American tree species.Forest Ecology and Management97:1-24.
Woods, K.D.; A.H. Feiveson and D.B.,Botkin. 1991. Statistical analysis forbiomass density and leaf-area indexestimation. Canadian Journal ofForest Research 21:974-989.±
28 Aditive biomass equations for pine species. Návar et al.
Manuscrito recibido el 30 de octubre de 2003.Aceptado el 12 de julio de 2004.
Este documento se debe citar como:Návar Ch., J.J.; N. González B.; J.J. Graciano L.; V. Dale y B. Parresol. 2004. Additive biomass equations for
pine species of forest plantations of Durango, Mexico. Madera y Bosques 10(2):17-28.