naval postgraduate school · civil engineering budget analyst (construction data), capt bradley...
TRANSCRIPT

NAVAL POSTGRADUATE
SCHOOL
MONTEREY, CALIFORNIA
MBA PROFESSIONAL REPORT
The Effects of Relocation of Yongsan Garrison on Labor Cost Sharing
By: David T. Kim, Frank T. Skrypak, and Francis P. Brown
September 2006
Advisors: Aruna U. Apte
Randall B. Howard
Approved for public release; distribution is unlimited.

THIS PAGE INTENTIONALLY LEFT BLANK

i
REPORT DOCUMENTATION PAGE Form Approved OMB No. 0704-0188 Public reporting burden for this collection of information is estimated to average 1 hour per response, including the time for reviewing instruction, searching existing data sources, gathering and maintaining the data needed, and completing and reviewing the collection of information. Send comments regarding this burden estimate or any other aspect of this collection of information, including suggestions for reducing this burden, to Washington headquarters Services, Directorate for Information Operations and Reports, 1215 Jefferson Davis Highway, Suite 1204, Arlington, VA 22202-4302, and to the Office of Management and Budget, Paperwork Reduction Project (0704-0188) Washington DC 20503. 1. AGENCY USE ONLY (Leave blank)
2. REPORT DATE September 2006
3. REPORT TYPE AND DATES COVERED MBA Professional Report
4. TITLE AND SUBTITLE: The Effects of Relocation of Yongsan Garrison on Labor Cost Sharing 6. AUTHOR(S) David T. Kim, Frank T. Skrypak, Francis P. Brown
5. FUNDING NUMBERS N/A
7. PERFORMING ORGANIZATION NAME(S) AND ADDRESS(ES) Naval Postgraduate School Monterey, CA 93943-5000
8. PERFORMING ORGANIZATION REPORT NUMBER N/A
9. SPONSORING / MONITORING AGENCY NAME(S) AND ADDRESS(ES) Yongsan Garrison USFK Seoul, Republic of Korea
10. SPONSORING / MONITORING AGENCY REPORT NUMBER N/A
11. SUPPLEMENTARY NOTES The views expressed in this report are those of the author(s) and do not reflect the official policy or position of the Department of Defense or the U.S. Government. 12a. DISTRIBUTION / AVAILABILITY STATEMENT Approved for public release; distribution is unlimited
12b. DISTRIBUTION CODE
13. ABSTRACT (maximum 200 words)
The objective of this project is to estimate the amount of labor cost sharing (LCS) for both the United States Forces Korea (USFK) and the Republic of Korea government, using a forecasting model. This essential tool will allow leadership in the Korean peninsula to make decisions ahead of time that may prevent demonstrations and mass layoffs affecting the mission and the objective of U.S. presence in the region. With the planned move of Yongsan Garrison from Seoul to the Pyeongtaek region in 2008, there will be a mass consolidation in supporting units. The consolidation will result in reduced need of Korean Nationals (KN) in the region. Although the forecasting model may not result in perfect information, it will give the leadership a better tool to make critical decisions regarding the future of KN employees who are vital to the mission.
15. NUMBER OF PAGES
61
14. SUBJECT TERMS Yongsan Garrison, Relocation, Labor Cost Sharing, United States Forces Korea, Republic of Korea, Osan Air Base, Korean Peninsula, Demilitarized Zone, Korean Labor Union, Land Partnership Plan, Special Measurements Agreement 16. PRICE CODE
17. SECURITY CLASSIFICATION OF REPORT
Unclassified
18. SECURITY CLASSIFICATION OF THIS PAGE
Unclassified
19. SECURITY CLASSIFICATION OF ABSTRACT
Unclassified
20. LIMITATION OF ABSTRACT
UL NSN 7540-01-280-5500 Standard Form 298 (Rev. 2-89) Prescribed by ANSI Std. 239-18

ii
THIS PAGE INTENTIONALLY LEFT BLANK

iii
Approved for public release; distribution is unlimited
THE EFFECTS OF RELOCATION OF YONGSAN GARRISON ON LABOR COST SHARING
David T. Kim, Captain, United States Air Force Frank T. Skrypak, 1st Lieutenant, United States Air Force
Francis P. Brown, Lieutenant, United States Navy
Submitted in partial fulfillment of the requirements for the degree of
MASTER OF BUSINESS ADMINISTRATION
from the
NAVAL POSTGRADUATE SCHOOL September 2006
Authors: _____________________________________
David T. Kim _____________________________________
Frank T. Skrypak _____________________________________ Francis P. Brown Approved by: _____________________________________
Aruna U. Apte, Co- Advisor _____________________________________ Randall B. Howard, Co- Advisor _____________________________________ Robert N. Beck, Dean
Graduate School of Business and Public Policy

iv
THIS PAGE INTENTIONALLY LEFT BLANK

v
THE EFFECTS OF RELOCATION OF YONGSAN GARRISON ON LABOR COST SHARING
ABSTRACT
The objective of this project is to estimate the amount of labor cost sharing (LCS)
for both the United States Forces Korea (USFK) and the Republic of Korea government,
using a forecasting model. This essential tool will allow leadership in the Korean
peninsula to make decisions ahead of time that may prevent demonstrations and mass
layoffs affecting the mission and the objective of U.S. presence in the region. With the
planned move of Yongsan Garrison from Seoul to the Pyeongtaek region in 2008, there
will be a mass consolidation in supporting units. The consolidation will result in reduced
need of Korean Nationals (KN) in the region. Although the forecasting model may not
result in perfect information, it will give the leadership a better tool to make critical
decisions regarding the future of KN employees who are vital to the mission.

vi
THIS PAGE INTENTIONALLY LEFT BLANK

vii
TABLE OF CONTENTS
I. INTRODUCTION........................................................................................................1 A. PURPOSE.........................................................................................................1 B. BACKGROUND ..............................................................................................1 C. RESEARCH QUESTIONS.............................................................................2 D. METHODOLOGY ..........................................................................................2 E. ORGANIZATION ...........................................................................................3 F. BENEFITS OF STUDY...................................................................................3
II. OVERVIEW OF RELOCATION OF YONGSAN/LABOR COST-SHARING.....................................................................................................................5 A. PURPOSE.........................................................................................................5 B. KOREAN WAR BACKGROUND.................................................................5 C. CURRENT STATE..........................................................................................6 D. PRESIDENTS’ INTENT.................................................................................6 E. ROK-US ALLIANCE......................................................................................7 F. TRANSFORMATION.....................................................................................7 G. ALIGNMENT ..................................................................................................8 H. USFK COMMANDER’S INTENT ................................................................8 I. YONGSAN RELOCATION (YRP) ...............................................................9 J. FUNDING.......................................................................................................10 K. LABOR COST SHARING............................................................................11
III. OVERVIEW OF ASSUMPTIONS ..........................................................................13 A. PURPOSE.......................................................................................................13 B. LABOR COST SHARING HISTORICAL DATA.....................................13 C. LABOR COST SHARING ASSUMPTIONS..............................................13 D. RELOCATION ASSUMPTIONS ...............................................................15
IV. USFK/KN TRANSFORMATION............................................................................17 A. PURPOSE.......................................................................................................17 B. TRANSFORMATION BACKGROUND ....................................................17 C. USFK SERVICE MEMBER REQUIREMENTS.......................................20 D. USFK KOREAN NATIONAL REQUIREMENTS....................................21 E. AFTER THE TRANSFORMATION...........................................................24
V. LCS DATA ANALYSIS ............................................................................................25 A. PURPOSE.......................................................................................................25 B. PURPOSE OF THE ANALYSIS..................................................................25 C. METHODOLOGY ........................................................................................25 D. THE PREFERRED MODEL........................................................................34
VI. CONCLUSION AND RECOMMENDATIONS.....................................................37 A. PURPOSE.......................................................................................................37 B. ANALYTICAL FINDINGS ..........................................................................37 C. ENVIRONMENTAL ISSUE.........................................................................37

viii
D. FUNDING THE RELOCATION .................................................................38 E. RETURN OF THE WARTIME COMMAND............................................39 F. HOPEFUL REUNIFICATION ....................................................................39 G. RECOMMENDATIONS...............................................................................40
LIST OF REFERENCES......................................................................................................41
INITIAL DISTRIBUTION LIST .........................................................................................43

ix
LIST OF FIGURES
Figure 1. Two Phase Plan................................................................................................18 Figure 2. LCS Share ........................................................................................................26 Figure 3. Republic of Korea Military End Strength (1950-2006)...................................27 Figure 4. Total LCS Payments By Rep. of Korea (1991-2006) ......................................28 Figure 5. ROK LCS Share as a Moving Average of n=4 (1995-2010)...........................30 Figure 6. WMA Application and Results........................................................................31 Figure 7. ROK LCS Contributions (Actual vs. Exponential Smoothing Forecast) ........33 Figure 8. ROK LCS Contributions (Actual vs. Exponential Smoothing
Optimization) ...................................................................................................34

x
THIS PAGE INTENTIONALLY LEFT BLANK
xi
LIST OF TABLES
Table 1. 2008 USFK Military Stationing.......................................................................20 Table 2. Regression Output............................................................................................22 Table 3. 2008 KN Stationing .........................................................................................23 Table 4. 2008 USFK & KN Stationing ..........................................................................23 Table 5. Trends in Korean Defense Budgeting (In Billion Korean Won) .....................27 Table 6. Regression Output............................................................................................29

xii
THIS PAGE INTENTIONALLY LEFT BLANK

xiii
LIST OF ABBREVIATIONS
AF Air Force
ATFT Army’s Total Force Transformation
CFCOM Combined Forces Command
DMZ Demilitarized Zone
DoD Department of Defense
FYDP Future Year Defense Plan
GNP Grand National Party
KN Korean Nationals
KNEU Korean National Employees Union
LCS Labor Cost Sharing
LPP Land Partnership Plan
PACAF Pacific Air Force
ROK Republic of Korea
ROKA Republic of Korea Army
SMA Special Measures Agreement
UN United Nations
USFK United States Forces Korea
YRP Yongsan Relocation Plan

xiv
THIS PAGE INTENTIONALLY LEFT BLANK
xv
ACKNOWLEDGMENTS
The following individuals are acknowledged for their efforts and assistance in
completion of this MBA Professional Project: Major Tracey Watkins, USFK Financial
Management Officer (LCS Data), Dr. Warren Switzer, J5 Contractor (Special
Measurements Agreement), Mr. Charles Shin, J5 Lawyer (Congressional Reports), Lt
Col Kelly Slaven, Theater Master Planner (Yongsan Relocation), Mr. Om Tae Kwang,
Civil Engineering Budget Analyst (Construction Data), Capt Bradley Drapeaux, Osan
Budget Officer for funding and sponsoring the MBA Professional Project, and we would
like to extend our deep appreciation to Dr. Aruna Apte and Lt Col Randall Howard for
acting as our advisors and also for their tireless efforts in guiding us to complete this
MBA Professional Project. Thank you all for your time and contributions to this project.

xvi
THIS PAGE INTENTIONALLY LEFT BLANK

1
I. INTRODUCTION
A. PURPOSE
The objective of this project is twofold. The first objective is to model and
forecast the labor cost sharing amount for both the USFK and the Republic of Korea
government. The second objective is to determine the number of Korean National
employees needed at Pyeongtaek once Yongsan makes the projected transition to the new
post in 2008.
B. BACKGROUND
The United States maintains a multi-year cost-sharing agreement with the
Republic of Korea. The most recent agreement expired in 2004. These accords
essentially build on past arrangements, and provide for significant and increasing host
country participation in cost sharing. This contribution is critical not only for
maintaining military readiness of our deployed forces, but also for sustaining the political
support that is essential to forward stationing, and thus to our ability to project U.S.
power and influence in defense of shared interests.
About 15,000 South Koreans are hired by the U.S. military and 12,000 of them
are paid by the Korean government under a cost-sharing program. In early April of 2005,
USFK announced that it would cut 1,000 South Korean jobs, citing the Korean
government’s decision to cut its contributions for the U.S. troop presence in Korea.1 As
progress in cost-share negotiations stagnated, the Korean National Employees Union
(KNEU) held many demonstrations at military installations. The contributions from the
Korean government are vital to meet all mission objectives within the Korean Peninsula.
The commands must be ready to fight every day since the Demilitarized Zone (DMZ) is
only 30 miles away from the capital of Korea, Seoul.
The Department of Defense announced on 23 July 2004 that representatives of the
Republic of Korea and United States finalized an agreement to relocate all U.S. Forces
from the Seoul metropolitan area to the Pyeongtaek area. The agreement fulfilled a
1 Jung S. Ki. “USFK to Cut Jobs on Base.” Hankook Times. 2006.

2
commitment made by President George W. Bush and President Roh Moo Hyun at their
summit meeting in Washington in May 2003.2 The relocation of U.S. Forces out of
Seoul will be completed by December of 2008. The labor cost sharing arrangements will
definitely be affected by the relocation. With the current budget deficit within USFK and
Air Force Pacific Command (PACAF), consolidation of many of their supporting
elements will be a key cost saving measure. The consolidation will be possible due to the
close proximity of the forces. This means that the same number of jobs will not be
needed, causing another dilemma around the labor cost-sharing issue. The Korean
government is aware of this situation and this may lead to less contribution than in past
years.
C. RESEARCH QUESTIONS
The key research questions that will be explored are as follows; With the move of
Yongsan south to the Pyeongtaek region, to what extent will the Korean government
reduce their share of the labor cost distribution for the 7th AF (Osan and Kunsan)? What
method can be used to estimate the LCS distribution? How will the amounts of shared
cost affect the end-strength of KN employees at Osan and Kunsan? To what extent will
the Pyeongtaek region transform as a result of the relocation? What types of activities
and services will be consolidated within the Pyeongtaek region? Will the consolidation
affect Korean National end-strength? What will be the relationship between the
consolidation efforts and the reduction of US Forces?
D. METHODOLOGY
The methodology used for this research is divided into five steps; review of
pertinent literature, collection of data, summarization of material, data analysis through
forecasting/simulation, and an assessment/recommendation of the outcome. Review of
literature was conducted on the Relocation of Yongsan and LCS. Since the relocation
has not yet occurred there were very few literary works to assess in this case. There
were however several articles found on LCS which will be used to establish a
foundational understanding of the situation and the process. The data was collected from
2 Jin S. Han. “Dealing with US Bases.” Hankook Times. 2004.
3
Yongsan Garrison, Osan AB, Kunsan AB, and Daegu. Historical records of LCS funding
since its inception in 1991 have been included. The data also contained a theater master
plan for the relocation of Yongsan in every aspect such as engineering, environmental
areas, funding, and land purchases to name a few. Information has been summarized for
content and compiled into relevant data in preparation for analysis. Data has been
analyzed to identify the best forecasting figure for the labor cost estimate. A final
analysis is provided to assess the best estimate for future labor cost funding.
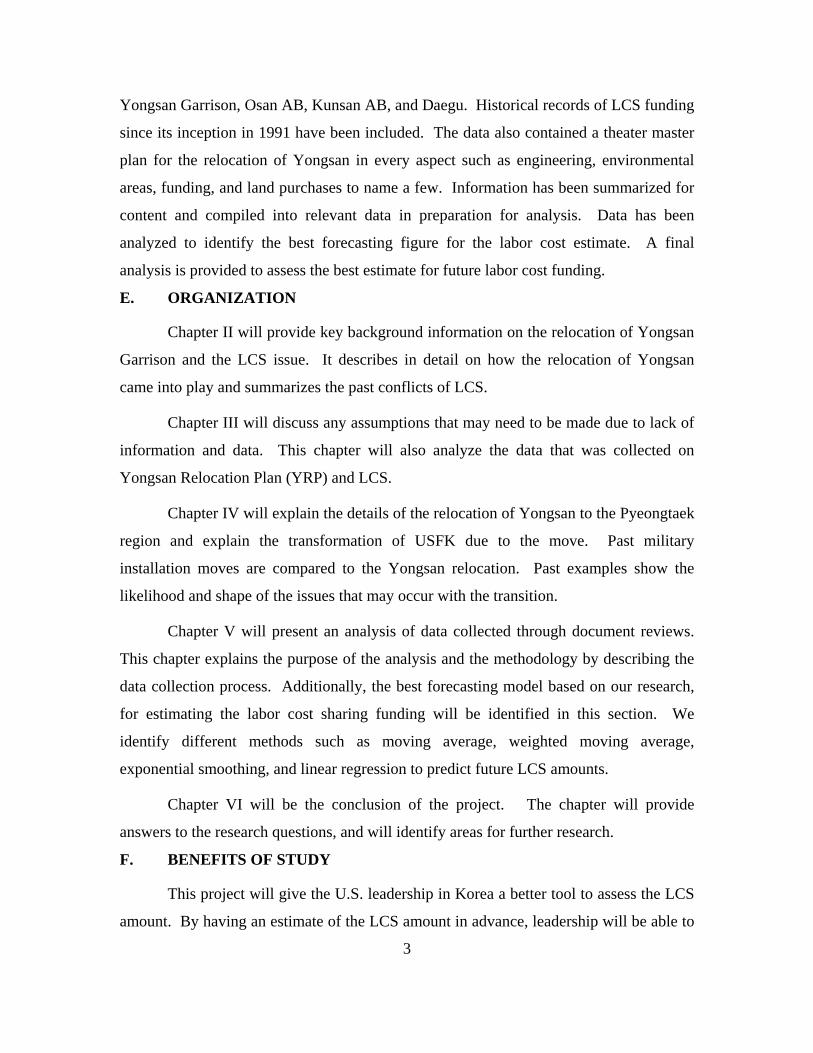
E. ORGANIZATION
Chapter II will provide key background information on the relocation of Yongsan
Garrison and the LCS issue. It describes in detail on how the relocation of Yongsan
came into play and summarizes the past conflicts of LCS.
Chapter III will discuss any assumptions that may need to be made due to lack of
information and data. This chapter will also analyze the data that was collected on
Yongsan Relocation Plan (YRP) and LCS.
Chapter IV will explain the details of the relocation of Yongsan to the Pyeongtaek
region and explain the transformation of USFK due to the move. Past military
installation moves are compared to the Yongsan relocation. Past examples show the
likelihood and shape of the issues that may occur with the transition.
Chapter V will present an analysis of data collected through document reviews.
This chapter explains the purpose of the analysis and the methodology by describing the
data collection process. Additionally, the best forecasting model based on our research,
for estimating the labor cost sharing funding will be identified in this section. We
identify different methods such as moving average, weighted moving average,
exponential smoothing, and linear regression to predict future LCS amounts.
Chapter VI will be the conclusion of the project. The chapter will provide
answers to the research questions, and will identify areas for further research.
F. BENEFITS OF STUDY
This project will give the U.S. leadership in Korea a better tool to assess the LCS
amount. By having an estimate of the LCS amount in advance, leadership will be able to

4
assess how many KN employees will be able to support the US role at each installation.
This will help the relocation to occur in an efficient manner that will assure a
continuation of a conflict free relationship between both the countries.

5
II. OVERVIEW OF RELOCATION OF YONGSAN/LABOR COST-SHARING
A. PURPOSE
This chapter gives an overview of how the United States military began its
presence in the Korean Peninsula. The chapter also gives an overview of leadership’s
intent in the region, the alliance between the two nations, and the transformation that is
occurring due to restructuring. It discusses the decision to relocate Yongsan from its
present location in Seoul to the Pyeongtaek region. Finally, it details how LCS came into
existence and discusses the latest problems that have occurred due to conflicts on each
side of the table.
B. KOREAN WAR BACKGROUND
On June 30, 1950, North Korean forces crossed the 38th parallel with 135,000
troops and attacked South Korea. Within days, the out-numbered and out-gunned South
Korean forces were in full retreat. Seoul was captured by the North Koreans on the
afternoon of July 3, 1950.3
In response to the North Korean actions, President Harry S. Truman ordered
General Douglas MacArthur, the Supreme Commander of Allied Forces, to transfer
munitions to the Republic of Korea Army (ROKA) and to provide air cover to protect the
evacuation of US citizens. Following this initial response, MacArthur then ordered an
amphibious invasion at Inchon. United Nations (U.N.) troops landed at Inchon, faced
only mild resistance and quickly moved to recapture Seoul. The United Nations troops
drove the North Koreans back past the 38th parallel. Many in the west, including General
MacArthur, thought that spreading the war to China would be necessary. However,
Truman and the other leaders disagreed, and MacArthur was ordered to be very cautious
when approaching the Chinese border.
3 Tah K. Jack. “The Korean War June 1950.” Institute of Defense Strategic Studies. 2006. p. 40.

6
The U.N. forces made the Chinese uncomfortable however, and China began an
assault on October 25, 1950.4 On January 4, 1951, Communist Chinese and North
Korean forces recaptured Seoul.5 MacArthur was succeeded by General Matthew
Ridgway, who managed to regroup U.N. forces for an effective counter-offensive. A
series of attacks managed to slowly drive back the communist forces. Heavy casualties
were inflicted on the Chinese and North Korean units as the Eighth Army advanced
several miles north of the 38th parallel.
C. CURRENT STATE
A cease fire was established on July 27, 1953, by which time the front line was
back in the proximity of the 38th parallel.6 The Demilitarized Zone (DMZ) was
established on the 38th parallel and is still defended today by North Korean troops on one
side, and South Korean and American troops on the other.
North Korea has been an enemy of the United States and the ROK for over 50-
years. Since, the armistice between the two nations, North Korea has caused a succession
of confrontations and clashes with the ROK-US alliance. The sinking of a ROK Navy
Patrol Vessel in June of 2002 was the latest of these violent encounters that included
assassination attempts on the ROK president.7
D. PRESIDENTS’ INTENT
2006 marks the 53rd anniversary of the Republic of Korea-United States Mutual
Defense Treaty and the Armistice Agreement. During a summit meeting in 2004,
President George Bush and President Roh Moo Hyun noted the significance of the long
standing partnership and highlighted the importance of crafting a relationship for
continued peace and prosperity on the Korean Peninsula. Both presidents pledged to
increase mutual security cooperation and to modernize the Republic of Korea-United
4 Tah K. Jack. p. 43. 5 Ibid., p. 48. 6 Ibid., pp. 68-69. 7 Ibid., p. 70.

7
States alliance with several initiatives. These initiatives include improving military
capabilities, consolidating United States Forces south of the Han River, and relocating
United States Forces from the Seoul Metropolitan area.
E. ROK-US ALLIANCE
The dynamics of the security environment has changed and as our bilateral
security relationship continues to adjust, our ROK-US alliance remains committed to its
fundamental purpose. The purpose is to deter or defeat North Korean aggression while
sustaining a commitment to regional stability. To ensure that the troops have the right
capabilities on the peninsula, Combined Forces Command (CFCOM) continues its
transformation strategy to enhance, shape, and align the forces in the area.8 This
transformation initiative is intended to optimize the complementary capabilities and
combat power that each nation contributes, while designing a stationing blueprint for the
United States forces in Korea.
F. TRANSFORMATION
Shaping combined forces by transferring selected military missions from the
United States forces to Republic of Korea forces is currently underway. These changes
acknowledge the growing capabilities of the ROK military and its growing role in its own
defense, while maintaining a firm U.S. commitment to peninsula security and regional
stability. In early 2004, the USFK end-strength was at 37,500 troops. The United States
and the Republic of Korea governments agreed to the reduction of 12,500 military
personnel from United States Forces Korea over a five-year period, which began in 2004.
Per the agreement, USFK has been reduced by 8,000 troops, to include the deployment of
the U.S. Second Infantry Division’s 2nd Brigade Combat Team to Iraq between 2004 and
2005. In 2006, USFK will be reduced by 2,000 more troops, and in 2007 and 2008, an
additional 2,500 will be reduced.9 The authorized end-strength will be left at 25,000
military personnel on the peninsula. These reductions principally affect the Eighth
8 Kevin Hawkins. “U.S. Forces Korea Fact Book.” Resource Management HQ U.S. Force Korea.
2006. pp. 7-8. 9 Ibid., p. 8.

8
United States Army, which will reduce its force while restructuring as part of the Army’s
Total Force Transformation (ATFT) effort. The Seventh Air Force will also be reduced,
but on a much smaller scale.
G. ALIGNMENT
Aligning the majority of United States forces in Korea into two enduring hubs is
the final component of the USFK transformation plan. This effort consists of the
consolidation of forces, and then their eventual southward relocation away from the
Seoul metropolitan area. This shift increases the operational flexibility of the U.S. forces
on the peninsula. In 2004, USFK concluded negotiations with the ROK to relocate US
forces from the area north of the Han River and from Yongsan Army Garrison. The
location to which the forces will move is Camp Humphreys, which is near the city of
Pyeongtaek. One key aspect of the agreement is the relocation of the Yongsan Garrison
out of Seoul. This shift was initiated at the request, and expense, of the ROK
government.10
A second aspect of the agreement is the consolidation and realignment of the
United States Second Infantry Division south of the Han River. As planned, the Second
Infantry Division realignment is occurring in two phases. The first phase consolidates the
Second Infantry Division into existing installations, while new facilities are prepared at
Camp Humphreys. This consolidation effort is already underway and is progressing as
planned. Once construction at Camp Humphreys is complete, actions to relocate the
Second Infantry Division into the new facilities will begin. Two sources of funding are
necessary for this plan to be executed. The first is the funding of United States military
construction projects in Korea. These projects are contained in the Future Years Defense
Plan (FYDP). Another important funding source should come from the ROK, as a host
nation burden sharing of the construction funds.
H. USFK COMMANDER’S INTENT
General B.B. Bell serves as the senior military member in the Republic of Korea.
He is the Commander of the United Nations Command and the United States/Republic of
10 Kevin Hawkins. p. 8.

9
Korea Combined Forces Command, and Commander, USFK. His focus is on the
transformation of the Forces in the Korean Peninsula.11 The transformation efforts will
result in units with enhanced deterrence and warfighting capabilities. Transformation
will also support a thirty-three percent reduction of United States forces in Korea and a
sixty-six percent overall reduction of real estate occupied by U.S. forces.12 All these
efforts provide increased readiness and a less intrusive presence in the region. An
additional benefit is a realization of greater economies of scale which in turn generates
efficiencies and cost savings. Finally, transformation provides a strategically mobile
force capable of dissuading potential threats to the Republic of Korea- United States
Alliance and to United States interests in the region of Northeast Asia.
I. YONGSAN RELOCATION (YRP)
In October 2004, the Republic of Korea Minister of National Defense and the
Commander of United States Forces Korea signed the Yongsan Relocation Plan
Agreement. This agreement was ratified by the Republic of Korean National Assembly
in December 2004.13 According to the terms of this agreement, the headquarters
elements of the United Nations Command, Combined Forces Command, and United
States Forces Korea will relocate to Camp Humphreys in 2007. All other units currently
in Seoul will finish relocating by December 2008. Over ninety percent of Yongsan will
be returned to the Republic of Korea with only a small presence of approximately fifty
personnel remaining in Seoul. This group will serve as a liaison between the United
Nations Command, the Combined Forces Command, the United States Forces Korea, and
various ministries and organizations of the government of the Republic of Korea.
Additionally, the Dragon Hill Lodge, an Armed Forces Recreation Center for United
States Forces Korea service members and their families, will remain in operation.14
The alignment of the Eighth United States Army’s Second Infantry Division is
part of this overall consolidation and relocation plan. The Second Infantry Division’s
11 Kevin Hawkins. p. 11. 12 Ibid., pp. 12-13. 13 USFK. “Yongsan Relocation Plan (YRP).” PowerPoint FOUO. 2006. p. 2. 14 Ibid., p. 3.

10
alignment will occur in two phases. The first phase, an extension of the 2002 Land
Partnership Plan Agreement, consolidates the Second Infantry Division into existing
installations at Camps Casey, Hovey, Red Cloud and Stanley. Once new facilities are
prepared the units will relocate south of the Han River, primarily at Camp Humphreys, by
2008.15 The consolidation phase is currently well ahead of schedule. Thirty-one
facilities have been closed, freeing up 11,000 acres that have a tax assessment value of
over $500 million. By the end of calendar year 2008 a total of 50 facilities are planned to
be closed, which equates to over 36,000 acres of freed up land.16 This land, when
returned to ROK control, will account for almost two-thirds of the total land granted to
United States under the Status of Forces Agreement (SOFA).
J. FUNDING
In accordance with the Yongsan Relocation Agreement, the Republic of Korea
will pay most of the costs associated with moving United Nations Command, Combined
Forces Command, and United States Forces Korea organizations. Included are the costs
of moving equipment, personnel and family members from Yongsan to other
installations.
Two sources of sustained funding of United States military construction projects
at Camp Humphreys, and Osan and Kunsan Air Bases are crucial to the relocation plan’s
complex schedule. The U.S. funding contained in the FYDP designated for barracks,
dormitories and family housing units, coupled with Republic of Korea host nation funded
construction projects will ensure the completion of the plan.17 Additionally, there are
some commercially financed build-to-lease projects that play an important role in the
project timeline.
Although the relocation of Yongsan will be funded by the Republic of Korea
government, there are many aspects of burden sharing that both the United States and
Republic of Korea will participate in bilaterally. The Special Measures Agreement
15 Kevin Hawkins. pp. 7-8. 16 Ibid., pp. 9-10. 17 Ibid., p. 12

11
(SMA) was created to negotiate the amounts, terms, exchange rates, and inflation rates
used by the two governments in sharing the burden of the stationing costs.18 Within the
SMA is the LCS agreement between the two nations.
K. LABOR COST SHARING
The South Korean government started the labor cost sharing program in 1991
with a contribution of over $30K to assist in paying Korean National (KN) employees
who were working at US military installations throughout the Korean Peninsula.19 KN
employees consist of permanent employees and temporary employees. With factors such
as inflation, a rapid growth of the Korean economy and the ever changing military stance
in South Korea, the $30K contribution grew to approximately $283K by 1996.20 The
labor cost sharing program is under the SMA. The recent SMA expired in 1994 causing
uncertainty with the funding amounts. In 1995, there were approximately 15,000 Korean
National employees working on US installations. Approximately 12,000 of those KN
employees’ salaries were paid for by the South Korean government. Due to unexpected
cut in labor cost sharing from the South Korean government in 1995, USFK was forced
to cut 1,000 South Korean jobs. The South Korean government cited that the funding cut
was due to the planned reduction and ongoing restructuring of the U.S. troop force. The
allies agreed to cut the number of American soldiers to 25,000 by 2008.21
The reduction in labor cost funding forced each military installation on the
peninsula to cut temporary jobs, and give permanent employees near retirement age, an
early exit. The commanders knew the KN employees were a vital part of the mission and
they could ill afford to lose any of them. However, without funding, the leadership did
not have a choice. In the meantime, the Korean Employees Union at USFK decided to
18 Warren Switzer. “Burdensharing and Special Measures Agreement.” PowerPoint FOUO. 2006. p.
2. 19 Tracy Watkins. “Labor Cost Sharing.” Spreadsheet USFK. 2006. p. 1. 20 Ibid., p. 1. 21 Jung S. Ki. “USFK to Cut Jobs on Base.” Hankook Times. 2006.

12
hold several demonstrations near military installations venting their anger at the U.S.
leadership for letting go of KN employees. The SMA negotiations are currently under
intense discussion.

13
III. OVERVIEW OF ASSUMPTIONS
A. PURPOSE
This chapter gives an overview of any assumptions that were made due to lack of
information or data on both the Labor Cost Sharing program and the Relocation of
Yongsan Garrison. All assumptions are based on historical data and recent events that
have occurred as the relocation is still an ongoing process.
B. LABOR COST SHARING HISTORICAL DATA
The LCS program started in 1991 with two payments being made each year.
Starting in 2002, the Korean government started making three equal payments throughout
the year instead of two payments. The program began with an amount of $30,745 from
the Republic of Korea government and has escalated to the current amount of $282,900
in 2006. 2005 marked the first year since the inception of the program that the total
amount of labor cost sharing has curtailed. The amount of the contribution has decreased
in each of the last two years.22
C. LABOR COST SHARING ASSUMPTIONS
With the planned move of Yongsan down to the Pyeongtaek region, it is safe to
assume that the end-strength of KN employees will likely be affected by the transition.
The change in the end-strength will affect the contribution of labor cost sharing made by
the Korean government.
The Korean government has been hinting at lowering the LCS amount because of
the planned reduction in forces to 25,000 by 2008. The Korean government’s belief is
that reduction in US forces will result in less KN employees needed at each installation.
Another assumption is that there will be a considerable number of consolidation
projects due to the move of Yongsan Garrison and because Camp Casey is directly next
to the future location of Yongsan. Consolidation will mean there will be less employees
22 Tracy Watkins. “Labor Cost Sharing.” Spreadsheet USFK. 2006. p. 1.

14
working at the new location. The former employees will either be transferred to other
installations or end-strength requirements will be altered to meet new base needs.
Yongsan Garrison is located 30-miles north of the Pyeongtaek region. It is fair to
assume that all the employees that worked at Yongsan Garrison will not relocate to the
Pyeongtaek region because of the distance. The distance factor might play a major role
in number of employees working at new installations. The safety record in Korea is far
worse than that in the U.S. High vehicular traffic which leads to high accident rate may
prohibit the current employees from traveling those 30-miles. Korea ranked first in
number of traffic accidents in the world with 2.5 accidents per kilometer of road followed
by Turkey at 0.9 and Japan at 0.8.23 This predicament may lead to uncertainty in
retaining or hiring employees.
Another fair assumption is that KN employees will feel that the on-base military
jobs are unstable due to the transition of US role within the Korean peninsula. This
transition may make KN employees have second thoughts about job stability and they
might look somewhere else for job opportunities. The job market in rest of Korea is
lucrative. The Korean economy based on GDP ranks 11th in the world.24 Korea
recovered from the Asian Market Crisis and there are many more job opportunities in the
private sector than in public sector.25
The final assumption is that the USFK and the Korean government will not have a
cordial relationship with the Korean Labor Union. This may be due to past labor disputes
with USFK and the Korean government’s current decision to reduce the LCS amount
which forced nearly 1,000 employees to be laid off in April of 2005. Currently, USFK
and the Korean Labor Union are trying to mend their relationship with semi-annual
meetings to discuss their differences.
23 “Korea Road Traffic Safety Association.”
http://www.who.int/violence_injury_prevention/resources/reb28/en/ accessed 2 August 2006. 24 “World Development Indicator Database.: Worldbank.org. World Bank. 1 July 2006. p. 1. 25 Sherry Kiser. “Recovery from Financial Crisis: The Case of South Korea.” Economic and Financial
Review. October 2001. p. 8.

15
All of the above mentioned assumptions are realistic and are critical to the
forecasting of future LCS amounts. Most of the assumptions seem to lead towards a
reduction of Korean National workers on the payroll. These are necessary assumptions
needed to conduct our research.
D. RELOCATION ASSUMPTIONS
U.S. bases are scattered across South Korea, which increases operational costs.
This is especially true with the numerous small camps dispersed throughout Seoul. Their
protection, telecommunications, and transportation have become so expensive that plans
have been developed to integrate them into a large-scale hub. This transition will include
large land procurement and new facility construction. However, our focus is on LCS for
USFK and the ROK. Therefore, we do not consider the effects of these procurements
and construction on end-strength requirements.
The number of USFK service members and Korean Nationals that support USFK,
who will transition from the Yongsan Garrison to the Pyeongtaek region, will represent
the actual end-strength requirements of USFK. For this analysis, USFK service members
will be defined as United States military personnel assigned to USFK and Korean
Nationals will be defined as Korean civilian workers assigned to USFK. Due to the
unavailability of data, the requirements for USFK service members, and the requirements
for Korean Nationals do not include forces from Republic of Korea Army (ROKA), or
Korean Augmentation to United States Army (KATUSA) personnel. We understand that
these numbers may affect the number of KN and USFK employees.

16
THIS PAGE INTENTIONALLY LEFT BLANK

17
IV. USFK/KN TRANSFORMATION
A. PURPOSE
The purpose of this chapter is to determine how the future stationing of USFK
will transform the end strength of the Korean National workforce. Emphasis will be
placed on the major installations within the Pyeongtaek region. Additionally, special
attention will be given to how the transformation efforts of the Yongsan Garrison
relocation will affect this region. This chapter will provide background information and
an overview for the planned relocation of USFK. It will also include a forecast for future
KN end strength for the Pyeongtaek region as the number of USFK service members is
reduced and re-allocated throughout the Korean Peninsula.
B. TRANSFORMATION BACKGROUND
The governments of the Republic of Korea and the United States have agreed to
reduce the number of US forces stationed in Korea. This agreement is driven by the
Future of the Alliance Policy Initiative and it contributes to the transformation of US
installations in Korea and includes the proper alignment of all US forces and its
installations. The rationale is to enhance USFK operations within newly formed hubs of
enduring installations south of Seoul’s Han River. This effort will enable greater
command and control of these forces, and maximize the return of land to the Korean
Government.26
This transformation is to be conducted in two phases. The first phase includes the
reduction, reorganization, and consolidation of existing forces targeted for realignment.
This phase also initiates the construction of new facilities required for relocation, and is
currently underway. Phase two encompasses the actual relocation plan. Execution of
this phase is dependent on the completion of facilities needed and leadership decisions
from both the Republic of Korea and the United States.
26 Foreign Press Center Briefing. (23 July 2004). Future of the Alliance Policy Initiative.
http://fpc.state.gov/fpc/34662.htm accessed 19 July 2006.

18
Figure 1: 2 Phase Plan2008
Yongsan Relocation
2005
Osan/Humphreys
Busan
Seoul
Chinhae
Daegu
Han
Rive
r
Mu Juk
Kunsan
Casey
Joint Training Facility
2002
Busan
Mu Juk
...
. . .
.
..
.
.
.....
. .
.. ..
.
.
.
. ..
.. ..
..
.
....
.
.. ....
. . .
.
.
.
.
.. ..
.
.
.
.
.
.
Osan/Humphreys
Han
Rive
rSeoul
Kunsan
Chinhae
Daegu
Osan/Humphreys
Busan
Seoul
Chinhae
Daegu
Han
Rive
r
Mu Juk
Kunsan
Joint Training Facility
Plan conception & development Consolidate & reorganize
Source: USFK Theater Master Plan
Figure 1. Two Phase Plan
The maps in Figure 1 show how the USFK will transition from many scattered
units, to two synergistic hubs. The two hubs are marked in the figure with a dark circle.
The Southwest hub will be made up of Osan Air Base and Camp Humphreys. It is
important to note that this hub will be located in the Pyeongtaek region, and will include
the units relocated from the Yongsan Garrison and metropolitan Seoul. The planned
relocation of the Yongsan Garrison will be done in 2008. This effort includes the
headquarters elements of the United Nations Command (UNC), Combined Forces
Command (CNC), and United States Forces Korea (USFK), who will relocate to Camp
Humphreys, near Pyeongtaek, in 2007. All other units at Yongsan will finish relocating
by December, 2008.27
The Yongsan Relocation Plan (YRP), which is based on the decision to
implement USFK force restructuring, is an important document that maps out the future
of USFK force restructuring. Originally signed in 1990, the YRP contains the necessary
guidance for the relocation of US forces from Seoul. This agreement was executed in
27 Statement of General Leon J. Laporte: Hearing before the House Appropriations Committee. Sub-
Committee on Military Quality of Life, Veterans affairs and Related Agencies. 10 March 2005.

19
part until differences on alternate locations and funding hindered progress. In October
2004, this agreement was re-written and the revised plan was signed by the Republic of
Korea Minister of National Defense and the Commander, United States Forces Korea.28
The YRP contains several key principles. Most importantly, the relocation must
be implemented in accordance with the Status of Forces Agreement (SOFA). Several
funding agreements for the relocation have also been outlined in the YRP. The original
YRP committed the Republic of Korea to fully fund the movement of USFK units out of
central Seoul. At the present time, the Republic of Korea (ROK) is to provide all land,
facilities and moving services related to the relocation.29 The USFK and ROK have
agreed to optimize each party’s responsibilities through close coordination and efficient
planning. All facilities, services, and expenses incurred in implementing the relocation
will be validated and paid using procedures to be established by the SOFA Joint
Committee. The USFK and ROK may mutually consult and make necessary adjustments
to the relocation plan. For example, a significant change in the requirements of USFK
facilities and areas in the process of the implementation of the relocation would require
an adjustment to the plan. The focus for the United States is to make funding available
for sustainment, restoration, and maintenance of enduring facilities while keeping the
cost of relocation to a minimum.
The YRP program is expected to total $3.5 to $4.5 billion (U.S. dollars), and the
program’s facility requirements are complex and numerous. These requirements include
acquisition of land, high-rise and mid-rise housing units, administrative and headquarters
facilities, schools, hospitals, multi-functional facilities, and related infrastructure. It is
anticipated that 15 installations will be returned to the ROK and two sites will be partially
closed.30 The YRP also states that the relocation of US forces from Seoul, and
28 David Shin, LTC. Asia-Pacific Center for Security Studies. ROK and the United States 2004-2005:
Managing Perception Gaps? February 2005. http://www.apcss.org/Publications/SAS/APandtheUS/ShinROK1.pdf accessed 19 July 2006.
29 U.S. Government Accountability Office. Defense Infrastructure:Factors Affecting U.S. Infrastructure Costs Overseas and the Development of Comprehensive Master Plans. Publication No. GAO-04-609. July 2004. p. 17.
30 Request for Qualifications. V. 20 March 2006. p. 4.

20
construction of required facilities will be finalized according to the Status of Forces
Agreement (SOFA). Under SOFA, the current schedule for the relocation and
construction will extend through 2008.
C. USFK SERVICE MEMBER REQUIREMENTS
The number of USFK troops required to maintain military operations throughout
South Korea in 2003 was 37,000. As the plan to consolidate and relocate USFK forces
materializes, USFK troop end strength is scheduled to decrease. By 2008, the total
number of USFK forces in Korea will be approximately 24,500.
End strength data was collected from the USFK Theatre Master Plan that shows
how USFK forces will be stationed throughout South Korea through 2008 and is shown
in Table 1. The numbers represent how the USFK service members will be allocated to
the future Southwest and Southeast hubs, and Kunsan Air Base, and represent the
approximate requirements of USFK. Ratios were developed from these requirements to
determine how the required USFK service members will be allocated. Of the total 24,500
service members, the Southwest Hub will require 17,640 service members, or 72%.
Table 1. 2008 USFK Military Stationing
Requirements % Allocation
Southwest Hub 17,640 72%
Kunsan AB 2,940 12%
Southeast Hub 3,920 16%
Total 24,500 100%
Since we assume that the number of KN employees required at each hub is driven
by the number of USFK service members required, the allocation ratios for the 2008
stationing of USFK service members, shown in Table 1, will also represent how the KN
workforce will be allocated, and the same percentages will be used.

21
D. USFK KOREAN NATIONAL REQUIREMENTS
It is assumed that the transformation of USFK and the relocation of the Yongsan
Garrison down to the Pyeongtaek region will affect the end strength of Korean National
employees. The actual change in the end strength will be affected by the level of USFK
troop reductions. The following data was collected and analyzed to determine if a
relationship exists between the allocations of USFK service members and the number of
Korean National employees, and if that relationship is significant enough to predict the
number of Korean National employees needed for the support of the installations in the
Southwest hub.
Historical (Korean National employees and USFK) troop level data was collected
for the years 2000 through 2006 to develop a model that would determine if the number
of USFK troops had some effect on the number of Korean Nationals needed for
installation support. The data that was used represents the number of USFK service
members and KN employees in total, for each year, from 2000 through 2006.
A linear regression model was developed, with the number of KN employees as
the dependent variable, and USFK total service members as the independent variable.
The intent was twofold. The first intent was to determine if KN national end strength
was related to the amount of USFK service members. The second intent was to predict
the total number of KN employees needed as a result of the transformation efforts. Since
the data used for this model represents the total number of USFK service members and
KN employees at the aggregate level; only one regression would be needed to predict the
number of KN employees.
The output generated from the model is displayed in Table 2. The output shows
that 81% of the variability in the KN data is explained by the level of USFK service
member levels. This model also produces strong evidence that a relationship does exist
between KN and USFK end strength. This relationship suggests that as the number of
USFK service members decreases, the number of KN employees will also decrease.

22
Table 2. Regression Output
Multiple R .90
R Square .81
Adjusted R Square .78
Standard Error 138.34
Observations 8
Coefficients Standard Error t Stat P-Value
Intercept 8346.0826 360.8410 23.1295 4.2814
X Variable (USFK Troops) .0553 .01098 5.0363 .0002
Since we now have established that the relationship between the number of USFK
service members and KN workers is significant, we can now use the equation generated
by the model to predict the level of KN workers needed, given a certain number of USFK
service members. This linear equation, generated by the regression, is constructed for our
estimate.
Y = 8346.0826 + X (.0553)
Where:
Y = the predicted number of KN employees required, in total, for 2008.
X = the number of USFK service members required, in total, for 2008.
Since we already know that the projected number of USFK service members in
2008 is 24,500, this number will represent our X value. Using the equation, the predicted
number of total KN employees required (Y), given 24,500 USFK service members,
equals approximately 9,701.

23
Table 3. 2008 KN Stationing
Requirements % Allocation
Southwest Hub 6,985 72%
Kunsan AB 1,164 12%
Southeast Hub 1,552 16%
Total 9,701 100%
This table shows the KN stationing requirements for 2008. The total 2008 KN
stationing requirement of 9,701 is provided by the regression equation. This number is
allocated to Kunsan AB, the Southwest and Southeast Hubs using the same percentages
that we used to allocate the USFK service member requirements. Table 4 shows that the
Southwest Hub will receive 6,985 KN employees, or, 72% of the total.
Table 4. 2008 USFK & KN Stationing
USFK Military KN
Southwest Hub 17,640 6,985
Kunsan AB 2,940 1,164
Southeast Hub 3,920 1552
Total 24,500 9,701
Table 4 shows how the estimated USFK military end strength and total number of
KN personnel that will be allocated in 2008. In total, the number of USFK service
members will be 24,500. 72% of this total, or 17,640, will be allocated to the Southwest
Hub. Likewise, 72% of the 9,701 total KN employees will also be allocated to the
Southwest Hub, giving the Southwest Hub 6,985 KN employees.

24
E. AFTER THE TRANSFORMATION
Clearly, the total size of the forces stationed in the Korean Peninsula, and the foot
print caused by old posturing dating back to the Korean War are decreasing. When many
of the units dispersed throughout the Korean Peninsula are consolidated, especially in the
areas in and around Seoul, the sizes of the proposed enduring hubs will depend on the
requirement of USFK service members.
We believe there is a positive correlation between the number of USFK service
members, and the number of Korean Nationals required for stationing in 2008. In other
words, the total number of required USFK military is directly proportional to the number
of KN employees. However, since this statement holds true to the aggregate end-strength
in Korea, we must now consider how this relates to the end-strength requirements in the
Southwest Hub.
As the relocation efforts of the Yongsan Garrison continue, the USFK will
experience a greater concentration of its total end-strength requirements in the Southwest
Hub. Explained earlier in this chapter, the concentration of both USKF service members
and KN will be 72% of the total end strength. This will have a profound impact on how
the future Labor Cost Share (LCS) will be allocated.

25
V. LCS DATA ANALYSIS
A. PURPOSE
This chapter will present an analysis of Labor Cost Sharing data collected through
document reviews and site visits. It will explain the data collection process and the
purpose of the analysis. We will describe the methodology and identify the best
forecasting model to be used in estimating LCS.
B. PURPOSE OF THE ANALYSIS
The purpose of the project and the analysis is to develop a tool to better predict
future LCS amounts and to determine the trend in the end strength of both KN employees
and US troops stationed in the ROK. The data used to develop the models and graphs
will reveal the decisions made on LCS. The primary decision made will be which
country will shoulder the main LCS burden and therefore, what troop levels will be
supported by the LCS contributions. The data is also suggestive of the future KN and US
troop requirements in the region. The analysis will allow US leadership to have a more
in-depth idea of what the future holds, and will provide the leadership with the tools to
make informed decisions.
C. METHODOLOGY
Several respected techniques were applied to the data in order to arrive at
forecasts and projections. The historical trend of LCS between the Republic of Korea
and the United States was analyzed to obtain the forecast for percentage of LCS.

26
0.00%
10.00%
20.00%
30.00%
40.00%
50.00%
60.00%
70.00%
80.00%
1994
1995
1996
1997
1998
1999
2000
2001
2002
2003
2004
2005
2006
Year
Perc
enta
ge
ROK %
US%
Figure 2. LCS Share
As evidenced by the graph in Figure 2, there was a drastic shift in labor cost
sharing between 1996 and 1997. As the strength of the ROK forces increased the two
countries agreed that fewer U.S. forces would be needed in the area. This situation
created an opportunity for the ROK to shoulder more of the cost burden as it took the
lead in security decisions. The recent trend to convergence came about as a result of an
ROK decision to provide less money toward the employment of Korean nationals in
support of U.S. forces. This move appears to be an attempt to assure its younger
population, which is not as pro U.S., that the ROK is moving toward self sufficient
defenses.31
31 Park Song Wu. “Korea Can Take Wartime Control Now.” Koreatimes.com. 9 August 2006. p. 1.
27
590,911600,000
683,000 686,000
540,000
560,000
580,000
600,000
620,000
640,000
660,000
680,000
700,000
1950 1961 2002 2006
Year
Am
ount
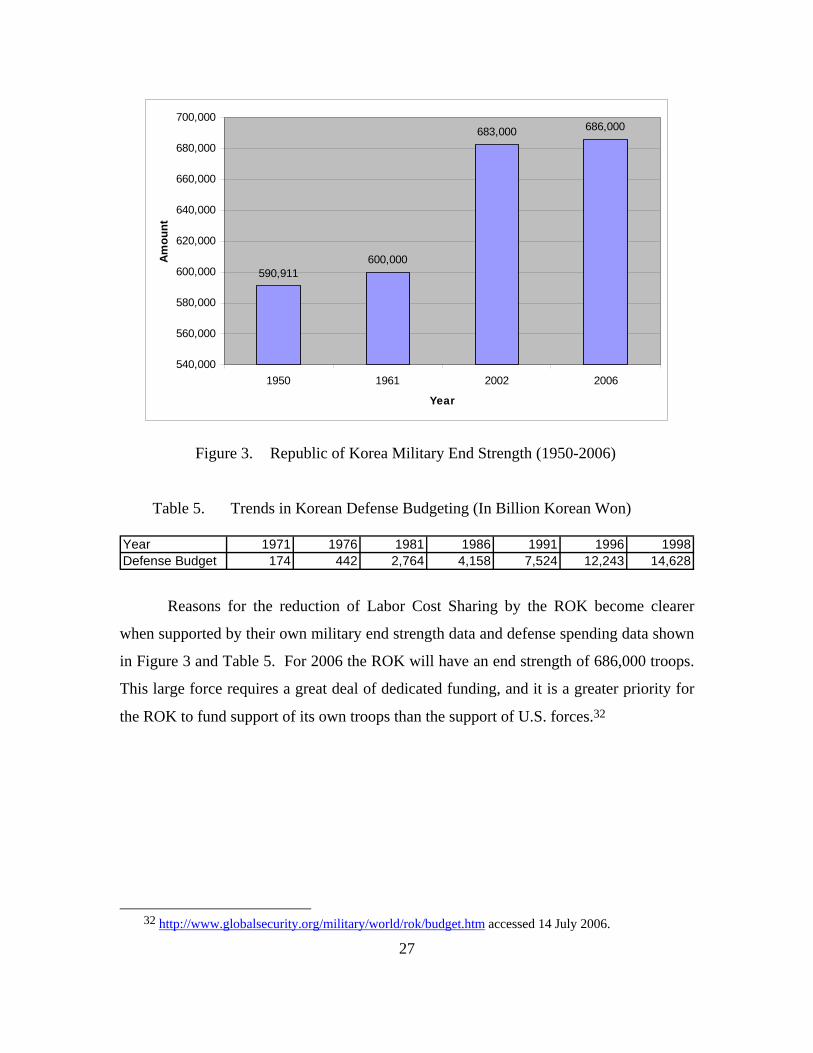
Figure 3. Republic of Korea Military End Strength (1950-2006)
Table 5. Trends in Korean Defense Budgeting (In Billion Korean Won) Year 1971 1976 1981 1986 1991 1996 1998Defense Budget 174 442 2,764 4,158 7,524 12,243 14,628
Reasons for the reduction of Labor Cost Sharing by the ROK become clearer
when supported by their own military end strength data and defense spending data shown
in Figure 3 and Table 5. For 2006 the ROK will have an end strength of 686,000 troops.
This large force requires a great deal of dedicated funding, and it is a greater priority for
the ROK to fund support of its own troops than the support of U.S. forces.32
32 http://www.globalsecurity.org/military/world/rok/budget.htm accessed 14 July 2006.

28
$0.00
$50,000.00
$100,000.00
$150,000.00
$200,000.00
$250,000.00
$300,000.00
$350,000.00
1991
1992
1993
1994
1995
1996
1997
1998
1999
2000
2001
2002
2003
2004
2005
2006
Years
Am
ount
Figure 4. Total LCS Payments By Rep. of Korea (1991-2006)
Data showing the total LCS contributions by the ROK over the last 16 years also
contributes to the notion that the ROK will be looking to bolster its own forces while
cutting back on LCS funding. As Figure 4 shows, contributions hit an all time high in
2004. It may be due to the increased size of the ROK military which led to reduced
funding contributions in 2005 and 2006. We can expect this trend to continue until U.S.
force levels bottom out at around the 25,000 troop level within the next few years. The
number of required Korean national support personnel will cease its decline and level off.
Chapter IV examined what levels of support personnel should be expected. After
establishing that this environment is what can be expected for the foreseeable future there
were grounds on which the data could be used to make forecasts.
Prior to running the first model, we looked at a simple regression on LCS
contribution verses time. Time was selected because it had the best statistical results
when compared with other independent variables such as Korean national workforce or
troop levels. R Squares for the three options were .94 for time, .64 and .10 for the
independent variables of Korean National workforce and troop levels respectively. A
summary of the resulting statistics for LCS contribution verses time is listed in Table 6.

29
The R Square statistic tells us that time explains 94 percent of the variation in LCS
amount. The very small P-Value for the X variable indicates that that it is significant at
greater than the 99 percent confidence level. The linear equation generated by this
regression is as follows:
Y = 21727 + 19900(X)
where:
Y is the amount of LCS contribution
X is the amount of years past the first data point for which the estimate is desired
(i.e. if the estimate for 1995 is desired X would be 4 since the first data point was 1991)
Table 6. Regression Output
Multiple R .9698
R Square .9405
Adjusted R Square .9363
Standard Error 24661.1
Observations 16
Coefficients Standard Error t Stat P-Value
Intercept 21727 12932 1.68 .1151
X Variable (# of Years) 19900 1337 14.88 5.66E-10
The first forecasting model used is the moving average. The moving average uses
the results of previous periods to forecast occurrences in the future. The number of
periods used in the calculation is denoted by the letter n. Given the total number of data
points available in this case, the model was run for n=3 and n=4. The average LCS
contribution of the three previous periods and four previous periods, respectively, were
used to calculate the forecasts. A benefit to the moving averages technique is that is
smoothes out sudden fluctuations in the data but a drawback is the need to collect data for
an extended period of time. A large n will generally bring better results when using this
model. The graph of the n=4 moving average is shown in Figure 5.

30
$0.00
$50,000.00
$100,000.00
$150,000.00
$200,000.00
$250,000.00
$300,000.00
$350,000.00
1995
1996
1997
1998
1999
2000
2001
2002
2003
2004
2005
2006
2007
2008
2009
2010
Years
Amou
nt
Figure 5. ROK LCS Share as a Moving Average of n=4 (1995-2010)
A key characteristic of a good model is a low forecasting error. This means that
the forecasts are close to the observed data points. In comparing the n=3 and n=4 models
the n=3 model produced the smallest amount of error. However, the n=4 model produced
very close forecasts for 2005 and 2006. In large part this was due to the change in trend
from increasing to decreasing LCS contributions by the ROK from 2004 to 2005. By
using an extra period of the lower contribution amount the n=4 model dampened the rise
in the forecast and therefore came closer to the actual contribution when it began to fall.
The second type of model that was used on the data was a weighted moving
average (wma) model. Unlike the regular moving average the wma does not treat all data
points equally. This modeling tool uses a weighting system to assign more applicability
to certain data. By using weights the analyst recognizes a trend or presence of a specific
relationship. In this case two different sets of weights were applied to the data. The first
set of weights consisted of .2, .35 and .45. This indicates that the more recent data was

31
more representative of forecast than older data. For example, 1994 data is weighted by
.2, the 1995 data is weighted by .35 and the 1996 is weighted by .45. Assigning weights
can be a subjective practice, based on an understanding of the environment or assignment
can be based on specific data and information. In this case the application was due to our
knowledge of the situation.
Weights Trial 1 Trial 2 Trial 3W1 0.2 0.3 0.1W2 0.35 0.4 0.1W3 0.45 0.3 0.8
Weights Used in WMA Analysis
Year Actuals w.m.a. 1 error w.m.a. 2 error w.m.a. 3 error
1991 $30,745.001992 $42,050.001993 $61,600.001994 $96,000.00 $48,586.50 $47,413.50 $44,523.50 $51,476.50 $56,559.50 $39,440.501995 $112,000.00 $73,170.00 $38,830.00 $66,055.00 $45,945.00 $87,165.00 $24,835.001996 $146,891.25 $96,320.00 $50,571.25 $90,480.00 $56,411.25 $105,360.00 $41,531.251997 $191,000.00 $124,501.06 $66,498.94 $117,667.38 $73,332.63 $138,313.00 $52,687.001998 $203,302.40 $159,761.94 $43,540.46 $149,656.50 $53,645.90 $178,689.13 $24,613.281999 $212,000.00 $187,714.33 $24,285.67 $181,458.10 $30,541.91 $196,431.05 $15,568.962000 $232,600.00 $204,755.84 $27,844.16 $202,220.96 $30,379.04 $209,030.24 $23,569.762001 $250,700.00 $219,530.48 $31,169.52 $215,570.72 $35,129.28 $227,610.24 $23,089.762002 $279,200.00 $236,625.00 $42,575.00 $231,850.00 $47,350.00 $245,020.00 $34,180.002003 $301,500.00 $259,905.00 $41,595.00 $253,820.00 $47,680.00 $271,690.00 $29,810.002004 $324,100.00 $283,535.00 $40,565.00 $277,340.00 $46,760.00 $294,190.00 $29,910.002005 $287,400.00 $307,210.00 $19,810.00 $301,590.00 $14,190.00 $317,350.00 $29,950.002006 $282,900.00 $303,065.00 $20,165.00 $306,310.00 $23,410.00 $292,480.00 $9,580.002007 $292,715.00 $297,060.00 $287,470.002008
MAD $38,066.42 $42,788.58 $29,135.81% Error 18% 20% 13%
Figure 6. WMA Application and Results
In this application the first set of weights achieved a better result as the 2006
estimate only deviated from the 2006 actual by 7 percent.
In order to arrive at the optimal set of weights for the forecasting model of
weighted moving average optimization was used. Optimization seeks to find the best
possible weights to apply to the data to minimize the total amount of error. The two
statistics that were selected for minimization were the percent error and the mean
absolute deviation (MAD). The MAD is the average of the absolute values of the
individual forecast errors, and the percent error is the amount of deviation of the forecasts

32
from the actual data points. Upon performing the optimization, the combination of 0, 0,
1.0 was suggested as the optimal weighting of the data. What this result recommends is
not counting any of the data except the previous period when making a forecast. The
reason for this result is captured in two characteristics of the data. The first characteristic
is a rapid rise in the amount of LCS contribution over the first thirteen years for which
data was available. By taking an average of previous data points the model dampens the
increase. The actual situation was quite different that the model over that period. The
second characteristic of the data that leads to the suggestion of only considering the
previous data point is the drastic change in contribution strategy that takes place between
2004 and 2005. The ROK decreased the amount of contribution at that point, so rather
than use previous periods in which an increasing relationship is present, the optimization
tool recommends using a point estimate.
The final forecasting method explored is the exponential smoothing model. An
advantage in applying exponential smoothing to this data is it does not require extensive
record keeping or a large sample size. The technique fits this situation well due to the
availability of only a small data set. Exponential smoothing, similar to moving averages,
uses a weight to forecast future occurrences. It differs in where the weight is applied.
The formula calls for the forecast from the previous period to be adjusted by the variation
between the forecast and observed data for that period multiplied by the smoothing
constant. The smoothing constant is also referred to as alpha, or the weight. In the
application of exponential smoothing to this data set several different smoothing
constants were examined. The resulting graph from the constant of .3 is shown in Figure
7. The benefit of this method is that while it lags the actual data, it catches the large
change in contribution that occurred from 2004 to 2006. In fact, the 2006 forecast is only
off by 2.2 percent from the 2006 observation. Due to the nature of the data as the size of
the constant increases the amount of error decreases. The use of optimization on this
model, which is discussed next, further reveals the effect of a large smoothing constant
on the model.

33
$0.00
$50,000.00
$100,000.00
$150,000.00
$200,000.00
$250,000.00
$300,000.00
$350,000.00
Year
1992
1994
1996
1998
2000
2002
2004
2006
Year
Am
ount Actuals
Forecast
Figure 7. ROK LCS Contributions (Actual vs. Exponential Smoothing Forecast)
The optimization tool applied to the moving weighted moving average model was
also applied to the exponential smoothing model. The result was the same as before, and
for the same reasons. The optimizer recommended using a smoothing constant of 1.0,
which would take the previous forecasts error under complete consideration in making
the forecast as opposed to just a percentage of the error. The resultant graph of the
optimized exponential smoothing model is shown in Figure 8. The result is that the
forecast does not trail the observed data point by nearly as much, and the amount of error
contained in the model is greatly reduced.

34
$0.00
$50,000.00
$100,000.00
$150,000.00
$200,000.00
$250,000.00
$300,000.00
$350,000.00
Year
1992
1994
1996
1998
2000
2002
2004
2006
Year
Amou
nt ActualsForecast
Figure 8. ROK LCS Contributions (Actual vs. Exponential Smoothing Optimization) D. THE PREFERRED MODEL
Given the limited amount of data available and the variation in the contribution
amount, we believe that the model that captures the best forecast in recent periods is the
weighted moving average model. This model uses three prior periods and weights the
values with a .2, .35 and .45 weighting from oldest to most recent. An equation for this
model reads as follows:
Ft+1 = W1 At-2 + W2 At-1 + W3 At
Ft+1 = (0.2) At-2 + (0.35) At-1 + (0.45) At
Subject to the constraints…
W1 + W2 + W3 = 1
W1 , W2 , W3 > 0
This equation is valid when Ft+1 is the forecast for the next period and At is the
observed data point for the most recent period. This model weights the most recent data
more heavily and still provides a smoothing effect to the data which is valuable given the
recent change in the LCS contribution trend. The need for a smoothing effect is the

35
reason why the optimized models are not preferred for this data. The optimized models
recommend only considering the most recent period. While the optimization method
reduces the total amount of error in the model it is not useful due to the downturn in ROK
contributions. In a more stable situation the optimized exponential smoothing model
would be the preferred model.
36
THIS PAGE INTENTIONALLY LEFT BLANK

37
VI. CONCLUSION AND RECOMMENDATIONS
A. PURPOSE
The purpose of this chapter is to summarize how the analytical model can help the
USFK in the future. The chapter will also cover current issues such as the environmental
pollution dilemma and funding problems for the relocation of Yongsan Garrison. The
chapter will also cover future issues such as wartime command being returned to the
Republic of Korea government and possible reunification of North and South Korea.
B. ANALYTICAL FINDINGS
Historical data used to forecast the future of LCS amounts have shown that LCS
amounts are in a downturn, but will soon stabilize once Yongsan Garrison relocates to the
Pyeongtaek region. The data shows that USFK end-strength is decreasing while ROK
end-strength has steadily increased since the Korean War. The future of U.S. presence in
the Korean region varies depending on the success of the reunification of both Koreas. In
the mean time, the LCS amount will stabilize once Yongsan’s relocation is completed in
the near future.
According to the data presented in Chapter V, there is a shift in LCS contribution
by both countries. From 1996, ROK contribution has steadily increased while US
reduced their contribution. However, starting in 2004, the LCS contributions reverse to a
point that the US contributes more than the ROK by 8.8%. This was due to stagnation in
the SMA talks. There were several methodologies used to find the best forecasting
model. The conclusion is that the weighted moving average offered the best forecast for
future LCS amounts based on smaller forecasting error.
C. ENVIRONMENTAL ISSUE
Under a 2004 land swap pact, the U.S. military is required to gradually hand back
170 million square meters of land which constitutes 42 military bases and facilities across
the country. The transfer is supposed to be completed by 2011. In return, South Korea

38
promised the USFK 12 million square meters of land in the Pyeongtaek region to relocate
Yongsan Garrison and to expand Camp Humphreys and Osan Air Base.33
The environmental issue has recently become a major problem because of the
differences between USFK and South Korea over the level of environmental cleanup
required at the bases. USFK feels that South Korea is requiring the U.S. side to meet new
and more strict environmental standards outside the Status of Forces Agreement (SOFA)
between the two nations. USFK has gone above and beyond what is required by SOFA.
Most of the failed inspections are from the work completed before the SOFA agreement.
The South Korean government insists that most of the estimated $500 billion
cleanup cost should be paid by the United States.34 USFK insists that it is obliged to
clean only the areas that contain contaminants and are in imminent threat to human health
and safety under the SOFA.
D. FUNDING THE RELOCATION
Both USFK and South Korean governments disagree over the cost of U.S. Base
Relocation which can affect the relocation of Yongsan Garrison by 2008. The top U.S.
commander in the region estimates that South Korea has to provide $6.8 billion for the
relocation to occur without any problems. The South Korean government which will
share the burden of relocating the U.S. installations has thus far only promised to pay
$1.7 billion.35 The U.S. has decided to contribute $4.5 billion for the relocation.36 The
two countries are still $600 million short of the estimated total cost of the move.
The U.S. has asked South Korea to delay drawing up a master plan for the
construction of a new, consolidated base in the Pyeongtaek region. The master plan is
the key blueprint in deciding the specific construction timetable, design, and size of
buildings. Military sources hinted that the delay was caused by the tug-of-war between
the two sides over the share of relocations costs.
33 Jung S. Ki. “USFK Chief Complains About Stalling in Giving Back Bases.” The Korea Times,
2006. p. 2. 34 Ibid., p. 1. 35 Jung S. Ki. “ROK, US Differ Over US Base Relocation Costs.” The Korea Times, 2006. p. 1. 36 Jung S. Ki. “ US to Fund Up to $4.5 Bil. For Base Relocation Plan.” The Korea Times, 2006. p. 1.

39
E. RETURN OF THE WARTIME COMMAND
South Korea is expected to completely take back wartime command of its military
from the U.S. in 2012. General B.B. Bell, commander of USFK, emphasized that the
future of U.S. assistance to the South Korean military would be air and naval centric.37
South Korea regained peacetime control of its military from the U.S. in 1994, but
wartime command has remained in the U.S. hands since the 1950-1953 Korean war.38
Recent North Korean missile testing has shown that the South Korean military’s
intelligence community needs further improvements. Reports have shown that South
Korean military authorities received the report of North Korean’s test launch of its first
short-range Scud missile from the U.S. military nine minutes after the firing was
conducted.39 Conservatives, led by the Main Grand National Party (GNP), have opposed
early wartime command transfer, citing Korea’s lack of intelligence capabilities.40 Top
U.S. military commanders have also stressed that in order for the South Korean military
to assume full wartime command, they need to established their own War-Fighting
headquarter.41 On 17 August, Korean Defense Minister, Yoon Kwang-un announced that
the US would continue to share its intelligence capabilities even after the wartime
command transfer.42
F. HOPEFUL REUNIFICATION
Most of the citizens in North and South Korea yearn for the day that both Koreas
reunite. China and Russia are opposed to the idea of reunification because a reunified
Korea will become economically and politically sound and may challenge the
neighboring countries. Recent North Korean missile crisis’ and nuclear weapons
aspirations have drastically isolated North Korea from nations around the world. North
37 Song W. Park. “Seoul to Get Back Wartime Command in 5 to 6 Years.” The Korea Times, 2006. p.
1. 38 Ibid., p. 1. 39 Jung S. Ki. “Transfer of Wartime Command Premature.” The Korea Times, 2006. p. 1. 40 Jung S. Ki. “US to Share Military Intelligence after Command Transfer.” The Korea Times, 2006.
p. 1. 41 Song W. Park. “Seoul First Needs Its Own War Fighting HQ.” The Korea Times, 2006. p. 1. 42 Ibid., p. 1.

40
Korea’s missile arsenal currently threatens South Korea and Japan. The Taepo Dong 2
missile which is in development stage could reach Alaska and parts of Hawaii. Experts
fear that within 10-15 years a three-stage version could be developed that could deliver a
200-kilogram payload to the continental United States.43
These threats and the isolated state of North Korea do not help the reunification
talks. The North has postponed several scheduled talks and demanded sanctions be lifted
before any talks resume.
The South Korean government does want the presence of USFK to remain in
Korea even after the reunification of the two Koreas. However, the North Korea media
outlets have criticized presence of the USFK in the South, describing it as a foreign
power that threatens world peace and reconciliation of the Korean people.
G. RECOMMENDATIONS
The breakdown in the LCS issue in 2004 resulted in the loss of jobs for KN
employees and a breach in the mission due to a lack of personnel needed for operation.
The current tense situation between the US and ROK government does not help in the
Special Measures Agreement and Labor Cost Sharing negotiations.
The forecasting model shows that the LCS amounts should plateau and stabilize
once Yongsan transitions to the Pyeongtaek region. We recommend that the figures be
updated yearly and the model be used to assess the amount of future contributions.
Although, the model will not result in perfect information, it will give leadership a better
tool to make critical decisions regarding the future of KN employees who are vital to the
overall mission needs.
43 David Ensor. “North Korea Tests Long Range Missile.” CNN. 5 July 2006. p. 1.

41
LIST OF REFERENCES
Bateman, Sam. “The Korean Journal of Defense Analysis.” Korea Institute for Defense Analysis. Vol. XVIII, No. 2, Summer 2006.
Choi, Jong Cheol. “Strategic Flexibility of USFK and South Korea’s Strategic Responses.” Korea Foundation. Vol. 14, No. 2, Summer 2006.
Dong, Hoon. “Inter Korean Relations and Security of the Korean Peninsula.” Korea and World Affairs. Hallym Institute of Advanced International Studies. Vol. XXX, No. 1, Spring 2006.
Foreign Press Center Briefing. (23 July 2004). Future of the Alliance Policy Initiative. http://fpc.state.gov/fpc/34662.htm accessed 18 July 2006.
Han. Jin S. “Dealing with US Bases.” Hankook Times. 2004.
Hawkins, Kevin. “U.S. Forces Korea Fact Book.” Resource Management HQ U.S. Force Korea. 2006. pp. 7-8.
Jack, Tah K. “The Korean War June 1950.” Institute of Defense Strategic Studies. 2006. p. 40.
Keller, Gerald. “Statistics for Management and Economics, 7th Edition.” Copyright Thompson Brooks/Cole 2005.
Ki, Jung S. “USFK to Cut Jobs on Base.” Hankook Times. 2006.
Ki, Jung S. “US to Share Military Intelligence after Command Transfer.” The Korea Times, 2006. p. 1.
“Korea Road Traffic Safety Association.” http://www.who.int/violence_injury_prevention/resources/reb28/en/ accessed 2 August 2006.
Lee, Insung. “The North Korean Nuclear Crisis.” The Institute of Korean Studies. Vol. 37 No. 2. Summer 2006.
Shin, David W LTC. Asia-Pacific Center for Security Studies. ROK and the United States 2004-2005: Managing Perception Gaps? February 2005. http://www.apcss.org/Publications/SAS/APandtheUS/ShinROK1.pdf accessed 7 July 2006.
Statement of General Leon J. Laporte: Hearing before the House Appropriations Committee. Sub-Committee on Military Quality of life, Veterans affairs and Related Agencies. 10 March 2005.

42
Switzer, Warren. “Burdensharing and Special Measures Agreement.” PowerPoint FOUO. 2006. p. 1.
USFK. “Yongsan Relocation Plan (YRP).” PowerPoint FOUO. 2006. p. 2.
U.S. Government Accountability Office. Defense Infrastructure:Factors Affecting U.S. Infrastructure Costs Overseas and the Development of Comprehensive Master Plans. Publication No. GAO-04-609. July 2004. p. 17.
Watkins, Tracy. “Labor Cost Sharing.” Spreadsheet USFK. 2006. p. 1.
43
INITIAL DISTRIBUTION LIST
1. Defense Technical Information Center Ft. Belvoir, Virginia
2. Dudley Knox Library Naval Postgraduate School Monterey, California
3. Yongsan Garrison USFK Seoul, Republic of Korea
4. Dudley Knox Library Naval Postgraduate School Monterey, California
5. Aruna U. Apte Naval Postgraduate School Monterey, California
6. Randall B. Howard Naval Postgraduate School Monterey, California
7. David T. Kim Naval Postgraduate School Monterey, California
8. Frank T. Skrypak Naval Postgraduate School Monterey, California
9. Francis P. Brown Naval Postgraduate School Monterey, California