nature methods: doi:10.1038/nmeth · sweeps on 5 mbp region based on the model of human demography,...
TRANSCRIPT

Supplementary Figure 1
Empirical SAFE distribution.
(a) and as estimators of f. Empirical analysis, with 10,000 neutrally evolving population (about 3 million SNPs) with default parameter set, shows
that and are (biased) estimators of allele frequency f ( f = i/n for all integers i [1, n-1] ). (b) The top panel is the SAFE score Probability
Density Function (PDF) of 10,000 neutrally evolving population (about 3 million SNPs with minor allele frequency > 0.05) with default parameter
set. The bottom panel is Quantiles of the SAFE score against the quantiles of the Normal distribution. The coefficient of determination (R2 = 0.9997)
for the QQ-plot shows that Gaussian distribution is a good approximation to the SAFE score distribution.
Nature Methods: doi:10.1038/nmeth.4606

Supplementary Figure 2
SAFE evaluation.
Performance of the safe score evaluated in different scenarios with 1000 simulations per bin. In each panel, we change one parameter and other
parameters have their default values (see Online Methods). The fixed population size N = 20,000. The dashed (dotted) line represents median
(quartile). In the bottom-right panel, white represents the result for a fixed size population model with default parameters and gray represents a model
of human demography for EUR population (see Online Methods; Supplementary Figure 14). The onset times of selection was post-bottleneck (23
kya-current) epochs.
Nature Methods: doi:10.1038/nmeth.4606

Supplementary Figure 3
iSAFE evaluation.
(a,b,c) Performance of iSAFE measured by rank of the favored variant and the distance of the favored variant from the peak in 1000 simulations per
bin. The dashed (dotted) line represents median (quartile). (d) Performance of iSAFE compared to iHS and SCCT measured by rank of the favored
variant in 5000 simulations on 5 Mbp region around ongoing hard sweeps ( 0 = 1/N; 0.1 < < 0.9) with a fixed population size (N = 20,000) and
default values for other simulation parameters. In the left panel, for any rank r on the x-axis, the y-intercept represents the proportion of samples
where the favored allele had rank r. In the right panel, solid (dashed) lines represent the mean (respectively, median) value of the favored allele
rank. (e) iSAFE performance upon addition of outgroup samples. No deterioration is seen for low frequencies of the favored variant, but iSAFE
performance improves dramatically when favored mutation is near fixation or fixed. The dashed (dotted) line represents median (quartile). This
comparison is based on 1000 simulations of 5 Mbp genomic regions simulated using a model of human genome based on the human demography
(Supplementary Fig. 14). The time of onset of selection was chosen at random (using the distribution in Supplementary Fig. 14) after the out of
Africa event, in the lineage of EUR population (as the target population). When the onset of selection is before split of EUR and EAS (>23kya), both
(EUR and EAS) are under selection.
Nature Methods: doi:10.1038/nmeth.4606

Supplementary Figure 4
Demo I: iSAFE versus CMS in a model of human demography.
Comparing iSAFE and CMS signals in a model of human demography (see Online Methods; Supplementary Figure 14). Solid-horizontal lines
separate replicates based on the favored allele frequency ( ) in EUR as the target population, and dotted-vertical lines separate different replicates.
The rank of the favored mutation (solid-red circle) for each test is shown on the top-right corner.
Nature Methods: doi:10.1038/nmeth.4606

Supplementary Figure 5
Demo II: iSAFE without outgroup samples.
iSAFE on ongoing selective sweeps with different favored allele frequency ( ) in 5 Mbp region. The position of the favored mutation selected from
range [2.5 Mbp, 5 Mbp]. Other simulation parameters are the default values for fixed population size (see Online Methods) and outgroup samples are
not available.
Nature Methods: doi:10.1038/nmeth.4606

Supplementary Figure 6
Demo III: iSAFE and selection strength.
iSAFE on 5 Mbp region with different selection strength, Ns [0, 100, 200, 500, 1000]. Left panels shows the e,w matrix. Middle panel
shows the iSAFE-score as a function of the variant position. Right panel show the derived allele frequency as a function of iSAFE score.
Nature Methods: doi:10.1038/nmeth.4606

Supplementary Figure 7
Peak iSAFE.
(a) Empirical analysis, with 5000 simulations on 5 Mbp region with a wide range of selection strength (Ns [10, 50, 100, 200, 300, 400, 500,
1000]), shows difference in performance of iSAFE beyond a score threshold of 0.1 for peak value of iSAFE. (b) Rank of favored mutation as a
function of peak iSAFE score (Bottom x-axis) or P value (top x-axis; see Online Methods) for the same data in part a. Each gray dot represents the
favored mutation of a simulation using a wide range of selection coefficients. The performance deteriorates for iSAFE-scores below 0.1. The dashed
(dotted) line represents median (quartile).
Nature Methods: doi:10.1038/nmeth.4606

Supplementary Figure 8
iSAFE versus CMS on well-characterized selective sweeps.
iSAFE and CMS scores (right and left panels, respectively) on 8 well-characterized selective sweeps (Supplementary Table 1). The rank of the
putative favored mutation (red star) in 5 Mbp region is shown in parentheses.
Nature Methods: doi:10.1038/nmeth.4606

Supplementary Figure 9
iSAFE on targets of selection.
iSAFE on 5 Mbp regions reported to be under selection. Putative favored mutation is shown in blue square when it is among iSAFE top rank
mutations, and in blue triangle when the signal of selection is very weak (peak iSAFE << 0.1). The right axis is empirical P value (see Online
Methods). (a,b) PCDH15 and ADH1B loci with 207 samples (414 haplotypes) from CHB+JPT populations. (c) PSCA locus with 108 samples (216
haplotypes) from YRI population. (d,e,f) ASPM, FUT2, and F12 loci with 91 samples (182 haplotypes) from GBR population.
Nature Methods: doi:10.1038/nmeth.4606

Supplementary Figure 10
iSAFE on the GRM5-TYR locus.
The Tyrosinase (TYR) gene, encoding an enzyme involved in the first step of melanin production is present in a large region under selection. A
nonsynonymous mutation rs1042602 (blue) in TYR gene is reported as a candidate favored variant. A second intronic variant rs10831496 (red) in
GRM5 gene, 396 kbp upstream of TYR, has been shown to have a strong association with skin color. In contrast, iSAFE ranks mutation rs672144
(turquoise) as the top candidate for the favored variant region out of ~22,000 mutations (5 Mbp; see Supplementary Note 2). (a) This variant was
the top ranked mutation not only in CEU (Fig 3c), but also the top ranked mutation for EUR, EAS, AMR, and SAS. The signal of selection is strong
in all populations (iSAFE > 0.5, P << 1.3e-8 for all of) except AFR, which does not show a signal of selection in this region. We plotted the
haplotypes carrying rs672144 in all 5008 haplotypes (2504 samples) of 1000GP and found (Fig. 3d) that two distinct haplotypes carry the mutation,
both with high frequencies maintained across a large stretch of the region, suggestive of a soft sweep with standing variation. (b) Frequency of
derived alleles of rs10831496, rs672144, and rs1042602, are shown in red, turquoise, and blue, respectively. iSAFE candidate (rs672144) may not
have been reported earlier because it is near fixation in all populations of 1000GP except for AFR ( f = 0.27). (c) Each row is a haplotype and each
column is a variant in EUR populations of 1000GP. In total we have 1006 haplotypes (503 samples). Carrier haplotypes of derived alleles of
rs10831496, rs672144, and rs1042602, are shaded by red, turquoise, and blue, respectively. For making the plot sensible, we removed low frequency
SNPs fEUR < 0.2 and SNPs that are near fixation in the whole 1000GP, f1000GP > 0.95. The previously suggested candidates rs1042602, rs10831496 are
fully linked to rs672144, but not to each other. The EUR haplotypes can be partitioned into 4 clusters. Each of the 4 haplotypes show high
homozygosity, suggestive of selection. However, rs1042602 can only explain the sweep in clusters C1+C2. rs10831496 can only explain C1+C3.
Only rs672144 explains all 4 clusters, providing a simpler explanation of selection in this region.
Nature Methods: doi:10.1038/nmeth.4606

Supplementary Figure 11
iSAFE on the OCA2-HERC2 locus.
The mutation rs1448484 is the iSAFE top rank mutation in all the population of 1000GP except African that does not show any signal of selection in
this region. rs12913832 is a candidate favored mutation for the selection in European, proposed by Wilde et al. (2014). Supplementary Table SN2.2
provides iSAFE rank of some other candidate mutations associated with pigmentation in this region (see Supplementary Note 2).
Nature Methods: doi:10.1038/nmeth.4606

Supplementary Figure 12
iSAFE on the KITLG locus.
iSAFE top rank mutations (circles) and candidate mutation rs642742 (blue triangle) proposed by Miller et al. (2007). See Supplementary Note 2 and
Supplementary Table SN2.3 for more details.
Nature Methods: doi:10.1038/nmeth.4606

Supplementary Figure 13
iSAFE on the TRPV6 locus.
10 mutations (rs11772526, rs4725602, rs11763225, rs7796010, rs11762011, rs13239916, rs4145394, rs10808023, rs10808021, and rs4726591) are
highly linked and are top 10 iSAFE candidate mutations in all the 1000GP populations except for AFR where there is no signals of selection. See
Supplementary Note 2 and Supplementary Table SN2.3 for more details.
Nature Methods: doi:10.1038/nmeth.4606

Supplementary Figure 14
Simulation of selection on human demography.
(a) A model of human demography described by Fig. 4 and Table 2 of Gravel et al. (2011). The model assumes an out-of-Africa split at time TB, with
a bottleneck that reduced the effective population from NAf to NB, allowing for migrations at rate mAf-B. The African population stays constant at NAf
up to the present generation. The model assumes a second split between European and Asian populations at time TEuAs, with a bottleneck reducing the
Asian and European populations to NAs0 and NEu0 respectively. The bottleneck was followed by exponential growth at rates rAs and rEu, as well as
migrations among all three sub-populations, leading to current populations from which East Asian (EAS), European (EUR), and Africans (AFR)
individuals were sampled. We used default values for simulation parameters not assigned (see Online Methods). (b) We simulated 1000 selective
sweeps on 5 Mbp region based on the model of human demography, and with selection coefficient s = 0.05 and starting favored allele frequency 0 =
0.001. The selection happens in a random time, after the out of Africa in the lineage of EUR population (as the target population). When the onset of
selection is before split of EUR and EAS (> 23 kya), both (EUR and EAS) are under selection.
Nature Methods: doi:10.1038/nmeth.4606

Supplementary Figure 15
Maximum difference in derived allele frequency (MDDAF).
We simulated 25,000 instances of AFR, EUR, and EAS populations, based on a model of human demography (see Online Methods; Supplementary
Fig. 14). (a) The MDDAF score of mutations as a function of derived allele frequency in the target population DT. (b) Distribution of the MDDAF
score for mutations with DT > 0.9. (c) Empirical P value of the MDDAF score for mutations with DT > 0.9. The dashed-red lines represent the value
0.78, where MDDAF, given DT > 0:9, has a P value less than 0.001.
Nature Methods: doi:10.1038/nmeth.4606

Supplementary Table 1:iSAFE on 8 well characterized selective sweeps. Number of haplotypes in CEU, CHB,JPT, FIN, and YRI populations are 198, 206, 208, 198, and 216, respectively. Computation ofempirical P value is provided in Online Methods.
GeneTarget
PopulationCandidateSNP ID
CandidateSNP Function
Frequency Selective AdvantageiSAFERank
PSelectionReference
FunctionalReference
SLC24A5 CEU rs1426654 Missense 1 Light skin pigmentation 1 <1.3e-8 1 2
EDAR CHB+JPT rs3827760 Missense 0.87 Hair and teeth 1 <1.3e-8 1 3,4
LCT/MCM6 FIN rs4988235 Intron 0.59 Lactase persistence 1 <1.3e-8 5 6,7
TLR1 CEU rs5743618 Missense 0.77 Sepsis, leprosy, tuberculosis 1 1.0e-5 8 9
ACKR1/DARC YRI rs2814778 5′UTR 1 Malaria resistance 1 2.8e-5 10 11
ABCC11 CHB+JPT rs17822931 Missense 0.93 Cold climate, earwax, body odour 2 <1.3e-8 12 12
HBB YRI rs334 Missense 0.14 Malaria resistance 4 1.6e-4 13 14
G6PD YRI rs1050828 Missense 0.21 Malaria resistance 13 7.3e-6 5 15
Nature Methods: doi:10.1038/nmeth.4606

Supplementary Note 1:
The iSAFE statistic
1.1 iSAFE: Input, Output and Overview.
Consider a sample of phased haplotypes in a genomic region. We assume that all sites are biallelic
and polymorphic in the sample. Thus, our input is in the form of a binary SNP matrix with each
row corresponding to a haplotype and each column to a mutation, and entries corresponding to the
allelic state, with 0 denoting the ancestral allele, and 1 denoting the derived allele. The output is
a non-negative iSAFE-score for each mutation, with the highest score corresponding to the favored
mutation.
At a high level, iSAFE uses a 2-step procedure to identify the favored variant, given a large
region (5Mb) under selection. In the first step, it finds the best candidate mutations in small (low
recombination) windows. Finally, it combines the evidence to give an iSAFE-score to all variants
in the large region.
1.2 HAF: Haplotype Allele Frequency.
The HAF score for haplotype h is the sum of the derived allele counts of the mutations on h. Define
the SNP matrix M such that, Mh,e = 1 if haplotype h carries the derived allele of SNP e, and 0
otherwise. The Haplotype Allele Frequency (HAF) score of haplotype h defined in Ronen et al.
(2015)16 as:
HAF(h) =∑e
Mh,e
∑h′
Mh′,e =∑h′
[M ·MT ]h,h′ , (SN1.1)
where∑
h′ Mh′,e is derived allele count for SNP e, and [M ·MT ]h,h′ is number of shared derived
alleles (mutations) between haplotypes h and h′ (see Fig. 1a).
1.3 SAFE: Selection of Allele Favored by Evolution.
For each SNP e, define φ as:
φ(e) =
∑h[Mh,e ·HAF(h)]∑
h HAF(h), (SN1.2)
In other words, φ is sum of HAF scores of carriers of the derived allele e (∑
h[Mh,e · HAF(h)]),
divided by sum of HAF scores of all haplotypes in the sample (∑
h HAF(h)).
Similarly, for each SNP e, we define κ as:
κ(e) =
∣∣∣∣⋃h
{Mh,e ·HAF(h)}∣∣∣∣− 1∣∣∣∣⋃
h
{HAF(h)}∣∣∣∣ , (SN1.3)
implying that κ is the fraction of distinct non-zero values in HAF scores of SNP e carriers. κ is
closely related, but not identical, to fraction of all distinct haplotypes that carry the mutation e.
Nature Methods: doi:10.1038/nmeth.4606
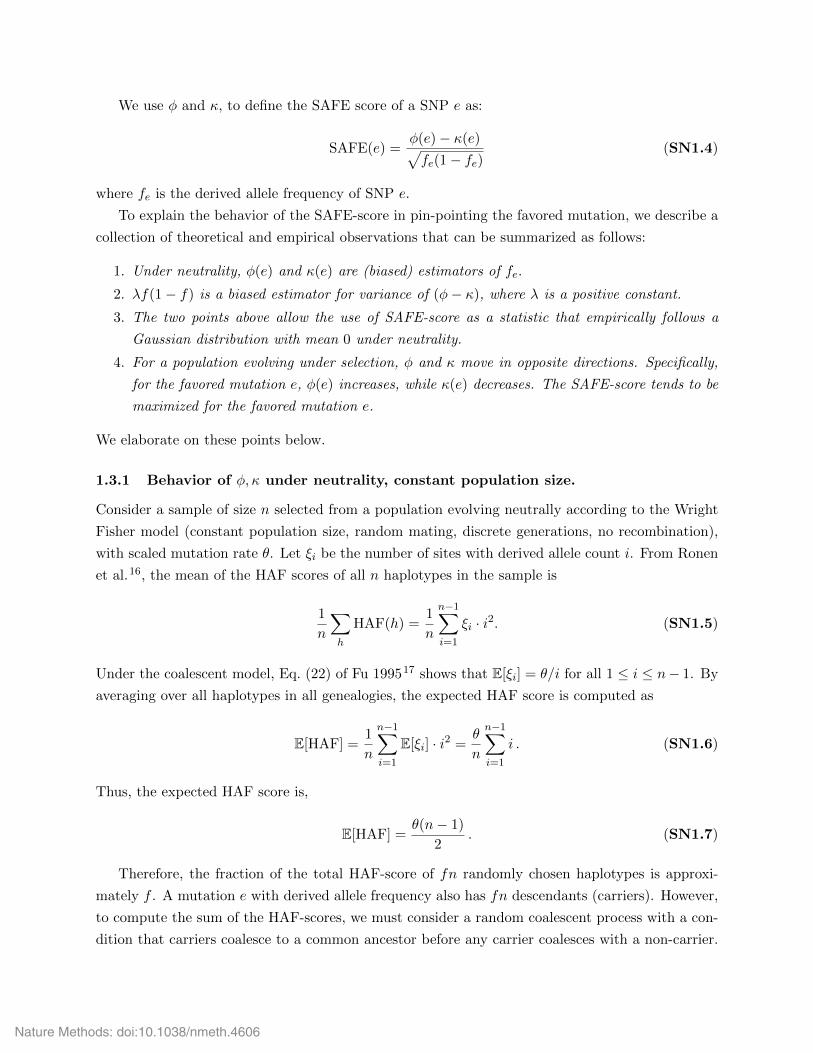
We use φ and κ, to define the SAFE score of a SNP e as:
SAFE(e) =φ(e)− κ(e)√fe(1− fe)
(SN1.4)
where fe is the derived allele frequency of SNP e.
To explain the behavior of the SAFE-score in pin-pointing the favored mutation, we describe a
collection of theoretical and empirical observations that can be summarized as follows:
1. Under neutrality, φ(e) and κ(e) are (biased) estimators of fe.
2. λf(1− f) is a biased estimator for variance of (φ− κ), where λ is a positive constant.
3. The two points above allow the use of SAFE-score as a statistic that empirically follows a
Gaussian distribution with mean 0 under neutrality.
4. For a population evolving under selection, φ and κ move in opposite directions. Specifically,
for the favored mutation e, φ(e) increases, while κ(e) decreases. The SAFE-score tends to be
maximized for the favored mutation e.
We elaborate on these points below.
1.3.1 Behavior of φ, κ under neutrality, constant population size.
Consider a sample of size n selected from a population evolving neutrally according to the Wright
Fisher model (constant population size, random mating, discrete generations, no recombination),
with scaled mutation rate θ. Let ξi be the number of sites with derived allele count i. From Ronen
et al.16, the mean of the HAF scores of all n haplotypes in the sample is
1
n
∑h
HAF(h) =1
n
n−1∑i=1
ξi · i2. (SN1.5)
Under the coalescent model, Eq. (22) of Fu 199517 shows that E[ξi] = θ/i for all 1 ≤ i ≤ n− 1. By
averaging over all haplotypes in all genealogies, the expected HAF score is computed as
E[HAF] =1
n
n−1∑i=1
E[ξi] · i2 =θ
n
n−1∑i=1
i . (SN1.6)
Thus, the expected HAF score is,
E[HAF] =θ(n− 1)
2. (SN1.7)
Therefore, the fraction of the total HAF-score of fn randomly chosen haplotypes is approxi-
mately f . A mutation e with derived allele frequency also has fn descendants (carriers). However,
to compute the sum of the HAF-scores, we must consider a random coalescent process with a con-
dition that carriers coalesce to a common ancestor before any carrier coalesces with a non-carrier.
Nature Methods: doi:10.1038/nmeth.4606

This is harder, even though conditional coalescent processes have been studied extensively (e.g.,
Wiuf and Donnelly18). Empirical analysis on neutral coalescent simulations conditioned on the
mutation e having fn carriers reveals that (Supplementary Fig. 1a)
E[φ(e)|f ] ≈ f .
While κ has not been studied previously, it is closely related to the fraction of distinct haplotypes
in the sample. Empirically, for a mutation e, with fn descendants, we observe that (Supplemen-
tary Fig. 1a)
E[κ(e)|f ] ≈ f .
and, for all e (Supplementary Fig. 1b),
E[φ(e)− κ(e)] ≈ 0 . (SN1.8)
1.3.2 Distribution of SAFE-scores in a neutrally evolving population.
The discussion above suggests that E(SAFE(e)) = 0 for all derived alleles e. Additionally, empirical
observations suggest that λf(1−f) is a biased estimator for variance of (φ−κ), where λ is a positive
constant. We observed empirically that the distribution of the SAFE score of derived alleles in a
neutrally evolving population is therefore approximated by a Gaussian distribution with mean 0
and unknown variance λ (see Supplementary Fig. 1b).
1.3.3 Behavior of φ, κ, and SAFE in a population under selection with a constant
population size.
The dynamics of HAF-score for a haplotype carrying the favored mutation in an ongoing selective
sweep was analyzed earlier16. It increases dynamically upto fixation of the favored allele, and then
decreases dramatically.
Formally, let HAF car (respectively, HAF non) denote the HAF score of a random haplotype car-
rier of the favored allele (respectively, a non-carrier) when a fraction f of the n sampled haplotypes
carry the favored allele. In S1 Text of Ronen et al.(2015)16, we show that under strong selection
(Ns� 1) and no recombination,
E[HAF car] ≈ θn(f + 1
2− 1
(1− f)n+ 1
), (SN1.9)
E[HAFnon] ≈ θn(
1
2+
1
2n− 1
(1− f)n+ 1
). (SN1.10)
Because of the separation between carriers and non-carriers, the HAF-scores can be used to
predict the carrier of ongoing selective sweeps without knowledge of the favored allele16. Moreover,
for the favored allele e with fn descendants, in a hard selective sweep that is not very close to
fixation, we can approximate φ(e) as
Nature Methods: doi:10.1038/nmeth.4606

φ(e) ≈ fnE[HAF car]
fnE[HAF car] + (1− f)nE[HAFnon]≈ f2 + f
f2 + 1= f +
f2(1− f)
f2 + 1≥ f . (SN1.11)
For a population undergoing a positive natural selection with favored mutation e, φ(e) overestimates
the favored allele frequency f (Fig. 1a,b and Eq. SN1.11). On the other hand, κ(e) underestimates
f (Fig. 1a,b). Therefore, we expect the distribution of (φ− κ) for the favored allele to be skewed
in positive direction.
SAFE score performs very well in identifying the favored variant within a small window (Fig. 1c
and Supplementary Fig. 2); but the performance decays in larger windows (Fig. 2c); because in
larger windows most of the haplotypes become unique and κ estimate f correctly, even for favored
mutations of selective sweeps, while we expect it to underestimate the f for the favored mutations.
Consequently, the estimator κ is no-longer useful for pinpointing the favored mutation.
1.4 Illustration of iSAFE: integrated SAFE for large regions.
We devise iSAFE-score by extending the SAFE score to boost the performance in larger windows.
We apply the SAFE score, as a kernel, on overlapping sliding windows. Define S as the set of all
SNPs, W as the set of all sliding windows. Let S1 ⊆ S denote the subset of mutations that had
the highest SAFE-score in their respective windows. For mutation e ∈ S, and window w ∈ W, let
Ψe,w denote the SAFE-score of e, when e is ‘inserted’ into window w if it is positive, 0 otherwise.
Fig. 2a provides a cartoon illustration of windows w1, w2, w3 and F, N, and �, where F denotes
the favored mutation and is located in w2.
We note the following:
• ΨF,w2is high for the favored mutation F. However, ΨN,w1
and Ψ�,w3may be high even for
hitchhiking mutations (N,�) due to the genealogies of w1 and w3. Thus SAFE-score by itself
may not be a reliable predictor over a large region containing multiple windows.
• When a non-favored mutation is inserted in a window with a different genealogy, it is not likely
to have a high SAFE-score. When F and N are inserted into window w3, ΨF,w3> ΨN,w3
because F separates carriers from non-carriers and has high values for φ(F) and low values
for κ(F). On the other hand, κ(N) is higher because its descendants include non-carriers
which are typically distinct haplotypes. Similarly ΨF,w1> Ψ�,w1
because φ(�) is lower in
w1. In other words, the weighted sum of ΨF,w over all windows w is likely to dominate other
mutations.
• Similarly, the window containing the favored mutation (w2) has the appropriate genealogy,
and is likely to give a high score to multiple candidate mutations.
Based on these considerations, we define the score α of window w ∈ W as:
α(w) =
∑e∈S1 Ψe,w∑
w′∈W∑
e∈S1 Ψe,w′, (SN1.12)
Nature Methods: doi:10.1038/nmeth.4606

The window with the highest weight is the one which gets higher SAFE-scores for other mutations
that are insrted into it. Finally, we define the score iSAFE of mutation e ∈ S as:
iSAFE(e) =∑w∈W
Ψe,w · α(w). (SN1.13)
where the mutation with the highest score is one that gives high scores when inserted into high
weight windows.
1.5 MDDAF: Maximum Difference in Derived Allele Frequency.
We have shown that iSAFE is successful in pinpointing the favored variant in an ongoing selective
sweep. When the favored mutation is near fixation (ν > 0.9), iSAFE performance decays and when
the favored variant is fixed (ν = 1), iSAFE cannot detect the favored mutation because it is no
longer a variant (Supplementary Fig. 3e). For the purpose of pinpointing the favored mutation
in a fixed selective sweeps we add random samples from non-target population (outgroup) to the
target population to constitute 10% of the sample.
To minimize the noise added to the data with random outgroup samples, we devise a simple
method to decide whether to use outgroups or not. Our score is motivated by the work of Grossman
et al.(2010)1, who introduced the ∆DAF score of a mutation as ∆DAF = DT −mean(DNT ), where
DT is the derived allele frequency in the target population and mean(DNT ) is the average derived
allele frequency in non-target populations. As it is possible that some of the non-target populations
are also under selection, choosing the average derived allele frequency may lower ∆DAF, and weaken
the signal of selection. Instead we define the Maximum Difference in Derived Allele Frequency
(MDDAF) score as :
MDDAF = DT −min(DNT ), (SN1.14)
where, DT is the derived allele frequency in the target population and min(DNT ) is the minimum
derived allele frequency over all non-target populations.
1.6 Adding Outgroup Samples.
Simulation of human population demography under neutral evolution (Supplementary Fig. 14),
shows P (MDDAF > 0.78|DT > 0.9) = 0.001 (Supplementary Fig. 15) making it a rare event to
have high MDDAF score even when the frequency is high in the Target population. Therefore, when
there is a high frequency mutation (DT > 0.9) with MDDAF > 0.78 in the target population, we
add random outgroup samples to the data to constitute 10% of the data. For analysis on real data,
where we looked at 1000GP populations, we randomly selected outgroup samples from non-target
populations of 1000GP.
In Supplementary Fig. 3c, we compared the performance of iSAFE with or without having
the option of using outgroup samples; we simulated 5 Mbp of human genome based on the human
demography model described in Supplementary Fig. 14. The selection happens in a random
Nature Methods: doi:10.1038/nmeth.4606

time, with a distribution given in Supplementary Fig. 14b, after the out of Africa in the lineage
of EUR population (as the target population). When the onset of selection is before split of EUR
and EAS (> 23kya), both (EUR and EAS) are under selection. When we have random sample
option, we use the MDDAF criterion to decide whether we should use random sample or not. In
case of adding random sample, we add a random subset of individuals from EAS+AFR to constitute
10% of the data (200 haplotypes from EUR and 22 from EAS+AFR).
The performance of iSAFE for sweeps with ν < 0.9 did not change with or without having
outgroup sample option (Supplementary Fig. 3e). When frequency of the favored mutation is
near fixation (ν > 0.9) having the outgroup sample option is helpful and increase the performance
of the iSAFE. When the sweep is fixed (ν = 1), iSAFE is no longer capable of detecting the favored
mutation without having outgroup samples because the favored mutation is no longer a variant in
the target population. However, with the outgroup sample option, iSAFE can successfully pinpoint
the Favored mutation even in a fixed selective sweep (see Supplementary Fig. 3e).
Nature Methods: doi:10.1038/nmeth.4606

Supplementary Note 2:
Results on selective sweeps in human populations
2.1 Well characterized selective sweeps.
We examined 8 well characterized selective sweeps with strong candidate mutation. These loci are
LCT, SLC24A5, TLR1, EDAR, ACKR1/DARC, ABCC11, HBB, and G6PD1,13,6,12,15,8. iSAFE
results for these loci are summarized in Fig. 3b and Supplementary Fig. 8 and Supplementary
Table 1.
We also examined 14 other loci reported to be under selection with one or more candidate
favored mutations19,20,5,1,21.
2.2 Pigmentation genes.
SLC45A2/MATP. This region is involved in human pigmentation pathways and is a target
of selective sweep in European population19. A nonsynonymous mutation rs16891982 is
associated with light skin pigmentation and is believed to be the favored variant1,19. This
mutation is also ranked first by iSAFE out of ∼21,000 mutations (5 Mbp) in CEU population
with a significant score (see Fig. 3c, iSAFE = 0.32, P < 1.3e-8). This mutation is almost
fixed in European; frequency in AFR, EAS, SAS, AMR, and EUR is 0.04, 0.01, 0.06, 0.45,
and 0.94, respectively.
MC1R. The MC1R gene is implicated in many skin color phenotypes, including red hair, fair skin,
freckles, poor tanning response and higher risk of skin cancer. It is is a target of positive
selection in East Asian populations, with a non-synonymous mutation (rs885479) suggested
as a candidate favored mutation20. This mutation is ranked first by iSAFE in CHB+JPT
(see Fig. 3c, iSAFE = 0.24, P = 1.4e-6) out of ∼16,000 mutations (2.8 Mbp). The putative
selected region is 300 kbp away from the telomere of chromosome 16.
GRM5-TYR. The Tyrosinase (TYR) gene, encoding an enzyme involved in the first step of
melanin production is present in a large region under selection. A nonsynonymous mutation
rs1042602 in TYR gene is reported as a candidate favored variant19. A second intronic
variant rs10831496 in GRM5 gene, 396 kbp upstream of TYR, has been shown to have a
strong association with skin color22.
In contrast, iSAFE ranks mutation rs672144 as the top candidate for the favored variant
region out of ∼22,000 mutations (5 Mbp). This variant was the top ranked mutation not only
in CEU (iSAFE = 0.48, P � 1.3e-8), but also the top ranked mutation for EUR, EAS, AMR,
and SAS (see Fig. 3c and Supplementary Fig. 10). The signal of selection is strong in
all populations (iSAFE > 0.5, P � 1.3e-8 for all of) except AFR, which does not show a
signal of selection in this region. It may not have been reported earlier because it is near
fixation in all populations of 1000GP except for AFR (f = 0.27), as seen in Supplementary
Fig. 10. We plotted the haplotypes carrying rs672144 and found (Fig. 3d) that two distinct
Nature Methods: doi:10.1038/nmeth.4606

haplotypes carry the mutation, both with high frequencies maintained across a large stretch
of the region, suggestive of a soft sweep with standing variation.
The previously suggested candidates rs1042602, rs10831496 are fully linked to rs672144 (Sup-
plementary Fig. 10c), but not to each other. The EUR haplotypes can be partitioned into
4 clusters (Supplementary Fig. 10c). Each of the 4 haplotypes show high homozygosity,
suggestive of selection. However, rs1042602 can only explain the sweep in clusters C1+C2.
rs10831496 can only explain C1+C3. Only rs672144 explains all 4 clusters, providing a sim-
pler explanation of selection in this region. GTEx eQTL analysis on TYR gene for the tissue
‘Skin - Sun Exposed (Lower leg)’ showed P = 0.61 for rs1042602, P = 0.15 for rs10831496,
and P = 0.08 for rs672144. While the P value does not rise to a level of significance due to
sample size issues, it is indicative of a regulatory function for the mutation.
OCA2-HERC2. This region is suggested as a target of selection in European1,23,19, and several
mutations in this region are associated with hair, eye, and skin pigmentation. For example,
rs12913832 is considered to be the main determinant of iris pigmentation (brown/blue) and is
also associated with skin and hair pigmentation and the propensity to tan19. rs1667394 is also
linked to blond hair and blue eyes23. Some other mutations, many fully linked, (rs4778138,
rs4778241, rs7495174, rs1129038, rs916977) are also associated with blue eyes23. This region
is also suggested to be a target of selection in East Asia with rs1800414 suggested as a
candidate for light skin pigmentation in that population. We applied iSAFE on this region
to all 1000GP super-populations.
iSAFE selected a single variant rs1448484 in OCA2 (with high confidence, P < 1.34e-8 for
EUR, EAS, AMR and P = 2.13e-6 for SAS) as the favored variant in all 1000GP populations
(EUR, EAS, SAS, AMR) except for AFR that showed no signal of selection in this region (see
Supplementary Fig. 11 and Fig. 3c). This variant is close to fixation in all populations
except for AFR, where ν = 20% (see Supplementary Fig. 11). iSAFE result along with
the frequency pattern of the top ranked variant, suggests an out of Africa selection, probably
on light skin color, on this region. The other candidate variants are all ranked high, and
tightly linked with the top-ranked variant (Supplementary Table SN2.1).
KITLG. This genomic region has been linked to skin pigmentation24 in European and East Asian
populations, and shows a strong signature of selective sweep on regulatory regions surrounding
the gene in all non-African populations20, with a candidate variant rs642742, that is associated
with skin pigmentation24.
iSAFE analysis identified the same mutations gaining the top rank in multiple populations
(Supplementary Fig. 12). Top rank mutations in EUR, SAS, EAS, and AMR populations
are shown in Supplementary Table SN2.2. The top ranked mutation in EUR and CEU
populations (rs405647) was ranked 1, 2, 3 in AMR, SAS, and EAS, respectively, and is tightly
linked to rs642742 (D′ = 0.92). Mutation rs661114 is ranked 2 in EUR, 5 in CEU, 6 in SAS,
Nature Methods: doi:10.1038/nmeth.4606

and 20 in AMR, and lies in a region with H3K27 acetylation that is associated with enhanced
expression.
TRPV6. This region has been reported a target of selection in CEU population5. TRPV6 is
involved in calcium absorption. It has been suggested that “Individuals with lighter skin
pigmentation might have produced too much 1,25-dihydroxyvitamin D, resulting in an in-
creased intestinal Ca2+ absorption. Thus, to reduce the risk of absorptive hypercalciuria
with kidney stones, the derived haplotype would have spread only among individuals with
lighter skin pigmentation”25. iSAFE suggests 10 strongly linked mutations located along
a 9 kbp region located 84 kbp downstream of TRPV6 (see Supplementary Fig. SN2.1).
These mutations are ranked in the top 10 in all non-African populations (Supplementary
Table SN2.3). There is no signal of selection in this region in AFR. The pattern of selection
in this region in global population along with the confidence and consistency of iSAFE results
in all non-African populations is consistent with an out of Africa selection on this region with
the favored mutation being near fixation in all non-African populations (Supplementary
Fig. 13).
2.3 Population specific selection: East Asian.
PCDH15. This gene plays a role in development of inner-ear hair cells and maintaining retinal
photoreceptors and is reported to be under selection in East Asian and a nonsynonymous
mutation rs4935502 is proposed to be the favored variant1. This mutation is ranked 12 by
iSAFE in CHB+JPT (see Supplementary Fig. 9, iSAFE = 0.45, P < 1.34e-8). All top
mutations are highly linked.
ADH1B. ”The ADH1B gene encodes one of three subunits of the Alcohol dehydrogenase (ADH1)
protein, a major enzyme in the alcohol degradation pathway that catalyzes the oxidization of
alcohols into aldehydes.” This region is a target of positive selection in East Asian population5.
A non-synonymous mutation in this gene is associated with Alcohol dependence26. We tested
this gene in CHB+JPT populations. iSAFE rank, in 2 Mbp around ADH1B gene, for the
candidate mutation (rs1229984) is 8 (see Supplementary Fig. 9). The top rank mutation
is an upstream mutation (rs3811801) 5 kbp upstream of the candidate mutation rs1229984
and highly linked to it (D′ = 0.99). The second rank mutation (rs284787) is a 3′-UTR of
ADH7 which is shown to be associated with Upper Aerodigestive Tract Cancers in a Japanese
Population27.
2.4 Population specific selection: UK
The UK Biobank project was recently investigated for regions under selection. The regions were
reported as a target of a recent selection by analyzing the structure of UK Biobank and Ancient
Eurasians21. We applied iSAFE on GBR (British in England and Scotland) population in 1000GP
to check if the favored mutation could be confirmed.
Nature Methods: doi:10.1038/nmeth.4606

ATXN2-SH2B3. Galinsky et al. proposed a nonsynonymous mutation (rs3184504) as a candi-
date that is associated to blood pressure28. We tested this region in GBR population of
1000GP. This candidate mutation is jointly ranked first with two other mutations rs7137828,
rs7310615 (see Fig. 3c, iSAFE = 0.27, P = 1.6e-7). rs7137828 is an intronic mutation in
ATXN2 that is associated with Primary Open Angle Glaucoma that is a leading cause of
blindness worldwide29. The other first rank mutation (rs7310615) is associated with blood
expression levels of SH2B330. Surprisingly, all of the top 10 mutations, ranked by iSAFE
have a known association to a phenotype (Supplementary Table SN2.4), and are highly
linked (Supplementary Fig. SN2.2).
CYP1A2/CSK. We tested a 5 Mbp region around these genes in GBR population of 1000GP.
The proposed mutation rs1378942 by21 with frequency 0.69 in GBR population is ranked
89 by iSAFE (iSAFE = 0.13, P = 7.0e-5). The top-ranked mutation rs2470893 (Fig. 3c,
iSAFE = 0.16, P = 2.7e-5) is between CYP1A1 and CYP1A2 with frequency 0.40 in GBR
and is associated with Caffeine metabolism31. rs2470893 and rs1378942 are in a strong LD
(D′ = 0.91).
FUT2. The signal of selection on 5 Mbp around this region in GBR population is very weak
(Supplementary Fig. 9), with peak iSAFE = 0.026, P = 0.009. There is a very weak peak
in 400 kbp around FUT2 gene (chr:49077276-49475876). The stop gained mutation rs601338
proposed as a candidate mutation by21 is ranked 4 (P = 0.1).
F12. The signal of selection on 5 Mbp around this region in GBR population is very weak (Sup-
plementary Fig. 9, peak iSAFE = 0.027, P = 0.008). The proposed mutation rs2545801
has a very weak signal (P = 0.2).
Other genes
PSCA. This gene has been reported as a target of selection in YRI population5. A 5′UTR
mutation rs2294008 proposed as a candidate favored mutation in this region that is associated
with urinary bladder and gastric cancers32,33. The signal of iSAFE in 5 Mbp around this gene
in YRI population is weak (see Supplementary Fig. 9, peak iSAFE = 0.04, P = 2.4e-3).
The proposed mutation rs2294008 is ranked 7 in 5 Mbp region surrounding this region. The
local rank in 400 kbp around this gene is joint-first with 8 other mutations including rs2976392
which is also associated with diffuse-type gastric cancer33. Other mutations are rs2978979,
rs2920279, rs2978980, rs2920282, rs2294010, rs2717562, rs2978982. This 9 mutation are fully
linked in YRI population in a 20 kbp region that cover PSCA from upstream regulatory region
to its down stream (chr8:143757286-143776668, GRCh37/hg19).
ASPM. This gene is reported to be a target of weak selection in GBR population5. The signal
in 2 Mbp around this gene is very weak (see Supplementary Fig. 9, peak-iSAFE = 0.025,
Nature Methods: doi:10.1038/nmeth.4606

P = 0.01). The proposed mutation rs41310927 has a very weak signal (P = 0.4). However,
we do see a strong iSAFE signal 1.3 Mbp away from the ASPM gene.
Nature Methods: doi:10.1038/nmeth.4606

Supplementary Fig. SN2.1:SNP matrix of TRPV6 top candidates. Haplotypes of top 10 iSAFE mutations, and theproposed mutation (rs4987682) by5, in 5 Mbp around TRPV6 in 2504× 2 haplotypes of 1000GPare shown. These mutations are sorted by their iSAFE rank from left to right. iSAFE top 10mutations span a 9 kbp region(chr7:142476441-142485399, GRCh37/hg19). White is derived andblack is ancestral allele.
Supplementary Fig. SN2.2:SNP matrix of ATXN2-SH2B3 top candidates. Haplotypes of top 20 iSAFE mutations in5 Mbp around ATXN2-SH2B3 in GBR population are shown. These mutations are sorted by theiriSAFE rank from left to right. They span a 1.07 Mbp region around ATXN2-SH2B3 region(chr12:111833788-112906415, GRCh37/hg19). White is derived and black is ancestral allele. Mostof these mutations are associated to a phenotype (see Supplementary Table SN2.4).
Nature Methods: doi:10.1038/nmeth.4606

Supplementary Table SN2.1:iSAFE rank of putative favored variants of OCA2-HERC2. iSAFE rank of candidatemutations proposed by19,23 in 1 Mbp region around OCA2-HERC2 that are associated with eye,hair, and skin pigmentation. Number of haplotypes in CEU, CHB, and JPT populations are 198,206, and 208, respectively. Computation of empirical P value is provided in Online Methods.
ID Association Population iSAFE Rank P
rs916977 Blue eye CEU 15 4.1E-5
rs1667394 Blue eye & blond hair CEU 16 4.3E-5
rs1129038 Blue eye CEU 21 6.2E-5
rs12913832 Blue eye, skin & hair CEU 21 6.2E-5
rs4778138 Blue eye CEU 70 1.6E-4
rs4778241 Blue eye CEU 72 1.8E-4
rs1800414 Skin CHB+JPT 122 2.6E-3
Supplementary Table SN2.2:KITLG candidate variants. iSAFE rank of top mutations in 2 Mbp around KITLG gene.sorted by their Mean Reciprocal Ranks, calculated over EUR, SAS, EAS, and AMR. Only thosewith Mean Reciprocal Rank greater than 0.1 are shown (the candidate mutation rs642742proposed by24 is also reported in the last row). Frequency and iSAFE score for this region in allthe 1000GP populations are provided in Supplementary Fig.12. Number of haplotypes inCEU, EUR, SAS, EAS, and AMR populations are 198, 1006, 978, 1008, and 694, respectively.
IDiSAFE Rank
EURiSAFE Rank
SASiSAFE Rank
EASiSAFE Rank
AMRMean Reciprocal RankEUR, SAS, EAS, AMR
iSAFE RankCEU
rs405647 1 2 3 1 0.71 1
rs496859 4 1 2 12 0.46 7
rs61942772 10 57 1 94 0.28 22
rs560859 2 4 152 20 0.2 5
rs661114 2 6 151 20 0.18 5
rs11105020 8 3 32 5 0.17 23
rs10506957 17 22 46 2 0.16 2
rs7979311 5 5 156 20 0.11 3
rs1907702 22 20 45 3 0.11 8
rs642742 30 49 64 166 0.02 94
Supplementary Table SN2.3:TRPV6 candidate variants. iSAFE rank of top mutations in 5 Mbp around TRPV6 gene,sorted by their Mean Reciprocal Ranks, calculated over EUR, SAS, EAS, and AMR. Number ofhaplotypes in CEU, EUR, SAS, EAS, and AMR populations are 198, 1006, 978, 1008, and 694,respectively.
IDiSAFE Rank
EURiSAFE Rank
SASiSAFE Rank
EASiSAFE Rank
AMRMean Reciprocal RankEUR, SAS, EAS, AMR
iSAFE RankCEU
rs11772526 4.0 1.0 1.0 1.0 0.81 4.0
rs4725602 1.0 4.0 1.0 2.0 0.69 1.0
rs11763225 1.0 4.0 5.0 2.0 0.49 1.0
rs7796010 4.0 1.0 3.0 6.0 0.44 4.0
rs11762011 4.0 3.0 3.0 6.0 0.27 4.0
rs13239916 4.0 6.0 6.0 4.0 0.21 4.0
rs4145394 3.0 8.0 10.0 5.0 0.19 1.0
rs10808023 8.0 7.0 7.0 8.0 0.13 4.0
rs10808021 9.0 10.0 8.0 8.0 0.12 10.0
rs4726591 10.0 9.0 9.0 10.0 0.11 4.0
Nature Methods: doi:10.1038/nmeth.4606

Supplementary Table SN2.4:ATXN2-SH2B3 candidate variants. iSAFE rank of top 20 mutations in GBR population(182 haplotypes) of 1000GP in 5 Mbp around ATXN2-SH2B3 region and their association todiseases. Computation of empirical P value is provided in Online Methods.
ID Rank P Gene Function GBR Frequency Association Reference
rs3184504 1 2.2e-7 SH2B3 missense 0.5 Blood pressure and hypertension, Coronary artery disease, & more 34
rs7137828 1 2.2e-7 ATXN2 intron 0.5 Primary open-angle glaucoma 29
rs7310615 1 2.2e-7 SH2B3 intron 0.5 Fibrinogen levels 30
rs597808 4 2.7e-7 ATXN2 intron 0.49 Systemic lupus erythematosus 35
rs4766578 5 3.0e-7 ATXN2 intron 0.51 Vitiligo 36
rs10774625 5 3.0e-7 ATXN2 intron 0.51 Systemic lupus erythematosus, Retinal vascular caliber 35
rs653178 7 3.1e-7 regulatory 0.5 Blood pressure and hypertension, Myocardial infarction, & more 34
rs11065979 8 4.4e-7 intergenic 0.47 Cancer (pleiotropy) 37
rs17630235 9 4.6e-7 TRAFD1 downstream 0.43 Body mass index 38
rs11065987 10 4.9e-7 intergenic 0.45 Tetralogy of Fallot, Coronary artery disease, & more 39
rs11065991 10 4.9e-7 BRAP intron 0.45
rs10774624 12 5.2e-7 RP3-473L9.4 intron,nc 0.52 Rheumatoid arthritis 40
rs2013002 13 8.2e-7 ALDH2 upstream 0.44
rs11066309 14 1.1e-6 PTPN11 intron 0.45
rs11066188 15 1.5e-6 0.43
rs17696736 16 1.5e-6 NAA25 intron 0.46 Ischemic stroke, Type 1 diabetes, & more 41
rs11066301 17 1.9e-6 PTPN11 intron 0.46 Hematological parameters 42
rs11066320 17 1.9e-6 PTPN11 intron 0.46
rs11066283 19 2.1e-6 RPL6 downstream 0.46
rs11513729 20 2.2e-6 MAPKAPK5-AS1 downstream 0.45
Nature Methods: doi:10.1038/nmeth.4606

References
[1] Grossman, S. R. et al. A composite of multiple signals distinguishes causal variants in regions
of positive selection. Science 327, 883–886 (2010).
[2] Sturm, R. A. & Duffy, D. L. Human pigmentation genes under environmental selection.
Genome biology 13, 248 (2012).
[3] Fujimoto, A. et al. A replication study confirmed the EDAR gene to be a major contributor to
population differentiation regarding head hair thickness in Asia. Human genetics 124, 179–185
(2008).
[4] Bryk, J. et al. Positive selection in East Asians for an EDAR allele that enhances NF-κB
activation. PLoS One 3, e2209 (2008).
[5] Peter, B. M., Huerta-Sanchez, E. & Nielsen, R. Distinguishing between selective sweeps from
standing variation and from a de novo mutation. PLoS Genet 8, e1003011 (2012).
[6] Enattah, N. S. et al. Identification of a variant associated with adult-type hypolactasia. Nature
genetics 30, 233–237 (2002).
[7] Olds, L. C. & Sibley, E. Lactase persistence DNA variant enhances lactase promoter activity
in vitro: functional role as a cis regulatory element. Human molecular genetics 12, 2333–2340
(2003).
[8] Heffelfinger, C. et al. Haplotype structure and positive selection at TLR1. European Journal
of Human Genetics 22, 551–557 (2014).
[9] Wong, S. H. et al. Leprosy and the adaptation of human toll-like receptor 1. PLoS Pathog 6,
e1000979 (2010).
[10] McManus, K. F. et al. Population genetic analysis of the DARC locus (Duffy) reveals adapta-
tion from standing variation associated with malaria resistance in humans. PLoS genetics 13,
e1006560 (2017).
[11] Miller, L. H., Mason, S. J., Clyde, D. F. & McGinniss, M. H. The resistance factor to
Plasmodium vivax in blacks: the Duffy-blood-group genotype, FyFy. New England Journal of
Medicine 295, 302–304 (1976).
[12] Ohashi, J., Naka, I. & Tsuchiya, N. The impact of natural selection on an ABCC11 SNP
determining earwax type. Molecular biology and evolution 28, 849–857 (2011).
[13] Sabeti, P. C. et al. Positive natural selection in the human lineage. science 312, 1614–1620
(2006).
Nature Methods: doi:10.1038/nmeth.4606

[14] Network, M. G. E. Reappraisal of known malaria resistance loci in a large multicenter study.
Nature genetics 46, 1197–1204 (2014).
[15] Tishkoff, S. A. et al. Haplotype diversity and linkage disequilibrium at human G6PD: recent
origin of alleles that confer malarial resistance. Science 293, 455–462 (2001).
[16] Ronen, R. et al. Predicting carriers of ongoing selective sweeps without knowledge of the
favored allele. PLoS Genet 11, e1005527 (2015).
[17] Fu, Y.-X. Statistical properties of segregating sites. Theoretical population biology 48, 172–197
(1995).
[18] Wiuf, C. & Donnelly, P. Conditional genealogies and the age of a neutral mutant. Theoretical
population biology 56, 183–201 (1999).
[19] Wilde, S. et al. Direct evidence for positive selection of skin, hair, and eye pigmentation in
Europeans during the last 5,000 y. Proceedings of the National Academy of Sciences 111,
4832–4837 (2014).
[20] Coop, G. et al. The role of geography in human adaptation. PLoS Genet 5, e1000500 (2009).
[21] Galinsky, K. J., Loh, P.-R., Mallick, S., Patterson, N. J. & Price, A. L. Population structure
of UK Biobank and ancient Eurasians reveals adaptation at genes influencing blood pressure.
The American Journal of Human Genetics 99, 1130–1139 (2016).
[22] Beleza, S. et al. Genetic architecture of skin and eye color in an African-European admixed
population. PLoS Genet 9, e1003372 (2013).
[23] Donnelly, M. P. et al. A global view of the OCA2-HERC2 region and pigmentation. Human
genetics 131, 683–696 (2012).
[24] Miller, C. T. et al. cis-Regulatory changes in Kit ligand expression and parallel evolution of
pigmentation in sticklebacks and humans. Cell 131, 1179–1189 (2007).
[25] Suzuki, Y. et al. Gain-of-function haplotype in the epithelial calcium channel TRPV6 is a risk
factor for renal calcium stone formation. Human molecular genetics 17, 1613–1618 (2008).
[26] Park, B. L. et al. Extended genetic effects of ADH cluster genes on the risk of alcohol depen-
dence: from GWAS to replication. Human genetics 132, 657–668 (2013).
[27] Oze, I. et al. Impact of multiple alcohol dehydrogenase gene polymorphisms on risk of upper
aerodigestive tract cancers in a Japanese population. Cancer Epidemiology and Prevention
Biomarkers 18, 3097–3102 (2009).
[28] for Blood Pressure Genome-Wide Association Studies, I. C. et al. Genetic variants in novel
pathways influence blood pressure and cardiovascular disease risk. Nature 478, 103–109 (2011).
Nature Methods: doi:10.1038/nmeth.4606

[29] Bailey, J. N. C. et al. Genome-wide association analysis identifies TXNRD2, ATXN2 and
FOXC1 as susceptibility loci for primary open-angle glaucoma. Nature genetics (2016).
[30] De Vries, P. S. et al. A meta-analysis of 120,246 individuals identifies 18 new loci for fibrinogen
concentration. Human molecular genetics ddv454 (2015).
[31] Cornelis, M. C. et al. Genome-wide meta-analysis identifies six novel loci associated with
habitual coffee consumption. Molecular psychiatry 20, 647–656 (2015).
[32] Wu, X. et al. Genetic variation in the prostate stem cell antigen gene PSCA confers suscepti-
bility to urinary bladder cancer. Nature genetics 41, 991–995 (2009).
[33] Sakamoto, H. et al. Genetic variation in PSCA is associated with susceptibility to diffuse-type
gastric cancer. Nature genetics 40, 730–740 (2008).
[34] Levy, D. et al. Genome-wide association study of blood pressure and hypertension. Nature
genetics 41, 677–687 (2009).
[35] Bentham, J. et al. Genetic association analyses implicate aberrant regulation of innate and
adaptive immunity genes in the pathogenesis of systemic lupus erythematosus. Nature genetics
(2015).
[36] Jin, Y. et al. Genome-wide association analyses identify 13 new susceptibility loci for general-
ized vitiligo. Nature genetics 44, 676–680 (2012).
[37] Fehringer, G. et al. Cross-Cancer Genome-Wide Analysis of Lung, Ovary, Breast, Prostate,
and Colorectal Cancer Reveals Novel Pleiotropic Associations. Cancer research 76, 5103–5114
(2016).
[38] Locke, A. E. et al. Genetic studies of body mass index yield new insights for obesity biology.
Nature 518, 197–206 (2015).
[39] Cordell, H. J. et al. Genome-wide association study identifies loci on 12q24 and 13q32 associ-
ated with tetralogy of Fallot. Human molecular genetics dds552 (2013).
[40] Okada, Y. et al. Genetics of rheumatoid arthritis contributes to biology and drug discovery.
Nature 506, 376–381 (2014).
[41] Dichgans, M. et al. Shared genetic susceptibility to ischemic stroke and coronary artery disease.
Stroke 45, 24–36 (2014).
[42] Soranzo, N. et al. A genome-wide meta-analysis identifies 22 loci associated with eight hema-
tological parameters in the HaemGen consortium. Nature genetics 41, 1182–1190 (2009).
Nature Methods: doi:10.1038/nmeth.4606