natural variation in sar11 marine bacterioplankton genomes inferred from metagenomic data
TRANSCRIPT
BioMed CentralBiology Direct
ss
Open AcceResearchNatural variation in SAR11 marine bacterioplankton genomes inferred from metagenomic dataLarry J Wilhelm1, H James Tripp1, Scott A Givan2, Daniel P Smith1 and Stephen J Giovannoni*1Address: 1Department of Microbiology, Oregon State University, Corvallis, OR, 97331, USA and 2Center for Genome Research and Bioinformatics, Oregon State University, Corvallis, OR, 97331, USA
Email: Larry J Wilhelm - [email protected]; H James Tripp - [email protected]; Scott A Givan - [email protected]; Daniel P Smith - [email protected]; Stephen J Giovannoni* - [email protected]
* Corresponding author
AbstractBackground: One objective of metagenomics is to reconstruct information about specificuncultured organisms from fragmentary environmental DNA sequences. We used the genome ofan isolate of the marine alphaproteobacterium SAR11 ('Candidatus Pelagibacter ubique'; strainHTCC1062), obtained from the cold, productive Oregon coast, as a query sequence to studyvariation in SAR11 metagenome sequence data from the Sargasso Sea, a warm, oligotrophic oceangyre.
Results: The average amino acid identity of SAR11 genes encoded by the metagenomic data to thequery genome was only 71%, indicating significant evolutionary divergence between the coastalisolates and Sargasso Sea populations. However, an analysis of gene neighbors indicated that SAR11genes in the Sargasso Sea metagenomic data match the gene order of the HTCC1062 genome in96% of cases (> 85,000 observations), and that rearrangements are most frequent at predictedoperon boundaries. There were no conserved examples of genes with known functions beingfound in the coastal isolates, but not the Sargasso Sea metagenomic data, or vice versa, suggestingthat core regions of these diverse SAR11 genomes are relatively conserved in gene content.However, four hypervariable regions were observed, which may encode properties associated withvariation in SAR11 ecotypes. The largest of these, HVR2, is a 48 kb region flanked by the sole 5Sand 23S genes in the HTCC1062 genome, and mainly encodes genes that determine cell surfaceproperties. A comparison of two closely related 'Candidatus Pelagibacter' genomes (HTCC1062and HTCC1002) revealed a number of "gene indels" in core regions. Most of these were found tobe polymorphic in the metagenomic data and showed evidence of purifying selection, suggestingthat the same "polymorphic gene indels" are maintained in physically isolated SAR11 populations.
Conclusion: These findings suggest that natural selection has conserved many core features ofSAR11 genomes across broad oceanic scales, but significant variation was found associated withfour hypervariable genome regions. The data also led to the hypothesis that some gene insertionsand deletions might be polymorphisms, similar to allelic polymorphisms.
Published: 7 November 2007
Biology Direct 2007, 2:27 doi:10.1186/1745-6150-2-27
Received: 2 October 2007Accepted: 7 November 2007
This article is available from: http://www.biology-direct.com/content/2/1/27
© 2007 Wilhelm et al; licensee BioMed Central Ltd. This is an Open Access article distributed under the terms of the Creative Commons Attribution License (http://creativecommons.org/licenses/by/2.0), which permits unrestricted use, distribution, and reproduction in any medium, provided the original work is properly cited.
Page 1 of 19(page number not for citation purposes)

Biology Direct 2007, 2:27 http://www.biology-direct.com/content/2/1/27
Open peer reviewReviewed by Eugene Koonin, Igor B. Jouline (Zhulin) andPeer Bork. For the full reviews, please go to the Reviewers'comments section.
BackgroundA particularly vexing aspect of microbial genomics is thecommon observation of high genome variability amongstrains of a species [1-3]. Such observations have raisedsignificant questions about the validity of the microbialspecies concept, and the value of single genome sequencesfor comparisons between taxa [4]. To reconcile thisdilemma, it has been suggested that bacterial species havea "core-genome" consisting of genes that are alwayspresent, and a "pan-genome" of genes that are variablypresent [3]. Metagenomics, the study of genome sequenceretrieved from mixed assemblages of organisms collectedfrom nature, is providing high coverage of genomesequence variation from natural microbial communities[5], which can be employed to study the conservation ofgenome features and illustrate patterns of natural varia-tion.
The Sargasso Sea metagenomic dataThe Sargasso Sea is an oligotrophic subtropical gyre whereaverage surface temperatures are about 23°C, and rarelydrop below 20°C [6]. The Sargasso Sea metagenomic dataconsists of 1.6 G base pairs of unique environmentalgenomic DNA shotgun sequence. The SAR11 cladeaccounts for 380 of the 1,412 SSU rRNA genes in the Sar-gasso Sea data (27%), suggesting that it includes enoughSAR11 genome sequence data to encode the equivalent ofabout 775 SAR11 strain HTCC1062 genomes [7]. Despitethe abundance of SAR11 genome sequences in the Sar-gasso Sea data, the assembly of SAR11 genomes failedwhen traditional DNA assembly methods were applied[7]. The largest SAR11 rRNA-anchored scaffold recon-structed with the Celera Assembler was relatively small(ca. 21,000 bp), and assembly depth-of-coverage was low(0.94 – 2.2 fold) [7].
Genome streamliningThe genome streamlining theory was invoked to explainthe small genomes of 'Candidatus Pelagibacter' andProchlorococcus [8,9]. The essence of the genome stream-lining theory is that selection is most efficient in microbialpopulations that have large effective population sizes, andtherefore the elimination of unnecessary DNA fromgenomes will be most pronounced in organisms, like bac-terioplankton, that meet this criterion. In particular,"genome streamlining" usually refers to the eliminationof functionless DNA from genomes, because of the cost ofreplication. However, in principle the same conceptshould apply to other features of genome evolution. If thegenome streamlining theory is correct, then, in large bac-
terioplankton populations, selection should be unusuallyefficient at preserving all genome features that have a pos-itive fitness associated with them, and eliminating fea-tures that confer a negative fitness.
Ecologically significant variation in SAR11 populationsThis observation of high sequence diversity led to specu-lation that the SAR11 clade might be a diverse assemblageof perhaps hundreds or thousands of species, each withlow coverage in the shotgun sequence library [7]. How-ever, ecological data suggests that the SAR11 clade con-sists of a few ecotypes, which can be differentiated eitherphylogenetically [10], or by their appearance in the envi-ronment at different depths and seasons [11]. A phyloge-netic analysis of 16S rRNAs revealed the presence of twoSAR11 ecotypes in the Sargasso Sea metagenomic data[12]. Rusch et al. [13] reported evidence of nine geneti-cally divergent SAR11 populations in metagenomic datafrom different ocean surface sites. The interpretation mostconsistent with this data is that the large population sizesof SAR11, and the age of these clades, allow them to accu-mulate very extensive neutral sequence variation thatrenders assembly difficult, but that there are relatively few,perhaps less than a dozen, ecotypes that are important tothe ecology of the oceans [2].
Throughout this paper we refer to genes found in themetagenomic data as "SAR11 genes" if they were found onfragments of DNA sequence that harbored at least onegene identified as a 'Candidatus Pelagibacter' gene, accord-ing to the tests described below. We use the term 'Pelagi-bacter', to refer to genes from the two sequenced genomesof 'Candidatus Pelagibacter ubique', because these isolatesare genetically distinct from Sargasso Sea SAR11 popula-tions. Pelagibacter strains HTCC1062 and HTCC1002were isolated from the cold, nutrient rich Oregon coast[14,15], have an average 16S rRNA sequence similarity toSAR11 16S rRNA genes from the Sargasso Sea metagen-omic data of 96%, and belong to a 23S-ITS-16S phyloge-netic cluster that is distinct from Sargasso Sea populations[16]. In addition to ocean currents and geography, thelarge temperature difference between the Sargasso Sea andthe Oregon coast is most likely a significant barrier thatisolates their respective SAR11 populations. A SAR11strain obtained very recently from the Sargasso Sea,HTCC7211, shows a higher temperature optimum thanthe Oregon coast isolates, as predicted from the significantdifference in temperature between these environments(Stingl, unpublished data).
Autecology approaches to the study of metagenomic dataAutecology is the study of the ecology of species. A varietyof approaches have been employed to infer informationabout microbial genome variation for specific taxa frommetagenomic data, with the intent of understanding the
Page 2 of 19(page number not for citation purposes)

Biology Direct 2007, 2:27 http://www.biology-direct.com/content/2/1/27
roles of organisms in ocean surface ecology. Hallam et al.[17], used a composite genome sequence of Cenarchaeumsymbiosum to study the diversity of Marine Group Iarchaeal genomes in metagenomic databases using BLASTscore ratios [18] to identify conserved genes, and a similarapproach was employed by Coleman to study genomevariation in Prochlorococcus [19]. Recently, a study waspublished by Rusch et al. [13] that used marine microbialgenomes as templates to identify environmental frag-ments from ocean metagenomic data. Rusch et al. [13]used BLASTN to identify homologs to SAR11 genes, butdid not employ further tests to exclude homologs origi-nating from non-SAR11 organisms.
ObjectivesThe objective of this study was to identify genomic fea-tures of SAR11 that are conserved between two Pelagi-bacter isolates and their counterparts in the Sargasso Sea.The predicted proteins of the HTCC1062 genome wereused as TBLASTN queries to identify homologs to SAR11proteins in the Sargasso Sea metagenomic DNA, and onlygenes that retrieved Pelagibacter homologs as their topscores when the NCBInr database was searched withBLASTP were classified as SAR11 genes. We quantifiedgene-to-gene boundaries to assess gene insertions, dele-tions and rearrangements, and the occurrence of non-orthologous genes adjacent to Pelagibacter orthologs. Wemeasured synteny and displayed the relationship betweensynteny and amino acid identity in a novel way thatallows observation of small-scale gene insertions (<5genes). Collectively, these tools enabled us to ask ques-tions about the presence of genes in conserved gene order,gene rearrangements, and the juxtaposition of Pelagi-bacter homologs with genes that are not found in Pelagi-bacter, which might reveal genes unique to the SargassoSea population. To our surprise, with the exception of thehypervariable regions of the genome, we found that thegenomes of the divergent population we studied wereremarkably similar to the query genome in gene contentand gene order. The results suggest that extraordinarilyhigh allelic variation and genome rearrangements maskthe conservation of many genome properties in nativeSAR11 populations.
ResultsThe genome sequence of any individual microbial cell is asub-sample of natural variation. Metagenomics is nowproviding extraordinary datasets that deeply sample natu-ral variation, raising the question, how should this varia-tion be represented? We have taken a comparativeapproach to learn more about SAR11 genomes, but wehave also searched for evolutionary models that will helpus understand and graphically represent natural genomevariation. Our comparative approach stems from a largergoal of understanding the nature of species and ecotypes
in SAR11 populations. A full description of a species orecotype might include: 1) a list of core genes that confer arelatively conserved phenotype, 2) a list of ancillary genesthat may be found, along with the probabilities that eachgene is present, and 3) information about patterns in genecomposition and gene order that reflect evolutionaryprocesses, such as the divergence of species or ecotypes.
Phylogenetic relationships between the query genomeand SAR11 genomes represented in the metagenomic dataare shown in Fig. 1. The tree supports the presence of twosub-clades in the Sargasso Sea metagenomic data, as pre-viously reported [12].
StrategyThe bioinformatic strategy we employed is outlined in Fig.2. Table 1 lists the number of fragments in the metagen-omic dataset, and the number of those that had TBLASTN
Maximum likelihood tree of recA amino acid sequencesFigure 1Maximum likelihood tree of recA amino acid sequences. The tree includes Sargasso Sea metagenomic data and predicted proteins from cultured isolates of Pelagi-bacter. The sequence data was derived from Vergin et al., 2007 [37], with the addition of a sequence from strain HTCC7211, which was recently isolated from the Sargasso Sea. All other HTCC strains are from the coastal Pacific Ocean. The non-HTCC numbers correspond to the frag-ment identifier in the Sargasso Sea data set. The scale bar indicates substitutions per nucleotide position.
�
�
����������� ����������������������������������
��������������������
Page 3 of 19(page number not for citation purposes)

Biology Direct 2007, 2:27 http://www.biology-direct.com/content/2/1/27
expect scores lower than 1 × 10⁻¹⁰ to HTCC1062 genes,which we called "homologous fragments". We use theterm "fragment" to refer to DNA sequences from the Sar-gasso Sea environmental data set, whether they are singlereads or contigs assembled from multiple reads. Table 1also lists the number of homologous fragments thatretrieved HTCC1062 or HTCC1002 genes as their bestBLAST hits against the NCBInr database. These we called"homologous fragments that passed the best-hit test". Wethen identified fragments that were syntenic with thequery genome, and those that were not. The former wecalled "syntenic fragments". We used these classes of frag-ments to study the conservation of amino acid identity,gene content and gene order in the Sargasso Sea SAR11metagenome.
An expect score of 1 × 10⁻¹⁰ was employed in the initialhomolog detection step (Fig. 3A). This is a relatively per-missive cutoff that ensures the inclusion of homologs,including those from distant taxa, such as other alphapro-teobacteria. For convenience, we hereafter refer to this setof fragments as 'homologous fragments'. The log of thenumber of homologous fragments for each HTCC1062Coding Sequence (CDS) is shown as a function of geneposition in Fig. 3A. We found that homologous fragmentsfrom the Sargasso Sea cover 97% of the HTCC1062genome and account for 43% of the fragments in the com-plete dataset (349,742 of 811,372, Table 1). This numberis somewhat high when compared to predictions fromSSU rRNA data – SAR11 genes account for 27% of thetotal SSU rRNA genes found among the fragments. Thisobservation is not unexpected, considering that the set ofhomologous fragments contains homologs from non-SAR11 species as well as genes originating from SAR11. Ofthe 1,354 CDSs in the HTCC1062 genome, 32 are foundon at least 3,000 environmental fragments (the maximumnumber returned from our homolog search), and 31 arenot found at all. Fig. 3A reveals three regions of theHTCC1062 genome where coverage is low. These hyper-variable regions are labeled HVR1 through HVR4. Thelongest of these, HVR2, spans almost 50 CDSs.
SyntenyWe define "syntenic fragments" as homologous fragmentsthat passed the best-hit and synteny tests (Fig. 2B,C). Ofthe 349,742 fragments shown in Fig. 3A, 111,332 sharesynteny with HTCC1062. A large proportion of the"homologous fragments with synteny" (71,696) passedthe best-hit test and were therefore placed in the "syntenicfragments" bin (Table 1, Fig. 3D). Several lines of evi-dence indicate that the process used to "bin" sequencesoriginating from SAR11 was neither too stringent nor toorelaxed. The maximum in the distribution of expect scoresfor genes on syntenic fragments is 1 × 10-33 and declinessharply as it approaches 1 × 10⁻¹⁰, suggesting that the mostabundant clade of genes in the dataset, which is predictedto be SAR11, are included, but the tail of the distribution,is excluded (Additional file 1). Also, the average GC con-tent of the syntenic fragments, 29.1%, is nearly identicalto that of the HTCC1062 genome (29.7%) and the plot-
Table 1: Classes ("bins") of metagenomic data fragments used in this study.
Class Number Genome coverage Avg. AA Identity
CDSs in HTCC 1062 1354 -- --Total fragments of metagenomic data 811,372 -- --Homologous fragments (Fig. 1A) 349,742 97% --Homologous fragments that passed the best hit test (Fig. 1C) 187,844 97% 59.7%Homlogous fragments with synteny 111,332 97% 64.0%Syntenic fragments* (Fig. 1D) 71,696 91% 71.0%
* For all genes on the fragment, HTCC1062 genes are the best BLAST hits.
Schematic diagram of procedures used to "bin" the classes of metagenomic dataFigure 2Schematic diagram of procedures used to "bin" the classes of metagenomic data. The query genome, in this case HTCC1062, is represented on the x-axis. A) TBLASTN of protein sequences from the query genome against metage-nomic data. "Homologous fragments" were defined as frag-ments of metagenomic data with expect scores of 1 × 10⁻¹⁰
or better to genes from the query genome. B) "Homlogous fragments with synteny" contain homologs in the same gene order as the query genome, with as many as 5 gene gaps (gene deletions) allowed. C) Best-hit test. Fragments of metagenomic data pass the test if the nucleotide sequence of the fragment gene yields the corresponding query gene as the best hit in a BLASTX search of the NCBI nr database. D) The position of the fragment on the vertical axis corresponds to the average amino acid identity score of all the genes on the fragment.
�
Page 4 of 19(page number not for citation purposes)

Biology Direct 2007, 2:27 http://www.biology-direct.com/content/2/1/27
ted values approximate a normal distribution (Additionalfile 2). Tests that used other query genomes (E. coli,Prochlorococcus marinus and Croceibacter atlanticus) sup-ported the conclusion that the procedure used to identifysyntenic fragments is selective (Table 2, Additional files 3and 4).
To visualize variation among the syntenic fragments, thedata were plotted as a function of gene position in theHTCC1062 genome and amino acid identity (Fig. 3D).The vertical axis is inverted (low amino acid identityscores at the top) to emphasize the high-scoring syntenicfragment's relationship to the template genome. The syn-tenic fragments shown in Fig. 3D vary in average amino-acid identity score from 30% to 98%, with an average of71.0%. The ranges spanned on the vertical axis varybetween genes because the amino acid sequences of somegenes are more conserved than others. For example, genesfor ribosomal proteins appear relatively low in the plots(Fig. 3D, regions colored black). Though 86% of the syn-tenic fragments carry just two genes, the distribution ofsyntenic fragments across the HTCC1062 genome is verysimilar when syntenic fragments carrying three or moregenes are plotted (Additional file 5).
The Sargasso Sea metagenome data includes assembliesthat are known to contain some errors resulting fromunrelated fragments being joined incorrectly [20]. How-ever, an analysis of syntenic fragments that did notinclude assemblies (Additional file 6) yielded similarplots that supported the same conclusions.
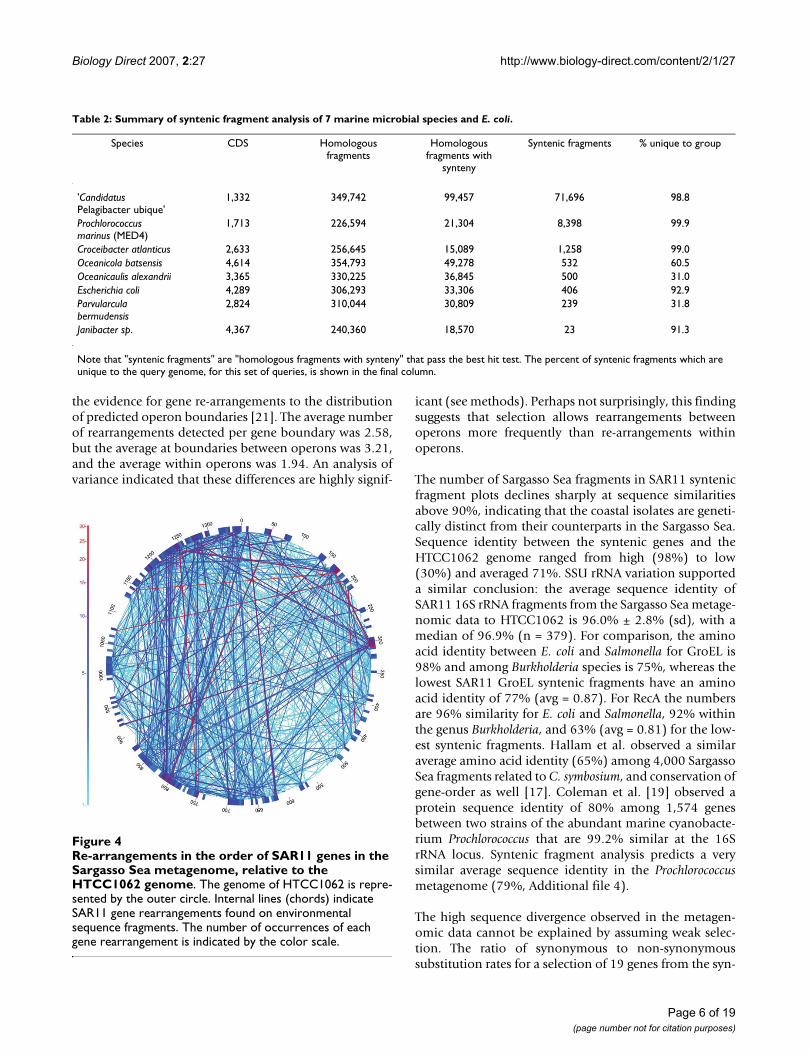
Syntenic fragments cover most of the HTCC1062 genome(Fig. 3D), indicating that gene order is relatively con-served between the Pacific coastal strains and the SargassoSea SAR11 population. An analysis of gene-to-geneboundaries revealed that gene order in 96% of the Sar-gasso Sea SAR11 homologous fragments matches the geneorder of the HTCC1062 genome (see synteny index, inMethods). While the aforementioned facts are striking,they nonetheless allow considerable latitude for genomerearrangements. To map genome rearrangements we plot-ted the gene positions found on non-syntenic fragments(Fig. 4). These are fragments containing two or more adja-cent SAR11 genes that differ from HTCC1062 in geneorder. Fragment inclusion in this set follows the samerules as those in Fig. 2, except no synteny requirement wasimposed. The high incidence of synteny (Fig. 3D) can bereconciled with the many gene rearrangements shown inFig. 4 by considering that a few very frequent rearrange-ments account for most of the cases of rearranged genes.3,350 fragments had at least two genes that passed thebest-hit test but displayed an alternate gene order. Of the627 different genes found in non-syntenic positions inFig. 4, seventeen can be tracked to genes that are notfound on any syntenic fragments (Table 3). These arelikely to represent examples of gene re-arrangements thatare conserved in the Sargasso Sea SAR11 population rela-tive to the Oregon coast population.
Genome rearrangements were not random, but were con-centrated at boundaries between operons. We compared
HTCC1062 genome coverage for the different classes of metagenomic dataFigure 3HTCC1062 genome coverage for the different classes of metagenomic data. The data for the figure are described numerically in Table 1. A). The number of homolo-gous fragments (TBLASTX expect scores ≤ 1 × 10⁻¹⁰) for each HTCC1062 gene, plotted by position in the HTCC1062 genome. B) GC content of HTCC1062 genome. C) The dis-tribution of homologous fragments that passed the best-hit test, regardless of synteny. The data in this plot includes frag-ments that cover one or more genes. The plotted amino acid identities are for the individual genes, not averaged as they are in the syntenic fragment plot below. D) Syntenic frag-ment coverage of the HTCC1062 genome as a function of gene position and amino acid identity. See Fig. 2 for an expla-nation of syntenic fragments. Fragments in this category ("bin"), include parts of at least two genes that could be iden-tified by TBLASTX. Regions of blue on the fragments indicate gaps. Syntenic fragments were allowed to be missing as many as five intervening genes (gaps) between the syntenic genes. Genes that encode ribosomal proteins are indicated in black.
�
Page 5 of 19(page number not for citation purposes)
Biology Direct 2007, 2:27 http://www.biology-direct.com/content/2/1/27
the evidence for gene re-arrangements to the distributionof predicted operon boundaries [21]. The average numberof rearrangements detected per gene boundary was 2.58,but the average at boundaries between operons was 3.21,and the average within operons was 1.94. An analysis ofvariance indicated that these differences are highly signif-
icant (see methods). Perhaps not surprisingly, this findingsuggests that selection allows rearrangements betweenoperons more frequently than re-arrangements withinoperons.
The number of Sargasso Sea fragments in SAR11 syntenicfragment plots declines sharply at sequence similaritiesabove 90%, indicating that the coastal isolates are geneti-cally distinct from their counterparts in the Sargasso Sea.Sequence identity between the syntenic genes and theHTCC1062 genome ranged from high (98%) to low(30%) and averaged 71%. SSU rRNA variation supporteda similar conclusion: the average sequence identity ofSAR11 16S rRNA fragments from the Sargasso Sea metage-nomic data to HTCC1062 is 96.0% ± 2.8% (sd), with amedian of 96.9% (n = 379). For comparison, the aminoacid identity between E. coli and Salmonella for GroEL is98% and among Burkholderia species is 75%, whereas thelowest SAR11 GroEL syntenic fragments have an aminoacid identity of 77% (avg = 0.87). For RecA the numbersare 96% similarity for E. coli and Salmonella, 92% withinthe genus Burkholderia, and 63% (avg = 0.81) for the low-est syntenic fragments. Hallam et al. observed a similaraverage amino acid identity (65%) among 4,000 SargassoSea fragments related to C. symbosium, and conservation ofgene-order as well [17]. Coleman et al. [19] observed aprotein sequence identity of 80% among 1,574 genesbetween two strains of the abundant marine cyanobacte-rium Prochlorococcus that are 99.2% similar at the 16SrRNA locus. Syntenic fragment analysis predicts a verysimilar average sequence identity in the Prochlorococcusmetagenome (79%, Additional file 4).
The high sequence divergence observed in the metagen-omic data cannot be explained by assuming weak selec-tion. The ratio of synonymous to non-synonymoussubstitution rates for a selection of 19 genes from the syn-
Re-arrangements in the order of SAR11 genes in the Sar-gasso Sea metagenome, relative to the HTCC1062 genomeFigure 4Re-arrangements in the order of SAR11 genes in the Sargasso Sea metagenome, relative to the HTCC1062 genome. The genome of HTCC1062 is repre-sented by the outer circle. Internal lines (chords) indicate SAR11 gene rearrangements found on environmental sequence fragments. The number of occurrences of each gene rearrangement is indicated by the color scale.
�
Table 2: Summary of syntenic fragment analysis of 7 marine microbial species and E. coli.
Species CDS Homologous fragments
Homologous fragments with
synteny
Syntenic fragments % unique to group
'Candidatus Pelagibacter ubique'
1,332 349,742 99,457 71,696 98.8
Prochlorococcus marinus (MED4)
1,713 226,594 21,304 8,398 99.9
Croceibacter atlanticus 2,633 256,645 15,089 1,258 99.0Oceanicola batsensis 4,614 354,793 49,278 532 60.5Oceanicaulis alexandrii 3,365 330,225 36,845 500 31.0Escherichia coli 4,289 306,293 33,306 406 92.9Parvularcula bermudensis
2,824 310,044 30,809 239 31.8
Janibacter sp. 4,367 240,360 18,570 23 91.3
Note that "syntenic fragments" are "homologous fragments with synteny" that pass the best hit test. The percent of syntenic fragments which are unique to the query genome, for this set of queries, is shown in the final column.
Page 6 of 19(page number not for citation purposes)
Biology Direct 2007, 2:27 http://www.biology-direct.com/content/2/1/27
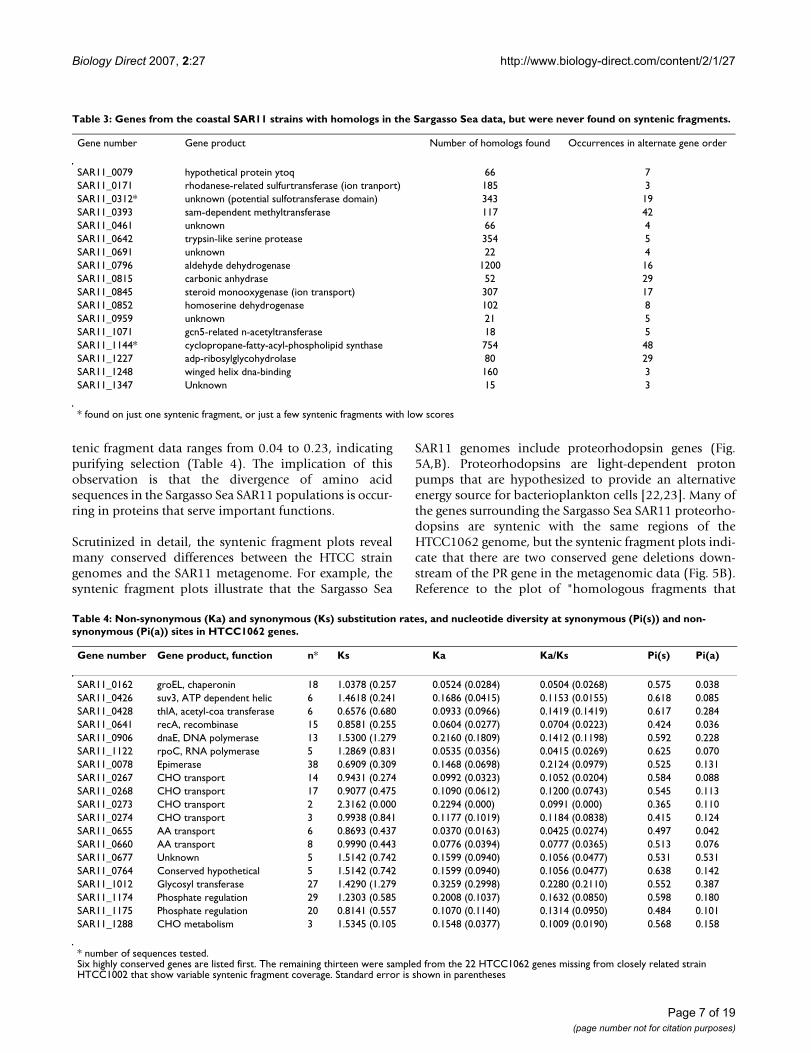
tenic fragment data ranges from 0.04 to 0.23, indicatingpurifying selection (Table 4). The implication of thisobservation is that the divergence of amino acidsequences in the Sargasso Sea SAR11 populations is occur-ring in proteins that serve important functions.
Scrutinized in detail, the syntenic fragment plots revealmany conserved differences between the HTCC straingenomes and the SAR11 metagenome. For example, thesyntenic fragment plots illustrate that the Sargasso Sea
SAR11 genomes include proteorhodopsin genes (Fig.5A,B). Proteorhodopsins are light-dependent protonpumps that are hypothesized to provide an alternativeenergy source for bacterioplankton cells [22,23]. Many ofthe genes surrounding the Sargasso Sea SAR11 proteorho-dopsins are syntenic with the same regions of theHTCC1062 genome, but the syntenic fragment plots indi-cate that there are two conserved gene deletions down-stream of the PR gene in the metagenomic data (Fig. 5B).Reference to the plot of "homologous fragments that
Table 4: Non-synonymous (Ka) and synonymous (Ks) substitution rates, and nucleotide diversity at synonymous (Pi(s)) and non-synonymous (Pi(a)) sites in HTCC1062 genes.
Gene number Gene product, function n* Ks Ka Ka/Ks Pi(s) Pi(a)
SAR11_0162 groEL, chaperonin 18 1.0378 (0.257 0.0524 (0.0284) 0.0504 (0.0268) 0.575 0.038SAR11_0426 suv3, ATP dependent helic 6 1.4618 (0.241 0.1686 (0.0415) 0.1153 (0.0155) 0.618 0.085SAR11_0428 thlA, acetyl-coa transferase 6 0.6576 (0.680 0.0933 (0.0966) 0.1419 (0.1419) 0.617 0.284SAR11_0641 recA, recombinase 15 0.8581 (0.255 0.0604 (0.0277) 0.0704 (0.0223) 0.424 0.036SAR11_0906 dnaE, DNA polymerase 13 1.5300 (1.279 0.2160 (0.1809) 0.1412 (0.1198) 0.592 0.228SAR11_1122 rpoC, RNA polymerase 5 1.2869 (0.831 0.0535 (0.0356) 0.0415 (0.0269) 0.625 0.070SAR11_0078 Epimerase 38 0.6909 (0.309 0.1468 (0.0698) 0.2124 (0.0979) 0.525 0.131SAR11_0267 CHO transport 14 0.9431 (0.274 0.0992 (0.0323) 0.1052 (0.0204) 0.584 0.088SAR11_0268 CHO transport 17 0.9077 (0.475 0.1090 (0.0612) 0.1200 (0.0743) 0.545 0.113SAR11_0273 CHO transport 2 2.3162 (0.000 0.2294 (0.000) 0.0991 (0.000) 0.365 0.110SAR11_0274 CHO transport 3 0.9938 (0.841 0.1177 (0.1019) 0.1184 (0.0838) 0.415 0.124SAR11_0655 AA transport 6 0.8693 (0.437 0.0370 (0.0163) 0.0425 (0.0274) 0.497 0.042SAR11_0660 AA transport 8 0.9990 (0.443 0.0776 (0.0394) 0.0777 (0.0365) 0.513 0.076SAR11_0677 Unknown 5 1.5142 (0.742 0.1599 (0.0940) 0.1056 (0.0477) 0.531 0.531SAR11_0764 Conserved hypothetical 5 1.5142 (0.742 0.1599 (0.0940) 0.1056 (0.0477) 0.638 0.142SAR11_1012 Glycosyl transferase 27 1.4290 (1.279 0.3259 (0.2998) 0.2280 (0.2110) 0.552 0.387SAR11_1174 Phosphate regulation 29 1.2303 (0.585 0.2008 (0.1037) 0.1632 (0.0850) 0.598 0.180SAR11_1175 Phosphate regulation 20 0.8141 (0.557 0.1070 (0.1140) 0.1314 (0.0950) 0.484 0.101SAR11_1288 CHO metabolism 3 1.5345 (0.105 0.1548 (0.0377) 0.1009 (0.0190) 0.568 0.158
* number of sequences tested.Six highly conserved genes are listed first. The remaining thirteen were sampled from the 22 HTCC1062 genes missing from closely related strain HTCC1002 that show variable syntenic fragment coverage. Standard error is shown in parentheses
Table 3: Genes from the coastal SAR11 strains with homologs in the Sargasso Sea data, but were never found on syntenic fragments.
Gene number Gene product Number of homologs found Occurrences in alternate gene order
SAR11_0079 hypothetical protein ytoq 66 7SAR11_0171 rhodanese-related sulfurtransferase (ion tranport) 185 3SAR11_0312* unknown (potential sulfotransferase domain) 343 19SAR11_0393 sam-dependent methyltransferase 117 42SAR11_0461 unknown 66 4SAR11_0642 trypsin-like serine protease 354 5SAR11_0691 unknown 22 4SAR11_0796 aldehyde dehydrogenase 1200 16SAR11_0815 carbonic anhydrase 52 29SAR11_0845 steroid monooxygenase (ion transport) 307 17SAR11_0852 homoserine dehydrogenase 102 8SAR11_0959 unknown 21 5SAR11_1071 gcn5-related n-acetyltransferase 18 5SAR11_1144* cyclopropane-fatty-acyl-phospholipid synthase 754 48SAR11_1227 adp-ribosylglycohydrolase 80 29SAR11_1248 winged helix dna-binding 160 3SAR11_1347 Unknown 15 3
* found on just one syntenic fragment, or just a few syntenic fragments with low scores
Page 7 of 19(page number not for citation purposes)

Biology Direct 2007, 2:27 http://www.biology-direct.com/content/2/1/27
passed the best-hit test", above (Fig. 5A), shows that theMOSC binding protein (CDS 629) is found consistentlyelsewhere in the SAR11 metagenome, but no closehomologs to the other "gene indel", CDS 631, weredetected.
Nowhere in this analysis did we see clear evidence of theSargasso Sea SAR11 ecotypes reported previously fromthis dataset [12], and suggested by Fig. 1. This is not to saythat there are no patterns in the plots, particularly the syn-tenic fragment plots, related to ecotypic variation. Ourinterpretation is that the dominant two SAR11 ecotypesrepresented by the metagenomic data are too similar incore genome regions to be discriminated by theapproaches we employed, and are best detected by phylo-genetic analyses such as that shown in Fig. 1.
Hypervariable regionsAlthough the distributions of homologous fragments andsyntenic fragments suggest a relatively conserved SAR11"core" genome, they also revealed four distinct hypervari-able regions, HVR1 – 4 (Fig. 3A,C, Fig. 6, Additional files7 and 8). Both gene order (synteny) and sequence similar-ity drop dramatically in the SAR11 hypervariable regions,causing them to stand out prominently as gaps in theplots of homologs and syntenic fragments (Fig. 3A,C, Fig.6, Additional files 7 and 8). Rusch saw evidence of the
same HVRs in "recruitment plots" [13]. "Islands" ofgenome variability similar to the HVRs we report havebeen found in many microbial genomes [19,24]. Theyhave been shown to include genes potentially involved inpathogenicity [25] and lipopolysaccharide (LPS) biosyn-thesis [26]. Most evidence for large microbial pan-genomes comes from variable genomic islands.
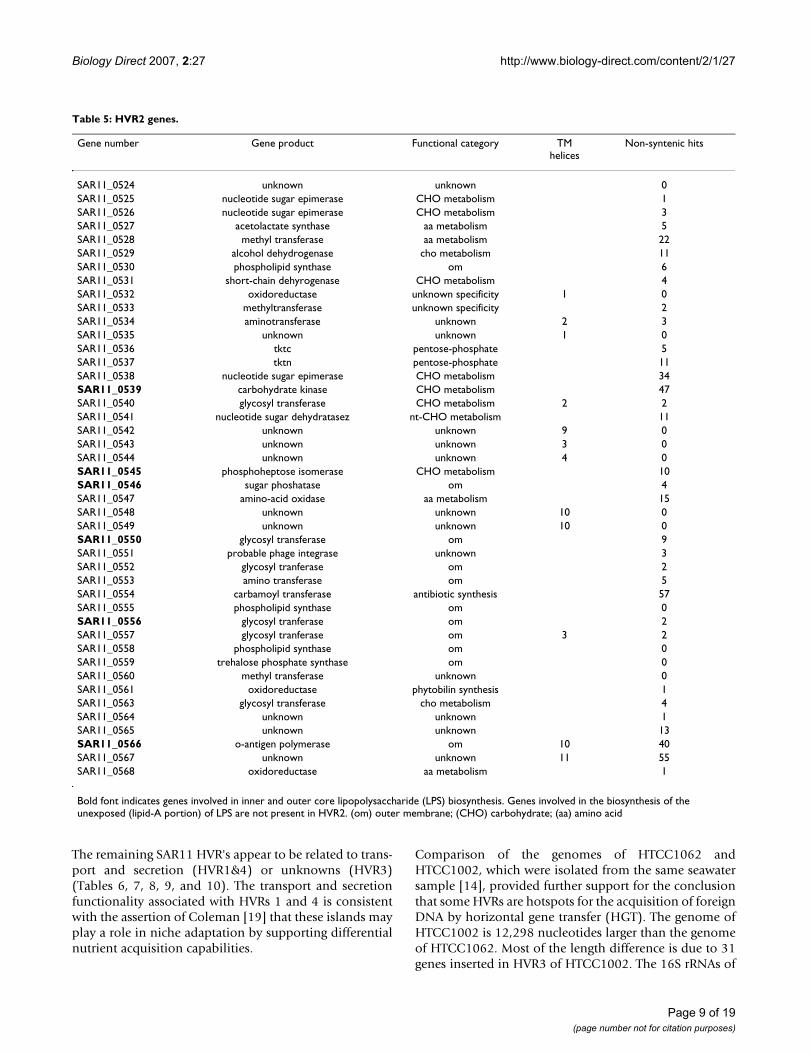
The largest of the SAR11 hypervariable regions, HVR2, is a48 kb region flanked by the sole 5S and 23S rRNA genesin the HTCC1062 genome. HVR2 mainly contains pro-posed lipopolysaccharide (LPS) biosynthesis genes (Table5), and appears to be analogous to previously observedregions encoding cell surface properties. Based on currentannotations, all but one of the enzymes involved in thebiosynthetic pathways for the inner and outer core oflipopolysaccharide (LPS) are present in HVR2, while theenzymes involved in synthesis of the unexposed regionsof the LPS are found elsewhere in the genome (Table 5).
The existence of a hypervariable region similar to HVR2 inthe Sargasso Sea SAR11 population was inferred from themetagenomic data. Only two fragments containing SAR1116S rRNA genes are found among the 349,742 homolo-gous fragments, but SAR11 5S rRNA genes were found on36 fragments. Nineteen of these fragments carriedhomologs to HTCC1062 CDS 570 upstream of the 5SrRNA gene, as found in the HTCC1062 genome, suggest-ing that the Sargasso Sea SAR11 cells, like the Pelagibacterisolates, have split ribosomal RNA operons.
Enlargement of HVR2Figure 6Enlargement of HVR2. HTCC1062 syntenic fragment plot showing detail in the region of HVR2.
�
Detail of Figs 3C and 3D, in the vicinity of the proteorho-dopsin geneFigure 5Detail of Figs 3C and 3D, in the vicinity of the prote-orhodopsin gene. A) homologous fragments that passed the best-hit, and B) syntenic fragments. Regions of blue on the fragments indicate gaps. Only syntenic fragments contain-ing 3 or more genes are shown. (SMRP) small multi-drug resistance protein, (ACAS) acyl-coenzyme A synthetase, (FD) ferrodoxin, (TD) thioredoxin disulfide reductase, (GST) glutathione S-transferase, (DKS) DnaK suppressor protein.
�
Page 8 of 19(page number not for citation purposes)
Biology Direct 2007, 2:27 http://www.biology-direct.com/content/2/1/27
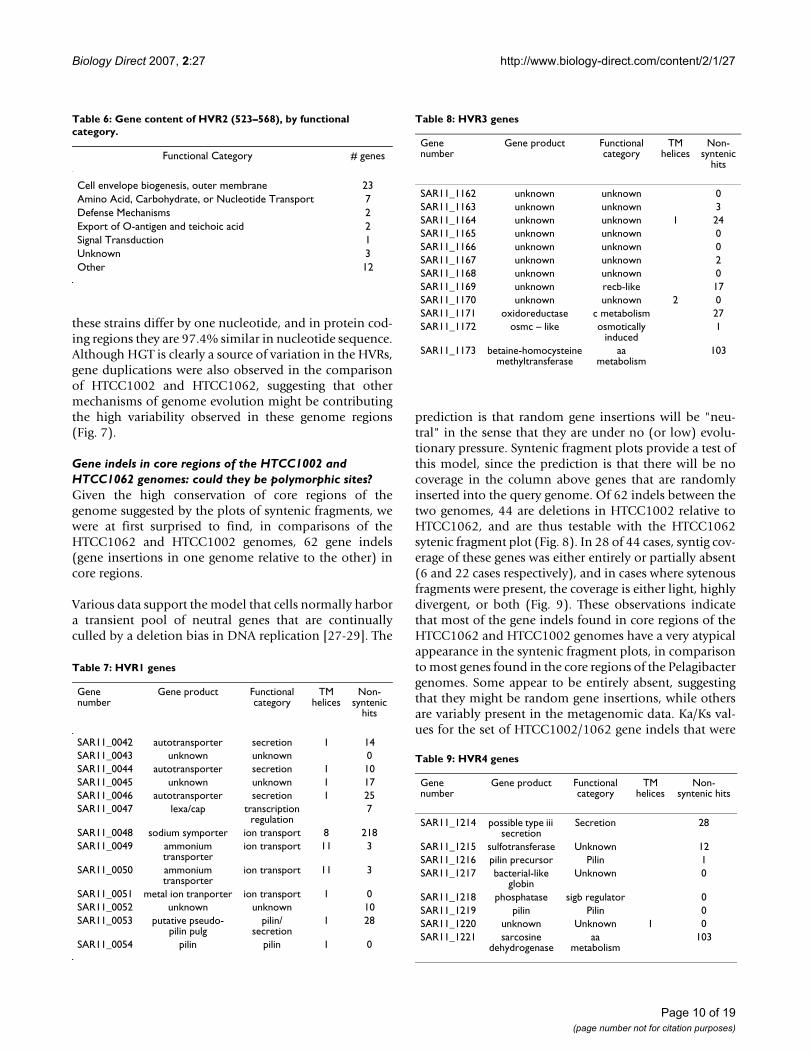
The remaining SAR11 HVR's appear to be related to trans-port and secretion (HVR1&4) or unknowns (HVR3)(Tables 6, 7, 8, 9, and 10). The transport and secretionfunctionality associated with HVRs 1 and 4 is consistentwith the assertion of Coleman [19] that these islands mayplay a role in niche adaptation by supporting differentialnutrient acquisition capabilities.
Comparison of the genomes of HTCC1062 andHTCC1002, which were isolated from the same seawatersample [14], provided further support for the conclusionthat some HVRs are hotspots for the acquisition of foreignDNA by horizontal gene transfer (HGT). The genome ofHTCC1002 is 12,298 nucleotides larger than the genomeof HTCC1062. Most of the length difference is due to 31genes inserted in HVR3 of HTCC1002. The 16S rRNAs of
Table 5: HVR2 genes.
Gene number Gene product Functional category TM helices
Non-syntenic hits
SAR11_0524 unknown unknown 0SAR11_0525 nucleotide sugar epimerase CHO metabolism 1SAR11_0526 nucleotide sugar epimerase CHO metabolism 3SAR11_0527 acetolactate synthase aa metabolism 5SAR11_0528 methyl transferase aa metabolism 22SAR11_0529 alcohol dehydrogenase cho metabolism 11SAR11_0530 phospholipid synthase om 6SAR11_0531 short-chain dehyrogenase CHO metabolism 4SAR11_0532 oxidoreductase unknown specificity 1 0SAR11_0533 methyltransferase unknown specificity 2SAR11_0534 aminotransferase unknown 2 3SAR11_0535 unknown unknown 1 0SAR11_0536 tktc pentose-phosphate 5SAR11_0537 tktn pentose-phosphate 11SAR11_0538 nucleotide sugar epimerase CHO metabolism 34SAR11_0539 carbohydrate kinase CHO metabolism 47SAR11_0540 glycosyl transferase CHO metabolism 2 2SAR11_0541 nucleotide sugar dehydratasez nt-CHO metabolism 11SAR11_0542 unknown unknown 9 0SAR11_0543 unknown unknown 3 0SAR11_0544 unknown unknown 4 0SAR11_0545 phosphoheptose isomerase CHO metabolism 10SAR11_0546 sugar phoshatase om 4SAR11_0547 amino-acid oxidase aa metabolism 15SAR11_0548 unknown unknown 10 0SAR11_0549 unknown unknown 10 0SAR11_0550 glycosyl transferase om 9SAR11_0551 probable phage integrase unknown 3SAR11_0552 glycosyl tranferase om 2SAR11_0553 amino transferase om 5SAR11_0554 carbamoyl transferase antibiotic synthesis 57SAR11_0555 phospholipid synthase om 0SAR11_0556 glycosyl tranferase om 2SAR11_0557 glycosyl tranferase om 3 2SAR11_0558 phospholipid synthase om 0SAR11_0559 trehalose phosphate synthase om 0SAR11_0560 methyl transferase unknown 0SAR11_0561 oxidoreductase phytobilin synthesis 1SAR11_0563 glycosyl transferase cho metabolism 4SAR11_0564 unknown unknown 1SAR11_0565 unknown unknown 13SAR11_0566 o-antigen polymerase om 10 40SAR11_0567 unknown unknown 11 55SAR11_0568 oxidoreductase aa metabolism 1
Bold font indicates genes involved in inner and outer core lipopolysaccharide (LPS) biosynthesis. Genes involved in the biosynthesis of the unexposed (lipid-A portion) of LPS are not present in HVR2. (om) outer membrane; (CHO) carbohydrate; (aa) amino acid
Page 9 of 19(page number not for citation purposes)
Biology Direct 2007, 2:27 http://www.biology-direct.com/content/2/1/27
these strains differ by one nucleotide, and in protein cod-ing regions they are 97.4% similar in nucleotide sequence.Although HGT is clearly a source of variation in the HVRs,gene duplications were also observed in the comparisonof HTCC1002 and HTCC1062, suggesting that othermechanisms of genome evolution might be contributingthe high variability observed in these genome regions(Fig. 7).
Gene indels in core regions of the HTCC1002 and HTCC1062 genomes: could they be polymorphic sites?Given the high conservation of core regions of thegenome suggested by the plots of syntenic fragments, wewere at first surprised to find, in comparisons of theHTCC1062 and HTCC1002 genomes, 62 gene indels(gene insertions in one genome relative to the other) incore regions.
Various data support the model that cells normally harbora transient pool of neutral genes that are continuallyculled by a deletion bias in DNA replication [27-29]. The
prediction is that random gene insertions will be "neu-tral" in the sense that they are under no (or low) evolu-tionary pressure. Syntenic fragment plots provide a test ofthis model, since the prediction is that there will be nocoverage in the column above genes that are randomlyinserted into the query genome. Of 62 indels between thetwo genomes, 44 are deletions in HTCC1002 relative toHTCC1062, and are thus testable with the HTCC1062sytenic fragment plot (Fig. 8). In 28 of 44 cases, syntig cov-erage of these genes was either entirely or partially absent(6 and 22 cases respectively), and in cases where sytenousfragments were present, the coverage is either light, highlydivergent, or both (Fig. 9). These observations indicatethat most of the gene indels found in core regions of theHTCC1062 and HTCC1002 genomes have a very atypicalappearance in the syntenic fragment plots, in comparisonto most genes found in the core regions of the Pelagibactergenomes. Some appear to be entirely absent, suggestingthat they might be random gene insertions, while othersare variably present in the metagenomic data. Ka/Ks val-ues for the set of HTCC1002/1062 gene indels that were
Table 9: HVR4 genes
Gene number
Gene product Functional category
TM helices
Non-syntenic hits
SAR11_1214 possible type iii secretion
Secretion 28
SAR11_1215 sulfotransferase Unknown 12SAR11_1216 pilin precursor Pilin 1SAR11_1217 bacterial-like
globinUnknown 0
SAR11_1218 phosphatase sigb regulator 0SAR11_1219 pilin Pilin 0SAR11_1220 unknown Unknown 1 0SAR11_1221 sarcosine
dehydrogenaseaa
metabolism103
Table 7: HVR1 genes
Gene number
Gene product Functional category
TM helices
Non-syntenic
hits
SAR11_0042 autotransporter secretion 1 14SAR11_0043 unknown unknown 0SAR11_0044 autotransporter secretion 1 10SAR11_0045 unknown unknown 1 17SAR11_0046 autotransporter secretion 1 25SAR11_0047 lexa/cap transcription
regulation7
SAR11_0048 sodium symporter ion transport 8 218SAR11_0049 ammonium
transporterion transport 11 3
SAR11_0050 ammonium transporter
ion transport 11 3
SAR11_0051 metal ion tranporter ion transport 1 0SAR11_0052 unknown unknown 10SAR11_0053 putative pseudo-
pilin pulgpilin/
secretion1 28
SAR11_0054 pilin pilin 1 0
Table 6: Gene content of HVR2 (523–568), by functional category.
Functional Category # genes
Cell envelope biogenesis, outer membrane 23Amino Acid, Carbohydrate, or Nucleotide Transport 7Defense Mechanisms 2Export of O-antigen and teichoic acid 2Signal Transduction 1Unknown 3Other 12
Table 8: HVR3 genes
Gene number
Gene product Functional category
TM helices
Non-syntenic
hits
SAR11_1162 unknown unknown 0SAR11_1163 unknown unknown 3SAR11_1164 unknown unknown 1 24SAR11_1165 unknown unknown 0SAR11_1166 unknown unknown 0SAR11_1167 unknown unknown 2SAR11_1168 unknown unknown 0SAR11_1169 unknown recb-like 17SAR11_1170 unknown unknown 2 0SAR11_1171 oxidoreductase c metabolism 27SAR11_1172 osmc – like osmotically
induced1
SAR11_1173 betaine-homocysteine methyltransferase
aa metabolism
103
Page 10 of 19(page number not for citation purposes)

Biology Direct 2007, 2:27 http://www.biology-direct.com/content/2/1/27
variably present indicate that these genes are subject topurifying selection (Table 4).
Previous studies of E. coli in culture reported a balancedpolymorphism that arose spontaneously and was main-tained by selection [30]. The resulting haplotypesdiverged phylogenetically and met Cohan's definition forecotypes [31]. Thus, there is precedent that anticipatesbalanced polymorphisms in natural microbial popula-tions. We speculate that the gene indels we observed couldbe balanced polymorphisms, and that this phenomenonmight explain part of the natural variation in gene contentfound in microbial populations.
Gene complementWe were surprised to find no indication of conserved dif-ferences in gene complement that would suggest signifi-cant physiological differences between the coastal strainsand Sargasso Sea SAR11 populations. This is not to saythat there is not physiological variation within andbetween the Sargasso Sea and coastal Oregon SAR11 pop-ulations. Rather, we observed no genes thought to controlsignificant phenotypic attributes in HTCC1002 andHTCC1062 that were not also well-represented among thesyntenic fragments, and no conserved occurrences of func-tionally important genes in the SAR11 metagenomic datathat did not have orthologs in the HTCC1062 genome.We should have seen such genes if they were highly con-served, because our analysis included an average of 118fragments that covered each end of each gene and pro-vided evidence for the identity of the adjacent gene. Only19 genes from the HTCC1062 genome are not representedin the SAR11 metagenome (syntenic fragments or homol-ogous fragments that passed the best BLAST hit test). Ofthese, nine are from the hypervariable regions (Table 11),and six returned no hits to NCBI databases with expectscores less than 1 × 10⁻¹⁰. Two members of this group(CDSs 542 and 555) are suspected to be involved in outer
Summary of analysis of HTCC1002/HTCC1062 "gene indels" in core regionsFigure 8Summary of analysis of HTCC1002/HTCC1062 "gene indels" in core regions. The flow diagram shows how 62 HTCC1002/HTCC1062 gene indels and the data from the syntenic fragment plot were combined to choose 13 genes for the tests of selection data shown in Table 4.
Table 10: HVR gene content summary
HVR Dominant Category Genes TM Spanning
1 Transport/Secretion 13 102 Outer Membrane/CHO Metabolism 44 123 Unknowns 12 24 Transport/Secretion 8 1
Deletion of duplicate genes in the HVR1 region of strains HTCC1002 and HTCC1062Figure 7Deletion of duplicate genes in the HVR1 region of strains HTCC1002 and HTCC1062. Strain HTCC1002 appears at the top of the display and HTCC1062 at the bot-tom. One of four homologous Type V autotransporters is deleted in HTCC1062 relative to HTCC1002, and one of two homologous ammonium transporters is deleted in HTCC1002 relative to HTCC1062.
�
Page 11 of 19(page number not for citation purposes)

Biology Direct 2007, 2:27 http://www.biology-direct.com/content/2/1/27
membrane biosynthesis and CDS 1217 is a bacterial-likeglobin (Table 11). With only one exception, we foundcloser homologs to these genes in the Sargasso Sea datasetthan in NCBI databases.
ConclusionThe reconstruction of microbial genomes from metagen-omic data is a challenge for microbial ecologists, particu-larly when the genomes originate from large planktonpopulations that exhibit inherently high natural variabil-ity. Venter attributed the failure to assemble SAR11genomes for the Sargasso Sea metagenomic data, despiteapparently high coverage, to high species diversity. But, analternative explanation is that some genomes are inher-ently diverse in neutral characteristics because of largeeffective population sizes. In such cases, it seems likelythat a linear genome, the objective of assembly, is anoverly simplistic model for representing natural genomevariation. Therefore, we sought a strategy that wouldreveal conserved and variable elements of genome struc-
ture. This strategy was predicated on the use of a relatedquery genome, and designed to be useful for predictinggenome properties for studies of ecology and evolution.
The amino acid sequence divergence between the querygenome we used and the Sargasso Sea SAR11 populationsexceeds the divergence between some microbial genera,suggesting that genomic properties have had ample timeto diverge in response to selection. We were surprised tofind that there was heavy coverage of most of the genomeby syntenic fragments, suggesting a relatively conservedgene order in core regions of the genome. Previous reportshave shown that the conservation of gene order betweenprokaryotic genomes dissipates faster than proteinsequence identity or gene complement [32,33]. Synteny isregarded as a rapidly evolving property of genomes, sec-ond only to DNA with regulatory functions [34]. Huynenand coworkers compared orthologs from an evolutionar-ily diverse set of 9 genomes to show that gene orderbecomes nearly random before protein identity decaysbelow 50% [34].
The seemingly incongruous observation of the preserva-tion of synteny in the presence of 30% divergence in aver-age amino acid sequence can be explained by noting that
Table 11: Evidence for genes specific to the coastal variants of SAR11.
Gene number Gene annotation SSD NCBI HVR
SAR11_0043 unknown protein* 4 None 1SAR11_0163 unknown protein* 1 × e-10 1.6SAR11_0414 unknown protein* 1 × e-4 NoneSAR11_0471 unknown protein* 3 × e-9 2.1SAR11_0542 unknown protein* 3 × e-10 5 × e-11 2SAR11_0544 unknown protein,
possible viral origin3 × e-6 3 × e-4 2
SAR11_0548 unknown protein 8 × e-9 6 × e-5 2SAR11_0555 unknown protein 3 × e-8 6 × e-4 2SAR11_0631 unknown protein* 1.1 NoneSAR11_0788 unknown protein* 9 × e-5 NoneSAR11_0875 unknown protein 1 × e-10 NoneSAR11_0930 unknown protein* 0.47 1.2SAR11_0989 unknown protein 0.61 NoneSAR11_1165 unknown protein,
possible exonuclease4 × e-7 1.3 3
SAR11_1170 unknown protein 1.8 2.8 3SAR11_1182 unknown protein 3 × e-10 2.2SAR11_1217 bacterial globin-like 4 × e-10 2 × e-8 4SAR11_1220 unknown protein 2 × e-4 6.2 4SAR11_1249 unknown protein 2 × e-6 3.7
This list includes all genes for which no homologs were found in the Sargasso Sea Dataset (SSD) with a TBLASTN expect score of less than or equal to 1 × e-10. There were no examples of genes with known, significant physiological functions in this category. The best TBLASTN expect score against the Sargasso Sea Dataset (SSD) and the NCBI non-redundant nucleotide database (NCBInr), and the hypervariable region (HVR) in which the gene was found, are listed. Astericks indicate short CDS that may be gene calling error.Syntig coverage of HTCC1002/HTCC1062 deletionsFigure 9
Syntig coverage of HTCC1002/HTCC1062 deletions. Shaded areas highlight the syntig coverage above the genes in HTCC1062 that are deleted in closely related strain HTCC1002. Panels A-G show all 44 genes of this type with HTCC1062 gene numbers on the x-axis.
Page 12 of 19(page number not for citation purposes)

Biology Direct 2007, 2:27 http://www.biology-direct.com/content/2/1/27
Huynen and coworkers studied species that are highlydivergent in functional properties, whereas the SAR11population appears relatively uniform, despite the accu-mulation of considerable neutral sequence variation. Thisexplanation implies that selection is acting to preservegene order in SAR11 populations. We speculate that thismay be another example of streamlining selection, in thiscase acting to preserve gene order [9].
Rusch et al. [13] reported that synteny was conserved in allabundant marine prokaryotes, but their method ofobserving synteny was qualitative and therefore they didnot offer a quantitative estimate that could be used forcomparative purposes. We provide a quantitative estimateof synteny and also show that genome rearrangements arenot random, but are concentrated at particular sites,which are often operon boundaries. This observation hasimplications for the "extreme assembly" employed byRusch, which has an unproven ability to detect and reportthe frequency of genome rearrangements.
The high coverage provided by this dataset enabled us toexamine core regions of the genome for conserved generearrangements, including insertions. Although manyconserved gene rearrangements were observed, noneinvolved genes acquired by HGT. The approaches wedescribe are robust for some conclusions; for example, theidentification of genomic regions that are missing orhighly diverged from the query sequence, and regions,such as the proteorhodopsin gene locus, where genes andgene order vary in conserved patterns. There are also cave-ats. For example, it is likely that only the termini of largecassettes of inserted genes in the target genomes can beobserved, and then, only where they abut regions of con-served gene order. Thus, the absence of any observationssuggesting conserved insertions of novel genes in theSAR11 metagenomic data suggests that the Sargasso SeaSAR11 variants are very similar to their coastal counter-parts, in core regions of the genome, but does not rule outthe involvement of HVRs in evolution by gene acquisi-tion.
The concept of the "core" and "pan" genomes is gatheringsupport as genome sequencing reveals more examples ofconserved core genome regions and hypervariableregions, or islands of genome variability, as they are some-times known [3,19]. While the mechanisms that generatevariability in these regions remain poorly understood, it isincreasingly apparent that they often encode niche-spe-cific proteins that are important to competitive success.Our observations are consistent with the interpretationthat natural selection has concentrated genes that encodecell surface properties into HVR2, and that this region issubject to unusually rapid rates of sequence divergenceand re-arrangements of gene order. It has been postulated
that similar variability in the C. jejuni LPS cassette is anadaptive response to selection pressure to evade hostacquired immune responses [35]. Viral predation onmicrobial cells is intense in the ocean water column andis likely to provide a keen source of selective pressure thatfavors microbial populations with diverse, rapidly evolv-ing surface properties. An analogous variable genomeregion containing genes for cell surface components (LPScassettes) has been observed in Prochlorococcus sp. [26,36],and is evident in our syntenic fragment plot for this organ-ism (arrow in Additional file 4B). We propose that thestructural RNA genes flanking the LPS cassettes providezones of conserved DNA sequence that promote horizon-tal exchange of the cassettes by homologous recombina-tion. Multi-locus sequence typing has shown that rates ofintraspecific recombination are high within the coastalSAR11 population [37]. Alternatively, this variablegenome region could be explained by horizontal genetransfer from another species, a hypothesis that is consist-ent with the observation that the AT content of HVR2 isanomalously high (79%).
To explain the apparent conservation of core genomeregions, and reconcile it with the apparent variability ofSAR11 genomes in nature, we hypothesize that the largepopulation sizes of SAR11, and the age of these clades thatis inferred from phylogenies, have allowed them to accu-mulate very extensive variation in genome properties thatare selectively neutral [2]. However, it is clear that ourstudy offers only a glimpse of the evolution of the SAR11clade. In particular, the study of genome organization, asinferred from plots of syntenic fragments and other meth-ods, revealed less about the evolution of SAR11 ecotypesthan did phylogenetic analyses. In part, we attribute thisto a relatively high level of conserved organization inSAR11 genomes, and the role of hypervariable regions,which by definition are not amenable to studies based onthe identification of conserved genome features.
An intriguing finding is the correspondence between"gene indels" in core regions of the two Pelagibactergenomes, and patterns in the synteny plots from anotherocean. This finding needs further investigation. In part, itis consistent with the established idea that genes are ran-domly inserted into genomes at a low frequency, and lostif not preserved by positive selection [27-29]. But, ourfindings suggest that some gene indels might haveanother explanation. They could be polymorphisms thatare maintained in populations by processes similar tothose that maintain allelic polymorphisms [30]. The mostappealing approach to resolving this interesting questionwould be the sequencing of many genomes from closelyrelated isolates.
Page 13 of 19(page number not for citation purposes)
Biology Direct 2007, 2:27 http://www.biology-direct.com/content/2/1/27
Our findings indicate that SAR11 genomes from differentoceanic provinces share many conserved features despitedynamic processes of genome change that are at work innature. The Sargasso Sea SAR11 populations are con-served in local gene order, and gene complement, withrespect to populations that live in richer, colder coastalwater, but diverge dramatically in amino acid sequencesimilarity. A broad implication is that large microbialpopulations such as bacterioplankton accumulate highdiversity in some genome properties, while remainingconstrained in others [2]. Protein evolution provides ananalogy. Protein families can encompass wide variation inamino acid sequences while retaining the key elements ofthree-dimensional structure that confer function [38].Similarly, in old clades that comprise large populations,microbial genomes may wander over sequence space, giv-ing an illusion of variability, while remaining highly con-strained in features that govern cellular structure andfunction. An important challenge going forward will be inestablishing quantitative measures that reveal these prop-erties of genome conservation from metagenomic data.
Materials and methodsPhylogenetic analysisAmino acid sequences were aligned with ClustalW [39](gap open penalty: 100; gap extension penalty: 0.2). Max-imum likelihood trees were constructed with RAxMLusing the PROTMIXBLOSUM62 amino acid model. Boot-strap values are based on 100 iterations [40].
Homolog searchFragments carrying genes with high similarity toHTCC1062 genes are identified at the protein level withTBLASTN [41], using the amino acid sequence as input, a1 × 10-10 expect score cutoff, and complexity filtering off.The results are limited to the first 3,000 hits. Commandline: blastall -i sar11_proteins.fa -d venter_nt -p tblastn -e'1e-10' -F F -v 3000 -b 3000, where sar11_proteins.fa is afasta file of HTCC1062 proteins, venter_nt is the SargassoSea fragment data in BLAST format. Default values wereused for all unnamed parameters, blastall version was2.2.12. For convenience, the set of fragments identified inthis fashion are hereafter referred to as "homologous frag-ments".
Syntenic fragment detectionA subset of the homologous fragments that shared syn-teny with the HTCC1062 genome was identified by find-ing fragments that were common to the lists fromadjacent HTCC1062 genes, and verifying that the genesare arranged in tandem on the fragment. Each gene onthese syntenic fragments was subjected to the reciprocalbest-hit test (Fig. 2). The fragment nucleotide sequence ofthe high-scoring sequence pair (HSP) from the TBLASTNsearch for homologs was searched against the NCBI non-
redundant proteins database using BLASTX. The accessionnumber of the best hit was compared to the accessionnumber of the predicted HTCC1062 gene to confirm theidentity of the reciprocal best hit. The term "syntenic frag-ment" thus designates fragments containing at least twobest-hitting HTCC1062 genes in the proper order, butdoes not itself indicate anything about the rest of the frag-ment, for instance the presence of genes withouthomologs in HTCC1062.
Syntenic fragment plots with different query genomesTo assess the selectivity of syntenic fragments we studieda set of organisms of varying relevance to ocean surfaceecology. Of these, Procholorococcus marinus MED4 pro-vides an example from a clade that is relatively abundantin the Sargasso Sea but forms a shallow cluster by 16SrRNA gene sequence analysis [42]. Escherichia coli waschosen as an organism that is unlikely to appear often inthe Sargasso Sea. Five additional cultured marine strainswere also used as query genomes. They are listed in Table2. We found that the syntenic fragment plots are charac-teristic for each group, and the numbers of syntenic frag-ments in the plots correlates with the abundance of eachorganism's 16S rRNA genes in the metagenomic data(Additional file 4). For each selected organism, the rela-tive abundance of genomic DNA within the Sargasso Seametagenome is estimated by the number of 16S rRNAfragments satisfying identity thresholds of 97%, 93%, and90%. These values are shown as insets in Additional file 4.The number of syntenic fragments recovered for eachorganism correlates with the number of similar 16S rRNAgenes. The most abundant organism, SAR11, produced byfar the most syntenic fragments (71,696) while P. marinusreturned an intermediate number (8,398). Other organ-isms (e.g. C. atlanticus in Table 2 and Additional file 4)that are virtually undetectable by 16S rRNA analysisreturned a number of syntenic fragments (1258) similarto our negative control E. coli (406). Additional file 3shows the distribution of syntenic fragments recovered forE. coli.
If the syntenic fragment detection process described hereaccurately recovers environmental fragments arising froma given template organism, then the list of syntenic frag-ments should be unique for each organism. Thus, to esti-mate the selectivity of our method we compared thesyntenic fragment lists of all organisms tested. The per-centage of syntenic fragments unique to each organism(Table 2) is 98.8 % for HTCC1062 and 99.0 % for P. mari-nus. Less-abundant organisms have as few as 30% uniquesyntenic fragments, but not in all cases. In numbers, thelow abundance organisms are not distinguishable fromeach other or E. coli, though other marine microbes showa narrower, more distinct syntenic fragment pattern thanE. coli, similar to Additional file 4C (data not shown).
Page 14 of 19(page number not for citation purposes)
Biology Direct 2007, 2:27 http://www.biology-direct.com/content/2/1/27
Genome rearrangements and operon predictionTo find fragments containing HTCC1062 genes in alteredgene orders, the genes on the homologous fragments thatdid not show synteny to HTCC1062 were subjected to thebest BLAST analysis described above for the syntenic frag-ments. The number of occurrences of a given best-hittingHTCC1062 gene adjacent to a non-syntenic best-hittingHTCC1062 gene was determined, scoring the number oftimes any unique pair of genes occurred together.
To determine if genome rearrangements are concentratedat operon boundaries, a statistical analysis was performedcomparing the number of gene pairs found that violateoperon boundaries (disallowed pairs; n = 1301), to thenumber found that preserve operon boundaries (allowedpairs; n = 2131). A maximum likelihood estimator wasused to calculate the probability that this observationcould be due to chance, assuming the rearrangements atgene boundaries follow a normal distribution. The list ofpredicted operons for P. ubique HTCC1062 was obtainedvia the ENTREZ Genome Project [21].
Hypervariable regionsSite-specific recombination mediated by integrases hasbeen shown to cause rapid change in some islands ofgenomic variability [24]. However, SAR11, as with mostexamples thus analyzed [43], failed to display clear signa-tures of the integron model – attC sites were not foundassociated with any of the HVRs. HVR2 includes an inte-grase gene, and HVR4 is flanked by tRNA genes, whichhave been shown to serve as site-specific recombinationsites for temperate phages and transmissible plasmids[44].
Comparison of the genomes of strains HTCC1062 andHTCC1002 provides evidence that the 23S and 5S rRNAgenes flanking HVR2 are sites of homologous recombina-tion that allow novel variations of the LPS region tospread rapidly within populations. The HVR2 regions inthese two genomes are 99.96% similar in nucleotidesequence, compared to 97.4% similarity for the genomesoverall. In addition to few point mutations, the two HVR2sequences differ by a deletion of 13 nucleotides thatremoves one from a set of four tandem repeats within ahypothetical gene.
In contrast, the HVR1 regions of HTCC1062 andHTCC1002 reveal the loss and gain of divergent, tandemduplicated genes. One gene is deleted from a set of fourtandem, divergent gene duplications of Type V secretionproteins in strain HTCC1062 (Fig. 7). In strainHTCC1002, a single ammonium transporter gene isdeleted from two, tandem duplicated genes. A high pro-portion of hypothetical genes, such as we found in theSAR11 hypervariable regions, is a general feature of
genome islands. While phages are suspected to be the res-ervoir for this novel gene pool [43] direct evidence for thishypothesis remains elusive. Daubin and Ochmanreported that E. coli hypothetical genes are short, AT rich,and most likely originate from phage [45]. The evidencefor rapid gene evolution by duplication, divergence,domain rearrangements and deletion observed in HVR1could also be explained by the alternative hypothesis thatgenetic processes intrinsic to the cell cause at least some ofthe rapid change in the SAR11 HVRs.
Tests for selectionSequences were analyzed for synonymous and non-syn-onymous substitution rates using the software programSWAAP 1.0.2 [46], set to the Li method (1993) with a win-dow size of 90 and step size of 18. The values reported inTable 2 were created from alignments that include thoseportions of the HTCC1062 gene and syntenic fragmentsequence defined by the HSP start and end positionstaken from the TBLASTN results (see homolog detectionstep). Translated sequence was used to guide the align-ments when necessary. Nucleotide divergence values werecalculated with the software program DnaSP 4.0 using the'synonymous non-synonymous substitution' optionunder the analysis menu with default parameters [47].
Searching for genes conserved in Sargasso Sea SAR11 populations and not found in the genomes of the coastal isolatesNon-homologous genes found alongside genes that hadbest hits to HTCC1062 genes were regarded as candidatesfor genes specific to the Sargasso Sea SAR11 populations.The amino acid sequence of each CDS (the determinationof open reading frames on the environmental fragmentswas taken from the conserved domain feature tags of theNCBI GenBank record) on every homologous fragmentwith sufficient length to include non-HTCC1062homologs was used as a BLAST query sequence against theNCBI non-redundant proteins database (BLASTP, expectscore cutoff 1 × 10⁻⁶) and the NCBI Conserved DomainDatabase (CDD) [48]. We examined the data for the fre-quency of any specific non-HTCC1062 gene occurringnext to a given HTCC1062 gene, using the gene descrip-tions from the NCBI database as well as the protein familyidentifier from the CDD as search strings for the identifi-cation of common genes.
Calculating a synteny indexWe define a synteny index to be the fraction of best-hittingHTCC1062 homologs found adjacent to a best-hittingand syntenic HTCC1062 homolog. The amino acidsequence of each CDS on all homologous fragments car-rying at least two genes (238,663 of 349,742 total, Table1) was queried against the NCBI non-redundant proteinsdatabase. For every best-hitting gene on the fragment, if at
Page 15 of 19(page number not for citation purposes)

Biology Direct 2007, 2:27 http://www.biology-direct.com/content/2/1/27
least one best-hitting neighbor was present, it wascounted as a syntenic observance. To calculate the syntenyindex the total of all syntenic observances is divided bythe total observances of best hitting genes, syntenic andnon-syntenic.
Genes conserved in the coastal isolates but not found in the Sargasso Sea SAR11 populationsHTCC1062 genes that were not represented among the setof homologous fragments identified in the Sargasso Seadataset by TBLASTN were considered as candidates forgenes specific to the coastal ecotypes (Pelagibacter). Thetranslation products of these CDS were used as queries ina TBLASTN search of the Sargasso Sea dataset and theNCBInr database, using an expect score cutoff of 10. Thehighest scores found for these 19 genes are listed in Table11. Three CDS (414, 788 and 875) failed to hit theNCBInr database with an expect score of less than 1 × e-4
and are classified as hypothetical proteins in theHTCC1062 genome.
Competing interestsThe author(s) declare that they have no competing inter-ests.
Authors' contributionsLJW carried out the programming and drafted the manu-script. HJT contributed the comparisons of theHTCC1002 and HTCC1062 genomes. SAG operates theannotation pipeline. DPS carried out the analysis ofgenome re-arrangements. SJG conceived of the study, andparticipated in its design and coordination and helped todraft the manuscript. All authors read and approved thefinal manuscript.
Reviewer's commentsReviewer's report 1Eugene Koonin, National Center for Biotechnology Information, Bethesda, MDThis is quite an exciting study that makes an extensive useof metagenomic data to assess the natural variability ofPelagibacter (SAR11), apparently, the most abundantmarine bacterium. Pelagibacter seems to break the trendthat, previously, seemed consistent in all comparedprokaryotic genomes, namely, that gene order evolvesfaster than sequence (at least, coding sequence). It is rea-sonably proposed that the high effective population sizeof Pelagibacter leads to rapid accumulation of neutralsubstitutions. It is further proposed that purifying selec-tion acts to maintain the gene order in Pelagibacter andthat this is somehow related to genome streamlining. Theconnection seems pretty mysterious but, at face value, it ishard to deny that, at the time scale when many substitu-tions accumulate, genome rearrangements do not. Anexplicit population-genetic analysis of this discrepancy
would be interesting but one needs a good model forgenome rearrangements, of course.
There seems to be striking analogy between the hypervar-iable regions in Pelagibacter discovered here and pathe-genicity islands in bacterial pathogens, e.g., E. coli. I thinkit is worth more emphasis.
It will be very revealing to see whether these findingssmoothly extend to other marine bacteria such as Prochlo-rocccus, and whether the population-genetic explanationholds compared to the available abundance data. I actu-ally suspect that the data is there for such a comparison tobe done right now but, certainly, that can be done in anew paper, the present one stands on its own.
Reviewer's report 2Igor B. Jouline (Zhulin), Associate Professor and Senior R&D Staff Member, Joint Institute for Computational Sciences, The University of Tennessee – Oak Ridge National LaboratoryThis study aims at evaluating metagenomics data on themost abundant marine proteobacteria, SAR11, by com-paring it with available whole genome data of the SAR11strains. The overarching goal is to understand the natureof species and ecotypes in SAR11 populations. A morespecific aim was to assess trends in the SAR11 genomeevolution by determining the core genome and variableregions.
One of the main results of this study is a quantitative esti-mate of synteny and a demonstration that genome rear-rangements in SAR11 are not random, but areconcentrated at particular sites, which are often operonboundaries.
On a broader scale, this work presents an approach, whichis general enough to be applied to other metagenomicdata sets in order to study evolutionary trends in naturalmicrobial populations.
I don't have any major concerns regarding this paper. Itreads well and I found it quite interesting for a non-spe-cialist in microbial ecology and metagenomics. I woulddefinitely recommend it to anyone who is seriously think-ing about deriving information from the metagenomicsdata sets.
Reviewer's report 3Peer Bork, senior scientist (bioinformatics)/group leader at the EMBL (Heidelberg); joint coordinator of the EMBL Structural and Computational Biology program; visiting group leader at the MDC (Berlin-Buch)I think this is a great case study that wisely uses metagen-omics data to understand more about the natural varia-
Page 16 of 19(page number not for citation purposes)
Biology Direct 2007, 2:27 http://www.biology-direct.com/content/2/1/27
tion and evolution of Pelagibacter/SAR11, probably themost abundant marine bacterium.
A number of trends could be observed, some are similarto studies in other phyla, some are different; so the paperalso adds in general terms to our understanding of bacte-rial populations and the impact of habitats on their evo-lution.
Interestingly, it is proposed that gene order seems to sur-prisingly evolve slower than sequence and which isexplained partially by the large population size. I assumethat for the more detailed Quantification of this observa-tion more data will be needed, but the approach demon-strates the power of integrating metagenomics data ingenome analysis.
The quantification of the non-random accumulation ofmutations along the genome is another interesting aspectworth noting as is a surprizngingly high number of coregenes (or relative little indels) given the many individualsfrom which sequence fragments were available.
Taken together, the paper implies substantial amount ofwork in an important research area, it is based on a newintegration approach, and it addresses an number ofimportant points that are all worth publishing.
Additional material
AcknowledgementsThis work was supported by research grant MCB-0237713 from the NSF Microbial Observatories Program, and a Marine Microbiology Initiative investigator award from the Gordon and Betty Moore Foundation. The authors thank Saul Kravits, Steve Ferriera, Justin Johnson, Robert Friedman, Yu-Hui Rogers, J. Craig Venter and staff for genome sequencing of HTCC1002, and Kevin Vergin, Dee Denver, Robert Burton, and Ulrich Stingl for critical advice.
Accession numbers of strains used in this study. HTCC1062: NC_007205 HTCC1002: AAPV00000000.
Tool release. The source code for the identification and display of syn-tenic fragments is available at the Giovanonni laboratory web site [49].
References1. Welch RA, Burland V, Plunkett G 3rd, Redford P, Roesch P, Rasko D,
Buckles EL, Liou SR, Boutin A, Hackett J, et al.: Extensive mosaic
Additional file 1Distribution of expect scores for Pelagibacter syntenic fragments. The val-ues in the plot are taken from the TBLASTN search in which predicted proteins from the HTCC1062 genome were the query genes and the Sar-gasso Sea metagenomic database was searched (Fig. 2A). The distribution indicates a sharp decline in expect scores approaching the cutoff of 1 × 10-
10. The data are provided as support for this choice of expect score cutoff.Click here for file[http://www.biomedcentral.com/content/supplementary/1745-6150-2-27-S1.doc]
Additional file 2GC content of Pelagibacter syntenic fragments. Histogram of the GC con-tent of metagenomic fragments from the syntenic fragments bin, com-pared to the mean for the HTCC1062 genome.Click here for file[http://www.biomedcentral.com/content/supplementary/1745-6150-2-27-S2.doc]
Additional file 3Sargasso Sea syntenic fragment plot for Escherichia coli. A syntenic frag-ment plot using Escherichia coli as the query genome. The data provide a rough measure of the false-positive rate in the syntenic fragment plots.Click here for file[http://www.biomedcentral.com/content/supplementary/1745-6150-2-27-S3.doc]
Additional file 4Syntenic fragment plots of three representative organisms. The bar chart in the upper right corner indicates the number of fragments containing the query organism's 16S rRNA, at the indicated degree of similarity. The horizontal line indicates the average syntenic fragment score.Click here for file[http://www.biomedcentral.com/content/supplementary/1745-6150-2-27-S4.doc]
Additional file 5Syntenic fragments carrying at least three genes. A large portion of the syntenic fragments are not of sufficient length to carry more than three genes. These data show that the general trends of genome coverage and range of amino-acid level identity shown in Fig. 3D hold when the shorter fragments are excluded.Click here for file[http://www.biomedcentral.com/content/supplementary/1745-6150-2-27-S5.doc]
Additional file 6Analysis of assemblies versus unassembled reads. Pelagibacter syntenic fragment analysis performed on unassembled reads (A), and on sequence data containing assemblies as well as unassembled reads (B). The plots are essentially similar.Click here for file[http://www.biomedcentral.com/content/supplementary/1745-6150-2-27-S6.doc]
Additional file 7Enlargement of HVR3 and HVR4. HTCC1062 syntenic fragment plot showing detail in the region of HVR3 and HVR4.Click here for file[http://www.biomedcentral.com/content/supplementary/1745-6150-2-27-S7.doc]
Additional file 8Enlargement of HVR1. HTCC1062 syntenic fragment plot showing detail in the region of HVR1.Click here for file[http://www.biomedcentral.com/content/supplementary/1745-6150-2-27-S8.doc]
Page 17 of 19(page number not for citation purposes)

Biology Direct 2007, 2:27 http://www.biology-direct.com/content/2/1/27
structure revealed by the complete genome sequence ofuropathogenic Escherichia coli. Proc Natl Acad Sci USA 2002,99:17020-17024.
2. Thompson JR, Pacocha S, Pharino C, Klepac-Ceraj V, Hunt DE, BenoitJ, Sarma-Rupavtarm R, Distel DL, Polz MF: Genotypic diversitywithin a natural coastal bacterioplankton population. Science2005, 307:1311-1313.
3. Tettelin H, Masignani V, Cieslewicz MJ, Donati C, Medini D, WardNL, Angiuoli SV, Crabtree J, Jones AL, Durkin AS, et al.: Genomeanalysis of multiple pathogenic isolates of Streptococcusagalactiae: implications for the microbial "pan-genome".Proc Natl Acad Sci USA 2005, 102:13950-13955.
4. Konstantinidis KT, Tiedje JM: Genomic insights that advance thespecies definition for prokaryotes. Proc Natl Acad Sci USA 2005,102:2567-2572.
5. Tyson GW, Chapman J, Hugenholtz P, Allen EE, Ram RJ, RichardsonPM, Solovyev VV, Rubin EM, Rokhsar DS, Banfield JF: Communitystructure and metabolism through reconstruction of micro-bial genomes from the environment. Nature 2004, 428:37-43.
6. Steinberg DK, Carlson CA, Bates NR, Johnson RH, Michaels AF, KnapAH: Overview of the US JGOFS Bermuda Atlantic Time-series Study (BATS): a decade-scale look at ocean biologyand biochemistry. Deep-Sea Research II 2001, 48:1405-1447.
7. Venter JC, Remington K, Heidelberg JF, Halpern AL, Rusch D, EisenJA, Wu D, Paulsen I, Nelson KE, Nelson W, et al.: Environmentalgenome shotgun sequencing of the Sargasso Sea. Science2004, 304:66-74.
8. Dufresne A, Garczarek L, Partensky F: Accelerated evolutionassociated with genome reduction in a free-living prokary-ote. Genome Biology 2005, 6:R14.
9. Giovannoni SJ, Tripp HJ, Givan S, Podar M, Vergin K, Batista D, BibbsL, Eads J, Richardson TH, Noordewier M, et al.: Genome stream-lining in a cosmopolitan oceanic bacterium. Science 2005,309:1242-1245.
10. Rappé MS, Giovannoni SJ: The uncultured microbial majority.Annual Reviews Microbiology 2003, 57:369-394.
11. Morris RM, Cho JC, Rappe MS, Vergin KL, Carlson CA, GiovannoniSJ: Temporal and spatial response of bacterioplankton line-ages to annual convective overturn at the Bermuda AtlanticTime-series Study site. Limnol Oceanography 2005, 50:1687-1696.
12. Giovannoni SJ, Stingl U: Molecular Diversity and Ecology ofMicrobial Plankton. Nature Insight 2005, 437:343-348.
13. Rusch DB, Halpern AL, Sutton G, Heidelberg KB, Williamson S,Yooseph S, Wu D, Eisen JA, Hoffman JM, Remington K, et al.: TheSorcerer II Global Ocean Sampling Expedition: NorthwestAtlantic through Eastern Tropical Pacific. PLoS Biol 2007,5:e77.
14. Rappé MS, Connon SA, Vergin KL, Giovannoni SJ: Cultivation ofthe ubiquitous SAR11 marine bacterioplankton clade. Nature2002, 418:630-633.
15. Smith RL, Huyer A, Fleischbein J: The coastal ocean off Oregonfrom 1961 to 2000: is there evidence of climate change oronly of Los Niños? Progress in Oceanography 2001, 53:369-387.
16. Brown MV, Schwalbach MS, Hewson I, Fuhrman JA: Coupling 16S-ITS rDNA clone libraries and automated ribosomal inter-genic spacer analysis to show marine microbial diversity:development and application to a time series. Environ Microbiol2005, 7:1466-1479.
17. Hallam SJ, Konstantinidis KT, Putnam N, Schleper C, Watanabe Y,Sugahara J, Preston C, de la Torre J, Richardson PM, DeLong EF:Genomic analysis of the uncultivated marine crenarchaeoteCenarchaeum symbiosum. Proc Natl Acad Sci USA 2006,103:18296-18301.
18. Rasko DA, Myers GS, Ravel J: Visualization of comparativegenomic analyses by BLAST score ratio. BMC Bioinformatics2005, 6:2.
19. Coleman ML, Sullivan MB, Martiny AC, Steglich C, Barry K, Delong EF,Chisholm SW: Genomic islands and the ecology and evolutionof Prochlorococcus. Science 2006, 311:1768-1770.
20. DeLong EF: Microbial community genomics in the ocean. NatRev Microbiol 2005, 3:459-469.
21. Price MN, Huang KH, Alm EJ, Arkin AP: A novel method for accu-rate operon predictions in all sequenced prokaryotes. NucleicAcids Res 2005, 33:880-892.
22. Béjà O, Aravind L, Koonin EV, Suzuki M, Hadd A, Nguyen LP, Jovanov-ich SB, Gates CM, Feldman RA, Spudich JL, et al.: Bacterial rho-
dopsin: evidence for a new type of phototrophy in the sea.Science 2000, 289:1902-1906.
23. Giovannoni SJ, Bibbs L, Cho JC, Stapels MD, Desiderio R, Vergin KL,Rappe MS, Laney S, Wilhelm LJ, Tripp HJ, et al.: Proteorhodopsin inthe ubiquitous marine bacterium SAR11. Nature 2005,438:82-85.
24. Dobrindt U, Hochhut B, Hentschel U, Hacker J: Genomic islands inpathogenic and environmental microorganisms. Nat RevMicrobiol 2004, 2:414-424.
25. Hacker J, Carniel E: Ecological fitness, genomic islands and bac-terial pathogenicity. A Darwinian view of the evolution ofmicrobes. EMBO Rep 2001, 2:376-381.
26. Rocap G, Larimer FW, Lamerdin J, Malfatti S, Chain P, Ahlgren NA,Arellano A, Coleman M, Hauser L, Hess WR, et al.: Genome diver-gence in two Prochlorococcus ecotypes reflects oceanicniche differentiation. Nature 2003, 424:1042-1047.
27. Berg OG, Kurland CG: Evolution of microbial genomes:sequence acquisition and loss. Mol Biol Evol 2002, 19:2265-2276.
28. Lerat E, Daubin V, Ochman H, Moran NA: Evolutionary origins ofgenomic repertoires in bacteria. PLoS Biol 2005, 3:e130.
29. Nilsson AI, Koskiniemi S, Eriksson S, Kugelberg E, Hinton JC, Anders-son DI: Bacterial genome size reduction by experimentalevolution. Proc Natl Acad Sci USA 2005, 102:12112-12116.
30. Rozen DE, Schneider D, Lenski RE: Long-term experimental evo-lution in Escherichia coli. XIII. Phylogenetic history of a bal-anced polymorphism. J Mol Evol 2005, 61:171-180.
31. Cohan FM: What are bacterial species? Annu Rev Microbiol 2002,56:457-487.
32. Tamames J: Evolution of gene order conservation in prokary-otes. Genome Biol 2001, 2:11.
33. Wolf YI, Rogozin IB, Kondrashov AS, Koonin EV: Genome align-ment, evolution of prokaryotic genome organization, andprediction of gene function using genomic context. GenomeRes 2001, 11:356-372.
34. Huynen MA, Bork P: Measuring genome evolution. Proc NatlAcad Sci USA 1998, 95:5849-5856.
35. Linton D, Karlyshev AV, Wren BW: Deciphering Campylobacterjejuni cell surface interactions from the genome sequence.Curr Opin Microbiol 2001, 4:35-40.
36. Proctor LM, Fuhrman JA: Viral mortality of marine bacteria andcyanobacteria. Nature 1990, 343:60-62. 350
37. Vergin KL, Tripp HJ, Wilhelm LJ, Denver DR, Rappe MS, GiovannoniSJ: High Intraspecific Recombination Rate in a Native Popu-lation of Candidatus Pelagibacter ubique (SAR11). Environ-mental Microbiology 2007. Online Early: doi: 10.1111/j.1462-2920.2007.01361.x
38. Bashford D, Chothia C, Lesk AM: Determinants of a protein fold.Unique features of the globin amino acid sequences. J Mol Biol1987, 196:199-216.
39. Thompson JD, Higgins DG, Gibson TJ: CLUSTAL W: improvingthe sensitivity of progressive multiple sequence alignmentthrough sequence weighting, position-specific gap penaltiesand weight matrix choice. Nucleic Acids Res 1994, 22:4673-4680.
40. Stamatakis A: RAxML-VI-HPC: maximum likelihood-basedphylogenetic analyses with thousands of taxa and mixedmodels. Bioinformatics 2006, 22:2688-2690.
41. Altschul SF, Madden TL, Schaffer AA, Zhang J, Zhang Z, Miller W, Lip-man DJ: Gapped BLAST and PSI-BLAST: a new generation ofprotein database search programs. Nucleic Acids Res 1997,25:3389-3402.
42. Rocap G, Distel DL, Waterbury JB, Chisholm SW: Resolution ofProchlorococcus and Synechococcus ecotypes by using 16S-23S ribosomal DNA internal transcribed spacer sequences.Appl Environ Microbiol 2002, 68:1180-1191.
43. Holmes AJ, Gillings MR, Nield BS, Mabbutt BC, Nevalainen KM,Stokes HW: The gene cassette metagenome is a basicresource for bacterial genome evolution. Environ Microbiol2003, 5:383-394.
44. Reiter WD, Palm P, Yeats S: Transfer RNA genes frequentlyserve as integration sites for prokaryotic genetic elements.Nucleic Acids Res 1989, 17:1907-1914.
45. Daubin V, Ochman H: Bacterial genomes as new gene homes:the genealogy of ORFans in E. coli. Genome Res 2004,14:1036-1042.
46. Pride DT: A tool for analyzing substitutions and similarity inmultiple alignments. Distributed by the author 2005.
Page 18 of 19(page number not for citation purposes)
Biology Direct 2007, 2:27 http://www.biology-direct.com/content/2/1/27
Publish with BioMed Central and every scientist can read your work free of charge
"BioMed Central will be the most significant development for disseminating the results of biomedical research in our lifetime."
Sir Paul Nurse, Cancer Research UK
Your research papers will be:
available free of charge to the entire biomedical community
peer reviewed and published immediately upon acceptance
cited in PubMed and archived on PubMed Central
yours — you keep the copyright
Submit your manuscript here:http://www.biomedcentral.com/info/publishing_adv.asp
BioMedcentral
47. Rozas J, Sanchez-DelBarrio JC, Messeguer X, Rozas R: DnaSP, DNApolymorphism analyses by the coalescent and other meth-ods. Bioinformatics 2003, 19:2496-2497.
48. Marchler-Bauer A, Anderson JB, Cherukuri PF, DeWeese-Scott C,Geer LY, Gwadz M, He S, Hurwitz DI, Jackson JD, Ke Z, et al.: CDD:a Conserved Domain Database for protein classification.Nucleic Acids Res 2005:D192-196.
49. Oregon State University Giovanonni laboratory [http://www.mcb.oregonstate.edu/giovannoni/]
Page 19 of 19(page number not for citation purposes)