bacterioplankton growth associated with physical fronts ... · bacterioplankton growth associated...
TRANSCRIPT

Vol. 116: 233-245'1995 MARINE ECOLOGY PROGRESS SERIES
Mar. Ecol. Prog. Ser. Published January 12
Bacterioplankton growth associated with physical fronts during a cyanobacterial bloom
Anne Heinanen, Kaisa Kononen, Harri Kuosa, Jorma Kuparinen, Kalervo Makela
Finnish Institue of Marine Research, PO Box 33, FIN-00931 Helsinki, Finland
ABSTRACT: The main compartments of the nucrobial food web were studied in a hydrodynamically complicated area to determine the response of bacterioplankton to spatio-temporal discontinuities in the water column structure. The samples were divided according to water masses into those repre- senting frontal areas and those representing low-saline areas. In the upper mixed water layer (UML) bacterial production was higher in the frontal water (average 4.5 mg C m 3 d l ) than in the low-saline water (3.7 mg C irr3 d-I). However, the proportion of bacterial production of the primary production was about the same in the frontal water (15 5%) and in the low-saline (16 %) water. The data implied that the recorded frontal upwelling event did not drastically change the mode of production from regenerated to new production. Furthermore, the data indicated that heterotrophic flagellates did not respond to increased bacterial abundance during the intervals between hydrodynamic events. Below the thermochne, the turnover time of bacterial numbers was less than in the UML, as was thymidine incorporation (TdR) per cell, but leucine incorporation (Leu) per cell was highest in the UML. The average molar ratio of Leu to TdR was 7.7 in the UML and 3 below the thermocline. The molar ratio showed an increase in the growth rate during a storm event. Leu and TdR methods did not give equivalent rates of bacterial production over the daily timescale, although they gave quite similar estimates when averaged over the whole study penod (11 d). Our data indicated that one should be very cautious in using conversion factors, which are derived from surface water, to calculate bactenal production throughout the water column, and that sometimes even higher conversion factors should be used below the thermocline than in the UML.
KEY WORDS: Bactenoplankton . Bacterial production Thymidine incorporation Leucine incorpora- tion . Heterotrophic flagellates Picocyanobactena . Cyanobacteria Physical fronts . Baltic Sea
INTRODUCTION
The central role of heterotrophic bacterioplankton in the carbon flow of aquatic food webs has been estab- lished during the past decade (Williams 1981, Azam et al. 1983). Several experimental studies have provided valuable information on the factors limiting and regu- lating bacterioplankton growth in controlled environ- ments with a limited set of manipulated factors (e.g. Wright & Coffin 1984, Goldman et al. 1987, Autio 1990, Kirchman et al, 1990, Kuuppo-Leinikki 1990, Kivi et al. 1993, Kuparinen & Heinanen 1993, Zweifel et al. 1993, Shiah & Ducklow 1994). Extrapolation of the results from controlled, laboratory-scale studies to natural environments on ocean and global scales seems to be the challenge in this decade. This extrapolation from
flasks to oceans not only requires field studies up- scaled to different spatio-temporal scales, but also interdisciplinary studies, with biological, chemical and physical interactions. However, such interdisciplinary studies are sparse in the literature (Ki~rboe 1993) mainly due to the difficulty in simultaneously covering all the spatio-temporal scales involved in the dynamics of pelagic physics and biology (McManus & Fuhrman 1988).
In temperate sea areas, such as the Baltic Sea, plankton community dynamics are predominantly in- fluenced by season (Hallfors & Niemi 1986). The main features in the northern Baltic Sea proper are the spring and summer blooms. In our study area, at the entrance to the Gulf of Finland, the vigorous phyto- plankton spring bloom ends in the depletion of in-
63 Inter-Research 1995 Resale of full article not permitted
234 Mar. Ecol. Prog. Ser. 116: 233-245, 1995
-
organic nutrients and the stratification of the water column. The major part of the phytoplankton spring bloom ('new production' sensu Dugdale & Goering 1967) is removed from the pelagic food webs through sedimentation (Leppanen 1988, Lignell et al. 1993). In summer, the water column is steeply temperature stratified and the thermocline and the nutricline coin- cide (Stigebrandt & Wulff 1987). Phytoplankton pro- duction, based mainly on regenerated nutrients, occurs in the upper mixed water layer (10 to 20 m deep) isolated from the nutrient reserves, and the microbial loop type food web prevails. However, occasional events, e.g. upwellmg and storms, may break the stratification during summer and bring mineral nutri- ents into the photic layer. Thus, spatio-temporally, new production may interfere with the regenerated mode of production.
The response of bacterioplankton to spatio-temporal discontinuities in water column structure has been poorly investigated. It has been shown experimentally that, during the new production period in the study area (spring phytoplankton bloom), bacterioplankton is mainly controlled by the availability of labile DOC (dissolved organic carbon) (bottom-up). The control by predators (top-down) is of minor importance, because bacterioplankton growth rates are faster at low tem- peratures than those of their predators. During the regenerated production period (stratified summer situ- ation), both nutrient and predator control are impor- tant (Kivi et al. 1993, Kuparinen & Heinanen 1993).
The Baltic Sea is a hydrodynamically complicated sea area due to the shallow and complex bottom topography, remarkable salinity gradients (from al- most limnic in the bayheads to ca 8 ppt in the open Baltic Sea) and periodic water exchange with the North Sea. Compared to the oceans, the spatial and temporal scales of hydrodynamic events and features are small, e.g. upwelling and wind-induced mixing occur over a time scale from hours to a few days and the spatial scale of hydrodynamic fronts is only kilometres (Nbmmann 1990). The deepening or even break-up and renewal of the thermocline may occur on a scale of hours during a storm (Krauss 1981, Malkki & Tamsalu 1985). As the thermocline and nutricline are coincident in the Baltic Sea during summer, the total amount of nutrients available to the pelagic food webs is occasionally enhanced by disruptions in the vertical structure of the water column. It can be hypothesised that, during such occasions, the microbial food web will be forced out of balance, different components of the microbial food web being able to grow under less control by nutrients and/or predators. Recording of
such events requires a sampling strategy which is in accordance with the phenomena under study.
In this paper, the dynamics of the main compart- ments of the microbial food web (bacterioplankton, heterotrophic flagellates and picocyanobacteria) were studied in the upper mixed water layer during a cyanobacterial bloom in August 1992. The special focus is on bacterioplankton; and, the problems arising in bacterial production measurements in a hydro- dynamically complicated area are discussed in detail.
MATERIALS AND METHODS
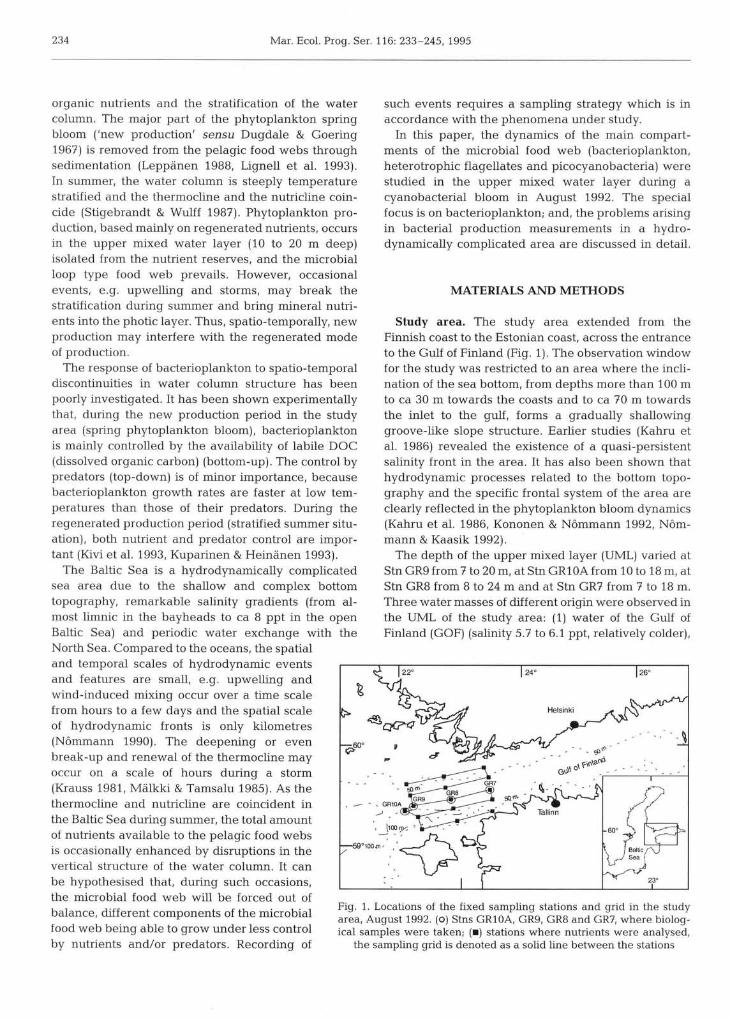
Study area. The study area extended from the Finnish coast to the Estonian coast, across the entrance to the Gulf of Finland (Fig. 1). The observation window for the study was restricted to an area where the incli- nation of the sea bottom, from depths more than 100 m to ca 30 m towards the coasts and to ca 70 m towards the inlet to the gulf, forms a gradually shallowing groove-like slope structure. Earlier studies (Kahru et al. 1986) revealed the existence of a quasi-persistent salinity front in the area. It has also been shown that hydrodynamic processes related to the bottom topo- graphy and the specific frontal system of the area are clearly reflected in the phytoplankton bloom dynamics (Kahru et al. 1986, Kononen & Nbmmann 1992, NOm- mann & Kaasik 1992).
The depth of the upper mixed layer (UML) varied at Stn GR9 from7 to 20mi at Stn GRlOAfrom 10 to 18 m, at Stn GR8 from 8 to 24 m and at Stn GR7 from 7 to 18 m. Three water masses of different origin were observed in the UML of the study area: (1) water of the Gulf of Finland (GOF) (salinity 5.7 to 6.1 ppt, relatively colder),
Fig. 1. Locations of the fixed samplmg stations and grid in the study area, August 1992. (0) Stns GRlOA, GR9, GR8 and GR7, where biolog- ical samples were taken; (m) stations where nutrients were analysed,
the sampling grid is denoted as a solid line between the stations

Hemanen et al.: Growth of bacterioplankton during a cyanobacterial bloom 235
(2) water of the Northern Baltic Proper (NBP) (salinity 6.4 to 6.6 ppt, relatively warmer), and (3) upwelled water (13 to 15 OC). In the thermocline layer, the location of the internal frontal interface between GOF water and NBP water did not vertically match with the surface front. In the intermediate water layer between the thermocline and the halocline, the internal front was persistently located between Stns GR10A and GR9, At Stn GR8, a body of NBP water inside the less-saline water mass was moving slowly towards the west in the intermediate layer. In the halocline, the distribution of water masses was similar to that in the intermediate water layer.
At the beginning of the research cruise, the average wind was NE at ca 10 m s-I for 1 wk and, after a 2 to 3 d period of calm, southerly winds, wind speed increased to 15 m s (on 11 August). During the storm the wind was E, but the next day (12 August) it was again SW. Upwelling at the northern (Finnish) coast and down- welling at the southern (Estonian) coast caused by the persistent SW wind took place between 4 and 11 August. Clear salinity fronts existed inside our ob- servation window from 14 July to 17 August according to the high-resolution automatic surface layer salinity measurements made daily on board a ferry which sailed regularly across our study area. The appearance and location of any particular front, however, varied (Eija Rantajarvi & Juha-Markku Leppanen, Finnish Inst. Mar. Res., unpubl. data). During our cruise, the quasi-permanent surface salinity front between the 2 main water masses was characterised as follows: the salinity difference between the 2 sides was 0.3 to 0.5 ppt, temperature difference was 0.2 to 0.3"C, the front was generally east-west directed and relatively stationary in space and time (e.g. Fig. 3).
Sampling. A single integrated sample to represent the whole UML was prepared as follows. Density and chlorophyll profiles were used to determine the depth of the UML. Water samples were taken at 1 m intervals from the UML and mixed in a container. Between 5 and 10 1 of water were taken from each sampling depth. In addition, at Stn GR9 and later at Stn GRlOA, bacterioplankton analyses were also done from ver- tical samples at depths of 0, 20, 40, 60 and 90 m. The sampling at fixed locations was done daily, 3 to 13 August 1992, at 3 stations (Fig. 1). The westernmost station was moved towards the west (GR10A instead of GR9) during the course of the study as the water masses moved. In the analysis of data, the samples were divided according to water masses into those rep- resenting the frontal area and into those representing the low-salinity area (Table 1). The water mass at Stn GR7 on 11 to 13 August was apparently different from the 2 known water masses, but it was impossible to locate its origin inside our observation window. These data are shown in the figures, but was excluded
Table 1 The location of samplmg stations in different water masses during the study period
1 station Water mass I Frontal Low-saline Unknown
GR? 3-10 Aug 11-13 Aug GR8 12-13 Aug 3-11 Aug GR9 3-7 AUCJ 8-10 A u ~ GR10A 11-13 Aug
from the data analyses, although including this data in the data set of frontal samples would not have caused any major changes in the results.
Nutrients were analysed daily at 12 extra fixed grid stations, normally at 10 m intervals from surface to bottom, unless more frequent sampling was necessary. In addition, 24 CTD measurements were made at 21 fixed grid stations and chlorophyll (in situ fluorescence), salinity and temperature at 5 m depth within the obser- vation window were measured semi-continuously on board RV 'Aranda' during 2 to 14 August (Fig. 1).
Bacterial numbers. Subsamples (20 ml) were fixed with filtered (0.2 pm Minisart filters, Sartorius) forma- lin (200 pl, 39 %), stained with filtered (0.2 pm Minisart filters, Sartorius) acridine orange (0.5 mM), filtered onto Nuclepore filters (polycarbonate, black, 0.2 pm), and the numbers of bacteria were enumerated under an epifluorescence microscope (Hobbie et al. 1977). The counting was made with a Leitz Aristoplan micro- scope using 1 2 . 5 ~ oculars and a PL Fluotar lOOx/1.32 oil objective. At least 200 cells and 20 fields were counted from each preparation.
Turnover time of bacterial numbers (days) was calculated by dividing the cell numbers by the cell production rate measured by thymidine incorporation using a conversion factor of 1.1 x 10" cells mol-I (Riemann et al. 1987).
Thymidine and leucine incorporation. Duplicate subsamples (10 ml) and 1 formalin-killed control from each sample were incubated in acid-washed glass vials with a saturating concentration of 10 to 12 nM [methyl-^H]thymidine (48 to 51 Ci mrnoll; Amersham International, Amersham, UK) for 39 to 143 min (Fuhrman & Azam 1982, Heinanen 1993). Duplicate subsamples (10 ml) and 1 formalin-killed control were also incubated with L-[4, 5-^H]leucine (135 to 166 Ci mmol l ; Amersham International) for 55 to 112 min. The final concentration of leucine was 102 to 104 nM (100 nM unlabelled leucine) (Kirchman et al. 1986). The measurement of leucine incorporation was carried out on the vertical samples at Stns GR9 and GR10A. The ambient saturation levels of thymidine and of leucine were measured during the cruise: for thymi- dine it was about 10 nM and for leucine 40 to 100 nM.

236 Mar Ecol. Prog. Ser. 116. 233-245, 1995
The incubations were carried out at in situ temperature and stopped b y adding 100 pl o f formalin. T h e sub- samples were filtered through 0.2 pm cellulose nitrate filters (Sartorius). The incubation vials, filtration fun- nels and filters were rinsed with ice-cold 5 % T C A . Filtration equipment and samples were kept ice cold throughout the filtration procedure. Radioactivity counting was performed on board RV 'Aranda' using a 1219 Rackbeta liquid scintillation counter (LKB Wallac, Turku, Finland) after adding 10 ml of scintillator (Lumagel, Lumac) to each sample.
Bacterial production. The calculation of bactenal production based on the thymidine incorporation rate was done using a conversion factor o f 1.1 x 10¹⁸ cells m o l l (Riemann et al. 1987), a carbon content o f 0.35 pg C p n 3 (Bjurnsen 1986) and a mean cell volume o f 0.024 pm3 based on Heinanen & Kuparinen (1993) and data b y Heinanen (unpubl.) from the study area. Bacterial production was calculated from the leucine incorporation rate according to Simon & Azam (1989). W e used a leucine concentration which was above the saturation level and therefore omitted the isotope dilution factor from the equation. The areal produc- tivity values based on vertical sampling at Stns GR9 and GR10A were calculated using trapezoid integra- tion.
Heterotrophic nanoflagellates. Heterotrophic flagel- lates were enumerated with epifluorescence micro- scopy. The samples were fixed with glutaraldehyde ( E M grade) at a final concentration of 2 %. O f the sample, 5 rnl was then stained with proflavine for 1 min and filtered onto a black Nuclepore 0.2 pn pore-sized polycarbonate filter (Haas 1982). The filters were mounted on paraffin oil and stored i n a freezer until analysis. A Leitz Dialux microscope fitted with a HBO- 50 mercury lamp, Leitz filter block I2 and a lOOx/1.32 oil immersion objective was used. At least 100 flagel- lates were counted from each sample.
Picocyanobacteria. Samples for counting of pico- planktonic cyanobacteria (5 ml) were filtered onto black 0.2 pm pore-sized Nuclepore filters under a vacuum less than 13 kPa. The samples were not fixed or stained. The filters were mounted in paraffin oil and examined with a Leitz Aristoplan microscope equipped with a 50 W mercury lamp. Cyanobacteria were enumerated with epifluorescence microscopy using green excitation light (Leitz filter set M2) and lOOx/1.32 oil immersion objective. O n an average 200 cells (minimum 100 cells) per filter were counted.
Phytoplankton primary production and chloro- phyll a (chl a). Primary production estimates were based on simulated in situ measurements (Nielsen & Bresta 1984) from the integrated water sample (surface to thermocline) incubated in the deck incubator. Water from the sampling depths was poured through a
200 pm mesh filter to remove larger zooplankton and aggregates. This integrated sample was further poured through 20 pm mesh to obtain a < 20 pm size fraction. The <20 pm fraction was further filtered b y gravity through a 2.0 pm Nuclepore filter (45 mm diameter). From the < 2 pm size fraction, triplicate 20 ml aliquots were incubated in the deck incubator under surface light (100 %). From the < 20 pm size frac- tion, duplicate 20 ml aliquots were incubated under dif ferent light levels (10, 20, 40, 60, 80, 100 and 110 % of surface light). From the <200 pm size fraction, an additional 60 ml aliquot was incubated under surface light. A larger volume sample from the < 200 pn size fraction was used to obtain a more representative value for particulate production from the water which had observable aggregates.
Irradiance during the day and during the 2 h incu- bation period was recorded with a LI quantum sensor (LI-COR, Lincoln, NB, USA) . Relative irradiance was recorded during each sampling from 0 , 1, 2, 3, 4 , 5 , 10, 15 and 20 m depths with the quantum sensor. In order to calculate daily production, a normalised photsynthesis- irradiance (PI) curve was made from the measurements at different light levels in the incubator at noon (Fig. 2) . From the measurements o f surface irradiance during the day and the vertical irradiance attenuation at the sam- pling station, a matrix for actual irradiances for each hour could be constructed. Combining the actual irradi- ances and the relative production rates from the PI curve, a matrix o f relative production for the whole day for the different light depths was established (Table 2) . The actual production rates at different depths were ob- tained from the incubator measurements and the rela- tive production data in the matrix. Daily production rates were calculated b y summing the integrated (trape- zoid) hourly depth profile values.
The chi a concentration was determined on What- m a n GF/F glass fiber filters after extraction with 96 %
-100 0 100 200 300 400 500 600 700 800 900
Irradiance, pmol m ' s - '
Fig. 2. A normalized PI curve made from the measurements at different light levels m the incubator at noon

Hemanen et al.: Growth of bacterioplankton during a cyanobacterial bloom 237
Table 2. A matrix of relative production for an entire day and for the different light depths based on light values on 2 Aug and actual irradiance measurements
Depth Relative (m) attenuation o
0 CT) 0
I 0 0 CO 0
Time of day (h) 0 0
0 0 0 LO
0 2 H 2 0 0 0 0 0 0 CD 4
tf7 2 +
ethanol for 24 h and measured fluorometrically (Perkin Elmer LS-2B) (BMEPC 1988),
Hydrographical and chemical analysis. Tempera- ture, fluorescence and conductivity were measured with a CTD-sonde (Mark V , Neil Brown) and salinity was computed from the data according to UNESCO (1981). Inorganic nutrients were determined with an autoanalyzer (Grasshoff et al. 1983), except for am- monia, which was determined manually (Grasshoff et al. 1983).
RESULTS
Upper mixed water layer
At the beginning of the study period, the cyano- bacterial bloom was in a declining stage and total chl a concentration on 3 August at the frontal station (GR9) was 6.4 m g m 3 ; at the low-saline stations it was 7.2 m g m - 3 (GR8) and 6.5 m g m-3 (GR7). T h e clear spatial seg- regation of the 2 dominant cyanobacterial species, Nodularia spwnigena and Aphanizomenon flos-aquae, observed in the earlier stage of the bloom, 2 w k before, had vanished and both species appeared over the whole entrance area of the Gulf (Kaisa Kononen, Finnish Inst. Mar. Res., unpubl.). A n e w bloom period (11 to 17 August) was initiated at the end of our cruise during a storm. T h e range of some parameters charac- terising the UML of the frontal and low-saline water masses are shown in Table 3.
Bacterioplankton numbers, the thymidine incorpora- tion rate, numbers of heterotrophic flagellates and picocyanobacteria in the low-saline and frontal areas are shown in Figs. 3 to 6 and coefficients of variation in Table 4 , respectively,
Thymidine incorporation per cell was, on average, 1.3 times higher in the frontal water mass than in the low-saline water mass and the turnover time o f bac- terial numbers averaged 18 d (range 6 to 47 d ) in the low-saline water and 13 d (range 6 to 21 d ) in the frontal water. Changes in the turnover time of the bac- terial numbers could have been used to distinguish the different water masses, but the response of the turnover time to disturbances was not immediate and was subject to a delay, e.g. due to the storm event on 2 d. T h e average numbers of picocyanobacteria were also 1.3 times higher in the frontal water mass com- pared to the low-saline water mass. The average num- bers o f heterotrophic flagellates were almost the same in the low-saline water mass (2.7 x l a 9 cells m 3 ) and in the frontal water mass (2.6 x l o 9 cells m-"). In the frontal samples, a significant positive correlation was found between numbers of bacterioplankton and heterotrophic flagellates (r = 0.68, p = 0.03) and in the low-saline samples, a significant negative correlation existed between the numbers of picocyanobacteria and heterotrophic flagellates (r = -0.72, p = 0.02).
Table 3. Range of various parameters in frontal and low-saline samples. DIN: dissolved inorganic nitrogen, bd- below detec-
tion limit
salinity (PP~) P o 4 (mmol m-j) Total P (mmol m-3) DIN (mmol m-3) Total N (mmol m-3) Total chl a (mg m 3 ) Primary production
(mg C m 3 d l )
Frontal
6.13-6.64 bd-0.05
0.43-1.32 0.08-1.64
24-67 3.7-12
7-75

3 4 5 6 7 8 9 10 11 12 13 date
Fig. 3. Bacterial cell numbers (cells m 3 ) in the upper mixed water layer. Black bars: low-saline stations; grey bars: frontal stations; white bars: stations with water of unknown origin. The longitudes of the samplmq stations are given on the y-axis (scale of space) and sampling dates in August 1992 are given on the x-axis (scale of time). The stations are denoted as black squares on the salinity isopleths (see also Fig. 1). Upper row: samples from GR9 (3 to 10 August) and GR10A (11 to 13 August);
middle row: samples from GR8; lower row: samples from GR?
date
Fig. 5. Abundance of heterotrophic flagellates (cells m-9 In the upper mixed water layer. Symbols as in Fig. 3
nmol m 3 h-I
3 4 5 6 7 8 9 10 11 12 13 date
Fig. 4. Thymidine incorporation rate (nmol m 3 h l ) in the upper mixed water layer. Symbols as in Fig. 3
cells m3 (x 1 011)
3 4 5 6 7 8 9 10 11 12 13
date
Fig. 6. Abundance of picocyanobacteria (cells m 3 ) in the upper mixed water layer. Symbols as in Fig. 3
Heinanen et al.: Growth of bacterioplankton during a cyanobacterial bloom 239
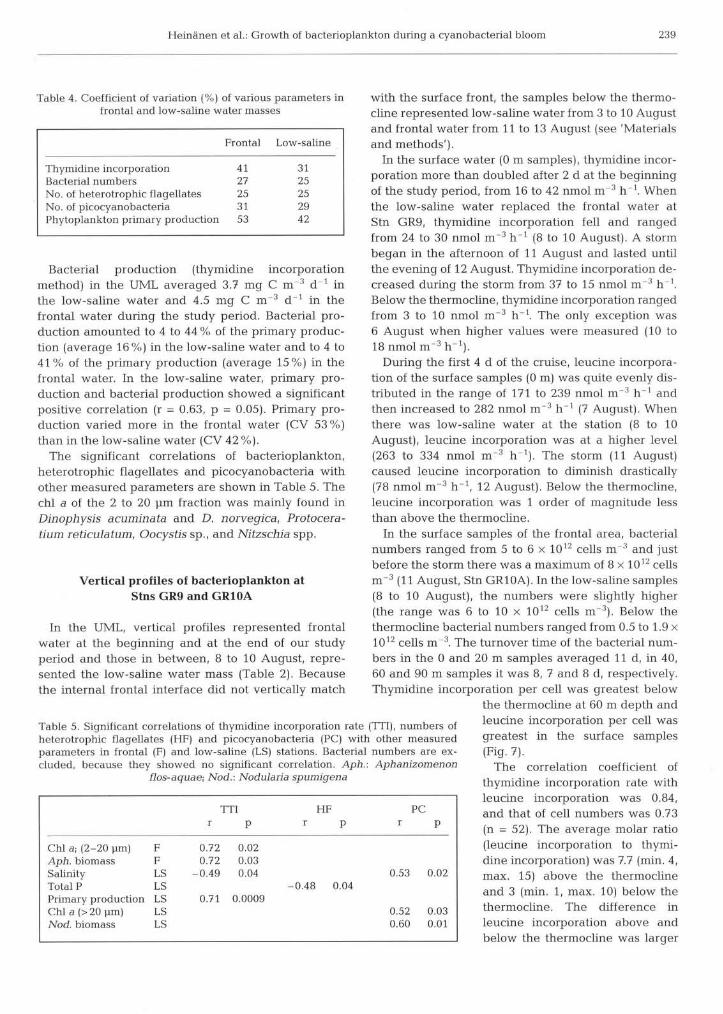
Table 4 . Coefficient of variation (%) of various parameters m frontal and low-saline water masses
Frontal Low-saline
Thymidine incorporation 41 31 Bacterial numbers 27 25 No of heterotrophic flagellates 25 25 No. of picocyanobacteria 31 29 Phytoplankton primary production 53 42
Bacterial production (thymidine incorporation method) m the U M L averaged 3.7 m g C m 3 d l in the low-saline water and 4.5 m g C m 3 d l i n the frontal water during the study period. Bacterial pro- duction amounted to 4 to 44 % of the primary produc- tion (average 16 %) in the low-saline water and to 4 to 41 % of the primary production (average 15 %) in the frontal water. In the low-saline water, primary pro- duction and bacterial production showed a significant positive correlation (r = 0.63, p = 0.05). Primary pro- duction varied more in the frontal water (CV 53%) than in the low-saline water (CV 42 %).
T h e significant correlations of bacterioplankton, heterotrophic flagellates and picocyanobacteria with other measured parameters are shown in Table 5. The chl a of the 2 to 20 pm fraction was mainly found in
Dinophysis acuminata and D. norvegica, Protocera- tium reticulatum, Oocystis sp., and Nitzschia spp.
Vertical profiles of bacterioplankton at Stns GR9 and GR10A
In the UML, vertical profiles represented frontal water at the beginning and at the end of our study period and those in between, 8 to 10 August, repre- sented the low-saline water mass (Table 2). Because the internal frontal interface did not vertically match
with the surface front, the samples below the thermo- cline represented low-saline water from 3 to 10 August and frontal water from 11 to 13 August (see 'Materials and methods').
In the surface water (0 m samples), thymidine incor- poration more than doubled after 2 d at the beginning of the study period, from 16 to 42 nmol m 3 hh l . W h e n the low-saline water replaced the frontal water at Stn GR9, thymidine incorporation fell and ranged from 24 to 30 nmol mA3 hrrl (8 to 10 August). A storm began in the afternoon of 11 August and lasted until the evening of 12 August. Thymidine incorporation de- creased during the storm from 37 to 15 nmol m 3 h-l. Below the thermocline, thymidine incorporation ranged from 3 to 10 nrnol m 3 h . T h e only exception was 6 August w h e n higher values were measured (10 to 18 nmol m - 3 h-I ) .
During the first 4 d of the cruise, leucine incorpora- tion of the surface samples (0 m ) was quite evenly dis- tributed in the range of 171 to 239 nmol m 3 h 1 and then increased to 282 nmol m 3 h (7 August). W h e n there was low-saline water at the station (8 to 10 August), leucine incorporation was at a higher level (263 to 334 nmol m-3 h-I) . T h e storm (11 August) caused leucine incorporation to dimimsh drastically (78 nmol m 3 h l , 12 August). Below the thermocline, leucine incorporation was 1 order of magnitude less than above the thermocline.
In the surface samples o f the frontal area, bacterial numbers ranged from 5 to 6 x 1 0 cells m 3 and just before the storm there was a maximum of 8 x 1 0 cells m 3 (11 August, Stn GR10A). In the low-saline samples (8 to 10 August), the numbers were slightly higher (the range was 6 to 10 x 1012 cells m 3 ) . Below the thermocline bacterial numbers ranged from 0.5 to 1.9 x 10¹² cells m 3 . T h e turnover time of the bacterial num- bers m the 0 and 20 m samples averaged 11 d , in 40, 60 and 90 m samples it was 8, 7 and 8 d , respectively. Thymidine incorporation per cell was greatest below
Table 5. Significant correlations of thymidine incorporation rate (TTI), numbers of heterotrophic flagellates ( H F ) and picocyanobacteria (PC) with other measured parameters in frontal ( F ) and low-saline ( L S ) stations. Bactenal numbers are ex- cluded, because they showed no significant correlation. Aph.: Aphanizomenon
flos-aquae; Nod.: Nodulana spumigena
TTI HF PC r P r P r P
Chl a; (2-20 pm) F 0.72 0.02 Aph. biomass F 0.72 0 03 Salinity LS -0.49 0.04 0 53 0.02 Total P LS -0.48 0.04 Primary production LS 0.71 0.0009 Chl a (> 20 urn) LS 0.52 0 03 Nod. biomass LS 0 60 0.01
the thermochne at 60 m depth and leucine incorporation per cell was greatest in the surface samples (Fig. 7 ) .
The correlation coefficient of thymidine incorporation rate with leucine incorporation was 0.84, and that o f cell numbers was 0.73 (n = 52). The average molar ratio (leucine incorporation to thymi- dine incorporation) was 7.7 (min. 4 , max. 15) above the thermocline and 3 (min. 1, max. 10) below the thermocline. The difference in leucine incorporation above and below the thermocline was larger

240 Mar. Ecol. Prog. Ser. 116: 233-245, 1995
0 L " " ~ " " ' I 3 4 5 6 7 8 9 1 0 1 1 1 2 1 3
date date
3 4 5 6 7 8 9 1 0 1 1 1 2 1 3
date 3 4 5 6 7 8 9 1 0 1 1 1 2 1 3
date
Fig. 7. Thymidine incorporation (TdR) per cell and leucine incorporation (Leu) per cell (nmol c e l l 1 h 1 ) at the vertical sampling Stn GR9/GR10A
than in thymidine incorporation, 10 times compared to 4 times. In the surface water there were 2 clear peaks in the molar ratio, the first one at the beginning of the study period and the second one during the storm. The influence of the storm was also seen in the increased leucine: thymidine molar ratio of the deeper samples below the thermocline (Fig. 8).
3 4 5 6 7 8 9 1 0 1 1 1 2 13
date
date
Fig 8. Average molar ratio of leucine incorporation to thymi- dine incorporation at the vertical sampling Stn GR9/GR10A
Areal bacterial production from the surface to 90 m depth was estimated based both on thymidine incor- poration and on leucine incorporation. The average daily production was 232 mg C m 2 by the leucine incorporation method and 259 mg C mu2 by the thymidine incorporation method. The profiles of bac- terial production (mg C m 3 h l ) obtained by the thymidine and leucine incorporation methods were similar (r = 0.85, p < 0.0001). However, the daily areal production estimates from surface to 90 m depth obtained by the 2 methods were not correlated (Fig. 9).
400 - 350 - Leu
300 -
250
150
100 3 4 5 6 7 8 9 1 0 1 1 1 2 1
date
Fig. 9. Integrated bacterial production (mg C m 2 d l ) at the vertical sampling Stn GR9/GR10A. Leu: leucine incorporation
method, TdR: thymidine incorporation method

Heinanen et al.: Growth of bacterloplankton during a cyanobacterial bloom 24 1
DISCUSSION
Patchiness in the study area
The levels of bacterial numbers, bacterial production and primary production measured in this study were in the range measured earlier at the entrance of the Gulf of Finland during the late summer period (Gronlund & Leppanen 1990, Heinanen & Kuparinen 1991). The higher spatio-temporal resolution of our sampling com- pared to earlier studies did not result in the detection of unusually low or high production values, although it did reveal highly variable bacterial production. The distance between our sampling stations was about 40 km, which was larger than the observed spatial scale of patches in phytoplankton biomass (chl a) from 1 to over 10 km. Phytoplankton is of great importance to heterotrophic bacterioplankton, because it is the main source of DOC in the open Baltic Sea (Maksi- mova 1982, Pocklington 1986). The scale of phyto- plankton patches was smaller than the spatial resolu- tion of our sampling and consequently resulted in high CV of thymidine incorporation between stations. A similar high CV of thymidine incorporation, as in the frontal water mass of our study, has been reported dur- ing highly patchy phytoplankton spring blooms (Kahru et al. 1990, Heinanen & Kuparinen 1991, Kononen et al. 1992). Typical variation in summer, independent of the scale, would have been half of what we found (Heinanen & Kuparinen 1991). Thus, physical fronts which coincided with cyanobacterial blooms created a water mass where bacterial production was more patchy than in the adjacent water masses. In contrast to production, the variation in bacterial numbers was very low.
Frontal vs low-saline dynamics
The enhanced levels of primary production, bacterial production and abundance, and abundance of pico- cyanobacteria in the frontal samples compared to those of the low-saline samples indicated that the frontal area provided ample growth conditions. Similar sites for enhanced biological activity compared to adjacent water masses have been recorded from the frontal areas of the North Sea and the English Channel (Holli- gan et al. 1984, van Duyl et al. 1990). The possible rea- sons for higher production might have been increased nutrient concentrations and higher turnover of nutri- ents and labile dissolved organic carbon compared to the low-saline water mass.
We expected bacterioplankton production to be a smaller proportion of primary production in the frontal area compared to the low-saline area since seasonal
studies show that during the new production period, the microbial loop is less important than during the regenerated production period (Larsson & Hagstrom 1982, Kuosa & Kivi 1989, Lignell 1990). However, the relative production rates were about the same (16 in the low-saline area compared to 15 in the frontal area) and quite close to the average (20) found by Cole et al. (1988) in a cross-system overview. Thus, in both areas, bacterioplankton production had the same propor- tional importance, which indicated that the recorded frontal upwelling event did not drastically change the mode of production from regenerated to new produc- tion. The same relative production rates implied also that the availability of labile carbon originating from phytoplankton was perhaps the most important factor in determining the actual amount of bacterial produc- tion. A positive relationship existed between phyto- plankton and cyanobacterial biomass and bacterial production in the frontal area, and phytoplankton primary production and bacterial production in the low-saline area (Table 5). This indicated that bacterial production in the frontal area was more connected with the already decaying cyanobacterial bloom than with the sites of highest primary production, as was the case in the low-saline area. In addition, the photo- synthesis to respiration ratio (P/R) showed that the study area was net autotrophic and the low-saline area was even more net autotrophic than the frontal area (P/R 2.5 and 1.4, respectively; Jorma Kuparinen, Finnish Inst. Mar. Res., unpubl.). The significant corre- lation in the frontal area between bacterioplankton production and Aphanizornenon biomass also indi- cated the possibility that Aphanizornenon aggregates provided a rich substrate environment for effective bacterial recycling of inorganic nutrients.
The nutrient levels were almost equal in the frontal and low-sahne samples. The only exception was total nitrogen concentrations, which were slightly higher in the frontal samples. The high ammonium con- centrations in both areas suggested that effective decomposition of organic matter and regeneration of nutrients were occurring in the whole study area. These parallel the conclusion concerning bacterio- plankton production and primary production, that the regenerated mode of production was the dominant feature in the study area. Because ammonium concen- trations were quite high, it is probable that the rate of phosphate flux was limiting bacterioplankton growth (Kuparinen & Heinanen 1993, Zweifel et al, 1993). At low phosphate concentrations, bacterioplankton cells are superior competitors compared to phytoplankton cells (Currie & Kalff 1984a, b, Coveney & Wetzel1992, Glide et al. 1992, Rothhaupt & Glide 1992) but, accord- ing to Rothhaupt & Glide (1992), even very small phos- phate pulses result in a shift of phosphate uptake from
242 Mar. Ecol. Prog. Ser. 116: 233-245, 1995
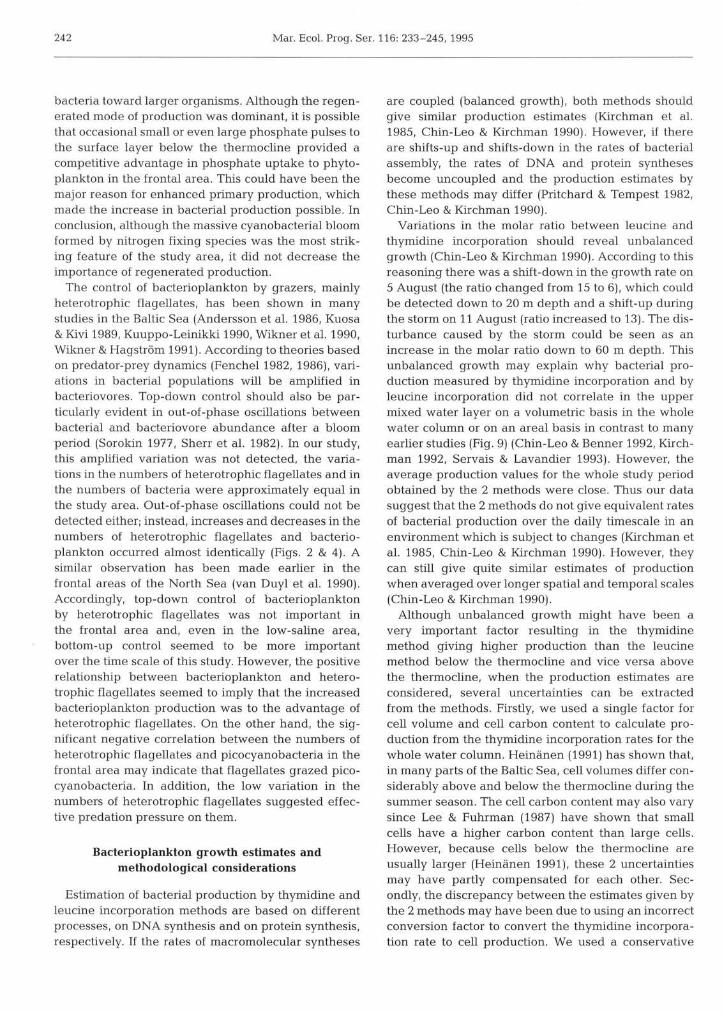
bacteria toward larger organisms. Although the regen- erated mode of production was dominant, it is possible that occasional small or even large phosphate pulses to the surface layer below the thermocline provided a competitive advantage in phosphate uptake to phyto- plankton in the frontal area. This could have been the major reason for enhanced primary production, which made the increase in bacterial production possible. In conclusion, although the massive cyanobacterial bloom formed by nitrogen fixing species was the most strik- ing feature of the study area, it did not decrease the importance of regenerated production.
The control of bacterioplankton by grazers, mainly heterotrophic flagellates, has been shown in many studies in the Baltic Sea (Andersson et al. 1986, Kuosa & Kivi 1989, Kuuppo-Leinikki 1990, Wikner et al. 1990, Wikner & Hagstrom 1991). According to theories based on predator-prey dynamics (Fenchel 1982, 1986), vari- ations in bacterial populations will be amplified in bacteriovores. Top-down control should also be par- ticularly evident in out-of-phase oscillations between bacterial and bacteriovore abundance after a bloom period (Sorolun 1977, Sherr et al. 1982). In our study, this amplified variation was not detected, the varia- tions in the numbers of heterotrophic flagellates and in the numbers of bacteria were approximately equal in the study area. Out-of-phase oscillations could not be detected either; instead, increases and decreases in the numbers of heterotrophic flagellates and bacterio- plankton occurred almost identically (Figs. 2 & 4). A similar observation has been made earlier in the frontal areas of the North Sea (van Duyl et al. 1990). Accordingly, top-down control of bacterioplankton by heterotrophic flagellates was not important in the frontal area and, even in the low-saline area, bottom-up control seemed to be more important over the time scale of this study. However, the positive relationship between bacterioplankton and hetero- trophic flagellates seemed to imply that the increased bacterioplankton production was to the advantage of heterotrophic flagellates. On the other hand, the sig- nthcant negative correlation between the numbers of heterotrophic flagellates and picocyanobacteria in the frontal area may indicate that flagellates grazed pico- cyanobacteria. In addition, the low variation in the numbers of heterotrophic flagellates suggested effec- tive predation pressure on them.
Bacterioplankton growth estimates and methodological considerations
Estimation of bacterial production by thymidine and leucine incorporation methods are based on different processes, on DNA synthesis and on protein synthesis, respectively. If the rates of macromolecular syntheses
are coupled (balanced growth), both methods should give similar production estimates (Kirchman et al. 1985, Chin-Leo & Kirchrnan 1990). However, if there are shifts-up and shifts-down in the rates of bacterial assembly, the rates of DNA and protein syntheses become uncoupled and the production estimates by these methods may differ (Pritchard & Tempest 1982, Chin-Leo & Kirchman 1990).
Variations in the molar ratio between leucine and thymidine incorporation should reveal unbalanced growth (Chin-Leo & Kirchman 1990). According to this reasoning there was a shift-down in the growth rate on 5 August (the ratio changed from 15 to 6), which could be detected down to 20 m depth and a shift-up during the storm on 11 August (ratio increased to 13). The dis- turbance caused by the storm could be seen as an increase in the molar ratio down to 60 m depth. This unbalanced growth may explain why bacterial pro- duction measured by thymidine incorporation and by leucine incorporation did not correlate in the upper mixed water layer on a volumetric basis in the whole water column or on an areal basis in contrast to many earlier studies (Fig. 9) (Chin-Leo & Benner 1992, Kirch- man 1992, Servais & Lavandier 1993). However, the average production values for the whole study period obtained by the 2 methods were close. Thus our data suggest that the 2 methods do not give equivalent rates of bacterial production over the daily timescale in an environment which is subject to changes (Kirchman et al. 1985, Chin-Leo & Kirchman 1990). However, they can still give quite similar estimates of production when averaged over longer spatial and temporal scales (Chin-Leo & Kirchman 1990).
Although unbalanced growth might have been a very important factor resulting in the thymidine method giving higher production than the leucine method below the thermocline and vice versa above the thermocline, when the production estimates are considered, several uncertainties can be extracted from the methods. Firstly, we used a single factor for cell volume and cell carbon content to calculate pro- duction from the thymidine incorporation rates for the whole water column. Heinkinen (1991) has shown that, in many parts of the Baltic Sea, cell volumes differ con- siderably above and below the thermocline during the summer season. The cell carbon content may also vary since Lee & Fuhrman (1987) have shown that small cells have a higher carbon content than large cells. However, because cells below the thermocline are usually larger (Heinkinen 1991), these 2 uncertainties may have partly compensated for each other. Sec- ondly, the discrepancy between the estimates given by the 2 methods may have been due to using an incorrect conversion factor to convert the thymidine incorpora- tion rate to cell production. We used a conservative

Heinanen et al.: Growth of bacterioplankton during a cyanobacterial bloom 243
factor of 1.1 x lo1* cells m o l l in the lower range of published factors for the Gulf of Finland (Kuparinen & Kuosa 1993). The same factor was used in all samples. To our knowledge, there are no published conversion factors derived from the water layers below the ther- mocline in the Baltic Sea and, even in other sea areas, most conversion factor experiments are performed using surface water. Thus it was difficult to determine whether different conversion factors should have been used for the samples below the thermocline.
The turnover rates of bacterial numbers (calculation based on thymidine method and cell abundance) were greater in the samples below the thermocline than in the UML. This seemed to be unrealistic and indicated that the conversion factor was too high for the bacterio- plankton in the deeper layers or too low for the bac- terioplankton in the UML. In addition, according to the molar ratios, the growth of bacterioplankton below the thermocline seemed to be balanced and the 2 methods should have given similar production estimates in this water layer. If we had chosen a higher conversion factor to be used for the UML samples and a lower one for the samples below the thermocline, the areal esti- mates of bacterial production calculated from the thymidine and leucine methods would have shown a better correlation. However, when this matter was investigated thoroughly, it became clear that thymi- dine incorporation per cell (a parameter not influenced by a conversion factor) was highest at 60 m depth and was also higher at 40 and 90 m depth than in the UML. This implied that a higher, rather than lower, conver- sion factor should have been used for thymidine incor- poration below the thermocline than in the UML. This can only be explained by the sedimenting bloom pro- viding good growth conditions for heterotrophic bac- teria below the thermocline allowing them to multiply vigorously. It is concluded that estimates of bacterial production in deep, multilayer seas may be strongly biased, if conversion factors from the surface water are used throughout the water column and efforts should be made to determine conversion factors in other than the surface water layer.
We performed saturation level experiments in differ- ent water parcels which indicated that the saturation level was lower than the concentration of leucine we used for incorporation measurements and, hence, that isotope dilution did not occur. However, saturation levels were not checked from every sample and the kinetic approach was not used in the leucine incorpo- ration measurements as recommended by van Looij & Riemann (1993) and thus there is a small possibility that occasionally we might have used levels of leucine below the saturating concentration. Because no dilu- tion factor was used, the leucine incorporation-based production estimates are conservative.
In spite of these methodological problems, the trend of leucine incorporation-based production being higher in the UML and thymidine incorporation-based production higher below the thermocline indicated that bacterial growth in the UML was primarily to increase biomass by increasing biovolume and below the thermocline to increase biomass by increasing the number of cells. This is opposite to the usual late sum- mer situation, when the cells are generally numerous but very small in the UML and relatively few but large in size below the thermocline (Heindnen 1991). This episode was made possible in the UML by decreased grazing pressure on bacterioplankton, which is usually highest on largest cells, and by decaying bloom pro- viding nutrients; and in the water layers below the thermocline by the sedimenting bloom. Thus the frontal activity markedly changed bacterioplankton growth patterns, although it did not change the rela- tive importance of regenerated production.
Acknowledgements We thank the Finnish Institute of Marine Research, the Academy of Finland, and the Maj and Tor Nessling Foundation for funding this study The analysis of water masses was done by Sulev Nommann, Juss Pavelson and Jaan Laanemets from the Estonian Marine Institute. Finally, we greatly appreciate the shipboard and laboratory assistance of Maija Huttunen, Markku Jansson, T m o Laitinen, Pirkko Lemponen, Terttu Someroja, Pirjo Tikkanen and Tuovi Vartio.
LITERATURE CITED
Andersson, A., Larsson, U , Hagstrom, A (1986). Size- selective grazing by a microflagellate on pelagic bac- teria. Mar. Ecol. Prog. Ser 33: 51-57
Autio, R. M. (1990). Bactenoplankton in filtered brackish water cultures: some physical and chemical parameters affecting community properties. Arch. Hydrobiol. 117: 437-451
Azam, F., Fenchel, T., Field, J . G., Gray, J S., Meyer-Reil, L. A,, Thingstad, F. (1983) The ecological role of water-column microbes in the sea. Mar. Ecol. Prog. Ser. 10: 257-263
BMEPC (1988). Guidelines for the Baltic monitoring pro- gramme for the third stage. Baltic Sea Environment Pro- ceedings No. 27D Baltic Marine Environment Protection Commission, Helsinki
Bjernsen, B. K. (1986). Automatic determination of bacterio- plankton biomass by image analysis. Appl. environ. Microbiol. 51: 1199-1204
Chin-Leo, G., Benner, R. (1992). Enhanced bacterioplankton production and respiration at intermediate salinities in the Mississippi River plume. Mar. Ecol Prog. Ser. 87. 87-103
Chin-Leo, G., Kirchman, D. L. (1990). Unbalanced growth in natural assemblages of marine bacterioplankton. Mar. Ecol. Prog. Ser. 63: 1-8
Cole, J . J., Findlay, S., Pace, M. L. (1988) Bacterial production in fresh and saltwater ecosystems: a cross-system over- view. Mar. Ecol. Prog. Ser. 43: 1-10
Coveney, M. F., Wetzel, R. G. (1992). Effects of nutrients on specific growth rate of bacterioplankton in ohgotrophic lake water cultures. Appl. environ. Microbiol, 58: 150-156


Heinanen et al.: Growth of bacterioplankton during a cyanobacterial bloom 245
sive anthropogenic action. Oceanol. Acad. Sci. U.S.S.R. 22: 555-559
Malkki, P., Tamsalu, R. (1985). Physical features of the Baltic Sea Finn. mar. Res. 252: 1-110
McManus, G. B., Fuhrman, J. A. (1988) Control of marine bacterioplankton populations: measurement and signifi- cance of grazing. Hydrobiologia 159: 51-62
Nielsen, G. A,, Bresta, A.-M (1984). Guidelines for the meas- urement of phytoplankton primary production, 2nd edn. The Baltic Marine Biologists Publ. No. 1. Marine Pollution Laboratory, Charlottenlund
Nommarm, S. (1990) Physical control of phytoplankton growth in the Baltic Sea A multitude of spatio-temporal scales. Ph.D. thesis, Dept. Systems Ecol, University of Stockholm
Nbmmann, S , Kaasik, E. (1992) Hydrodynamical control of phytoplankton succession during the vernal light-limited phase in the Baltic Sea. Mar. Ecol. Prog. Ser 84: 279-292
Pocklington, R. (1986). The Gulf of St. Lawrence and the Baltic Sea: two different organic systems. Dtsch. hydrogr. Z. 39: 65-75
Pntchard, R. H., Tempest, D. W (1982). Growth: cells and populations. In Mandelstam, J. McQuillen, K., Dawes, I. (eds.) Biochemistry of bacterial growth, 3rd edn. Blackwell Scientific Publications, Oxford, p 99-123
Riemann, B., Bj~irnsen, B K., Newell, S., Fallon, R (1987). Calculation of cell production of coastal marine bacteria based on measured incorporation of (H)thymidine. Lim- nol. Oceanogr. 32: 471-476
Rothhaupt, K. O., Gude, H. (1992). The influence of spatial and temporal concentrations gradients on phosphate partitioning between different size fractions of plankton' further evidence and possible causes. Limnol. Oceanogr. 37: 739-749
Servais, P. Lavandier, P. (1993). Consistency between bac- terial productions estimated from 3H-thymidme and 3H- leucine incorporation rates in natural freshwaters. C.r. Acad. Sci., Paris, S6r. 3, 316: 642-646
Sherr, B. F , Sherr, E. B , Berman, T. (1982). Decomposition of organic detritus, a selective role for microflagellate proto-
This article was submitted to the editor
zoa. Limnol. Oceanogr. 27: 765-769 Shiah, F.-K., Ducklow, H. W. (1994). Temperature and sub-
strate regulation of bacterial abundance, production and specific growth rate in Chesapeake Bay, USA. Mar Ecol Prog. Ser. 103: 297-308
Simon, M., Azam, F. (1989). Protein content and protein syn- thesis rate of planktonic marine bacteria. Mar Ecol. Prog Ser 51- 201-213
Sorokm, Y. I. (1977). The heterotrophic phase of plankton succession in the Japan Sea. Mar. Biol. 41: 107-117
Stigebrandt, A,, Wulff, F. (1987) A model for the dynamics of nutnents and oxygen in the Baltic Proper. J. mar. Res. 45' 729-759
UNESCO (1981). Background papers and supporting data on the practical salmty scale 1978. UNESCO Tech. Pap. Mar. Sci. 37: 1-44
van Duyl, F. C., Bak, R. P. M., Kop, A. J., Nieuweland, G. (1990). Bacteria, auto- and heterotrophic nanoflagellates, and their relations in mixed, frontal and stratified waters of the North Sea. Neth. J. Sea Res. 26- 97-109
van LOOI], A,, Riemann, B. (1993). Measurements of bactenal production in coastal marine environments using leucine: application of a kinetic approach to correct for isotope dilution. Mar. Ecol. Prog. Ser. 102: 97-104
Wikner, J., Hagstrom, A. (1991). Annual study of bacteno- plankton community dynamics. Limnol. Oceanogr 36: 1313-1324
Wikner, J., Rassoulzadegan, F., Hagstrom, A. (1990). Periodic bacterivore activity balances bacterial growth in the marine environment. Limnol. Oceanogr. 35. 313-324
Williams, P. J leB. (1981). Incorporation of microheterotrophc processes into the classical paradigm of the planktonic food web Kieler Meeresforsch. Sonderh. 5: 1-28
Wright, R. T , Coffin, R. B. (1984). Measuring microzoo- plankton grazing on planktonic marine bacteria by its impact on bactenal production Microb. Ecol. 10 137-149
Zweifel, U. L., Norrman, B., Hagstrom, A. (1993). Consump- tion of dissolved organic carbon by marine bacteria and demand for inorganic nutnents. Mar. Ecol Prog. Ser. 101: 23-32
Manuscript first received: April 26, 1994 Revised version accepted: September 16, 1994