natural resources, development models and sustainable...
TRANSCRIPT

Natural Resources, Development Models and Sustainable Development
Richard M Auty
ENVIRONMENTAL ECONOMICS PROGRAMME
Discussion Paper 03-01
June 2003
International Institute for Environment and Development (IIED) IIED is an independent, non-profit research institute working in the field of sustainable development. IIED aims to provide expertise and leadership in researching and achieving sustainable development at local, national, regional, and global levels. In alliance with others we seek to help shape a future that ends global poverty and delivers and sustains efficient and equitable management of the world’s natural resources. Environmental Economics Programme The Environmental Economics Programme (EEP) seeks to develop and promote the application of economics to environmental issues in developing countries. This is achieved through research and policy analysis on the role of the environment and natural resources in economic development and poverty alleviation. The Author Richard M Auty is Professor of Economic Geography at the University of Lancaster. Correspondence should be addressed to: R M Auty Lancaster University Lancaster LA1 4YB, UK 044-1524-593751 044-1524-847099 [email protected] Acknowledgements Grateful thanks are due to the Royal Danish Ministry of Foreign Affairs (Danida) for providing funding for this research. Additional support for publication of this report was provided by the Swedish International Development Cooperation Agency (Sida). Copies of this report are available from: Earthprint Limited, Orders Department, P.O. Box 119, Stevenage, Hertfordshire SG1 4TP, UK; Email: [email protected]. Enquiries: tel +44 (0)1438 748111; fax +44 (0)1438 748844; Email [email protected]. This report is available in pdf format at www.iied.org/eep or from [email protected].
Contents 1. Introduction 1
2. Basic Macro and Micro Policies for
Sustainable Resource Management 2 3. Natural Resources, the Political State and Policy Failure 4 4. Managing Renewable Resources 6 5. Managing Finite Resources 9 6. Managing the Global Pollution Sinks 11 7. Conclusions and Main Policy Implications 15 8. References 16
Abstract This paper starts out from the optimistic assumption that the basic policies for environmental economic development are known but uncertainties surround the speed of their adoption. In many developing countries the key obstacle is poor governance: consequently, renewable resources continue to be mined, non-renewable resources are depleted irresponsibly, and reductions in pollution intensity lag. Recent research identifies resource abundance as an important cause of policy failure. This is because the primary sector remains large in relation to GDP so that differences in the scale of natural resource rents (and in their socio-economic linkages) condition macro policy in important ways. Most developing countries are resource-rich, a condition that engenders predatory political states that deploy resource rents in ways that cumulatively distort the economy so it falls into a staple trap, which undermines economic growth and environmentally sustainable policies. Sound macroeconomic policy is critical to the success of microeconomic measures like much of environmental policy, a fact often neglected by environmental reformers. There are two implications of this. First, in the long term, improved governance will enhance environmentally sustainable management of: renewable resources (by taking account of the total economic value of resources); finite resources (guided by the need to maintain genuine saving); and the global pollution sinks (by flattening the environmental Kuznets curve). Second, until such improvements occur, environmental policies are likely to under-perform unless they are adapted to take account of flawed macro policies. Environmental reformers therefore need to support efforts by the international financial institutions to improve macroeconomic management.
1
1. Introduction This paper starts from the optimistic premise that the basic economic policies for sustainable development are known and that it is policy implementation that raises most controversy. In the advanced (knowledge) economies the controversy revolves around the speed of the response to environmental issues, because the faster and more abrupt the response, the greater the costs that the present generation must bear. The dispute is rooted in uncertainty about the capacity of technology to resolve future environmental problems (Birdsall and Steers 1993) and also in ethical concerns regarding inter-generational obligations. In contrast, the principal obstacle to environmentally sustainable policies in the developing countries is that of government failure to promote economic and environmental policies that have clearly established benefits. This paper is concerned with the obstacles to sustainable development in the developing countries. It identifies the mismanagement of natural resource abundance as a key cause of macroeconomic policy failure, which adversely affects all aspects of micro policy, including environmental policy. It goes on to suggest that many analyses of environmental problems in the developing countries neglect how macroeconomic failure affects policies that are implemented at the micro level, and as a consequence such analyses risk misdiagnosing the effectiveness of those policies and the reforms required. There is increasing evidence that because the primary sector remains important in low income countries, the scale of the natural resource rents and the socio-economic linkages that they generate affect the aims of the government and the development trajectory of the economy in important ways (Sachs and Warner 1995a and 1995b, Karl 1997, Ascher 1999, Ross 1999, Auty 2001). In particular, since the 1960s the resource-poor countries have tended to spawn developmental political states that pursued a trajectory of competitive industrialisation characterised by high and rising genuine saving rates, which indicate strong economic and environmental sustainability. Those same countries have tended to strengthen their social capital, formal institutions and political accountability, so that their development policies are also becoming socially more sustainable (Woolcock et al. 2001). In contrast, natural resource abundance has been associated with predatory political states that distort their economies so that the development trajectory is one that becomes locked in a staple trap of increasing dependence on a primary sector with diminishing competitiveness. Such economies are vulnerable to a growth collapse that causes all forms of capital, including social capital, to run down, and from which recovery has proved to be protracted and may take generations. There are, however, sufficient anomalies among the resource-abundant countries (including Botswana, Chile, pre-1997 Indonesia and Malaysia) to suggest that this outcome is not a deterministic one. This paper explains how differences in the natural resource endowment affect policy in the developing countries and spells out the implications for improvements in environmental policy and sustainable development. The paper is structured as follows. The next section, section two, sets out the basic macro- and microeconomic policy requirements for environmentally sustainable development. Section three demonstrates how natural resource abundance can undermine these requirements

2
by adversely conditioning government aims. The next three sections then explain the consequences of macro policy failure, and offer solutions, for each of the three principal sets of natural resources, namely renewable (section four), fund (section five) and the pollution sinks (section six). The conclusion summarises the argument and draws the main policy implications. 2. Basic Macro and Micro Policies for Sustainable Resource
Management Post-war development policies experienced a sharp discontinuity around 1980, when the international financial institutions (IFIs) spearheaded efforts to reduce the role of government and refocus it. During the first three decades after the Second World War many developing countries increased their commitment to forced industrialisation and cumulatively distorted their economies, resembling the centrally planned economies in that respect (Auty and Mikesell 1998). Forced industrialisation grew out of the sharp contraction of the world trade system in the 1930s and 1940s. It spawned a growing controversy among development economists with respect to the contribution of primary commodity exports to growth. Structuralists like Prebisch (1964) projected a downward trend in the terms of trade for primary commodities in relation to manufactured goods imported by the developing countries. He argued that any increase in productivity in primary commodity production accrues to industrialised countries, whereas productivity increases in industrial countries result in higher wages and profits in those countries rather than a decrease in the prices of manufactures imported by the developing countries. Therefore, he concluded that the developing countries should accelerate industrialisation by protecting 'infant' industry geared to supplying the domestic market. The structuralist economists favoured planning and the non-market allocation of resources achieved through a variety of controls and also government incentives for domestic investment, prices, and foreign trade. This approach tended to dominate development theory during the decades 1950 to1980. The structuralist ideas were opposed by mainstream economists such as Bauer and Yamey (1957) and MacBean (1966) who accepted the doctrine of comparative advantage, and argued that primary commodity exports are the only way that countries in the early stages of development can generate the foreign exchange necessary to pay for essential imports and to service external debt. Also, an expansion of trade attracts foreign investment and the transfer of modern technology. Growth is therefore maximised by maintaining free internal and external markets for goods, and by allocating capital in free capital markets. A basic weakness in the case made by the structuralists and development planners is that it underestimated the capacity of developing country governments to misallocate resources and impair both domestic and foreign investment (Lal 1983). With the benefit of hindsight, the unexpectedly high risk of policy failure suggests that developing country governments should confine their effort to creating an enabling environment, focusing their economic activities on fiscal, monetary and exchange rate policies for stabilising domestic prices and preventing balance of payments disequilibria. However, they should also intervene to correct market failure arising either from the inability of investors to capture the full gains of their

3
investment, as in large-scale infrastructure investments and education, or the failure of producers to absorb the full costs of their activity, as with the environment. This argument gained strong support as a result of growth collapses in the more distorted developing countries during the 1970s and the phenomenal growth of the East Asian newly industrialised countries, which followed relatively liberal economic policies, although their governments did intervene to encourage investment in emerging comparative advantage (Sachs 1985). The, unjustly, much-maligned Washington consensus (Williamson 1996, 14-15) provides a useful summary of the basic policy measures required to achieve an enabling environment. Briefly, it argues that governments need to: maintain fiscal discipline by broadly matching public expenditure to a healthily
diversified tax base; direct public expenditure away from administration, defence, ad hoc subsidies
and white elephant mega-projects towards neglected areas offering high returns, notably those that improve asset distribution such as education, health and social infrastructure;
secure property rights without excessive costs, including rights for the informal sector;
maintain a competitive exchange rate and remove domestic price distortions, including subsidies that encourage wasteful over-consumption;
promote competitive markets, including efficient financial markets that facilitate entry by domestic and foreign firms and enhance the efficient allocation of investment.
During the 1990s, some movement occurred in favour of placing more direct emphasis on poverty alleviation by, for example, pro-poor asset redistribution and targeting public transfers more tightly towards those in need (Williamson 1996, 18). The creation of an enabling economic environment should align a country's investment with its underlying comparative advantage, thereby improving the use of scarce capital and human resources so that economic growth rates recover. Rapid economic growth with open trade encourages the adoption of new technology, which seeks to improve resource use efficiency and to curb pollution (Birdsall and Wheeler 1992). This process is helped by the removal of domestic price distortions such as subsidies that encourage the wasteful consumption of energy, fertiliser and irrigation water. In addition, the negative externality costs that arise from air and water pollution, can be reduced by incorporating the cost of damage to health and the environment into prices through appropriate economic instruments (such as taxes, charges or marketable permits) or, usually as a second best solution, by emission targets managed by government command-and-control. Developing countries have much to lose by waiting for their incomes to rise before curbing environmental damage and the wasteful use of natural resources. It is the basic thesis of this paper that environmental policies can be adopted earlier and more effectively if environmental policy makers are more informed about the capacity of governments to sustain sound macro and micro policies, including environmental policies. A prerequisite for this improvement in performance is an understanding of the causes of policy failure in low-income countries.
4
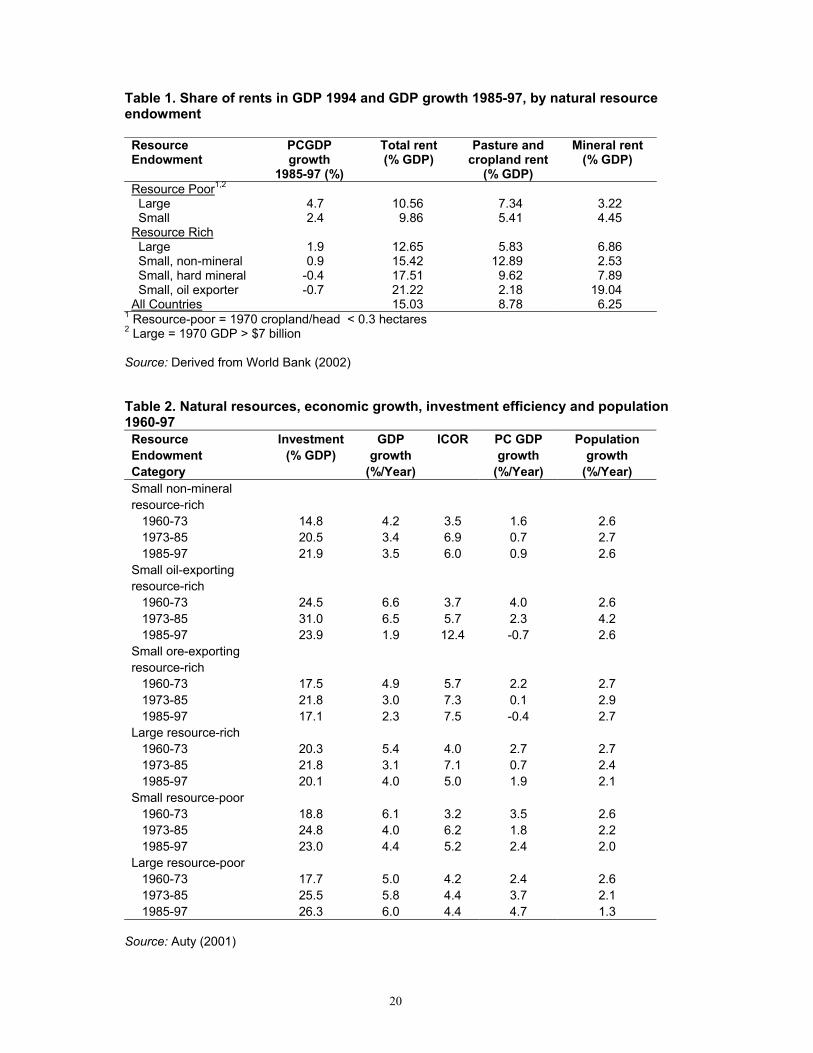
3. Natural Resources, the Political State and Policy Failure An abundance of natural resources should accelerate economic development because it increases exports so that more capital goods can be imported to build up the economy, and also because the natural resource rents (returns in excess of those required by an efficient producer) can be used to boost capital investment. This, along with the capacity to benefit from the redeployment of labour into more productive activity and the closure of the technology gap with the knowledge economies, creates the conditions for rapid convergence in per capita incomes. Indeed, some countries, most of them resource-poor and including China since 1978 and more recently India, and comprising 54 per cent of the developing country population (World Bank 2002), have been doing that. However, the resource-rich countries, which predominate in Latin America, sub-Saharan Africa and the Arab world, although less populous, are more numerous and many of them have fallen behind. In fact, since the mid-1980s per capita income growth in the developing countries has been inversely related to the share of natural resource rents in GDP (Table 1). The mineral-driven economies had the highest rents, and the weakest economic growth: nature's gift of natural resource abundance has been a curse rather than a blessing (Gelb and Associates 1988). There are two main reasons for the superior performance of the resource-poor countries in recent decades. The first is that they have been more likely than resource-rich countries to foster developmental political states that possess both the autonomy to pursue coherent policies and the aim of raising the welfare of the entire population. The second reason is that resource-poor countries diversify their economies earlier than the resource-rich countries into competitive manufacturing and this brings high, and more importantly, efficient, investment. These outcomes can be distilled into two contrasting models: the competitive industrialisation model and the staple trap model (Auty and Gelb 2001). The competitive industrialisation model is associated with resource-poor countries and developmental political states whereas the staple trap model is linked to resource abundance and predatory political states. More specifically, developmental political states have been associated with resource-poor countries because the absence of rents gives their governments a stronger incentive than their resource-rich counterparts to generate wealth by providing public goods and promoting efficient investment rather than by capturing natural resource rents. In addition, limited scope for primary product exports causes resource-poor countries to commence competitive industrialisation at a low level of per capita income. Much of the manufacturing is for export and low wages result in it initially being labour-intensive. The combination of a developmental political state with an early start on competitive labour-intensive industrialisation triggers virtuous interlocking economic and social circles that sustain rapid and equitable economic growth. The experience of resource-poor countries as diverse as South Korea, Hong Kong and Mauritius is summarised by the competitive industrialisation model. The virtuous economic cycle of the competitive industrialisation model is rooted in the resource-poor countries' early start on industrialisation, which accelerates their rate of urbanisation. This, in turn, speeds passage through the demographic cycle so
5
that population growth slows and the number of dependants (children and pensioners) that each worker supports falls. This increases the rate of saving and investment, pushing the latter above 25 per cent of GDP (Table 2). Moreover, exposure to global competition helps to sustain the efficiency of domestic investment so that economic growth is rapid and per capita GDP can double each decade. In addition, manufacturing is initially labour-intensive and rapidly absorbs surplus rural labour so that labour shortages create pressure for wage increases. This prompts diversification into more skill-intensive and capital-intensive industry that can pay an increasingly expensive workforce by making the workers more productive. The resulting competitive economic diversification strengthens the economy's resilience to shocks. The virtuous social cycle is based on the fact that the labour shortages put a floor under the wages of the poor, while the rapid accumulation of skills puts a ceiling on the skill premium, which gives a relatively equitable income distribution. Meanwhile, early urbanisation creates a hierarchy of markets that not only facilitates trade but also dilutes the anti-innovation effect of bonding (local) social capital by extending social networks out to the regional and national level. The combination of equitable income distribution and strengthening social capital fosters trust, which lowers transaction costs and further boosts investment efficiency. As noted below in section five, the resource-poor countries tend to have rising positive genuine saving rates, which indicate strong sustainability. In contrast, the disappointing development since the 1970s of many (but not all) countries in Latin America, sub-Saharan Africa and the Arab world is linked to the fact that most are resource-rich and their development trajectories tend to follow the staple trap model. Natural resources allow governments to win political support by capturing and distributing the rents, so they neglect wealth creation. In this way, a longer reliance on primary product exports engenders predatory political states rather than developmental ones. It also delays competitive industrialisation so that urbanisation is retarded, the demographic cycle is delayed and each worker must support more dependants. The rate of saving therefore increases more slowly than in resource-poor countries. Meanwhile, the lag in labour-intensive manufactured exports causes surplus labour to persist in rural areas, while skills accumulate more slowly. This heightens income inequality and social tensions. Fears of unemployment cause resource-rich governments to deploy the rents to force industrialisation or to expand government services, both of which tend to use labour and capital inefficiently. A protected sector of industry and bureaucracy grows, forcing the government to squeeze more and more rent from farms and mines to support it. These transfers eventually outstrip the natural resource rents and absorb the return to capital, destroying incentives for efficient investment within the primary sector. In this way, the resource-abundant economy becomes locked into a staple trap in which parasitic protected industry and an over-expanded bureaucracy siphon revenue from a primary sector whose competitiveness and relative size both wane as government policies blunt incentives. The result is a weakened economy that is vulnerable to a growth collapse. The price shocks of the 1970s triggered growth collapses in most resource-rich countries (Table 1), whether large like Brazil, Mexico, Nigeria and the Philippines or small, ranging down from Venezuela through Zambia to Papua New Guinea.
6
Fortunately, the relationship between natural resource rents and type of political state is not a deterministic one. A handful of resource-abundant countries spanning quite different cultures and including Botswana, Chile, Indonesia and Malaysia spawned developmental political states. In such cases, the longer reliance on primary products merely postpones competitive industrialisation. The key to successful development therefore lies in discouraging predatory political states by strengthening sanctions against anti-social governance so that coherent economic policies can be pursued that sustain rising incomes and curb environmental damage. The next three sections review these policies for each of the three principal categories of natural resources: renewable resources, finite resources and the global pollution sinks. 4. Managing Renewable Resources This section surveys the optimistic views of many mainstream economists about socio-economic adjustment to increasing demands on renewable resources. It notes their neglect of the risks of government and market failure in developing countries, examples of which are presented for farming and rain forest management. Finally, it advances the concept of total economic value as a useful tool for correcting resource mismanagement. Boserup (1965) argues that increasing population pressure on land will be self-correcting because an initial fall in living standards causes farmers to seek to regain their earlier lifestyle by making social and technical changes to systems that may have lasted centuries. Change then becomes inbuilt to the system so that fallow periods in shifting cultivation are steadily shortened, eventually giving way to sedentary rain-fed farming, with appropriate adjustments to soil types. Further population pressure may subsequently be met by recourse to irrigation, which raises yields by improving control over the timing of farm operations. Thereafter, green revolution techniques applied to irrigated farming systems intensify yields still further while concerns for over-use of chemical fertilisers and pesticides encourage recourse to biological substitutes (Bray 1994). As an example, Tiffen and Mortimore (1994) report the recovery of production on land in Machakos, Kenya that was already degraded by population pressure in the 1930s. The key was land use change so that instead of each farm growing a range of subsistence crops irrespective of physical conditions, farmers specialised and matched their crops to slope and soil. A critical component in such stories of successful agricultural adaptation is access to markets to allow crop specialisation (Goldman 1993). Where markets are repressed or missing, as under excessive intervention by a predatory government or following a growth collapse, farmers become trapped in subsistence with insufficient land resources. The threat of starvation shortens time horizons and leads to the unsustainable management of natural resources. The capacity of the government to manage the economy in a way that facilitates the division of labour is therefore critical (Lipton 1997). It is possible to conceive of a variant on the Environmental Kuznets Curve (EKC) in which pressure on land resources first intensifies and then eases as per capita incomes rise (Scherr 1997). Within such a land EKC the agricultural frontier first expands until
7
land scarcity encourages substitution of land, first by labour, and later increasingly by capital (Binswanger and Pingali 1987). As income levels rise further, population growth slows and demand for agricultural products slows with it. However, cropping continues to intensify so that land is increasingly released for recreational and conservation uses (Mitchell 1997, 50-51; Lofdhal 2002, 95). This self-correcting sequence will be aborted, however, so that soil degradation will occur if maladroit macroeconomic policies fail to improve rural infrastructure, or to generate sufficient jobs in non-farm employment to absorb surplus rural labour and curb population growth, or to earn sufficient foreign exchange to maintain supplies of essential farm inputs. The cumulative distortion and collapse of the economies of many resource-rich countries through the 1960s and 1970s furnishes examples of agricultural regression. Revenue extraction from agriculture was especially damaging in sub-Saharan Africa: Krueger (1993) found that direct agricultural taxation there averaged 25 per cent of crop revenues, some four times that of Latin America and ten times that of Asia. The figure for sub-Saharan Africa doubles when indirect taxes, such as overvalued exchange rates, are added. Such maladroit policies pushed farmers back into subsistence. For example, in order to subsidise urban workers, the Ethiopian government drastically cut farm revenue by a combination of under-pricing domestic food purchases and overvaluing the exchange rate to reduce the cost of imported food. This triggered a vicious downward spiral as returns to farming fell and men migrated to the city in search of jobs. This migration simultaneously increased the work burden on rural women and children and raised the demand for urban fuel. Unable to pay higher prices for imported oil-based fuels, the poorer urban groups turned to local fuel supplies. Farmers then found it more profitable to sell crop residue and dung for urban fuel than to use it to replenish the soil. However, this caused crop yields to deteriorate in a vicious circle of rural impoverishment and environmental degradation (Newcombe 1989). In the absence of a competent government, environmental policies need to be adapted to minimise the damage arising from macroeconomic failure. For example, the World Resources Institute (WRI) (1987, 235) identifies simple measures such as contour ridges and alley cropping that can be undertaken by local people to maintain natural resources and boost output without reliance on the national government. In this context, the recent fashion for 'bottom-up' land use programmes may be a response to macro policy failure rather than to systemic flaws in 'top-down' development. If this is so, environmental planners should recognise that 'bottom-up' policies will also be damaged if farmers become too dependent on assistance from a failing political state. Meanwhile, the WRI suggests that the scope for improved farming practices can eventually be expanded when successful economic reform eliminates overvalued exchange rates and price distortions, like urban food subsidies. The ultimate 'bottom-up' strategy is to nurture effective markets that provide farmers with the information they require to make the most effective use of whatever land, labour and financial resources they can command. Rainforests provide a second important example of how government failure and market failure can turn renewable resources into finite ones. Binswanger (1991) estimates that a hectare of Amazon forest is capable of generating $7,000/yr revenue under its natural state, but only $3,000 in degraded form. He concludes that this is brought about by a combination of three factors; maladroit macroeconomic
8
policy, market failure and micro policies that convert socially unprofitable land uses into privately profitable ones. The failure of successive Brazilian governments to reform the faltering forced industrialisation development strategy or to redistribute land in eastern Brazil led successive governments to turn to the Amazon for solutions (Auty 1994). In order to offset flagging foreign exchange earnings, the government borrowed recycled petrodollars to invest in resource-based projects in the Amazon like the Gran Carajas iron ore mine. However, improved transport links opened up intervening opportunities for settlement of new tracts by both small farmers and large ranchers unfamiliar with tropical rainforest environments. More specifically, macro mismanagement led to chronic inflation in Brazil of 900 to 2,000 per cent from the late 1970s that encouraged wealthier groups to invest in land as an inflation hedge. Micro measures reinforced the returns to such speculation by offering tax credits for up to 75 per cent of cash invested in Amazon projects and subsidised loans for purchasing farm inputs. Tax exemptions on farming also encouraged businessmen to evade taxation by buying land and mis-declaring income from urban business as farm income. These measures were a regressive subsidy from all taxpayers to the rich to remove the forest and replace it with pasture that rapidly lost its nutrition. Small farmers also secured perverse incentives from the government. Small farmers from the east were encouraged to sell their land to businessmen (who could make a higher return using it as a tax shelter) and migrate to the Amazon, an environment that away from the valley bottoms proves hostile to agriculture. However, the newly arrived squatters secured usage rights for public land after one year of occupation and ownership rights after five years. Farmers had an incentive to clear the land to evade taxation because taxes were levied at a higher rate on 'unimproved' farm holdings than on cultivated land. In addition to government failure, market failure also biases incentives against conservation. It does so by preventing forest owners from capturing the financial returns on the various environmental services that are provided by the forest such as soil erosion control, flood prevention, biodiversity and carbon sequestration. A rationale for forest exploitation is provided by the concept of total economic value (TEV), which identifies the worth of conservation benefits. The latter comprise direct use value (sustainable timber plus non-timber products, medicinal value and recreation benefits), indirect use value (nutrient recycling, watershed protection, air pollution reduction and preservation of local micro-climates), the option value of forgoing present uses in order to keep future options open and existence value (the satisfaction of knowing the forest exists even if the recipient never uses it). Correction of market failures should mean that forest removal only occurs if the benefits from development exceed the costs of such development plus the net benefits of conservation foregone (i.e. conservation benefits as identified by TEV, minus conservation costs). Direct value is the easiest component of TEV to determine because markets already exist for such services. However, various techniques allow the estimation of indirect, option and existence values, and ways are also increasingly being found to capture the revenues. For example, Nordhaus (1994) calculates global warming damage at $13/tonne of CO2 in 1989 prices so if emissions from forest burning are 100 tonnes/ha, then the pollution cost per hectare of forest burned is $1,300. Afforestation is estimated to absorb carbon at the rate of 10 tonnes/ha of rainforest, which gives a value to such practices of $130 per hectare. Markets are now beginning to emerge for carbon
9
sequestration that allow industrial polluters to pay farmers and foresters to follow land use practices that offset their pollution. A further example of correcting market failure is provided with regard to existence value, which is measured by 'willingness to pay' studies (contingent valuation). For example, Pearce (1996) estimates from surveys that each member of the 400 million-strong global middle class would pay $8 per year for the existence value of rainforest conservation. That would generate $3.2 billion annually, some 25 per cent of Amazonian GDP, which could be made available to compensate local people for foregoing exploitive activity. The emergence of such missing markets based on mutual self-interest is succeeding where political negotiations and state intervention have failed. 5. Managing Finite Resources Mainstream economists consider that sustainable development based upon the exploitation of finite mineral resources is feasible, despite the apparent contradiction, provided there are practical substitutes for the depleting natural asset. The critical assumption is that sustainability does not require that the natural resource be passed on to future generations. After all, the natural resource may be rendered worthless by the discovery of superior resources elsewhere or technological substitutes. Rather, sustainability requires that the capacity to sustain the income stream from the mineral asset needs to be passed on to future generations. This calls for the income generating capacity of the depleted mineral to be replaced with alternative wealth-generating assets (for example, factories or an educated workforce). At the local level, sustainability requires communities to avoid increasing their dependence on subsidies from the mining sector. Rather, a fraction of the mine receipts should be set aside to provide alternative employment opportunities for the community when mining ceases, and also to restore the environment as close as possible to its pre-mined state, consistent with the benefits of restoration not exceeding the costs (Auty and Mikesell 1998). Yet at the national level matters are not so simple, as shown by the fact that in recent years the mineral economies have performed least well of all the six categories of resource endowment in Table 1. The difficulty arises out of two features of mining. First, it tends to generate mineral rents that are large relative to GDP (Table 1). Second, the socio-economic linkages arising from the capital-intensive production function of mining concentrate the natural resource rents on taxation and therefore on the government. These two features intensify the risk of government and policy failure through over-rapid domestic absorption of the mineral rents whereas more diffuse socio-economic linkages such as those for peasant cash crops, tend to absorb the rents more slowly because the rents are spread across a wider range of economic agents that display a greater propensity to save than governments do (Bevan et al. 1997). Here again, strengthened sanctions against anti-social governance will improve the quality of governance, but environmental and natural resource accounting (EARA) can also help by providing a rationale for sustainable deployment of the mineral rents. EARA recognises that the GNP identity of the standard national accounts (SNA) overstates investment and output because each year some produced (man-made)
10
capital is scrapped (depreciated). This is only partially corrected in the SNA by calculating the net national product (NNP), which equals GNP minus the annual depreciation of produced (man-made) capital. EARA takes this process further. It does so by first accounting for the depletion of finite resources like minerals, to generate ENP1, and then deducting the cost of damage done to environmental services (such as natural pollution absorption capacity), which gives ENP2. The process can be further elaborated by, for example, accounting for changes in the human capital stock (the net effect of educational expenditure) to give the expression: ENP2 = GNP - Dp - Dr - De + E (1) where: ENP2 = environmental national product adjusted for depletion of finite
and environmental resources GNP = gross national product Dp = depreciation of produced assets Dr = depletion of finite natural resource assets De = depletion of environmental assets E = net increase in education The most commonly used measure of finite natural resource depletion is the net price, which calculates the annual depletion coefficient as the total rent (revenue minus all costs of production of an efficient world producer including a risk-related return on investment). However, the net price method tends to overstate the depletion coefficient because convenience usually dictates that the average cost is used rather than the marginal cost. An alternative measure of the depletion coefficient is the 'user cost' that divides the rent into two components: an income component, which can be consumed by the present generation, and a capital component, which must be saved and invested for future generations. The capital component of the rent is defined as the sum invested annually to yield sufficient income to replace the mining income when mining ends. For example, if it is assumed that the rent averages £250,000 per year, the interest rate is 10 per cent and the life of the mine is 20 years, then the annual depletion component is £37,000 and the income component is £213,000. This is because £37,000 when saved and compounded each year at 10 per cent interest over the 20-year life of the mine yields the sum of £2.13 million. This sum, at 10 per cent interest, gives an annual income of £213,000 in perpetuity, equivalent to the annual income during the working life of the mine. There is also no consensus on how to measure the extent and cost of the damage done to the environment, in order to estimate ENP2. The adjustment is usually based on the production foregone from polluted farmland and/or the cost of illnesses and of damage caused to buildings by emissions. Van Tongeren et al. (1991) estimate ENP2 for Mexico in 1985. They calculate ENP1 as 94 per cent of NNP, after deducting 6 per cent of GNP for the value of annual oil depletion and then estimate ENP2 as only 87 per cent of NNP after deducting a further 7 per cent of GNP for the cost of environmental damage (based on the estimated cost of water, air and land pollution). The resulting adjustment to derive ENP2 cuts the level of net investment to -2 per cent of GNP, implying that the Mexican economy in 1985 consumed more capital than it invested and was therefore not on a sustainable path.
11
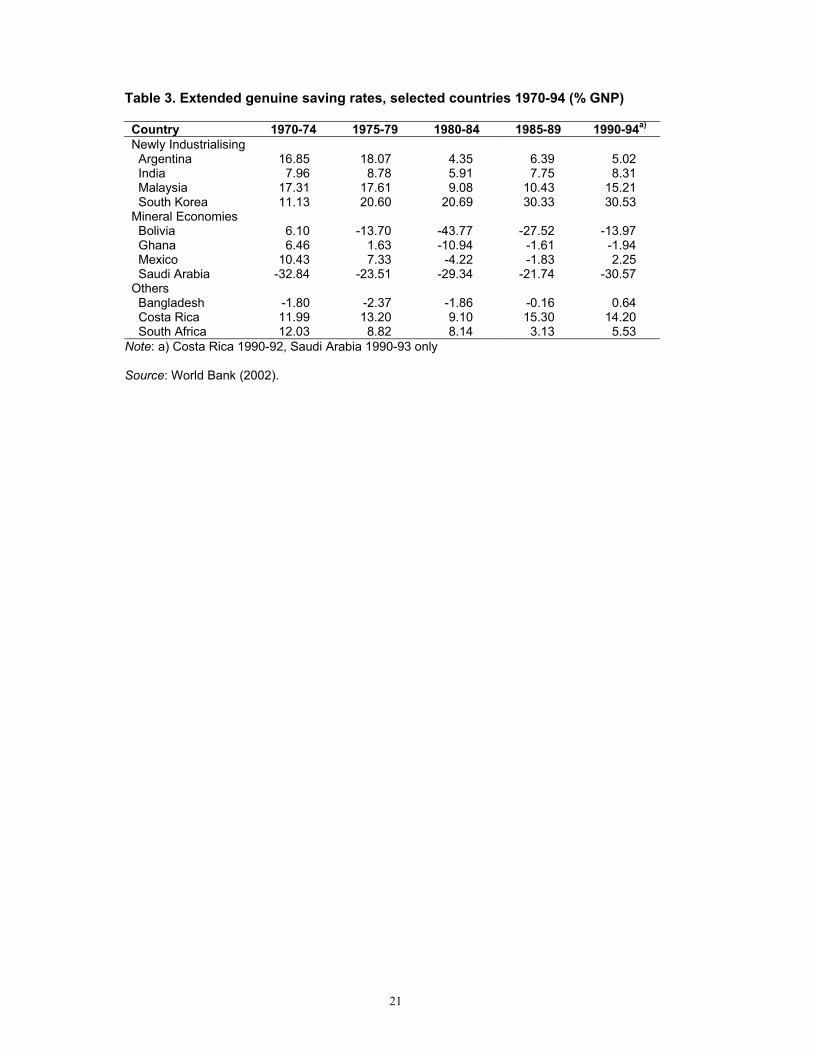
Such calculations have given rise to the concept of genuine saving, which some economists claim as the first available index of the sustainability of an economy. Pearce et al. (1996) argue that for development to be sustainable, ENP2 must not be declining over time. They identify the rate of genuine saving as the critical index of sustainability and define genuine saving as: GS = GNP - C - G - Dp - Dr - De + E (2) where: GS = genuine saving C = private consumption G = government consumption GNP, Dp , Dr , De and E carry the same definitions as (1) above For sustainability, the genuine saving rate must be greater than or equal to the sum of the depreciation of produced capital minus the depletion of finite natural capital minus the degradation of environmental capital. World Bank data for 1970-94 suggests that the newly industrialising countries have high and rising genuine saving coefficients of between 20 and 30 per cent of GNP (Table 3). This reflects the very high rates of saving achieved by those countries, the low importance of finite capital (minerals) in their economies and modest estimates of environmental damage arising from productive facilities that are of recent vintage and so incorporate modern pollution-abating technology. In marked contrast, most oil-exporters as well as the hard mineral economies tend to record either low or negative genuine saving, which implies that they generate part of their wealth from consuming capital and that their development is not sustainable. The key policy implication from EARA is that many resource-rich governments need to shift resources away from consumption and towards investment to competitively diversify the economy away from reliance on the consumption of finite natural resources. 6. Managing the Global Pollution Sinks Evidence began to emerge in the 1980s to suggest that in market economies, the intensity with which energy and materials are used and the rate at which pollutants are emitted, first increases with per capita income and then declines (Bernstam 1991). The resulting EKC, the ‘inverted U-shape’ curve, reflects: changes in economic structure as countries first assemble the infrastructure of
a modern economy and then spend an increasing share of income on services and 'weightless' knowledge activity;
changes in technology designed to alleviate environmental damage; growing preference for a cleaner environment (World Bank 2000).
A World Bank study (1992, 40) speculates that it may be possible to de-link GNP from natural resource use. It notes that, historically, reductions in the use intensity in market economies (but not centrally planned economies) have preceded the increase in government concern for the environment. Subsequent policies adopted to correct the market failure (which undervalued the environmental natural resources used to absorb pollutants) accelerate this process. They rely initially on command-
12
and-control measures but increasingly favour economic instruments, which achieve reductions at less cost to society. Consistent with the EKC, Grossman and Krueger (1995) report evidence of the decline in the pollution intensity of GDP at higher levels of per capita income. For example, the downturn in suspended particulate and SO2 emissions occurs around the per capita income level of $5,000 (measured in 1985 US dollars at purchasing power parity). This approximates to the average per capita income of countries like Malaysia and Mexico in the early 1990s. Other atmospheric pollutants, such as carbon monoxide, carbon dioxide and nitrogen oxides appear to peak at somewhat higher per capita income levels. The turning point for water pollution also appears to occur later at between $8,500 and $11,500 per capita income. Over that range the levels of faecal coliform counts, dissolved oxygen, biochemical oxygen demand (BOD) and nitrate all begin to improve. Subsequent work, however, suggests that matters are less clear-cut (Harbaugh et al. 2002). The inverted U-shape pattern is not universal: levels of toxic metals in rivers appear to fall steeply to around $5,000 per capita income before levelling out or rising slightly and then falling again at $14,000. Moreover, Stern et al. (1995) caution that whereas some emissions such as water pollutants, sulphur and nitrogen oxides appear to decline, others do not appear to do so, including carbon dioxide and solid waste. In addition, the combination of declining pollution intensity with increasing output and a higher fraction of the global population attaining mid income levels, suggests that aggregate global pollution may continue to rise for some decades yet. Consistent with this warning, Hettige et al. (2000) caution, with reference to water pollution, that although increasing per capita income is associated with declining pollution intensity, the very modest decline of the share of polluting industry in GDP at higher incomes combines with continued total GDP growth to hold aggregate pollution steady. Nevertheless, where the domestic political economy permits developing country governments to pursue coherent economic policies, technology allows them to abate pollution at far lower incomes than the advanced economies. In other words, there is scope to flatten the EKC. This is because the EKC is very much an artefact of the specific historical patterns of pollution abatement prior to the 1980s when it was conceived. For example, Reddy and Goldenberg (1990) describe the historical trend in the energy-intensity of GDP, which acts as a proxy for pollution-intensity. They show that whereas the UK, the first industrial nation, experienced a peak energy use of 1.03 tonnes of oil equivalent per $1,000 of GDP in 1880, Germany peaked at 80 per cent of that level in 1920 and Japan at two-fifths of the UK level by 1940. Reddy and Goldenberg suggest the developing countries can match the Japanese level or even improve on it and further flatten the EKC. The main reasons why developing countries deviate from the ‘best practice’ or flattening EKC are related to the natural resource endowment. Syrquin and Chenery (1989) show how the natural resource endowment impacts on industrial structure. For instance, large countries industrialise earlier due to greater ability to capture economies of scale. They also tend to be more self-sufficient (autarkic) than small countries, partly due to their large domestic market but partly through fashionable structuralist policies that sought to curb import dependence. This preference slowed
13
the adoption of resource-conserving technology: Bernstam (1991) reports that insulation from market-sensitive technology and inaccurate price signals arrest, or even reverse, the declining resource-intensity and pollution-intensity of GDP. This implies that a development strategy aligned with a country's resource endowment and using appropriate prices is a pre-requisite for improving the sustainability of its development. In addition, the World Bank (1994) recommends that developing countries embrace presumptive charges (price incentives) over command-and-control measures (government targets) for pollution abatement in order to conserve their scarce administrative resources. The charges are levied on emissions, assuming a given technology and ratio between production volume and emission level. Firms achieving cleaner production become eligible for a rebate. The presumptive charge facilitates pollution abatement at least cost, unlike command-and-control because the individual firm decides whether it is cheapest to pay the charge; to invest in equipment to curb emissions; or to sub-contract treatment to specialist firms (as in the case of waste water in export processing zones in Thailand, for example). Similarly, air-borne emissions could be reduced through presumptive charges and adoption of a rational price structure. For example, Thai fuel taxes were lower on domestic lignite and imported coal than on cleaner fuel oil and diesel. The re-adjustment of taxes to remove the price distortion enhances the incentive both to conserve energy and to use cleaner fuels. The use of scarce administrative resources can also be optimised if charges are initially applied to the largest firms only, using data collected about the output volumes and treatment levels of such firms. For example, research from the Philippines suggests that around 100 large plants account for 60 per cent of pollution. In Thailand a charge of $500 per tonne of BOD was proposed for large producers, with rebates paid if firms demonstrate superior performance. The adoption of such a scheme should halve total BOD. Recognising the lack of trained personnel as a constraint, NGOs can be co-opted to assist in emission monitoring while the training of special environmental police can also help improve enforcement. The targeting of larger firms can also diffuse improved practice. For example, where large firms assemble supplies from small plants, the large firm can be made responsible for the presumed aggregate pollution and so acquire an incentive to encourage improved practice among its suppliers. Such a system appears to be especially suitable for dealing with hazardous waste in metal finishing and electronics, for example. Other measures to reduce emissions from small firms include making local authorities responsible for their emission levels and subsidising technical assistance for abatement reduction (World Bank 1993). It is sometimes argued that low-income countries assign lower priority to a clean environment than to poverty elimination and basic needs. However, this dichotomy is false because new industrialisers can turn their late start to advantage by providing price incentives to adopt the cleanest technology now. For example, given appropriate incentives, a country growing as fast as Indonesia in the 1980s would by 2010 have 85 per cent of its manufacturing capacity with post-1990 vintage technology that would be pollution-abating (Brandon and Raman Kutty 1993). Moreover, there are strong incentives for firms to adopt pollution-abating technology.
14
For example, Chinese firms can cut sulphur pollution for $3/tonne (compared with more than $100/tonne in the US where the earlier cheaper gains from abatement have been won), whereas the benefits in terms of lives saved and health improvement are at least twenty times this expenditure (Mani and Wheeler 1998). Concern that tighter pollution controls in industrial countries drive pollution-intensive industry to seek pollution havens in the developing countries appears unfounded. A test of the hypothesis that advanced countries export pollution is provided by comparing trends in the ratio of imports/exports for polluting industries (steel, non-ferrous metals, non-metallic minerals, pulp and paper, and industrial chemicals). A rate above one indicates greater dependence on imports of polluting industry than exports and is consistent with environmental dumping (the country is a net importer of ‘dirty’ products). In fact, the Japanese ratio did rise sharply after the early 1970s (i.e. the country began importing more 'dirty' products), but it turned down from a peak of 0.95 in the late 1980s so the country remained a net exporter of pollution-intensive products. Consistent with this, the ratio for the newly industrialising economies (NIEs) fell sharply from three to two between 1975 and 1981 (so these countries were moving towards being net exporters of ‘dirty’ products i.e. pollution havens) but then stabilised above two. Elsewhere, the lower-income developing Asian countries including China and SE Asia, lag the NIEs by a decade and also stabilise, in this case above three. The pattern of indices for North America and Latin America is similar and all three major OECD regions (North America, Japan and Western Europe) remain net exporters of pollution-intensive products voiding the pollution haven hypothesis. In short, the pollution haven thesis had some credence until developing countries began to tighten regulations in the 1980s. In fact, far from trade adversely affecting environmental conditions in the developing countries, Birdsall and Wheeler (1992) find it to be beneficial. Analysing Latin American pollution intensity during the years 1960-88, they find that growth in pollution intensity is lower the more open the trade policy and the higher the per capita income. Growth in pollution intensity ceased entirely in those open, fast-growth, high-income Latin American countries, which eschewed attempts to develop national technology via forced industrialisation in favour of investing in new plant with the latest pollution-reducing technology. In addition, pressure from overseas customers in the OECD for more pollution-free products also stimulated abatement. The dumping of industrial pollution does not appear to be a significant factor in global industry location. A more important determinant of the pollution signature in developing countries is per capita income. As domestic markets grow and cross threshold sizes that permit competitive local production, new domestic industries emerge, moving from 'early’ industry, like agro-processing and textiles, that tends to pollute water courses, through 'middle’ industry, like cement and chemicals, that has a greater impact on the atmosphere (a development reinforced by the concomitant growth in private transport), to 'late' industry, like metals and machinery, that principally impacts on hazardous solid waste. In other words, domestic demand is a more important factor than environmental dumping in driving the composition of manufacturing and levels of pollution in most developing countries (Auty 1997). In fact, low-income countries can increasingly benefit from industrial country efforts to abate pollution. In 2000, the World Bank established a $75 million floating fund to
15
invest in pollution-abating technology, like renewable energy, in developing countries. The users of the fund derive carbon credits that can be sold to industrial country firms with high marginal costs of pollution abatement. A global market for carbon permits is rapidly emerging with prices ranging from around $15 to $30 per tonne as industrial country firms, that have already cut emissions substantially, find further cuts progressively more expensive than purchasing offsetting reductions in developing countries. To the extent that these carbon trades increase opportunities for developing country farmers and foresters, they boost per capita incomes in those countries while also increasing incentives for conservation. Yet another form of carbon sequestration involves injecting carbon emissions into suitable rock reservoirs that offer a cheaper way of curbing emissions (Herzog et al. 2000). Here again, markets can harness mutual self-interest to reduce reliance on political negotiation and moral suasion. 7. Conclusions and Main Policy Implications This paper starts from the optimistic assumption that the policies required for environmentally sustainable economic development are known but difficulties surround their implementation. Consequently, renewable resources continue to be mined, fund resources are depleted irresponsibly and the EKC flattens more slowly than it might with sounder policies. The paper argues that in the low-income countries differences in the natural resource endowment are an important and hitherto neglected cause of tardy environmental policy improvements. This is because the primary sector remains large relative to GDP in such countries so that the scale and socio-economic linkages generated by the natural resource rents condition the aims of governments in important ways. Most developing countries are resource-rich and natural resource abundance tends to foster predatory political states that use the rents to relax market discipline and buy political support, distorting their economies in the process so that competitive economic diversification falters and growth collapses. Recovery is protracted and may take generations to accomplish. Meanwhile, macro policy failure damages micro policies, including those aimed at environmental improvement, by distorting prices and incentives, depressing genuine saving rates and shortening time horizons to secure immediate survival. It is ironic that fears in the 1970s that shortages of natural resources might halt economic growth (Meadows et al. 1972) have given way to concern that the mismanagement of natural resource abundance intensifies environmental problems. Environmental policy makers and their advisers can benefit from a fuller awareness of how macro policy failure adversely impacts on environmental policies. They need to adapt environmental policies to the macroeconomic limitations and to recognise that some past policies may have failed because of those limitations rather than through systemic flaws in the policies themselves. They also need to be more supportive of the efforts of the IFIs to ease the constraint of maladroit macroeconomic management. The strengthening of sanctions against anti-social governance can help here. This will improve the design of sound environmental policies guided by total economic value to price in externalities, green accounting to achieve positive genuine saving, and cost-effective pollution abatement measures to flatten the EKC. In this way, developing countries can leapfrog the environmental learning curve of the advanced economies and limit the mismanagement of natural resources and minimise the damage to environmental services.
16
8. References Ascher, W (1999), Why Governments Waste Natural Resources: Policy Failure in Developing Countries, Baltimore MD: Johns Hopkins University Press. Auty, RM (1995), ‘Industrial policy, sectoral targeting and post-war economic growth in Brazil: The resource curse thesis’, Economic Geography 71: 257-272. Auty, RM (1997), ‘Pollution patterns during the industrial transition’, Geographical Journal 163: 206-15. Auty, RM (2001) (ed.), Resource Abundance and Economic Development, Oxford: Oxford University Press. Auty, RM and RF Mikesell (1998), Sustainable Development in Mineral Economies, Oxford: Clarendon Press. Bauer, PT and BS Yamey (1957), The Economies of Under-developed Countries, Cambridge: Cambridge University Press. Bernstam, MS (1991), The Wealth of Nations and the Environment, London: IEA. Bevan, Dl., P Collier and JW Gunning (1997), ‘Consequences of a commodity boom in a controlled economy: Accumulation and redistribution in Kenya’, World Bank Economic Review 1: 489-513. Binswanger, H and P Pingali (1988), ‘Technological priorities for farming in sub-Saharan Africa’, World Bank Research Observer 3: 81-98. Binswanger, HP (1991), ‘Brazilian policies that encourage deforestation in the Amazon’, World Development 19: 821-30. Birdsall, N and D Wheeler (1992), ‘Trade policy and industrial pollution in Latin America: Where are the pollution havens?’ in Low, P. (Ed.) International Trade and the Environment, World Bank Discussion Papers 159, Washington DC: World Bank. Birdsall, N and A Steers (1993), ‘Act now on global warming, but don't cook the books’, Finance and Development 30 (1): 6-9. Boserup, E (1965), The Conditions of Agricultural Growth, London: Earthscan. Brandon, C and R Raman Kutty (1993), Toward an Environmental Strategy for Asia, Washington DC: World Bank. Bray, F (1994), ‘Agriculture in developing countries’, Scientific American 271 (10): 18-25. Dasgupta, S, H Wang and D Wheeler (1997), Surviving success: policy reform and the future of industrial pollution in China, World Bank Working Paper 1976, Washington DC: World Bank.
17
Goldin, I and LA Winters (1995), The Economics of Sustainable Development, Cambridge: Cambridge University Press. Goldman, A (1993), ‘Agricultural innovation in three areas of Kenya: Neo-Boserupian theories and regional characterisation’, Economic Geography 69: 44-71. Grossman, GM and A Krueger (1995), ‘Economic growth and the environment’, Quarterly Journal of Economics, 110: 353-377. Harbaugh, WT, A Levinson and DM Wilson (2002), ‘Re-examining the empirical evidence for an EKC’, Review of Economics and Statistics, 84 (3): 541-551. Herzog, H, B Eliasson and O Kaarstad (2000), ‘Capturing green house gases’, Scientific American 282 (February): 72-79. Hettige, H, M Mani and D Wheeler (2000), ‘Industrial pollution in economic development: The EKC revisited’, Journal of Development Economics 62: 445-476. Krueger, A (1993), Political Economy of Policy Reform in Developing Countries, Cambridge MA: MIT Press. Lal, D (1983), The Poverty of 'Development Economics', Hobart Paperback 16, London: Institute of Economic Affairs. Liptron, M (1997), ‘Accelerated resource degradation by agriculture in developing countries?’ in SA Visti and T Reardon (eds) Sustainability, Growth and Poverty Alleviation, Baltimore MD: Johns Hopkins, pp. 79-89. Lofdhal, CL (2002), Environmental Impacts of Globalization and Trade, Cambridge MA: MIT Press. MacBean, AI (1966), Export Instability and Economic Development, Cambridge MA: Harvard University Press. Mani, M and D Wheeler (1998), ‘In search of pollution havens? Dirty industry in the world economy 1960-95’, Journal of Environment and Development 7 (3). Mauro, P (1997), ‘Why worry about corruption’, Economic Issues 6, Washington DC: International Monetary Fund. Meadows, DH, DL Meadows, J Randers and WW Beherens (1972), The Limits to Growth, New York: Signet. Mitchell, DO, MD Ingco and RC Duncan (1997), The World Food Outlook, Cambridge: Cambridge University Press. Newcombe. KJ (1989) ‘An economic justification for rural afforestation’ in G Schramm and JJ Warford (eds) Environmental Management and Economic Development, Baltimore ND: Johns Hopkins University Press, pp. 117-138.
18
Nordhaus, WD (1994), Managing the Global Commons, Cambridge MA: MIT Press. Pargal, S and D Wheeler (1996), ‘Informal regulation of industrial pollution in developing countries: Evidence from Indonesia’, Journal of Political Economy 104:1314-27. Pearce, D (1996), ‘Global environmental value and tropical rainforest’ in Adamoweicz, W. (ed.) Forestry, Economics and Environment, Reading: CAB international. Pearce, D, K Hamilton and G Atkinson (1996), ‘Measuring sustainable development: Progress on indicators’, Environment and Development Economics 1 (1): 85-101. Prebisch, R (1964), Towards a New Trade Policy for Development, Proceedings of the United Nations Conference on Trade and Development, Vols. I-VIII, New York: United Nations. Sachs, JD (1985), ‘External debt and macroeconomic performance in Latin America and East Asia’, Brookings Papers on Economic Activity 2, pp. 529-73, Washington DC: Brookings Institution Press. Sachs, JD and A Warner (1995a), ‘Economic reform and the process of global integration’, Brookings Papers on Economic Activity 1, pp. 1-118, Washington DC: Brookings Institution Press. Sachs, JD and AM Warner (1995b), Natural Resources and Economic Growth, HIID Mimeo, Cambridge MA: Harvard Institute for International Development. Scherr, SJ (1997), ‘People and environment: What is the relationship between exploitation of natural resources and population growth in the South?’ Forum for Development Studies 1: 40-47. Stern, DI (1998), ‘Progress on the Environmental Kuznets Curve?’ Environment and Development Economics 3:173-96. Syrquin, M. and HB Chenery (1989), Patterns of Development, 1950 to 1983, World Bank Discussion Paper 41, Washington DC: World Bank. Tiffen, M and M Mortimore (1994), ‘Malthus controverted: the role of capital and technology in growth and recovery in Kenya’ World Development 22: 997-1010. Van Tongeren, J, S Schweinfest, E Lutz, M Gomez Luna and F Guillen (1993), ‘Integrated environmental and economic accounting: Case of Mexico’ in E Lutz (ed.) Toward Improved Accounting for the Environment, Washington DC: World Bank, pp 85-107. Williamson, J (1996), ‘Lowest common denominator or neo-liberal manifesto? The polemics of the Washington Consensus’ in RM Auty and J Toye (eds) Challenging the Orthodoxies, London: Macmillan, pp. 13-22.
19
Woolcock, M, L Pritchett and J Isham (2001), ‘The social foundations of poor economic growth in resource-rich countries’ in RM Auty (ed.) Resource Abundance and Economic Development, Oxford: Oxford University Press, pp. 76-91. World Bank (1992), World Development Report 1992, Washington DC: World Bank. World Bank (1993), Malaysia: Managing Costs of Urban Pollution, Washington DC: World Bank. World Bank (1994), Thailand: Mitigating Pollution and Congestion Impacts in a High-growth Economy, Washington DC: World Bank. World Bank (2002), World Development Indicators 2002, Washington DC: World Bank. World Bank (2000), Greening Industry, New York: OUP. World Resources Institute (1987), World Resources 1987, New York: Basic Books, pp 221-238.
20
Table 1. Share of rents in GDP 1994 and GDP growth 1985-97, by natural resource endowment Resource Endowment
PCGDP growth
1985-97 (%)
Total rent (% GDP)
Pasture and cropland rent
(% GDP)
Mineral rent (% GDP)
Resource Poor1,2 Large 4.7 10.56 7.34 3.22 Small 2.4 9.86 5.41 4.45 Resource Rich Large 1.9 12.65 5.83 6.86 Small, non-mineral 0.9 15.42 12.89 2.53 Small, hard mineral -0.4 17.51 9.62 7.89 Small, oil exporter -0.7 21.22 2.18 19.04 All Countries 15.03 8.78 6.25
1 Resource-poor = 1970 cropland/head < 0.3 hectares 2 Large = 1970 GDP > $7 billion
Source: Derived from World Bank (2002) Table 2. Natural resources, economic growth, investment efficiency and population 1960-97 Resource Endowment Category
Investment (% GDP)
GDP growth
(%/Year)
ICOR PC GDP growth
(%/Year)
Population growth
(%/Year) Small non-mineral resource-rich
1960-73 14.8 4.2 3.5 1.6 2.6 1973-85 20.5 3.4 6.9 0.7 2.7 1985-97 21.9 3.5 6.0 0.9 2.6 Small oil-exporting resource-rich
1960-73 24.5 6.6 3.7 4.0 2.6 1973-85 31.0 6.5 5.7 2.3 4.2 1985-97 23.9 1.9 12.4 -0.7 2.6 Small ore-exporting resource-rich
1960-73 17.5 4.9 5.7 2.2 2.7 1973-85 21.8 3.0 7.3 0.1 2.9 1985-97 17.1 2.3 7.5 -0.4 2.7 Large resource-rich 1960-73 20.3 5.4 4.0 2.7 2.7 1973-85 21.8 3.1 7.1 0.7 2.4 1985-97 20.1 4.0 5.0 1.9 2.1 Small resource-poor 1960-73 18.8 6.1 3.2 3.5 2.6 1973-85 24.8 4.0 6.2 1.8 2.2 1985-97 23.0 4.4 5.2 2.4 2.0 Large resource-poor 1960-73 17.7 5.0 4.2 2.4 2.6 1973-85 25.5 5.8 4.4 3.7 2.1 1985-97 26.3 6.0 4.4 4.7 1.3
Source: Auty (2001)
21
Table 3. Extended genuine saving rates, selected countries 1970-94 (% GNP) Country 1970-74 1975-79 1980-84 1985-89 1990-94a) Newly Industrialising Argentina 16.85 18.07 4.35 6.39 5.02 India 7.96 8.78 5.91 7.75 8.31 Malaysia 17.31 17.61 9.08 10.43 15.21 South Korea 11.13 20.60 20.69 30.33 30.53 Mineral Economies Bolivia 6.10 -13.70 -43.77 -27.52 -13.97 Ghana 6.46 1.63 -10.94 -1.61 -1.94 Mexico 10.43 7.33 -4.22 -1.83 2.25 Saudi Arabia -32.84 -23.51 -29.34 -21.74 -30.57 Others Bangladesh -1.80 -2.37 -1.86 -0.16 0.64 Costa Rica 11.99 13.20 9.10 15.30 14.20 South Africa 12.03 8.82 8.14 3.13 5.53
Note: a) Costa Rica 1990-92, Saudi Arabia 1990-93 only Source: World Bank (2002).