natural resource abundance and human capital accumulation
TRANSCRIPT

World Development Vol. 34, No. 6, pp. 1060–1083, 2006� 2006 Elsevier Ltd. All rights reserved
0305-750X/$ - see front matter
www.elsevier.com/locate/worlddevdoi:10.1016/j.worlddev.2005.11.005
Natural Resource Abundance and
Human Capital Accumulation
JEAN-PHILIPPE STIJNS *
Northeastern University, Boston, MA, USA
Summary. — This paper studies the link between resource abundance and human capital accumu-lation. It reviews the commonly used indicators of resource abundance and human capital accumu-lation. The case for a form of resource curse in human capital accumulation is not robust toreasonable changes in these indicators. In fact, subsoil wealth and resource rents per capita areshown to be significantly correlated with improved indicators of human capital accumulation. Ifmineral wealth is what authors have in mind when they refer to natural resource abundance, thenthey should choose indicators that measure this concept as accurately as possible.
� 2006 Elsevier Ltd. All rights reserved.Key words — human capital, education, natural resources, resource curse, economic development
* We are grateful to several anonymous referees for
useful suggestions and to George Akerlof, Pranab Bar-
dhan, Brad DeLong, Chad Jones, Steve Pische, Ted
Miguel, David Romer, Gavin Wright, and the partici-
pants of seminars at the University of California at
Berkeley and Northeastern University for valuable dis-
cussion and suggestions. We have benefited from pre-
senting related research at the 2001 WEAI Conference,
the Second World Congress of Environmental and Re-
source Economists, the 2002 All-UC Economic History
Conference, and the 2003 AEA meetings. We also thank
Tamara Springsteen and Jennifer Jefferson for helpful
editing, as well as Brian Baker, Oscar Brookings, Megan
Bushor, and Alan Dyer for kindly proofreading a draft
of this paper. We are solely responsible for the opinions
expressed here and for any remaining errors. The begin-
ning of this research was undertaken while the author
was an SSRC Fellow in Applied Economics. Financial
support from the Social Science Research Council
is gratefully acknowledged. Final revision accepted:November 9, 2005.
1. INTRODUCTION
It is widely assumed in the literature that nat-ural resources tend to slow down economicgrowth in countries that possess or discoverthem. Sachs and Warner (1995, 1999) havemost notably made this claim. It deserves care-ful scrutiny if only because of its potentialimplications for development policy. In partic-ular, the Extractive Industries Review (EIR)commissioned by the World Bank (2003) ar-gues that international financial institutionsshould cease lending for hydrocarbon projectsby 2008 and should limit lending for othermining activity to those countries with effectivegovernments. In a press release, the WorldBank (2004) has politely dismissed the basicthrust of the EIR’s recommendations andannounced that ‘‘management [. . .] wouldcontinue investments in oil, gas, and miningproduction, as these will continue to be anessential part of the development of many poornations.’’ However, subsequent developmentsseem to indicate that the questions raised bythe EIR are likely to continue haunting theWorld Bank particularly its Mining Depart-ment.
The purpose of this paper is to shed somenew light on this debate. Because resourceabundance is likely to have a large variety ofpossibly conflicting effects on different sectors
106
and functions of the economy, the paper re-stricts its attention to the link between resourceabundance and human capital accumulation.The question at stake here is: Do natural re-source-abundant countries tend to accumulatemore or less human capital than resource-poorcountries?
0

NATURAL RESOURCE ABUNDANCE AND HUMAN CAPITAL ACCUMULATION 1061
That human capital accumulation accompa-nies mineral activities should be positive newsfrom the perspective of economic development.Human capital accumulation is a crucial issuefor economic development in all countries.Barro (1997, 2001) argues that education per-manently increases the efficiency of the laborforce by fostering democracy. He also arguesthat human capital facilitates the absorptionof superior technologies from leading countries.This technology-absorption effect is supposedto be especially important at the secondaryand higher education levels. Similarly, Aghion,Caroli, and Garcia-Penalosa (1999) assert thateducation creates better conditions for goodgovernance by improving health and enhancingequality.
Development economists, most notably Sen(1999), stress the importance of education,and in particular the importance of educatingwomen in developing countries. The marginalsocial returns of education for growth are con-sidered sizeable at the human capital levelscharacteristic of developing economies. Addi-tionally, given the high degree of incomeinequality prevailing in these countries, educa-tion is often considered a better indicator ofthe median level of development than grossdomestic product per capita.
Let us briefly review the limited literaturedealing with the nexus between resource abun-dance and human capital accumulation. Gylfa-son (2001) shows that public expenditure oneducation relative to national income, expectedyears of schooling for girls, and gross second-ary enrollment are all inversely related to theshare of natural capital in national wealthacross countries. He concludes that naturalcapital appears to crowd out human capital,thereby slowing the pace of economic develop-ment. Gylfason asserts, ‘‘nations that are confi-dent that their natural resources are their mostimportant asset may inadvertently—and per-haps even deliberately!—neglect the develop-ment of their [other] resources, by devotinginadequate attention and expenditure to educa-tion.’’ He goes on to add, ‘‘their natural wealthmay blind them to the need for educating theirchildren.’’
Birdsall, Pinckney, and Sabot (2001) start byobserving that most governments around theworld extol the benefits of education whileclaiming that their investment in education islimited because of a lack of money. Indeed,the EIR (World Bank, 2003) reports that gov-ernments ‘‘believe that [extractive] industries
contribute to [. . .] poverty alleviation [and that]revenues from extractive industries can be usedfor [. . .] education [. . .]’’ (Vol. 3, Annex 5, p.102). As Birdsall et al. (2001) note, if limitson human capital investment primarily resultfrom binding government constraints, resourceabundance should induce additional invest-ment, all else equal. Yet, these authors arguethat the data tell another story: resource-abun-dant countries, on average, invest less in educa-tion than other countries.
Just how surprising we can find the paradox-ical result reported by Birdsall and her coau-thors is debatable. On one hand, Wade (1992)argues that, in Latin America for example, gov-ernments controlled by the owners of naturalresources have no incentive to invest in basicskills. The idea is that in resource-abundantcountries, with plentiful foreign exchange, thereis no incentive for the political elite to invest inbasic skills so as to export the manufacturesneeded to pay for imports. Rather, the re-source-owning elite have a tendency in thesecircumstances to use the country’s resourcesto invest in highly skilled labor, particularly inthe form of college-level education for theirchildren.
On the other hand, it is surprising that whilemineral states tend to lavishly spend their reve-nues on numerous development projects andprograms (see, e.g., Ascher, 1999), educationwould be the only exception. It is even moresurprising to read that in regard to education,the same mineral states actually spend less thanother states. In fact, in an under appreciatedpaper about resource abundance and economicgrowth, Davis (1995) finds human capital accu-mulation indicators to be higher in mineralcountries than non-mineral countries. The re-sults in this paper support his conclusions. Thispaper explains why Gylfason (2001) and Bird-sall et al. (2001) have reached different conclu-sions. It improves upon Davis (1995) by usingricher human capital data and better resourceabundance measures.
This paper is organized as follows. Section 2presents the data used, paying close attention tothe different indicators of resource abundanceand human capital accumulation used in the lit-erature in order to better understand why theylead us to strikingly different conclusions. Sec-tion 3 reports and comments on linear correla-tion coefficients between these various resourceabundance and human capital accumulationindicators. These correlation coefficients arebootstrapped to generate confidence intervals

1062 WORLD DEVELOPMENT
and deal with non-normality and sample repre-sentativity issues. Section 4 discusses someextensions to the results in Section 3 resultsand suggests some candidates for country casestudies based on the variables surveyed in thispaper. Finally, Section 5 presents the conclu-sions of this paper and offers some recommen-dations for future research.
2. DATA
One of the main purposes of this paper is tocompare how strongly associated various mea-sures of resource abundance are with differentmeasures of human capital accumulation. Tothis end, we have collected data about the mostcommonly used variables to measure resourceabundance and human capital accumulation.This section describes these variables and clari-fies the differences among the indicators used inthe literature. Section 2(a) deals with resourceabundance indicators, while Section 2(b) dis-cusses human capital accumulation indicators.
(a) Resource abundance indicators
(i) Share of natural capital in national wealthGylfason (2001) introduces the share of natu-
ral capital in national wealth. He defines it as‘‘natural capital’’ over the sum of the same nat-ural capital, the perpetual inventory value of‘‘produced assets’’—referred to in this papersimply as ‘‘physical capital’’—and ‘‘humanresources’’ measured as a residual, that is, asthe present value of GDP net of the other na-tional wealth components. In other terms, thisratio, which we call the natural capital:totalcapital ratio, is defined as
Share of natural capital in national wealth
� Natural Capital
Natural CapitalþProduced AssetsþHuman Resources
The original variables come from the WorldBank (1997) and are estimated for 1994. Natu-ral capital is the sum of ‘‘subsoil wealth,’’ andwhat this paper refers to as ‘‘green capital,’’that is, timber, non-timber benefits of forests,cropland, pastureland, and the opportunitycost of protected areas. In turn, subsoil wealthis the present value of a constant stream of eco-nomic profits on ‘‘resource rents’’ on variousfuels and minerals, that is, gross profit onextraction less depreciation of capital and nor-mal return on capital.
(ii) Natural capital:physical capital ratioWe introduce the natural capital:physical
capital ratio with the aim of removing a majorsource of distortion implicit to the share of nat-ural capital in national wealth. The presence ofhuman capital in the denominator of Gylfa-son’s ratio is troublesome if the intended useof this ratio is to correlate it with human capitalaccumulation itself. Indeed, if Country A ismore successful at investing a share of its natu-ral wealth in education than Country B, thenceteris paribus Gylfason’s ratio will identifyCountry B as more resource abundant thanCountry A. This renders suspicious claimsmade using this ratio that resource-abundantcountries invest less in education.
(iii) Subsoil wealth:physical capital ratioWe introduce this second ratio, subsoil
wealth:physical capital, with the purpose of dis-tinguishing between the effects of subsoil wealth(minerals and fuels) and green capital. Besidesthe caveats mentioned below about primary ex-port intensity, it is hard to find an argumentthat would imply that the human capital ac-cumulation effects of the opportunity cost ofprotected areas should be similar to those ofprimary products, let alone minerals and fuels.In any case, it is doubtful that protected areasare what authors have in mind when they makethe claim that resource abundance is detrimen-tal to human capital accumulation.
(iv) Green capital:physical capital ratioThe idea behind this third ratio is to see what
role resources other than subsoil wealth play indriving the correlation between the share ofnatural capital in national wealth (or naturalcapital:total capital ratio) and human capitalaccumulation measures. This definition impliesthat what we call ‘‘green capital’’ is equal tonatural capital minus subsoil wealth.
(v) Subsoil wealth per capitaThis indicator suggests itself naturally when
we measure human capital accumulation byaverage years of education, which is an indica-tor of human capital accumulation per capita.Further, scaling subsoil wealth by populationrather than physical or total capital removesan important bias intrinsic to other scaling fac-tors. Indeed, if a country is successfully indus-trialized based, at least in part, on its mineralwealth, then its physical capital stock—andthus total capital—are likely to reflect thissuccess. The problem is that the subsoil

NATURAL RESOURCE ABUNDANCE AND HUMAN CAPITAL ACCUMULATION 1063
wealth:physical capital and the subsoil wealth:total capital ratios are going to attribute these‘‘success stories’’ to resource-poor countriesby construction, thereby heavily stacking thecards in favor of finding that these ‘‘resource-poor’’ cases of faster economic developmenthave corresponded to faster accumulation ofhuman capital. Scaling subsoil wealth by popu-lation avoids this problem. Dividing subsoilwealth, as defined above, by country popula-tion yields subsoil wealth per capita.
(vi) Arable land per capitaBirdsall et al. (2001) use Auty’s (1995, 1997,
2001) classification of countries. Auty’s com-plete classification is based on arable land percapita, country size, and the nature of exports.Yet, as Birdsall et al. use it, a country is catego-rized as resource-poor simply if cropland perhead was smaller than 0.3 hectares in 1970. Itis this categorization that Birdsall et al. (2001,Tables 4.1 and 4.2, pp. 58 and 63–64, respec-tively) rely on solely to conclude that re-source-rich countries accumulate less humancapital than resource-poor countries. However,it is questionable whether arable land per capitacan be used as a reliable indicator of resourceabundance when many notoriously resource-rich countries, such as Saudi Arabia, have littlearable land to speak of. Additionally, the 0.3hectares in 1970 sounds somewhat arbitrary,and we would like to analyze the impact ofswitching from this binary classification to acontinuous variable. Therefore, we use arableland per capita instead. We calculate this vari-able using arable land and population datafrom the World Bank’s World DevelopmentIndex (WDI) database.
(vii) Primary export intensitySachs and Warner (1995) proposed primary
export intensity, defined as primary export,thus encompassing all agricultural, mineral,and energy exports, divided by gross nationalproduct. Sachs and Warner measured this var-iable in 1970, and they applied it to economicgrowth rather than human capital accumula-tion. However, because of the popularity of thisindicator in the literature, we also consider it.This paper reproduces Sachs and Warner’s cal-culations for every year in the sample, using theWorld Trade Data 1 sets described in Feenstra,Lipsey, and Bowen (1997). Sachs and Warneruse SITC (Standard International Trade Classi-fication) categories 0–2, 4, and 68, correspond-ing to non-fuel primary activities. 2 They also
include SITC category 3 covering fuels. Forthe denominator, they use Gross NationalProduct. We take this variable from the WorldBank’s WDI database.
Stijns (2005) criticizes the use of primary ex-port intensity precisely for being a measure ofnatural resource intensity of exports, thus tradespecialization in the primary sector, rather thanthe intended measure of resource abundance,which is a direct measure of factor endowment.Further, it is doubtful that the agricultural andmining sectors play similar roles in economicdevelopment. Justifications for making anempirical distinction between these two sectorsare numerous. These justifications include theuse of very different technologies and the factthat the rents typically generated in each sectordiffer substantially in magnitude. However,Sachs and Warner’s measure lumps these twovery different sectors together.
(viii) Agricultural export intensityThere are two reasons behind the use of
agricultural export intensity is this paper.The first is that it should indicate whether ameasure of trade specialization in agriculturediffers in its effects on human capital accumu-lation from an endowment measure such asarable land per capita. The second reason forusing this indicator is to check for the conse-quences of aggregating the agricultural sectorwith the mineral and fuel sectors when usingSachs and Warner’s primary export intensityvariable. This ratio is obtained by combiningdata from the World Bank’s WDI about theshare of agricultural raw materials, as well asabout food exports in total merchandise ex-ports, with data on total merchandise exportsand total output from the World Trade datasets. 3
(ix) Mineral export intensityWhile mineral export intensity has the same
numerator as the share of minerals in exports,the denominator is gross domestic productrather than total exports. This paper introducesthis indicator to check whether the choice ofscaling factor for mineral exports, total exports,or gross domestic product has an influence onresults. The second purpose of this ratio is toilluminate the implications of using Sachs andWarner’s primary export intensity as an indica-tor of resource abundance, and, thus, of includ-ing primary activities other than fuel andmineral extraction. GDP data for the denomi-nator comes from the WDI database.

1064 WORLD DEVELOPMENT
(x) Share of minerals in exportsDavis (1995) uses mineral exports as a share
of total exports. He collected data for 1991.We have computed this variable for all yearsin the dataset, again using the World TradeData. Like Davis, we use SITC categories 3,68, and 971, covering all mineral and energyexports. This paper uses ‘‘share of mineralsin exports’’ and ‘‘mineral export share’’ inter-changeably throughout.
This ratio is aimed at measuring the extent ofa country’s trade specialization in mineral ex-ports. An important justification for using thisratio is that trade specialization in mineralsmay affect human capital accumulation differ-ently than mineral abundance. Indeed, the(standard) Hecksher–Ohlin theorem only im-plies that the exports of a country be intensivein their abundant factors. In the case of miner-als, this theorem does not necessarily imply thata mineral-abundant country (as compared tothe rest of the world) exports a higher shareof minerals, just that its exports be more min-eral-intensive. Therefore, a country could berichly endowed in minerals and not concentrateits exports in the minerals sector. In otherwords, a country could export manufacturedproducts that embed its mineral productionand yet export few minerals per se.
Finally, there is the issue of how relevant acountry’s stock of human capital is to tradespecialization in the minerals sector. de Ferr-anti et al. (2002, Chap. 2) present results thatimply that countries with a comparative advan-tage in tropical agriculture, raw materials,petroleum, and labor-intensive manufacturesare typically characterized by lower-than-aver-age education and knowledge scores. Theseresults make us expect a negative correlationbetween trade specialization in minerals (whichshould result from a comparative advantagetherein) and human capital. Unfortunately,data limitations brought de Ferranti and hiscoauthors to exclude deposits and minerals asdeterminants of comparative advantage.
(xi) Resource-rent intensityWe introduce resource-rent intensity to cap-
ture the contribution of mineral and fuel rentsto the aggregate income of resource-abundantcountries. This ratio uses the World Bank’s(1997) estimates for resource rents, furtherexplained in Hamilton and Clemens (1999).The basic approach used by World Bank tocalculating resource rents for non-renewableresources is to subtract country- or region-
specific average costs of extraction from theworld price for the resource in question, allexpressed in current US dollars. For minerals,the levels of total resource rents are calculatedas
Rent �World price�mining costs
�milling and beneficiation costs
� smelting costs� transport to port
� ‘‘normal’’ return to capital.
For crude oil, unit rents are calculated as theworld price less lifting costs. Currently, naturalgas does not have a single world price yet.Hamilton and Clemens estimate its world priceby averaging free-on-board prices from severalpoints of export worldwide, following whichthey calculate unit rents as they do for oil. Inaddition to timber, coal, oil, and natural gas,the minerals they cover include zinc, iron ore,phosphate rock, bauxite, copper, tin, lead,nickel, gold, and silver. Data problems led themto exclude diamonds from their estimates.Dividing this variable by current price GDPdata gives us resource-rent intensity.
(xii) Resource rent per capitaIntroducing resource rents per capita cap-
tures the contribution of rents in the mineralindustry to income per capita. This contribu-tion in absolute terms to income per capitameasures the mineral revenues available (onaverage) for each inhabitant to accumulatehuman capital. This indicator suggests itselfnaturally when we measure human capitalaccumulation using indicators that are averagesover the country’s (relevant) population, suchas average years of education, literacy rates, lifeexpectancy at birth, and, to a lesser extent,secondary enrollment rates. Dividing resourcerents by a country’s population yields resourcerents per capita. Multiplying this number bythe GDP deflator, also taken from the WorldBank’s WDI, yields real rents per capita.
(b) Human capital accumulation indicators
(i) Average years of educationAverage years of education is the most direct
and preferred indicator of accumulation ofhuman capital at the country level. Gylfason(2001) uses this data for females. This datafor females and for both genders combinedcomes from Barro and Lee (2001). Barro andLee (1993) extend their previous (1993) esti-

NATURAL RESOURCE ABUNDANCE AND HUMAN CAPITAL ACCUMULATION 1065
mates of educational attainment up to 1995and provide projections for 2000. Reportingresults for females is important because, first,we would expect the female educational attain-ment variable to capture the median level ofhuman capital accumulation. Second, femaleeducation is considered important on its ownif only with respect to labor market participa-tion and demographic transition in developingcountries.
(ii) Net secondary enrollment rateThe net secondary enrollment rate has been
very common in the empirical economic growthliterature, starting as early as Mankiw, Romer,and Weil (1992). Gylfason (2001) and Birdsallet al. (2001) also use this indicator. Davis(1995) uses primary school enrollment instead.The net secondary enrollment rate is definedas the number of children of official secondaryschool age enrolled in secondary school dividedby the size of the population in the same agebracket. 4 These data come from the UNESCOInstitute for Statistics via the WDI database.
It is possible to argue in favor of the use of alagged school enrollment indicator to measurecurrent human capital on the grounds that to-day’s useful human capital in terms of laborproductivity is the result of schooling someyears ago. However, this paper does not con-sider a lag in secondary enrollment rate becauseit is conceptually difficult to imagine thattoday’s stock of mineral reserves influencedyesterday’s investment in human capital morethan today’s investment in human capital.Moreover, the more we extend the lag in thesecondary enrollment rate, the more we runthe risk of capturing reverse causality run-ning from yesterday’s human capital stock totoday’s mineral reserves. Indeed, David andWright (1997) argue that during the second halfof the 19th century and the first half of the 20thcentury, the US mineral base reflected in largepart the superior geological knowledge ofAmerican engineers.
(iii) Adult literacy rateDavis (1995) and Birdsall et al. (2001) use
this indicator. The adult literacy rate is particu-larly interesting in the context of developingcountries and when the distribution of humancapital is a concern. Indeed, literacy rates tellus more about the median skill levels than otheraverage indicators. This paper’s adult literacyrate data comes from the UNESCO Institutefor Statistics via the WDI database.
(iv) Life expectancy at birthDavis (1995) uses life expectancy at birth for
both genders. Health is considered to be animportant component of workers’ human capi-tal because workers’ efficiency often dependscritically on their health conditions, particu-larly in developing countries. Life expectancyat birth should also be more informative thanaverage indicators regarding the median levelof human capital accumulation. This paper’slife expectancy data are World Bank staff esti-mates based on various sources and they arecollected from the WDI database.
(v) Public expenditure on educationas a percent of aggregate expenditure
Gylfason (2001) uses public expenditure oneducation as a percent of aggregate expendi-ture. This ratio aims to measure the amountof resources used as input in the public pro-duction of human capital. However, there areseveral caveats to be made. First, public expen-diture on education as a percent of aggregateexpenditure does not take into account theneeds of the population even if it does providea measure of the political ‘‘effort’’ at providingpublic education with respect to the size of theeconomy. Second, by definition, public expen-diture as a share of GDP does not cover privateexpenditure on education. It could be that re-source rents trickle down on at least the upperand middle classes and allow them to affordmore private schooling, particularly in develop-ing countries. Or conversely, public expenditureon education funded by resource rents maycrowd out private expenditure, so that any po-sitive association between resource abundanceand public expenditure on education may bemisleading. However important these consider-ations, a rigorous empirical investigation ofthese hypotheses falls outside the more modestscope of this paper. Fortunately, the otherhuman capital variables, namely average yearsof education, net secondary enrollment rate,adult literacy, and life expectancy at birth, donot suffer from this public vs. private complica-tion. We collect data on public expenditure oneducation as a percent of aggregate expenditurefrom the UNESCO Institute for Statistics viathe WDI database.
3. MAIN CORRELATIONS
This section analyzes simple linear (Pear-son) correlations between the natural resource

1066 WORLD DEVELOPMENT
abundance and human capital accumulationindicators discussed in the previous section.Tables 1 and 2 report these correlation coeffi-cients. Additionally, these tables provide bias-corrected and bootstrapped 95% confidenceintervals for the reported correlation coeffi-cients. Finally, the tables report whether corre-lation coefficients test as significantly differentfrom zero at the usual 10–5–1% level of confi-dence based on bootstrapped 90–95–99% confi-dence intervals.
Table 1 reports correlation coefficientsamong the complete sample of observed coun-tries. On the grounds that the effect of resourceabundance in developing countries may operateon human capital accumulation differently thanin the complete sample of countries, Table 2reports correlation coefficients within thesubsample of observed developing countries.Section 3(b) discusses Table 1, whereas Section3(c) discusses Table 2.
Resource abundance indicators can be classi-fied into two categories: measures availableacross countries only for a single year, andmeasures available across countries and overtime. The upper part of Tables 1 and 2 reportscorrelations involving cross-sectional indicatorsof resource abundance, whereas the lower partof Tables 1 and 2 reports correlations involvingpanel indicators of resource abundance. Beforediscussing these results, let us first explain thepaper’s use of bootstrapping.
(a) Bootstrapping confidence intervalsfor correlation coefficients
Many key observations made in this sectionand the following concern the statistical sig-nificance of correlation coefficients betweenresource abundance and human capital indica-tors. There are two major issues regarding suchobservations. First, it is unclear just howrepresentative is the sample of the larger setof countries that exist or could exist. Second,hypothesis testing usually relies on someassumption regarding the population that mayor may not be true. In the case of correlationcoefficients, it is typically assumed that the vari-ables are following a bi-normal distribution inthe population. It turns out that an omnibustest rejects the null hypothesis of bi-normalityfor the vast majority of the pairs of variablesconsidered in this paper. 5 Fortunately, the sta-tistical method known as bootstrapping (Efron,1979) is known to do a surprisingly effective jobof addressing both concerns.
Due to limited space, it is not possible to ex-plain bootstrapping here. Efron and Tibshirani(1993) offer a detailed introduction to boot-strapping, and Lunneborg (1985) explainshow the application of bootstrapping to corre-lation coefficients is done. Tables 1–4 report thebias-corrected 95% bootstrapped confidenceintervals of the correlation coefficients. Thesetables also report for each correlation coeffi-cient a test of statistical significance at the10%, 5%, or 1% level. It is straightforward totest this hypothesis based on the corresponding90–95–99% confidence interval. The correlationcoefficient is statistically significant when thewhole corresponding interval and thus both ofits bounds fall on the same side of zero.
(b) Correlations among all countries
(i) Cross-sectional indicators of resourceabundance
The World Bank estimates for the compo-nents of country wealth are only available for1994 and, therefore, this is also the case forratios such as the natural capital:total capitalratio (Gylfason’s share of natural capital in nat-ural wealth), the natural capital:physical capitalratio, the subsoil wealth:physical capital ratio,and the green capital:physical capital ratio, aswell as for subsoil wealth per capita. The upperpart of Table 1 provides Pearson correlationcoefficients between these measures and humancapital accumulation indicators among allcountries. The net secondary enrollment rates,adult literacy rates, life expectancy at birth,and public expenditure on education as a shareof GDP are all averaged over the period 1991–95. The reason for this averaging is to keep asmany countries as possible for the calculationof correlation coefficients despite the fact thatthere are many countries for which these mea-sures are not reported every year. The exceptionis total years of education for both genders andfor females. These data are available at 5-yearintervals, and this table uses values for 1995.
Gylfason’s ratio, the natural capital:totalcapital ratio in 1994, is significantly (a 6 .01)associated with lower values for all human cap-ital accumulation indicators. The same is trueof the natural:physical capital ratio. However,correlations are weaker between human capitalindicators and the natural:physical capital ratiothan with Gylfason’s ratio. This consistentweakening indicates that the presence of humancapital in the denominator of Gylfason’sratio is biasing results in the direction of his

Table 1. Correlations across all countries
Total years of education Secondaryenrollmentrate (net)
Adultliteracy
rate
Lifeexpectancy
at birth
Publicexpenditure
on education(% of GDP)
All Females
Share of natural capital in national wealth �0.69* �0.69* �0.71* �0.60* �0.78* �0.58*
(�0.78, �0.55) (�0.78, �0.58) (�0.83, �0.55) (�0.75, �0.39) (�0.85, �0.67) (�0.66, �0.48)1994 [70] [70] [44] [61] [81] [72]
Natural capital:physical capital ratio �0.55* �0.54* �0.58* �0.54* �0.56* �0.42*
(�0.63, �0.44) (�0.63, �0.43) (�0.69, �0.41) (�0.73, �0.2) (�0.67, �0.4) (�0.5, �0.33)1994 [70] [70] [44] [61] [81] [72]
Subsoil wealth:physical capital ratio �0.04 �0.02 �0.23* 0.03 0.00 �0.23*
(�0.23, 0.14) (�0.22, 0.16) (�0.37, �0.07) (�0.24, 0.37) (�0.27, 0.15) (�0.35, �0.09)1994 [60] [60] [37] [50] [67] [60]
Green capital:physical capital ratio �0.55* �0.54* �0.69* �0.51* �0.53* �0.41*
(�0.63, �0.44) (�0.62, �0.41) (�0.82, �0.49) (�0.75, �0.1) (�0.69, �0.32) (�0.57, �0.32)1994 [60] [60] [37] [50] [67] [60]
Subsoil wealth per capita 0.45* 0.45* �0.06 0.04 0.16* 0.39**
(0.27, 0.57) (0.27, 0.57) (�0.3, 0.36) (�0.07, 0.39) (0.07, 0.34) (0.06, 0.66)1994 [60] [60] [37] [50] [67] [60]
(continued next page)
NA
TU
RA
LR
ES
OU
RC
EA
BU
ND
AN
CE
AN
DH
UM
AN
CA
PIT
AL
AC
CU
MU
LA
TIO
N1067

Table 1—continued
Total years of education Secondaryenrollmentrate (net)
Adultliteracy
rate
Lifeexpectancy
at birth
Publicexpenditure
on education(% of GDP)
All Females
Arable land per capita 0.17* 0.17* 0.11** �0.08 �0.02 0.09**
(0.06, 0.25) (0.05, 0.25) (0.03, 0.18) 0.16, 0.02) (�0.09, 0.05) (0, 0.17)1975–2000 [584] [583] [380] [603] [878] [542]
Primary export intensity �0.10*** �0.09** �0.08*** 0.02 �0.09* �0.07**
(�0.21, 0) (�0.21, �0.01) (�0.25, 0.03) 0.08, 0.09) (�0.16, �0.03) (�0.12, �0.01)1975–2000 [536] [536] [314] [471] [668] [504]
Agricultural export intensity �0.12* �0.10** �0.10** �0.01 �0.12* �0.14*
(�0.2, �0.04) (�0.18, �0.01) (�0.22, 0.03) 0.1, 0.08) (�0.19, �0.04) (�0.2, �0.07)1975–2000 [423] [423] [271] [400] [553] [400]
Mineral export share �0.22* �0.23* �0.27* �0.13* �0.20* �0.12*
(�0.3, �0.15) (�0.31, �0.1 6) (�0.37, �0.16) ( .21, �0.04) (�0.27, �0.12) (�0.19, �0.04)1975–2000 [506] [505] [324] [467] [671] [459]
Mineral export intensity �0.07 �0.06 �0.03 �0.02 0.02 �0.03(�0.16, 0.02) (�0.15, 0.02) (�0.18, 0.08) 0.07, 0.09) (�0.09, 0.02) (�0.08, 0.03)
1975–2000 [555] [555] [319] [494] [703] [523]
Resource rent intensity �0.18* �0.20* �0.27* �0.05 �0.17* 0.16(�0.23, �0.14) (�0.24, �0.15) (�0.34, �0.2) 0.13, 0.03) (�0.22, �0.11) (�0.06, 0.36)
1975–2000 [486] [486] [257] [407] [569] [547]
Resource rents per capita 0.08** 0.08** �0.02 0.16* 0.06 0.03(0, 0.15) (0, 0.16) (�0.15, 0.11) .07, 0.23) (�0.02, 0.13) (�0.02, 0.1)
1975–2000 [475] [475] [244] [395] [551] [547]
Notes: 95% bias-corrected bootstrapped confidence internal between brackets; # of observations between squa brackets.* Significant at the 1% level.** Significant at the 5% level.*** Significant at the 10% level.
1068W
OR
LD
DE
VE
LO
PM
EN
T
(�
(�
(�
�0
(�
(�
(0
re

Table 2. Correlations among developing countries
Total years of education Secondaryenrollmentrate (net)
Adultliteracy
rate
Lifeexpectancy
at birth
Publicexpenditure on
education (% of GDP)All Females
Share of natural capital in national wealth �0.63* �0.62* �0.59* �0.56* �0.67* �0.45*
(�0.77, �0.42) (�0.75, �0.42) (�0.79, �0.17) (�0.73, �0.34) (�0.79, �0.52) (�0.62, �0.28)1994 [49] [49] [25] [57] [60] [52]
Natural capital:physical capital ratio �0.53* �0.50* �0.50** �0.51* �0.45* �0.39*
(�0.63, �0.29) (�0.6, �0.29) (�0.67, �0.08) (�0.71, �0.15) (�0.6, �0.26) (�0.52, �0.25)1994 [49] [49] [25] [57] [60] [52]
Subsoil wealth:physical capital ratio 0.39** 0.39** 0.10 0.08 0.19 0.11(0.07, 0.64) (0.06, 0.63) (�0.2, 0.46) (�0.21, 0.46) (�0.14, 0.38) (�0.1, 0.38)
1994 [40] [40] [19] [46] [47] [41]
Green capital:physical capital ratio �0.55* �0.51* �0.63* �0.48*** �0.40* �0.41*
(�0.67, �0.39) (�0.62, �0.33) (�0.86, �0.21) (�0.72, 0) (�0.6, �0.12) (�0.61, �0.23)1994 [40] [40] [19] [46] [47] [41]
Subsoil wealth per capita 0.53** 0.56** 0.05 0.06 0.20** 0.36**
(0.33, 0.68) (0.38, 0.7) (�0.33, 0.55) (�0.03, 0.43) (0.06, 0.26) (0.12, 0.57)1994 [40] [40] [19] [46] [47] [41]
(continued next page)
NA
TU
RA
LR
ES
OU
RC
EA
BU
ND
AN
CE
AN
DH
UM
AN
CA
PIT
AL
AC
CU
MU
LA
TIO
N1069
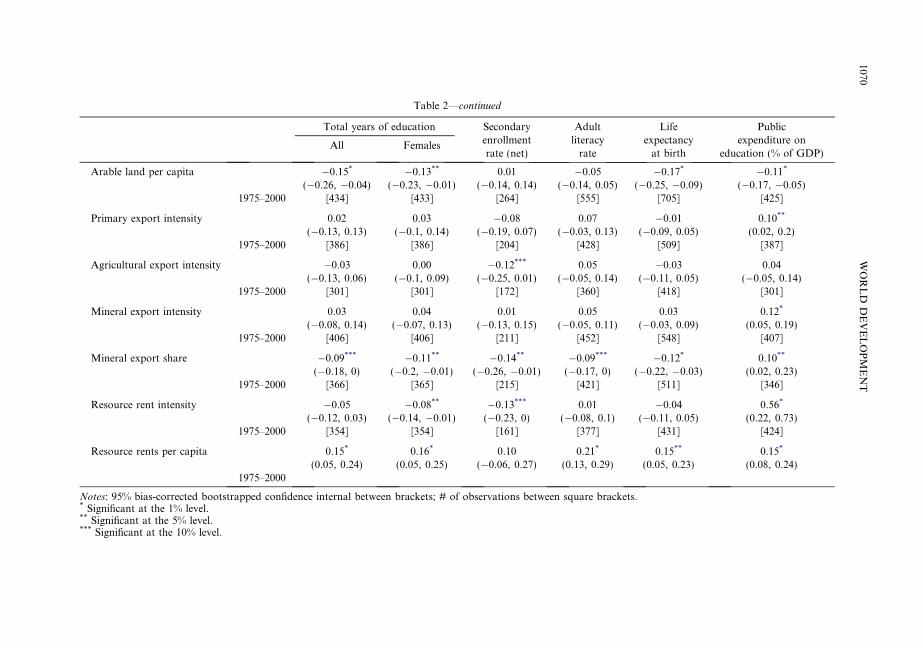
Table 2—continued
Total years of education Secondaryenrollmentrate (net)
Ad ltlite cy
ra
Lifeexpectancy
at birth
Publicexpenditure on
education (% of GDP)All Females
Arable land per capita �0.15* �0.13** 0.01 �0 5 �0.17* �0.11*
(�0.26, �0.04) (�0.23, �0.01) (�0.14, 0.14) (�0.14 0.05) (�0.25, �0.09) (�0.17, �0.05)1975–2000 [434] [433] [264] [5 ] [705] [425]
Primary export intensity 0.02 0.03 �0.08 0. �0.01 0.10**
(�0.13, 0.13) (�0.1, 0.14) (�0.19, 0.07) (�0.03 0.13) (�0.09, 0.05) (0.02, 0.2)1975–2000 [386] [386] [204] [4 ] [509] [387]
Agricultural export intensity �0.03 0.00 �0.12*** 0. �0.03 0.04(�0.13, 0.06) (�0.1, 0.09) (�0.25, 0.01) (�0.05 0.14) (�0.11, 0.05) (�0.05, 0.14)
1975–2000 [301] [301] [172] [3 ] [418] [301]
Mineral export intensity 0.03 0.04 0.01 0. 0.03 0.12*
(�0.08, 0.14) (�0.07, 0.13) (�0.13, 0.15) (�0.05 0.11) (�0.03, 0.09) (0.05, 0.19)1975–2000 [406] [406] [211] [4 ] [548] [407]
Mineral export share �0.09*** �0.11** �0.14** �0. *** �0.12* 0.10**
(�0.18, 0) (�0.2, �0.01) (�0.26, �0.01) (�0. , 0) (�0.22, �0.03) (0.02, 0.23)1975–2000 [366] [365] [215] [4 ] [511] [346]
Resource rent intensity �0.05 �0.08** �0.13*** 0. �0.04 0.56*
(�0.12, 0.03) (�0.14, �0.01) (�0.23, 0) (�0.0 0.1) (�0.11, 0.05) (0.22, 0.73)1975–2000 [354] [354] [161] [3 ] [431] [424]
Resource rents per capita 0.15* 0.16* 0.10 0. * 0.15** 0.15*
(0.05, 0.24) (0.05, 0.25) (�0.06, 0.27) (0.13 .29) (0.05, 0.23) (0.08, 0.24)1975–2000
Notes: 95% bias-corrected bootstrapped confidence internal between brackets; # of observations between squa brackets.* Significant at the 1% level.** Significant at the 5% level.*** Significant at the 10% level.
1070W
OR
LD
DE
VE
LO
PM
EN
T
urate
.0,
55
07,
28
05,
60
05,
52
091721
018,77
21, 0
re

Table 3. Disaggregated resource abundance indicators
Total years of education Secondaryenrollmentrate (net)
Adultliteracy
rate
Lifeexpectancy
at birth
Publicexpenditure on
education (% of GDP)All Females
Mineral wealth:physical capital ratio �0.07 �0.05 �0.06 0.00 �0.09 �0.07(�0.24, 0.13) (�0.24, 0.16) (�0.26, 0.11) (�0.26, 0.25) (�0.24, 0.12) (�0.15, 0.07)
1994 [77] [77] [50] [67] [90] [79]
Coal wealth:physical capital ratio 0.07 0.05 �0.06 0.03 �0.08 �0.11(�0.26, 0.3) (�0.31, 0.29) (�0.37, 0.2) (�0.34, 0.23) (�0.33, 0.17) (�0.36, 0.12)
1994 [39] [39] [28] [28] [43] [38]
Oil wealth:physical capital ratio �0.07 �0.03 �0.31 0.00 0.03 �0.05(�0.26, 0.22) (�0.21, 0.22) (�0.47, 0.2) (�0.2, 0.33) (�0.12, 0.16) (�0.3, 0.31)
1994 [43] [43] [28] [33] [47] [43]
Gas wealth:physical capital ratio 0.10 0.14 �0.19 0.12 0.03 �0.02(�0.16, 0.36) (�0.13, 0.38) (�0.5, 0.17) (�0.19, 0.37) (�0.18, 0.2) (�0.29, 0.33)
1994 [40] [40] [29] [28] [43] [40]
Timber wealth:physical capital ratio �0.22 �0.20 �0.24 �0.28** �0.38* �0.15(�0.41, 0.04) (�0.4, 0.02) (�0.5, 0.12) (�0.49, �0.05) (�0.55, �0.18) (�0.3, 0.08)
1994 [76] [76] [47] [65] [87] [77]
Cropland wealth:physical capital ratio �0.45* �0.44* �0.58* �0.51** �0.49* �0.34*
(�0.55, �0.29) (�0.54, �0.32) (�0.69, �0.44) (�0.66, �0.21) (�0.6, �0.36) (�0.42, �0.27)1994 [76] [76] [49] [67] [89] [78]
(continued next page)
NA
TU
RA
LR
ES
OU
RC
EA
BU
ND
AN
CE
AN
DH
UM
AN
CA
PIT
AL
AC
CU
MU
LA
TIO
N1071

Table 3—continued
Total years of education Secondaryenrollmentrate (net)
Adulitera
rate
Lifeexpectancy
at birth
Publicexpenditure on
education (% of GDP)All Females
Mineral wealth per capita 0.15 0.17 0.08 0.15 0.14 0.06(�0.11, 0.33) (�0.08, 0.34) (�0.09, 0.27) (�0.16, 27) (�0.08, 0.26) (�0.07, 0.23)
1994 [77] [77] [50] [67] [90] [79]
Coal wealth per capita 0.10 0.05 0.04 0.25 0.16 �0.23(�0.25, 0.33) (�0.26, 0.3) (�0.51, 0.31) (�0.38, 47) (�0.2, 0.33) (�0.46, 0.1)
1994 [22] [22] [16] [11] [22] [21]
Oil wealth per capita 0.17 0.19 �0.27 0.00 0.07 0.24(�0.12, 0.46) (�0.07, 0.47) (�0.5, 0.28) (�0.18, 31) (�0.04, 0.22) (�0.15, 0.61)
1994 [44] [44] [29] [33] [48] [44]
Gas wealth per capita 0.37** 0.39* 0.05 0.18 0.21** 0.30(0.06, 0.56) (0.15, 0.58) (�0.28, 0.35) (�0.13, 37) (0.05, 0.36) (�0.09, 0.61)
1994 [41] [41] [29] [29] [44] [41]
Timber wealth per capita 0.32*** 0.31*** 0.13 0.09 0.15 0.12(�0.01, 0.49) (�0.1, 0.48) (�0.17, 0.32) (�0.18, 26) (�0.17, 0.29) (�0.1, 0.29)
1994 [39] [39] [28] [28] [43] [38]
Cropland wealth per capita 0.51* 0.52* 0.43* 0.22* 0.32* 0.60*
(0.33, 0.63) (0.34, 0.63) (0.25, 0.56) (0.03, 0 7) (0.2, 0.41) (0.37, 0.76)1994 [76] [76] [47] [65] [87] [77]
Notes: 95% bias-corrected bootstrapped confidence internal between brackets; # of observations between squa brackets.* Significant at the 1% level.** Significant at the 5% level.*** Significant at the 10% level.
1072W
OR
LD
DE
VE
LO
PM
EN
T
ltcy
0.
0.
0.
0.
0.
*
.3
re

Table 4. Secondary vs. tertiary education
All countries Developing countries
Average years ofsecondaryeducation
Average years oftertiary
education
Average years ofsecondaryeducation
Average years oftertiary
education
All Females All Females All Females All Females
% of natural capital innational wealth
�0.64* �0.65* �0.53* �0.50* �0.55* �0.55* �0.47* �0.46*
(�0.73, �0.54) (�0.73, �0.54) (�0.65, �0.39) (�0.61, �0.37) (�0.72, �0.36) (�0.7, �0.39) (�0.64, �0.25) (�0.6, �0.28)1994 [70] [70] [70] [70] [49] [49] [49] [49]
Natural capital:physicalcapital ratio
�0.47* �0.47* �0.39* �0.37* �0.42* �0.41* �0.33* �0.32*
(�0.54, �0.36) (�0.57, �0.37) (�0.48, �0.3) (�0.45, �0.26) (�0.54, �0.24) (�G.52, �0.27) (�0.45, �0.17) (�0.42, �0.19)1994 [70] [70] [70] [70] [49] [49] [49] [49]
Subsoil wealth:physicalcapital ratio
�0.09 �0.07 �0.06 �0.05 0.42* 0.43* 0.23 0.22(�0.28, 0.08) (�0.27, 0.1) (�0.25, 0.13) (�0.25, 0.14) (0.1, 0.61) (0.14, 0.64) (�0.14, 0.53) (�0.1, 0.58)
1994 [60] [60] [60] [60] [40] [40] [40] [40]
Green capital:physicalcapital ratio
�0.48* �0.48* �0.40* �0.38* �0.46* �0.45* �0.36* �0.34*
(�0.58, �0.38) (�0.59, �0.38) (�0.48, �0.29) (�0.46, �0.27) (�0.58, �0.31) (�0.55, �0.28) (�0.45, �0.21) (�0.43, �0.21)1994 [60] [60] [60] [60] [40] [40] [40] [40]
Subsoil wealth percapita
0.40* 0.43* 0.36* 0.35* 0.56* 0.61* 0.34** 0.33*
(0.17, 0.57) (0.2, 0.58) (0.2, 0.58) (0.19, 0.56) (0.37, 0.73) (0.42, 0.76) (0.09, 0.55) (0.1, 0.61)1994 [60] [60] [60] [60]* [40] [40] [40] [40]
(continued next page)
NA
TU
RA
LR
ES
OU
RC
EA
BU
ND
AN
CE
AN
DH
UM
AN
CA
PIT
AL
AC
CU
MU
LA
TIO
N1073

Table 4—continued
All countries Developing countries
Average years ofsecondaryeducation
Average years oftertiary
education
Av ge years ofcondaryucation
Average years oftertiary
education
All Females All Females All Females All Females
Arable land percapita
0.10** 0.12** 0.28* 0.25* �0.33* �0.30* �0.16* �0.13**
(0, 0.19) (0, 0.21) (0.16, 0.38) (0.14, 0.35) (�0.4, �0 ) (�0.38, �0.22) (�0.24, �0.06) (�0.22, �0.03)1975–2000 [584] [584] [584] [584] [434] [434] [434] [434]
Primary exportintensity
�0.14* �0.13* �0.14* �0.13* �0.03 �0.02 �0.09* �0.08*
(�0.2, �0.09) (�0.19, �0.08) (�0.19, �0.09) (�0.17, �0.08) (�0.12, 0. ) (�0.1, 0.05) (�0.15, �0.04) (�0.14, �0.03)1975�2000 [536] [536] [536] [536] [386] [386] [386] [386]
Agricultural exportintensity
�0.24* �0.22* �0.17* �0.14* �0.20* �0.16* �0.16* �0.14*
(�0.3, �0.16) (�0.29, �0.15) (�0.24, �0.08) (�0.22, �0.06) (�0.27, �0 2) (�0.23, �0.07) (�0.25, �0.07) (�0.22, �0.05)1975–2000 [423] [423] [423] [423] [301] [301] [301] [301]
Mineral exportintensity
�0.08* �0.07* �0.10* �0.09* 0.03 0.04 �0.04 �0.04(�0.13, �0.03) (�0.12, �0.02) (�0.14, �0.05) (�0.14, �0.05) (�0.06, 0. ) (�0.06, 0.13) (�0.11, 0.02) (�0.1, 0.02)
1975–2000 [555] [555] [555] [555] [406] [406] [406] [406]
Mineral exportshare
�0.17* �0.17* �0.12* �0.13* 0.02 0.00 0.03 �0.01(�0.23, �0.09) (�0.24, �0.1) (�0.19, �0.06) (�0.19, �0.06) (�0.08, 0. ) (�0.1, 0.1) (�0.07, 0.12) (�0.1, 0.09)
1975–2000 [506] [506] [506] [506] [366] [366] [366] [366]
Resource rentintensity
�0.19* �0.20* �0.16* �0.16* �0.07** �0.09** �0.07 �0.09**
(�0.23, �0.14) (�0.24, �0.16) (�0.2, �0.11) (�0.19, �0.11) (�0.13, (�0.15, �0.02) (�0.12, 0.03) (�0.14, �0.01)1975–2000 [486] [486] [486] [486] [354] [354] [354] [354]
Resource rentsper capita
0.05 0.07 0.08** 0.06 0.12** 0.13* 0.09** 0.06(�0.02, 0.13) (�0.01, 0.14) (0.01, 0.17) (�0.01, 0.16) (0.03, 0.2 (0.04, 0.22) (0, 0.18) (�0.02, 0.16)
1975–2000 [475] [475] [475] [475] [349] [349] [349] [349]
Notes: 95% bias-corrected bootstrapped confidence internal between brackets; # of observations between squa brackets.* Significant at the 1% level.** Significant at the 5% level.*** Significant at the 10% level.
1074W
OR
LD
DE
VE
LO
PM
EN
T
eraseed
.25
04
.1
13
14
*
0)
1)
re

NATURAL RESOURCE ABUNDANCE AND HUMAN CAPITAL ACCUMULATION 1075
conclusions. In fact, footnote 3 in Gylfason(2001) mentions that a referee was concernedabout this issue, but the author dismissed it asinconsequential because results can be repro-duced by ‘‘using different measures of naturalresource abundance, such as the share of theprimary sector in the labor force [. . .] or theshare of primary exports in total exports orGDP [. . .]’’ (bottom of p. 2). Indeed, this paperfinds that there are other resource abundanceindicators, generally those that adopt a loosedefinition of resource abundance, that are nega-tively associated with human capital accumula-tion. However, this is not a reason—to thecontrary—for defining resource abundance ina way that is likely to, and here observed to, biasresults toward confirming the hypothesis of anegative effect on human capital accumulation.
As we move from the natural:physical capitalratio to the subsoil wealth:physical capital ratio,correlations weaken further, often becominginsignificant (and even changing sign in the caseof the adult literacy rate and life expectancy atbirth). This consistent weakening of correla-tions indicates that the presence of the non-min-eral and non-fuel components of natural wealthin the numerator of Gylfason’s ratio was alsobiasing results in the direction of his findings.In comparison, the presence of elements of‘‘green capital’’ in the numerator of the natu-ral:total capital ratio appears to be biasing re-sults much more than the inclusion of humancapital in the numerator does. The strongly neg-ative and significant (a 6 .01) correlationsobserved for the green capital:physical capitalratio confirm this interpretation. While the sub-soil wealth:physical capital ratio is significantly(a 6 .01) associated with lower ‘‘human capitalinput’’ measures (secondary enrollment rate andpublic expenditure on education as a share ofGDP), it is not significantly associated withlower (or higher) ‘‘human capital output’’ mea-sures (total years of education, adult literacyrate, and life expectancy at birth).
Finally, rescaling subsoil wealth on a percapita basis instead of as a ratio to physicalcapital reverses results. Subsoil wealth per capitais significantly (a 6 .01) associated with moreyears of education (for both genders and for fe-males), longer life expectancy at birth, and a lar-ger share of GDP devoted to public education.Subsoil wealth per capita is not significantlyassociated with the secondary enrollment andadult literacy rates. These positive correlationsindicate a possible bias of ratios that scale re-source abundance by variables that could be
themselves positively influenced by resourceabundance. In the case of physical capital, Dea-ton (1999, p. 11) argues that ‘‘the revenue fromcommodity exports provides a potential sourceof investment funds’’ even though the qualityof these investments may be questioned, espe-cially in Africa. In other words, if a resource-abundant country successfully invests resourcerents into physical capital, the type of ratios inquestion here will identify this country as lessresource abundant, everything else equal. If thesame type of country also successfully investsin human capital, this bias will mislead theresearcher toward concluding that resourceabundance is asso- ciated with a failure to investin human capital.
(ii) Panel indicators of resource abundanceThe lower part of Table 1 reports correlations
between (time-varying) human capital accumu-lation indicators and time-varying measures ofresource abundance. The net secondary enroll-ment and adult literacy rates, life expectancyat birth, and public expenditure on educationas a share of GDP are averaged over five periodsof 5 years beginning with 1971–75 and endingwith 1991–95. All resource abundance indica-tors are averaged in the same way. Again, thereason for this averaging is to keep as manycountries as possible in the calculation of corre-lations, despite the fact that for many countriesthese measures are not available for every singleyear. The exception is again total years of edu-cation for all and for females only. These dataare available at 5-year intervals, and thereforevalues for 1975–80–85–90–95 have been used.All five intervals are pooled to compute the cor-relation coefficients reported in Table 2. How-ever, qualitatively similar results are obtainedwhen these correlations are computed insteadperiod by period.
The most striking feature of the lower part ofTable 1 is the contrast between per capita re-source abundance measures and resource inten-sity measures. With the exception of mineralexport intensity, all intensity measures are typi-cally significantly associated with lower humancapital indicators. In contrast, arable land percapita and resource rents per capita are bothtypically associated with higher human capitalindicators. This is again evidence that the scalingof resource abundance by development-relatedmeasures such as physical capital stocks maymislead the researcher toward finding an artifi-cially negative association between resourceabundance and human capital accumulation.
1076 WORLD DEVELOPMENT
There are also some interesting patterns to beobserved when comparing correlations acrossresource intensity measures. Correlations weak-en when we move from primary export intensityto mineral export intensity, to the extent of mak-ing all associations insignificant. The differencemade by excluding agricultural exports from pri-mary export intensity when using mineral exportintensity indicates that specialization in agricul-tural exports plays a significantly different rolefor human accumulation than does mineralexport specialization. This interpretation issupported by the observation that agriculturalexport intensity is typically significantly associ-ated with lower human capital indicators(a 6 .05 except for the adult literacy rate).
Finally, it also appears that human capitalindicators are more significantly and negativelycorrelated with the share of minerals in exportsthan with mineral export intensity. One possi-ble interpretation is to see this as a reflectionof the fact that export concentration per sewould be detrimental to human capital accu-mulation. Another candidate interpretationis related to the fact that trade specializationin minerals is detrimental to human capitalaccumulation. This detrimental effect could belinked to the notoriously high volatility of com-modity prices, causing increased volatility ofgovernment revenues. Obviously, further evi-dence is required to confirm (or reject) suchinterpretations.
(c) Correlations among developing countries
Although growth theory generally considersdeveloping countries together with other coun-tries and in doing so assumes that a similar datageneration process applies for developing andnon-developing countries, development econo-mists tend to look at developing countries inisolation on the grounds that their economiesdo not necessarily function and evolve in thesame way as industrialized countries. Table 2reproduces the statistics of Table 1 whilerestricting the sample to developing countries.This helps to evaluate to what extent the as-sociation between resource abundance andhuman capital indicators is different in thesubsample of developing countries than in thecomplete sample.
(i) Cross-sectional indicators of resource abun-dance
With a few notable exceptions, it turns outthat the conclusions reached concerning devel-
oping countries in Table 2 are of a similarnature to those reached in Table 1 regardingall countries. Generally speaking, the directionand significance of associations in Table 2 aresimilar to what is found in Table 1. In particu-lar, in the upper part of Table 1, the naturalcapital and subsoil wealth:physical capital ratioare both significantly (a 6 .01, except in onecase) associated with lower human capital indi-cators in developing countries. Among develop-ing countries, correlations also weaken whenwe move from Gylfason’s ratio to the naturalcapital:physical ratio, with the same interpreta-tion as in Section 2(b).
Here too, the correlations with human capitalaccumulation indicators decrease when we re-move green capital from the denominator ofthe ratio. So much so here, that among devel-oping countries there is a positive correlationbetween the subsoil wealth:physical capitalratio and all human capital accumulation indi-cators. All correlations are significant (a 6 .05)except the secondary enrollment and adult liter-acy rates. Importantly, the correlation betweenthe subsoil wealth:physical capital ratio andtotal years of education is both positive andsignificant. This positive and significant corre-lation is found for both females only and forthe whole population. This finding is remark-able, as it can be argued that the subsoilwealth:physical capital ratio and total years ofeducation are quite precise indicators of naturalresource abundance and human capital accu-mulation.
(ii) Time-varying indicators of resourceabundance
At the bottom of Table 2, in contrast to whatwas found across all countries, arable land percapita is negatively and significantly correlatedwith most indicators of human capital accumu-lation. A possible interpretation is that landabundance plays a different role in developingcountries than it does in other countries.Perhaps the difference in technologies usedin the agricultural sector in the industrial vs.the developing world can somehow explainthe reversal of the corresponding correlationcoefficients. However, the observation thatagricultural export intensity is now (except inthe case of the secondary enrollment rate) insig-nificantly correlated with human capital indi-cators warrants caution about accepting thisinterpretation of the data. In fact, all resourceabundance intensity indicators display weakerand often insignificant associations with human

NATURAL RESOURCE ABUNDANCE AND HUMAN CAPITAL ACCUMULATION 1077
capital indicators. In spite of this tendency, theshare of mineral exports typically remains sig-nificantly associated with lower human capitalindicators. In contrast, resource rents per capi-ta see their correlation coefficient become largerand more significant (a 6 .01, except in onecase). Finally, the share of public expenditureon education in GDP is positively associatedwith all panel indicators of resource abun-dance, with the exception of arable land percapita.
Overall, there is some evidence that resourceabundance plays a more important role forhuman capital accumulation in developingcountries than in other countries. Perhaps thisis not surprising in the context of the usualtax-collection difficulties faced by governmentsin developing countries. Indeed, according toHirschman (1977), there is presumably a trade-off between production and government revenuelinkages. An activity such as manufacturing,which is highly interlinked with the rest of theeconomy, is expected to have a strong politicallever with which to avoid taxation. Conversely,enclave economies are by definition economi-cally isolated and are often run by foreigners.Hence, mineral extraction activities represent
Figure 1. Subsoil wealth:physical capital ratio vs. tot
fewer votes, have less political leverage, andare very often the object of heavy corporateincome and export taxation. Additionally, asHughes (1975, p. 813) points out, ‘‘followingRicardian logic, the supply of mineral is in- elas-tic in the short-run, so that with a given demandthe resource rent can be siphoned off withoutaffecting the amount of mineral that will bemined.’’ Therefore, perhaps it is not so surpris-ing to observe that, particularly in developingcountries, resource rents generate an increasein the ability of governments to spend on,among other programs, public education.
4. EXTENSIONS
This section explores possible extensions ofthe data analysis conducted in Section 3. First,Table 3 disaggregates measures of resourceabundance to see if different types of natural re-sources impact differently on human capitalaccumulation. Second, Table 4 decomposesaverage years of education, leading to a discus-sion of whether resource abundance helps ter-tiary education at the expense of secondaryeducation. Third, we use Figures 1 and 2 to
al years of education. Both variables standardized.

Figure 2. Subsoil wealth:physical capital ratio vs. total years of education for females. Both variables standardized.
1078 WORLD DEVELOPMENT
suggest some natural candidate for future case-studies.
(a) Disaggregating resource abundanceindicators
It can be argued that just as agricultural pro-duction and mineral extraction may have differ-ent effects on human capital accumulation,possibly because they generate (taxable) rentsof significantly different magnitude, there is acase for also disaggregating other measures ofresource abundance. It is also important toagain address in this context the issue of theeffect of the choice of scaling factor for vari-ous types of natural resources, namely totalor physical capital vs. population. To theseends, Table 3 presents correlation coefficientsbetween disaggregated measures of resourceabundance and human capital accumulationindicators. Specifically, the upper part of Table3 considers the ratio of mineral, coal, oil, gas,timber, and cropland wealth to physical capital.The lower part of Table 3 considers mineral,coal, oil, gas, timber, and cropland wealth percapita. Recall that mineral, coal, oil, and gaswealth are components of subsoil wealth,whereas timber and cropland wealth are com-
ponents of green capital. This data comes fromthe World Bank (1997) and the correspondingvariables are estimated for 1994.
In the upper part of Table 3, none of the ratiosto physical capital based on disaggregated mea-sures of subsoil wealth are significantly corre-lated with human capital accumulation. In thissense, minerals and fuels seem to have a simi-larly neutral effect on human capital accumula-tion, as was found in the upper part of Table 1using the subsoil wealth:natural capital ratio.The difference is that in Table 3, the correlationswith the secondary enrollment rate and theshare of GDP devoted to public education arealso insignificant. In contrast, the timberwealth:natural capital ratio is significantly asso-ciated with lower adult literacy rates and lifeexpectancy at birth. The cropland:natural capi-tal ratio is significantly (a 6 .01) associated withlower values for all human capital indicators.
The bottom part of Table 3 yields similarconclusions in that none of the mineral, oil,or coal wealth per capita is significantly associ-ated with any human capital indicator, whereasin the upper part of Table 1, subsoil wealth percapita is significantly associated with all humancapital indicators except for the secondaryenrollment and adult literacy rates. A possible

NATURAL RESOURCE ABUNDANCE AND HUMAN CAPITAL ACCUMULATION 1079
interpretation of this data feature is that therange of resources a country is endowed withis important in terms of spurring human capitalaccumulation. Specifically, while a country maymanage to exploit a single resource withoutinvesting much in education (perhaps byimporting specialized labor), the exploitationof a diverse resource base requires the develop-ment of a wide range of skills that are onlyavailable to countries with deep stocks of hu-man capital. The exception is gas wealth per ca-pita, which is significantly associated (a 6 .05)with higher years of education for both gendersand for females, as well as with longer lifeexpectancy at birth.
There is, however, a strong contrast betweenthe upper and lower parts of Table 3 in that tim-ber and cropland wealth per capita are in factsignificantly associated with a higher numberof average years of education. In addition, crop-land per capita is also significantly associatedwith the rest of the human capital indicators.The same remark that is made in Section 3 ap-plies here: scaling by a variable related to an-other helpful outcome of resource abundancebiases results toward finding a negative relationbetween resource abundance and human capitalaccumulation. Beyond this, the difference madeby scaling a country’s population as opposed toits physical capital stock can be interpreted assimply implying that being well endowed per ca-pita with respect to agriculture or forestry doesnot threaten human capital accumulation, tothe contrary. Yet, the negative correlationsfound for the timber wealth:physical capital ra-tio and even more so for cropland wealth:phys-ical capital ratio may indicate that excessiveproductive specialization, possibly via excessiveexport specialization, may be detrimental to hu-man capital accumulation, perhaps because ofthe volatility of the underlying prices. Alterna-tively, the nature of the production technologiesinvolved in agriculture and forestry may play arole here too. The observations made in Table 3regarding timber wealth per capita are perhapsnot so surprising, as the forestry industry isknown to be quite human capital intensive inindustrialized countries. The successful exam-ples of Sweden and Finland come to mind inthis context (de Ferranti, Perry, Lederman, &Maloney, 2002, Chap. 3).
(b) Secondary vs. tertiary education
According to Wade (1992, p. 311), ‘‘govern-ments [in Latin America] controlled by an elite
that owned the natural resources saw no partic-ular need to extend basic education throughoutthe labor force, for the exploitation of the nat-ural resources did not depend on a large supplyof basically skilled people. But the elites didwant to expand tertiary education sufficientlyto professionalize their own children. Hence,secondary education was often expensive; ter-tiary education was often cheap.’’ This type ofstatement calls for investigating whether inour data there is a tendency for resource abun-dance indicators to be more systematically cor-related with higher average years of tertiaryeducation or lower average years of secondaryeducation. In fact, there is evidence for thealternate hypothesis of greater focus on second-ary than tertiary education.
Table 4 correlates our resource abundanceindicators with average years of secondaryand tertiary education for both genders andfor females only. These data come from Barroand Lee (2001). Generally, average years of sec-ondary and tertiary education are correlated ina similar way with resource abundance indica-tors as with average years of (total) educationin Tables 1 and 2. Notably, arable land per ca-pita is also significantly associated with higheryears of secondary and tertiary education forboth genders and females across all countries,while it is associated with lower values for thesevariables across developing countries. Subsoilwealth per capita is significantly associated withhigher years of secondary and tertiary educa-tion for both genders and females both acrossall countries and across developing countries.
In developing countries, while the subsoilwealth:physical capital ratio is significantlyassociated with higher average years of second-ary education for both genders and for females,it is not significantly associated with averageyears of tertiary education. Again in developingcountries, while primary export intensity is sig-nificantly associated with lower average yearsof tertiary education for both genders and forfemales, it is not significantly associated withaverage years of secondary education. Agricul-tural export intensity is significantly associatedin developing countries with lower averageyears of secondary and tertiary education forboth genders and for females.
The evidence is ambiguous with respect toresource rents per capita. Across all countries,resource rents per capita are significantly asso-ciated with higher years of education for bothgenders, but they are not significantly corre-lated with years of secondary education and

1080 WORLD DEVELOPMENT
years of tertiary education for females. In con-trast, across developing countries, resourcerents per capita are significantly associated withhigher average years of secondary and tertiaryeducation for both genders, but insignificantlyassociated with years of tertiary education forfemales. Similarly, across developing countries,resource-rent intensity is significantly associ-ated with lower years of tertiary education forfemales but not for both genders. Therefore,there is some evidence that in resource-abun-dant developing countries, tertiary educationis expanded more systematically to the benefitsof males rather than females. Subsoil wealthper capita, however, does not support thisinterpretation.
(c) Case study candidates
Although space limitations prevent this paperfrom exploring case studies, it is worth notingsome natural candidates and suggesting ques-tions for future country case studies. Figures1 and 2 scatter plot subsoil wealth per capitavs. average years of education for both gendersand females only, respectively. Additionally,linear regression lines appear on the figuresfor reference, and 90–95–99% elliptical confi-dence areas 6 appear for the two variables ofinterest under the assumption of bi-normalityfor these two population variables. In otherwords, each ellipse gives the area in whichwe expect observed combinations of subsoilwealth:physical capital ratios and average yearsof education to fall with no more than 10%,5%, or 1% probability of failure, respectively.
What can we learn from Figure 1? With re-spect to the link between resource abundanceand human capital stocks, it appears that Chile(CL) has achieved very high average years ofeducation compared to developing countrieson average, and also among resource-abundantdeveloping countries. At a lower level of subsoilwealth:physical capital ratio, two other coun-tries stand out. Malaysia (MY) appears to haveoutperformed similarly resource-abundant deve-loping countries, whereas Sierra Leone (SL) hasclearly underperformed compared to the samecountries. The 6-year difference (more than 2standard deviations) between the averageyears of education for both genders observedbetween these two countries is remarkablebecause the countries are similar with respectto their subsoil wealth:physical capital ratios(0.27 for Malaysia vs. 0.29 for Sierra Leone, lessthan 7% of a standard deviation apart). Figure 2
yields the same qualitative observations with re-spect to average years of education for females.
The literature might well benefit from case-studying these countries with a view to answer-ing questions such as: why have countries likeMalaysia so clearly outperformed equally re-source-abundant countries like Sierra Leonein terms of human capital accumulation.Likewise, why has Chile not proportionallybenefited from its higher resource abundancecompared to Malaysia in terms of humancapital accumulation? In other words, is therecountry-level evidence that there is some kindof non-linearity in the positive relationship ob-served at the aggregate level between resourceabundance and human capital stocks? Finally,what are the complementary factors thatincrease the odds that a resource-abundantcountry invests its resource rents into humancapital?
5. CONCLUSIONS
There are obviously many possible extensionsto and many unresolved questions about the setof indicators covered here. Indeed, even theaverage number of years can still be considereda relatively raw measure of human capital accu-mulation when we factor in that in some casesyears of education do not necessarily translateinto marketable skills. Similarly, one importantpotential byproduct of education is social capi-tal. Unfortunately, we can only wish that morecountries have data on educational achieve-ment scores and social capital indicators.
To claim a negative and significant correla-tion between resource abundance and humancapital accumulation using Pearson correla-tions, we must arbitrarily pick indicators onboth sides of the correlation. As a corollary,such claims are not robust to reasonable—andactually desirable—changes in the choice ofindicators. Gylfason (2001) and Birdsall et al.(2001) make an important contribution to thedevelopment literature by analyzing some ofthe existing data regarding the nexus betweenresource abundance and human accumulation.However, they conclude in favor of a negativeeffect running from resource abundance tohuman capital accumulation because of the useof questionable resource abundance indicators.
Gylfason’s share of natural capital in na-tional wealth suffers from incorporating ele-ments such as non-timber benefits of forestsand the opportunity cost of protected areas

NATURAL RESOURCE ABUNDANCE AND HUMAN CAPITAL ACCUMULATION 1081
that have little to do with a strict definition ofnatural resources, that is, a definition restrictedto minerals and fuels. In fact, when we look atcorrelations between human capital indicatorsand the subsoil wealth:physical capital ratioinstead, we find insignificant correlation coeffi-cients for all countries and positive and signifi-cant coefficients among developing countries.Birdsall et al. (2001) use Auty’s (2001) countryclassification to conclude that resource-richcountries, compared to resource-poor coun-tries, underinvest in human capital. As dis-cussed earlier, there are some fundamentalproblems with their use of Auty’s classificationsystem and their choice of an arbitrary land percapita threshold. In fact, if we look instead atcorrelations between arable land per capita asa continuous—rather than categorical—vari-able, we find positive and significant correla-tions between this variable and total years ofeducation, the net secondary enrollment rate,and the share of aggregate expenditure devotedto public education.
To find negative correlation coefficients be-tween arable land per capita and human capitalaccumulation indicators, we have to restrict thesample to developing countries, which is actu-ally what Birdsall et al. (2001) do in their paper.It is not the purpose of this paper to argue thatrestricting attention to developing countries isinappropriate. However, arable land per capitaand agricultural export intensity tell us moreabout the effect on education of a comparativeadvantage and specialization in the agriculturalsector than they tell us about the effect ofnatural resource abundance (interpreted in itsusual sense as mineral wealth) on humancapital accumulation. While among all coun-tries, agricultural export intensity is negativelyand significantly associated with human capitalaccumulation indicators, the corresponding cor-relation coefficients are not significant amongdeveloping countries. If development policy isthe focus, it would therefore be advisable toproceed to further investigation before con-cluding that moving away from agriculture
might favor the accumulation of humancapital.
Future papers on the effect of natural re-source abundance on various aspects of macro-economic development would benefit fromestablishing a clear distinction between factorendowments in the agricultural vs. mining sec-tor. In other words, if mineral wealth is whatauthors have in mind when they refer to naturalresource abundance, then they should use re-source abundance indicators that appropriatelymeasure this type of endowment and refrainfrom using indicators that capture a compara-tive advantage in the agricultural sector. Addi-tionally, the choice of the variable used to scaleresource abundance also matters. It would bewiser to abstain from scaling factors that areendogenous to a country’s development processbecause they tend to bias results by systemati-cally underestimating the resource abundanceof countries that successfully accumulate fac-tors of production.
Certainly, it is possible to argue that there ismuch more to analyzing the effects of mineralendowments and exploitation on developmentthan the seemingly narrow focus on humancapital accumulation adopted here. There is along list of other channels of operation runningfrom resource abundance to economic develop-ment; to name just one example, mineral activ-ities are likely to have a profound and lastingimpact on the environment. These other chan-nels of operation should continue to be the ob-ject of research. Nevertheless, as the ExtractiveIndustries Review argues, ‘‘consumption of fi-nite resources could be considered sustainableif it improves the welfare of future generationsby, for example, raising other forms of capital,such as human capital (if revenues are used,say, for education) or social capital’’ (WorldBank, 2003, Vol. 1, p. 4). The evidence offeredin this paper suggests that, at a minimum, weshould carefully consider human capital ac-cumulation before attempting to discouragemineral production, especially in developingcountries.
NOTES
1. The World Trade Database (WTDB), put togetherby Statistics Canada, contains bilateral trade flows forall countries from 1970 to 1992, recently updated up to
1997, classified according to the Standard InternationalTrade Classification. This database is considered tocover 98% of all trade.

1082 WORLD DEVELOPMENT
2. We have added category 971, non-monetary gold, asDavis (1995) does, for the sake of comprehensiveness.
3. See Section (vii) above for further details about thisdataset.
4. In contrast, the gross enrollment rate is the ratio ofthe number of students enrolled in secondary school,regardless of age, to the population of the correspondingofficial school age. Rates above 100 can occur when
there are a lot of overage students in secondary schools.Such rates can indicate educational system ineffective-ness.
5. The results are not reported in this paper but areavailable from the author upon request.
6. Refer to Tracy, Young, and Mason (1992) forfurther details.
REFERENCES
Aghion, P., Caroli, E., & Garcia-Penalosa, C. (1999).Inequality and economic growth: The perspective ofthe new growth theories. Journal of Economic Liter-ature, 37(4), 1615–1660.
Ascher, W. (1999). Why governments waste naturalresources: Policy failures in developing countries.Baltimore and London: The John Hopkins Univer-sity Press.
Auty, R. M. (1995). Patterns of development: Resources,policy and economic growth. London and New York:Edward Arnold.
Auty, R. M. (1997). Natural resource endowment, thestate and development strategy. Journal of Interna-tional Development, 9(4), 651–663.
Auty, R. M. (2001). Resource abundance and economicdevelopment: Introduction and overview. In R. M.Auty (Ed.), Resource abundance and economic growth(pp. 3–16). Oxford University Press.
Barro, R. J. (1997). Determinants of economic growth: Across-country empirical study. Cambridge, MA: MITPress.
Barro, R. J. (2001). Human capital and growth. Amer-ican Economic Review, 91(2), 12–17.
Barro, R. J., & Lee, J.-W. (1993). International com-parisons of educational attainment. Journal of Mon-etary Economics, 32(3), 363–394.
Barro, R. J., & Lee, J.-W. (2001). International data oneducational attainment: Updates and implications.Oxford Economic Papers, 53(3), 541–563.
Birdsall, N., Pinckney, T., & Sabot, R. (2001). Naturalresources, human capital, and growth. In R. M. Auty(Ed.), Resource abundance and economic growth(pp. 57–75). Oxford: Oxford University Press.
David, P. A., & Wright, G. (1997). Increasing returnsand the genesis of American resource abundance.Industrial and Corporate Change, 6(2), 203–245.
Davis, G. A. (1995). Learning to love the Dutch disease:Evidence from the mineral economies. World Devel-opment, 23(10), 1765–1779.
Deaton, A. (1999). Commodity prices and growth inAfrica. Journal of Economic Perspectives, 13(3),23–40.
de Ferranti, D., Perry, G., Lederman, D., & Maloney,W. (2002). From natural resources to the knowledgeeconomy: Trade and job quality. Washington, DC:The World Bank.
Efron, B. (1979). Bootstrap methods: Another look atthe jackknife. The Annals of Statistics, 7(1), 1–26.
Efron, B., & Tibshirani, R. (1993). An introduction to thebootstrap. New York: Chapman & Hall.
Feenstra, R. C., Lipsey, R. E., & Bowen, H. P. (1997).World trade flows, 1970–1992, with production andtariff data. NBER Working Paper Series, 5910, 1–65.
Gylfason, T. (2001). Natural resources, education, andeconomic development. European Economic Review,45(4–6), 847–859.
Hamilton, K., & Clemens, M. (1999). Genuine savingsrates in developing countries. World Bank EconomicReview, 13(2), 333–356.
Hirschman, A. O. (1977). A generalized linkageapproach to development with special reference tostaples. Economic Development and Cultural Change,25(Suppl.), 67–98.
Hughes, H. (1975). Economic rents, the distribution ofgains from mineral exploitation, and mineral devel-opment policy. World Development, 3(11&12),811–825.
Lunneborg, C. E. (1985). Estimating the correlationcoefficient: The bootstrap approach. PsychologicalBulletin, 98, 209–215.
Mankiw, N. G., Romer, D., & Weil, D. N. (1992). Acontribution to the empirics of economic growth.Quarterly Journal of Economics, 107(2), 407–437.
Sachs, J. D., & Warner, A. M. (1995). Natural resourceabundance and economic growth. NBER WorkingPaper Series, 5398, 1–47.
Sachs, J. D., & Warner, A. M. (1999). Natural resourceintensity and economic growth. In J. Mayer, B.Chambers, & A. Farooq (Eds.), Development policiesin natural resource economies (pp. 13–38). Chelten-ham, UK and Northampton, MA: Edward Elgar.
Sen, A. (1999). Development as freedom. Oxford: OxfordUniversity Press.
Stijns, J.-Ph. (2005). Natural resource abundance andeconomic growth revisited. Resources Policy, 30(2),107–130.
Tracy, N. D., Young, J. C., & Mason, R. L. (1992).Multivariate control charts for individual observa-tions. Journal of Quality Technology, 24(2), 88–95.
Wade, R. (1992). East Asia’s economic success: Con-flicting perspectives, partial insights, shaky evidence.World Politics, 44(2), 270–320.

NATURAL RESOURCE ABUNDANCE AND HUMAN CAPITAL ACCUMULATION 1083
World Bank. World Development Indicators. WorldBank: http://publications.worldbank.org/WDI/.
World Bank (1997). Are we saving enough for thefuture?. In Expanding the measure of wealth: Indica-tors of environmentally sustainable development(pp. 7–18). Washington, DC: World Bank.
World Bank (2003). Striking a better balance. FinalReport of the Extractive Industries Review, Decem-ber. World Bank: http://www.eireview.org/.
World Bank (2004). World Bank Group Board agreesway forward on extractive industries review. Wash-ington, DC: World Bank.