natural hazards on the taieri plains, otago hazards on the taieri plains, otago i executive summary...
TRANSCRIPT
Natural Hazards on
the Taieri Plains, Otago

Otago Regional Council
Private Bag 1954, 70 Stafford St, Dunedin 9054
Phone 03 474 0827 Fax 03 479 0015
Freephone 0800 474 082
www.orc.govt.nz
© Copyright for this publication is held by the Otago Regional Council. This publication may
be reproduced in whole or in part provided the source is fully and clearly acknowledged.
ISBN: 978-0-478-37658-6
Published March 2013
Prepared by: Kirsty O’Sullivan, natural hazards analyst
Michael Goldsmith, manager natural hazards
Gavin Palmer, director environmental engineering and natural hazards
Cover images
Both cover photos are from the June 1980 floods. The first image is the Taieri River at
Outram Bridge, and the second is the Taieri Plain, with the Dunedin Airport in the
foreground.
Natural Hazards on the Taieri Plains, Otago i
Executive summary
The Taieri Plains is a low-lying alluvium-filled basin, approximately 210km2 in size. Bound
to the north and south by an extensive fault system, it is characterised by gentle sloping
topography, which grades from an elevation of about 40m in the east, to below mean sea
level in the west. At its lowest point (excluding drains and ditches), it lies about 1.5m below
mean sea level, and has three significant watercourses crossing it: the Taieri River, Silver
Stream and the Waipori River. Lakes Waipori and Waihola mark the plain’s western
boundary and have a regulating effect on drainage for the western part of the plains.
The Taieri Plains has a complex natural-hazard setting, influenced by the combination of the
natural processes that have helped shape the basin in which the plain rests, and the land uses
that have developed since the mid-19th century. The natural setting of the plains exposes the
area to flooding, alluvial-fan hazard, landslides, seismic activity and tsunamis. The level of
risk that these events present varies greatly across the plains, depending on the nature and
scale of the particular hazard and the nature and vulnerability of the features exposed to that
hazard.
The area is one of the largest expanses of flat land close to Dunedin city, and is mainly used
for agricultural purposes, an activity that was established with the arrival of European settlers
to the area in the mid-1800s. A large residential community is located in and around Mosgiel,
with a number of smaller communities established at Outram, Allanton and North Taieri.
Identified in the early settlement plans of Otago, each of these communities are located
beyond the observed-flood extents of the early 19th century, indicating an early awareness of
flood hazard on the Taieri Plains.
Flooding has been a fact of life for those living on the Taieri Plains, with a number of
significant floods occurring since early European settlement in the mid-1800s. Modification
of the flood hazard, through extensive engineering works, has reduced the incidence of
flooding; however, a residual flood risk still exists.
Previous assessments of natural hazards on the Taieri Plains have generally focused on the
mitigation and subsequent modification of flood risk through the engineering works of the
Lower Taieri Flood Protection Scheme and the schemes that it subsumed. This report
combines information about residual-flood risks with alluvial-fan, seismic, landslide and
tsunami hazard information. A description of the social and environmental settings, which
together create the hazardscape of the Taieri Plains, is also provided.
The report also provides a detailed description of how the flood hazard varies across the
Taieri Plains. This description is a refinement and extension of that presented in a report
prepared jointly with Dunedin City Council in 2006 (report titled ‘Mosgiel Flood Event 25/26
April 2006 and Future Action’).
Spatial and temporal changes in extreme rainfall (storm) events have been analysed, using
rainfall records from the lower Taieri River catchment. These records show that there is
localised variability in extreme rainfall patterns, and that the northern end of the Taieri Plains
(including within the Silver Stream catchment) has experienced an increase in the intensity
and frequency of extreme rainfall events since the 1960s.
The risk associated with interactions between different types of hazard is explained. In
particular, the effect of a fault rupture or severe ground shaking (associated with a high
ii Natural Hazards on the Taieri Plains, Otago
magnitude earthquake) on flood risk is considered. Information about the possible effects of a
predicted warmer climate and higher sea level is also presented.
Decisions on land use need to take the complex hazard setting of the Taieri Plains into
consideration to ensure that activities are compatible with the hazard exposure and the
residual risk across the range of natural hazards. This report is intended to help inform those
decisions and other risk-reduction initiatives.

Natural Hazards on the Taieri Plains, Otago iii
Table of contents
1. Introduction .................................................................................................................. 1
2. Social setting................................................................................................................. 4
3. Environmental setting ................................................................................................. 14
3.1 Geology and topography .................................................................................... 14
3.2 Precipitation ....................................................................................................... 17
3.3 Surface water ..................................................................................................... 21
3.4 Groundwater ...................................................................................................... 31
4. Flood hazard ............................................................................................................... 33
4.1 Repeat flood events ............................................................................................ 33
4.2 Modification of the flood hazard ........................................................................ 37
4.3 Variation in flood hazard by location ................................................................. 45
Area 1: West Taieri Plain ............................................................................... 47
Area 2: Maungatua foothills ........................................................................... 51
Area 3: Waipori; Area 4: South of Waipori River; Area 5: South of
Meggatburn ........................................................................................ 52
Area 6: North of Lake Waipori; Area 7: South of Lake Waipori; Area 8:
Lakes Waipori and Waihola ............................................................... 52
Area 9: Henley ............................................................................................... 53
Area 10: Lower Taieri Floodway ...................................................................... 56
Area 11: Taieri River Berms ............................................................................. 57
Area 12: East Taieri Upper Pond ...................................................................... 58
Area 13: Upper Pond Ring Banks ..................................................................... 59
Area 14: North Taieri ....................................................................................... 60
Area 15: East of the Upper Pond ...................................................................... 62
Area 16: Dukes Road North.............................................................................. 64
Area 17: East Taieri Lower Pond ...................................................................... 65
Area 18: South of Owhiro Stream ..................................................................... 66
Area 19: East of the Lower Pond ...................................................................... 67
Area 20: Mosgiel .............................................................................................. 67
Area 21: Wingatui ............................................................................................ 67
Area 22: Flanks of coastal ranges ..................................................................... 67
5. Alluvial-fan hazard ..................................................................................................... 68
6. Landslides ................................................................................................................... 72
7. Seismic hazard ............................................................................................................ 76
7.1 Known faults on the Taieri Plains....................................................................... 76

iv Natural Hazards on the Taieri Plains, Otago
7.2 Surface-fault rupture .......................................................................................... 79
7.3 Ground shaking .................................................................................................. 80
7.4 Liquefaction, settlement of soils and lateral spreading ........................................ 80
7.5 Earthquake-induced landslides ........................................................................... 83
8. Tsunami hazard ........................................................................................................... 84
9. Conclusion .................................................................................................................. 87
10. Glossary ...................................................................................................................... 88
11. References .................................................................................................................. 91
12. Appendices ................................................................................................................. 95
Appendix 1 – Geological timeline ............................................................................... 95
Appendix 2 – Flood-storage frequency relationship for the East Taieri Upper Pond .... 96
Appendix 3 – Modified Mercalli Intensity Scale (Opus, 2005) .................................... 97
Appendix 4 – Modelled tsunami-inundation extents – 50cm rise in sea level ............. 101

Ch 1. Introduction 1
1. Introduction
The Taieri Plains is a low-lying, relatively flat expanse of land located to the west of Dunedin
city (Figure 1.1), covering an area of 21,000 hectares. Used for rural, residential, commercial
and industrial activities, the Taieri Plains is home to about 15,000 people, mostly clustered in
and around the urban area of Mosgiel. The main land use is agriculture, an activity that was
established with the arrival of the first European settlers in the mid-1800s. The land is highly
productive, with fertile soils providing ideal conditions for crop and pasture growth. Dunedin
International Airport is also nestled at the centre of the plains.
Figure 1.1 The Taieri Plains (looking south from Flagstaff).
A number of small rural and rural-residential communities are located at the edges of the
plains (Figure 1.2). The proximity of the plains to Dunedin city and the flat landscape have
contributed to the area’s popularity for rural-residential development. Census data (1996 to
2006) show that the population on the northern side of the Silver Stream (North Taieri) has
increased from 530 in 1996 to 698 in 2006 (~25% increase). During the same period, Mosgiel
experienced a population increase of about 504 (a 5% increase), compared to an increase of
about 0.5% in the wider Dunedin City district.

2 Ch 1. Introduction
Figure 1.2 Communities on the Taieri Plains.
The alluvium-filled basin that makes up the Taieri Plains is bound by an extensive fault
system to the north and south. The gentle topography, which grades from about 40m in the
east to below sea level in the west, provides the largest expanse of flat land near Dunedin
city. The Taieri River, the second longest river in Otago and fifth longest in New Zealand,
meanders across the Taieri Plains before flowing out to sea at Taieri Mouth, via the Lower
Taieri Gorge. The Taieri River is tidal at least as far upstream as Allanton, with lakes
Waihola and Waipori also influenced by the rise and fall of the tide. Two major tributaries of
the Taieri River also cross the Taieri Plains: the Silver Stream, from the north-east, and the
Waipori River, from the south-west.
The Taieri Plains and environs have a complex-hazard setting that has shaped it and affects
how it is used. Possible hazards include the plain’s exposure to flood inundation from various
sources, seismic activity and, to a lesser degree, landslides, alluvial-fan and tsunami hazard.
Other weather-related features, such as strong winds and heavy snow (Figure 1.3), also
present hazards, although these are not discussed in detail in this report. The level of risk
these hazards present varies across the plains, depending on the nature and scale of the hazard
and the nature and vulnerability of the features exposed to that hazard. Therefore, decisions
on land use need to take these hazards and their variability into account to ensure that human
activities are compatible with the hazard exposure. This report is intended to help inform
those decisions and other risk-reduction initiatives.
Earlier reports about natural hazards on the Taieri Plains have tended to focus on flood-
hazard mitigation and the subsequent modification of flood hazard, usually through
engineering works, and often associated with a particular locality or issue. This report
combines information about residual-flood risks (the part of the risk that is not managed), and

Ch 1. Introduction 3
attempts to assess the residual risks of alluvial-fan, seismic, landslide and tsunami on the
plain in general.
The following sections describe the social and natural setting of the Taieri Plains and the
wider Taieri River catchment, and give an overview of how the flood hazard has been
modified (but not eliminated) through engineering works over the past 150 years. The report
then goes on to outline the risk of flooding, alluvial-fan, landslide, seismic and tsunami
hazards, including their possible effects, based on knowledge of the natural processes of the
area.
Figure 1.3 Heavy snow on the Taieri Plain, August 2004 (Source: Otago Daily
Times).

4 Ch 2. Social setting
2. Social setting
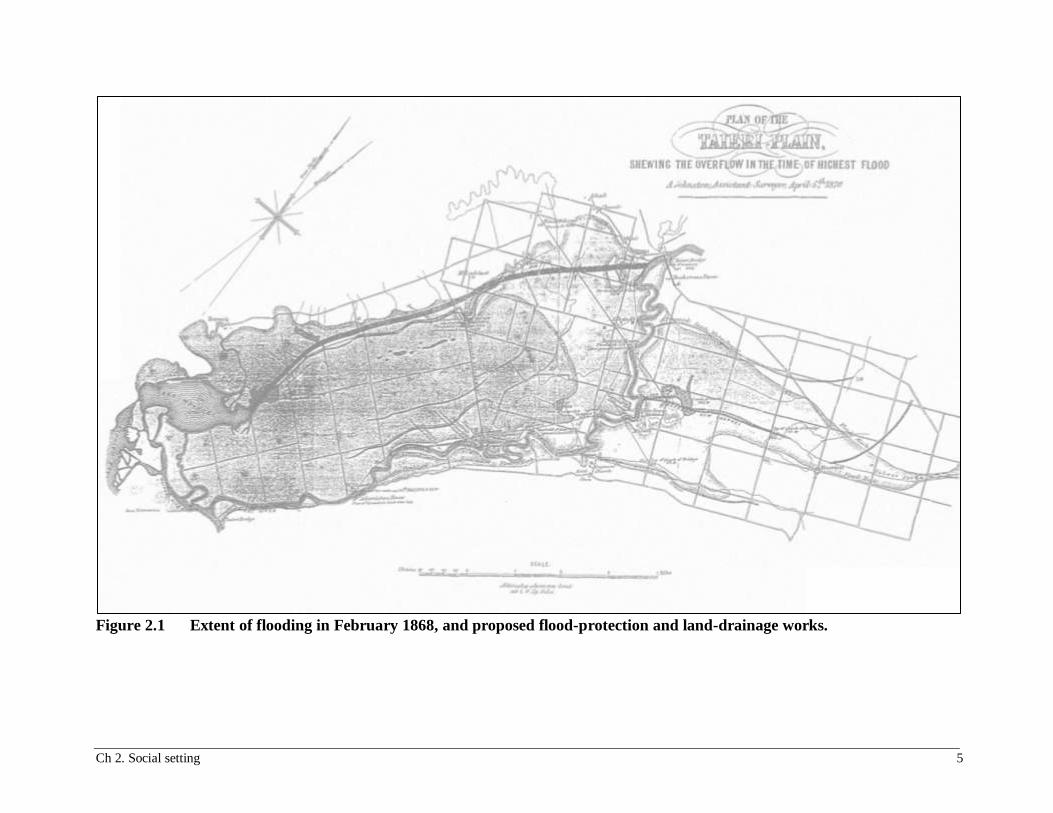
Residential activity is generally clustered around four areas: Mosgiel, Outram, Allanton and
North Taieri. An awareness of flood hazard through knowledge of flood history appears to
have influenced the placement of these settlements, with all four being largely located beyond
the flood extents observed in the late 19th century (Figure 2.1 and Figure 2.2). This
awareness of flood history apparently led to an early desire for engineered modifications of
the Taieri River, Silver Stream and many other parts of the plains (Figure 2.2), including
land-drainage works.
Ch 2. Social setting 5
Figure 2.1 Extent of flooding in February 1868, and proposed flood-protection and land-drainage works.

6 Ch 2. Social setting
Figure 2.2 Extent of flooding in May 1923, showing the communities of Mosgiel, Allanton and Outram. The map also
records the extent of flooding in 1868, from Figure 2.1.
Ch 2. Social setting 7
As settlers arrived in Dunedin during the mid-1800s, the search began for expanses of flat
land to develop into farms and market gardens. Despite being one of the largest areas of flat
land near Dunedin city, the Taieri Plains were not considered suitable at first. During a visit
in 1844, with Frederick Tuckett, official surveyor to the New Zealand Company, Dr David
Munro, a politician and speaker of the House of Representatives, noted that:
‘About the upper third of the Taieri basin is, in my opinion, available but the two lower thirds
can hardly be called ‘terra firma’, being, in fact, an immense grass – tree swamp, through
which canals of black sluggish water wind in various direction, and interspersed with
stagnant lagoons. And I very much fear that this swamp is not susceptible of being drained,
for its level is not above that of the sea’ (Houston, 1966).
Dr Munro’s observations suggest that, before European settlement and later drainage of the
plains, the plain was subject to flooding from even a modest variation in flows of the Taieri
River (Houston, 1966). Overland flow from the Maungatua Range, variations in the level of
Lake Waipori and tidal influences contributed to the western part of the plains being in a
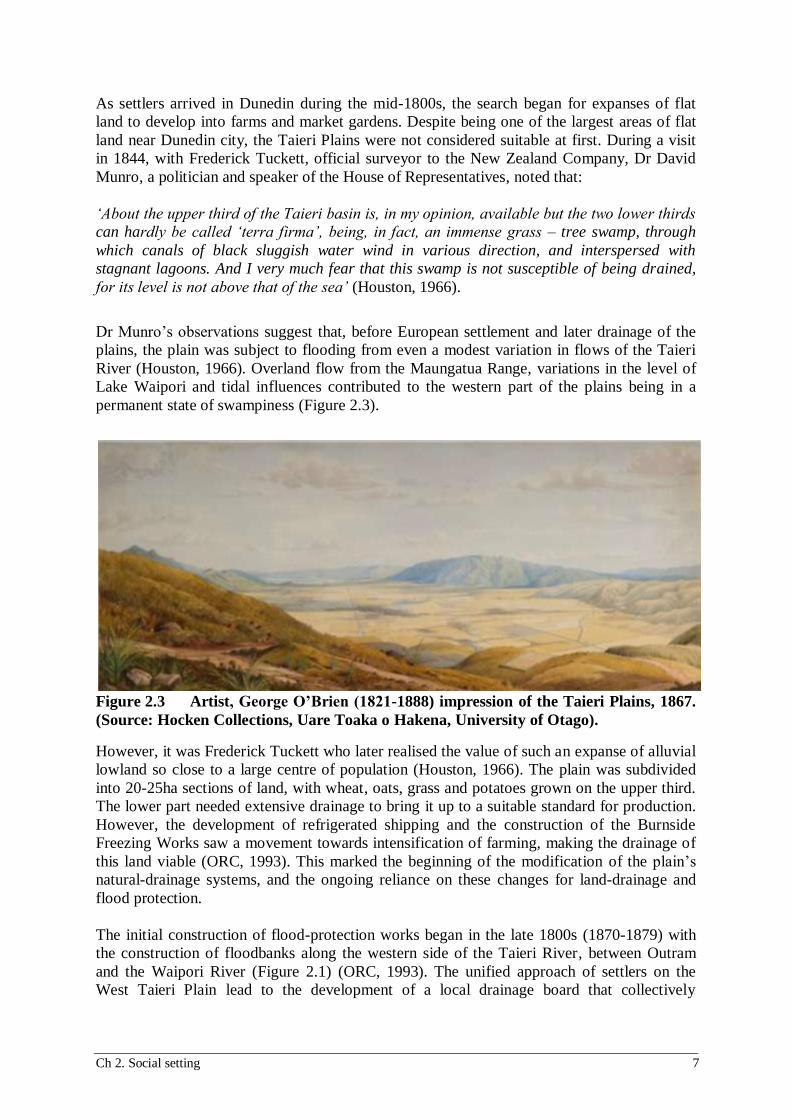
permanent state of swampiness (Figure 2.3).
Figure 2.3 Artist, George O’Brien (1821-1888) impression of the Taieri Plains, 1867.
(Source: Hocken Collections, Uare Toaka o Hakena, University of Otago).
However, it was Frederick Tuckett who later realised the value of such an expanse of alluvial
lowland so close to a large centre of population (Houston, 1966). The plain was subdivided
into 20-25ha sections of land, with wheat, oats, grass and potatoes grown on the upper third.
The lower part needed extensive drainage to bring it up to a suitable standard for production.
However, the development of refrigerated shipping and the construction of the Burnside
Freezing Works saw a movement towards intensification of farming, making the drainage of
this land viable (ORC, 1993). This marked the beginning of the modification of the plain’s
natural-drainage systems, and the ongoing reliance on these changes for land-drainage and
flood protection.
The initial construction of flood-protection works began in the late 1800s (1870-1879) with
the construction of floodbanks along the western side of the Taieri River, between Outram
and the Waipori River (Figure 2.1) (ORC, 1993). The unified approach of settlers on the
West Taieri Plain lead to the development of a local drainage board that collectively

8 Ch 2. Social setting
undertook work in that area, including the construction and ongoing maintenance of the early
flood banks, drainage schemes and the West Taieri Contour Channel (Figure 2.4).
Figure 2.4 Early construction of the Contour Channel on the West Taieri Plain (circa
1915).
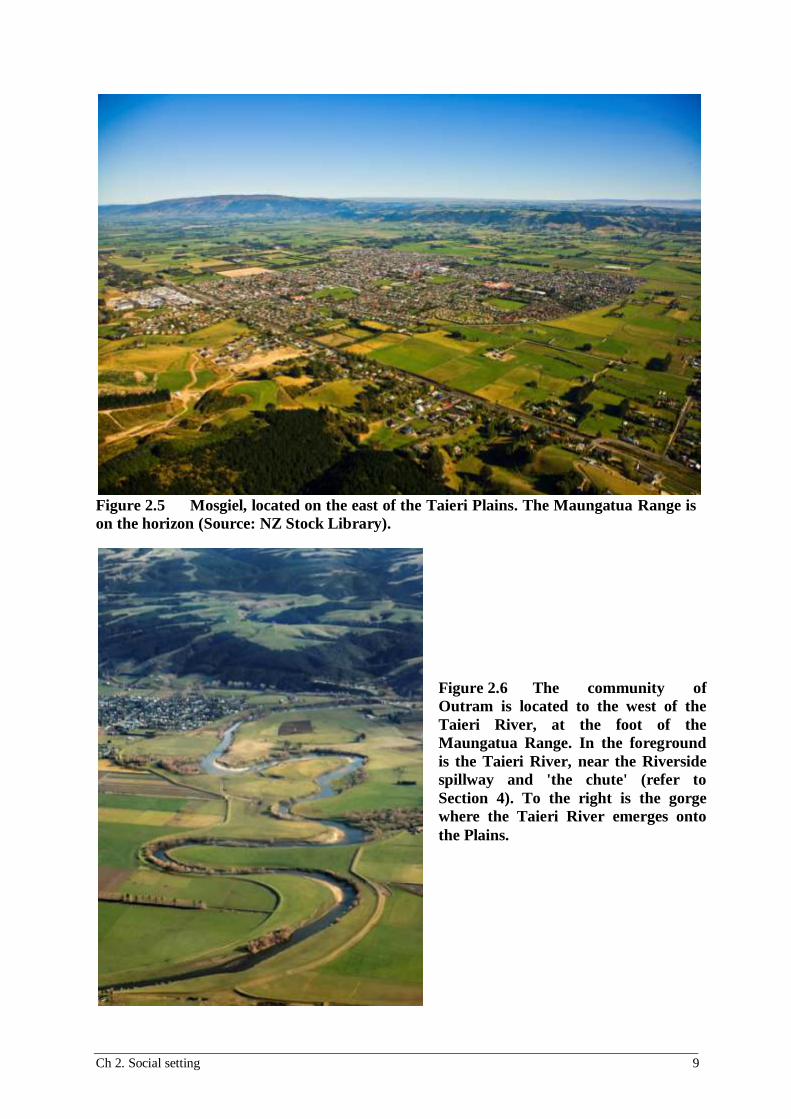
About the same time, Mosgiel, located on the plain’s elevated eastern section, continued to
develop as the area’s main population centre. The introduction of the rail system and a major
woollen mill in the 1870s caused a rapid growth in Mosgiel’s population. Today,
approximately about 15,000 people live on the Taieri Plains, with most still living in and
around Mosgiel (Figure 2.5), which provides the services and amenities of a small satellite
town, including a commercial precinct along Gordon Road, the town’s main street. Smaller
communities include Outram (Figure 2.6), Wingatui, East Taieri, Momona, Henley and
Berwick, most of which were also established in the late 19th century (Figure 2.1 and Figure
2.2).
Ch 2. Social setting 9
Figure 2.5 Mosgiel, located on the east of the Taieri Plains. The Maungatua Range is
on the horizon (Source: NZ Stock Library).
Figure 2.6 The community of
Outram is located to the west of the
Taieri River, at the foot of the
Maungatua Range. In the foreground
is the Taieri River, near the Riverside
spillway and 'the chute' (refer to
Section 4). To the right is the gorge
where the Taieri River emerges onto
the Plains.
10 Ch 2. Social setting
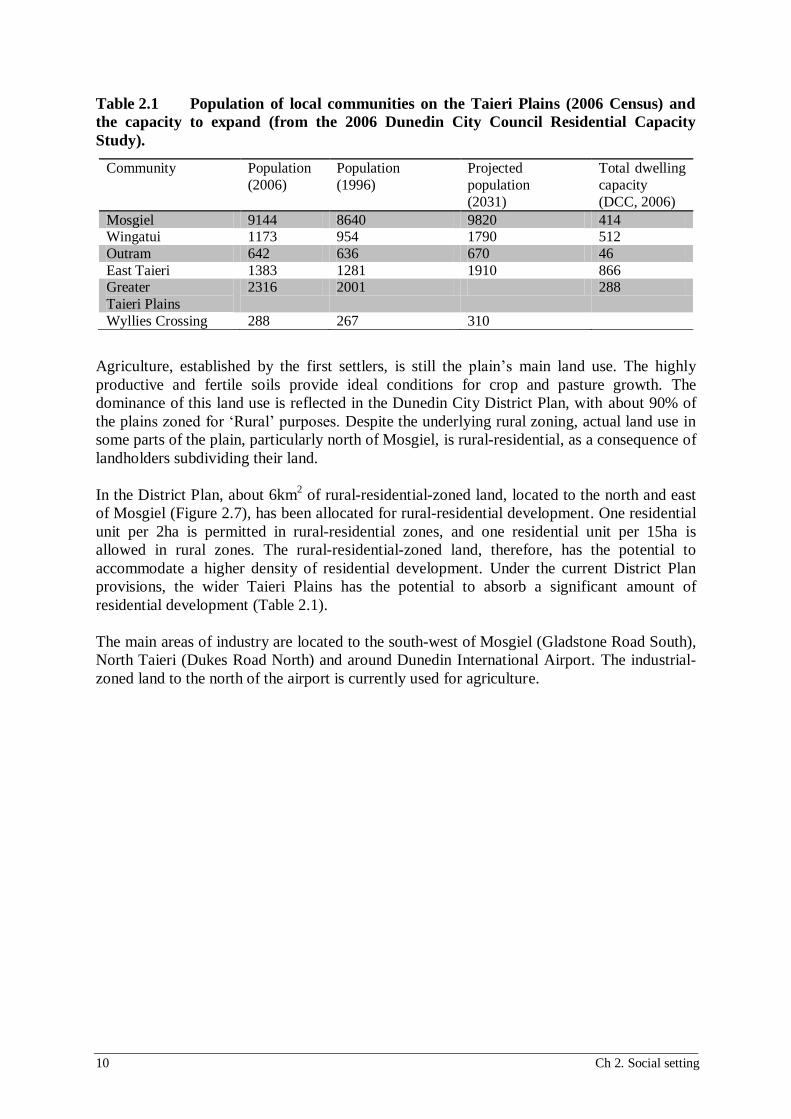
Table 2.1 Population of local communities on the Taieri Plains (2006 Census) and
the capacity to expand (from the 2006 Dunedin City Council Residential Capacity
Study).
Agriculture, established by the first settlers, is still the plain’s main land use. The highly
productive and fertile soils provide ideal conditions for crop and pasture growth. The
dominance of this land use is reflected in the Dunedin City District Plan, with about 90% of
the plains zoned for ‘Rural’ purposes. Despite the underlying rural zoning, actual land use in
some parts of the plain, particularly north of Mosgiel, is rural-residential, as a consequence of
landholders subdividing their land.
In the District Plan, about 6km2 of rural-residential-zoned land, located to the north and east
of Mosgiel (Figure 2.7), has been allocated for rural-residential development. One residential
unit per 2ha is permitted in rural-residential zones, and one residential unit per 15ha is
allowed in rural zones. The rural-residential-zoned land, therefore, has the potential to
accommodate a higher density of residential development. Under the current District Plan
provisions, the wider Taieri Plains has the potential to absorb a significant amount of
residential development (Table 2.1).
The main areas of industry are located to the south-west of Mosgiel (Gladstone Road South),
North Taieri (Dukes Road North) and around Dunedin International Airport. The industrial-
zoned land to the north of the airport is currently used for agriculture.
Community Population
(2006)
Population
(1996)
Projected
population
(2031)
Total dwelling
capacity
(DCC, 2006)
Mosgiel 9144 8640 9820 414 Wingatui 1173 954 1790 512
Outram 642 636 670 46
East Taieri 1383 1281 1910 866 Greater
Taieri Plains
2316 2001 288
Wyllies Crossing 288 267 310

Ch 2. Social setting 11
Figure 2.7 Land uses on the Taieri Plains, as defined in the Dunedin City District
Plan (DCC, 1999).
12 Ch 2. Social setting
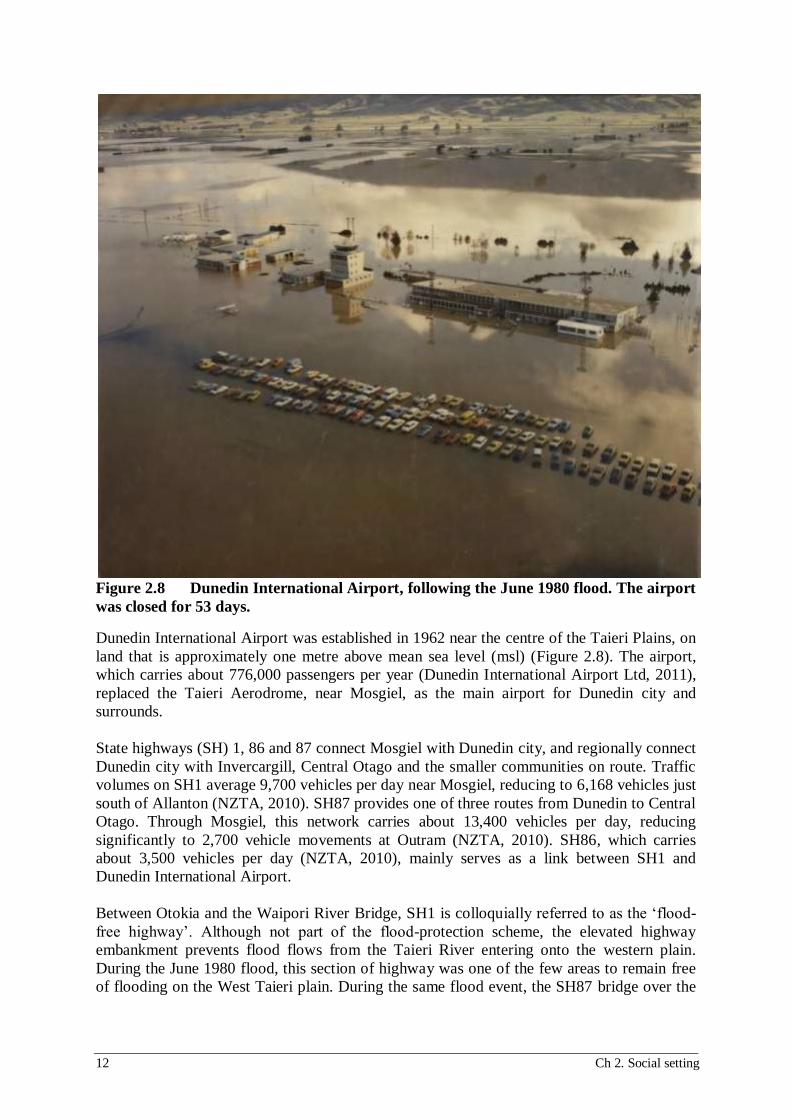
Figure 2.8 Dunedin International Airport, following the June 1980 flood. The airport
was closed for 53 days.
Dunedin International Airport was established in 1962 near the centre of the Taieri Plains, on
land that is approximately one metre above mean sea level (msl) (Figure 2.8). The airport,
which carries about 776,000 passengers per year (Dunedin International Airport Ltd, 2011),
replaced the Taieri Aerodrome, near Mosgiel, as the main airport for Dunedin city and
surrounds.
State highways (SH) 1, 86 and 87 connect Mosgiel with Dunedin city, and regionally connect
Dunedin city with Invercargill, Central Otago and the smaller communities on route. Traffic
volumes on SH1 average 9,700 vehicles per day near Mosgiel, reducing to 6,168 vehicles just
south of Allanton (NZTA, 2010). SH87 provides one of three routes from Dunedin to Central
Otago. Through Mosgiel, this network carries about 13,400 vehicles per day, reducing
significantly to 2,700 vehicle movements at Outram (NZTA, 2010). SH86, which carries
about 3,500 vehicles per day (NZTA, 2010), mainly serves as a link between SH1 and
Dunedin International Airport.
Between Otokia and the Waipori River Bridge, SH1 is colloquially referred to as the ‘flood-
free highway’. Although not part of the flood-protection scheme, the elevated highway
embankment prevents flood flows from the Taieri River entering onto the western plain.
During the June 1980 flood, this section of highway was one of the few areas to remain free
of flooding on the West Taieri plain. During the same flood event, the SH87 bridge over the

Ch 2. Social setting 13
Taieri River, near Outram, suffered significant damage. The central bridge piers and bridge
deck were completely demolished by flood flows in the Taieri River (Figure 2.9).
Figure 2.9 A. Outram Bridge during the June 1980 flood (6 June at 3pm); B. Outram
Bridge, with temporary Bailey bridge constructed post-event.
The South Island Main Trunk Railway crosses the southern part of the Taieri Plains and, for
the most part, runs close to and parallel with SH1. The railway is built on an embankment
elevated above the plain, but can be overtopped by floodwater at several locations (Figure
2.10), disrupting train operations.
A second railway line deviates from the main trunk near Wingatui, providing a rail
connection between Dunedin and Middlemarch, used mainly by the Taieri Gorge excursion
train. A siding provides access to the industrial precinct in North Taieri.
Figure 2.10 South Island Main Trunk Railway, after the April 2006 flood on the
Taieri Plains. The south-bound train was forced to stop and wait.
B A
14 Ch 3. Environmental setting
3. Environmental setting
Tectonic, climatic and sea-level changes have influenced the landscape of the Taieri Plains,
creating a complex environmental setting, which engineering and land drainage works have
further modified. The environmental setting gives rise to the plain’s natural hazards, such as
flooding and liquefaction; however, its positive attributes, such as its fertile land and reliable
rainfall, both of which allow the land to be intensively developed and occupied, have also
increased the risks of these hazards.
The topography of the Taieri Plains is largely determined by its geology and that of the wider
Taieri River catchment within which it lies; its climate is influenced by its topography and
setting. Climate and topography affect surface-water hydrology and are determined in part
by the plain’s elevation and catchment, relative to sea level. Groundwater is also influenced
by elevation relative to sea level and geology. These aspects of the plain’s setting are
discussed next, in the context of natural hazards. Each natural hazard is discussed in more
detail in subsequent sections.
3.1 Geology and topography
The Taieri Plains are part of the wider Taieri River catchment, which covers an area of
approximately 5,700km between Central Otago and the Pacific Ocean coastline. The Taieri
River catchment is dominated by schist-block mountains and fault-controlled basins (OCB,
1983). Between 99 and 2.6 million years ago1, the schists were uplifted by tectonic processes.
Over time, these have eroded to form the Otago peneplain surface, on which sediments have
subsequently been deposited (Norris and Nicholls, 2004). Throughout the catchment, the
peneplain surface is broken by numerous post-peneplanation faults, of which those associated
with the Taieri-Tokomairiro depression are the most significant (Bishop and Turnbull, 1996).
The Taieri Plain and the Tokomairiro Plain, to the south, formed within this depression. The
peneplain is also obscured beneath distinct landforms, such as the Dunedin Volcano Complex
to the north-east.
The Taieri-end of the depression rests between the Maungatua and North Taieri faults to the
north-west and the Titri Fault to the south-east. Movement along these faults has resulted in
the north-west (Maungatua) and south-east (coastal) mountain blocks being up-thrust relative
to the basin floor (ORC, 2010b) (Section 7). Continued movement along these faults (over
long geological timeframes) has also resulted in subsidence of the basin floor. It is not known
whether the basin floor is still subsiding (Irricon, 1994). Any further subsidence would have
implications for hazards on the Taieri Plains that are influenced by the difference between
ground level and sea level.
As with the wider Taieri River catchment, Otago Schist forms the basement rock beneath the
Taieri Plains. The depth to the schist basement is estimated to be between 150 to 300m in
places (Bishop and Turnbull, 1996; Irricon, 1994).
The Quaternary2 geology of the area reflects the depositional and tectonic processes of the
past 2 million years. The underlying depression is largely filled with Quaternary silts, sands
1 The geological time period between 99 to 65 million years before present is also known as the ‘Late
Cretaceous’ period. The ‘Early Tertiary’ period refers to a geological time period about 65 to 2.6 million years
before present. Refer to Appendix 1 for a geological timeline. 2 See the Glossary for a definition of this and other geological terms. See Appendix 1 for a geological timeline.

Ch 3. Environmental setting 15
and gravels derived from the Otago schists (Tonkin & Taylor, 2005). On the West Taieri
Plain, the Taieri and Waipori rivers have built extensive alluvial surfaces (Barrell et al.,
1999). Young alluvial fans grade into these surfaces, most notably along the margins of the
Maungatua Range. On the East Taieri Plain, an extensive alluvial surface has established
from the Silver Stream and the merging of the lower portions of alluvial-fan features from the
surrounding hill catchments.
Sea-level change has also had an influence on the topography of the Taieri Plains area, and
the composition of the stratigraphy which underlies them (as discussed in Section 3.4). Much
of this area was rapidly inundated by the sea and estuary waters between 8,000 and 4,000
years ago. The toes of many intermediate and old alluvial fans and the distribution and
morphology of cliff and gully features suggest that they were formed by wave action at the
margins of an extensive body of standing water (lake or marine inlet) during the Holocene
period (Barrell et al., 1999).
Figure 3.1 Geology of Taieri Basin (adapted from Bishop and Turnbull, 1996).
The Taieri Plains have formed in a basin, about 30km long, and orientated northeast-
southwest at the southern end of the Taieri River catchment (Figure 3.2). The plains are
bound to the north by the Maungatua Range (865m), to the east by the flanks of Flagstaff
(668m), to the west by lakes Waipori and Waihola, and to the south by the lower coastal hills
(Chain Hills, Saddle Hill, Scroggs Hill, Otokia Hill) (Figure 3.3). They are connected to the
coast by the narrow, 10km long Lower Taieri Gorge.
The Taieri Basin is characterised by flat, gently sloping land, and dissected by the
meandering Taieri River, which creates two distinctly separate areas, locally referred to as
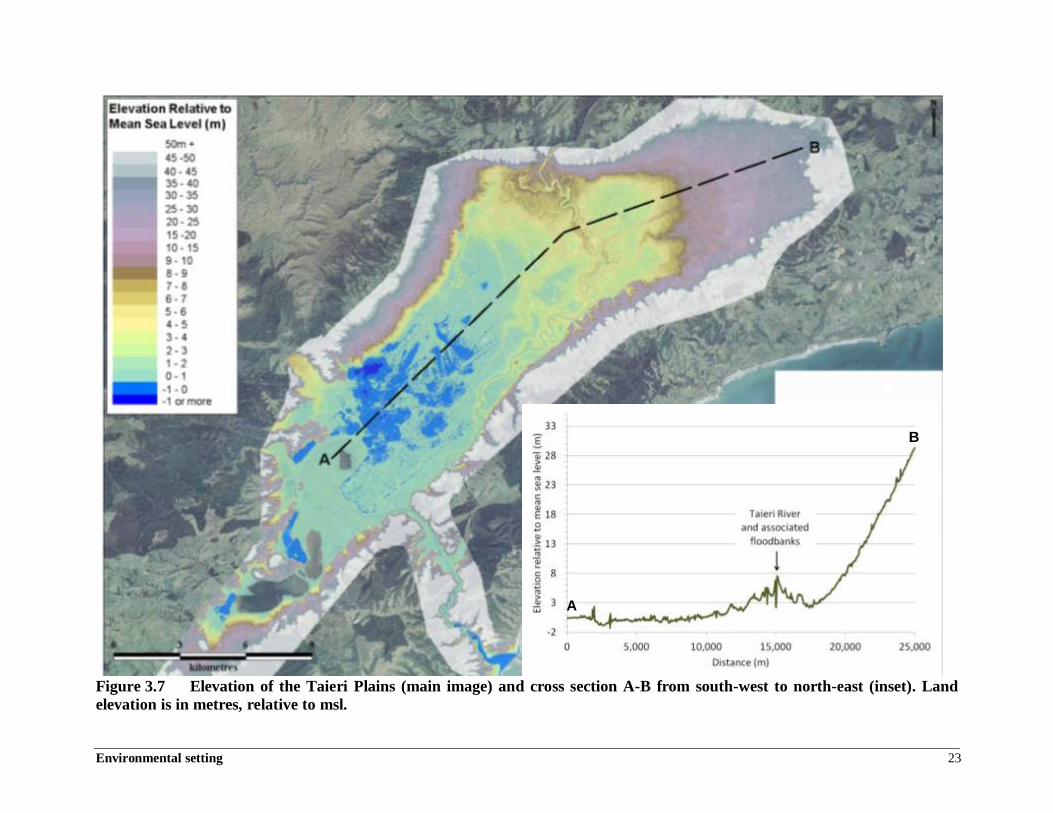
‘East Taieri’ and ‘West Taieri’. Elevated about 40m above msl at its northern end, the land

16 Ch 3. Environmental setting
grades down to within a couple of metres of sea level to the south-west (ORC, 2010b). The
lowest parts of the plains (excluding drains and ditches) lie about 1.5m below msl (Figure
3.7).
Figure 3.2 Topography of the Taieri River catchment.

Ch 3. Environmental setting 17
Figure 3.3 Digital Elevation Model of the Taieri Plains. Oblique image, looking
north-east, up the Taieri Basin.
3.2 Precipitation
The frequency and magnitude of hazards such as flooding, landslides and alluvial fans are
closely related to the rainfall events from which they are derived. Antecedent conditions
(driven by longer-term weather patterns) within the catchment can also have a direct
influence, by affecting groundwater and soil-moisture levels, for example.
The coastal sector of the Taieri River catchment is characterised by a cool, temperate, sub-
humid maritime climate (Glassey et al., 2001). Mean annual rainfall is generally between
650-750mm/year in the Taieri Basin (Table 3.1), and up to 1,300mm/year in the Maungatua
Range to the west and Silver Peaks to the north. Further inland, the upper Taieri River
catchment includes some of the driest areas in New Zealand, with less than 500mm of rain

18 Ch 3. Environmental setting
per year in some places. The upper to central catchment area is characterised by a semi-arid,
semi-continental climate, with hot summers and cold frosty winters.
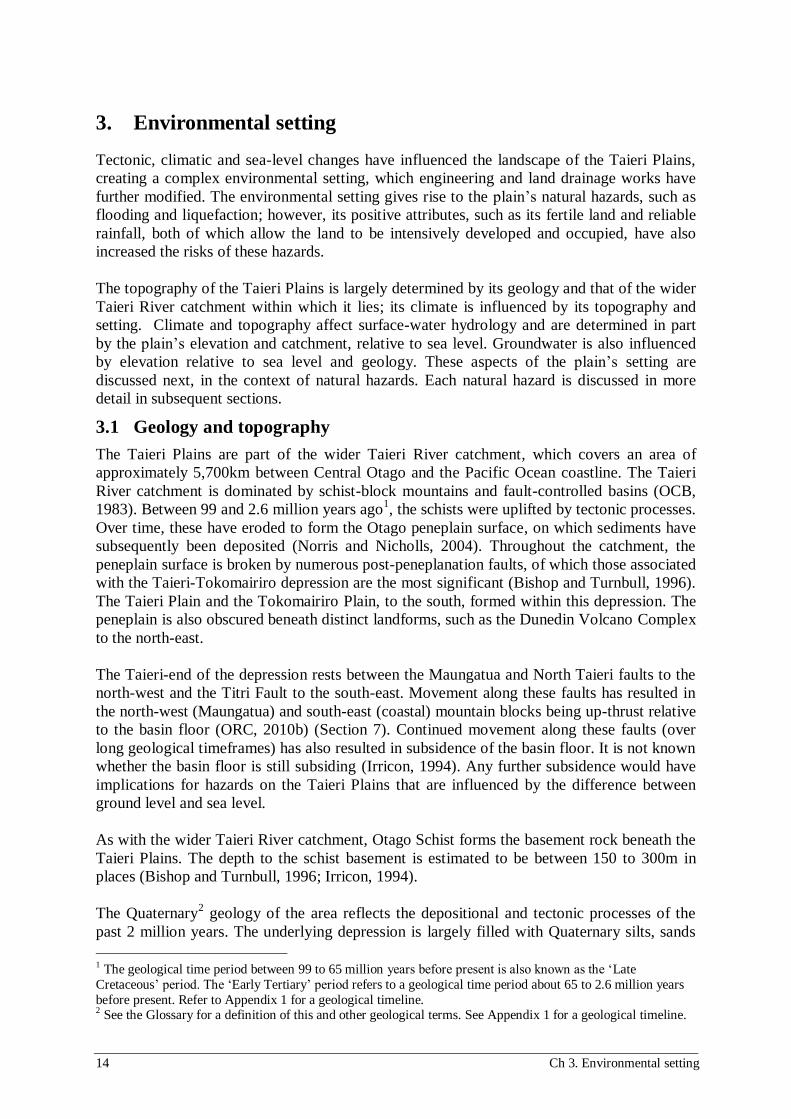
Table 3.1 Rainfall characteristics of the Taieri Plains and the hills to the north, as at
December 2011. The location of the measurements is shown on Figure 3.4.
Site and length of
record Altitude (m)
Mean
annual
rainfall
(mm)
Maximum
annual
rainfall
(mm)
Minimum
annual
rainfall
(mm)
Maximum
daily rainfall
(mm)
Silver Stream at
Riccarton Road (1989-2011)
15 654 1024.5
(2000)
416
(1990)
164.5
(26 Apr 2006)
Mosgiel (1952-2011)
8 684 1023.8
(2000)
415
(1985)
147.2
(26 Apr 2006)
Maungatua (1971-2011)
25 787 1060
(1994)
448
(1985)
122
(26 Apr 2006)
Dunedin Airport (1963-2011)
1 654 904.6
(1983)
412
(1985)
134.8
(26 Apr 2006)
Deep Stream at
SH87
(1994-2011)
369 556.66 737.88
(1994) 381 (2003)
85.5
(26 April 2006)
Three O’clock
Stream at Lamb
Hill
(Aug 2010-2011)
160 N/A N/A N/A 95.2
(18 Oct 2011)
Silver Stream at
Swampy Spur
(2008-2011)
630 1325 1429
(2010)
1220
(2008)
164
(25 May 2010)
The more elevated parts of the upper catchment (i.e. Rock and Pillar Range, Rough Ridge
and the Lammerlaw Range) (Figure 3.2) experience a colder, wetter climate, typical of more
mountainous areas. Annual precipitation across the peaks of the ranges exceeds 1,200mm,
with much of this falling as snow during the winter.
A number of perceptible trends in annual rainfall were evident across the lower South Island
during the latter part of the 20th century, including an increase in rainfall in the west and in
south Otago, and a trend towards drier conditions in the east (Mojzisek, 2005). No obvious
trends were evident at rainfall sites on the Taieri Plain during this period, although these sites
generally have relatively short records, or extensive periods of missing record.3
3 ORC has provided additional information about the spatial distribution of average (annual and seasonal)
rainfall on the Taieri Plain and surrounding area through growOTAGO (http://growotago.orc.govt.nz).
Ch 3. Environmental setting 19
Figure 3.4 Locations of the rainfall measurements presented in Table 3.1.
Of more importance to weather-related natural hazards (such as flooding) are the
characteristics of extreme rainfall events (i.e. storms). Precipitation extremes in the east of the
South Island generally became less frequent and less intense between 1951 and 2003
(Mojzisek, 2005). Stations with long-term records nearest to the Taieri Plains (Musselburgh
and Ross Creek) showed a similar trend, with decreases in rainfall intensity and very wet
days4 occurring during that period.
Rainfall stations on the Taieri Plains generally have a shorter record than those used by
Mojzisek, or are missing data from the early part of their record. Figure 3.5 gives an updated
analysis (using Mojzisek’s methodology) of the full length of continuous record up to
December 2011 at stations within the lower Taieri catchment. The figure shows changes over
time (since records began) for the following parameters: (a) the highest 5-day precipitation
amount (b) total annual precipitation (c) the number of wet days5 (d) the average intensity of
rainfall (e) the number of very wet days and (f) the percentage of annual rainfall falling on
very wet days.
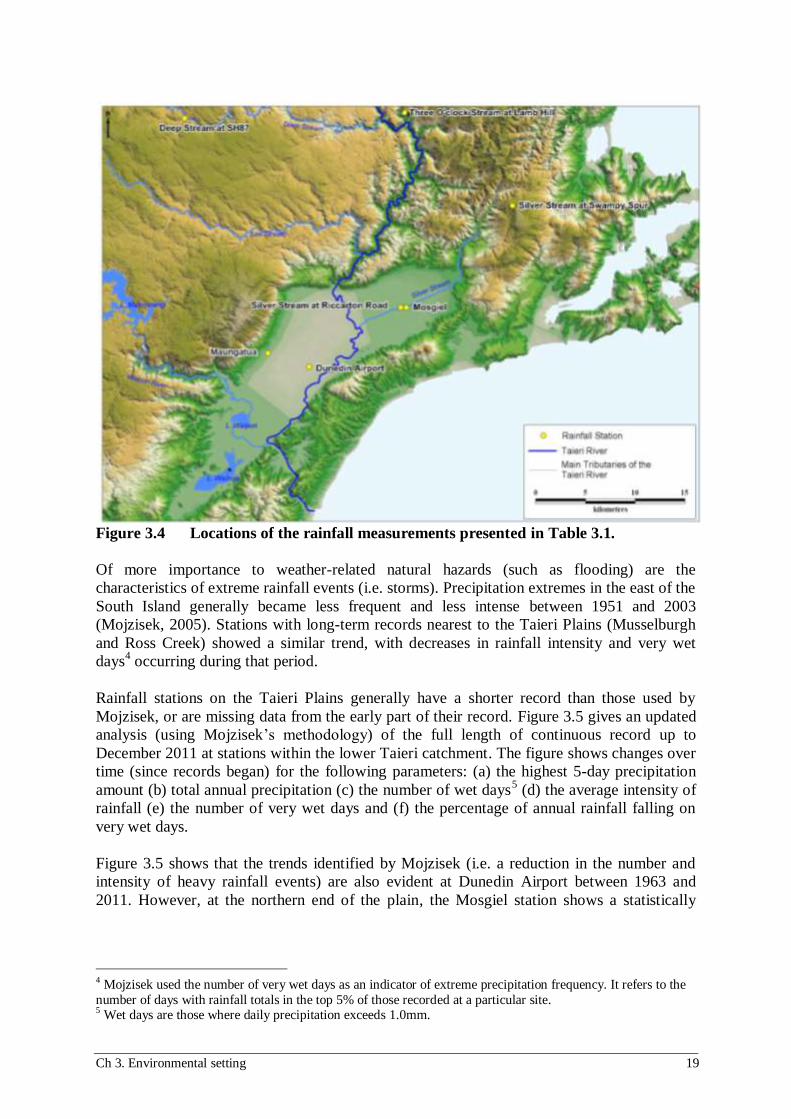
Figure 3.5 shows that the trends identified by Mojzisek (i.e. a reduction in the number and
intensity of heavy rainfall events) are also evident at Dunedin Airport between 1963 and
2011. However, at the northern end of the plain, the Mosgiel station shows a statistically
4 Mojzisek used the number of very wet days as an indicator of extreme precipitation frequency. It refers to the
number of days with rainfall totals in the top 5% of those recorded at a particular site. 5 Wet days are those where daily precipitation exceeds 1.0mm.
20 Ch 3. Environmental setting
significant6 increase in the number of very wet days (Figure 3.5e). Both Mosgiel and the
nearby Riccarton Road station also show a general increasing trend7 in the percentage of
rainfall which falls on very wet days (Figure 3.5f) and the highest 5-day precipitation
amounts (Figure 3.5a). Figure 3.5 shows that there is localised variability in extreme rainfall
patterns, and that the northern end of the Taieri Plain (including the Silver Stream catchment)
has experienced an increase in both the intensity and frequency of extreme rainfall events.
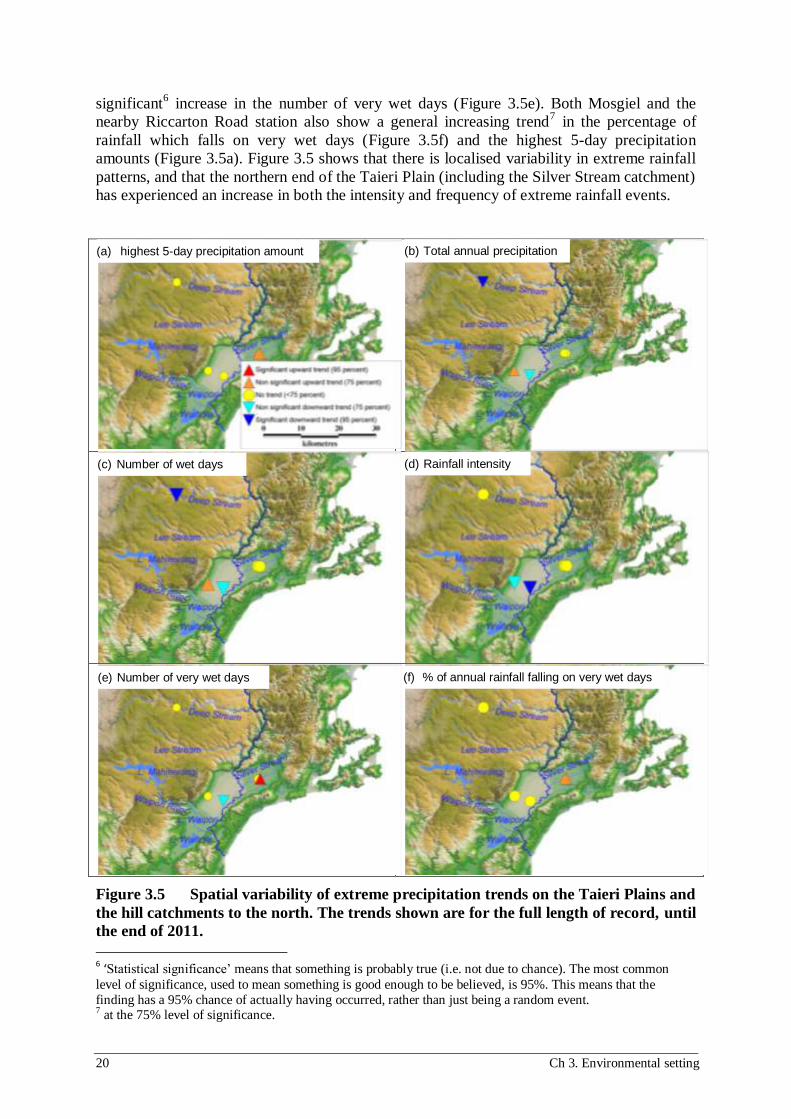
Figure 3.5 Spatial variability of extreme precipitation trends on the Taieri Plains and
the hill catchments to the north. The trends shown are for the full length of record, until
the end of 2011.
6 ‘Statistical significance’ means that something is probably true (i.e. not due to chance). The most common
level of significance, used to mean something is good enough to be believed, is 95%. This means that the
finding has a 95% chance of actually having occurred, rather than just being a random event. 7 at the 75% level of significance.
(a) highest 5-day precipitation amount (b) Total annual precipitation
(c) Number of wet days (d) Rainfall intensity
(e) Number of very wet days (f) % of annual rainfall falling on very wet days
Ch 3. Environmental setting 21
During the 20th century, climate stations near the Taieri Plains showed an overall warming
trend (Brown, 2006; Salinger and Griffiths, 2001). In Dunedin city (which is nearby and
experiences similar climatic conditions to the Taieri Plains), climate stations also showed an
increase in temperature of between 0.5 to 0.8ºC over the past century. Furthermore, records
show that, between 1940 and 1970, both the maximum and minimum temperature extremes
for the area have warmed, suggesting cold extremes are becoming less frequent, and warmer
extremes becoming more frequent. Since the 1970s, the warming trend has continued, but
only for the colder values (Brown, 2006).
Average temperature is predicted to increase by another 2ºC by 2100. Given that a warmer
atmosphere can hold more moisture, there is potential for storm events to bring heavier (or
more intense) rainfall, and to occur more frequently than has previously been observed (MfE,
2008). Heavy rain events, resulting from subtropical depressions drifting southward over
New Zealand, are likely to become more common. This type of event has the potential to
produce daily rainfall totals well in excess of the maximum daily rainfall totals observed to
date (Table 3.1).
However, a number of factors may influence regional trends in heavy rainfall patterns,
including the rugged topography of the hills surrounding the plains, the susceptibility of the
lower catchment to heavy rainfall events approaching from the east, and that the Taieri River
catchment’s location on the east coast of South Island is in the lee of the prevailing westerly
airflow. It is difficult to assess whether local topography and location will intensify or
moderate the effects of a warmer climate on extreme rainfall patterns in the Taieri River
catchment and on the Taieri Plains themselves. Previous trends (as discussed above) indicate
that changes in the intensity and frequency of heavy rainfall events has varied across the
plains, and this spatial variation may also continue under a warmer climate.
3.3 Surface water
Rising in the Lammerlaw and Lammermoor ranges, the Taieri River flows from the
headwaters for about 318km, before crossing the Taieri Plains and entering the Pacific Ocean
30km south-west of Dunedin (Figure 3.2). The river has eight main tributaries: the
Loganburn and Kyeburn in its upper reaches; the Sutton, Nenthorn, Deep and Lee Streams in
its central reaches; and the Silver Stream and Waipori River on its lower reaches. Other
hydrologic features include lakes Mahinerangi, Waipori and Waihola, and the Great Moss
Swamp, near the headwaters of the catchment.
The three main water courses on the Taieri Plains are the Taieri River, the Silver Stream and
the Waipori River. However, many other, smaller watercourses, drains and ephemeral swales
are associated with flood hazard (Figure 3.6 and Figure 4.3).

22 Ch 3. Environmental setting
Figure 3.6 Watercourses, drains and swales on the East Taieri Plain. Swales also
cross the plain on the south side of the Silver Stream (including through parts of
Mosgiel), although these features are not shown.
The Silver Stream originates in the Silver Peaks and emerges from the north-eastern corner of
the Taieri Plains. Initially flowing in a southerly direction, the Silver Stream follows a highly
modified channel through the centre of the eastern part of the Taieri Plains, joining the Taieri
River mid-way across the basin, about 4km upstream of Allanton. In the late 1800s, the Silver
Stream, below Puddle Alley, was diverted from its natural watercourse into its present
position, which flows straight to the Taieri River (Figure 2.1).
Flows from the Waipori River are semi-controlled by the Waipori hydro-electric scheme and
Lake Mahinerangi, entering the Taieri Plains at the south-western corner near Berwick. The
Waipori River is joined by the Contour Channel soon after emerging onto the plains, and
discharges into Lake Waipori before joining the Taieri River at Henley Ferry.
The Taieri River emerges from its schist-rock gorge near Outram and meanders across the
basin in a southerly direction before turning south-west at the foot of the coastal hills near
Allanton. Following the foot of the hills, the Taieri River joins the Waipori River at Henley
Ferry before exiting the basin through the Lower Taieri Gorge.
Environmental setting 23
Figure 3.7 Elevation of the Taieri Plains (main image) and cross section A-B from south-west to north-east (inset). Land
elevation is in metres, relative to msl.
A
B
24 Ch 3. Environmental setting
Most of the flood-producing storms on the Taieri Plains are easterly or southerly in origin and
are associated with depressions that slow or stall over Otago. Cold fronts, advancing from the
south, bring heavy falls over the central Taieri River catchment, moderately heavy falls over
the eastern areas and lighter falls in the northern regions (Houston, 1966; ORC, 2001). Unless
coupled with pre-existing high flows (as observed during the May 2010 flood (Figure 3.8)),
southerly fronts generally move swiftly across the catchment and are less conducive to
widespread flooding.
Cold fronts from the west tend to bring relatively heavy falls to the north-western edge of the
Taieri River catchment (including the Maniototo Plain). Heavy rainfall in the upper
catchment and any subsequent higher flows in the upper reaches of the Taieri River tend to be
moderated by the presence of the Taieri Scroll Plain (ORC, 2007b). Heavy falls in the upper
catchment do contribute to higher flows in the Taieri River at Outram and extend the duration
of flooding; however, by themselves, these events tend not to produce large floods on the
Taieri Plains.
Conversely, flood-producing storms approaching from the east bring heavy rainfall to the
eastern coastal regions, but produce little rain in areas west of the Rock and Pillar Range (i.e.
the upper catchment) (ORC, 2007b). On many occasions, the persistent easterly fronts have
brought the smaller tributaries of the Taieri Plains - the Silver Stream, Owhiro Stream,
Quarry Creek and Mill Creek - into flood. If the event is sufficiently confined and isolated,
easterly events can inundate parts of the East Taieri Plain adjacent to these watercourses, but
cause no appreciable rise of the Taieri River. More widespread easterly events, reaching into
Nenthorn, Sutton, Deep and Lee streams, can cause large flows in the Taieri River at Outram.
Due to the ‘horse-shoe’ shape of the upper Taieri River and the combination of plains,
wetlands and narrow gorges through which it passes (Figure 3.2), the pattern of flows in the
river can vary considerably along its length. High flows originating in the upper catchment
take several days to reach the plain, while high flows originating from tributaries closer to the
coast (e.g. Three O’clock Stream, Deep Stream and Silver Stream) can reach the plain in a
matter of hours. In addition, the watercourses that traverse the plain (including the Taieri
River, Silver Stream, Waipori River, Owhiro Stream, Quarry Creek and Mill Creek) will all
respond differently during a flood event, depending on the distribution and intensity of
rainfall across the catchment. As a result, the timing, magnitude and duration of the flood
peaks in these tributaries and in the main stem of the Taieri River will vary across the plains.
From its headwaters, the Taieri River flows through four main basins: the Styx and
Maniototo, in the upper catchment; the Strath Taieri, in the centre of the catchment; and the
Taieri, near the outlet to the ocean. Each basin is connected by confined river gorges.
Because of the essentially independent but hydrologically related basins, heavy rainfall
events that cover the whole catchment can result in multiple-flood peaks in the Taieri River
where it emerges onto the Taieri Plains at Outram (ORC, 1993) (Figure 3.8).
Ch 3. Environmental setting 25
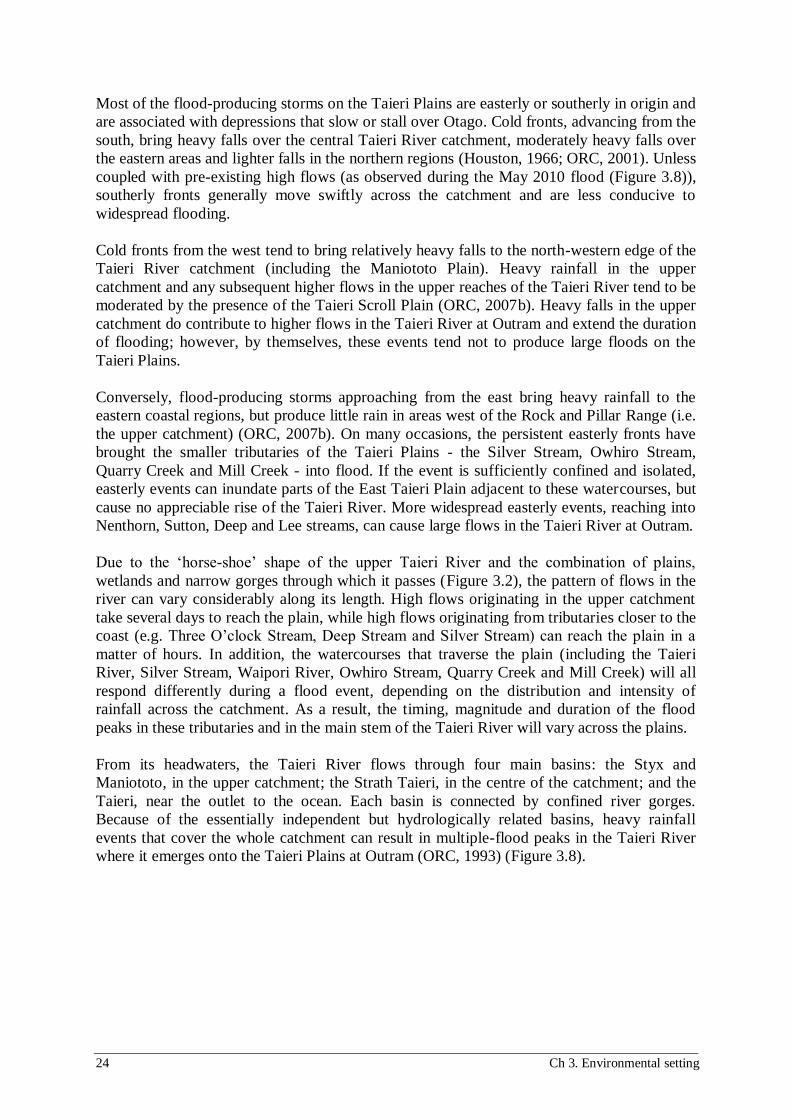
Figure 3.8 Changes in flow in the Taieri River at Outram during flood events in
1980, 1993, 2006, 2007 and 2010.
The first peak is generally the result of runoff from the catchment downstream of Sutton,
including the major tributaries of Deep, Lee, Nenthorn and Three O’clock streams (Figure
3.2). The second peak is the result of runoff from heavy rainfall further up the catchment,
with the moderating effect of the upper catchment (as described above) usually producing
flow magnitudes lower than the first peak. Figure 3.8 shows that a second peak in flow can
occur, for example, 12 (e.g. April 2006) or 26 hours (e.g. December 1993 and June 1980)
after the first peak. During the May 2010 event, the second flood peak, observed three days
after the first, resulted, in part, from a second, independent band of heavy rainfall crossing the
catchment.
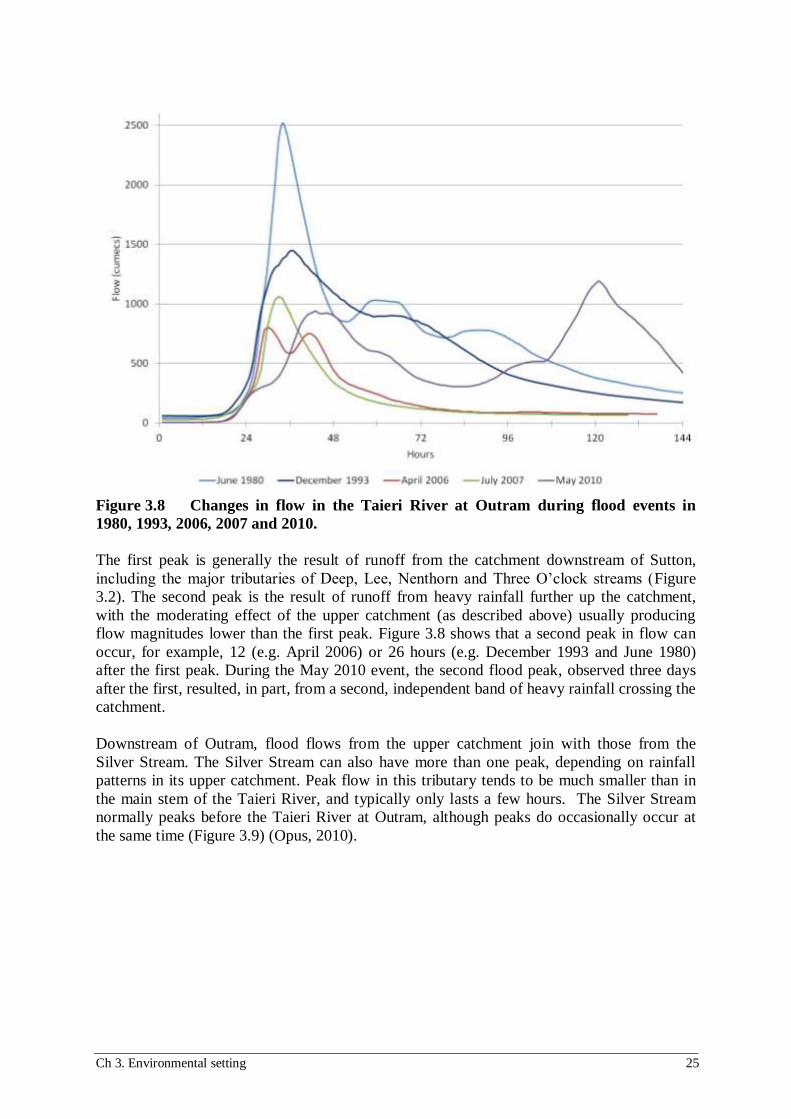
Downstream of Outram, flood flows from the upper catchment join with those from the
Silver Stream. The Silver Stream can also have more than one peak, depending on rainfall
patterns in its upper catchment. Peak flow in this tributary tends to be much smaller than in
the main stem of the Taieri River, and typically only lasts a few hours. The Silver Stream
normally peaks before the Taieri River at Outram, although peaks do occasionally occur at
the same time (Figure 3.9) (Opus, 2010).
26 Ch 3. Environmental setting
Figure 3.9 Examples of the Taieri River and Silver Stream flood hydrographs from
events in August 1990, March 1994 and April 2006.

Ch 3. Environmental setting 27
During flood events, the river level in the lower reaches of the Taieri River rises well above
the level of the adjacent land on the West Taieri Plain. Figure 3.10 shows the maximum water
level in the Taieri River at Henley, during the period October 2002 (when records began) to
April 2012, in relation to the adjacent land.
Figure 3.10 Cross section from Henley to West Taieri Plain (as shown in Figure 3.11),
showing the maximum water level observed between October 2002 and April 2012. The
water level in the Taieri River at Henley is shown as the current lowest high tide (Figure
3.15).
Figure 3.11 Location of the cross section shown in Figure 3.10.
28 Ch 3. Environmental setting
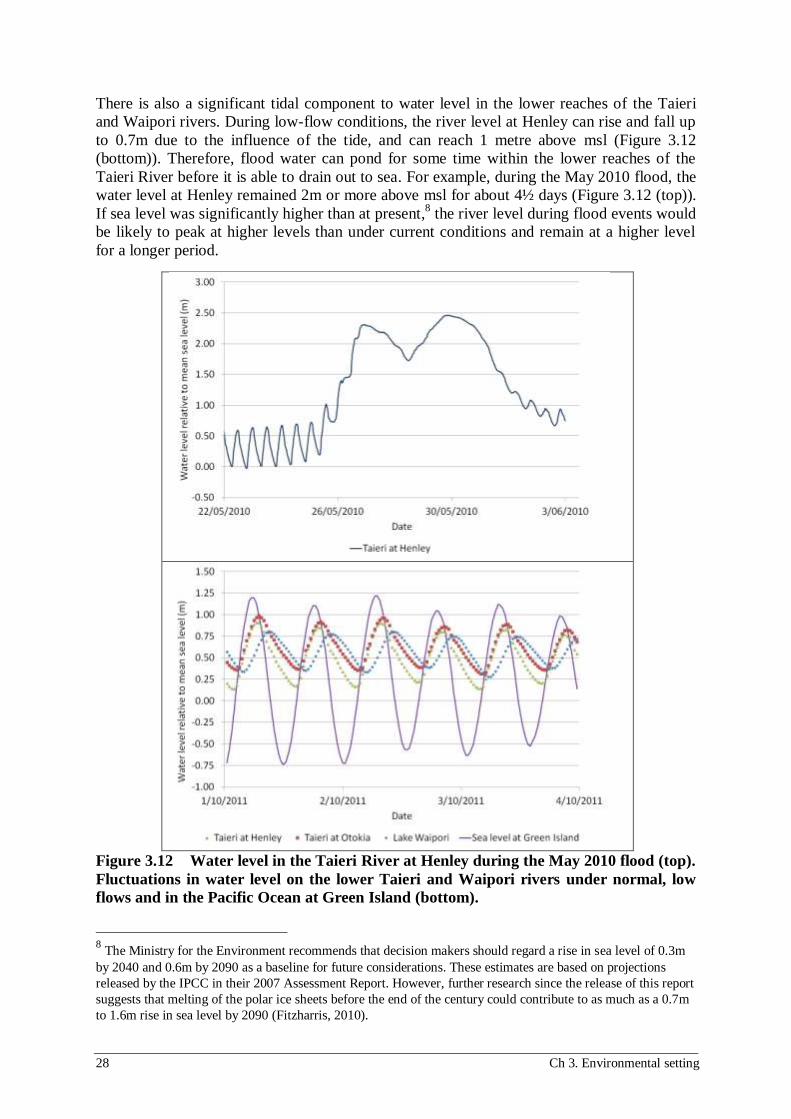
There is also a significant tidal component to water level in the lower reaches of the Taieri
and Waipori rivers. During low-flow conditions, the river level at Henley can rise and fall up
to 0.7m due to the influence of the tide, and can reach 1 metre above msl (Figure 3.12
(bottom)). Therefore, flood water can pond for some time within the lower reaches of the
Taieri River before it is able to drain out to sea. For example, during the May 2010 flood, the
water level at Henley remained 2m or more above msl for about 4½ days (Figure 3.12 (top)).
If sea level was significantly higher than at present,8 the river level during flood events would
be likely to peak at higher levels than under current conditions and remain at a higher level
for a longer period.
Figure 3.12 Water level in the Taieri River at Henley during the May 2010 flood (top).
Fluctuations in water level on the lower Taieri and Waipori rivers under normal, low
flows and in the Pacific Ocean at Green Island (bottom).
8 The Ministry for the Environment recommends that decision makers should regard a rise in sea level of 0.3m
by 2040 and 0.6m by 2090 as a baseline for future considerations. These estimates are based on projections
released by the IPCC in their 2007 Assessment Report. However, further research since the release of this report
suggests that melting of the polar ice sheets before the end of the century could contribute to as much as a 0.7m
to 1.6m rise in sea level by 2090 (Fitzharris, 2010).

Ch 3. Environmental setting 29
As most of the West Taieri Plain lies at or below current msl, it relies on the Waipori
pumping station (Figure 3.13), even during normal low-flow conditions, to prevent it from
transforming back to its former swamp-like state (Section 2). Water levels in Lake Waipori,
to the west of this area, are generally elevated above the land on the eastern side of the flood
bank (Figure 3.14), making the pump station and flood banks critical to the occupation and
use of the land (ORC, 2007a; ORC, 2010d). This characteristic also has implications for
seismic risk, as discussed later.
Figure 3.13 Waipori Pump Station and the inlet channel to the station (Main Drain).
The underground chamber (installed in 1989) housing the two ‘D’ pumps is on the left,
and the building housing the three ‘F’ pumps installed in 1929 is on the right. The three
‘F’ pumps are being replaced with two new submersible pumps in 2012/2013.
30 Ch 3. Environmental setting
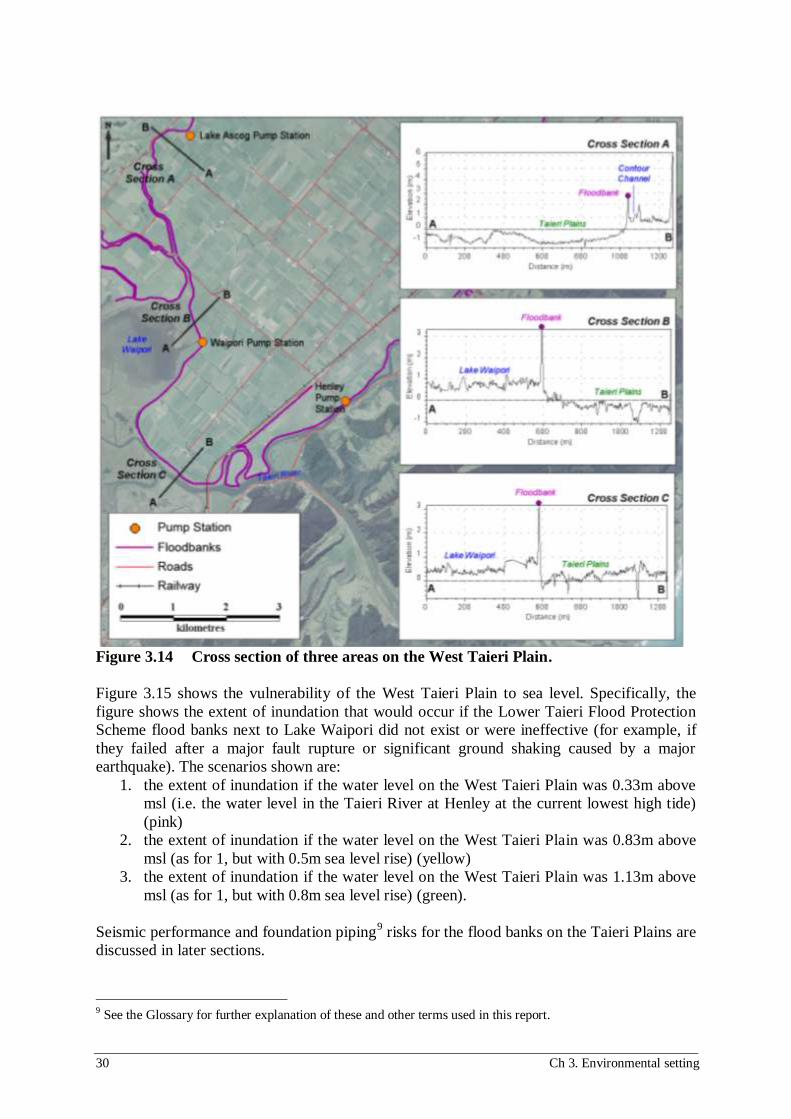
Figure 3.14 Cross section of three areas on the West Taieri Plain.
Figure 3.15 shows the vulnerability of the West Taieri Plain to sea level. Specifically, the
figure shows the extent of inundation that would occur if the Lower Taieri Flood Protection
Scheme flood banks next to Lake Waipori did not exist or were ineffective (for example, if
they failed after a major fault rupture or significant ground shaking caused by a major
earthquake). The scenarios shown are:
1. the extent of inundation if the water level on the West Taieri Plain was 0.33m above
msl (i.e. the water level in the Taieri River at Henley at the current lowest high tide)
(pink)
2. the extent of inundation if the water level on the West Taieri Plain was 0.83m above
msl (as for 1, but with 0.5m sea level rise) (yellow)
3. the extent of inundation if the water level on the West Taieri Plain was 1.13m above
msl (as for 1, but with 0.8m sea level rise) (green).
Seismic performance and foundation piping9 risks for the flood banks on the Taieri Plains are
discussed in later sections.
9 See the Glossary for further explanation of these and other terms used in this report.

Ch 3. Environmental setting 31
Figure 3.15 Potential landward extent of inundation during a 'flood banks down’
scenario on the West Taieri Plain. Note the correlation with the June 1980 flood (Figure
4.1), where numerous breaches in the flood banks occurred along the Waipori River
and Contour Channel.
3.4 Groundwater
The lower Taieri Basin is a tectonic depression resting between two major faults. Deposits of
sand, gravel, silt, clay and peat have built up within the basin, and are thought to extend to
depths of over 200m below the surface (ORC, 2010b). In the Mosgiel area, the mixtures of
these different sediments are highly variable and thinly layered. By contrast, western parts of
the Taieri Plain (from Henley to Riccarton Road) are more consistently layered. The
groundwater aquifer is located within loosely sorted gravels, and, at the plain’s western end,
is overtopped by a 20-25m thick layer of fine-grained deposits with low permeability. This
layer of silt and clay was formed over the underlying gravels when the Taieri Basin was
inundated by the sea and estuary waters, following the post-glacial rise in global sea levels,
about 4,000-8,000 years before present. This denser layer of silt and clay tends to confine and
pressurise the underlying gravel layers to produce confined aquifers (Figure 3.16).
Accumulated or heavy rainfall, or high flow in the Taieri River and its tributaries, acts to
recharge the aquifers beneath the Taieri Plain. However, the overlying silt and clay layer
limits the ability of groundwater to surcharge out onto the surface due to their low
permeability. As a result, flood events tend not to result in significant surface ponding due to
groundwater, despite the fact that much of the surface of the western Taieri Plain is lower
than the surrounding waterways (Figure 3.16) and the groundwater-pressure surface.10
Ponding on the Taieri Plain during flood events is instead dominated by surface water runoff.
10
The groundwater pressure surface is the equivalent level that groundwater would rise to in a bore.

32 Ch 3. Environmental setting
Figure 3.16 Map view of Lower Taieri Basin, with schematic cross section from
Wingatui to Lake Waipori, showing groundwater-flow directions as arrows (ORC,
2010b).