`natural' disaster, conflict and aid allocation
TRANSCRIPT
Graduate Institute of
International and Development Studies Working Paper No: 09/2011
`Natural' Disaster, Conflict and
Aid Allocation
Aude-Sophie Rodella-Boitreaud World Bank
Natascha Wagner Graduate Institute of International Studies
Abstract
This paper looks into aid allocation in the response to multiple crises, focusing more specifically on the cases of concomitance between so-called `natural' hazard/disaster and conflict situations. Over 150 natural disasters have occurred alongside complex political crises in the past seven years alone. Yet, the fields of conflict and disaster research remain largely isolated from one another, and in fact, no aid related research has addressed the issue of the concomitance of conflict and disaster. We exploit a large panel dataset that includes official development aid, and information about the victims from natural disasters and conflicts for 112 developing countries over a period of 35 years. For eight different donor countries and groups of donor countries we find that while conflict does not affect their aid allocation patterns, the occurrence of natural disasters does. The econometric analysis demonstrates that aid allocation needs to be analyzed in a disaggregated fashion -for each donor individually- as donors clearly have different agendas. Applying GMM techniques we account for the endogenous nature of the control variables such as per capita GDP. In addition we use the relative size of the youth cohort as exogenous instrument for conflict.
© The Authors. All rights reserved. No part of this paper may be reproduced without
the permission of the authors.
‘Natural’ Disaster, Conflict and Aid Allocation
Aude-Sophie Rodella-Boitreaud,∗and Natascha Wagner†
March 2011
Abstract
This paper looks into aid allocation in the response to multiple crises, focusing
more specifically on the cases of concomitance between so-called ‘natural’ hazard/
disaster and conflict situations. Over 150 natural disasters have occurred alongside
complex political crises in the past seven years alone. Yet, the fields of conflict
and disaster research remain largely isolated from one another, and in fact, no aid
related research has addressed the issue of the concomitance of conflict and disas-
ter. We exploit a large panel dataset that includes official development aid, and
information about the victims from natural disasters and conflicts for 112 devel-
oping countries over a period of 35 years. For eight different donor countries and
groups of donor countries we find that while conflict does not affect their aid allo-
cation patterns, the occurrence of natural disasters does. The econometric analysis
demonstrates that aid allocation needs to be analyzed in a disaggregated fashion
–for each donor individually– as donors clearly have different agendas. Applying
GMM techniques we account for the endogenous nature of the control variables
such as per capita GDP. In addition we use the relative size of the youth cohort as
exogenous instrument for conflict.
Keywords: Disaster, Conflict, Aid Allocation, Longitudinal Panel Methods, GMM
JEL: F35, Q34, Q54, C23
∗World Bank Washington DC, United States. Email: [email protected]†International Economics Unit. Graduate Institute of International and Development Studies,
Geneva, Switzerland. Email: [email protected]
1
1 Introduction
On December 26, 2004 a tsunami hit Indonesia, Sri Lanka, India, and Thailand. An
estimated 230,000 people were killed. In January 2010 Haiti’s capital Port-au-Prince was
devastated by a catastrophic earthquake of magnitude 7, affecting over 3 million people
with a death toll reaching that of the Indian Ocean tsunamis.1 Just in 2010, those mega-
disasters were followed by a massive earthquake in central Chile in February and by floods
in Pakistan in July, while Russia was fighting wild fires. In March 2011, Japan, one of
the most disaster-prepared countries, was struck by an earthquake of an 8.9 magnitude
on the Richter scale followed by a tsunami. This disaster is likely to trump the Great
Kanto Earthquake of 1923 so far considered the worst calamity in Japan’s history.2
In 2010, the Emergency Events Database of the Centre for Research on the Epidemi-
ology of Disasters (CRED), recorded 373 natural disaster in its database, killing 296,000
people, affecting over 207 million others and totaling over 109 billion US$ in economic
damages. While most of these disasters have received massive media attention –if only
a fleeting attention– they are by no means a recent phenomenon. For instance, earth-
quakes alone have claimed an average of 27,000 lives per year worldwide since the 1990s
(Guha-Sapir and Vos, 2011). Clearly reporting of these disasters has increased in recent
years. Alongside increased reporting the scope of disasters in terms of costs and human
loss has increased as well due to the combined effect of high rates of urbanization and
wealth accumulation. Consequently, natural hazards are all the more destructive when
they fail to be prevented.
Disasters have haunted humanity throughout history as consistently as another scourge:
conflict. According to the Uppsala Conflict Data Program, there were 36 ongoing conflicts
in 2009, of which 29 were intrastate and 7 were internationalized. In the case of natu-
ral disasters, international response in the form of humanitarian assistance has greatly
increased in the last couple of years. The perception of those disasters as the expres-
sion of Nature’s raw power seems to trigger waves of compassion and support. In turn,
the response to conflict by the general public seems to be more retained and fatalistic,
even when international organizations have come to appreciate the specificities of fragile
states.3
In this paper we wish to look at the official responses to natural disasters and conflicts
1Red Cross2It is worth noting that for each unit increase in earthquake magnitude, the strength increases by a
factor of 100. That is to say that between two earthquakes of 7 and 9 magnitude, one has to multiplyenergy dispersion by 1,000
3See the OECD Fragile States Principles (2007) and the 2011 World Bank World Development Report(WDR) that focuses on Conflict and Development
2

through the channels of official development aid (ODA). We want to explore whether
donor countries prefer to support disaster stricken countries versus conflict afflicted ones,
and in how far donors are susceptible to the concomitance of disaster and conflict. Al-
though we acknowledge that conflict and disaster have very distinctive features, there are
several reasons why looking simultaneously at the two makes sense.
First, we argue in terms of the vulnerability of countries in conflict. Countries in conflict
or emerging from conflict are less protected against disasters. Their exposure is high
both in terms of human casualties and economic consequences. Raddatz (2007) notes
that except for geological disasters which tend to be more concentrated in middle income
countries, large disasters are significantly more frequent in low-income countries. Besides,
governments of low-income countries may have an incentive to inflate the death tolls re-
flecting the impact of the disaster to attract more relief and assistance. The questions
emerging from this point are therefore: How does a disaster-related shock translate into
aid allocation? Does receiving ‘disaster-related’ emergency assistance affect the ‘conflict-
related’ funding? Does ODA systematically vary following either of the two shocks?
The second reason for looking at conflict and disaster concurrently is that it may provide
a new take in the understanding of donors’ aid allocation preferences and responsiveness.
Indeed, as pointed out by Round and Odedokun (2004) little of the sizeable literature
on aid addresses the issue of what determines the total volume of aid that donors make
available. However, donors are ultimately those who determine the quality and quantity
of aid available to recipient countries. Surprisingly, a much larger body of research has
dealt with the determinants on the recipient side, trying to identify features and settings
conjoining for greater aid allocation. Yet, the same literature acknowledges the strategic
dimension of aid, rightfully pointing into the donors’ direction for better understanding
of aid allocation priorities and preferences. Hoeffler and Outram (2010) find that roughly
half of the predicted value of aid is determined by donor specific effects. Of the remain-
ing variation, recipients’ need accounts for 36 % and donor self-interest for about 16 %.
Hoeffler and Outram further note that recipient merit, measured by growth, democracy
and human rights, accounts for only 2 % of predicted aid.
We look at the aid allocation of five major industrialized countries, namely France, Ger-
many, Japan, the United Kingdom and the United States. We also consider three unions
of groups of countries: the European Union, the group of the G7 and the OECD. By
fitting an identical empirical model for these eight different countries and groups of coun-
tries, we aim at understanding whether donors have a preference for exogenous ‘natural
shocks’ in comparison to man-made crises in their allocation of aid. In doing so, we try
to tackle the reasons affecting the nature and volume of aid.
3
Obviously, the analysis is faced with a number of challenges. The assessment of needs in
recipient countries is a complicated task. In terms of the empirical analysis, we face the
problem of endogenous covariates. The potential endogeneity of the explanatory variables
is accounted for by carrying out a GMM analysis that allows us to take past observations
of our covariates as instruments for contemporaneous differenced observations. Besides,
measuring and comparing conflict and disaster related costs is tricky and not sufficiently
standardized. For that reason, we choose to focus our attention on the number of deaths
incurred by those crises. Last but not least, we we have to account for the heterogeneity
of the recipient countries.
Our findings are the following: While deaths from disasters significantly increase aid
endeavors of all countries except Japan, deaths from conflicts do not have a significant
impact on the disbursement of per capita official development aid. Once we account for
the endogeneity of conflict and instrument it by the size of the youth cohort, the link
between conflict and per capita development aid is undermined. Furthermore, we do
not find any evidence that governance matters. A country’s governance, as measured by
the polity2 variable, does not affect aid allocations by any donor. Similarly, the socio-
economic and health status of the population in the recipient countries –proxied by life
expectancy– has no effect on per capita aid commitments and disbursements. While
France and Germany seem quite sensitive to disasters in their aid allocation, Japan acts
according to neoclassical theory in that it supports countries with policies that have the
potential to enhance growth. In the case of the United Kingdom, trade links are shown
to be important determinants of ODA. For the United States it is the strategic dimension
of development aid as well as the linkages from trade that appear to be important. In the
case of the European Union as well as for the G7 and the OECD, humanitarian disasters
are shown to have a substantial impact on disbursed aid. However, only the former two
of the three unions seems to be also sensitive to geological disasters. Overall, aid dis-
bursement is sticky in the sense that past disbursed per capita aid is a good predictor for
current aid, which points to the importance of their preferences. Our results also show
that in order to analyze the patterns of aid allocation carefully, an individual focus on
the different donors and their agendas is warranted.
The paper is organized as follows: Section 2 sets out our working definition of disas-
ter and conflict and points to their connection. In section 3 we present the datasets that
are used. We have a large panel of 112 countries and 35 years starting in 1970. Although
we observe a very recent spike in the occurrence of natural disasters our dataset stops
in 2004 due to limitations in data availability. In section 3 it is also outlined how we
4

constructed the disaster and conflict variables. In section 4 present out the economet-
ric specification employed. We apply the System GMM proposed by Blundell and Bond
(1998) because it allows us to control for the endogeneity of the covariates using their own
past observations as instruments. Section 5 contains the results by donor country and
union of countries. We present results for committed and disbursed official development
aid (ODA) from one-step and two-step GMM regressions of which the latter employ the
efficient variance-covariance matrix. The robustness of the results is addressed in sec-
tion 6 and implications for aid donors and recipients are drawn in section 7. Section 8
concludes.
2 Context, Definition of Disaster and Conflict
Before proceeding to the empirical analysis it is worth to clarify how we define natural
disaster and conflict and to further allude to some of the problems related to the analysis
of these events. Obviously, such underlying conceptions are also instrumental in donors’
prioritarization of aid allocation.
In first place, one needs to distinguish the concepts of ‘hazards’ and ‘disasters’ which
are too often conflated in the media. The fundamental difference between hazard and
disaster is that while the former is an event, the later is a process. The historic case of the
Lisbon Earthquake (1755), which is estimated to have killed between 10,000 and 100,000
people in Lisbon alone, is a good example of the distinction between the two. Rousseau’s
response to a poem written by Voltaire about that disaster highlights a core tenant of
disaster research. Rousseau underlines the fact that Nature cannot be held responsible
for the building of high-rise houses and that the population density also played in to the
scale of the subsequent disaster. In contemporary disaster research, it is now recognized
that ‘natural disasters’ do not exist as such. This position is also shared by the United
Nations Strategy for Disaster Reduction (UNISDR) and Smith (2006) notes that “In
every aspect of a disaster, causes, vulnerability, preparedness, results and response, and
reconstruction, the contours of disaster and the difference between who lives and who
dies is to a greater or lesser extent a social calculus”. Consequently, one can deduce that
while there is a natural input (=̂ hazard) to a disaster, the consequences of hazards are
first and foremost human-made (World Bank, 2010b).
In spite of this distinction, the mental perception of disasters as largely Deus ex machina
persists among donors. Therefore, we subscribe to the understanding of disaster allo-
cated ODA as need-based and more strategically ‘neutral’ than other types of aid. Yet,
we acknowledge the complexity of natural hazards and their disasters and we admit that
from a conceptual point of view it is improper to strictly speak of ‘natural disaster’.
5
Disasters are the consequence of the interplay between nature and man-made intrusion.
Nevertheless, at their root lies the hazardous forces of nature that cannot be controlled
by human force. Therefore, we consider ‘natural disasters’ as exogenous events in our
empirical analysis. For the ease of exposition, and given the use of this term by donors
themselves, we keep writing ‘natural disaster’ when we refer to natural hazards that cause
disasters.
2.1 Conflict, Economic Shocks and Aid
We now turn to conflicts. Despite the growing research on development aid, its analysis
in connection with conflict is rather recent, particularly pioneered by Collier and Hoeffler
(2004, 2002). Collier and Hoeffler were amongst the first to point out the nexus between
economic factors and civil wars (Collier and Hoeffler, 1998 and 2000, and Collier, 1999).
The majority of available research on aid and conflict seems to find a negative relation-
ship. Arcand and Chauvet (2001), for example, present evidence that aid decreases the
likelihood of the occurence of a violent conflict. Still, they underline that “the uncertainty
of aid plays a destabilizing role in that it increases the probability of civil war.” Moreover,
de Ree and Nillesen (2009) demonstrate that a 10 % increase in foreign aid increases the
probability of an ongoing conflict to end by 8%. They argue that a government’s ability
to increase military spending quells rebellion(s). Looking at the issue of the onset of
conflicts and aid, Ruggeri and Schudel (2010a) argue that foreign aid in corrupt countries
decreases the risk of civil war outbreak. They suggest that foreign aid deters antagonistic
elites from organizing rebellion.
Yet, other studies identify a positive correlation indicating that aid flows increase the
propensity for conflicts. Such findings may have several underpinning dynamics, with aid
diversion towards military spending as a leading cause. Homer-Dixon (2009) estimated
misappropriation of aid for higher military expenditure to occur with 11.4% of all foreign
aid within the poorest African nations, and to be responsible for as much as 40% of these
countries’ military budgets. Such misappropriation, significantly increases the risk of con-
flict. Similarly, Grossman (1992) demonstrates that foreign aid increases the likelihood
of civil war when rebel groups try to assume power in order to exploit such aid transfers.
In such a scenario, aid enhances the risk of conflict by triggering rent-seeking behavior
of political actors. Foreign aid thereby increases the payoffs to rebels by increasing the
value and ‘return-on-investment’ of capturing the state (Grossman, 1991, 1992 and 1999).
Regarding donors’ reaction to conflict in their aid allocation, a similarly controversial
discussion can be encountered in the literature. de Ree and Nillesen (2009) find that
donor countries decrease aid commitments to countries undergoing armed conflict. Such
6

findings should be put in the perspective of earlier research by Alesina and Dollar (2001)
who point out that donor governments see aid as means to reinforce foreign alliances, or
tend to distribute aid based on former colonial relationships. Additionally, Alesina and
Weder (2002) show that domestic politics and military stability are a secondary concern
in determining aid commitments and that government corruption in the recipient coun-
try does not lead to a decrease in foreign aid commitments.4 The authors also underline
the fact that aid allocations are largely determined by factors outside the borders of the
recipient country.
To set up the larger research universe in which our paper operates, it is worth men-
tioning that the literature on aid and conflict has also some instructive contributions
from the micro level perspective. Among those, one cannot ignore Miguel and Kremer
(2004) and Blattman and Miguel (2008) who look into the causal impact of economic
shocks on the occurrence of civil war and demonstrate a negative relationship. Fearon
and Laitin (2003) focus on the effect of ethnic and religious diversity and its impact on
the risk of civil war. Hegre et al. (1999) and Sandler and Hegre (2002) test the theory
that both solid democratic and harsh autocratic regimes are associated with less civil
war than those that are at an intermediate level of democracy. Additional research on
aid and conflict includes Bergholt and Lujala (2010), Ruggeri and Schudel (2010b), and
Strandow et al. (2010).
2.2 Relationship between Conflict and Natural Disasters
Few studies, however, have explored the effect of natural disasters on conflict. Again,
these studies are divided into two main camps. The first one argues that disasters mitigate
the propensity of conflict by fostering cooperation among groups (Kelman and Koukis,
2000; Quarantelli and Dynes, 1976 and Evin, 2004)
A second category of researchers aims at demonstrating that disasters have the poten-
tial to generate conflicts. Ember and Ember (1992) bring forward the argument that
the threat of disasters may cause preemptive strikes for resources expected to be scarce
in the incidence of a disaster. Olson and Drury (1997) present evidence that the more
developed a country, the less likely a natural disaster is to have political consequences.
Bhavnani (2006) argues that natural disasters contribute to conflict because they create
competition for scarce resources, exacerbate inequality in the distribution of aid, change
power relationships, and can create power vacuums and consequently opportunities for
4However, Schudel (2008) presents evidence that in the case of bilateral aid the responsiveness ofdonor states to corruption in the recipient state depends on their own level of corruption: less corruptdonor states allocate more aid to less corrupt recipient states. Whereas corrupt donor states do not makesuch a clear distinction.
7

warlords. Similar is the argument brought forward by Nel and Righarts (2008), who look
at data for 187 countries and other political entities for the period 1950 to 2000. They
find that rapid-onset natural disasters significantly increase the risk of violent civil con-
flict both in the short and medium-term, specifically in low- and middle-income countries
that have high inequality, mixed political regimes , and sluggish economic growth.5
Fragile countries are thus particularly vulnerable to disasters entailing instability. Coun-
tries like Nicaragua and Guatemala saw their government falling due to the public dis-
content over disaster response. The 1970 Bhola cyclone in East Pakistan and the delay
of relief constituted a major trigger for the Bangladesh Liberation War (1971). More
recently, the 2004 tsunamis that affected Sri Lanka and Indonesia, had a heterogeneous
impact on the protracted conflicts experienced by those countries. In Aceh (Indonesia),
the response to the tsunami seems to have contributed to the resolution of a long-term
simmering conflict between Gerakan Aceh Merdeka and the government. Conversely, in
Sri Lanka the tensions between the Tamil Tigers and the government appeared to be
aggravated.6
In terms of ODA, the relationship between conflict and natural disasters has received
limited attention. Those two fields have long been perceived as separate areas of research
in aid allocation. The occurrence of ‘mega-disasters’ in fragile countries such as Haiti or
Pakistan has highlighted the outdated conception of those two types of events as isolated
from one another. Still, it is precisely the modalities of aid allocation that have rein-
forced the disconnect between conflict and disaster. As noted by Noy (2009), the impact
of aid that follows disasters is worth exploring. Unlike development aid, disaster aid is
first and foremost event-based and thus less dependent on complex considerations that
enter into donors’ aid allocation agenda. Furthermore, while previous aid decisions factor
in to current aid allocation, disaster aid is less likely to be influenced by the history of
previously allocated aid. Therefore, we choose the main focus of our analysis to be the
variation of aid allocation resulting from the occurrence of a natural disaster. We further
compare the differences (if any) between countries at peace and countries in conflict.
3 Data and methodology
Four different data sources have been consolidated in order to analyze the impact of natu-
ral disaster and conflict on ODA flows between 1970 and 2004. ODA data come from the
5For the case of earthquakes, Brancati (2007) shows that earthquakes increase the likelihood of conflictwith a bigger effect for higher magnitude earthquakes. Consequently, relief must consider the conflict-producing potential of earthquakes.
6Researchers have since argued that these two countries were at different ‘stages’ of conflict and thatthe tsunami and the response to the disaster had different impacts on the warring parties.
8
OECD (CRS). We consider total commitments and total net disbursements in constant
million US$. In order to express ODA in per capita terms and account for the skewness
of the distribution we divide ODA by the population size and take the logarithm. For-
eign aid from five countries is considered, namely France, Germany, Japan, the United
Kingdom and the United States. Furthermore, ODA flows from three groups of countries
are analyzed, namely the European Union, the G7 and the OECD. Descriptive statistics
for the respective countries are presented at the bottom of Tables 2 to 9.
French ODA flows over the course of the 35 years are on average -13.356 in log per
capita terms. German and Japanese log per capita ODA are similar in dimension. UK
development aid is with -14.53 slightly smaller and US aid is with -12.80 slightly higher.
Per capita aid flows of all five countries are rather steady, as shown by the relatively
small standard deviations. Apparently all five countries undertook similar aid efforts in
terms of average per capita aid in the recipient countries. Aid per capita from the EU,
the G7 and the OECD is higher, yet only marginally. However, when it comes to actual
budget sizes the eight countries and groups of countries differ a lot. Not surprisingly
the aid budget of the OECD and the G7 is biggest, it’s on average 56,403 and 27,437
million US$, respectively. Among the single nation countries the United States have with
7,932 million US$ the biggest average aid budget, followed by Japan and France. Thus,
although the countries differ substantially in the sizes of their aid budgets, they don’t
differ much in the intensity of per capita treatment in the recipient countries.
The country control variables are chosen among the WDI data published by the World
Bank. For all the 112 countries7 that received aid between 1970 and 2004 from one or
more of the donors at one or more points in time, we consider the commonly used country
covariates. We take GDP per capita because it has been identified by Boone (1995) as
one of the main determinants of aid flows and is also a variable of interest in the analysis
of armed conflict (Fearon and Laitin, 2003). This variable is measured as real GDP per
capita in constant US$ and logs are taken for scaling purposes. By and large GDP per
capita of receiving countries is very similar across donors. It ranges from 6.69 to 6.88 in
log per capita terms which translates into a range of 805.93 US$ to 973.60 US$ in real per
capita terms. Second, we include GDP growth. It accounts for the rate of development in
the recipient countries. It’s again very homogenous, in the sense that on average donors
target similar recipient countries. On average GDP growth ranges slightly above 3.6 %.
Yet, the variation in the growth of the recipient countries is substantial. The standard
deviation is almost 6 across all empirical specifications. The close proximity in the sum-
7The countries considered in the analysis are listed in Table 10. Except for Bahrain, Bhutan, Coted’Ivoire, Djibouti, Kuwait, Libya and Swaziland all countries are represented in all empirical specifica-tions.
9
mary statistics for the average recipient country per donor is not surprising given that all
donors face the same set of countries in need. We further include the trade volume as %
of GDP into the empirical model to account for the integration of developing countries
into the world economic and trade system.
To complement the economic variables, we also consider population growth and life ex-
pectancy at birth. We take these as proxies for the living conditions and the health care
system and therefore as indicators for development beyond the strict increase in produc-
tion. These variables allow us to see whether demographic and health indicators have
a significant impact on the allocation of aid. It is noteworthy to keep in mind that life
expectancy in the recipient countries is on average about 60 years whereas life expectancy
in the OECD countries is on average 76 years over the same period.
Finally, we also include ‘political affinity’ as donors are likely to consider the regime
type and issues of governance in their aid allocation. To that end, we take the polity2 in-
dex –as introduced by Marshall and Jaggers (2002)– to control for the level of democracy
in a country. The index ranges from -10 (strongly autocratic) to 10 (strongly democratic)
and allows examining general regime effects. A Cold War dummy is used to account for
strategic development aid during this area.
To construct our disaster variables, we rely on the Emergency Events Database of the
Centre for Research on the Epidemiology of Disasters, henceforth EM data. An event
qualifies as a disaster in that database if at least one of the following criteria is fulfilled:
(i) 10 or more people are reported killed; (ii) 100 or more people are reported affected,
injured and/or homeless; (iii) the government declares a state of emergency, or the gov-
ernment requests international assistance. While the EM dataset is the best available
on events of ‘natural disaster’, several issues should be kept in mind in the course of
the analysis. For one, as noted by Stromberg (2007) (mis)reporting of disasters varies
systematically across time, levels of income and political regimes. Reporting of small
disasters is likely to be more extensive in the latter years of the database as well as for
more developed countries. In turn, less democratic countries may have underreported
some natural disasters for fear of international intrusion, as in the case of the Cyclone
Nargis in Myanmar/Burma in 2008.
Political and strategic concerns may also play in how casualties and affected populations
are estimated. Aware of those shortcomings, we follow Noy (2009) in using a measure for
disaster magnitude in terms of the number of people killed. We have data on the number
of people killed for 507 disaster events. We adapt the measure of disaster magnitude to
our research by presuming that the impact of a specific natural disaster on aid allocation
10
depends on the magnitude of the disaster relative to the size of the overall population.
That means, donors allocate aid taking into consideration the needs incurred by the peo-
ple of the recipient country. The needs are estimated to be considerable higher the more
people are affected by the disaster. Therefore, we standardize the data by dividing the
number of people killed by the population size in the year prior to the disaster. The
lagged population size is used since the current year’s population has been affected by
the disaster itself. We choose that measure of disaster intensity as it allows for a direct
comparison between the victims of disaster and conflict. The logs of these variables are
taken to account for the skewness and high dispersion of the data.
Following Skidmore and Toya (2002) and Raddatz (2007), we classify disasters into three
categories to reflect the potentially differential effects and therefore differential responses:
• Climatic disasters (C) such as floods, droughts, extreme temperatures, and wind
storms
• Geological disasters (G) such as earthquakes, landslides, volcanoes, and waves
• Humanitarian disasters (H) such as famines and epidemics
We consider the impact of the intensity of the three types of disasters on aid allocation
independently in the analysis.
In terms of conflict, we use the conflict database from the Peace Research Institute
Oslo (PRIO). Comparable to our disaster variables, we also apply an intensity measure
of conflict in that we consider the number of victims per 10,000 inhabitants. Again we
take the lag of the population size and apply the logarithm to account for the skewness
of the distribution of conflict intensity. As summary statistics show deaths from conflicts
are small. On average roughly one person per 10,000 is killed.
4 Econometric specification
The empirical analysis is carried out cognizant that we face a couple of challenges. For
one, the data generating process of our panel is dynamic. Thus, current observations of
the dependent variable depend on past realizations. Furthermore, some of our explanatory
variables are endogenous and we do not have exogenous instruments for all of these.
Besides we compare a set of heterogeneous countries and therefore we have to account
for country fixed effects and heteroskedastic errors. Despite the window of 35 years,
the number of available time periods T is small relative to the number of countries
11
(N = 112). The low number of T stems inter alia from the fact that we do not have all
T = 35 observations for each country. The resulting econometric model looks as follows:
yit = α1yi,t−1 + α2Xit + β1Dit + β2Cit + β3Iit + µi + εit, (1)
where yit is our dependent variable which is log per capita ODA of country i at time
t, it also enters as lagged dependent variable. The matrix of country control variables
is denoted by Xit. This matrix of covariates also includes dummy variables for time
periods of five year windows to account for waves in aid allocation. The variable Dit
captures the disaster magnitudes as described above and Cit is a measure of conflict
intensity. The interplay between disaster and conflict is captured by Iit and the country
fixed effect are denoted by µi. We transform the above model in its difference form to
eliminate the country fixed effect µi. The transformed disturbance ∆εit then depends on
εit and εit−1. Therefore, consistent estimates of the coefficients (α1, α2, β1, β2, β3) can be
obtained for initial conditions yi1 that are uncorrelated to subsequent disturbances εit for
t = 2, 3, . . . , T . Accordingly, the lagged level of yit−2 is uncorrelated with ∆εit and serves
as instrument. This holds for all the other covariates (Xit, Dit, Cit, Iit) as well. All lags
dating back further than (t − 2) can also serve as instruments. Then, we can apply the
first-differenced GMM estimator as introduced by Arellano and Bond (1991). It exploits
the following moment condition:
E[yi,t−s∆εit] = E[Z ′i∆εi] = 0, (2)
for t = 3, 4, . . . , T and s ≥ 2, where ∆εi = (∆εi3,∆εi4, . . . ,∆εiT )′ and Zi is a (T − 2)×mmatrix of initial conditions. We consider the collapsed version of Zi that restricts the
instrument counts.
The difference estimator by itself suffers from one major limitation. It performs poorly
when the series under study are (close to) random walks or when the variance of the indi-
vidual effects increases relative to the variance of the transient shocks. As a consequence,
past levels have little information about future changes in the variables as these changes
represent the stochastic innovations. This means that the first differences instrumented
with past levels will not identify the coefficients as the lagged levels are only weakly cor-
related with the first-differences. To circumvent this problem Arellano and Bover (1995)
offer system GMM as solution. In addition to instrumenting first differences with lagged
levels, levels are instrumented with lagged differences. Under the additional assumption
of a stationary mean of the time series, system GMM has smaller finite sample bias and
greater precision when using persistent series. This implies that in addition to the mo-
ment condition of the first differenced equation (2) the following moment condition can
12
be exploited:
E[∆yit−1(µi + εit)] = 0, (3)
for i = 1, 2, . . . , N and t = 3, 4, . . . , T . The system estimator relies on a stacked dataset
with twice the observations –the transformed and the untransformed ones– of each in-
dividual country i. As the second moment condition does not account for country fixed
effects we also include regional dummies in the estimated specification. In the following
analysis we present results for both, the one-step feasible and the two-step efficient GMM
estimator using the asymptotically efficient variance-covariance matrix.
Furthermore, we consider conflict to be ‘truly’ endogenous. While the literature on
civil war and conflicts has considerably expanded in recent years, both at the micro and
macro levels, one is rather surprised to find that models and analyses proposed remain
quite accommodating of endogeneity concerns. While acknowledging the challenge of
endogeneity, most studies eventually rely on lagging variables to overcome, or at least
minimize this challenge. We try in this paper to tackle this challenge once more and
use the instrument in the form of the relative size of the youth cohort. The variable
was developed by Barakat and Urdal (2009) in their study of education, youth and con-
flict. The study is an extension of the work conducted by Urdal (2004) on youth bulges
and conflict (See also Urdal and Hoelscher, 2009). While a priori the size of the youth
cohort doesn’t have a direct impact on per capita development aid, it has been shown
that the size of the youth cohort directly influences the propensity of conflict in a country.
Moreover, there is no reason to postulate that the disaster measures will face any reverse
casualty from the aid/GDP growth variable. Therefore, the exogeneity of the disaster
measure is assumed. As noted by Noy (2009), this assumption is also adopted in three
other papers using a disaster measure as an independent variable (albeit in different spec-
ifications and for examining different hypotheses). Without the exogeneity assumption,
the only way to infer causality from our specifications would entail finding an appropriate
instrument for the initial disaster impact. Unfortunately such an instrument remains to
be found. The exogeneity issue can potentially be fully overcome by producing an index
of disaster intensity that depends only on the physical characteristics of the disaster (i.e.
area affected, wave height or storm circumference). The collection of such data from
primary sources and the construction of a comprehensive index are beyond the scope of
this paper, but would enhance the precision of future research addressing such issues.
13

5 Empirical Results
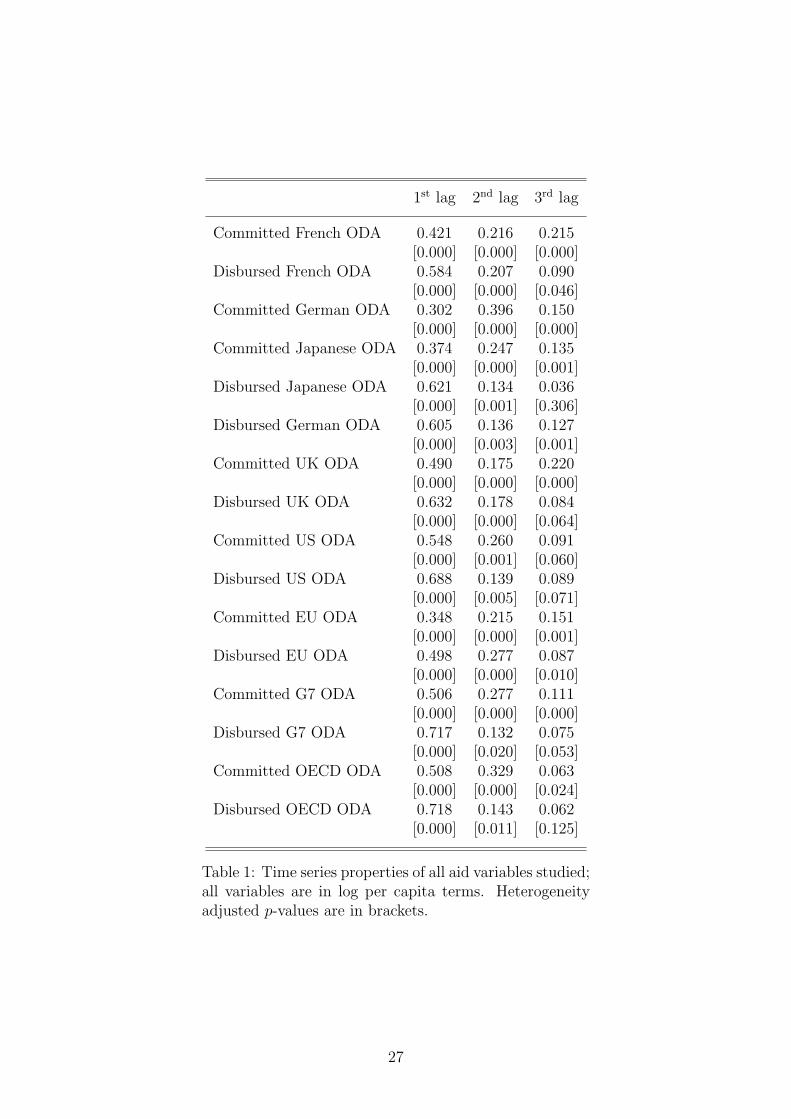
Before estimating our empirical model, the time series properties of the different aid cat-
egories are checked. AR(3) specifications are presented in Table 1. All series have a level
of first oder panel autocorrelation above 0.300. 10 out of the 16 series have an autocor-
relation of at least 0.500. The second lag is significant for all specifications and the third
lag is significant for 15 specifications. Therefore we feel confident about employing the
system GMM specification as presented in section 4.
For the eight countries and groups of countries we consider both log per capita com-
mitted and disbursed ODA as dependent variable. The results are found in Tables 2 to
9. All tables show the one and two step estimation results for committed ODA in the
first and the second column, the analogue for actually disbursed ODA is presented in
columns three and four of the same table. The empirical specification is only rejected in
five of the 34 cases making us confident about the model employed. Thus, 85 % of our
empirical specifications are properly identified. Coefficient sizes only change slightly be-
tween the one and the two step estimation procedure, yet inference changes significantly.
As indicated before, all specifications include country fixed effects in the first moment
restriction and regional dummies according to the UN classification8 in the second mo-
ment restriction. In addition, we also consider period dummies for seven windows of
five years. For clarity’s sake, the coefficients associated with the regional and the period
dummies are not reported in the tables. All p values are robust in the sense that the
corresponding standard-error estimates are consistent in the presence of any pattern of
heteroskedasticity and autocorrelation within panels. Although two step errors should
already be robust, we apply Windmeijer’s finite-sample correction.
Even at first glance, the results show that the countries and groups of countries un-
der study have different agendas and react differently to conflict and natural disasters in
their aid allocations. For example, for the United States, the G7 and the OECD strategic
placement of aid in the presence of the cold war appears to matter. Additionally, while
some countries seem to be sensitive to humanitarian disasters, others are more prone to
respond to geological disasters. Furthermore, for all donors the history of aid flows seems
to matter more in the context of disbursed aid than for aid commitments. This situation
is of particular interest for fragile states and ‘aid orphan’ countries, for whom the scope
of the impact of recovery is likely to be greater.
8Regions are the Caribbean, Central America, Central Asia, Eastern Africa, Eastern Asia, EasternEurope, Middle Africa, Northern Africa, Northern America, Northern Europe, Oceania, South America,South-Eastern Asia, Southern Africa, Southern Asia, Southern Europe, Western Africa, Western Asia,and Western Europe
14
We also introduce a dummy variable that captures the concomitance of disaster and
conflict. As this dummy variable is also very likely to be endogenous, we instrument it
by the interaction term of the size of the youth bulge and the occurrence of a geological
disaster as well as the interaction term of the size of the youth bulge and the occurrence
of a humanitarian disaster. Regarding conflict-disaster concomitance, none of the donors
are influenced in their aid allocation by this double-whammy throughout the period and
in all the countries. The interaction dummy of the concomitance of the two events is in-
deed always insignificant. Thus, if a given developing country is in a situation of conflict,
donors are not deterred from disaster relief once a natural disaster occurs concurrently.
Conversely, the concomitance of disaster and conflict does not induce a double back-up
for affected countries either. Yet, we remain doubtful about the instruments of the con-
comitance dummy. To overcome these doubts, we also estimate specifications excluding
the concomitance dummy. Results do not change significantly. We proceed by looking at
the individual countries’ aid allocation in a bit more detail:
We start the analysis with France. The results are presented in Table 2. In terms
of committed ODA per capita we see that past allocation of ODA doesn’t play a role,
neither do political or strategic variables. However, the number of people who died as
consequence of a humanitarian disaster significantly increases the commitment of aid per
capita. A 10 % increase in log per capita deaths from a humanitarian disaster, increases
log per capita aid by 1.05 %. In other words, in the sample at hand on average 283 peo-
ple died due to humanitarian disasters for an average population of 39.4 million. Thus,
if the magnitude of the disaster doubles, ODA increases from 59.1 million US$ to 67.1
million US$. In contrast, geological disasters do not influence the French per capita aid
commitment patterns nor do conflicts. When it comes to actual disbursement of aid per
capita, the picture is slightly different in that disbursement follows a more deterministic
path. Past allocation of per capita aid predicts current allocation with a coefficient of
0.303 (two-step estimation). Yet, it becomes apparent that in the actual allocation, the
French government considers both humanitarian and geological disasters. Strategic vari-
ables such as the cold war dummy do not play a role, neither for the commitment nor for
the distribution of per capita aid. Also, French aid decisions do not seem to be driven by
economic and/or trade motives. We fail to reject the validity of the empirical specification.
The results for German commitment and allocation patterns are shown in Table 3. Again,
all specifications are well identified according to the Arellano-Bond tests. Although, one
would expect that strategic aid in the face of the cold war and under the special situation
of a divided country had a momentous impact on German aid, we do not find any indi-
cation that this was the case. The cold war dummy is indeed never significant. In per
capita aid commitments, disasters do not seem to play a role, yet the incidence and inten-
15
sity of conflict has a negative impact on the amount of per capita aid committed. While
in the one-step specification the log number of deaths from conflict per 10,000 inhabi-
tants is only significant at the 11.3 % level, it is significant at the 9.1 % level employing
the efficient variance-covariance matrix. Considering only the one-step estimation, the
disaster-conflict interaction dummy is significant at the 11.1 % level and reduces log per
capita committed ODA by 0.527. Interestingly, past commitments of per capita aid seem
to have a negative impact on current commitments. Yet, this picture is changed into
the usual aid continuance story when we look at per capita disbursed German ODA. In
fact, there is a relatively high level of persistence in per capita aid flows as shown in
Columns (3) and (4) of Table 3. While good governance does not play a role for the
disbursement of per capita aid, economic variables appear to matter. Germany appears
to favor recipient countries with low log GDP per capita and relatively low trade shares.
In contrast to committed per capita aid that takes conflict intensity into consideration,
actually disbursed per capita aid does not seem to be driven away from conflict countries.
In addition, both humanitarian and geological disasters significantly increase the log per
capita aid that is directed to a certain country. Thereby, geological disasters appear to be
favored. The coefficient for the responsiveness to geological disaster is twice as large as
the coefficient for the reaction to humanitarian disasters. Despite the sizable differences
in estimated coefficient size, the equality of the two coefficients cannot be rejected. As
in all other specifications estimated, the disaster-conflict interaction is not significant.
In the case of Japan, per capita aid engagements are neither driven by disasters nor
conflicts, nor the by the concomitance of the two. As shown in Table 4 Japan appears
to favor growing economies. In this case, ‘growing’ means two things. On one hand,
Japan fosters economies with a growing GDP and on the other hand, preference is given
to countries with growing populations. It would be too simplistic to conclude that Japan
acts in its aid endeavors in a Solow way. Yet, the allocation and distribution patterns
do echo the neoclassical growth model that predicts output growth stemming from pop-
ulation growth. In a way, Japan seems to consider development aid as the engine of
growth rather than an instrument of relief. Moreover, Japan does not appear to display
self-interest in the sense that it assists countries with higher trade shares. Throughout
specifications, the coefficient on the trade share is insignificant. As for the preceding
countries, the specification tests support our model.
The United Kingdom (UK) follows yet another path in its aid efforts. Indeed, the UK
seems to favor countries that have a high trade share relative to their GDP. Yet, the
coefficients are small. Table 5 Columns (1) and (2) show the relatively small trade coeffi-
cients of 0.011 and 0.009 in the one and two step estimation, respectively, for committed
per capita aid. Despite the small value of the coefficients, the effect is sizable as the
16
mean trade share in the sample is 68.39 % and the standard deviation is 36.67 %. Nei-
ther conflict-related deaths, nor deaths from geological disasters appear to influence per
capita aid commitments of the UK. In contrast, deaths from humanitarian disasters do.
However, their impact does not make the way through into the actual distribution. Next
to the trade share, long-term relationships between the UK and the recipient countries as
well as past spending patterns appear to matter most in the disbursement of per capita
aid. It has to be noted that the specification for log committed ODA per capita is proper-
ly identified, yet the empirical model for log disbursed ODA per capita is only bor-
derline identified.
The results for the United States are quite similar to those for the United Kingdom.
They are presented in Table 6. Existing links do play a major role in the decision about
per capita aid commitments. As in the case of the UK, the coefficient on lag ODA per
capita is above 0.300 and thus by far higher than for the other donors. Disasters, both
humanitarian and geological, do increase the commitment and the disbursement of US
per capita development aid. While they are significant in the one-step specification, they
are not significant in the two-step model. Yet, their joint significance cannot be rejected.
Therefore, we come to the conclusion that jointly disasters do influence the per capita
aid allocation and spending pattern of the United States. In contrast to the UK, the
United States seems to take into consideration the level of GDP per capita of the recipi-
ent country in their per capita aid allocations. Countries with higher GDP per capita are
disadvantaged under this scenario. This result holds not only for the commitment of per
capita aid, but also for the distribution. Interestingly, the strongest effect on disbursed
per capita aid stems from the cold war dummy. Among the five individual countries in
our sample the cold war dummy only shows up significant for the United States. This is
yet another confirmation of the strategic role played by American ODA during the Cold
War. In addition, there is some mild indication that trade shares also matter, yet the
coefficient is not significant at conventional significance levels.
We turn now to the European Union (EU), the group of the G7 and the OECD countries.
The results for the former can be found in Table 7. The EU is the only union that shows a
slight tendency for increased funding endeavors in countries that are concurrently conflict
and disaster stricken. Yet this tendency is only perceptible in the committed per capita
aid, with a significance level at 15.6 % for the two step model. The sign turns negative and
significance vanishes completely in the actual disbursement of per capita aid. Yet, when
analyzing the results for the European Union one has to keep in mind that the overall
model specification for committed per capita aid is rejected by the Arellano-Bond tests.
However, the specification tests fail to reject the model for disbursed per capita ODA.
17
Thus, we feel confident about the non-existence of an effect of the disaster-conflict inter-
action in the model of disbursed per capita aid. In turn, we take very cautiously the result
indicating a positive impact of the disaster-conflict interaction for committed per capita
aid. Throughout all EU specifications, deaths from humanitarian disasters increase per
capita aid significantly. The coefficient associated with deaths from geological disasters
is not persistent as it looses its significance in the two-step specification. Yet jointly, the
disaster coefficients are significant in all specifications. Last but not least, past per capita
aid allocations do not influence current aid allocations to a similar degree as for the five
individual countries under study. What matters for EU decisions is the trade share of
the recipient country, which positively and significantly affects the disbursed per capita
aid. In stark contrast to what we have seen for Japan, the GDP growth of the recipi-
ent countries has a negative effect on per capita ODA disbursements in the case of the EU.
We now focus on the G7 countries9 as a group. In their joint commitment the G7 appear
to follow a more deterministic pattern than the EU. This can be verified in Table 8. Past
commitment patterns are good predictors of current commitment, with actual disburse-
ment of ODA being even ‘stickier’. For the group of the G7 the strategic component
of aid is also very strong. Throughout specifications the cold war dummy significantly
increases per capita aid commitments and disbursements. As in the case of Germany,
the occurrence and intensity of conflict matters for per capita aid commitments. It sig-
nificantly reduces committed per capita aid. Yet again, it does not work its way through
into actual disbursed per capita aid. As for the European Union, deaths from both types
of disasters cause the G7 to increase per capita aid allocation and disbursement. There
is, however, no indication for increased aid endeavors in the case of a concomitance of
disaster and conflict. Mild evidence points out that instead of considering GDP growth
when deciding about per capita aid disbursement, the group of the G7 favors recipient
countries with a low level of GDP per capita.
In the case of OECD countries, Table 9 shows that this group mirrors the aid efforts
of the G7 quite well. Per capita aid commitments and disbursements were significantly
increased during the cold war. Again, humanitarian disasters trigger action. Deaths from
conflict significantly reduces committed per capita aid, however disbursed per capita aid
is not affected. In contrast to the G7 aid allocation and spending patterns, the trade
share of the recipient countries matters to the OECD. The higher the trade share of any
recipient country, the more likely is the country to receive foreign aid. In the process of
commitment, OECD countries appear to take into consideration the level of GDP per
capita in the receiving countries. However, this is not displayed in actual disbursement
patterns. Yet, the specification for disbursed per capita aid has to be analyzed with cau-
9France, Germany, Italy, Japan, UK, USA and Canada
18
tion as its overall fit is rejected for both the one- and the two-step specifications. Instead,
the model for committed per capita aid is properly identified.
6 Robustness of Results
Our results are supported by a number of robustness checks. As already discussed in the
previous section, we do not only rely on the feasible GMM estimation, we contrast it with
the results employing the efficient variance-covariance matrix. In interpreting the results,
we consider as credible only those that are consistent across the two specifications. In ad-
dition, we tested whether our empirical model is properly identified. Instead of employing
the system GMM estimator we used the difference GMM and the orthogonal deviations
estimator. Yet, we rejected these models according to the specification tests.
Second, we tested for the significance of the third category of disaster (climatic dis-
asters). However, the variable did not show to have any impact on the allocation and
disbursement of aid of any of the donors. Therefore, we decided to exclude deaths from
climatic disasters from the specifications presented.
Third, we considered different lack structures of the disaster and conflict intensity vari-
ables to account for a potential lag in the reaction time of large administrations. None of
these specifications proved to improve upon the results presented. This led us to conclude
that donor governments react to disasters in a way very similar to those of individuals.
Initial consternation causes them to become involved within a negligible lag of time. From
a political economy point of view the prompt reaction of donor countries to disasters may
be considered with caution. Taking action out of initial dismay can lead to short-sighted
interventions that lack sustainability. We do not argue that the high responsiveness of
international donors is intrinsically to be criticized. We only want to point out that
donor’s immediate reaction also comprises the danger that development aid is only used
as short term relief without having any long-term goals. In light of the fact that we fail to
identify an impact of past disasters on contemporaneous aid allocations, the possibility
of donors’ short-sightedness needs further discussion.
7 Implications for aid donors and recipients
Our results present new evidence that donors and groups of donors have their distinct
individual preferences when it comes to prioritizing their development aid. While this
is not surprising, it in fact confirms Hoeffler and Outram’s findings, our results bear
additional implications in terms of aid allocation in general, and in the case of natural
disaster and/or conflict shocks in particular. Our study support the intuition that donors
19
have a higher degree of responsiveness in the case of disasters in comparison to conflict
shocks. Indeed, our analysis helped establish that France and Germany appear to be
sensitive to disasters in their aid allocations. Japan, in turn, seems to prefer providing
support to countries with policies that have the potential to enhance growth. Trade
links on the other hand are stronger predictors of aid allocation for the United King-
dom and the United States, with the latter displaying a strong strategic dimension in
aid disbursements over the period. In the case of the European Union, the G7 and the
OECD, our results show donors’ receptiveness to humanitarian disasters. However, only
the former two of the three unions also take action in the aftermath of geological disasters.
The political situation in fragile stages and open-conflict situations is complex. Yet, we
cannot find clear-cut evidence that countries in conflict receive less per capita ODA. Nev-
ertheless, donors’ aid commitment to these countries seems to be reduced. Indeed, prior
research has noted how conflict countries may receive less assistance than their peaceful
counterparts presenting similar needs (Patel et al., 2009). In the study at hand we can-
not find a significant reduction in aid due to conflict which coevally implies that there is
no aid-financing of conflict. Another potential explanation for the missing link between
aid and conflict is our instrument choice. Although the empirical specification is valid
according to the Arellano-Bond specification tests, it is possible that the relative size of
the youth bulge is a weak identification of conflict intensity as measured by the number
of victims per 10,000 inhabitants.
In the case of ‘double whammy’, countries do not see a lasting surge of aid allocations.
The attention span of donors is short and we do not observe a systematic increase or
decrease in per capita ODA as a consequence of the concomitance of disaster and conflict
Our results have also implications in terms of donors’ capacity to coordinate and harmo-
nize their aid allocations per their commitment to the Paris Declaration (2005) and the
Accra Agenda for Action (2008). Donors undoubtedly face major challenges in walking
the talk, as their previous aid allocation patterns confirm. Furthermore, donor prefer-
ences and their difficulty to harmonize aid can be expected to have more parlous effects in
the case of fragile countries. Regarding predictability, our analysis confirms that actual
disbursement of ODA is indeed ‘stickier’ than aid commitments. However, this type of
predictability can only be established ex-post and thus does not count towards improving
aid recipients’ visibility in terms of aid allocations.
Another consistent and interesting observation provided by our analysis is that the socio-
economic situation of the recipient country and the populations’ health status, proxied
by life expectancy, does not influence aid commitments or disbursements. Such a finding
20
is interesting in light of the donor commitments to the Millennium Development Goals
(MDGs). While the MDGs do not specifically make increasing life expectancy a goal, the
first six goals directly have this variable as an outcome of their fulfillment. Therefore,
one could have expected donors’ allocation to reflect more clearly this commitment. This
finding further reinforces the point that developing countries faced with multiple shocks
and challenges are at a major disadvantage in terms of the responsiveness of aid to their
needs and vulnerability.
In the context of Bilateral Donors’ review of their assistance strategy (See “The Future of
UK Aid”, 2011), our results have implications to enhance aid effectiveness in a situation
of competing priorities and increased budget constraints. Countries participating in the
Development Assistance Committee (DAC) continue to represent the majority of ODA
(120 billion US$), but new donors have become substantially more engaged. Indeed, over
the last two decades, aid has nearly doubled, reaching a level of about 200 billion US$
in 2008, a 50 % increase in real terms. In 2008, 65 billion US$ of total aid comes from
NGOs, foundations, corporations and many others.10 An additional 15 billion US$ comes
from non-DAC bilateral donors (OECD/ DAC 2008). Thus, the increase in aid observed
over the last two decades has been largely induced by those ‘non-traditional’ sources em-
phasizing the need to identify patterns of aid allocation and avoid a Keynesian beauty
contest scenario, likely to be the most detrimental to fragile countries.
8 Conclusion
This paper has considered how donors respond to natural disasters and conflicts in their
allocation of ODA. Our results are supported by a series of robustness checks. We showed
that by and large donors quickly respond to natural disasters but none of the donor coun-
tries under study is influenced by the double-whammy of conflict and disaster, throughout
the period and across countries. While donors are not deterred from providing disaster
relief when a natural disaster occurs in a conflict-afflicted country, the concomitance of
disaster and conflict does not induce a double backing either. We also confirmed that for
all donors, the history of aid flows matters more with respect to disbursed aid than for
aid commitments. This pattern in turn reinforces the donors’ preferences. Overall, we
could show that the main determinants of aid allocations are donor interests and that
these vary substantially across countries.
10Metcalf-Little (2010) shows that Americans gave 37.3 billion US$ to charitable causes in the devel-oping world in 2008, almost 1.5 times more funding than US ODA for the same period. The sectoraldistribution of private giving follows patterns similar to ODA, although new research suggests that phil-anthropic citizens behave differently from governments when making choices about whom to give. Indeed,Desai and Kharas (2009) find that the selectivity of private aid is less oriented toward country-specificfactors, and more toward frontline projects, indicating that private aid and official aid are complementary.
21
This situation is particularly problematic for fragile states and ‘aid orphan’ countries,
for whom the scope of the impact both in terms of costs and length of recovery is likely
to be greater. An analysis based on vulnerability and resilience with an early warning
type of approach would offer donors with a stronger basis in their arbitration on aid
allocation to ‘fragile states’. If prevention is indeed a key concern in aid allocation to
fragile states, a better understanding of how to prevent the trickling effect of hazards
–regardless of their initial nature– is crucial (World Bank, 2010b).
There is ample scope for further research. For one, in the case of disasters, we have
not included in our analysis the importance of media attention in disaster reporting and
the potential impact it has on donors’ aid allocation (Potter and Van Belle, 2008).11 Sec-
ond, the type of assistance provided by bilateral donors should also be further explored.
Given the substantial part of General Budget Support (GBS) provided by donors12 and
the high fungibility of this type of aid, it is likely that refining aid allocation beyond total
commitment and disbursement could yield relevant information for policy-making. How-
ever, the data provided by donors in the OECD Creditor Reporting System (CRS) isn’t
sufficiently consistent across donors and recipients over time to carry out such an analysis
at this point. Third, the emergence of new donors such as China, Brazil, India and the
OPEC countries constitutes a major ‘game change’ likely to increasingly be considered by
other donors in their aid allocation. Fourth, large cities exposed to cyclones and earth-
quakes will more than double their population by 2050, from 680 million in 2000 to 1.5
billion in 2050.13 Furthermore, climate change14 is expected to raise the complexity of the
issues relating to both conflict and disasters. Due to their exposure, mega-cities are at
high risk to suffer tremendous damages from climate change. Therefore, a combination of
prevention and early warning systems appears not only necessary but also economically
sensible beyond relief and ODA. Ergo, there is a lot of policy-relevant research that needs
to be done.
11The authors showed that the media impact on relief spending after disasters is also felt at the levelof the affected country/state. Besley and Burgess (2002) find that politicians’ responsiveness to disastersis increased by media coverage.
12For the European Union it is about 25% of the total ODA disbursement.13For example, Mumbai (India), the fourth largest city in the world with 20 million people and 6.7
million slum dwellers (WHO), is one of the top 10 most vulnerable cities in terms of floods, storms andearthquakes. Like many of Asia’s coastal mega-cities, most of the city is less than a meter above sea-level.With Mumbai accounting for almost 40 % of India’s tax revenue, any serious catastrophe there couldhave drastic economic consequences for the country.
14An estimate of the increase in damage associated with changed tropical cyclone activity as a resultof climate change is between $28 billion and $68 billion annually by 2100. This represents an increase ofbetween 50 and 125 % over no climate change (World Bank, 2010a).
22
References
Alesina, A. and Dollar, D. (2001). Who Gives Foreign Aid to Whom and Why?
Journal of Economic Growth, 5 (1), 33–63.
— and Weder, B. (2002). Do Corrupt Governments Receive Less Foreign Aid? The
American Economic Review, 92 (4), 1126–1137.
Arcand, J. and Chauvet, L. (2001). Foreign Aid, Rent-Seeking Behavior, and Civil
War. Working Paper - CERDI-CNRS, pp. 1–46.
Arellano, M. and Bond, S. (1991). Some Tests of Specification of Panel Data: Monte
Carlo Evidence and an Application to Employment Equations. Review of Economic
Studies, 58 (2), 277–297.
— and Bover, O. (1995). Another Look at the Instrumental Variable Estimation of
Error-Components Models. Journal of Econometrics, 68 (1), 29–52.
Barakat, B. and Urdal, H. (2009). Breaking the Waves? Does Education Mediate the
Relationship Between Youth Bulges and Political Violence? Policy Research Working
Paper, World Bank Washington, DC.
Bergholt, D. and Lujala, P. (2010). Economic Effects of Natural Disasters and
Armed Civil Conflict. Paper Prepared for the “Climate Change and Security” Confer-
ence, Trondheim, Norway 21-24 June.
Besley, T. and Burgess, R. (2002). The Political Economy of Government Respon-
siveness: Theory and Evidence from India. Quaterly Journal of Economics, 4 (17),
1415–51.
Bhavnani, R. (2006). Natural Disaster Conflicts. Working Paper, Harvard University,
pp. 1–46.
Blattman, C. and Miguel, E. (2008). Civil War. Journal of Economic Literature,
forthcoming.
Blundell, R. W. and Bond, S. R. (1998). Initial Conditions and Moment Restrictions
in Dynamic Panel Data Models. Journal of Econometrics, 87 (1), 115–143.
Boone, P. D. (1995). Politics and the Effectiveness of Foreign Aid. NBER Working
Paper No. w5308.
Brancati, D. (2007). Political Aftershocks: The Impact of Earthquakes on Intrastate
Conflict. Journal of Conflict Resolution, 51 (5), 715–743.
23

Collier, P. (1999). On the Economic Consequences of Civil War. Oxford Economic
Papers, 51 (1), 168–183.
— and Hoeffler, A. (1998). On Economic Causes of Civil War. Oxford Economic
Papers, 50 (4), 563–573.
— and — (2000). Greed and Grievance in Civil War. World Bank Policy Research
Working Paper 2355.
— and — (2002). Aid, Policy and Peace: Reducing The Risks of Civil Conflict. Defence
and Peace Economics, 13 (6), 435–450.
— and — (2004). Aid, Policy and Growth in Post-Conflict Societies. European Economic
Review, 48 (5), 1125–1145.
de Ree, J. and Nillesen, E. (2009). Aiding Violence or Peace? The Impact of For-
eign Aid on the Risk of Civil Conflict in Sub-Saharan Africa. Journal of Development
Economics, 88 (2), 301–313.
Desai, R. and Kharas, H. (2009). Do Philanthropic Citizens Behave Like Govern-
ments? Wolfensohn Center for Development at Brookings Working Papers, 12.
Ember, C. R. and Ember, M. (1992). Resource Unpredictability, Mistrust and War:
A Cross-Cultural Study. Journal of Conflict Resolution, 36 (2), 242–262.
Evin, A. (2004). Changing Greek Perspectives on Turkey: An Assessment of the Post-
Earthquake Rapproachment. Turkish Studies, 5, 4–20.
Fearon, J. and Laitin, D. (2003). Ethnicity, Insurgency, and Civil War. American
Political Science Review, 97 (1), 75–90.
Grossman, H. I. (1991). A General Equilibrium Model of Insurrections. American Eco-
nomic Review, 81 (4), 912–921.
— (1992). Foreign Aid and Insurrection. Defence and Peace Economics, 3 (4), 275–288.
— (1999). Kleptocracy and Revolutions. Oxford Economic Papers, 51 (2), 267–283.
Guha-Sapir, D. and Vos, F. (2011). Earthquakes, an Epidemiological Perspective on
Patterns and Trends. Advances in Natural and Technological Hazards Research, 29 (1),
13–24.
Hegre, H., Ellingsen, T., Gleditsch, N. and Gates, S. (1999). Towards a Demo-
cratic Civil Peace? Paper Presented to the DECGR Launch Workshop “Civil Conflicts,
Crime, and Violence in Developing Countries”, World Bank, Washington DC, Febru-
ary.
24
Hoeffler, A. and Outram, V. (2010). Need, Merit or Self-Interest - What Deter-
mines the Allocation of Aid? Accepted for Publication in the Review of Development
Economics, (2008-19).
Homer-Dixon, T. (2009). Wars, Guns and Votes: Democracy in Dangerous Places.
New York, NY: Harper.
Kelman, I. and Koukis, T. (2000). Disaster Diplomacy. Special Issue, Cambridge Re-
view of International Affairs, 14 (1), 214–94.
Marshall, M. G. and Jaggers, K. (2002). Polity IV Project Dataset Users’ Manual.
Unpublished Manuscript, University of Maryland.
Metcalf-Little, H. (2010). The Role of Private Assistance in International Develop-
ment. Hudson Institute Research Papers.
Miguel, E. and Kremer, M. (2004). Worms: Identifying Impacts on Education and
Health in the Presence of Treatment Externalities. Econometrica, 72 (1), 159–217.
Nel, P. and Righarts, M. (2008). National Disasters and the Risk of Violent Civil
Conflict. International Studies Quarterly, 52 (1), 159 –185.
Noy, I. (2009). The Macroeconomic Consequences of Disasters. Journal of Development
Economics, 88 (2), 221–231.
Olson, R. and Drury, A. (1997). Un-Therapeutic Communities: A Cross-National
Analysis of Post-Disaster Political Unrest. International Journal of Mass Emergencies
and Disasters, 15, 221–238.
Patel, P., Roberts, B., Guy, S., Lee-Jones, L. and Conteh, L. (2009). Tracking
Official Development Assistance for Reproductive Health in Conflict-Affected Coun-
tries. Public Library of Sciences (PLoS).
Potter, D. M. and Van Belle, D. (2008). News Coverage and Japanese Foreign
Disaster Aid: A Comparative Example of Bureaucratic Responsiveness to the News
Media. International Relations of the Asia-Pacific, 9 (2), 295–315.
Quarantelli, E. L. and Dynes, R. R. (1976). Community Conflict: Its Absence and
its Presence in National Disasters. Mass Emergencies, 1, 139–52.
Raddatz, C. (2007). Are External Shocks Responsible for the Instability of Output in
Low-Income Countries? Journal of Development Economics, 84 (1), 155–187.
Round, J. I. and Odedokun, M. (2004). Aid Effort and its Determinants. International
Review of Economics & Finance, 13 (3), 293–309.
25
Ruggeri, A. and Schudel, W. (2010a). Foreign Aid, Domestic Corruption and the
Onset of Civil War. Paper Presented at ISA Conference, New Orleans.
— and — (2010b). Pacifying Aid: The Effects of Foreign Aid on Civil War Duration.
Working Paper.
Sandler, T. and Hegre, H. (2002). Economic Analysis of Civil Wars. Defence and
Peace Economics, 13 (6), 429–433.
Schudel, W. (2008). Corruption and Bilateral Aid. Journal of Conflict Resolution,
52 (4), 507–525.
Skidmore, M. and Toya, H. (2002). Do Natural Disasters Promote Long-Run Growth?
Economic Inquiry, 40 (4), 664–687.
Smith, N. (2006). There’s No Such Thing as a Natural Disas-
ter. Understanding Katharina: Perspectives from the Social Sciences,
http://understandingkatrina.ssrc.org/Smith/.
Strandow, D., Powell, J. and Findley, M. (2010). The Geography of Foreign Aid
and Violent Armed Conflict. Working Paper.
Stromberg, D. (2007). Natural Disasters, Economic Development, and Humanitarian
Aid. Journal of Economic Perspectives, 21 (3), 199–222.
Urdal, H. (2004). The Devil in the Demographics: The Effect of Youth Bulges on
Domestic Armed Conflict, 1950-2000. Social Development Papers: Conflict Prevention
and Reconstruction, 14.
— and Hoelscher, K. (2009). Urban Youth Bulges and Social Disorder: An Empirical
Study of Asian and Sub-Saharan African Cities. SSRN eLibrary.
World Bank (2010a). Development and Climate Change. World Development Report.
World Bank (2010b). Natural Hazards, UnNatural Disasters. The Economics of Effec-
tive Prevention. Washington, DC: The World Bank.
26
1st lag 2nd lag 3rd lag
Committed French ODA 0.421 0.216 0.215[0.000] [0.000] [0.000]
Disbursed French ODA 0.584 0.207 0.090[0.000] [0.000] [0.046]
Committed German ODA 0.302 0.396 0.150[0.000] [0.000] [0.000]
Committed Japanese ODA 0.374 0.247 0.135[0.000] [0.000] [0.001]
Disbursed Japanese ODA 0.621 0.134 0.036[0.000] [0.001] [0.306]
Disbursed German ODA 0.605 0.136 0.127[0.000] [0.003] [0.001]
Committed UK ODA 0.490 0.175 0.220[0.000] [0.000] [0.000]
Disbursed UK ODA 0.632 0.178 0.084[0.000] [0.000] [0.064]
Committed US ODA 0.548 0.260 0.091[0.000] [0.001] [0.060]
Disbursed US ODA 0.688 0.139 0.089[0.000] [0.005] [0.071]
Committed EU ODA 0.348 0.215 0.151[0.000] [0.000] [0.001]
Disbursed EU ODA 0.498 0.277 0.087[0.000] [0.000] [0.010]
Committed G7 ODA 0.506 0.277 0.111[0.000] [0.000] [0.000]
Disbursed G7 ODA 0.717 0.132 0.075[0.000] [0.020] [0.053]
Committed OECD ODA 0.508 0.329 0.063[0.000] [0.000] [0.024]
Disbursed OECD ODA 0.718 0.143 0.062[0.000] [0.011] [0.125]
Table 1: Time series properties of all aid variables studied;all variables are in log per capita terms. Heterogeneityadjusted p-values are in brackets.
27
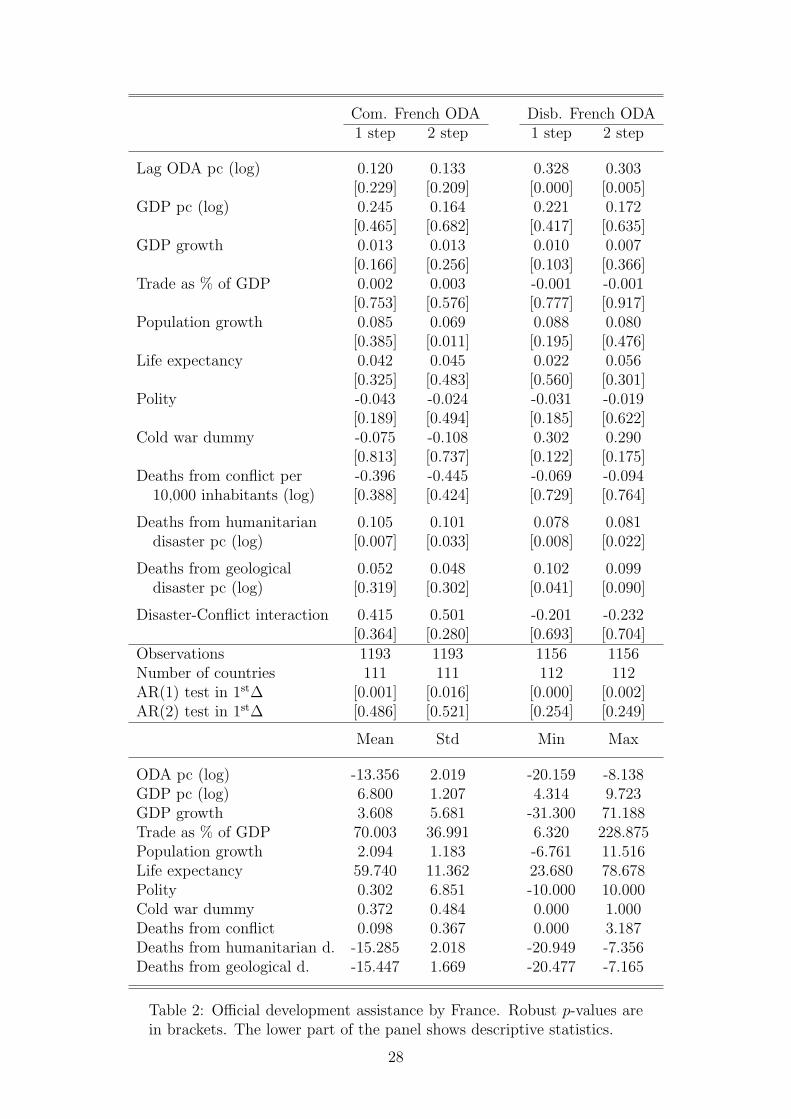
Com. French ODA Disb. French ODA1 step 2 step 1 step 2 step
Lag ODA pc (log) 0.120 0.133 0.328 0.303[0.229] [0.209] [0.000] [0.005]
GDP pc (log) 0.245 0.164 0.221 0.172[0.465] [0.682] [0.417] [0.635]
GDP growth 0.013 0.013 0.010 0.007[0.166] [0.256] [0.103] [0.366]
Trade as % of GDP 0.002 0.003 -0.001 -0.001[0.753] [0.576] [0.777] [0.917]
Population growth 0.085 0.069 0.088 0.080[0.385] [0.011] [0.195] [0.476]
Life expectancy 0.042 0.045 0.022 0.056[0.325] [0.483] [0.560] [0.301]
Polity -0.043 -0.024 -0.031 -0.019[0.189] [0.494] [0.185] [0.622]
Cold war dummy -0.075 -0.108 0.302 0.290[0.813] [0.737] [0.122] [0.175]
Deaths from conflict per -0.396 -0.445 -0.069 -0.09410,000 inhabitants (log) [0.388] [0.424] [0.729] [0.764]
Deaths from humanitarian 0.105 0.101 0.078 0.081disaster pc (log) [0.007] [0.033] [0.008] [0.022]
Deaths from geological 0.052 0.048 0.102 0.099disaster pc (log) [0.319] [0.302] [0.041] [0.090]
Disaster-Conflict interaction 0.415 0.501 -0.201 -0.232[0.364] [0.280] [0.693] [0.704]
Observations 1193 1193 1156 1156Number of countries 111 111 112 112AR(1) test in 1st∆ [0.001] [0.016] [0.000] [0.002]AR(2) test in 1st∆ [0.486] [0.521] [0.254] [0.249]
Mean Std Min Max
ODA pc (log) -13.356 2.019 -20.159 -8.138GDP pc (log) 6.800 1.207 4.314 9.723GDP growth 3.608 5.681 -31.300 71.188Trade as % of GDP 70.003 36.991 6.320 228.875Population growth 2.094 1.183 -6.761 11.516Life expectancy 59.740 11.362 23.680 78.678Polity 0.302 6.851 -10.000 10.000Cold war dummy 0.372 0.484 0.000 1.000Deaths from conflict 0.098 0.367 0.000 3.187Deaths from humanitarian d. -15.285 2.018 -20.949 -7.356Deaths from geological d. -15.447 1.669 -20.477 -7.165
Table 2: Official development assistance by France. Robust p-values arein brackets. The lower part of the panel shows descriptive statistics.
28
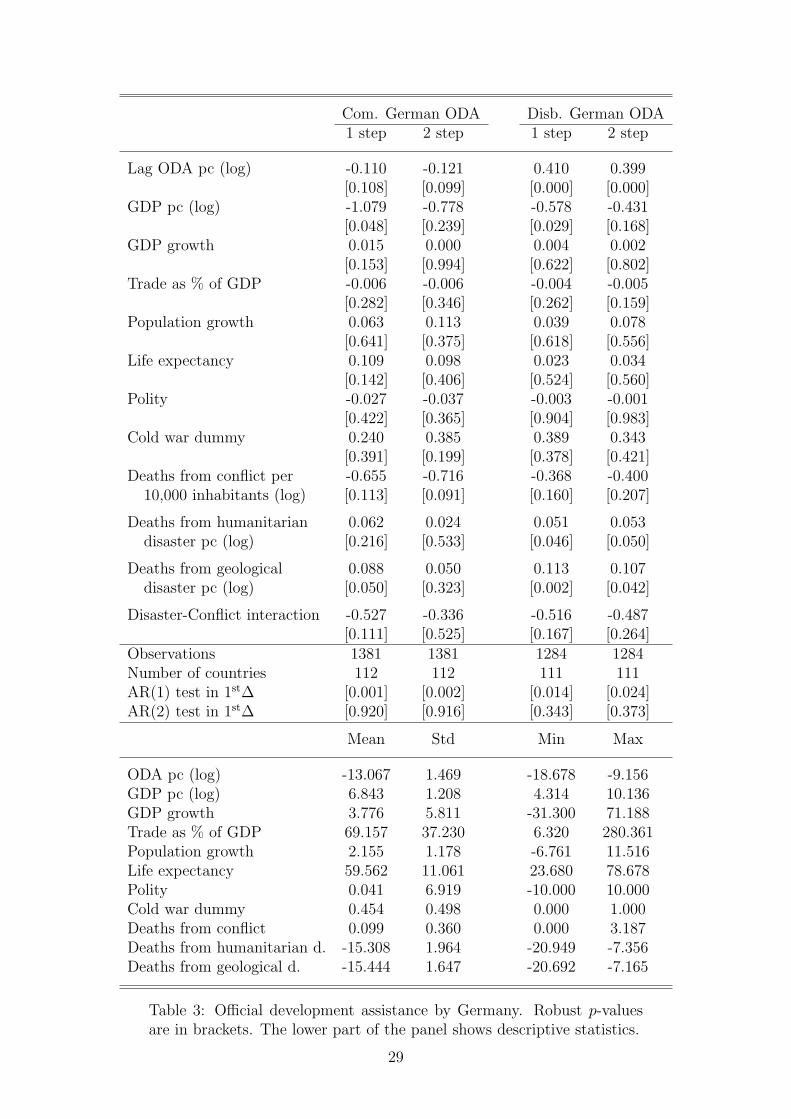
Com. German ODA Disb. German ODA1 step 2 step 1 step 2 step
Lag ODA pc (log) -0.110 -0.121 0.410 0.399[0.108] [0.099] [0.000] [0.000]
GDP pc (log) -1.079 -0.778 -0.578 -0.431[0.048] [0.239] [0.029] [0.168]
GDP growth 0.015 0.000 0.004 0.002[0.153] [0.994] [0.622] [0.802]
Trade as % of GDP -0.006 -0.006 -0.004 -0.005[0.282] [0.346] [0.262] [0.159]
Population growth 0.063 0.113 0.039 0.078[0.641] [0.375] [0.618] [0.556]
Life expectancy 0.109 0.098 0.023 0.034[0.142] [0.406] [0.524] [0.560]
Polity -0.027 -0.037 -0.003 -0.001[0.422] [0.365] [0.904] [0.983]
Cold war dummy 0.240 0.385 0.389 0.343[0.391] [0.199] [0.378] [0.421]
Deaths from conflict per -0.655 -0.716 -0.368 -0.40010,000 inhabitants (log) [0.113] [0.091] [0.160] [0.207]
Deaths from humanitarian 0.062 0.024 0.051 0.053disaster pc (log) [0.216] [0.533] [0.046] [0.050]
Deaths from geological 0.088 0.050 0.113 0.107disaster pc (log) [0.050] [0.323] [0.002] [0.042]
Disaster-Conflict interaction -0.527 -0.336 -0.516 -0.487[0.111] [0.525] [0.167] [0.264]
Observations 1381 1381 1284 1284Number of countries 112 112 111 111AR(1) test in 1st∆ [0.001] [0.002] [0.014] [0.024]AR(2) test in 1st∆ [0.920] [0.916] [0.343] [0.373]
Mean Std Min Max
ODA pc (log) -13.067 1.469 -18.678 -9.156GDP pc (log) 6.843 1.208 4.314 10.136GDP growth 3.776 5.811 -31.300 71.188Trade as % of GDP 69.157 37.230 6.320 280.361Population growth 2.155 1.178 -6.761 11.516Life expectancy 59.562 11.061 23.680 78.678Polity 0.041 6.919 -10.000 10.000Cold war dummy 0.454 0.498 0.000 1.000Deaths from conflict 0.099 0.360 0.000 3.187Deaths from humanitarian d. -15.308 1.964 -20.949 -7.356Deaths from geological d. -15.444 1.647 -20.692 -7.165
Table 3: Official development assistance by Germany. Robust p-valuesare in brackets. The lower part of the panel shows descriptive statistics.
29
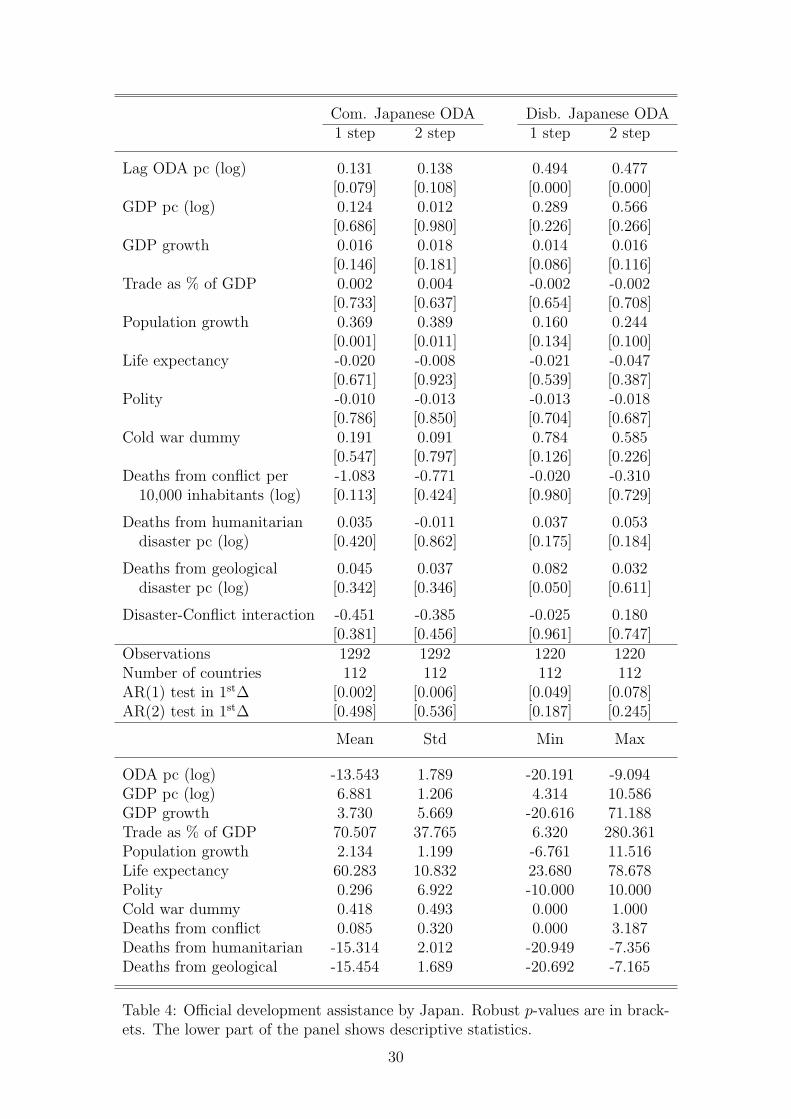
Com. Japanese ODA Disb. Japanese ODA1 step 2 step 1 step 2 step
Lag ODA pc (log) 0.131 0.138 0.494 0.477[0.079] [0.108] [0.000] [0.000]
GDP pc (log) 0.124 0.012 0.289 0.566[0.686] [0.980] [0.226] [0.266]
GDP growth 0.016 0.018 0.014 0.016[0.146] [0.181] [0.086] [0.116]
Trade as % of GDP 0.002 0.004 -0.002 -0.002[0.733] [0.637] [0.654] [0.708]
Population growth 0.369 0.389 0.160 0.244[0.001] [0.011] [0.134] [0.100]
Life expectancy -0.020 -0.008 -0.021 -0.047[0.671] [0.923] [0.539] [0.387]
Polity -0.010 -0.013 -0.013 -0.018[0.786] [0.850] [0.704] [0.687]
Cold war dummy 0.191 0.091 0.784 0.585[0.547] [0.797] [0.126] [0.226]
Deaths from conflict per -1.083 -0.771 -0.020 -0.31010,000 inhabitants (log) [0.113] [0.424] [0.980] [0.729]
Deaths from humanitarian 0.035 -0.011 0.037 0.053disaster pc (log) [0.420] [0.862] [0.175] [0.184]
Deaths from geological 0.045 0.037 0.082 0.032disaster pc (log) [0.342] [0.346] [0.050] [0.611]
Disaster-Conflict interaction -0.451 -0.385 -0.025 0.180[0.381] [0.456] [0.961] [0.747]
Observations 1292 1292 1220 1220Number of countries 112 112 112 112AR(1) test in 1st∆ [0.002] [0.006] [0.049] [0.078]AR(2) test in 1st∆ [0.498] [0.536] [0.187] [0.245]
Mean Std Min Max
ODA pc (log) -13.543 1.789 -20.191 -9.094GDP pc (log) 6.881 1.206 4.314 10.586GDP growth 3.730 5.669 -20.616 71.188Trade as % of GDP 70.507 37.765 6.320 280.361Population growth 2.134 1.199 -6.761 11.516Life expectancy 60.283 10.832 23.680 78.678Polity 0.296 6.922 -10.000 10.000Cold war dummy 0.418 0.493 0.000 1.000Deaths from conflict 0.085 0.320 0.000 3.187Deaths from humanitarian -15.314 2.012 -20.949 -7.356Deaths from geological -15.454 1.689 -20.692 -7.165
Table 4: Official development assistance by Japan. Robust p-values are in brack-ets. The lower part of the panel shows descriptive statistics.
30

Committed UK ODA Disbursed UK ODA1 step 2 step 1 step 2 step
Lag ODA pc (log) 0.338 0.306 0.484 0.459[0.000] [0.000] [0.000] [0.000]
GDP pc (log) -0.020 0.132 0.060 -0.048[0.959] [0.806] [0.847] [0.933]
GDP growth 0.018 0.008 0.006 0.000[0.111] [0.515] [0.478] [0.982]
Trade as % of GDP 0.011 0.009 0.008 0.007[0.012] [0.080] [0.025] [0.135]
Population growth -0.006 0.058 0.070 0.137[0.961] [0.689] [0.451] [0.148]
Life expectancy -0.016 -0.030 -0.027 -0.017[0.685] [0.652] [0.366] [0.779]
Polity -0.022 -0.023 0.017 0.017[0.544] [0.752] [0.504] [0.564]
Cold war dummy 0.053 0.108 -0.073 -0.096[0.876] [0.779] [0.798] [0.745]
Deaths from conflict per 0.293 0.217 0.140 0.03610,000 inhabitants (log) [0.532] [0.643] [0.535] [0.917]
Deaths from humanitarian 0.073 0.081 0.043 0.036disaster pc (log) [0.043] [0.018] [0.104] [0.237]
Deaths from geological 0.010 0.017 0.017 0.013disaster pc (log) [0.817] [0.697] [0.606] [0.792]
Disaster-Conflict interaction -0.180 0.042 -0.008 -0.058[0.536] [0.899] [0.980] [0.866]
Observations 1209 1209 1172 1172Number of countries 109 109 109 109AR(1) test in 1st∆ [0.001] [0.006] [0.000] [0.003]AR(2) test in 1st∆ [0.652] [0.627] [0.103] [0.110]
Mean Std Min Max
ODA pc (log) -14.531 2.109 -21.189 -8.051GDP pc (log) 6.736 1.125 4.314 9.723GDP growth 4.037 5.610 -31.300 71.188Trade as % of GDP 68.390 36.674 6.320 280.361Population growth 2.154 1.138 -6.761 11.516Life expectancy 59.072 11.012 23.680 78.678Polity 0.378 6.878 -10.000 10.000Cold war dummy 0.458 0.498 0.000 1.000Deaths from conflict 0.094 0.347 0.000 3.169Deaths from humanitarian d. -15.319 1.998 -20.949 -7.356Deaths from geological d. -15.470 1.652 -20.477 -7.165
Table 5: Official development assistance by the United Kingdom. Robust p-values are in brackets. The lower part of the panel shows descriptive statistics.
31
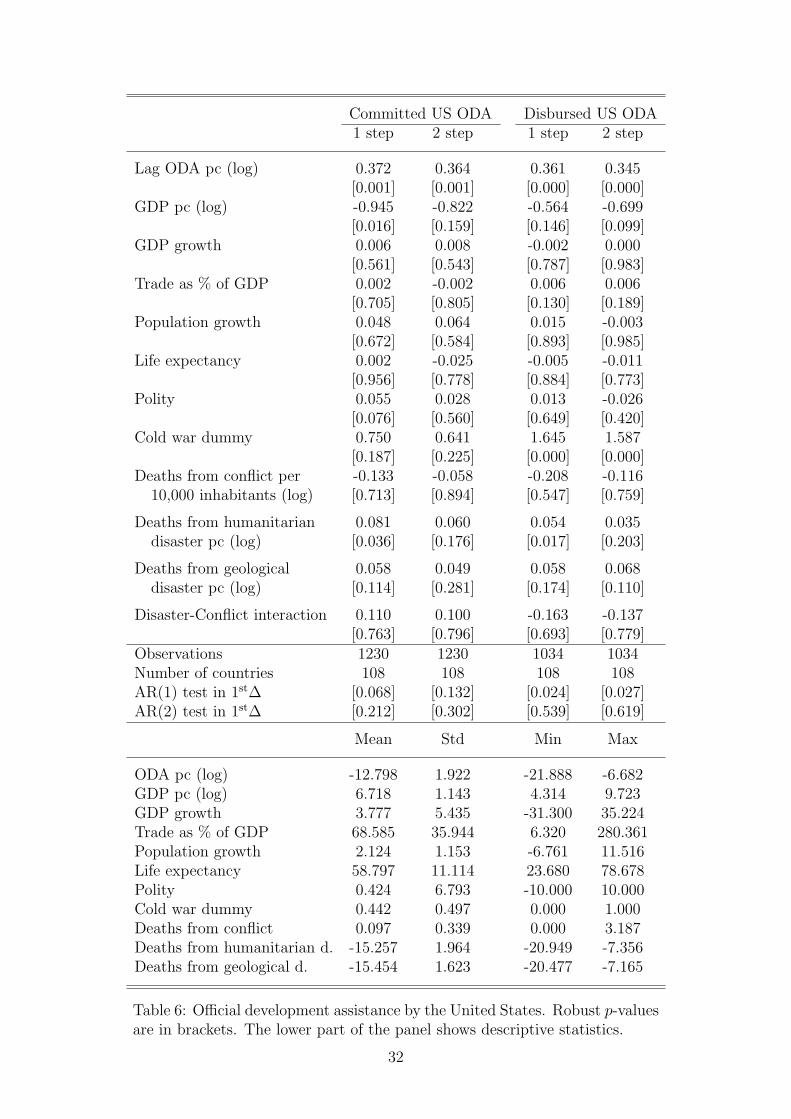
Committed US ODA Disbursed US ODA1 step 2 step 1 step 2 step
Lag ODA pc (log) 0.372 0.364 0.361 0.345[0.001] [0.001] [0.000] [0.000]
GDP pc (log) -0.945 -0.822 -0.564 -0.699[0.016] [0.159] [0.146] [0.099]
GDP growth 0.006 0.008 -0.002 0.000[0.561] [0.543] [0.787] [0.983]
Trade as % of GDP 0.002 -0.002 0.006 0.006[0.705] [0.805] [0.130] [0.189]
Population growth 0.048 0.064 0.015 -0.003[0.672] [0.584] [0.893] [0.985]
Life expectancy 0.002 -0.025 -0.005 -0.011[0.956] [0.778] [0.884] [0.773]
Polity 0.055 0.028 0.013 -0.026[0.076] [0.560] [0.649] [0.420]
Cold war dummy 0.750 0.641 1.645 1.587[0.187] [0.225] [0.000] [0.000]
Deaths from conflict per -0.133 -0.058 -0.208 -0.11610,000 inhabitants (log) [0.713] [0.894] [0.547] [0.759]
Deaths from humanitarian 0.081 0.060 0.054 0.035disaster pc (log) [0.036] [0.176] [0.017] [0.203]
Deaths from geological 0.058 0.049 0.058 0.068disaster pc (log) [0.114] [0.281] [0.174] [0.110]
Disaster-Conflict interaction 0.110 0.100 -0.163 -0.137[0.763] [0.796] [0.693] [0.779]
Observations 1230 1230 1034 1034Number of countries 108 108 108 108AR(1) test in 1st∆ [0.068] [0.132] [0.024] [0.027]AR(2) test in 1st∆ [0.212] [0.302] [0.539] [0.619]
Mean Std Min Max
ODA pc (log) -12.798 1.922 -21.888 -6.682GDP pc (log) 6.718 1.143 4.314 9.723GDP growth 3.777 5.435 -31.300 35.224Trade as % of GDP 68.585 35.944 6.320 280.361Population growth 2.124 1.153 -6.761 11.516Life expectancy 58.797 11.114 23.680 78.678Polity 0.424 6.793 -10.000 10.000Cold war dummy 0.442 0.497 0.000 1.000Deaths from conflict 0.097 0.339 0.000 3.187Deaths from humanitarian d. -15.257 1.964 -20.949 -7.356Deaths from geological d. -15.454 1.623 -20.477 -7.165
Table 6: Official development assistance by the United States. Robust p-valuesare in brackets. The lower part of the panel shows descriptive statistics.
32

Committed EU ODA Disbursed EU ODA1 step 2 step 1 step 2 step
Lag ODA pc (log) 0.118 0.100 0.253 0.170[0.093] [0.242] [0.002] [0.022]
GDP pc (log) 0.102 -0.097 -0.863 -0.555[0.792] [0.871] [0.051] [0.450]
GDP growth -0.018 -0.002 -0.011 -0.015[0.055] [0.923] [0.122] [0.095]
Trade as % of GDP 0.005 0.000 0.010 0.011[0.390] [0.982] [0.003] [0.000]
Population growth 0.206 0.084 -0.094 -0.070[0.109] [0.559] [0.528] [0.727]
Life expectancy -0.015 0.087 0.061 0.040[0.718] [0.350] [0.187] [0.502]
Polity 0.029 0.015 0.031 0.035[0.402] [0.857] [0.306] [0.401]
Cold war dummy -0.005 -0.055 0.253 0.195[0.995] [0.938] [0.491] [0.585]
Deaths from conflict per -0.127 0.150 -0.127 -0.33710,000 inhabitants (log) [0.687] [0.690] [0.559] [0.125]
Deaths from humanitarian 0.178 0.122 0.085 0.058disaster pc (log) [0.000] [0.059] [0.001] [0.069]
Deaths from geological 0.108 0.077 0.099 0.072disaster pc (log) [0.043] [0.369] [0.006] [0.106]
Disaster-Conflict interaction 0.986 1.128 -0.120 -0.063[0.008] [0.156] [0.608] [0.855]
Observations 1132 1132 1165 1165Number of countries 109 109 109 109AR(1) test in 1st∆ [0.000] [0.000] [0.006] [0.017]AR(2) test in 1st∆ [0.059] [0.073] [0.161] [0.227]
Mean Std Min Max
ODA pc (log) -12.837 1.952 -21.048 -8.494GDP pc (log) 6.692 1.131 4.314 9.723GDP growth 3.610 5.542 -31.300 71.188Trade as % of GDP 69.167 36.276 6.320 280.361Population growth 2.092 1.156 -6.761 11.516Life expectancy 59.137 11.299 23.680 78.642Polity 0.507 6.755 -10.000 10.000Cold war dummy 0.389 0.488 0.000 1.000Deaths from conflict 0.099 0.360 0.000 3.187Deaths from humanitarian d. -15.225 2.014 -20.949 -7.356Deaths from geological d. -15.408 1.644 -20.477 -7.165
Table 7: Official development assistance by the European Union. Robust p-values are in brackets. The lower part of the panel shows descriptive statistics.
33

Committed G7 ODA Disbursed G7 ODA1 step 2 step 1 step 2 step
Lag ODA pc (log) 0.225 0.228 0.439 0.454[0.001] [0.001] [0.000] [0.000]
GDP pc (log) -0.491 -0.320 -0.441 -0.496[0.107] [0.390] [0.155] [0.100]
GDP growth 0.009 0.008 0.004 0.000[0.197] [0.319] [0.555] [0.954]
Trade as % of GDP 0.001 0.001 0.002 0.002[0.697] [0.837] [0.584] [0.720]
Population growth 0.082 0.071 -0.058 -0.040[0.402] [0.537] [0.671] [0.788]
Life expectancy 0.053 0.029 0.022 0.030[0.185] [0.525] [0.502] [0.359]
Polity -0.011 -0.009 -0.009 -0.005[0.602] [0.805] [0.648] [0.862]
Cold war dummy 0.601 0.580 0.637 0.707[0.000] [0.001] [0.035] [0.041]
Deaths from conflict per -0.640 -0.636 -0.108 -0.17310,000 inhabitants (log) [0.051] [0.042] [0.607] [0.490]
Deaths from humanitarian 0.091 0.068 0.083 0.077disaster pc (log) [0.002] [0.013] [0.001] [0.000]
Deaths from geological 0.079 0.082 0.068 0.069disaster pc (log) [0.024] [0.051] [0.011] [0.041]
Disaster-Conflict interaction -0.170 -0.099 0.076 0.029[0.647] [0.821] [0.775] [0.927]
Observations 1404 1404 1330 1330Number of countries 112 112 112 112AR(1) test in 1st∆ [0.000] [0.001] [0.002] [0.008]AR(2) test in 1st∆ [0.885] [0.941] [0.952] [0.919]
Mean Std Min Max
ODA pc (log) -10.943 1.263 -15.328 -6.638GDP pc (log) 6.846 1.210 4.314 10.586GDP growth 3.767 5.842 -31.300 71.188Trade as % of GDP 69.787 37.481 6.320 280.361Population growth 2.159 1.180 -6.761 11.516Life expectancy 59.579 11.038 23.680 78.678Polity 0.089 6.931 -10.000 10.000Cold war dummy 0.457 0.498 0.000 1.000Deaths from conflict 0.098 0.358 0.000 3.187Deaths from humanitarian d. -15.277 1.965 -20.949 -7.356Deaths from geological d. -15.412 1.656 -20.692 -7.165
Table 8: Official development assistance by the G7 countries. Robust p-valuesare in brackets. The lower part of the panel shows descriptive statistics.
34
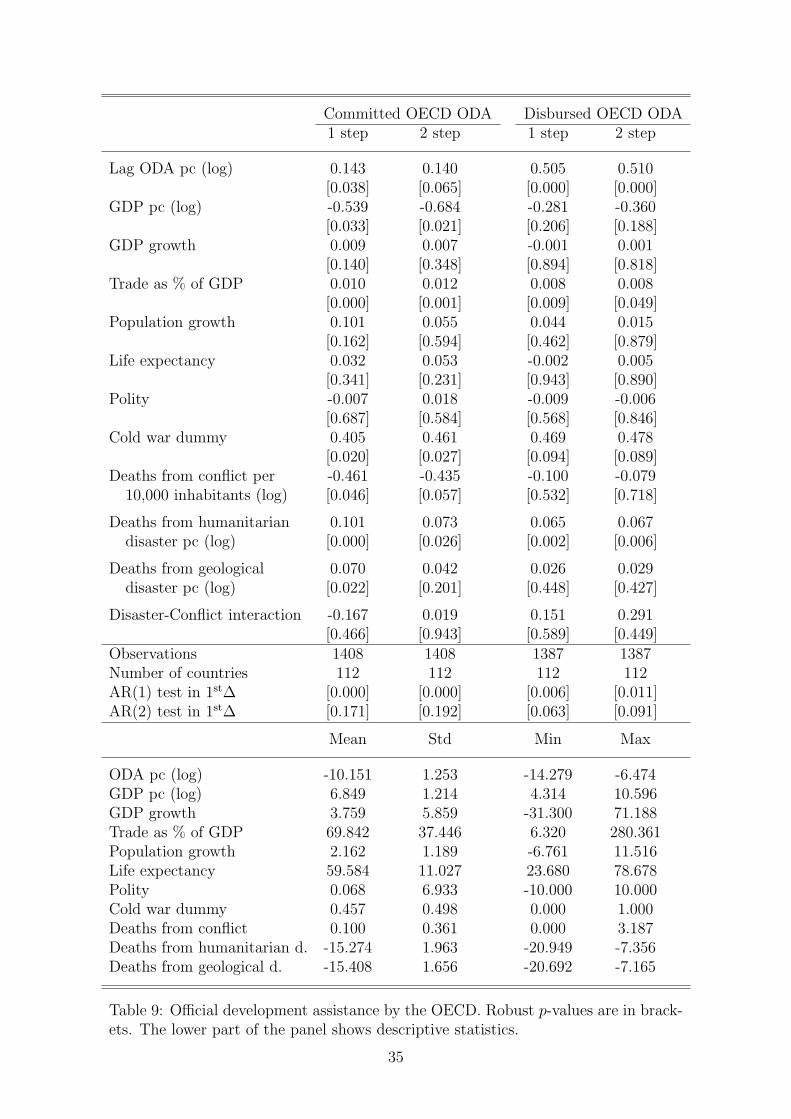
Committed OECD ODA Disbursed OECD ODA1 step 2 step 1 step 2 step
Lag ODA pc (log) 0.143 0.140 0.505 0.510[0.038] [0.065] [0.000] [0.000]
GDP pc (log) -0.539 -0.684 -0.281 -0.360[0.033] [0.021] [0.206] [0.188]
GDP growth 0.009 0.007 -0.001 0.001[0.140] [0.348] [0.894] [0.818]
Trade as % of GDP 0.010 0.012 0.008 0.008[0.000] [0.001] [0.009] [0.049]
Population growth 0.101 0.055 0.044 0.015[0.162] [0.594] [0.462] [0.879]
Life expectancy 0.032 0.053 -0.002 0.005[0.341] [0.231] [0.943] [0.890]
Polity -0.007 0.018 -0.009 -0.006[0.687] [0.584] [0.568] [0.846]
Cold war dummy 0.405 0.461 0.469 0.478[0.020] [0.027] [0.094] [0.089]
Deaths from conflict per -0.461 -0.435 -0.100 -0.07910,000 inhabitants (log) [0.046] [0.057] [0.532] [0.718]
Deaths from humanitarian 0.101 0.073 0.065 0.067disaster pc (log) [0.000] [0.026] [0.002] [0.006]
Deaths from geological 0.070 0.042 0.026 0.029disaster pc (log) [0.022] [0.201] [0.448] [0.427]
Disaster-Conflict interaction -0.167 0.019 0.151 0.291[0.466] [0.943] [0.589] [0.449]
Observations 1408 1408 1387 1387Number of countries 112 112 112 112AR(1) test in 1st∆ [0.000] [0.000] [0.006] [0.011]AR(2) test in 1st∆ [0.171] [0.192] [0.063] [0.091]
Mean Std Min Max
ODA pc (log) -10.151 1.253 -14.279 -6.474GDP pc (log) 6.849 1.214 4.314 10.596GDP growth 3.759 5.859 -31.300 71.188Trade as % of GDP 69.842 37.446 6.320 280.361Population growth 2.162 1.189 -6.761 11.516Life expectancy 59.584 11.027 23.680 78.678Polity 0.068 6.933 -10.000 10.000Cold war dummy 0.457 0.498 0.000 1.000Deaths from conflict 0.100 0.361 0.000 3.187Deaths from humanitarian d. -15.274 1.963 -20.949 -7.356Deaths from geological d. -15.408 1.656 -20.692 -7.165
Table 9: Official development assistance by the OECD. Robust p-values are in brack-ets. The lower part of the panel shows descriptive statistics.
35
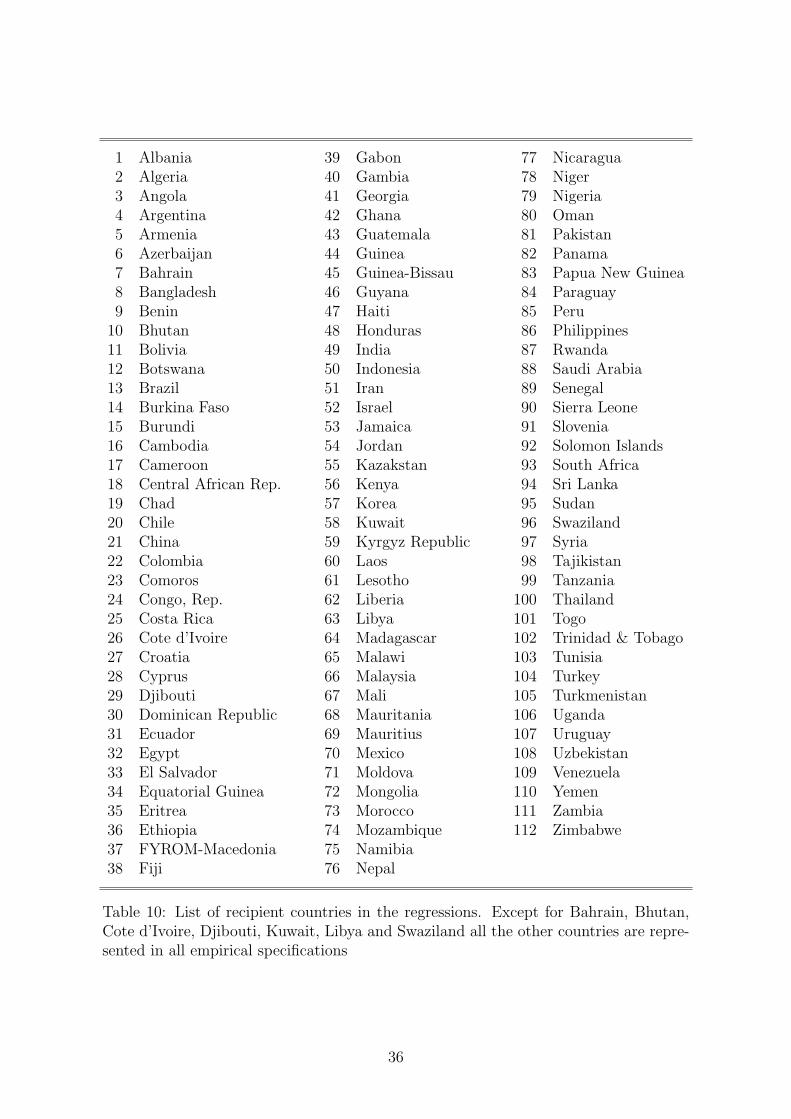
1 Albania 39 Gabon 77 Nicaragua2 Algeria 40 Gambia 78 Niger3 Angola 41 Georgia 79 Nigeria4 Argentina 42 Ghana 80 Oman5 Armenia 43 Guatemala 81 Pakistan6 Azerbaijan 44 Guinea 82 Panama7 Bahrain 45 Guinea-Bissau 83 Papua New Guinea8 Bangladesh 46 Guyana 84 Paraguay9 Benin 47 Haiti 85 Peru
10 Bhutan 48 Honduras 86 Philippines11 Bolivia 49 India 87 Rwanda12 Botswana 50 Indonesia 88 Saudi Arabia13 Brazil 51 Iran 89 Senegal14 Burkina Faso 52 Israel 90 Sierra Leone15 Burundi 53 Jamaica 91 Slovenia16 Cambodia 54 Jordan 92 Solomon Islands17 Cameroon 55 Kazakstan 93 South Africa18 Central African Rep. 56 Kenya 94 Sri Lanka19 Chad 57 Korea 95 Sudan20 Chile 58 Kuwait 96 Swaziland21 China 59 Kyrgyz Republic 97 Syria22 Colombia 60 Laos 98 Tajikistan23 Comoros 61 Lesotho 99 Tanzania24 Congo, Rep. 62 Liberia 100 Thailand25 Costa Rica 63 Libya 101 Togo26 Cote d’Ivoire 64 Madagascar 102 Trinidad & Tobago27 Croatia 65 Malawi 103 Tunisia28 Cyprus 66 Malaysia 104 Turkey29 Djibouti 67 Mali 105 Turkmenistan30 Dominican Republic 68 Mauritania 106 Uganda31 Ecuador 69 Mauritius 107 Uruguay32 Egypt 70 Mexico 108 Uzbekistan33 El Salvador 71 Moldova 109 Venezuela34 Equatorial Guinea 72 Mongolia 110 Yemen35 Eritrea 73 Morocco 111 Zambia36 Ethiopia 74 Mozambique 112 Zimbabwe37 FYROM-Macedonia 75 Namibia38 Fiji 76 Nepal
Table 10: List of recipient countries in the regressions. Except for Bahrain, Bhutan,Cote d’Ivoire, Djibouti, Kuwait, Libya and Swaziland all the other countries are repre-sented in all empirical specifications
36