nationstar mortgage holdings pitch - trinitysmf.com · nationstar mortgage holdings pitch....
TRANSCRIPT

Nationstar Mortgage Holdings Pitch


Investment ThesisT R I N I T Y S M F

T R I N I T Y S M F
Summary of Investment Thesis
•
•
•
•
•
•
•
•
•
•

Company OverviewT R I N I T Y S M F
T R I N I T Y S M F
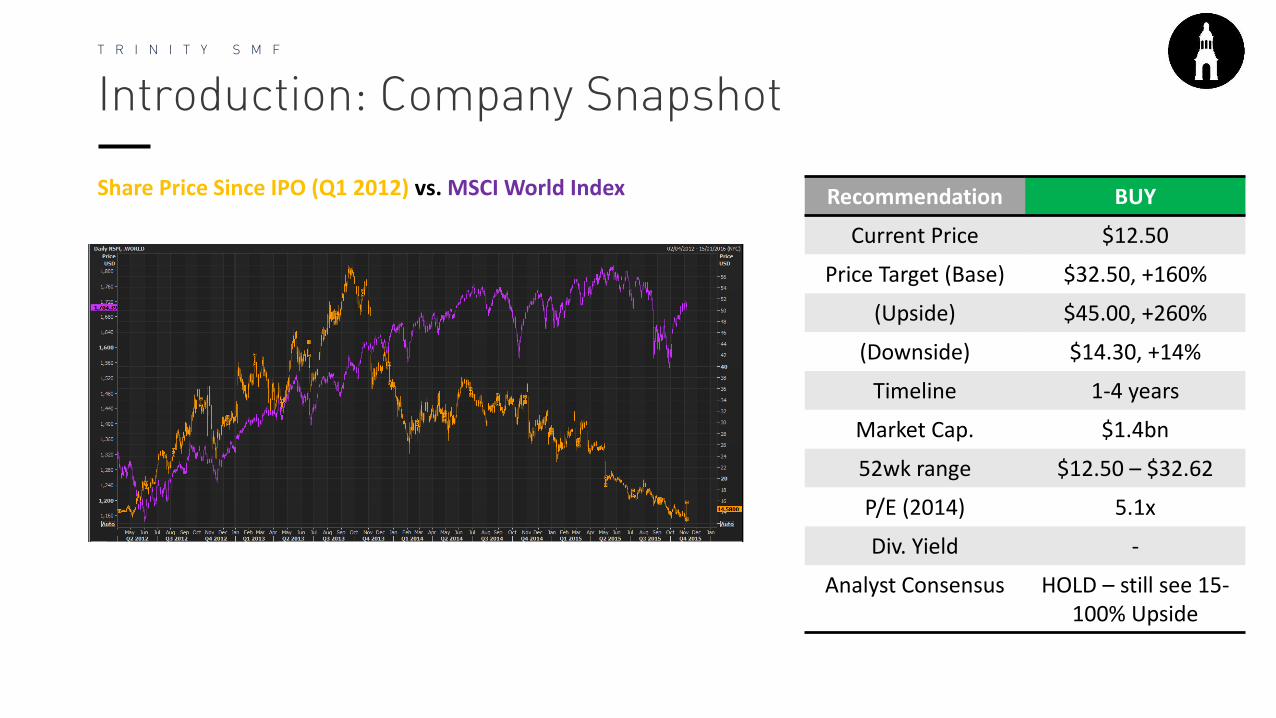
Introduction: Company Snapshot
Share Price Since IPO (Q1 2012) vs. MSCI World Index Recommendation BUY
Current Price $12.50
Price Target (Base) $32.50, +160%
(Upside) $45.00, +260%
(Downside) $14.30, +14%
Timeline 1-4 years
Market Cap. $1.4bn
52wk range $12.50 – $32.62
P/E (2014) 5.1x
Div. Yield -
Analyst Consensus HOLD – still see 15-100% Upside

T R I N I T Y S M F
Business Overview
•
•
•

T R I N I T Y S M F
Servicing, 40%
Origination, 35%
Xome, 25%
EBIT BY SEGMENT
•
•
•
•
•
•

T R I N I T Y S M F
Management
•
•
•
•
•
Variable, 92%
Fixed, 8%
CEO TOTAL DIRECT COMPENSATION MIX
T R I N I T Y S M F
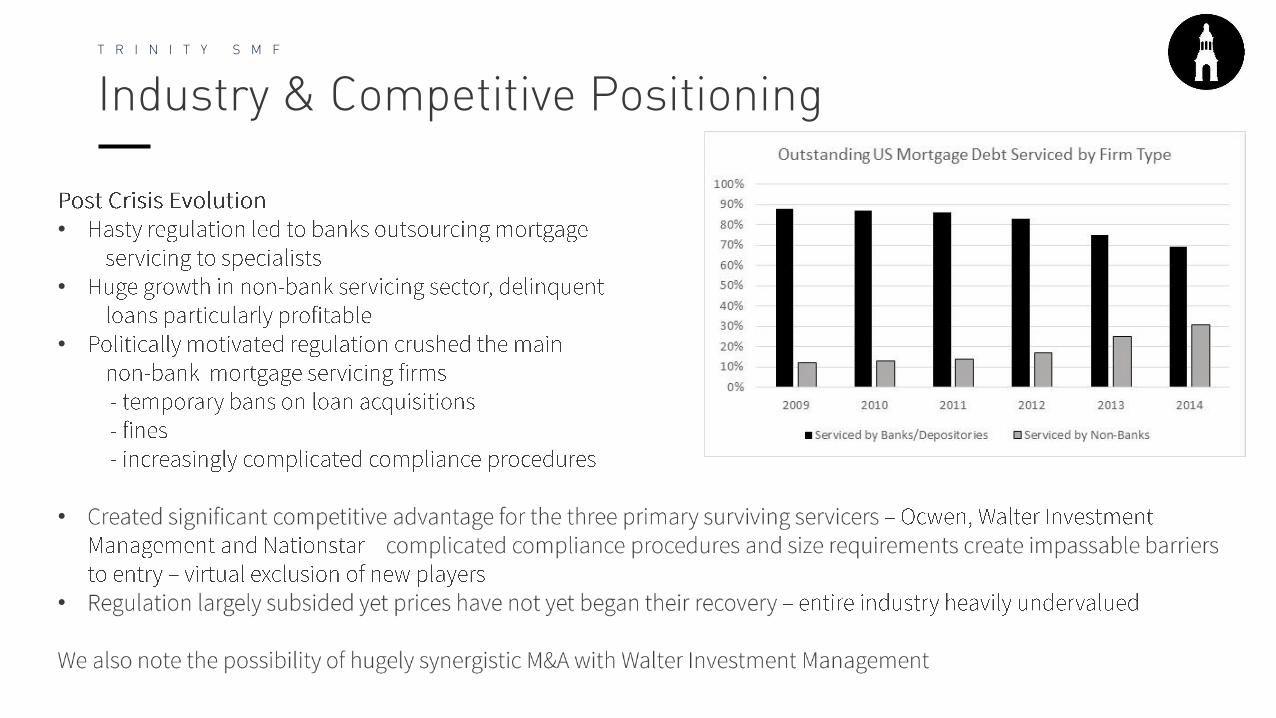
Industry & Competitive Positioning
•
•
•
•
•

T R I N I T Y S M F
•
•
•
•
•
•
•
•
•
•

Financial OverviewT R I N I T Y S M F

T R I N I T Y S M F
Financials
•
•
•
•
Summary (2014)
Market Cap $1.4bn Total Revenue $1.97bn
EBITDA $518mn EBITDA Margin 37%
ROE 20% P/B 0.7x
Total Debt $6.2bn P/TB 0.8x
Total Debt/Equity 3.7x P/E 5.1x

T R I N I T Y S M F
Income Statement
2014A 2015E 2016E 2017E 2018E 2019E
Revenue $2.0bn $2.0bn $2.2bn $2.5bn $2.8bn $3.1bn
Revenue Growth -5.5% 0.7% 11.6% 16.2% 11.9% 8.5%
Operating Income $478m $214m $558m $661m $755m $807m
EBITDA $518m $252m $600m $710m $810m $866m
Net Income $221m $24m $248m $313m $381m $440m
EPS $2.46 $0.23 $2.30 $2.91 $3.55 $4.09
EPS Growth 2.5% -90.7% 900% 27% 22% 15%
•
•
•
•
•
•

T R I N I T Y S M F
Balance Sheet
2014A 2015E 2016E 2017E 2018E 2019E
Cash and Equivalents $299m $630m $662m $695m $730m $766m
Restricted Cash $286m $489 $514m $539m $566m $594m
Total Assets $11.0bn $17.4bn $18.5bn $19.7bn $21.0bn $22.4bn
Total Debt $6.7bn $6.8bn $7.0bn $7.2bn $6.9bn $6.7bn
Total Liabilities $9.9bn $15.8bn $16.7bn $17.6bn $18.6bn $19.6bn
Shareholders Equity $1.2bn $1.8bn $2.0bn $2.3bn $2.7bn $3.1bn
Book Value Per Share $13.54 $17.02 $18.66 $21.57 $25.12 $29.20
Tangible Book Value Per Share
$12.72 $15.88 $17.50 $20.33 $23.79 $27.79
•
•
•
•

T R I N I T Y S M F
Debt Analysis
•
•
•
•
•

ValuationT R I N I T Y S M F

T R I N I T Y S M F
Valuation
Company Market Cap (m) 1 Year Performance LTM P/E 2016E P/E LTM P/TBV 2016E P/TBV
Nationstar Mortgage Holdings 1,462 -52% 9.2x 5.6x 0.8x 0.7x
Ocwen Financial Corp 813 -72% - 7.4x 0.9x 0.8x
Walter Investment Management 383 -40% - 4.1x 0.5x 0.6x
PennyMac Financial Services 1,140 -28% 13.0x 6.6x 1.7x 1.8x
Invesco Mortgage Capital 1,530 -21% - - 0.9x 1.0x
New Residential Investment Corp 2,814 -4% 11.0x 11.5x 1.2x 1.3x
Lending Tree 1,373 147% 68.0x 57.8x 15.2x 12.1x
Mean 25.3x 15.5x 3.4x 2.6x
Median 12.0x 7.0x 1.1x 1.0x
•
•
•

T R I N I T Y S M F
Implied Multiples Valuation
LTM Selected Range 11.0x - 13.0x LTM Selected Range 0.9x - 1.7x
2016E Selected Range 6.6x - 11.5x 2016E Selected Range 1.0 - 1.8x
Valuation Range Implied by P/E Valuation Range Implied by P/TBV
EPS 2014 2.455 11.0x - 13.0x 27.01 - 31.92 109% - 147%
EPS 2016E 2.30 6.6x - 11.5x 16.20 - 28.24 26% - 119%
TBV 2015 15.88 0.9x - 1.7x 14.30 - 27.00 11% - 109%
TBV 2016E 17.50 1.0x - 1.8x 17.50 - 31.49 36% - 144%
Implied Share Price Implied Upside (Downside)Nationstar Multiple Range
LTM Selected Range 11.0x - 13.0x LTM Selected Range 0.9x - 1.7x
2016E Selected Range 6.6x - 11.5x 2016E Selected Range 1.0 - 1.8x
Valuation Range Implied by P/E Valuation Range Implied by P/TBV

T R I N I T Y S M F
Sum-of-the-parts Analysis
Valuation Metric Statistic
Low High Low High
Servicing 2014 Net Income 170,641 18.5x 20.0x 3,156,859 3,412,820
Origination 2014 Net Income 147,275 16.5x 18.0x 2,430,038 2,650,950
Xome 2014 EBITDA 136,665 15.6x 21.2x 2,131,974 2,897,298
Total Firm Value 7,718,870 8,961,068
Less: Net Debt 5,600,000 5,600,000
Total Equity Value 2,118,870 3,361,068
Fully Diluted Shares Outstanding 103,400 103,400
SOTP Equity Value 20.49 32.51
Current Share Price 12.50 12.50
Premium (Discount) to Market 64% 160%
Prevailing Subsector MultipleBusiness Segment Enterprise Value
•
•

T R I N I T Y S M F
Extrapolative Valuation for Xome
Extrapolative calculation for value of Xome:
1. Xome CEO compensation package – awarded stock appreciation rights accounting for 8.5% of the fair
market value appreciation of Xome as of date of grant
2. As per 2014 filings the value of these stock appreciation rights matches the spread between the base
price and their fair market value, implying that 850,000 units of these represents 8.5% of the total
outstanding units
3. We know from the filings that the base price per unit is $140.25, implying a beginning fair market value
of $1,402.5m
4. CEO Comp from SAR’s = $33.8m through 850,000 units (evidently of 10,000,000 per 8.5%)
5. If 8.5% of appreciation = $33.8m, full appreciation = $398m
6. $1402.5m + $398m = $1800.5m implied value for Xome segment alone, completely ignoring the new
online and mobile platform
7. Again, this is likely to be recognised by the market through the sale of a minority stake in the Xome
business segment.
TL;DR – Xome segment could be worth 130% of the current valuation of the entire business, ignoring the
new online and mobile platform

T R I N I T Y S M F
Extrapolative Valuation for Xome… Continued
So now to value the mobile and web platform… Note we HAVE NOT INCLUDED DIRECT REVENUES FROM
THIS PLATFORM IN OUR VALUATION OR THESIS. IT IS ENTIRELY FREE UPSIDE OPTIONALITY.
1. 6,000,000 homes sold annually in the U.S. (LTM figure)2. Average home price as $222,000 (same) 3. Implied total market value on home sales of $1.332tn per annum 4. According to Zillow (an app to some extent similar to Xome) the average broker fee for these transactions
stands at 6%5. This creates a total addressable market for the Xome online platform of $80bn6. If Xome were to claim even 1% of this market (conservative given growth), yielding revenues of $800m,
then after applying a 20% net income margin and a 15x P/E multiple, the Xome online and mobile platform alone could be worth $2.4bn, or $22 per Nationstar share

RiskT R I N I T Y S M F

T R I N I T Y S M F
Qualitative Risk
•
Key Risks
Fortress 62% holding –could exert undue control or drive share price down by rapidly liquidating position
Have held company for 9 years, did not sell out at $60 per share – are highly unlikely to sell out now. Have expressed bullish commentary on the mortgage space at recent conferences and are seeking further investments in the space
Rising rates lead to contraction in origination volumes
Historically the effect here is very mild, particularly with gradual and moderate rate hikes. Nationstar also exhibits some degree of natural hedge to the downside of rate rises (servicing profits even while origination suffers). Note that due to recent growth in interest-rate sensitive servicing contracts has caused some pain in the servicing segment this year, however the positive effect of rising rates on these loans will more than offset any degree of origination slowdown
Increased regulation harming existing business and limiting growth prospects
We feel confident calling a bottom in regulation as noted throughout this report. Note also that Ben Lawsky, who led the politically motivated investigation into mortgage servicers has joined the private sector

T R I N I T Y S M F
Quantitative Risk
Volatility (standard deviation of returns): 4.48
Correlation with current holdings:American Express: 0.18MetLife: 0.05Deutsche Boerse: –0.31
Qualitative Risk Continued
•

T R I N I T Y S M F
Summary of Investment Thesis
•
•
•
•
•
•
•
•
•
•
