national transfer accounts: introduction to concepts andrew mason university of hawaii and east-west...
TRANSCRIPT

National Transfer Accounts:Introduction to Concepts
Andrew Mason
University of Hawaii
and East-West Center

Acknowledgments
• Research for this paper was funded by parallel grants from the National Institutes of Health to Ronald Lee and Andrew Mason, NIA R37 AG025247 and R01 AG025488; grants from MEXT.ACADEMIC FRONTIER to Nihon University Population Research Institutes, from the United Nations Population Fund (to NUPRI and EWC), from the MacArthur Foundation to EWC; and from IDRC to ECLAC, AERC, and EWC.
• The material presented here draws heavily on collaborative work with Ronald Lee and other researchers involved in the National Transfer Account project.

NTA is important because of thePopulation Age Transition
• Global phenomenon• In the middle of the transition
– Earlier: Share of children was increasing world-wide– Currently: Working-age population is increasing in
most countries– Future: Growth in elderly population will dominate
• Changes are unprecedented• Inevitable consequence of
– Continuing gains in life expectancy– Low and very low fertility most important

Benefits of Population Aging
• Living longer and healthier lives is a great social achievement.
• By bearing fewer children, parents have been able to invest more in each child and raise standards of living for their children and for themselves.
• Greater life expectancy and changes in age structure may be leading to greater wealth, capital deepening, and higher wages.
• Smaller populations, possible only with low fertility and older populations, yield important environmental benefits.
• But . . .

Population aging presents some major challenges
• Decline in share of working age population will lead to slower economic growth
• Sustainability of transfer systems– Public sector: Number of taxpayers will decline relative to
number of beneficiaries– Private sector: Number of working-age adults will decline
relative to dependent children and elderly• Reversal in transfer direction
– In past transfers have always been downward – from adults to their descendants
– Growth in public transfer systems and population aging are leading to increase in upward transfers
– Straining the social contract between generations? Leading to generational equity?

Importance of National Transfer Accounts
• Goal: Develop policies that respond effectively to the population age transition
• Requirement: a comprehensive and deep understanding of the generational economy:– Social and economic institutions– Economic flows across age groups– System of public and private obligations

Organization
• National Transfer Accounts: Key Concepts– Economic lifecycle – Age reallocation systems
• Two illustrative applications– Economic support ratio and demographic
dividends– Old age support system

NTA Concepts:Economic Lifecycle

Economic Lifecycle
• The economic lifecycle refers to the variation over our lifetime of our needs and our abilities
• Expresses itself in age variation in what we consume and what we produce
• In all contemporary societies we have extended periods at the beginning and the end of our lives, when we are consuming far more than we are producing.
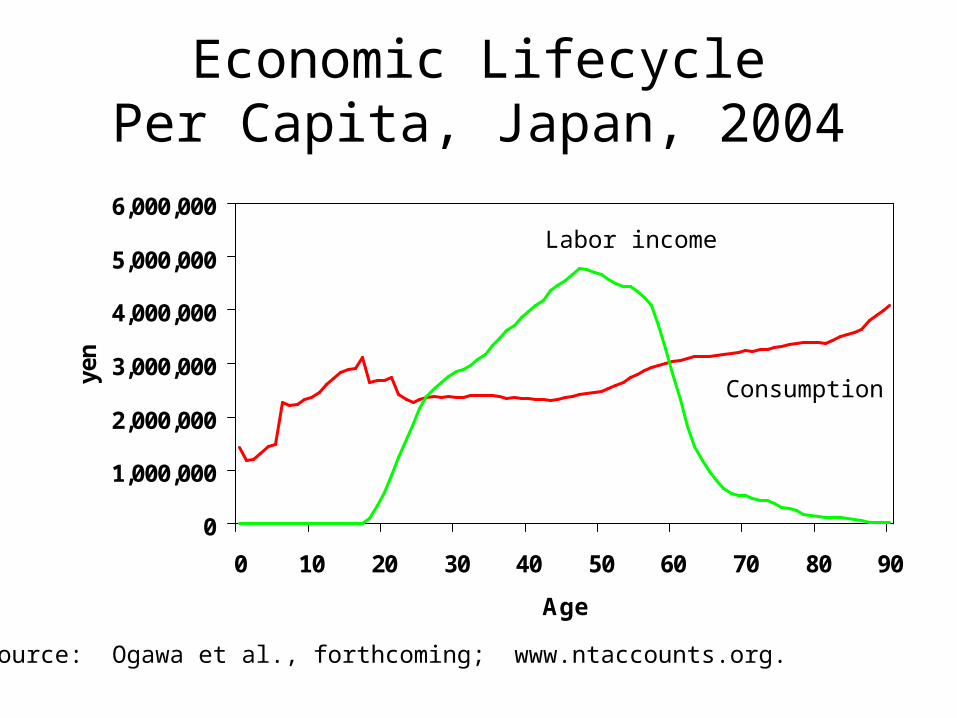
Economic LifecyclePer Capita, Japan, 2004
0
1,000,000
2,000,000
3,000,000
4,000,000
5,000,000
6,000,000
0 10 20 30 40 50 60 70 80 90
Age
yen
Labor income
Consumption
Source: Ogawa et al., forthcoming; www.ntaccounts.org.

USA, 2003
Austria, 2000
Sweden, 2003
Germany, 2003
0
0.3
0.6
0.9
1.2
1.5
0 10 20 30 40 50 60 70 80 90+ 0
0.3
0.6
0.9
1.2
1.5
0 10 20 30 40 50 60 70 80 90+ 0
0.3
0.6
0.9
1.2
1.5
0 10 20 30 40 50 60 70 80 90+ 0
0.3
0.6
0.9
1.2
1.5
0 10 20 30 40 50 60 70 80 90+
Japan, 2004
Finland, 2004
Spain, 2000
Slovenia, 2004
0
0.3
0.6
0.9
1.2
1.5
0 10 20 30 40 50 60 70 80 90+ 0
0.3
0.6
0.9
1.2
1.5
0 10 20 30 40 50 60 70 80 90+ 0
0.3
0.6
0.9
1.2
1.5
0 10 20 30 40 50 60 70 80 90+ 0
0.3
0.6
0.9
1.2
1.5
0 10 20 30 40 50 60 70 80 90+
Taiwan, 1998
Korea, 2000
Hungary, 2005
Mexico, 2004
0
0.3
0.6
0.9
1.2
1.5
0 10 20 30 40 50 60 70 80 90+ 0
0.3
0.6
0.9
1.2
1.5
0 10 20 30 40 50 60 70 80 90+ 0
0.3
0.6
0.9
1.2
1.5
0 10 20 30 40 50 60 70 80 90+ 0
0.3
0.6
0.9
1.2
1.5
0 10 20 30 40 50 60 70 80 90+
Chile, 1997
Costa Rica, 2004
Uruguay, 1994
Brazil, 1996
0
0.3
0.6
0.9
1.2
1.5
0 10 20 30 40 50 60 70 80 90+ 0
0.3
0.6
0.9
1.2
1.5
0 10 20 30 40 50 60 70 80 90+ 0
0.3
0.6
0.9
1.2
1.5
0 10 20 30 40 50 60 70 80 90+ 0
0.3
0.6
0.9
1.2
1.5
0 10 20 30 40 50 60 70 80 90+
Thailand, 2004
Indonesia, 2005
China, 2002
Philippines, 1999
0
0.3
0.6
0.9
1.2
1.5
0 10 20 30 40 50 60 70 80 90+ 0
0.3
0.6
0.9
1.2
1.5
0 10 20 30 40 50 60 70 80 90+ 0
0.3
0.6
0.9
1.2
1.5
0 10 20 30 40 50 60 70 80 90+ 0
0.3
0.6
0.9
1.2
1.5
0 10 20 30 40 50 60 70 80 90+
India, 2004
Nigeria, 2004
Kenya, 1994
0
0.3
0.6
0.9
1.2
1.5
0 10 20 30 40 50 60 70 80 90+ 0
0.3
0.6
0.9
1.2
1.5
0 10 20 30 40 50 60 70 80 90+ 0
0.3
0.6
0.9
1.2
1.5
0 10 20 30 40 50 60 70 80 90+
0
1
2
1 11 21 31 41 51 61 71 81 91
YL
C
CF
CG
Source: Tung forthcoming.

Economic Lifecycle: Labor Income
• Labor income– Wages & salaries– Fringe benefits– Self-employment income– Pre-tax
• Profiles based on household surveys of wages and income
• Adjusted to match National Income and Product Accounts
• Reflects age variation in productivity, hours worked, unemployment, and labor force participation.
0
1000000
2000000
3000000
4000000
5000000
6000000
0 10 20 30 40 50 60 70 80 90
Age
yen

Economic Lifecycle: Consumption
• Consumption– Public and private– Education, health, and other
• Profiles based on surveys and administrative records
• Adjusted to match National Income and Product Accounts
0
500000
1000000
1500000
2000000
2500000
3000000
3500000
4000000
4500000
0 10 20 30 40 50 60 70 80 90
Age
yen
• All estimates presented here are drawn from National Transfer Accounts
• Being constructed by research teams in 30 countries on six continents.
• Details available at www.ntaccounts.org.

Important features of the economic lifecycle
• In all contemporary societies there are large per capita lifecycle deficits at both the young and old ages.
• The per capita child deficit is rising as fertility declines, more is invested in human capital, and entry into the labor force is delayed.
• The per capita old age deficit is rising as age at retirement has declined and spending on health care has increased.
• The aggregate economic lifecycle is dominated by changes in age structure.
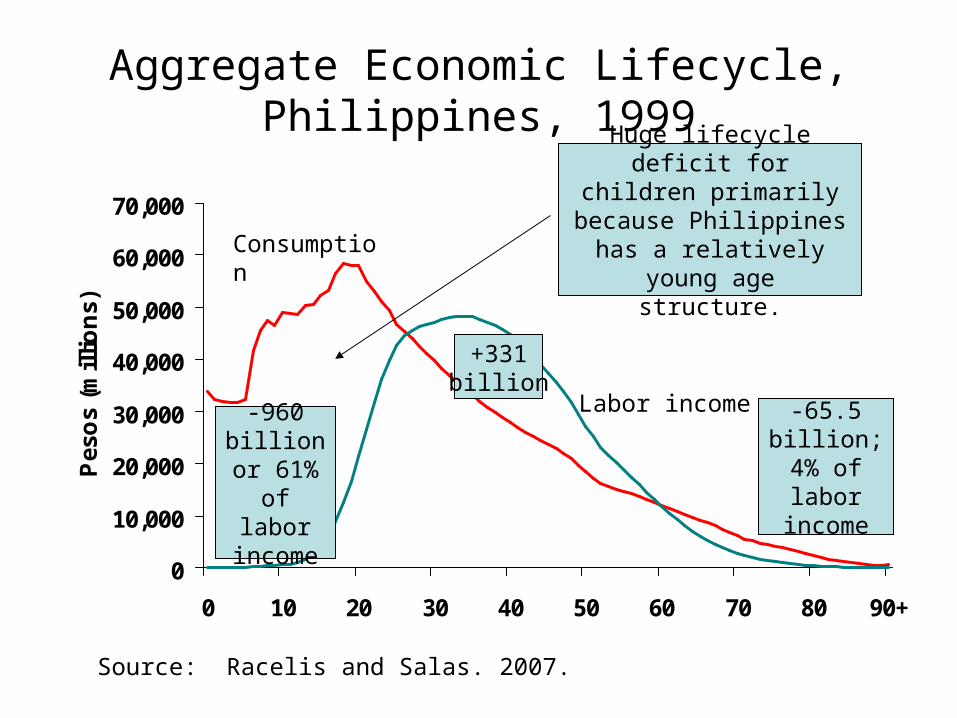
Aggregate Economic Lifecycle, Philippines, 1999
0
10,000
20,000
30,000
40,000
50,000
60,000
70,000
0 10 20 30 40 50 60 70 80 90+
Pes
os
(mil
lio
ns)
Source: Racelis and Salas. 2007.
-960 billion or 61% of labor
income
-65.5 billion; 4%
of labor income
+331billion
Huge lifecycle deficit for children primarily because Philippines has a relatively
young age structure.Consumption
Labor income
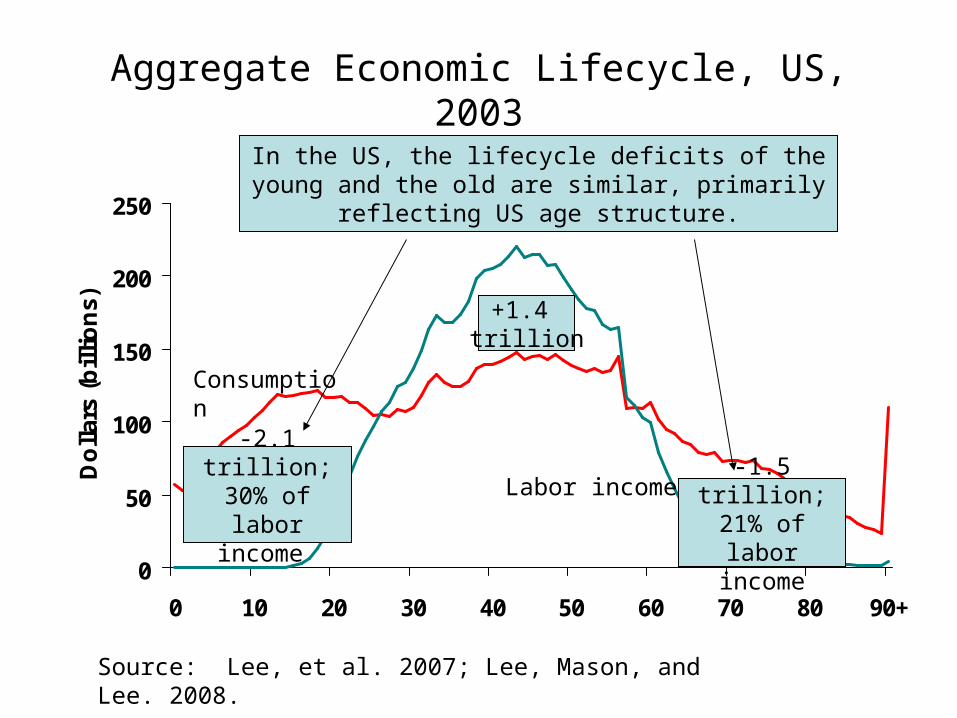
Aggregate Economic Lifecycle, US, 2003
0
50
100
150
200
250
0 10 20 30 40 50 60 70 80 90+
Do
llar
s (b
illi
on
s)
Source: Lee, et al. 2007; Lee, Mason, and Lee. 2008.
-2.1 trillion; 30% of labor
income
+1.4 trillion
-1.5 trillion; 21% of labor
income
In the US, the lifecycle deficits of the young and the old are similar, primarily reflecting US age structure.
Consumption
Labor income

NTA Concepts:Age Reallocation System
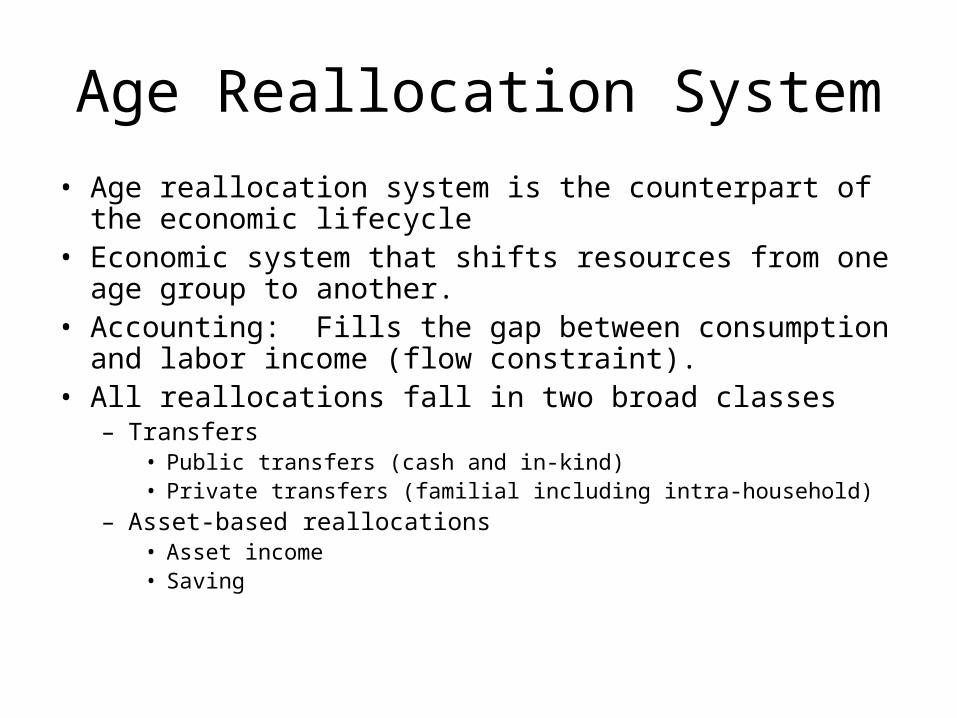
Age Reallocation System
• Age reallocation system is the counterpart of the economic lifecycle
• Economic system that shifts resources from one age group to another.
• Accounting: Fills the gap between consumption and labor income (flow constraint).
• All reallocations fall in two broad classes – Transfers
• Public transfers (cash and in-kind)• Private transfers (familial including intra-household)
– Asset-based reallocations• Asset income• Saving

The NTA Flow Account Identity
• Inflows– Labor Income– Asset Income– Transfer Inflows
• Outflows– Consumption– Saving– Transfer Outflows
Inflows Outflows
( ) ( ) ( ) ( ) ( ) ( )l aY x Y x x C x S x x
Lifecycle Deficit Net Transfers Asset-based Reallocations
Age Reallocations
( ) ( ) ( ) ( ) ( ) ( )l aC x Y x x x Y x S x
where x is age.

Components of Lifecycle Deficit, US 2003
-30000
-20000
-10000
0
10000
20000
30000
40000
50000
60000
70000
0 3 6 9 12 15 18 21 24 27 30 33 36 39 42 45 48 51 54 57 60 63 66 69 72 75 78 81 84 87 90
Age
US
$
Public Asset-Based Reallocations
Private Asset-Based Reallocations
Public Transfers
Private Transfers
Funding the Child Deficit
Net public transfers – public schools, value of public
goods allocated to children.
Net private transfers – intra-household transfers to children; largest in all
countries studied.
Asset-based flows – none for children, small for young
adults (mostly credit).

Components of Lifecycle Deficit, US 2003
-30000
-20000
-10000
0
10000
20000
30000
40000
50000
60000
70000
0 3 6 9 12 15 18 21 24 27 30 33 36 39 42 45 48 51 54 57 60 63 66 69 72 75 78 81 84 87 90
Age
US
$
Public Asset-Based Reallocations
Private Asset-Based Reallocations
Public Transfers
Private Transfers
Funding the Old-age Deficit
Asset-based reallocations – asset income and dis-saving
from owner-occupied housing, private pension
funds, personal saving, etc.
Net public transfers – social programs (public pensions, health care, etc.), benefits
from general programs, less taxes paid.
Net private transfers – inter- and intra-household
transfers.

Application: Economic Support Ratio and Demographic
Dividends

A Simple Economic Model
( , )(1 )
C Y H K Ls
N L N
-- consumption per capita
-- saving rate
income per worker depends on ( , ) --
human capital (H) and physical capital (K)
-- workers per capita (support ratio)
C
Ns
Y H K
L
L
N

A Simple Economic Model: In Growth Terms
• Given the saving rate and the productivity the growth rate of consumption per capita has a one-to-one relationship to the growth rate of the support ratio.
( , )(1 )
[] is the rate of growth.
C Y H K Lgr gr s gr gr
N L N
gr

The Economic Support Ratio
Definition: Effective workers/Effective consumers– Effective workers is weighted sum of population using
labor income age profile to allow for variation in participation, hours worked, unemployment, and productivity.
– Effective consumers is weighted to allow for age variation in needs.
– Constructed using NTA estimates of consumption and labor income by age
0
0
ˆ,Effective WorkersSupport Ratio(t) =
Effective Consumers ˆ,
lPop x t y xt
t Pop x t c x

Economic Support Ratio, Nigeria
0.500
0.550
0.600
0.650
0.700
0.750
0.800
0.850
0.900
1980 2000 2020 2040 2060 2080 2100 2120 2140 2160 2180
Su
pp
ort
Rat
io
Support ratio increases by 35% Support ratio declines by 15%
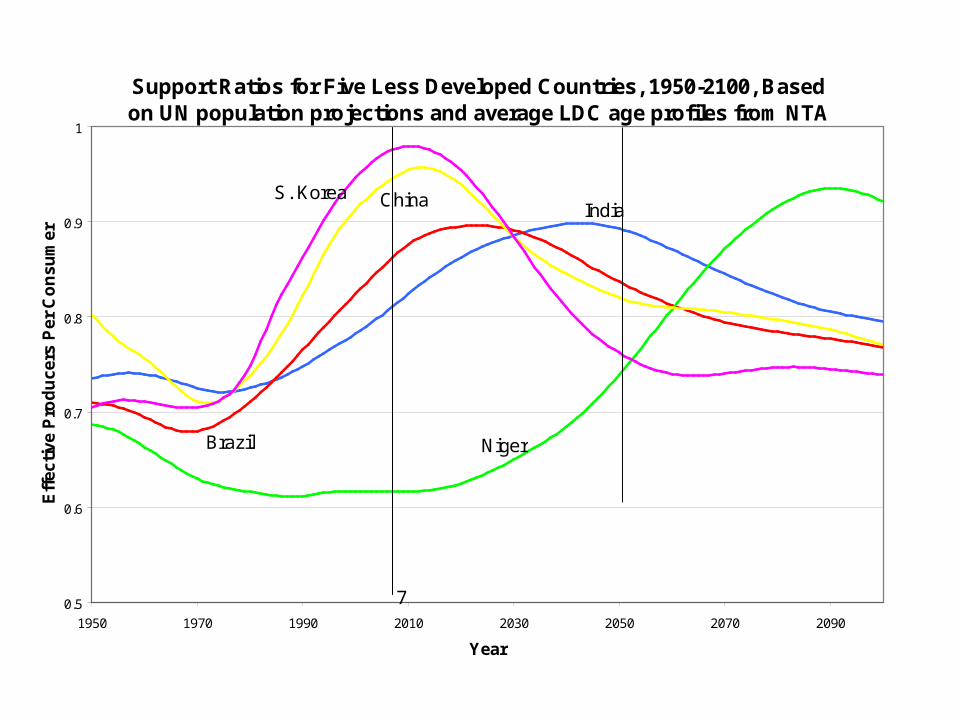
Support Ratios for Five Less Developed Countries, 1950-2100, Based on UN population projections and average LDC age profiles from NTA
India
Brazil Niger
ChinaS. Korea
0.5
0.6
0.7
0.8
0.9
1
1950 1970 1990 2010 2030 2050 2070 2090
Year
Eff
ecti
ve
Pro
du
cers
Per
Co
nsu
mer
2007

Summary of Support Ratio
• Many African countries have younger age structures than found elsewhere; hence, the support ratio starts at a very low level. Change over the age transition could be very large – around 40% or more.
• Many Asian and Latin American countries are in the final stages of their age transition.
• In Japan and Western countries economic support ratios are in decline. As a consequence, economic growth will be slower in the absence of compensating changes in the saving rate or productivity.
• Important issue is whether there are likely to be compensating changes and how will they be influenced by policy.

Application: Funding Old Age

Issues
• Do the elderly produce more of their consumption in some countries?
• How do the elderly fund their lifecycle deficit– Public transfers– Private transfers– Asset-based flows
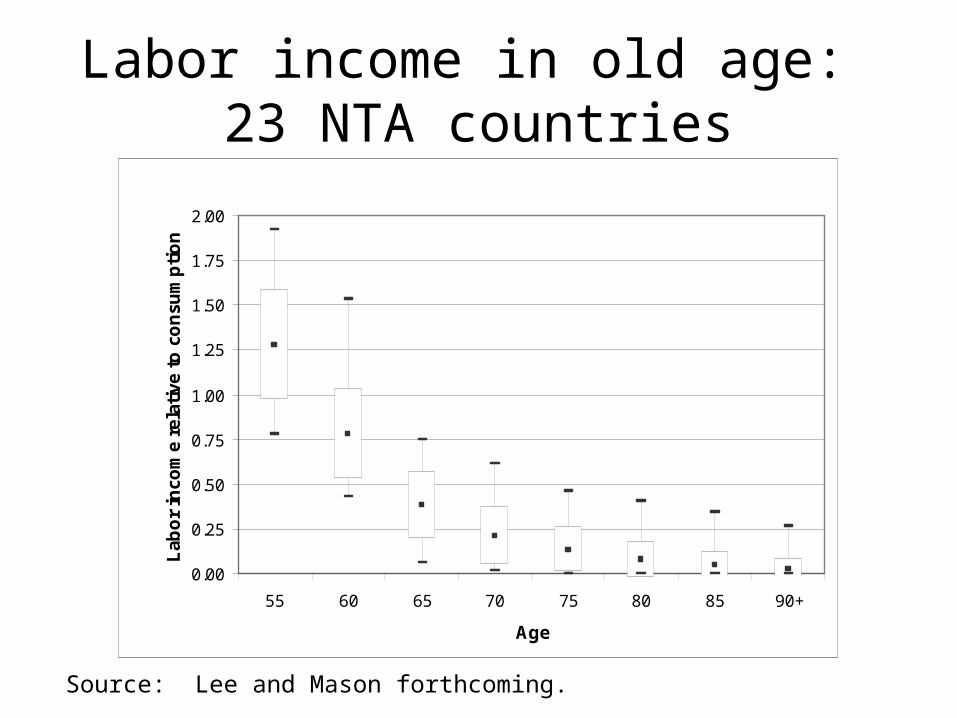
Labor income in old age: 23 NTA countries
0.00
0.25
0.50
0.75
1.00
1.25
1.50
1.75
2.00
55 60 65 70 75 80 85 90+
Age
Lab
or
inco
me
rela
tive
to
co
nsu
mp
tio
n
Source: Lee and Mason forthcoming.

Support Systems for the Elderly
• Support systems vary widely in ways not closely connected to the level of development– Public transfers important in Latin America and
Europe– Private, familial transfers are important in Asia (Japan
excepted). – Reliance on assets varies widely.
• Importance: Excessive reliance on transfers in some countries undermine an important incentive for capital accumulation with potentially adverse implications for economic growth.

Representing the Old-age Support System: Triangle Graph
00000000000000000000000000000000000000000000000000000000000000000000000000000000000000000000000000000000000000000000000000000000
1/3
1/3
1/3
2/3
2/3
2/3
Assets
PublicTransfers
FamilyTransfers
Along a grid line, share of one component is constant; other two vary. Ex: Public transfers constant at 1/3.
Value at corner of triangle means that elderly rely
exclusively on that source – family transfers in this
example.
Each component funds 1/3 of the lifecycle deficit
Outside the triangle: negative
values. Here elderly have negative net
transfers.

Uruguay
Germany
USThailand
Taiwan
S. Korea
Philippines
Mexico
Finland
JapanCosta Rica
Austria
1/3
1/3
1/3
2/3
2/3
2/3
Assets
PublicTransfers
FamilyTransfers
Funding the Lifecycle Deficit, 65 and older, NTA countries, recent year
Net public transfers: Range from zero in Thailand and Philippines to over 2/3 in Germany, Finland, and Austria.
Net private transfers: Positive only for 3 Asian economies; zero in Japan; negative elsewhere.
Asset-based flows: Exceed 2/3 in four countries including US; Under 1/3 in Taiwan, Germany, Finland, and Austria.
For US 65+, RA=70.5%; TG=38.3%;
TF=-8.8%.

AT
ES
FI
SE
US
1/3
1/3
1/3
2/3
2/3
2/3
Assets
PublicTransfers
FamilyTransfers
TH
CLCN
CR SI
JPKR
TW
PH
MX
UY
♦ Europe & US ▲ Asia ■ Latin America
Age 75-84

AT
ES
FI
SE
US
PH
1/3
1/3
1/3
2/3
2/3
2/3
Assets
PublicTransfers
FamilyTransfers
CN
TH
TW
KR
SI
UY
JP
CL
CR
MX
♦ Europe & US ▲ Asia ■ Latin America
Age 85+