n ational t ransfer a ccounts population age structure, demographic dividends, and economic growth...
TRANSCRIPT

NNational ational TTransfer ransfer AAccountsccounts
Population Age Population Age Structure, Demographic Structure, Demographic Dividends, and Dividends, and Economic GrowthEconomic Growth
Andrew MasonAndrew Mason
University of Hawaii at ManoaUniversity of Hawaii at Manoa
and the East-West Centerand the East-West Center
National Transfer Accounts
IssuesIssues
►Why does age structure influence Why does age structure influence economic growth?economic growth?
►How important are the effects?How important are the effects?►Are the gains from age-structure Are the gains from age-structure
changes sustainable? changes sustainable? ►What policies should be pursued?What policies should be pursued?
National Transfer Accounts
OutlineOutline
I.I. Simple Growth Model with Age Simple Growth Model with Age StructureStructure
II.II. First Demographic Dividend and the First Demographic Dividend and the Economic Support RatioEconomic Support Ratio
III.III. Second Demographic DividendSecond Demographic Dividend
IV.IV. Simulation Model and ResultsSimulation Model and Results
National Transfer Accounts
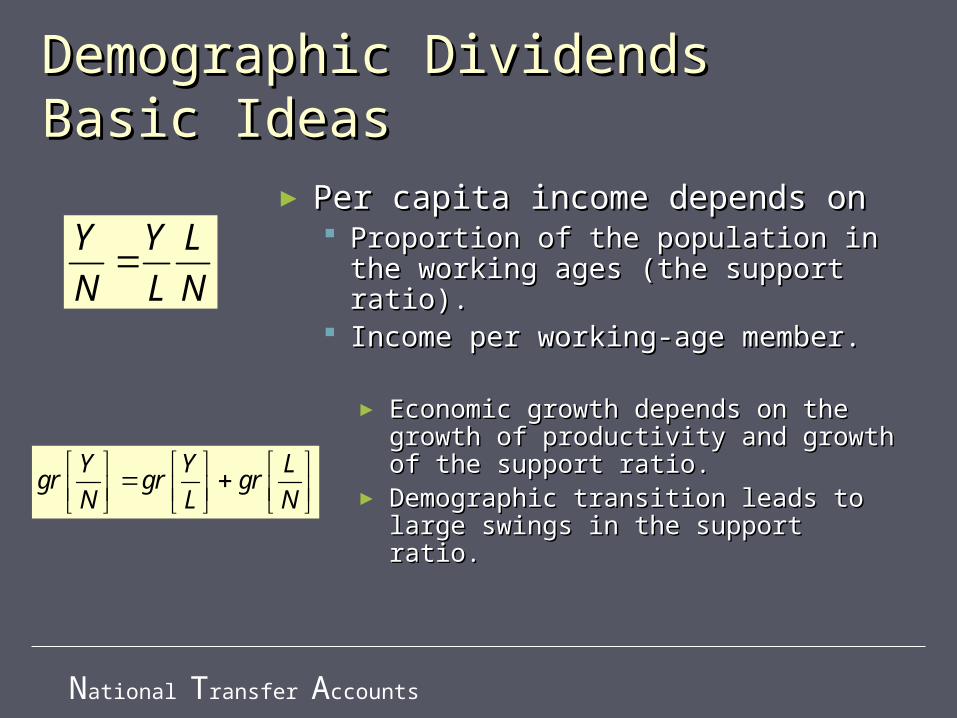
Demographic DividendsDemographic DividendsBasic IdeasBasic Ideas
► Per capita income depends on Per capita income depends on Proportion of the population in the Proportion of the population in the
working ages (the support ratio).working ages (the support ratio). Income per working-age member.Income per working-age member.
Y Y L
N L N
Y Y Lgr gr gr
N L N
► Economic growth depends on Economic growth depends on the growth of productivity and the growth of productivity and growth of the support ratio.growth of the support ratio.
► Demographic transition leads to Demographic transition leads to large swings in the support ratio.large swings in the support ratio.
National Transfer Accounts
Previous workPrevious work
►Statistical analysis of aggregate dataStatistical analysis of aggregate data Bloom, Canning, and others; Kelley and Bloom, Canning, and others; Kelley and
SchmidtSchmidt Estimate growth model using Barro growth Estimate growth model using Barro growth
framework (conditional convergence).framework (conditional convergence).►Simulation analysis Simulation analysis
Lee, MasonLee, Mason Detailed computer model of the economy Detailed computer model of the economy
with parameters based on NTA and other with parameters based on NTA and other empirical research.empirical research.
National Transfer Accounts
Features of this researchFeatures of this research
►Emphasis on consumption rather than Emphasis on consumption rather than income as the outcome variableincome as the outcome variable
►New theoretical approach to modeling New theoretical approach to modeling consumption and capital accumulationconsumption and capital accumulation
►Exploit new estimates of age profiles Exploit new estimates of age profiles of consumption, labor income, and of consumption, labor income, and transfers (www.ntaccounts.org). transfers (www.ntaccounts.org).
National Transfer Accounts
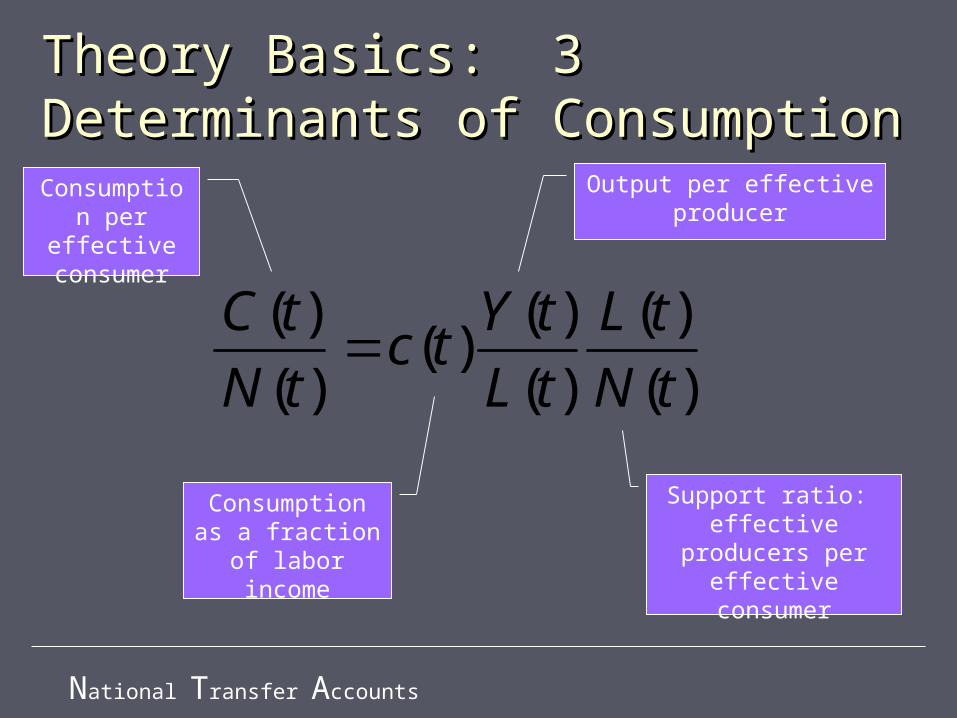
Theory Basics: 3 Determinants Theory Basics: 3 Determinants of Consumptionof Consumption
( ) ( ) ( )( )
( ) ( ) ( )
C t Y t L tc t
N t L t N t
Consumption per effective consumer
Output per effective producer
Support ratio: effective producers
per effective consumer
Consumption as a fraction of labor
income
National Transfer Accounts
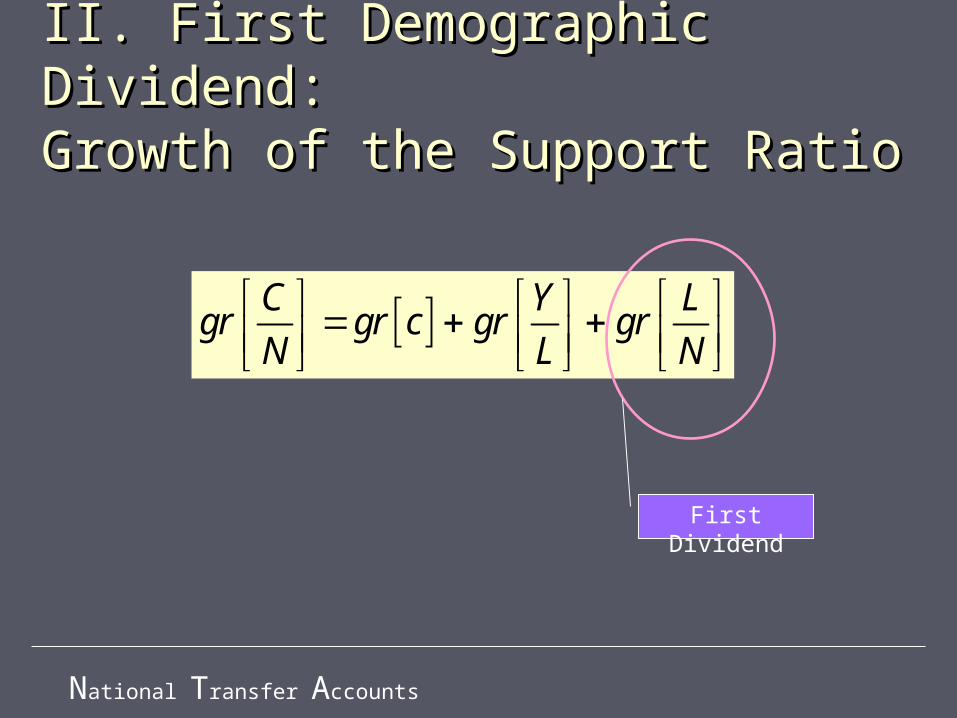
C Y Lgr gr c gr gr
N L N
II. First Demographic Dividend: II. First Demographic Dividend: Growth of the Support RatioGrowth of the Support Ratio
First Dividend
National Transfer Accounts
First DividendFirst Dividend
►The effect of changes in age structure The effect of changes in age structure on consumption per equivalent adult on consumption per equivalent adult holding the consumption rate and holding the consumption rate and output per worker constantoutput per worker constant
►Equal to the growth rate of the Equal to the growth rate of the economic support ratioeconomic support ratio
►Support ratio is calculated holding the Support ratio is calculated holding the shape of the age profiles of shape of the age profiles of consumption and labor income fixed. consumption and labor income fixed.
National Transfer Accounts
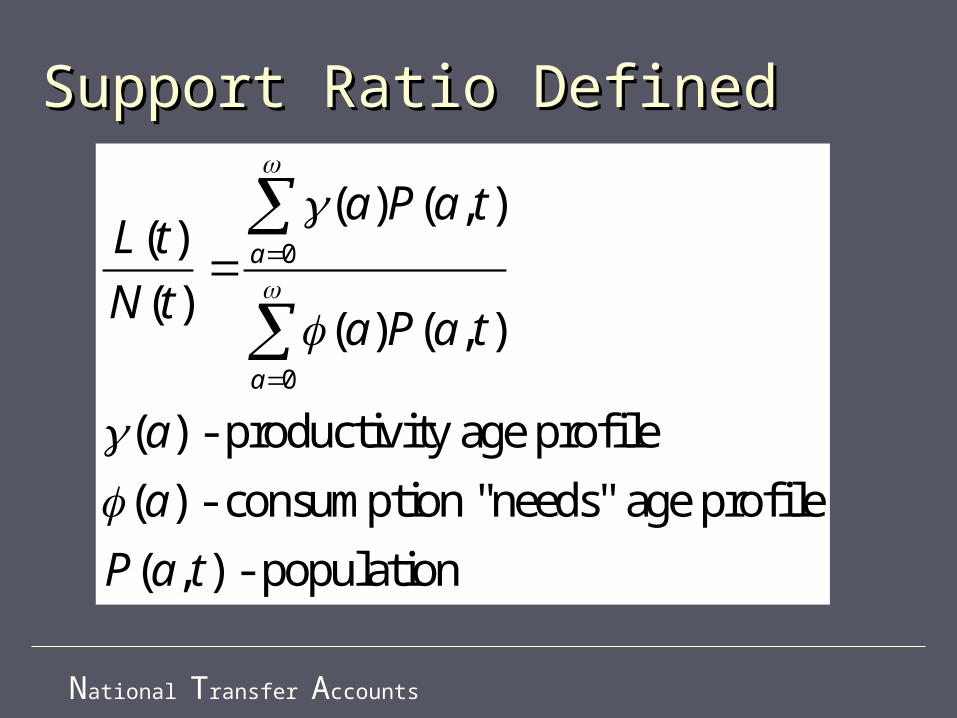
Support Ratio DefinedSupport Ratio Defined
0
0
( ) ( , )( )
( )( ) ( , )
( ) - productivity age profile
( ) - consumption "needs" age profile
( , ) - population
a
a
a P a tL t
N ta P a t
a
a
P a t
National Transfer Accounts
The Support RatioThe Support Ratio
►Support ratio measures the effect of Support ratio measures the effect of age structure on the capacity of a age structure on the capacity of a population to contribute to current population to contribute to current production. production.
►The age profiles of production and The age profiles of production and consumption reflect a wide variety of consumption reflect a wide variety of behavioral, institutional, and cultural behavioral, institutional, and cultural factors. factors.
National Transfer Accounts
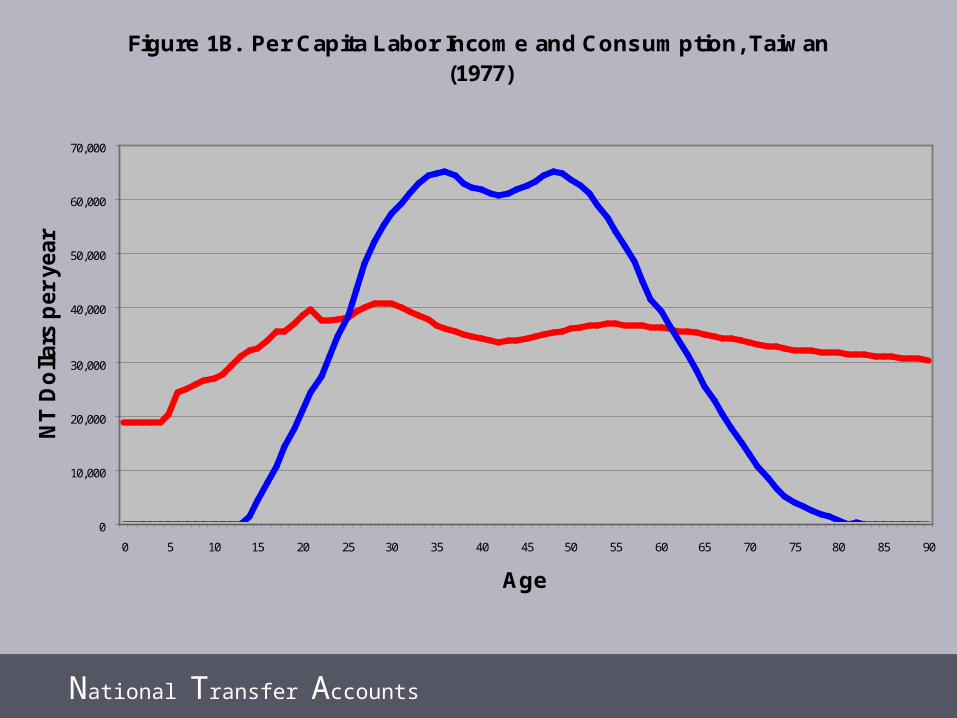
Figure 1B. Per Capita Labor Income and Consumption, Taiwan (1977)
0
10,000
20,000
30,000
40,000
50,000
60,000
70,000
0 5 10 15 20 25 30 35 40 45 50 55 60 65 70 75 80 85 90
Age
NT
Do
llars
per
year
Source: See Lee, Lee and Mason (2005) for methods and data sources for these estimates.
National Transfer Accounts
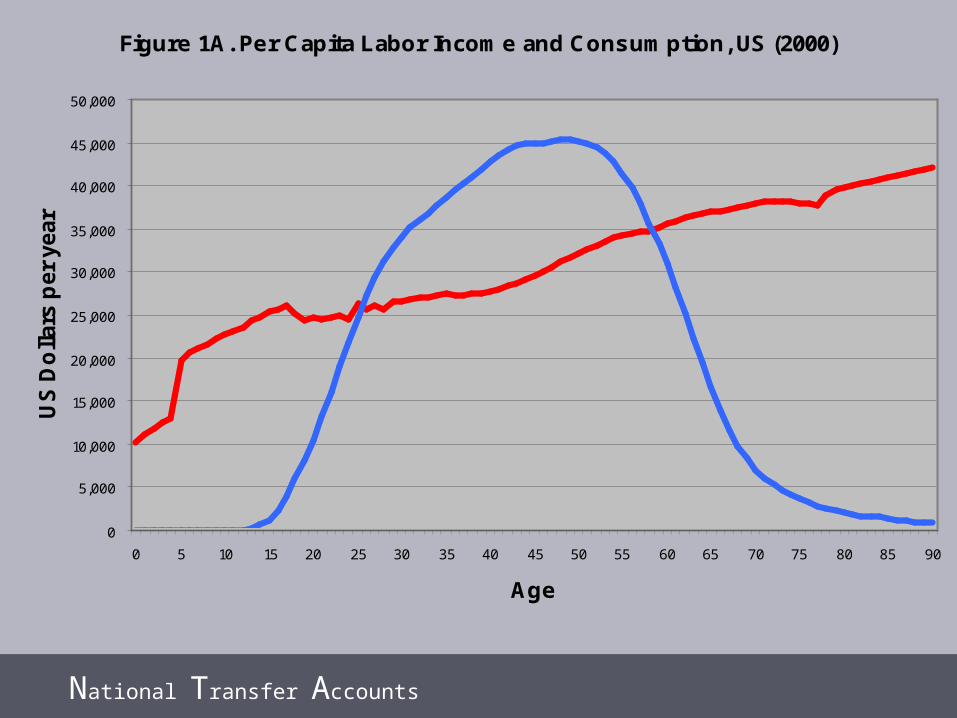
Figure 1A. Per Capita Labor Income and Consumption, US (2000)
0
5,000
10,000
15,000
20,000
25,000
30,000
35,000
40,000
45,000
50,000
0 5 10 15 20 25 30 35 40 45 50 55 60 65 70 75 80 85 90
Age
US
Do
llars
per
year
Source: See Lee, Lee and Mason (2005) for methods and data sources for these estimates.
National Transfer Accounts
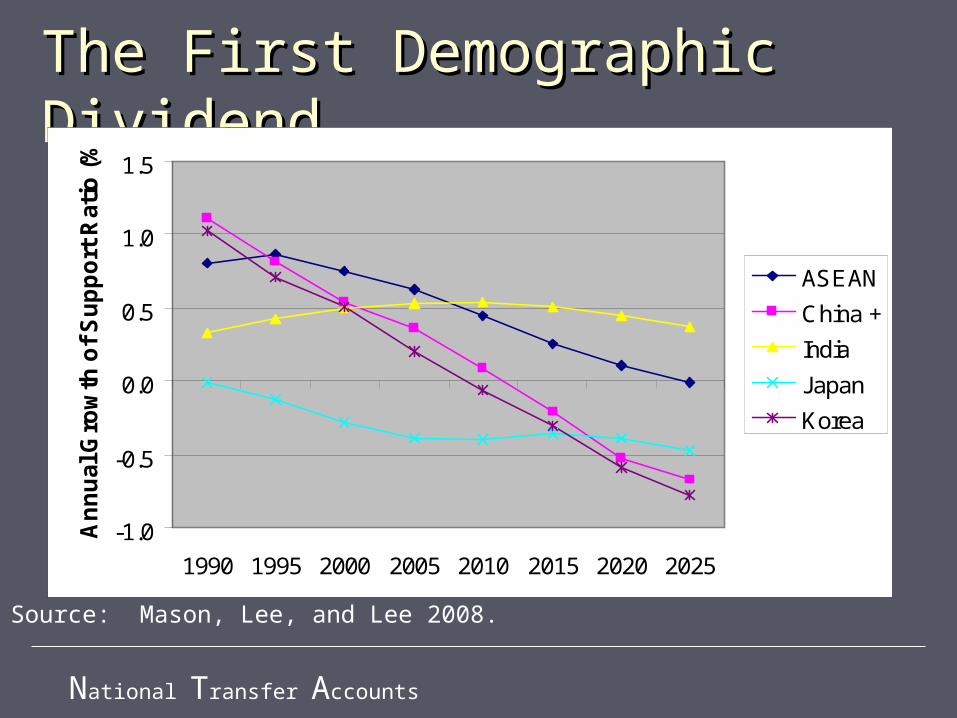
The First Demographic The First Demographic DividendDividend
-1.0
-0.5
0.0
0.5
1.0
1.5
1990 1995 2000 2005 2010 2015 2020 2025
An
nu
al G
row
th o
f S
up
po
rt R
atio
(%
)
ASEAN
China +
India
Japan
Korea
Source: Mason, Lee, and Lee 2008.
National Transfer Accounts
SummarySummary
► In Asia and many other countries economic In Asia and many other countries economic support ratio has been growing because of support ratio has been growing because of lower fertility. lower fertility.
► Result is higher consumption per equivalent Result is higher consumption per equivalent adult. adult.
► Welfare implications of compositional Welfare implications of compositional change is unclear.change is unclear.
► This is a transitory phenomenon. First This is a transitory phenomenon. First dividend will turn negative as aging occurs. dividend will turn negative as aging occurs. Already occurring in Japan.Already occurring in Japan.
National Transfer Accounts
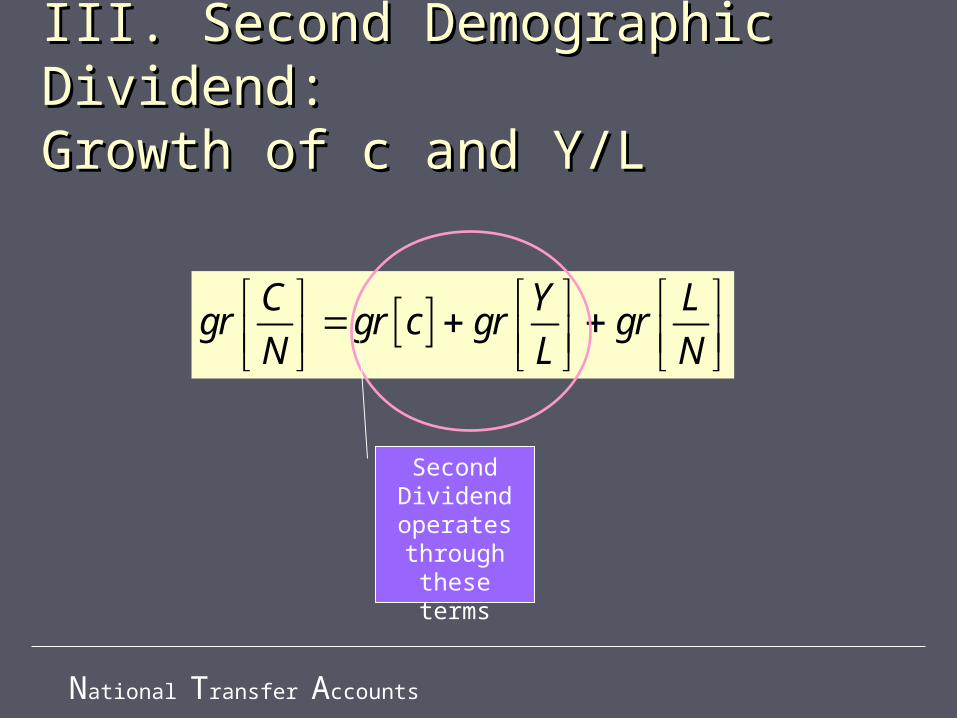
C Y Lgr gr c gr gr
N L N
III. Second Demographic III. Second Demographic Dividend: Dividend: Growth of c and Y/LGrowth of c and Y/L
Second Dividend operates through these terms
National Transfer Accounts
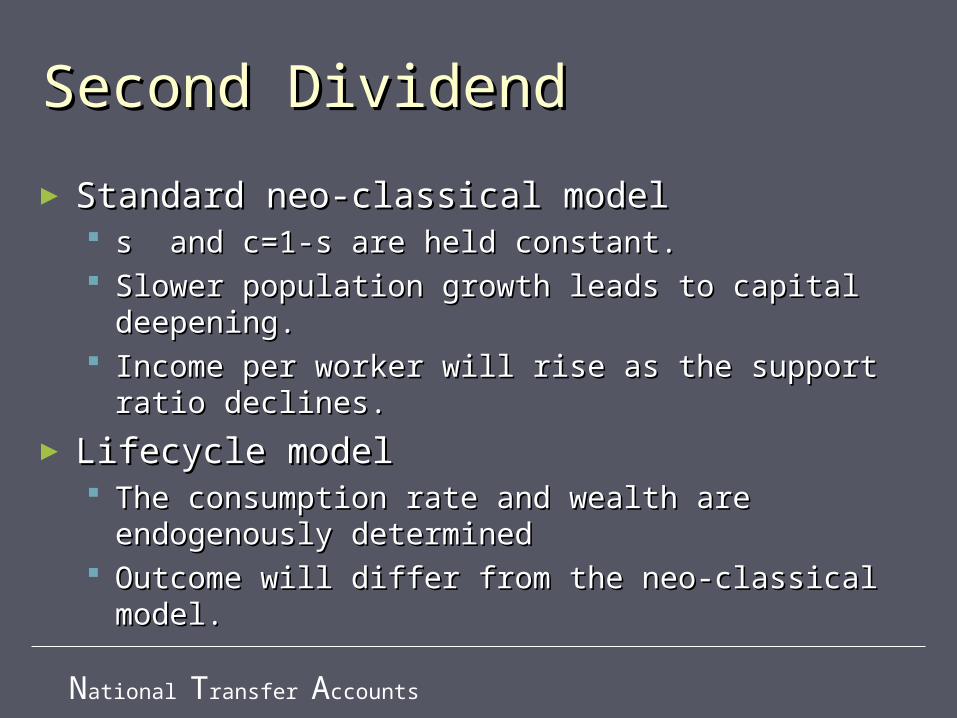
Second DividendSecond Dividend
► Standard neo-classical modelStandard neo-classical model s and c=1-s are held constant. s and c=1-s are held constant. Slower population growth leads to capital Slower population growth leads to capital
deepening.deepening. Income per worker will rise as the support ratio Income per worker will rise as the support ratio
declines. declines.
► Lifecycle modelLifecycle model The consumption rate and wealth are The consumption rate and wealth are
endogenously determinedendogenously determined Outcome will differ from the neo-classical model. Outcome will differ from the neo-classical model.
National Transfer Accounts
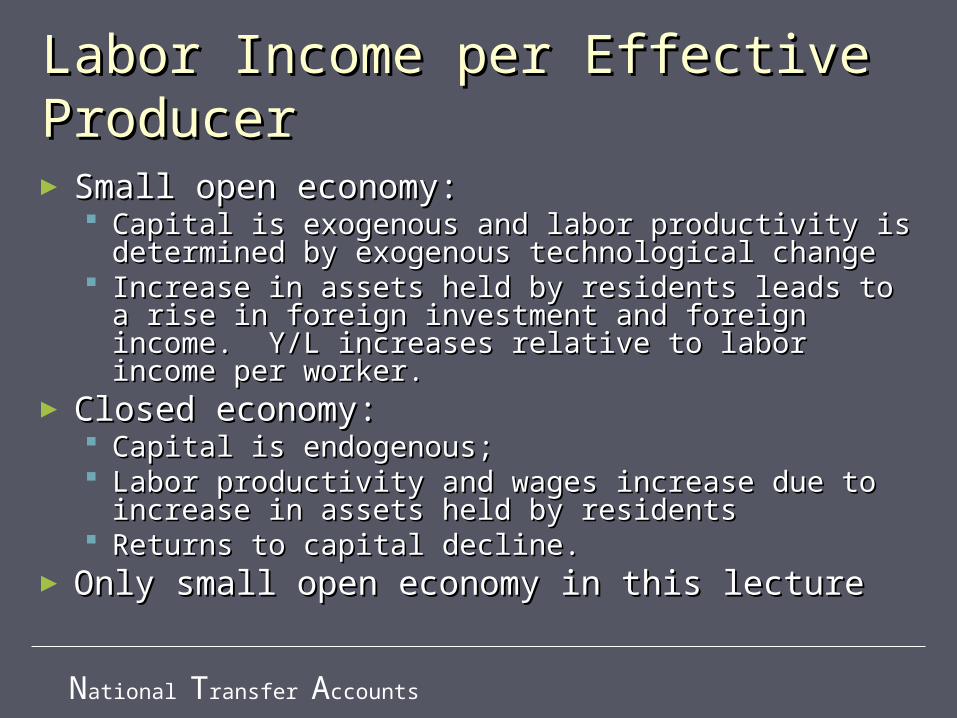
Labor Income per Effective Labor Income per Effective ProducerProducer► Small open economy: Small open economy:
Capital is exogenous and labor productivity is Capital is exogenous and labor productivity is determined by exogenous technological changedetermined by exogenous technological change
Increase in assets held by residents leads to a Increase in assets held by residents leads to a rise in foreign investment and foreign income. rise in foreign investment and foreign income. Y/L increases relative to labor income per worker. Y/L increases relative to labor income per worker.
► Closed economy:Closed economy: Capital is endogenous; Capital is endogenous; Labor productivity and wages increase due to Labor productivity and wages increase due to
increase in assets held by residentsincrease in assets held by residents Returns to capital decline. Returns to capital decline.
► Only small open economy in this lectureOnly small open economy in this lecture
National Transfer Accounts
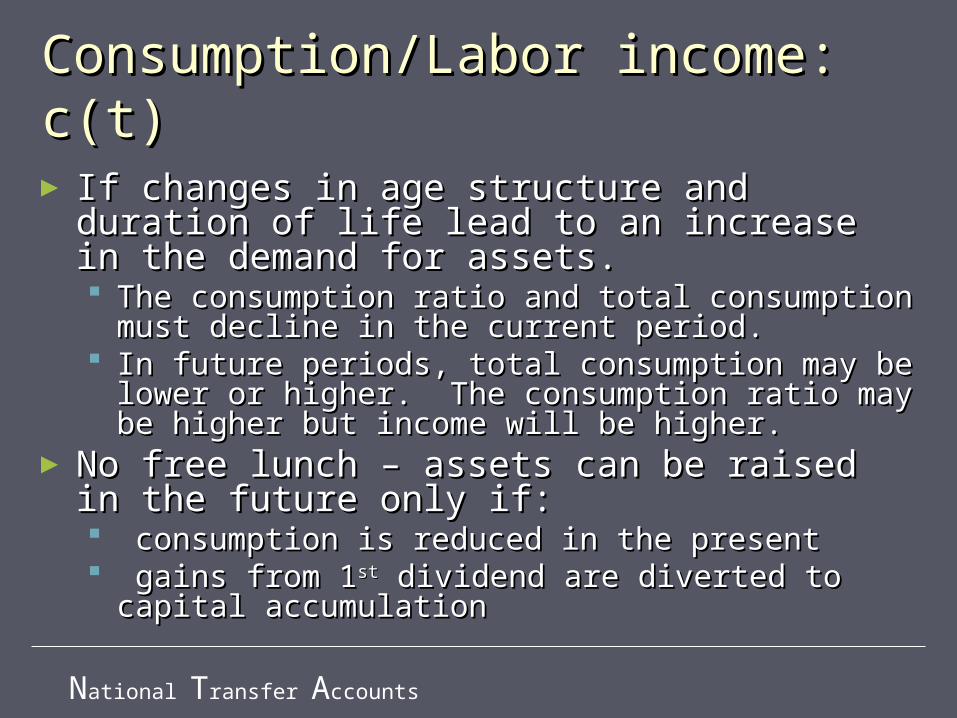
Consumption/Labor income: c(t)Consumption/Labor income: c(t)
► If changes in age structure and duration of If changes in age structure and duration of life lead to an increase in the demand for life lead to an increase in the demand for assets.assets. The consumption ratio and total consumption The consumption ratio and total consumption
must decline in the current period. must decline in the current period. In future periods, total consumption may be In future periods, total consumption may be
lower or higher. The consumption ratio may be lower or higher. The consumption ratio may be higher but income will be higher.higher but income will be higher.
► No free lunch – assets can be raised in the No free lunch – assets can be raised in the future only if:future only if: consumption is reduced in the present consumption is reduced in the present gains from 1gains from 1stst dividend are diverted to capital dividend are diverted to capital
accumulationaccumulation
National Transfer Accounts
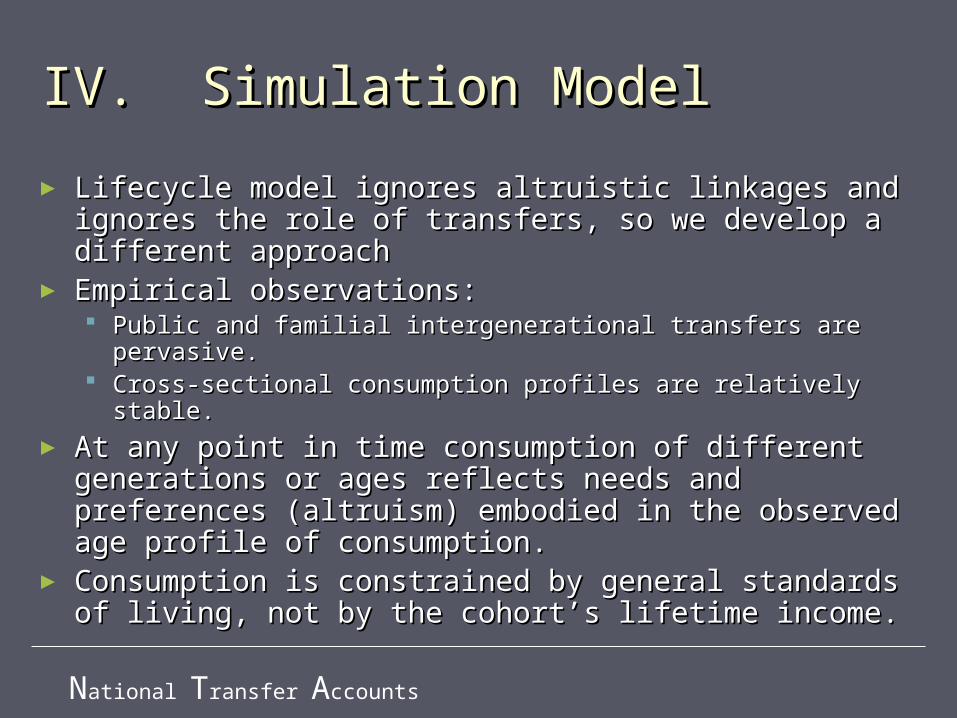
IV. Simulation ModelIV. Simulation Model
► Lifecycle model ignores altruistic linkages and Lifecycle model ignores altruistic linkages and ignores the role of transfers, so we develop a ignores the role of transfers, so we develop a different approach different approach
► Empirical observations: Empirical observations: Public and familial intergenerational transfers are Public and familial intergenerational transfers are
pervasive.pervasive. Cross-sectional consumption profiles are relatively stable.Cross-sectional consumption profiles are relatively stable.
► At any point in time consumption of different At any point in time consumption of different generations or ages reflects needs and preferences generations or ages reflects needs and preferences (altruism) embodied in the observed age profile of (altruism) embodied in the observed age profile of consumption.consumption.
► Consumption is constrained by general standards of Consumption is constrained by general standards of living, not by the cohort’s lifetime income.living, not by the cohort’s lifetime income.
National Transfer Accounts
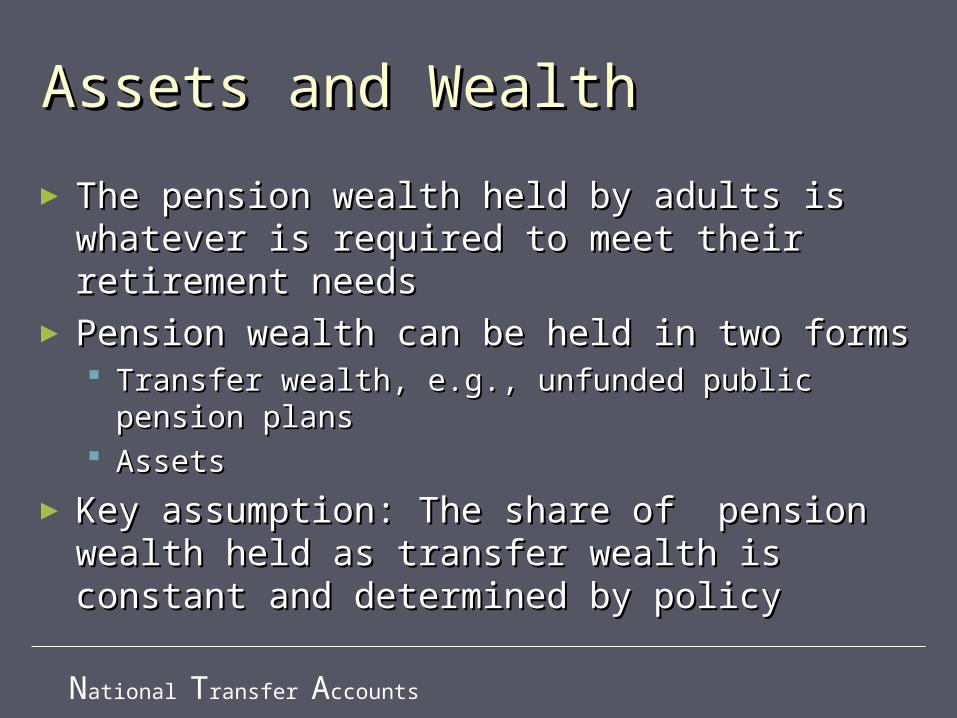
Assets and WealthAssets and Wealth
► The pension wealth held by adults is The pension wealth held by adults is whatever is required to meet their whatever is required to meet their retirement needsretirement needs
► Pension wealth can be held in two forms Pension wealth can be held in two forms Transfer wealth, e.g., unfunded public pension Transfer wealth, e.g., unfunded public pension
plansplans AssetsAssets
► Key assumption: The share of pension Key assumption: The share of pension wealth held as transfer wealth is constant wealth held as transfer wealth is constant and determined by policyand determined by policy
National Transfer Accounts
Assets and WealthAssets and Wealth
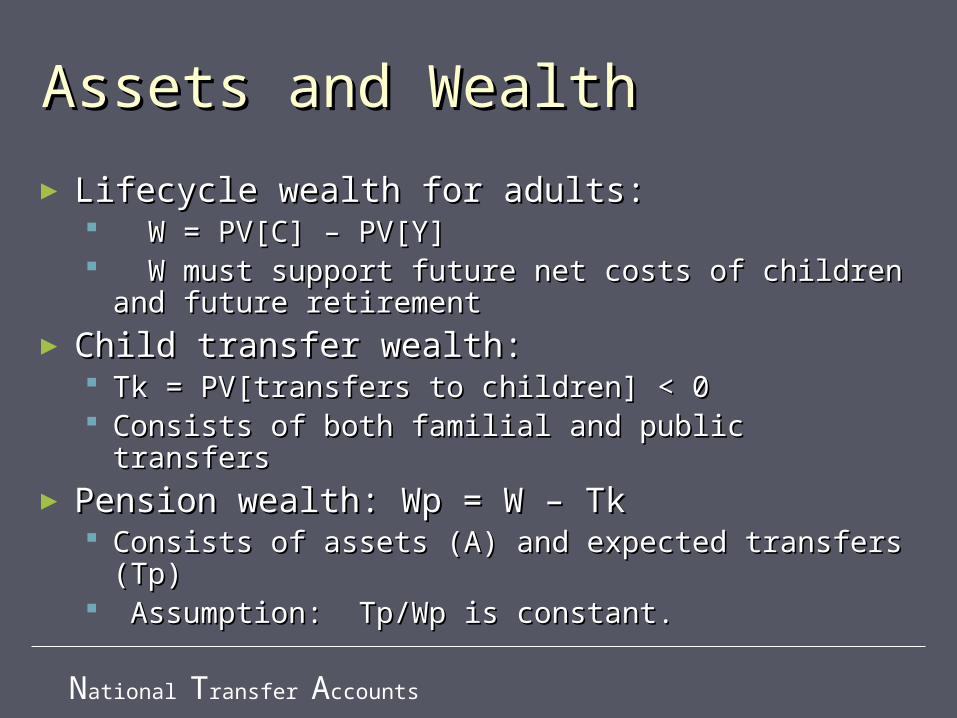
► Lifecycle wealth for adults:Lifecycle wealth for adults: W = PV[C] – PV[Y]W = PV[C] – PV[Y] W must support future net costs of children and W must support future net costs of children and
future retirement future retirement ► Child transfer wealth: Child transfer wealth:
Tk = PV[transfers to children] < 0Tk = PV[transfers to children] < 0 Consists of both familial and public transfersConsists of both familial and public transfers
► Pension wealth: Wp = W – Tk Pension wealth: Wp = W – Tk Consists of assets (A) and expected transfers Consists of assets (A) and expected transfers
(Tp)(Tp) Assumption: Tp/Wp is constant. Assumption: Tp/Wp is constant.
National Transfer Accounts
DataData
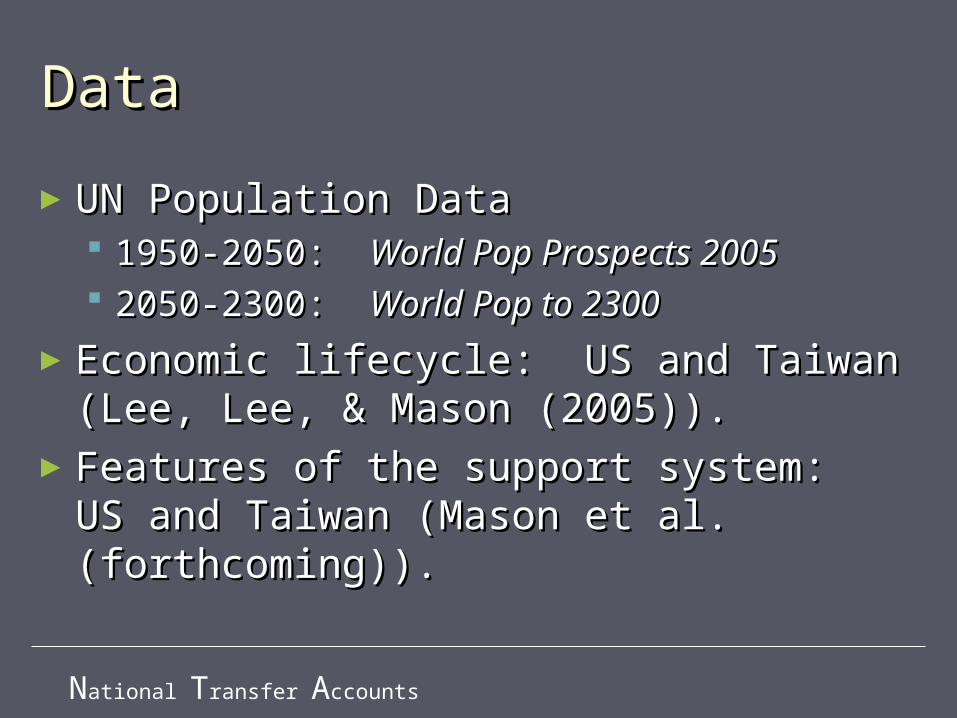
►UN Population DataUN Population Data 1950-2050: 1950-2050: World Pop Prospects 2005World Pop Prospects 2005 2050-2300: 2050-2300: World Pop to 2300World Pop to 2300
►Economic lifecycle: US and Taiwan Economic lifecycle: US and Taiwan (Lee, Lee, & Mason (2005)).(Lee, Lee, & Mason (2005)).
►Features of the support system: US Features of the support system: US and Taiwan (Mason et al. and Taiwan (Mason et al. (forthcoming)).(forthcoming)).
National Transfer Accounts
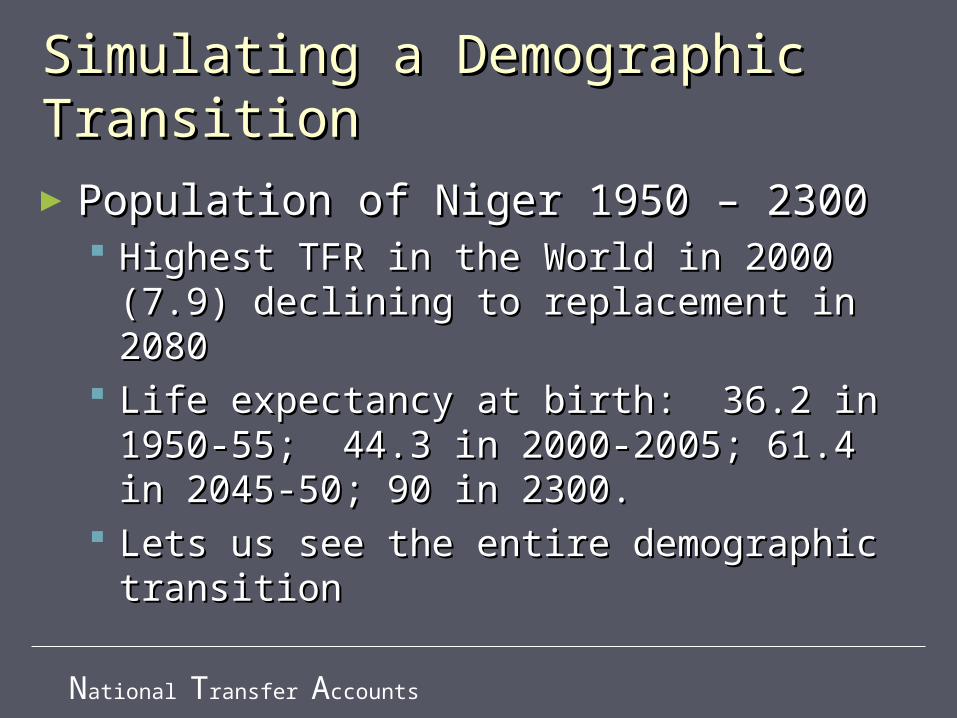
Simulating a Demographic Simulating a Demographic TransitionTransition►Population of Niger 1950 – 2300Population of Niger 1950 – 2300
Highest TFR in the World in 2000 (7.9) Highest TFR in the World in 2000 (7.9) declining to replacement in 2080declining to replacement in 2080
Life expectancy at birth: 36.2 in 1950-55; Life expectancy at birth: 36.2 in 1950-55; 44.3 in 2000-2005; 61.4 in 2045-50; 90 in 44.3 in 2000-2005; 61.4 in 2045-50; 90 in 2300.2300.
Lets us see the entire demographic Lets us see the entire demographic transition transition
National Transfer Accounts
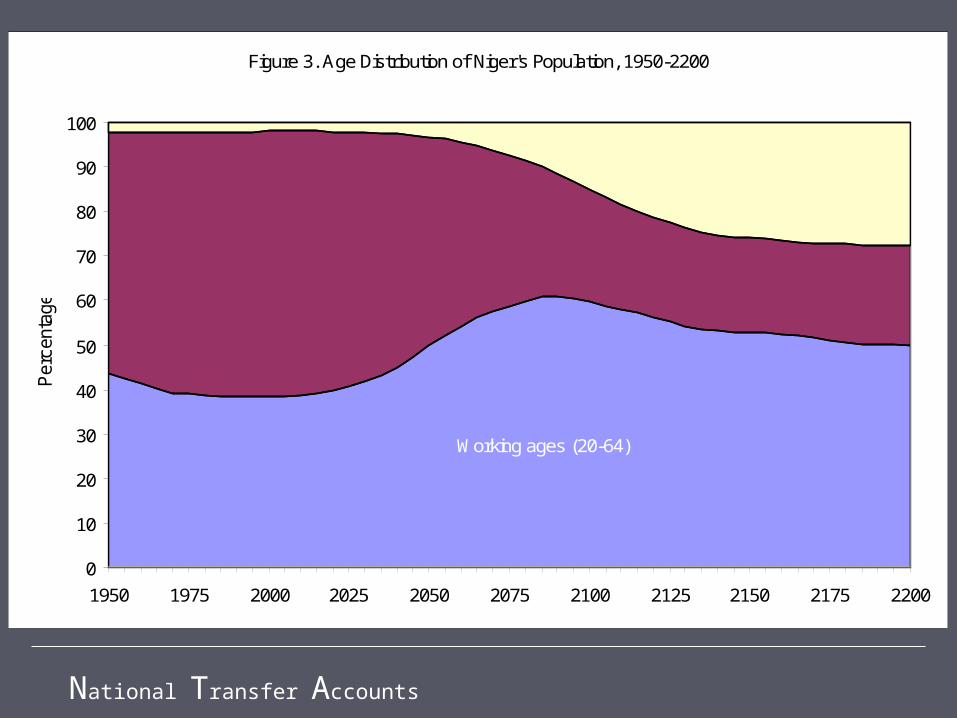
Figure 3. Age Distribution of Niger's Population, 1950-2200
0
10
20
30
40
50
60
70
80
90
100
1950 1975 2000 2025 2050 2075 2100 2125 2150 2175 2200
Per
cent
age
Working ages (20-64)
Children (0-19)
Elderly (65+)
National Transfer Accounts
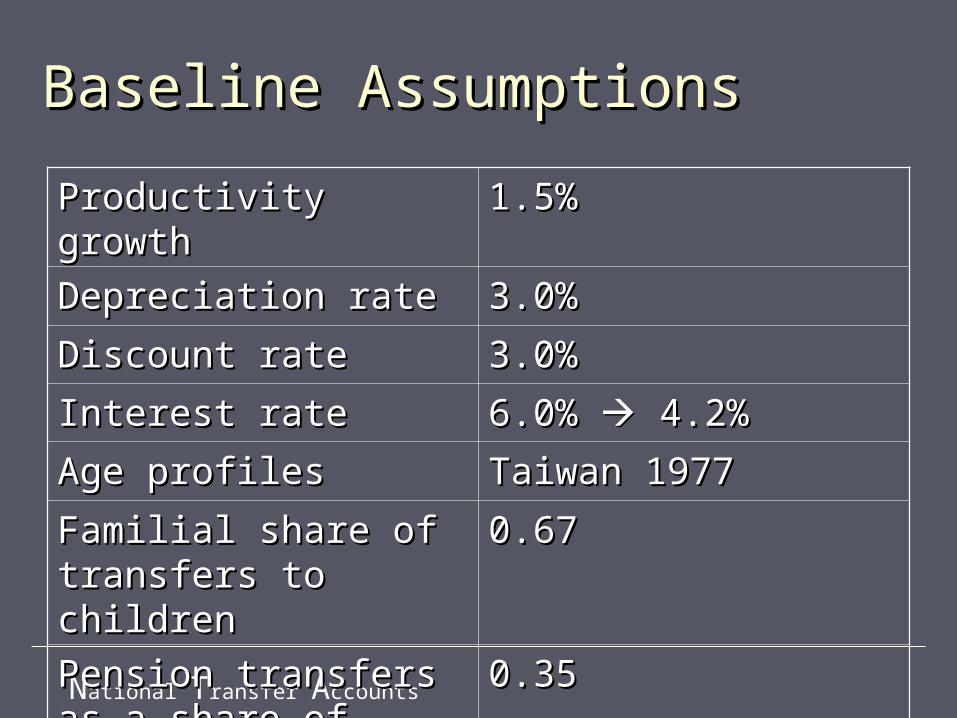
Baseline AssumptionsBaseline Assumptions
Productivity growthProductivity growth 1.5%1.5%
Depreciation rateDepreciation rate 3.0%3.0%
Discount rateDiscount rate 3.0%3.0%
Interest rateInterest rate 6.0% 6.0% 4.2% 4.2%
Age profilesAge profiles Taiwan 1977Taiwan 1977
Familial share of Familial share of transfers to childrentransfers to children
0.670.67
Pension transfers as a Pension transfers as a share of pension share of pension wealthwealth
0.350.35
National Transfer Accounts
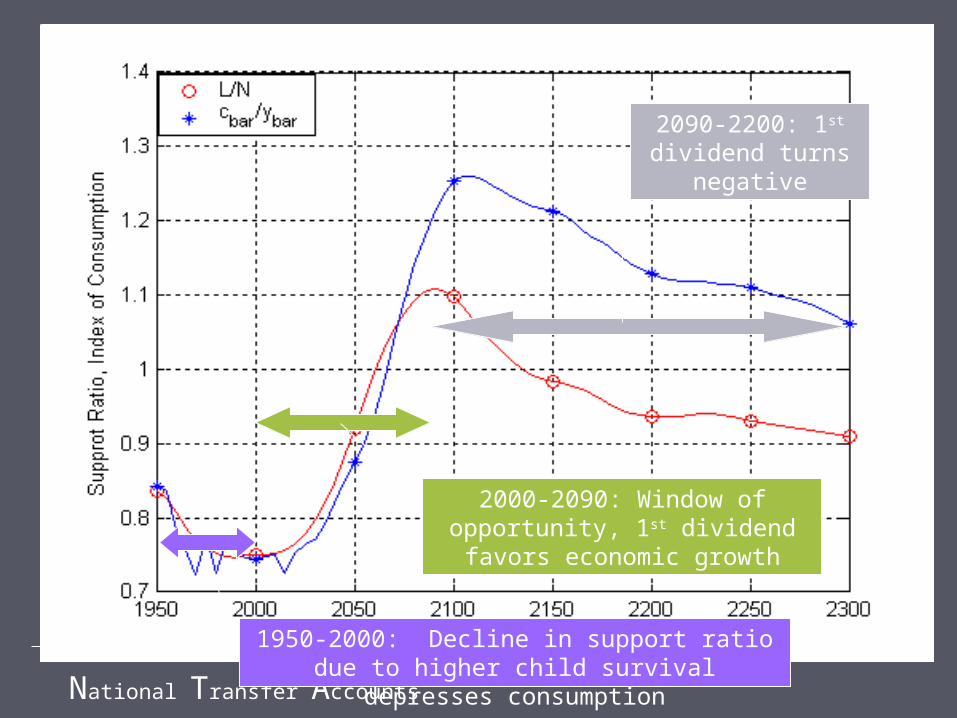
1950-2000: Decline in support ratio due to higher child survival depresses consumption
2000-2090: Window of opportunity, 1st dividend favors economic growth
2090-2200: 1st dividend turns
negative
National Transfer Accounts
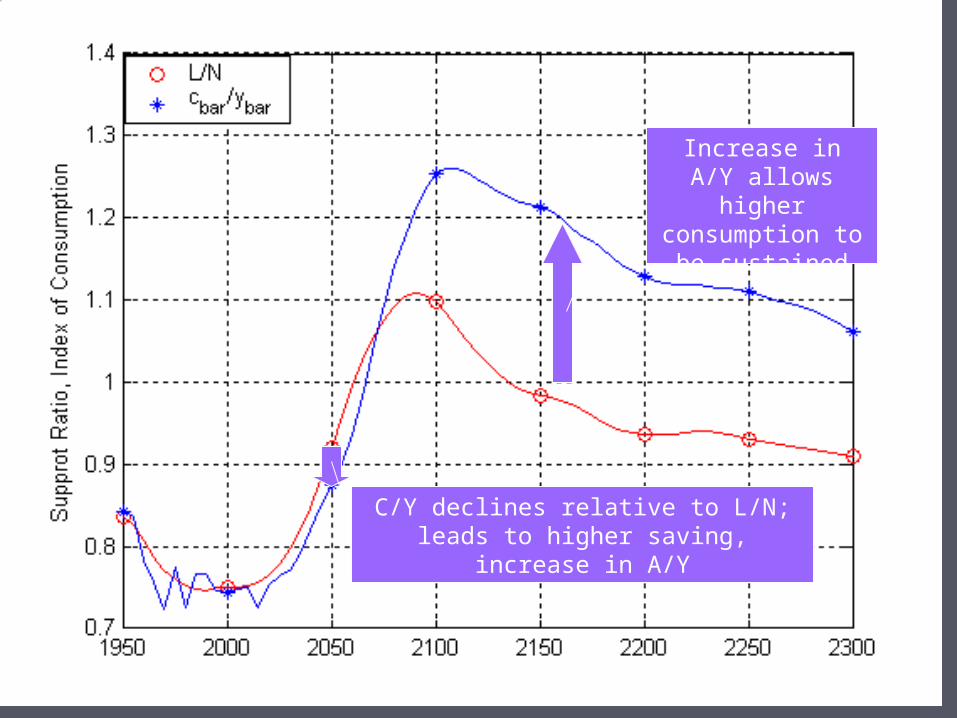
C/Y declines relative to L/N; leads to higher saving, increase in A/Y
Increase in A/Y allows higher
consumption to be sustained
National Transfer Accounts
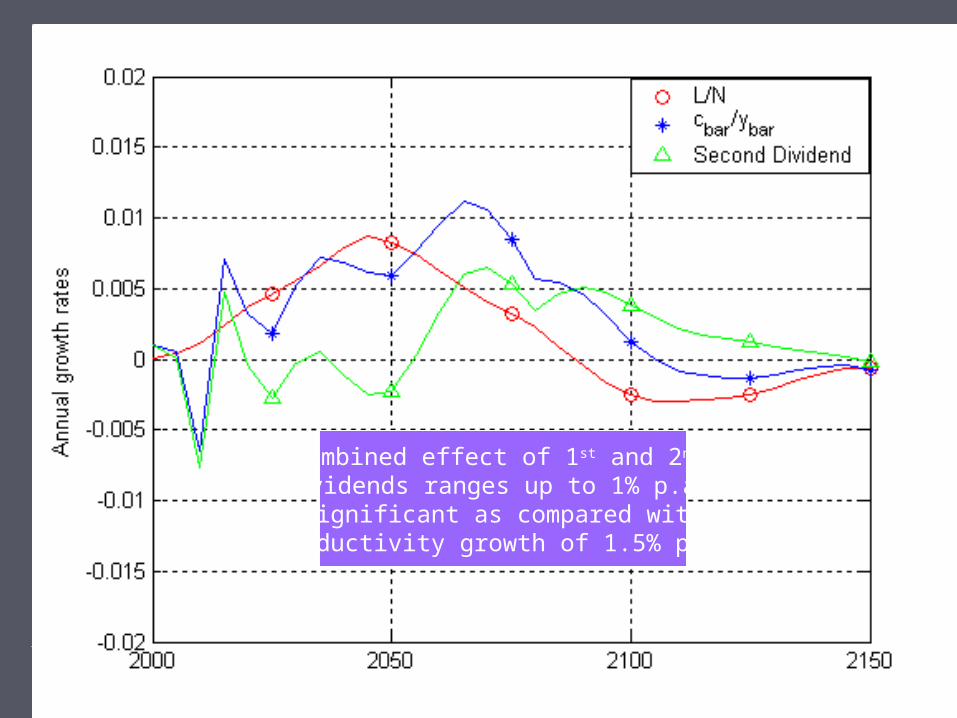
Combined effect of 1st and 2nd dividends ranges up to 1% p.a.
Significant as compared withproductivity growth of 1.5% p.a.
National Transfer Accounts
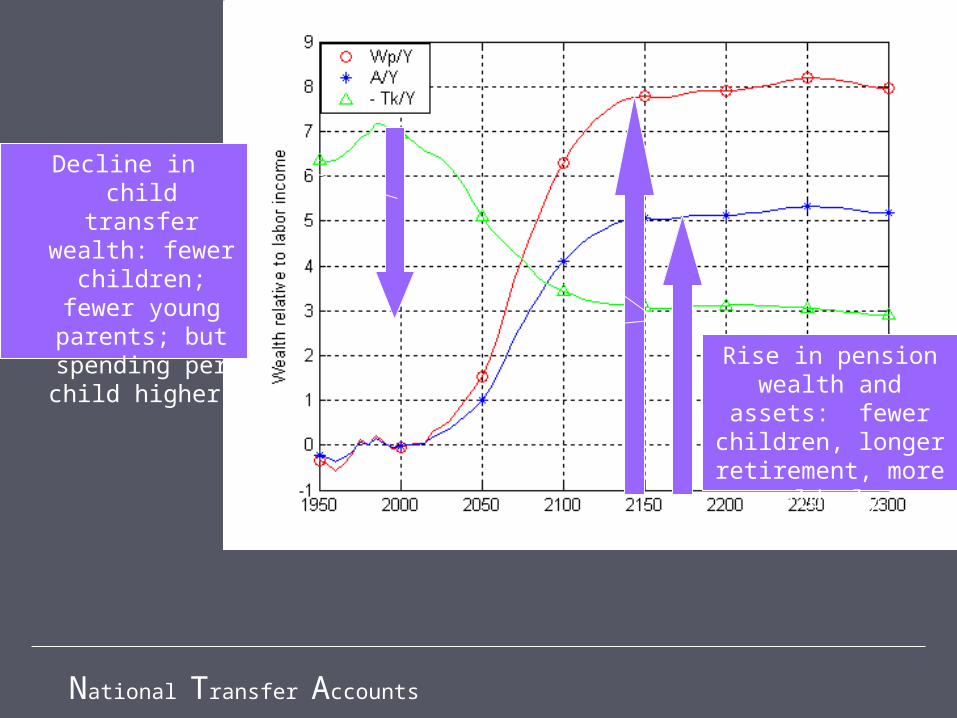
Decline in child transfer wealth: fewer children; fewer young parents; but spending per child higher.
Rise in pension wealth and assets:
fewer children, longer retirement, more
elderly
National Transfer Accounts
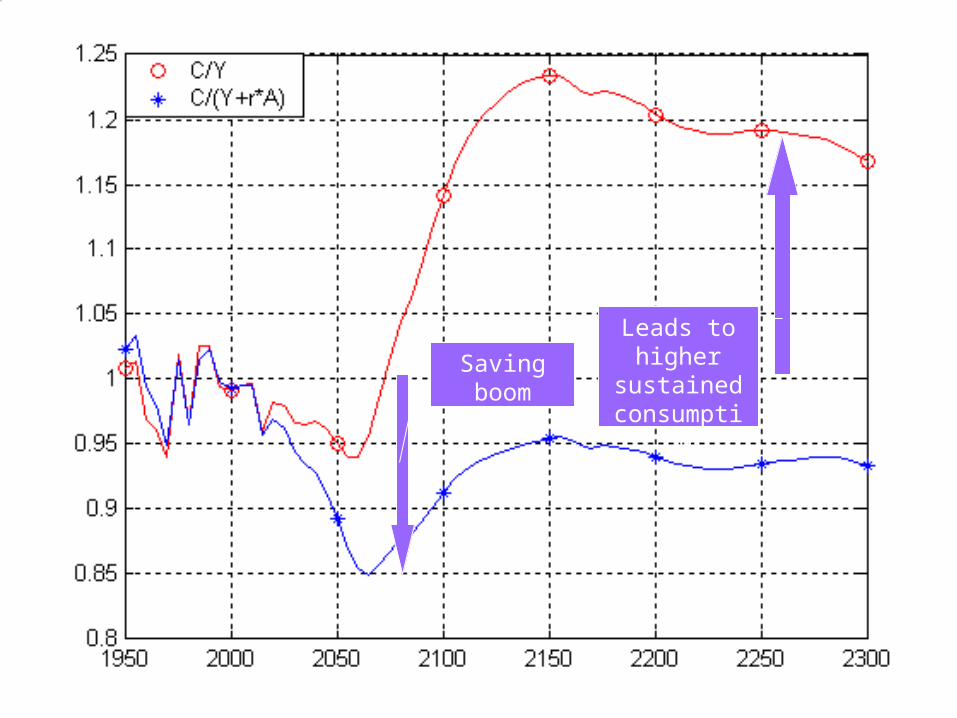
Saving boom
Leads to higher
sustained consumption
National Transfer Accounts
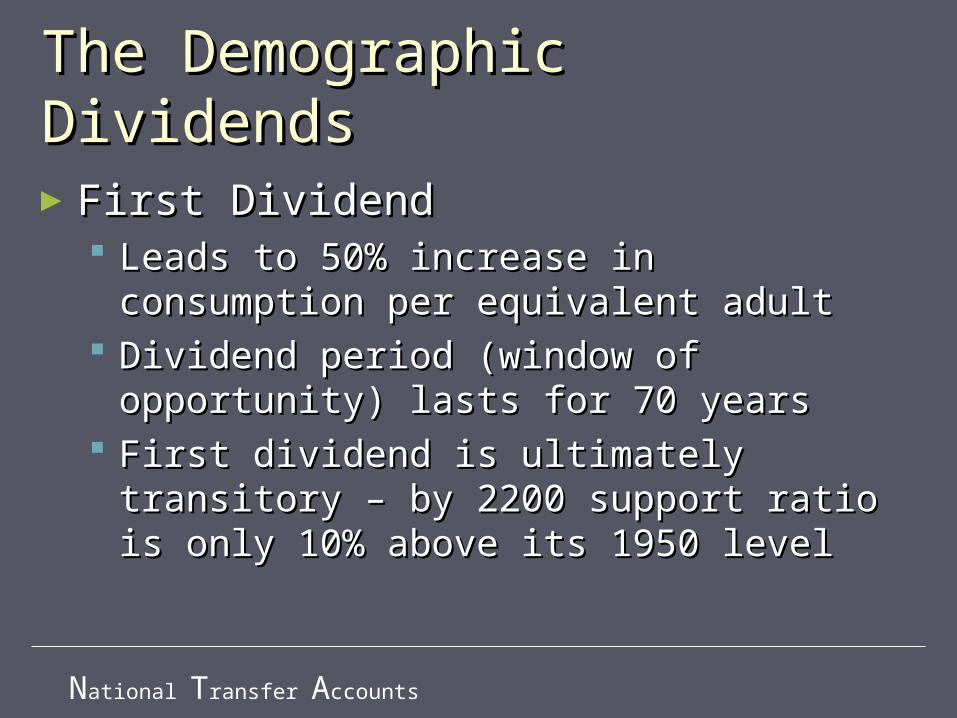
The Demographic DividendsThe Demographic Dividends
►First Dividend First Dividend Leads to 50% increase in consumption per Leads to 50% increase in consumption per
equivalent adultequivalent adult Dividend period (window of opportunity) Dividend period (window of opportunity)
lasts for 70 yearslasts for 70 years First dividend is ultimately transitory – by First dividend is ultimately transitory – by
2200 support ratio is only 10% above its 2200 support ratio is only 10% above its 1950 level1950 level
National Transfer Accounts
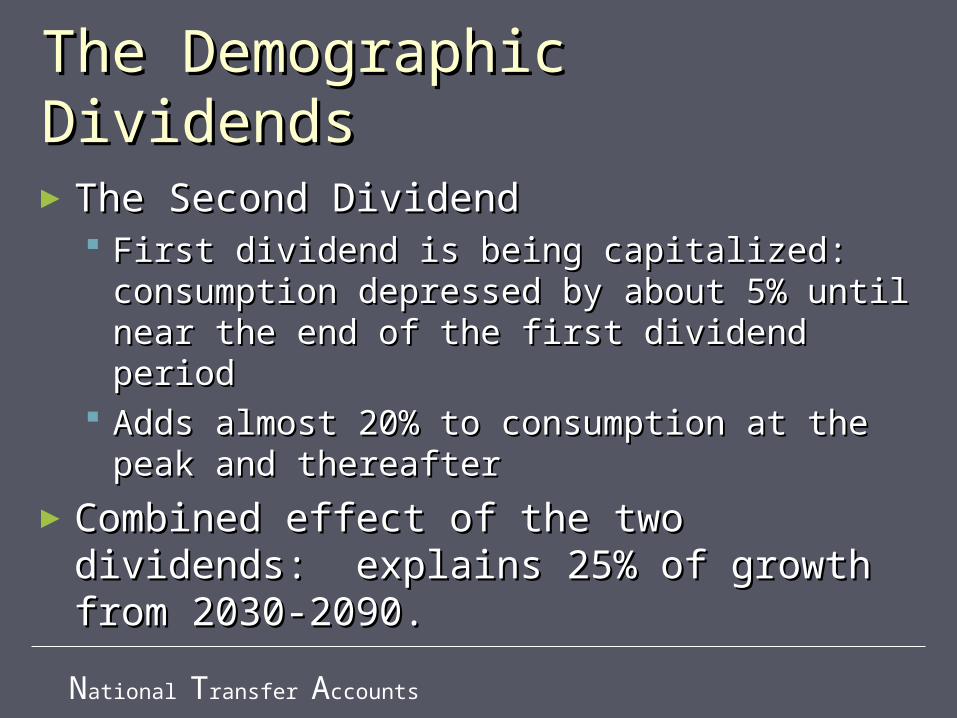
The Demographic DividendsThe Demographic Dividends
►The Second Dividend The Second Dividend First dividend is being capitalized: First dividend is being capitalized:
consumption depressed by about 5% until consumption depressed by about 5% until near the end of the first dividend periodnear the end of the first dividend period
Adds almost 20% to consumption at the Adds almost 20% to consumption at the peak and thereafterpeak and thereafter
►Combined effect of the two dividends: Combined effect of the two dividends: explains 25% of growth from 2030-explains 25% of growth from 2030-2090.2090.
National Transfer Accounts
Sensitivity AnalysisSensitivity Analysis
►US economic lifecycle leads to greater US economic lifecycle leads to greater assets, higher consumption in the assets, higher consumption in the short-run, but lower consumption in short-run, but lower consumption in the long-runthe long-run
► Increase in pension transfer wealth Increase in pension transfer wealth has a very large effect, more than has a very large effect, more than proportional, on wealth and adversely proportional, on wealth and adversely affects consumption. affects consumption.
National Transfer Accounts
Limitations of Current Limitations of Current AnalysisAnalysis►Model does not incorporate important Model does not incorporate important
feedbacks feedbacks Small open economySmall open economy Accumulation of assets does not lead to Accumulation of assets does not lead to
changes in interest rates or changes in changes in interest rates or changes in labor productivitylabor productivity
In future work this will be a key feature of In future work this will be a key feature of the analysisthe analysis
National Transfer Accounts
Policy Policy
• Develop asset-based pension systems.Develop asset-based pension systems.• Avoid excess reliance on public pensions.Avoid excess reliance on public pensions.• Improve access to labor markets for elderly.Improve access to labor markets for elderly.• Raise financial literacy.Raise financial literacy.• Strengthen financial sector. Strengthen financial sector. • Improve domestic investment environment. Improve domestic investment environment. • Increase access to international capital Increase access to international capital
markets. markets.
National Transfer Accounts
ConclusionsConclusions
►Age structure is important for economic Age structure is important for economic growth and poverty reduction.growth and poverty reduction.
►First dividend is transitory.First dividend is transitory.►Demographic transition can have a Demographic transition can have a
permanent effect on consumption by permanent effect on consumption by influencing the accumulation of assets.influencing the accumulation of assets.
►Similar effects could be realized Similar effects could be realized through human capital investment.through human capital investment.
►Outcome is highly policy-dependent.Outcome is highly policy-dependent.
National Transfer Accounts
Additional ReadingAdditional Reading
Mason, A. and R. Lee (2007). Transfers, Capital, and Consumption over the Demographic Transition. Population Aging, Intergenerational Transfers and the Macroeconomy. R. Clark, N. Ogawa and A. Mason, Elgar Press.
Mason, A., R. Lee, S.H. Lee (2008). Demographic Transition and Economic Growth in the Pacific Rim. East Asian Seminar on Economics (EASE), June 19-21, Seoul, Korea.
National Transfer Accounts
ExerciseExercise
► Calculate the support ratio for your countryCalculate the support ratio for your country► Calculate the rate of growth of the support ratioCalculate the rate of growth of the support ratio► What is the period during which support ratio is What is the period during which support ratio is
increasing (demographic window)? Declining?increasing (demographic window)? Declining?► What is the direct annual contribution of changes in What is the direct annual contribution of changes in
the support ratio to income per effective consumer the support ratio to income per effective consumer and consumption per effective consumer (first and consumption per effective consumer (first dividend) during this period?dividend) during this period?
► What is the total effect during this period? What is the total effect during this period? ► During period of decline, what is the annual effect During period of decline, what is the annual effect
and the total effect in income and consumption per and the total effect in income and consumption per effective consumer?effective consumer?

NNational ational TTransfer ransfer AAccountsccounts
The EndThe End