national telecommunications and information administration · pcc and sba workforce and economic...
TRANSCRIPT
69
Submitted April 25, 2014 ASR Analytics, LLC 1389 Canterbury Way Potomac, MD 20854 Federal TIN: 20-1204680 DUNS: 15-108-3305 GSA Schedule #: GS-10F-0062R Submitted to: Shelita Saint-Louis, Contracting Officer Cassandra Sterba, Contract Specialist Acquisition Services Directorate National Business Center Department of the Interior
National Telecommunications and Information Administration
Broadband Technology Opportunities Program Evaluation Study
Order Number D10PD18645
Progress towards BTOP Goals: Second Interim Report on CCI, PCC,
and SBA Case Studies
ii
Table of Contents Executive Summary ............................................................................................................................ 1
Section 1. Introduction ................................................................................................................... 4
1.1 Methodology ......................................................................................................................... 4
1.2 Grants in the Evaluation Study Sample ............................................................................... 4
1.3 Data ...................................................................................................................................... 8
1.4 Focus Areas ......................................................................................................................... 9
Section 2. Workforce and Economic Development Impacts ........................................................ 13
2.1 Workforce and Economic Development Potential Benefits ............................................... 13
2.2 PCC and SBA Workforce and Economic Development Impacts ....................................... 14
2.3 CCI Workforce and Economic Development Impacts ........................................................ 21
Section 3. Education and Training Impacts ................................................................................. 25
3.1 Education and Training Potential Benefits ......................................................................... 25
3.2 PCC and SBA Education and Training Impacts ................................................................. 25
3.3 CCI Education and Training Impacts ................................................................................. 31
Section 4. Healthcare Impacts ..................................................................................................... 36
4.1 Healthcare Potential Benefits ............................................................................................. 36
4.2 PCC and SBA Healthcare Impacts .................................................................................... 37
4.3 CCI Healthcare Impacts ..................................................................................................... 42
Section 5. Government Services Impacts .................................................................................... 46
5.1 Government Service Potential Benefits ............................................................................. 46
5.2 CCI Government Services Impacts .................................................................................... 48
Section 6. Quality of Life/Civic Engagement Impacts .................................................................. 53
6.1 Quality of Life/Civic Engagement Potential Benefits .......................................................... 53
6.2 PCC and SBA Quality of Life/Civic Engagement Impacts ................................................. 53
6.3 CCI Quality of Life/Civic Engagement Impacts .................................................................. 58
Section 7. Digital Literacy Impacts ............................................................................................... 61
7.1 Digital Literacy Potential Benefits....................................................................................... 61
7.2 PCC and SBA Digital Literacy Impacts .............................................................................. 62
7.3 CCI Digital Literacy Impacts ............................................................................................... 66
Section 8. Best Practices ............................................................................................................. 69
8.1 PCC and SBA ..................................................................................................................... 69
8.2 CCI ..................................................................................................................................... 71
iii
Section 9. Conclusions................................................................................................................. 72
9.1 Improve Access to Unserved and Underserved Areas of the Country .............................. 72
9.2 Broadband Education, Awareness, Training, Access, Equipment, and Support ............... 75
9.3 Public Safety Agencies ...................................................................................................... 78
9.4 Demand for Broadband, Economic Growth, and Job Creation .......................................... 78
Section 10. Next Steps for the Evaluation Study ....................................................................... 82
10.1 Roadmap for the Remainder of the Study ......................................................................... 82
10.2 Modifications to the Statistical Methodology ...................................................................... 82
10.3 Purpose of the Statistical Estimation Methodology ............................................................ 83
10.4 Estimating Short-Term Economic Impacts ......................................................................... 83
10.5 Estimating Intermediate-Term and Long-Term Impacts .................................................... 83
10.6 Matched Pairs Selection .................................................................................................... 83
10.7 Selecting Matching Counties .............................................................................................. 87
10.8 Rurality ............................................................................................................................... 88
10.9 Matching ............................................................................................................................. 88
10.10 Sensitivity Testing .............................................................................................................. 89
10.11 Extrapolating to Long-Term Broadband Impacts ............................................................... 91
10.12 Challenges and Methodological Adjustments .................................................................... 93
Appendix A. Matched Counties ................................................................................................... 96
Notes ............................................................................................................................................... 120
Glossary .......................................................................................................................................... 180
Bibliography .................................................................................................................................... 184

iv
List of Tables Table 1. Site Visit Summary Statistics ................................................................................................ 9
Table 2. Workforce and Economic Development: Potential Social and Economic Benefits ............ 14
Table 3. Education and Training: Potential Social and Economic Benefits ...................................... 25
Table 4. Healthcare: Potential Social and Economic Benefits ......................................................... 37
Table 5. Government Services: Potential Social and Economic Benefits ........................................ 48
Table 6. Quality of Life/Civic Engagement: Potential Social and Economic Benefits ...................... 53
Table 7. Digital Literacy: Potential Social and Economic Benefits ................................................... 62
Table 8. CCI CAI Pricing and Speed Changes ................................................................................ 75
Table 9. Selected BTOP CCI Grant Service Area Counties ............................................................. 84
Table 10. Potential Control Counties in the United States ............................................................... 86
Table 11. Number of Counties in Treatment, Control, and Discarded Groups ................................ 86
Table 12. Descriptive Statistics of Matching Variables ..................................................................... 87
Table 13. Descriptive Statistics of Matching Variables for Matched Pairs ....................................... 89
Table 14. Descriptive Statistics of Vulnerable Populations .............................................................. 90
Table 15. Descriptive Statistics of Matching Variables for Matched Pairs, Sensitivity Group .......... 90
Table 16. Broadband Benefits .......................................................................................................... 91
Table 17. Community Anchor Institutions in Treatment Counties and Base-Case Selected Control Counties ............................................................................................................................................ 94
v
List of Figures Figure 1. Evaluation Study Sample Grantee Locations ...................................................................... 5
Figure 2. PCC and SBA Workforce and Economic Development Impacts ...................................... 15
Figure 3. CCI Workforce and Economic Development Impacts ....................................................... 21
Figure 4. PCC and SBA Education and Training Outcomes and Impacts ....................................... 26
Figure 5. CCI Education and Training Impacts ................................................................................ 32
Figure 6. PCC and SBA Healthcare Impacts ................................................................................... 38
Figure 7. CCI Healthcare Impacts .................................................................................................... 42
Figure 8. CCI Government Services Impacts ................................................................................... 49
Figure 9. PCC and SBA Quality of Life/Civic Engagement Impacts ................................................ 54
Figure 10. Cumulative CCI Community Anchor Institution Connections .......................................... 74
Figure 11. Cumulative Signed Third-Party Service Provider and Broadband Wholesaler Agreements ...................................................................................................................................... 75
Figure 12. Cumulative Public Computer Centers Established and Upgraded ................................. 76
Figure 13. Cumulative PCC Hardware Installations and Upgrades ................................................. 77
Figure 14. Average Weekly PCC Users ........................................................................................... 78
Figure 15. Cumulative SBA New Household Subscribers ................................................................ 79
Figure 16. Quarterly Jobs Created by Project Type ......................................................................... 80
Figure 17. Distribution of Rural Percentage of Population in Treatment and Potential Control Counties ............................................................................................................................................ 88

1
Executive Summary About the Evaluation Study
On September 17, 2010, the National Telecommunications and Information Administration (NTIA) awarded a task order to ASR Analytics, LLC (ASR) to complete an Evaluation Study of the Broadband Technology Opportunities Program (BTOP).1 The scope of work includes an assessment of the benefits that BTOP grants are having on broadband availability and adoption, and in achieving economic and social benefits in areas served by the grantees.2 ASR is also required to provide NTIA with all data that created a foundation for the analysis and conclusions, as well as all data that could be utilized by future researchers.3 A complete description of the methodology used in the evaluation study is available in the BTOP Evaluation Study Design.4
This study includes two Interim Reports and a Final Report. The Interim Reports are designed to provide detailed information on the baselines against which future analysis will be compared, present a rigorous and defensible methodology incorporating all data available at the time, and provide an interim analysis of the initial economic and social impacts of BTOP grants.5
Between July 2011 and November 2013, ASR conducted forty-two site visits with twenty-seven different BTOP grantees (the evaluation study sample). The evaluation study team performed a total of 413 site visit interviews between July 2011 and November 2013. ASR submitted a case study report after each site visit. The results presented in case study reports are primarily qualitative, with quantitative data provided where feasible. Each case study report included the following descriptions:6
How the grantee maximized the impact of the BTOP investment.
Successful techniques, tools, materials, and strategies used to implement the project.
Best practices and evidence from third parties, such as consumers and anchor institutions, as to the impact of the project in the community.
This Interim Report summarizes and synthesizes the social and economic impacts presented in the forty-two case study reports accepted by NTIA under this task order. The information presented in this report captures the social and economic impacts of the BTOP projects in the evaluation study sample and is not an evaluation of any grantee, subgrantee, or partner.
About BTOP
The American Recovery and Reinvestment Act of 2009 (Recovery Act) appropriated $4.7 billion in federal funding to NTIA to implement BTOP.7 In 2009 and 2010, NTIA invested approximately $4 billion in 233 BTOP projects benefiting every state, as well as five territories and the District of Columbia. As of June 30, 2013, 163 projects remained in active status, and 61 projects had completed their project activities.8 As of June 30, 2013, NTIA had provided extensions until no later than September 30, 2013 to fifty-one grant recipients and extensions for no later than August 31, 2014 to four grant recipients.9 NTIA funded three types of projects under BTOP:10
Public Computer Centers (PCC) projects establish new public computer facilities or upgrade existing facilities in order to provide broadband access to the public or to specific vulnerable
The information presented in this report captures the social and economic impacts of the BTOP grantees and is not an evaluation of any grantee, subgrantee, or partner.

2
populations, such as low-income individuals, the unemployed, seniors, children, minorities, and people with disabilities.
Sustainable Broadband Adoption (SBA) projects focus on increasing broadband Internet use and adoption, especially in vulnerable populations where broadband technology has traditionally been underutilized.
Comprehensive Community Infrastructure (CCI) projects deploy new or improved broadband Internet facilities to connect households, businesses, and community anchor institutions (CAI) such as schools, libraries, hospitals, and public safety facilities.
Progress towards Recovery Act Goals
The Recovery Act instructed NTIA to implement BTOP to promote five core purposes.11 The following examples summarize the evaluation study team’s findings, described in more detail in the individual case study reports.
Provide access to broadband service to consumers residing in unserved areas of the country, and provide improved access to broadband service to consumers residing in underserved areas of the country.
o The PCC projects provided computer and broadband resources, such as hardware, software, training, and support, to vulnerable populations. PCC grants provided access to equipment and broadband primarily through public computer centers and limited distribution of computers to individuals. In ten of the thirteen quarters in the award period, PCC grantees had a combined total of at least one million weekly users.
o SBA projects provided affordable computer and broadband access by distributing personal devices, such as laptops, and providing access to affordable broadband subscriptions to eligible individuals. SBA projects also provided training to vulnerable populations in the targeted service areas.
o CCI projects provided broadband services over fiber-based or microwave open access networks to unserved and underserved areas of the country. As of September 30, 2013, CCI projects had constructed nearly 7,000 points of interconnection with BTOP-funded middle mile infrastructure and had signed more than 600 agreements with third-party service providers and broadband wholesalers. By the end of September 30, 2013, CCI projects had deployed 43,095 miles of new network fiber. Grantees had leased an additional 36,418 miles of new fiber and upgraded an additional 25,740 miles of existing network fiber. Finally, CCI grantees leased 6,248 miles of existing network fiber.
Provide broadband education, awareness, training, access, equipment, and support to (1) schools, libraries, medical and healthcare providers, community colleges and other institutions of higher learning, and other community support organizations; (2) organizations and agencies that provide outreach, access, equipment, and support services to facilitate greater use of broadband services by vulnerable populations (e.g., low-income, unemployed, seniors); and (3) job-creating strategic facilities located in state- or federally designated economic development zones.
o All PCC and SBA projects in the evaluation study sample implemented strategies surrounding broadband education, awareness, training, access, equipment, and support to implement the grants.
BTOP projects are intended to support the deployment of broadband infrastructure, enhance and expand public computer centers, and encourage sustainable adoption of broadband service.
All PCC and SBA projects in the evaluation study sample implemented strategies surrounding broadband education, awareness, training, access, equipment, and support to implement the grants.

3
o PCC projects supported this goal through the establishment of public computer centers as fundamental elements of their programs to promote computer and broadband access and adoption. As of September 30, 2013, PCC grantees had installed nearly 50,000 workstations. Grantees also upgraded more than 2,000 broadband connections and installed 2,000 wireless broadband connections.
o As of the third quarter of 2013, CCI projects had connected almost 20,000 CAIs.
Improve access to, and use of, broadband service by public safety agencies.
o Each of the CCI projects in the evaluation study sample enabled public safety activities, with the exception of Zayo Bandwidth’s Indiana Middle Mile Fiber for Schools, Communities, and Anchor Institutions project.
o Grants focused on Public Safety activities were not included in the sample of PCC and SBA projects.
Stimulate the demand for broadband, economic growth, and job creation.
o The PCC and SBA projects fostered the demand for broadband at the individual level. As of September 30, 2013, more than 800,000 households and more than 7,000 businesses were reported as subscribing to broadband as a result of SBA programs.
o CCI projects had a strong impact on promoting affordable pricing on a cost per MB basis, which may stimulate the demand for broadband, economic growth, and job creation in the future. Based on the data available from 82 CAIs interviewed by the evaluation study team, ASR found that these CAIs paid a median price of $111 per Mbps per month before BTOP, and a median of $1.50 per Mbps per month after connecting to BTOP-funded networks. Before BTOP, the median CAI subscription speed was 30 Mbps. After BTOP, the median subscription speed was 750 Mbps. The amount spent on broadband connectivity remained fairly constant, with median total monthly cost remaining steady at $1,500 per month.
o CCI grants in the evaluation study sample created more than 2,000 jobs due to project expenditures. PCC and SBA grants created a similar number of jobs, each generating at least 600 jobs in three and six reporting quarters, respectively.
CAIs interviewed during case study site visits paid a median price of $111 per Mbps per month before BTOP, and a median of $1.50 per Mbps per month after connecting to BTOP-funded networks.
4
Section 1. Introduction This section provides a description of the grantees selected for inclusion in the evaluation study and summarizes the methodology and data used as a basis for the case study reports and for this report.
1.1 Methodology
This Interim Report, and the case studies that support it, is part of a larger mixed-methods study of the social and economic impacts of BTOP. The methodology used for the analysis presented in this report is a comparative case study analysis of twenty-seven BTOP-funded projects. Case study analysis is a preferred strategy when “how” and “why” questions are raised and, through a mixed methods approach, is a complement to quantitative analysis.12 In June 2014, ASR will deliver a draft Final Report that quantitatively and qualitatively assesses the economic and social impact of BTOP grants (including CCI, PCC, and SBA projects). The centerpiece of the Final Report will be an assessment of how and to what extent BTOP grant awards have achieved economic and social benefits in areas served by the grantees. This assessment is expected to draw on both the qualitative results presented here and on further quantitative analysis described in Section 10, below.
To create this report, the evaluation study team used comparative case study analysis to evaluate the economic and social impacts of twenty-seven BTOP projects. The evaluation study team prepared case studies based on an analysis of activities leading to the acceptance and use of broadband Internet and computer technologies through field research, interviews, and analysis of secondary sources. PCC and SBA grantees were visited twice, once early in the project lifecycle to develop a baseline understanding of grant activities (described throughout the report as Round 1), and once near the end of the project lifecycle to better understand outcomes and impacts (described throughout the report as Round 2). The evaluation study team only made one visit to CCI grantees, and most CCI projects were not complete at the time of the site visit. ASR will contact each grantee during the second quarter of 2014 to understand the extent to which programs initially funded by BTOP are able to continue operating without BTOP funds. ASR will use the results from these follow-up interviews to round out the conclusions presented in the Final Report, to the extent possible.
1.2 Grants in the Evaluation Study Sample
NTIA selected eight PCC, seven SBA, and twelve CCI grants to provide a representative sample of projects for this evaluation study. The selection of grants was purposeful and not meant to yield a statistical sample. The BTOP Evaluation Study Design describes the process for selecting projects for the evaluation study.13 NTIA selected grants taking into consideration the wide variation of project goals, award and completion schedules, and targeted geographic areas. Logistical considerations, including budgetary and travel planning considerations, were also taken into account in making the selection of grants. The grantees selected for the study were under no obligation to participate, and some grants that were initially selected elected not to take part in the evaluation study. In these cases, NTIA identified a replacement. No grantees dropped out during the course of the study.
5
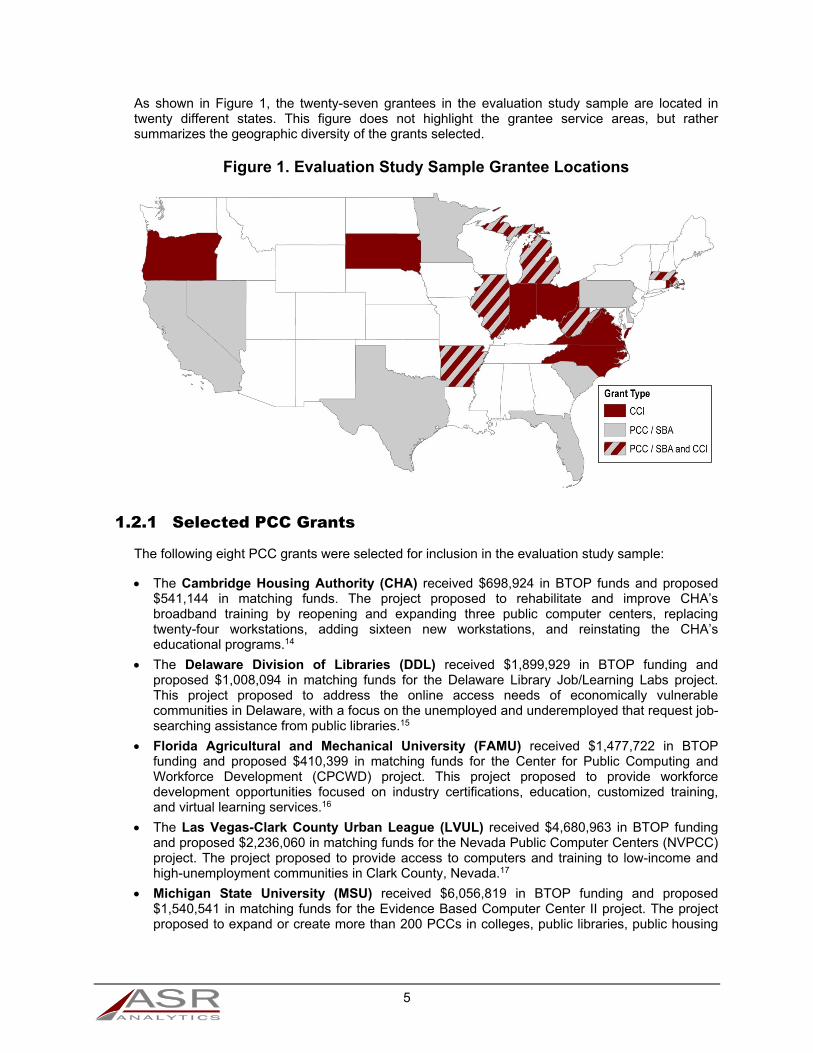
As shown in Figure 1, the twenty-seven grantees in the evaluation study sample are located in twenty different states. This figure does not highlight the grantee service areas, but rather summarizes the geographic diversity of the grants selected.
Figure 1. Evaluation Study Sample Grantee Locations
1.2.1 Selected PCC Grants
The following eight PCC grants were selected for inclusion in the evaluation study sample:
The Cambridge Housing Authority (CHA) received $698,924 in BTOP funds and proposed $541,144 in matching funds. The project proposed to rehabilitate and improve CHA’s broadband training by reopening and expanding three public computer centers, replacing twenty-four workstations, adding sixteen new workstations, and reinstating the CHA’s educational programs.14
The Delaware Division of Libraries (DDL) received $1,899,929 in BTOP funding and proposed $1,008,094 in matching funds for the Delaware Library Job/Learning Labs project. This project proposed to address the online access needs of economically vulnerable communities in Delaware, with a focus on the unemployed and underemployed that request job-searching assistance from public libraries.15
Florida Agricultural and Mechanical University (FAMU) received $1,477,722 in BTOP funding and proposed $410,399 in matching funds for the Center for Public Computing and Workforce Development (CPCWD) project. This project proposed to provide workforce development opportunities focused on industry certifications, education, customized training, and virtual learning services.16
The Las Vegas-Clark County Urban League (LVUL) received $4,680,963 in BTOP funding and proposed $2,236,060 in matching funds for the Nevada Public Computer Centers (NVPCC) project. The project proposed to provide access to computers and training to low-income and high-unemployment communities in Clark County, Nevada.17
Michigan State University (MSU) received $6,056,819 in BTOP funding and proposed $1,540,541 in matching funds for the Evidence Based Computer Center II project. The project proposed to expand or create more than 200 PCCs in colleges, public libraries, public housing

6
developments, tribal community centers, and other community support organizations across the State of Michigan and to equip them with about 2,400 computers.18
The South Carolina Technical College System (SCTCS) received $5,903,040 in BTOP funding and proposed $1,551,183 in matching funds for the Reach for Success project. The project proposed to provide PCCs to SCTCS students and members of the communities surrounding the technical colleges to increase their employability and to prepare them for successful careers.19
Technology for All (TFA) is a nonprofit organization that uses technology to create opportunities in low-income communities. TFA received $9,588,279 in BTOP funding and proposed $2,671,099 in matching funds for the Texas Connects Coalition (TXC2) project. The project proposed to create PCCs and networks that provide access to broadband technology, to promote computer literacy, and to permit digital inclusion for all Texans.20
WorkForce West Virginia (WFWV) is a state agency that seeks to increase employment, improve the quality of the workforce, and enhance job retention and earnings. WFWV received $1,901,600 in BTOP funds and proposed $568,000 in matching funds to for the One Stop Public Computer Center Modernization project. This project proposed to update nineteen employment resource centers across the state.21
1.2.2 Selected SBA Grants
The following seven SBA grants were selected for inclusion in the evaluation study sample:
The C.K. Blandin Foundation (C.K. Blandin) seeks to strengthen communities in rural Minnesota, especially the Grand Rapids area. C.K. Blandin received $4,858,219 in BTOP funding and proposed $1,525,777 in matching funds for the Minnesota Intelligent Rural Communities (MIRC) project. The MIRC project proposed to create technologically and economically vital rural communities by improving broadband adoption, job growth, and wealth creation opportunities. In addition to mobilizing eight statewide partners, the MIRC project funded eleven Demonstration Communities. Each of the Demonstration Communities independently designed and implemented a range of projects within a geographic community.22
The California Emerging Technology Fund (CETF) was established in 2005 as a nonprofit corporation by the California Public Utilities Commission (CPUC). CETF received $7,251,295 in BTOP funds and proposed $2,109,377 in matching funds for the Broadband Awareness and Adoption (BAA) project. The project proposed to facilitate broadband adoption in vulnerable communities in Los Angeles, the Central Valley, Orange County, San Diego, and the Inland Empire.23
The City of Chicago received $7,074,369 in BTOP funds and proposed $1,769,066 in matching funds for the Smart Chicago project. The project proposed to improve the quality of life of residents in target communities through digital technology and the Internet by increasing the programmatic depth of existing broadband awareness and adoption efforts.24
Connect Arkansas is a private, nonprofit organization promoting economic growth within Arkansas. Connect Arkansas promotes broadband education, use, and access throughout the State of Arkansas. Connect Arkansas received $3,702,738 in BTOP funding and proposed $1,037,247 in matching funds for the Expanding Broadband Use in Arkansas Through Education project. The project proposed to improve economic competitiveness, to improve healthcare provision, and to increase technology use among Arkansans.25
The Foundation for California Community Colleges (FCCC) provides funding and learning opportunities for students in the California Community College (CCC) system. FCCC received $10,944,843 in BTOP funding and proposed $3,179,057 in matching funds for the California Connects project. The project proposed to provide access to broadband and training for digital literacy, workforce development, and lifelong learning.26 Two partners deliver FCCC grant services: the Mathematics, Engineering, Science Achievement (MESA) program, which serves first-generation community college students with demonstrated financial need and residents in

7
their communities; and the Great Valley Center (GVC), which offers noncredit courses and workshops for residents of California’s Central Valley.
Future Generations Graduate School (Future Generations) employs community-based approaches to addressing major social challenges. Future Generations received $4,461,874 in BTOP funding and proposed $1,160,092 in matching funds for the Equipping West Virginia’s Fire and Rescue Squads project. The project proposed to provide broadband access to West Virginians in low-income and rural communities.27
The Urban Affairs Coalition (UAC) operates and manages a wide range of programs, services, and public policy initiatives that focus on community issues within the Greater Philadelphia, Pennsylvania area. UAC received $11,804,015 in BTOP funding and proposed $5,623,966 in matching funds for the Freedom Rings project. The project proposed to reduce barriers to broadband adoption through programs for increased access, awareness, and digital literacy training.28
1.2.3 Selected CCI Grants
The following twelve CCI grants were selected for inclusion in the evaluation study sample:
Clearwave Communications (Clearwave) is a facilities-based communications company that offers a range of telecommunications services to business and residential companies. Clearwave received $31,515,253 in BTOP funding and proposed $13,879,767 in matching funds for the Illinois Broadband Opportunities Partnership (IBOP) – Southern project. This project proposed to deploy a high-speed, fiber-based middle mile network across a twenty-three county region in southern Illinois to improve broadband access for CAIs in rural and economically distressed communities.29
The Executive Office of the State of West Virginia (West Virginia), as a member of the West Virginia Broadband Deployment Council, works to make broadband affordable and accessible to all West Virginians. West Virginia received $126,323,296 in BTOP funding and proposed $33,500,000 in matching funds to expand existing broadband infrastructure and the state’s microwave public safety network. The project proposed to add 900 miles of fiber and connect more than 1,000 CAIs.30
Lane Council of Governments (LCOG) is an association of local governments that provides member governments with services that include regional planning, coordination, program-development, and service delivery. LCOG received $8,325,530 from NTIA and proposed $2,113,505 in matching funds. LCOG proposed to improve a high-speed, fiber-optic backbone and deploy a new fiber-optic network across Lane County, Douglas County, Klamath County, and the Klamath Tribal regions in western Oregon. The project also proposed to improve broadband access for CAIs in rural and underserved communities.31
Massachusetts Technology Park (MassTech), a public agency that fosters economic development in Massachusetts, is composed of three divisions. One of these divisions, the Massachusetts Broadband Institute (MBI), was created to work with municipalities and broadband service providers to bridge the digital divide in Massachusetts. MassTech received $45,445,444 from NTIA and proposed $26,200,000 in matching funds to implement the MBI: MassBroadband 123 (MB123) project. The project proposed to deploy a high-speed, fiber-based network in western Massachusetts to provide the region with the same broadband connectivity available in the eastern part of the state.32
MCNC was founded in 1980 to stimulate economic development through technology research and initiatives. MCNC received $75,757,289 from NTIA and proposed $35,760,038 in matching funds to implement the North Carolina Rural Broadband Initiative (NCRBI) project. The project proposed to expand the work proposed in MCNC’s other CCI project by building a 100 Gbps middle mile infrastructure, including a 3 Mbps wireless network.33
Merit Network, Inc. (Merit) is a nonprofit broadband service provider that manages networks for education and nonprofit institutions throughout the State of Michigan. NTIA awarded Merit
8
$33,289,221 to implement the Rural Education Anchor Community Healthcare Michigan Middle Mile Collaborative (REACH-3MC) project. Merit proposed $8,322,306 in matching funds. The project proposed to deploy a high-speed, fiber-based middle mile network through Michigan’s Lower Peninsula to serve institutions, businesses, and households.34
The Mid-Atlantic Broadband Cooperative (MBC) provides telecommunications solutions to isolated rural communities in southern Virginia. MBC received $16,044,290 from NTIA and proposed $4,011,073 in matching funds to implement the Middle Mile Expansion for Southern Virginia. The project proposed to expand MBC’s existing fiber network to reach K-12 schools, community institutions, and industrial parks in seventeen counties and five cities in southern Virginia.35
OneCommunity is a nonprofit organization dedicated to accelerating the adoption of information technologies to drive economic development and support health, education, and government services in northeast Ohio. OneCommunity received $44,794,046 from NTIA and proposed $25,188,433 in matching funds to implement the Transforming NE Ohio project. The project proposed to build 900 miles of new fiber and leverage its existing network to connect CAIs throughout the twenty counties in northeastern Ohio.36
OSHEAN is a consortium of nonprofit organizations that seeks to provide innovative Internet-based technology solutions to its members and their communities. OSHEAN received $21,739,183 from NTIA and proposed $10,737,808 in matching funds to implement the Beacon 2.0 project. The project proposed to expand and upgrade OSHEAN’s Beacon 1.0 612-mile fiber network initially built in Rhode Island to connect up to 50 new CAIs in Rhode Island and Massachusetts.37
South Dakota Network, LLC (SDN) is owned by seventeen independent telecommunications companies, and provides centralized equal access and wholesale long distance services for its Members, state and local government entities, schools, financial institutions, and healthcare providers. SDN received $20,572,242 from NTIA and proposed $5,100,000 in matching funds to implement Project Connect South Dakota. The project proposed to add to its existing fiber-optic network to serve CAIs in rural and underserved areas of the state.38
The University of Arkansas System (UAS) has more than 66,000 students and 17,000 employees distributed across 6 main campuses, a medical school, 2 law schools, and several community colleges. UAS received $102,131,393 and proposed $26,450,427 in matching funds to implement the Arkansas Healthcare, Higher Education, Public Safety, and Research Integrated Broadband Initiative, later renamed the Arkansas e-Link project. The project proposed to improve telemedicine opportunities, extend fiber connections to higher education institutions, and upgrade existing higher education connections.39
Zayo Bandwidth, LLC (Zayo) is a division of the Zayo Group, LLC that provides bandwidth infrastructure services, including dark fiber, Internet Protocol (IP) transport, and carrier-neutral colocation. Zayo received $25,140,315 from NTIA and proposed $10,700,000 in matching funds to implement the Indiana Middle Mile Fiber for Schools, Communities, and Anchor Institutions project. The project proposed to deploy a 626-mile fiber-optic network to provide up to 10 Gbps connections to 21 Ivy Tech campuses.40
1.3 Data
The evaluation study team used computer-assisted qualitative data analysis software to identify common features in cases and to prepare data for analysis. Data were categorized by focus area, as described below, and activities, outcomes, and impacts were identified, compared, and contrasted across projects to develop an understanding of common features, as well as features that were unique to particular cases. This report uses the following definitions:
Activity: Actions performed or products created that reach targeted participants or populations. Activities lead to outcomes. Examples include workshops, meetings, development of products, training, counseling, assessments, and media outreach.41 While some CCI grantees performed

9
some of these activities, examples of CCI-specific activities include the upgrade and construction off fiber and microwave networks.
Outcome: Changes or benefits for individuals, families, groups, businesses, organizations, and communities. Outcomes include short-term results, defined as changes in awareness, knowledge, attitudes, skills, opinions, aspirations, or motivations, and medium-term results, defined as changes in behavior, practice, decision-making, policies, or social action.42
Impact: Long-term changes in a condition, including social, economic, civic, or environmental.43
Broadband: High-speed wireline or fixed wireless Internet service that has two-way data transmission with advertised speeds of at least 768 kbps upstream (upload) and at least 3 Mbps downstream (download).44
Vulnerable Population: groups that have historically lower rates of broadband adoption, including low-income individuals, the unemployed, seniors, children, minorities, and people with disabilities.45
The evaluation study team analyzed data from multiple sources, including interview transcripts, background reports, and grantee-provided data, to produce the individual case studies summarized in this report.46 As shown in Table 1, the evaluation study team performed a total of 413 site visit interviews between July 2011 and November 2013. The forty-two case study reports ASR delivered to NTIA referenced data from 872 files. Some documents may be referenced in both Round 1 and Round 2 PCC and SBA case study reports.
Table 1. Site Visit Summary Statistics
Project Type Site Visit Dates Total Number of Interviews and Focus Groups*
Total Number of Files Referenced†
PCC and SBA: Round 1 July – December 2011 118 239
PCC and SBA: Round 2 January – June 2013 131 223
CCI June – November 2013 164 410
Total 413 872
* Excludes follow-up conversations † Excludes interview transcripts, site visit notes, and e-mails
The evaluation study team also analyzed quantitative data on each of the selected grants, where possible. BTOP grantees are required to report their project progress to NTIA through the submission of five Performance Progress Reports (PPR) each year: one per calendar quarter plus one annual report (APR). ASR received the PPRs and APRs from NTIA each quarter between December 2010 and December 2013. As of December 2013, ASR had obtained 13 quarterly backups and analyzed data from 2,555 PPRs and 760 APRs. This analysis excludes seven public safety grants, which NTIA asked ASR to exclude from the analysis of social and economic impacts. ASR will request the most recently approved PPRs and APRs from NTIA in April 2014 (see Section 10.12.3 for more information). If these data are available, ASR will provide a final quantitative summary of grantee activities in the Final Report.
1.4 Focus Areas
This report describes the social and economic benefits of BTOP projects the evaluation study team visited in terms of six focus area categories:

10
Workforce and Economic Development: This focus area includes activities intended to increase overall employment of the target population, or to assist employed members of that population in finding jobs that offer increased salaries, better benefits, or a more attractive career path, including self-employment.
Education and Training: This focus area includes activities that lead to a certificate or diploma that would typically be awarded by an educational institution, or that indicates the recipient has received training that is recognized as valuable for career advancement.
Healthcare: This focus area includes broadband-enabled activities that improve the health of program participants or that of someone else. Activities performed by healthcare institutions as a result of BTOP grants, such as improvements in the provision and administration of healthcare services, are also included in this category.
Government Services: This focus area identifies how broadband improves services provided by government organizations to the public and includes both the provision and administration of public safety activities.
Quality of Life/Civic Engagement: This focus area includes activities that create stronger and more integrated communities and those that promote interaction between citizens and their governments.
Digital Literacy: This focus area is fundamental to all the others. Digital literacy defines a set of skills and abilities that enable an individual to interact with the digital aspects of culture and to maintain a digital identity.
A summary of the most frequently occurring project activities and the prominent impacts described by grantees in the evaluation study sample are provided below, organized by these focus area.
1.4.1 Workforce and Economic Development PCC and SBA: The most prevalent impacts reported by grantees include unemployed patrons
obtaining employment, underemployed patrons obtaining a higher-paying position, and patrons earning promotions. BTOP grants enabled individuals to realize these benefits by offering training and workshops, by providing access to computers with broadband, and by providing one-on-one assistance to enable users to effectively search and apply for jobs online. Grant-funded training programs often resulted in participants developing or refining their digital literacy and job readiness skills, both of which improved their ability to obtain employment. Grantees also reported that training programs and workshops enabled businesses and entrepreneurs to use digital tools and establish or enhance a web presence.
CCI: Observations reported by interviewees indicated that CCI grants most commonly resulted in businesses and organizations realizing improved productivity, although grantees were not required to track and report these benefits. CCI grant-funded fiber networks enabled businesses and CAIs to operate bandwidth-intensive tools and systems with improved functionality and to implement new internal tools or applications to support operations. Although grant-funded fiber networks had only recently been completed, some interviewees reported instances of companies expanding operations, and in doing so spurring job growth in target communities. CCI project outputs helped businesses more readily access the resources necessary to conduct operations, which allowed them to expand operations, to improve the quality or range of services, and to lower consumer prices.
1.4.2 Education and Training PCC and SBA: Education and Training impacts most often cited by interviewees included
students enrolling in a degree program and students obtaining a Certificate of High School Equivalency or another certificate. Students obtained a Certificate of High School Equivalency most often by gaining skills or knowledge that complements classroom instruction, a result of the computer and broadband access available at PCCs, and by participating in grant-sponsored educational training programs. Students often used the PCCs to complete coursework. Gaining
11
digital literacy skills through one or more grant-funded services was often the catalyst for students to enroll in a degree-conferring program.
CCI: Observations reported by interviewees indicated that educational institutions, including K-12 schools, school districts, and institutions of higher learning, realized the most benefits in this focus area. The impact cited across the largest number of CCI grants was the expansion of course or program offerings, which allowed CAIs to offer more online courses to their students. CAIs also reported productivity and efficiency increases, and improved academic performance, although grantees were not track and report to quantify these benefits. These impacts resulted from three activities: adopting new broadband-intensive tools, improving the functionality of existing tools, and accessing resources through broadband, such as cloud services.
1.4.3 Healthcare PCC and SBA: Although some PCC and SBA grantees offered activities and resources related
to healthcare, grantees had limited data related to observed improvements in patients’ health. Access to computers with broadband, training, and guidance enabled participants to obtain health-related information and to manage their own health, or the health of family and friends. However, few projects included in the evaluation study sample reported instances of participants improving their health as a result of these endeavors during the observation period. Grantees were not required to track and report these impacts.
CCI: Observations reported by interviewees indicated that healthcare providers realized the majority of benefits in this focus area. Improved provider efficiency was the most frequently observed impact among the projects included in the evaluation study sample. Interviewees also reported patients benefiting from improved care. These impacts were most often a result of improvements to provider services and, in some cases, providers offering a new type of service to patients, or expanding existing services to a new geographic area. Connecting to grant-funded networks enabled providers to improve services and to expand operations by adopting new bandwidth-intensive applications and improving existing broadband-dependent tools and systems.
1.4.4 Government Services PCC and SBA: This focus area is not included in the analysis of PCC and SBA impacts.
CCI: CAIs most commonly reported that obtaining a faster and more reliable connection increased web-based information sharing, improved communication, enhanced system security, and saved financial and personnel resources. The most commonly reported impact among interviewees was the proliferation of online government services and content resulting from web-based information sharing within and among organizations. Some interviewees reported efficiency gains. Enhancing the reliability of communication systems also helped to ensure the continuity of government and public safety services in emergencies.
1.4.5 Quality of Life/Civic Engagement PCC and SBA: Grant activities, such as digital literacy training and the provision of computers
with broadband access at PCCs, helped individuals to access government content online, create digital media content, and communicate with family, friends, and neighbors. Some grantees reported that this resulted in increased political and civic participation, improved social connections, volunteerism, and the ability to obtain legal rights and privileges, including citizenship.
CCI: Many of the CAIs interviewed by the evaluation study team had recently obtained connectivity to CCI fiber networks, and thus had collected limited data related to Quality of Life/Civic Engagement impacts. However, interviewees did report outcomes likely to lead to impacts in the near future. Enhanced connectivity improved the functionality of existing systems, enabling CAIs to help patrons more effectively access online government resources and to
12
strengthen social connections. Most interviewees reported using the increased bandwidth to improve the quality of existing services or expand the range of programs and resources available to patrons. For example, libraries reported increasing e-book circulation after obtaining improved connectivity through CCI grants.
1.4.6 Digital Literacy PCC and SBA: Digital literacy is fundamental to achieving benefits in all other focus areas. All
of the PCC and SBA grants included in the evaluation study sample offered digital literacy training and access to grant-funded computers with broadband connectivity, resulting in a group of individuals with a new or improved digital skillset. Digital literacy impacts overlap with those described within other focus areas, such as obtaining employment or improving academic performance.
CCI: Digital literacy was a less common focus among CCI interviewees. Some CAIs delivered digital literacy training programs, including instructor-led courses and self-paced individual learning activities. Other CAIs provided individuals with access to broadband connections over grant-funded fiber networks. Through these services, CAI patrons gained or improved digital literacy skills. Digital literacy skills improved patrons’ ability to engage in economic, social, and community life, and access entertainment online. In most instances, although digital literacy training was available and delivered to individuals, it was not possible for grantees to measure or observe outcomes.
13
Section 2. Workforce and Economic Development Impacts This section describes the Workforce and Economic Development impacts of the BTOP projects in the evaluation study sample. This focus area includes activities intended to increase overall employment of the target population, or to assist employed members of that population in finding jobs that offer increased salaries, better benefits, or a more attractive career path, including self-employment. Workforce and Economic Development activities can be performed for one’s own benefit, or they may be done on behalf of another person to assist with their employment situation. In order for project activities to be included in the Workforce and Economic Development focus area, it must be the intention of the grantee to assist members of the workforce in improving their employment outcomes, and project resources must be devoted to this purpose.
The evaluation study team gathered data related to focus area impacts from evaluation study participants during site visits. The following subsections present a summary of the economic and social benefits described in case study reports.
2.1 Workforce and Economic Development Potential Benefits
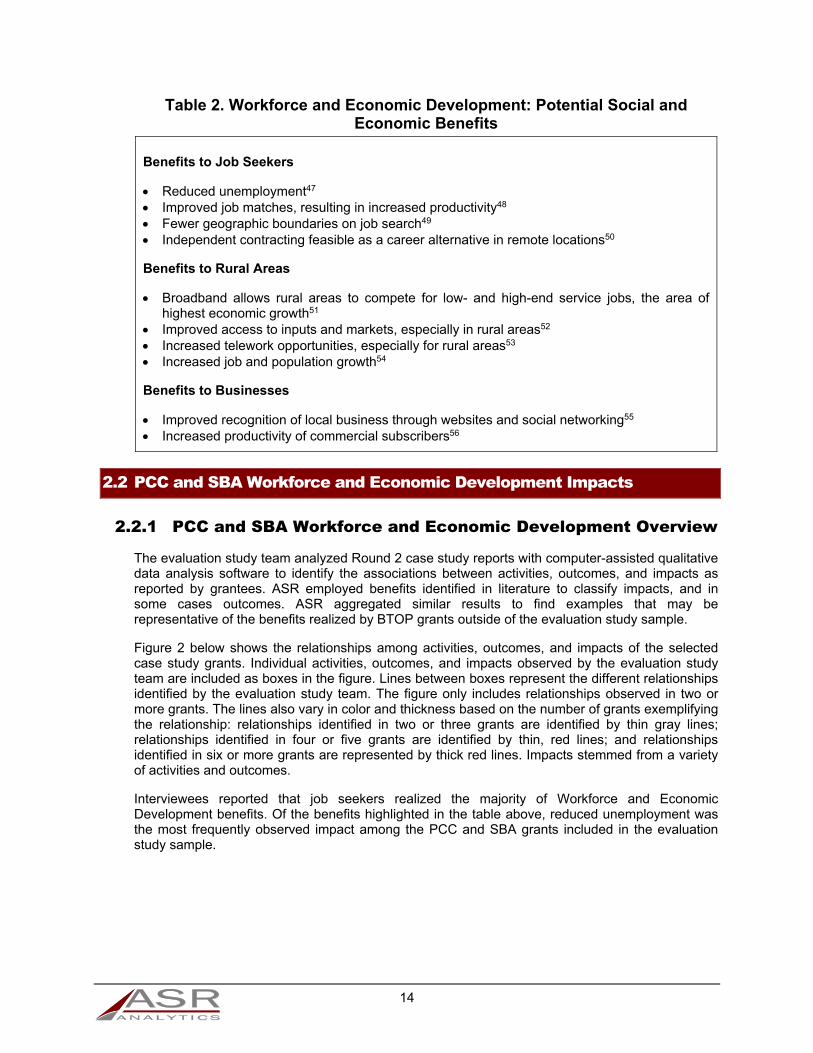
Table 2 presents potential social and economic impacts related to Workforce and Economic Development defined in Interim Report 1, organized as benefits to job seekers, rural areas, and businesses.
14
Table 2. Workforce and Economic Development: Potential Social and Economic Benefits
Benefits to Job Seekers
Reduced unemployment47 Improved job matches, resulting in increased productivity48 Fewer geographic boundaries on job search49 Independent contracting feasible as a career alternative in remote locations50
Benefits to Rural Areas
Broadband allows rural areas to compete for low- and high-end service jobs, the area of highest economic growth51
Improved access to inputs and markets, especially in rural areas52 Increased telework opportunities, especially for rural areas53 Increased job and population growth54
Benefits to Businesses
Improved recognition of local business through websites and social networking55 Increased productivity of commercial subscribers56
2.2 PCC and SBA Workforce and Economic Development Impacts
2.2.1 PCC and SBA Workforce and Economic Development Overview
The evaluation study team analyzed Round 2 case study reports with computer-assisted qualitative data analysis software to identify the associations between activities, outcomes, and impacts as reported by grantees. ASR employed benefits identified in literature to classify impacts, and in some cases outcomes. ASR aggregated similar results to find examples that may be representative of the benefits realized by BTOP grants outside of the evaluation study sample.
Figure 2 below shows the relationships among activities, outcomes, and impacts of the selected case study grants. Individual activities, outcomes, and impacts observed by the evaluation study team are included as boxes in the figure. Lines between boxes represent the different relationships identified by the evaluation study team. The figure only includes relationships observed in two or more grants. The lines also vary in color and thickness based on the number of grants exemplifying the relationship: relationships identified in two or three grants are identified by thin gray lines; relationships identified in four or five grants are identified by thin, red lines; and relationships identified in six or more grants are represented by thick red lines. Impacts stemmed from a variety of activities and outcomes.
Interviewees reported that job seekers realized the majority of Workforce and Economic Development benefits. Of the benefits highlighted in the table above, reduced unemployment was the most frequently observed impact among the PCC and SBA grants included in the evaluation study sample.

15
Figure 2. PCC and SBA Workforce and Economic Development Impacts
The subsections below define the activities, outcomes, and impacts presented in the figure above. Select PCC and SBA case study grants provide examples to illustrate impacts.
2.2.2 PCC and SBA Workforce and Economic Development Activities
Activities include services or products implemented by grantees that reached targeted participants or populations. The primary activities that led to impacts were training and workshops, providing access to computers with broadband, and one-on-one assistance.
Training and workshops
o Job seekers: These training programs and workshops focused on the development of job readiness skills and employer- or industry-specific knowledge. Workforce-specific training programs assisted participants in résumé creation, interview preparation, and effective job searching.57 Most projects offered training in computer and Internet basics, which helped to prepare new computer users to participate in workforce-specific training programs.58 Grant-funded workshops also included special events to improve employment outcomes, such as a recruiting session with a local employer or a job fair.59
o Businesses and entrepreneurs: Some grantees offered training programs and workshops specifically targeting small businesses. These programs often focused on teaching participants about the benefits of broadband for businesses, the use of digital tools, and building a web presence.60
Access to computers with broadband
o Job seekers: Broadband and computer access facilitates patrons’ ability to apply for jobs in the modern job market. Because many employers require the submission of online applications, access to computers and the Internet is necessary to apply for and obtain
16
employment.61 In addition to broadband connectivity, grant-funded computers may be equipped with software or applications specifically designed to aid job seekers, such as a résumé-building program.62
o Businesses and entrepreneurs: Grantees provided resources necessary to launch or grow a business. Computers with broadband connectivity enable business owners and entrepreneurs to access free or low-cost digital resources such as crowdfunding websites, social media and other marketing channels, and small business development assistance.63
One-on-one assistance: Staff members supporting grant activities assisted patrons in PCCs or other facilities hosting grant-funded activities. Staff members provided personalized guidance and instruction, enabling participants with varying levels of computer literacy to complete tasks and achieve objectives. This activity was particularly important for patrons with limited computer skills who needed to submit a job application for a position that did not require computer skills.64 Staff members also helped business owners and entrepreneurs use digital tools to improve business operations.65
2.2.3 PCC and SBA Workforce and Economic Development Outcomes
The activities described above lead to the following outcomes, among others: the acquisition of digital literacy skills, the ability to successfully search and apply for jobs online, and in some cases, the development of job readiness skills. Often a combination of these activities and outcomes enhanced users’ ability to obtain employment.
Searching and applying for jobs: Access to computers with broadband, one-on-one guidance, and participation in training programs enabled patrons to effectively search and apply for jobs online. Patrons used online job boards, company websites, and employment search engines to identify relevant open positions. Patrons could apply for open positions by completing online applications, creating résumés, and communicating electronically with potential employers. Many grant-funded workstations are available without time restrictions, allowing patrons to submit applications that took more time online to complete than the time allotted on other publicly available computers.66
Digital literacy skills: Acquiring digital literacy skills enables an individual to interact with the digital aspects of culture and to maintain a digital identity. Job seekers gained digital literacy skills by participating in training programs or dedicating time and effort in an open lab setting, which included self-paced learning activities and receiving one-on-one assistance.67
Job readiness skills: Grantees provided training, workshops, resources, and personalized assistance to strengthen participants’ job readiness skills. Acquiring job readiness skills helps job seekers improve their interviewing ability, learn how to dress professionally, network, and communicate with potential clients, employers, and colleagues, or, in the case of entrepreneurs, communicate with contractors, investors, and partners. These skills may prepare participants for specific positions or industries, or improve their ability to acclimate to and succeed in a professional setting.68
Digital tools: Through project activities including training and workshops, one-on-one assistance, and access to computers with broadband, businesses learned to implement efficiency-enhancing tools, including Microsoft Office, QuickBooks, and Square.69
Enhanced web presence: Businesses participated in training programs and workshops, or received individualized assistance. Participants learned how to use social media tools to reach customers, how to develop and operate an effective website, and how to communicate with customers by e-mail or on business review sites, such as Yelp.70
Access to customers/clients: Grant-funded resources and services enabled independent business owners and entrepreneurs to use broadband to interact with clients. Contractors used web-based communications tools to send quotes, proposals, and product information to current and potential customers.71
17
2.2.4 PCC and SBA Workforce and Economic Development Impacts
The most prevalent impacts in this focus area include employment, independent contracting or entrepreneurial endeavors, and benefits to businesses. The following list provides illustrative examples drawn from case study reports.
Obtain employment: The acquisition of digital literacy skills, development of job readiness skills, the ability to search and apply for jobs online, or a combination of these outcomes resulted in participants obtaining a job or promotion.72 While several projects included in the evaluation study sample reported instances of job seekers obtaining employment, grantees were not required to report this information and the majority of the projects did not have a mechanism in place to track the number of jobs obtained. Projects that did report the number of jobs obtained relied on patrons to self-report their employment. Reported impacts will, therefore, likely understate the total number of jobs obtained, as some newly employed patrons may not return to grant-funded sites to report their employment.
o Delaware Division of Libraries (DDL): DDL Job Centers reported that patrons obtained 420 job offers between July 2011 and March 31, 2013 due to grant-funded resources and services. Patrons’ acquisition of employment was a result of access to computers and broadband to facilitate job searching, independent learning, and, in some cases, digital literacy skills.73
o Technology for All (TFA): The project assisted job seekers in obtaining employment by providing access to computers and Internet-based resources and by offering guidance in searching and applying for jobs. TFA supplemented the provision of these resources by offering workforce and digital literacy training programs. As of April 25, 2013, TFA staff reported that 802 patrons of Haven for Hope, which offers resources for the homeless, had obtained employment. TFA partners estimated that 25 to 30 percent of job seekers using PCCs obtained at least short-term employment.74
o California Emerging Technology Fund (CETF): The Canal Alliance, a partner of the CETF subrecipient Latino Community Foundation, incorporated training on job search techniques, basic résumé construction, and cover letter writing into its digital literacy classes. It has found that current job market conditions make the use of e-mail, Craigslist, and online job applications key aspects of a more successful job search. Broadband users often found jobs after the Canal Alliance’s training and many did not return for additional employment assistance.75
Independent contracting or entrepreneurial endeavors: Participants successfully started or improved entrepreneurial endeavors using grant-funded resources. Users learned to implement web-based tools to launch an idea or to improve and grow their independent business.76 Participants increased their client base by developing or enhancing their web presence and using electronic communication tools to interact with current and potential clients.77
o Florida Agricultural and Mechanical University (FAMU): Entrepreneurs used the grant-funded workspace and technology resources for operating their small, private businesses to sustain or increase their income. Staff assisted small business owners in developing skills to enhance their businesses and increase profits. Impacts realized by small businesses and entrepreneurs include securing contracts, increasing client bases, and developing skills to improve operational efficiency and increase profits.78
Start or grow businesses: Training programs for businesses promoted the usefulness of Internet-based technologies to improve operational efficiency and grow customer bases. Entrepreneurs and small business owners benefited from gaining the knowledge necessary to leverage Internet-based resources, such as websites and social media networks, to enhance their marketing platforms.79 Representative examples of PCC and SBA grants that benefited businesses include:
o C.K. Blandin Foundation (C.K. Blandin): C.K. Blandin’s project partner University of Minnesota Extension (UME) offered training to entrepreneurs and small businesses, providing 306 workshops to 2,082 unique businesses and 4,206 attendees, as of
18
December 2012. Staff members reported that the training increased the percentage of businesses that had a digital presence, and that participating businesses increased their digital presence at a greater rate than those that did not participate. In addition, Minnesota Renewable Energy Marketplace (MNREM), a project partner, provided training and assistance to small businesses, primarily in the renewable energy sector, on the use of Internet-based technologies. MNREM reported that business owners were able to develop the skills to improve their business operations, and some small business owners found part-time contracting work.80
o City of Chicago: The City of Chicago’s Smart Communities program created the Business Resource Network (BRN), an initiative designed to help local businesses become sustainable, profitable entities by providing them with free access to broadband, business software, and technology workshops. BRNs offered technology consulting services to support small and medium-size businesses in the Smart Communities. As of December 2012, BRN consultants provided technology assessments for 461 community businesses in the service area, resulting in 335 technology action plans focused on adopting digital technologies and implementing online marketing strategies. BRNs distributed 100 desktop computers to business owners who completed BRN training. Some entrepreneurs established their businesses by leveraging the support of BRNs and other grant-funded services.81
o Florida Agricultural and Mechanical University (FAMU): The grantee provided small and minority businesses with workforce training focused on industry certifications and virtual learning. FAMU also delivered a Construction Management Development Program to small and disadvantaged businesses. Upon completion, participants earned a certification of proficiency, enabling businesses to participate in the Florida Department of Transportation Bond Guarantee Program.82 As of June 2013, ten business owners in three Florida counties had completed the training. One participant reported obtaining a contract with the state upon receiving a small business designation due to grant-funded activities.83
2.2.5 PCC and SBA Workforce and Economic Development Longitudinal Analysis
The purpose of the longitudinal analysis is to compare observations from Round 1 with observations from Round 2 to identify changes over time. The evaluation study team will use these data in the Final Report to assess the impact of BTOP. In Interim Report 1, the evaluation study team presented a selection of baseline activities and outcomes observed during site visits conducted between July and December 2011 for each of the five focus areas presented in Interim Report 1. The evaluation study team identified data elements to measure potential benefits, based on the data grantees reported collecting or intended to collect.
During Round 2 site visits, performed between January and June 2013, the evaluation study team obtained the data related to the potential benefits defined in Interim Report 1 from case study participants, when such information was available. Data collected during Round 2 site visits indicate that grant-provided programs and resources successfully supported job seekers’ ability to improve employment outcomes and aided entrepreneurs in starting and growing businesses.
Taking training to improve employment outcomes
o Delaware Division of Libraries (DDL): DDL provided employment-related training, including résumé writing, Microsoft Word, interview workshops, and career acceleration workshops. DDL provided 6,614 hours of Workforce Development training to 3,966 patrons as of March 31, 2013. Job Center patrons received more than 420 job offers between July 2011 and March 31, 2013. 84
o Technology for All (TFA): TFA provided access to training focused on basic computer skills and workforce readiness. Through the end of 2012, TFA delivered more than 290,000 hours of Workforce and Economic Development training to more than 17,000
19
participants.85 These statistics did not include Certificate of High School Equivalency training or certified training programs, which were reported in the Education and Training focus area.
Performing work for pay or as part of career development
o Michigan State University (MSU): MSU provided internship programs for MSU students and students of community college partners. Students learn to configure, troubleshoot, and install computers in PCCs and train PCC attendants to use the computers. As of December 2012, the grantee trained 673 MSU and community college student interns to help with the configuration, delivery, and installation of new equipment. At the time of the site visit, the internship program had ended. Family Educational Rights and Privacy Act (FERPA) restrictions prohibited contacting the students for success stories. However, research conducted by the National Association of Colleges and Employers indicates that an internship significantly increases the likelihood of receiving a full-time job offer.86 Interns received IT training and hands-on practice as they worked alongside coordinators to install BTOP workstations and other equipment.87
o City of Chicago: The City of Chicago provided students with a paid technology internship at a business, government agency, or nonprofit organization. The Digital Youth Summer Jobs (DYSJ) program matched sixty teens to technology-focused summer internships in the summers of 2010 and 2011. Participants with perfect attendance earned a MacBook computer paid for by the grant and broadband connectivity through an AirCard donated by Sprint. In total, the program distributed 118 MacBooks and AirCards.88 Sprint donated AirCards with six months of service to the first graduates of the DYSJ program donated additional AirCards to Smart Communities netbook recipients. The grantee provided the results of the study Digital Excellence in Chicago, but this study did not point to outcomes or impacts of the DYSJ program.
Entrepreneurial activities
o DDL: DDL conducted entrepreneurship workshops in partnership with the Delaware Economic Development Office (DEDO). DDL continued its relationship with DEDO and the Grassroots Plus program for part of the grant period. However, DDL and DEDO discontinued this partnership. As a result, there is limited information on the impact of the entrepreneurship workshops.89
o Connect Arkansas: Connect Arkansas provided entrepreneurship training, including the development, establishment, and operation of online businesses. As of March 31, 2013, Connect Arkansas provided entrepreneurship education to 144 high school classes throughout Arkansas. Through the Entrepreneurship Curriculum, 2,108 students learned to use the Internet to engage in entrepreneurial endeavors.90 As of April 2013, no students had taken advantage of the free three-year hosting opportunity that was available. Connect Arkansas believes that students were not interested in the hosting service because they viewed the campus edition’s subdomain as an obstacle. Connect Arkansas is unable to monitor traffic for the student-created websites.91
Operating one’s business online
o C.K. Blandin Foundation (C.K. Blandin): C.K. Blandin provided training and assistance to small businesses in the renewable energy sector with the use of broadband-based technologies, including topics such as getting found on the web, using social media, broadband for businesses, using Quick Response (QR) codes and smart grids, and how to hire a web developer. Through the end of 2012, a state partner provided 1,687 hours of training to small businesses in the renewable energy sector. A survey of businesses found that, although businesses perceived broadband as very important, fewer than 50 percent of the respondents used it before the training. One Demonstration Community reported that many business owners were able to develop the skills to improve their business operations, and some small business owners were able to find part-time contracting work helping other small businesses adopt broadband-based technologies.92
20
o Connect Arkansas: Connect Arkansas created a web-based community referral network known as SourceLink to promote entrepreneurial growth by linking small and start-up business owners with federal, state, and local resources. Connect Arkansas provides complete access to the website free of charge to support as many businesses and new ventures as possible. Between February 1 and April 3, 2013, 6,275 unique users visited Arkansas SourceLink. The BizTracker system was the only system in place at the time of the site visit to determine whether entrepreneurs obtained the resources needed. However, BizTracker is used only if users are having trouble finding the appropriate resources. There is no way of tracking the experience of users who do not intentionally seek assistance using BizTracker. Relatively few users have contacted Arkansas SourceLink for assistance. There were five entries in the BizTracker system as of April 2013.93
o City of Chicago94: The City of Chicago established community networks that connect firms with the right broadband services and applications, software, hardware, databases, and other computer resources, workshops, and training opportunities for their needs. As of December 2012, Business Resource Network (BRN) consultants provided technology assessments for 461 community businesses in the service area, resulting in 335 technology action plans that encouraged business owners to streamline operations. In addition, 100 business owners received desktop computers for participation in BRN training. Participants improved existing businesses by implementing social media marketing, mobile point-of-sale systems, and other tools identified in BRN technology action plans.95
2.2.6 Potential Future PCC and SBA Workforce and Economic Development Impacts
Other benefits within Workforce and Economic development, such as obtaining a position considered to be a better match for the job seeker, are more difficult to measure quantitatively. Certain activities can improve the likelihood that a user is able to achieve such a benefit.96 While grantees often assisted patrons in using resources and tools that would yield a better job match, they did not measure the extent to which this benefit occurred.
Several grantees provided resources and services supporting job seekers or small businesses, although grantees had limited data related to observed impacts.97 Projects that achieved similar outcomes, but did not collect quantitative or qualitative data related to impacts, include those described below. These potential impacts are not included in the analysis above and they may or may not occur.
South Carolina Technical College System (SCTCS): Local business owners used PCCs to perform activities to improve operations and grow their enterprises. The PCCs’ resources enabled business owners to draft contracts and submit bids for work, participate in training to gain proficiency in Microsoft Excel, and create marketing plans and material.98 These outcomes could result in improved results for business participants.99
Connect Arkansas: Websites enabled small business participants to establish or enhance their online presence and strengthen their marketing strategies, to increase their customer base, and to increase revenue. As of March 28, 2013, seventy small business participants had created a fully functional website or made substantial progress toward completing one through the Website in a Day class.100 Small business participants establishing a web presence could lead to improved recognition among current and potential customers.101
WorkForce West Virginia (WFWV): Job seekers developed digital literacy skills during the training sessions provided at the computer centers specifically aimed at using online tools and resources to search for jobs, to prepare and submit applications, and to network with employers. Job applicants also list their digital literacy skills on their résumés.102 Job seekers who participated in training, and thereby enhanced their digital skillset, improved their ability to search and apply for jobs, and increased their chance of obtaining employment.103
21
2.3 CCI Workforce and Economic Development Impacts
2.3.1 CCI Workforce and Economic Development Overview
The evaluation study team analyzed CCI case study reports with computer-assisted qualitative data analysis software to identify the associations between activities, outcomes, and impacts as reported by grantees. ASR employed benefits identified in literature to classify impacts, and in some cases outcomes. ASR aggregated similar results to find examples that may be representative of the benefits realized by BTOP grants outside of the evaluation study sample.
Figure 3 below shows the relationships among activities, outcomes, and impacts of the selected case study grants. Individual activities, outcomes, and impacts observed by the evaluation study team are included as boxes in the figure. Lines between boxes represent the different relationships identified by the evaluation study team. The figure only includes relationships observed in two or more grants. The lines also vary in color and thickness based on the number of grants exemplifying the relationship: relationships identified in two or three grants are identified by thin gray lines; relationships identified in four or five grants are identified by thin, red lines; and relationships identified in six or more grants are represented by thick red lines. Impacts stemmed from a variety of activities and outcomes.
CCI projects support Workforce and Economic Development activities by providing infrastructure to support the growth of new and existing businesses. Observations reported by interviewees indicated improved productivity was the most frequently observed impact among the projects included in the evaluation study sample. Several interviewees also reported benefiting from improved access to inputs and markets. Although a short time had elapsed since the construction of the grant-funded fiber networks, some interviewees reported instances of communities benefiting from job growth.
Figure 3. CCI Workforce and Economic Development Impacts

22
The subsections below define the activities, outcomes, and impacts presented in the figure. Select CCI case study grants provide examples to illustrate impacts.
2.3.2 CCI Workforce and Economic Development Activities
Activities include services or products implemented by CAIs and partners that reached targeted participants or populations. The primary activities that led to impacts were providing improved access to resources, adopting new internal tools or services, and making improvements in the functionality of bandwidth-intensive applications.
Improved functionality of bandwidth-intensive tools, applications, or systems: The bandwidth provided through the grant-funded fiber connections enables CAIs and project beneficiaries to use applications and systems previously hindered by bandwidth limitations.104
Improved access to resources: New and improved fiber networks enabled CAIs and partners to obtain the broadband-intensive resources necessary to conduct operations more efficiently, including obtaining resources at a lower per unit cost or obtaining the resource from nearby suppliers.105
Adopt new tools and services: Increased bandwidth and improved network reliability obtained by connecting to grant-funded fiber enabled CAIs, partners, and project beneficiaries to implement new tools and applications to support organizational operations.106
2.3.3 CCI Workforce and Economic Development Outcomes
The activities described above lead to the following outcomes: resource savings, improved quality/range of service delivered to customers, expansion of operations, enhanced human or intellectual capital, and in some cases lower consumer prices.
Save resources: Several businesses and CAIs interviewed obtained bandwidth at a lower price or implemented bandwidth-intensive systems to reduce the financial, time, or personnel resources required to complete tasks or objectives.107 Saving resources also includes enhancements to the security of systems that reduce disruptions to operations.108 Individuals may also realize resource saving outcomes such as dedicating less time or money to complete a task.109
Expand operations: Businesses use the improved access to resources, improved functionality of existing systems, and new applications to increase the amount of output generated. This includes increasing production within current facilities, establishing additional facilities for operations, and increasing the frequency or quantity of service delivery.110
Strengthen human/intellectual capital: Business and CAIs use the improved functionality of existing applications or implement new tools to strengthen the skills or knowledge of employees or staff members.111 Individuals using tools and applications are able to complete training or instructional activities.112
Improved quality/range of service delivered to customers: Improved access to resources and the improved functionality of existing systems enable businesses and CAIs to improve the quality or increase the variety of services delivered to customers.113 For example, access to reliable connectivity improves an organization’s ability to deliver services to customers.114
Lower prices for goods and services: Improved access to resources enables companies to reduce prices, passing savings on to customers.115
2.3.4 CCI Workforce and Economic Development Impacts
The most prevalent impacts in this focus area include improving productivity, access to inputs and markets, and job and population growth. The following list provides illustrative examples drawn from case study reports.
23
Improved productivity: Saving resources enables organizations to devote those resources to more productive channels.116 Strengthening the intellectual capital within an organization improves productivity by enabling employees to accomplish more challenging tasks or accomplish similar tasks with fewer resources.117 Improved productivity also includes enabling employees to telecommute in the event of severe weather or other instances that would prevent onsite attendance.118
o Zayo Bandwidth, LLC (Zayo): Improved network connectivity enables the Utilities District of Western Indiana (UDWI), a customer of Zayo, to realize a substantial improvement in the capabilities of its meter-reading system. Before connecting to fiber, employees required thirty seconds to read an individual meter and twelve hours to complete a full meter data collection. It now takes less than two seconds to read an individual meter and four hours to complete a full meter data collection.119
o Merit Network, Inc. (Merit): South Central Michigan Works! (SCMW) promotes employment by helping job seekers find jobs and by working with businesses to ensure an adequately skilled workforce. It is one of twenty-five regional Michigan Works agencies and the only one to receive service through Merit’s project. SCMW serves over 800 employers comprising two-thirds of the employers in Lenawee, Hillsdale, and Jackson Counties. Employers encourage employees to take SCMW's free computer classes to acquire digital skills, thereby increasing workplace productivity. The improved connectivity allows SCMW to offer these classes more efficiently to more students.120
Job and population growth: Businesses that expand operations into new geographic territories, businesses that increase production, and businesses that improve service delivery create and improve employment opportunities within communities.121 Businesses that improve the range of services offered may hire additional employees to support new company divisions.122 Job growth may be realized within specific industry sectors, such as a community realizing an increase in the number of service jobs.123
o Mid-Atlantic Broadband Cooperative (MBC): ICF International (ICF), a government and private sector consulting firm, recently opened a new facility in Martinsville, VA, largely due to MBC’s fiber network, which offers a high degree of reliability. Broadband connectivity is crucial for ICF, whose business needs include high-quality, high-capacity bandwidth and near 100 percent network reliability.124 ICF commenced a major telephony upgrade involving the construction of a new call center for managing market research. ICF customer service operations created 539 permanent jobs.125
o Merit Network, Inc. (Merit): MiSpot is an ISP that provides fixed wireless services to several areas in the northern half of the Lower Peninsula of Michigan. The increased access to middle mile fiber in its service area has allowed MiSpot to expand its business, and it has grown from four to eighteen employees. MiSpot’s parent company has also added several employees to provide technical support for MiSpot’s networking equipment.126
Access to inputs and markets: Businesses are able to increase their customer base by expanding operations, offering new products or services, selling at a new price point, or improving the quality of goods and services.127
o MBC: The high degree of reliability offered by MBC has enabled ICF to shift to 24/7 operations, resulting in the acquisition of new business contracts. ICF interviewees stated that they could not have acquired these contracts before transitioning to twenty-four-hour operations. This represents an expansion into new markets for ICF, which typically manages federal government contracts.128
o MBC: Shentel uses the MBC network to provide last mile broadband service in rural markets where it did not previously have a presence. A representative of Shentel remarked that MBC’s network reliability and wholesale pricing are significantly better than those of incumbent middle mile carriers. The lower prices MBC offered to Shentel result in lower retail prices for its customers, making Internet access available and affordable in rural markets.129
24
Obtain a job: Individuals who gained knowledge and skills improved their employability or performance in current engagements.130
o SDN: The BTOP grant provided funding to update the equipment in Mitchell Technical Institute’s (MTI) telecommunications lab. This new equipment provides students with modern training for technical jobs. MTI also uses the equipment to provide continuing education and training for existing SDN staff members. The up-to-date training that the students at MTI are receiving due to the new equipment has resulted in a 20 percent wage increase for graduates.131
o Clearwave Communications (Clearwave): John A. Logan College, a Clearwave customer, in partnership with Southern Illinois Healthcare (SIH), a private sector healthcare provider, established a nursing simulation and learning lab. The center offers local programs for nurses who require training for professional development, and will likely offer training for emergency medical service (EMS) technicians in the future. The establishment of the simulation and learning lab created five jobs immediately. The center uses broadband connectivity to deliver training in nursing and healthcare jobs to program participants.132
2.3.5 Potential Future CCI Workforce and Economic Development Impacts
Several projects provided resources and services targeting business and job growth, although grantees had limited data related to observed impacts.133 Projects that achieved similar outcomes, but did not collect quantitative or qualitative data related to impacts, include those described below. These potential impacts are not included in the analysis above and they may or may not occur.
Executive Office of the State of West Virginia (West Virginia): Connecting to the state’s education network provides teachers with opportunities to engage in online professional development activities during the day. The West Virginia Department of Education (WVDE) provides online professional development courses. Teachers are allotted time during the school day to complete training. Before the grant, limited bandwidth restricted teachers’ ability to complete online courses while instructional activities were taking place.134 Completing professional development programs is likely to improve teacher productivity and increase earning potential and career opportunities for participating teachers.135
OSHEAN: With the increased bandwidth for customers on the Beacon 2.0 network, the Taunton Municipal Lighting Plant (TMLP) is implementing demand-based services that enable more efficient energy delivery to customers. Communicating with customers via smart meters allows TMLP to idle large-scale energy-consuming equipment when it is not needed. TMLP estimated this could save customers about 20 to 30 percent on their energy bills. TMLP currently provides this service to a small number of large commercial customers. TMLP intends to expand the service to all customers, which would reduce energy consumption and utility bills.136 These bandwidth-intensive smart technologies are likely to improve TMLP’s operational productivity by reducing the amount of manual resources required to monitor and control energy use and delivery.137
Zayo: Sitco, a wireless Internet Service Provider (ISP), intends to improve wireless Internet service to current customers by increasing the speed and quality of service. Sitco reported that Zayo’s presence lowered the price of transport services. Connecting to Zayo’s fiber will allow Sitco to improve the speed tiers available to consumers without increasing prices. Sitco customers can purchase four different service packages, ranging in price from $39 to $69 per month, with each speed tier costing an additional $10 per month. Sitco will triple the speeds of the three lowest tier packages and double the speed of the fastest package without raising prices.138 Offering faster speeds without raising prices could help Sitco attract or retain customers.139
25
Section 3. Education and Training Impacts This section describes the Education and Training impacts of the BTOP projects in the evaluation study sample. This focus area includes activities that lead to a certificate or diploma that would typically be awarded by an educational institution, or that indicates the recipient has received training that is recognized as valuable for career advancement. Examples of certificates or diplomas include: community college degrees, four-year college degrees, advanced degrees, general equivalency degrees, certifications in advanced software technologies such as network engineering, and other licenses or certifications that reflect knowledge of a particular subject at a level that would typically be taught at an educational institution.
The evaluation study team gathered data related to focus area impacts from evaluation study participants during site visits. The following subsections present a summary of the economic and social benefits described in case study reports.
3.1 Education and Training Potential Benefits
Table 3 presents the potential social and economic benefits related to Education and Training identified in literature and defined in Interim Report 1.
Table 3. Education and Training: Potential Social and Economic Benefits
Benefits to Students
Improved student performance140 Improved educational resources for nontraditional or disabled students and students in
geographically remote areas or poor districts141 Increased levels of education142 More personalized educational activities143 Increased student-teacher engagement through social networking144
Benefits to Teachers
Increased teacher productivity145
Benefits to School Districts
Increased school enrollment rates146 Improved interaction among students, parents, teachers, and school administrators147 Lower-cost, more effective training of workers148
3.2 PCC and SBA Education and Training Impacts
3.2.1 PCC and SBA Education and Training Overview
The evaluation study team analyzed Round 2 case study reports with computer-assisted qualitative data analysis software to identify the associations between activities, outcomes, and impacts as reported by grantees. ASR employed benefits identified in literature to classify impacts, and in

26
some cases outcomes. ASR aggregated similar results to find examples that may be representative of the benefits realized by BTOP grants outside of the evaluation study sample.
Figure 4 below shows the relationships among activities, outcomes, and impacts of the selected case study grants. Individual activities, outcomes, and impacts observed by the evaluation study team are included as boxes in the figure. Lines between boxes represent the different relationships identified by the evaluation study team. The figure only includes relationships observed in two or more grants. The lines also vary in color and thickness based on the number of grants exemplifying the relationship: relationships identified in two or three grants are identified by thin gray lines; relationships identified in four or five grants are identified by thin, red lines; and relationships identified in six or more grants are represented by thick red lines. Impacts stemmed from a variety of activities and outcomes.
Of the potential benefits listed in Table 3, the impacts most often cited by interviewees on site visits included students increasing their level of education, which includes enrolling in a degree program, obtaining a Certificate of High School Equivalency, or earning another certification.
Figure 4. PCC and SBA Education and Training Outcomes and Impacts
The subsections below define the activities, outcomes, and impacts presented in the figure above. Select PCC and SBA case study grants provide examples to illustrate impacts.
3.2.2 PCC and SBA Education and Training Activities
Activities include services or products implemented by grantees that reached targeted participants or populations. The primary activities that led to impacts were the provision of public computer centers, training programs, and computer workstations.
Public computer centers: The grantee or other participating organizations make a lab equipped with computers and broadband available to the public or a particular population, for example, parents of students.149 Some computer centers provided special software or adaptive
27
equipment that helped individuals achieve educational outcomes.150 This activity also includes informal help from computer center staff.151
Educational training: Grantees provided training programs using grant funds in schools or with educational outcomes in mind. These activities included task-specific workshops and training programs such as Microsoft Office Certification training or Certificate of High School Equivalency preparation courses.152
Computers in class: The grantee or other participating organizations use grant funds to purchase desktops, laptops, tablets, and broadband connections for use in a classroom at K-12 or higher education institutions.153
Computers at home: The grantees used grant funds to distribute desktop computers, laptops, tablets, and subsidies for home broadband to individuals. These individuals included members of vulnerable populations, or participants of other grantee activities.154
Digital literacy training: Grantees provided training in basic computer and Internet skills.155
3.2.3 PCC and SBA Education and Training Outcomes
The activities described above lead to the following outcomes: new skills or knowledge, acquisition of digital literacy skills, and support with coursework.
Skills or knowledge that align with curriculum: Individuals gained skills or knowledge that complemented classroom instruction. Skills that helped students get accepted to a degree program or obtain a scholarship are also included in this category. This outcome was most often the result of education and training activities, including training on applications that helped students excel in school, get into college, or pass a certification exam.156 It was also the result of students using computers to play educational games or access other online tools, such as tutorials.157
Complete coursework: Students completed homework, studied for and took tests, and accessed online classroom management systems. This also includes taking a class entirely online. Individuals primarily achieved this outcome after gaining access to computers through open labs or subsidized home computers.158 Some students also used classroom computers.159
Digital literacy skills: Individuals became more proficient with computers, Internet resources, and technology in general. These digital literacy skills led to impacts through training programs and open lab access.160
Personalized education: Students, teachers, and parents used computers and broadband to create interactive and personalized educational experiences.161 For example, students could engage directly with an interactive website designed to recognize and accommodate individual needs, instead of following along as a teacher interacts on behalf of an entire class.162 This outcome also includes student-teacher networking through online discussion boards outside of class, and parent engagement that helps provide students with personalized guidance.163
3.2.4 PCC and SBA Education and Training Impacts
The Education and Training impact that occurred most frequently students obtaining increased levels of education. Eleven of the PCC and SBA grants included in the evaluation study sample reported observing this impact. Some grantees also reported students improving academic performance. The following list provides illustrative examples drawn from case study reports.
Increased levels of education: Students obtained a Certificate of High School Equivalency or another certificate, enrolled in higher education, or graduated from degree-conferring programs. Individuals who received a Certificate of High School Equivalency or another certification most often participated in activities that helped them develop skills and knowledge that aligned with the certification exam.164 Obtaining digital literacy skills through grantee-provided training and open lab access aided individuals in leveraging online and computer-based resources to
28
prepare for examinations, to search and apply for school admission, to apply for scholarships and financial aid, and to use the Internet to enroll in classes.165 Those who graduated from a degree program used computer centers or grant-funded computers to complete school assignments and access distance learning activities that helped them graduate.166 Others leveraged training to develop the skills necessary to complete coursework necessary to graduate.167
o Foundation for California Community Colleges (FCCC): Community college students participated in grant-funded education training on Microsoft software. After gaining skills in software applications including Word, Excel, Outlook, PowerPoint, and Access, students passed 1,119 Microsoft certification exams as of March 31, 2013.168
o Delaware Division of Libraries (DDL): The grantee collaborated with other organizations to provide education training to those seeking a high school diploma. DDL staff members estimated that, by September 2013, as many as fifty users obtained a high school diploma after gaining the necessary skills in the training.169
o Urban Affairs Coalition (UAC): Public housing residents who completed eight hours of digital literacy training were eligible to receive a free netbook. The training and free netbook program helped residents gain digital literacy skills that enabled them to enroll at a local community college. By the end of June 2013, 150 graduates of the program registered for credit classes at Community College of Philadelphia (CCP).170
o Florida Agricultural and Mechanical University (FAMU): The grantee provided opportunities for students to receive technology training through volunteer and internship programs. Several students completed an internship program and gained technology skills that helped them get accepted to college with a major in audio and video engineering.171
Improved academic performance: Students enrolled in K-12 schools improved their grades and performance in school.172 These impacts were observed in conjunction with grantees providing computers to schools or individuals, and conducting educational training. Access to computers helped teachers create more personalized educational environments in schools and helped students develop curriculum-specific skills by playing educational games online.173 Educational and digital literacy training helped students develop skills and knowledge aligned with school curriculum, and helped parents become more engaged in their children’s education.174
o C.K. Blandin Foundation (C.K. Blandin): A parent who received a home computer reported that her son has improved his grades because of the educational games available. In another location, a school district was able to purchase forty iPads for teacher and student use in K-12 classrooms. Teachers reported that students were more engaged and that performance increased significantly when students received access to the iPads.175
o Technology for All (TFA): During an eight-week course, Austin Free-Net (AFN) conducted training in six Austin Independent School District (AISD) schools, serving more than eighty parents who, through an eight-week course, gained the computer skills necessary to improve educational achievement for their children.176
3.2.5 PCC and SBA Education and Training Longitudinal Analysis
The purpose of the longitudinal analysis is to compare observations from Round 1 with observations from Round 2 to identify changes over time. The evaluation study team will use these data in the Final Report to assess the impact of BTOP. In Interim Report 1, the evaluation study team presented a selection of baseline activities and outcomes observed during site visits conducted between July and December 2011 for each of the five focus areas presented in Interim Report 1. The evaluation study team identified data elements to measure potential benefits, based on the data grantees reported collecting or intended to collect.
During Round 2 site visits, performed between January and June 2013, the evaluation study team obtained the data related to the potential benefits defined in Interim Report 1 from case study
29
participants, when such information was available. The data show that grant-provided programs and resources successfully supported outcomes and impacts, including obtaining diplomas, Certificates of High School Equivalency, and other certifications; using computers to complete coursework and apply to educational programs; increasing parental involvement in children’s education; improving preparation for the job market; and increasing English language skills to further education and careers.
Researching a degree or certificate program
o South Carolina Technical College System (SCTCS): SCTCS provided one-on-one assistance at campus libraries and Academic Success Centers (ASC) to qualified individuals looking to begin or continue a college education. Lab moderators were stationed in each of the PCCs to provide one-on-one assistance to students. The site visit team observed the moderators providing this assistance to students at Trident Community College, but interviewees did not track outcomes from this activity.177
Taking a class or online training that leads to a professional certification, degree, or Certificate of High School Equivalency
o Delaware Division of Libraries (DDL): DDL provided access to online courses through LearningExpress. DDL patrons engaged in 5,575 LearningExpress sessions from May 2011 to April 2013. The case study report presents the monthly data.178
o DDL: DDL provided adult education courses for students to earn Certificates of High School Equivalency and high school diplomas. Over the course of the award period, DDL delivered 6,740 hours of education training to 2,642 patrons. 1,660 hours of this training were targeted at adult Certificate of High School Equivalency education, and 1,435 patrons attended these Certificate of High School Equivalency sessions. DDL staff members estimate that twenty Job Center patrons obtained a Certificate of High School Equivalency and forty to fifty obtained a high school diploma by September 2013.179
o Cambridge Housing Authority (CHA): CHA provided middle and high school students access to computers and training geared toward improving skills for successful performance in college and assistance in using the computers to research and apply to colleges online. Each PCC serves roughly 45 Work Force students, ranging in age from 13 to 18, totaling 130 to 135 students annually (52 percent female and 48 percent male).180 The grantee reported that the BTOP-funded computer labs have strengthened the program and student outcomes. Students are able to access homework and supplementary materials to increase academic success. They are also able to use online resources to search for and apply to college and scholarships. In addition, the program offers internships for students. Eighty percent of the students placed in the Work Force program’s exploratory jobs receive “competent” or “advanced” evaluation ratings from employer-mentors. The evaluation study team observed a ninth grade Work Force class where students were preparing for an informational visit to Draper Laboratories, a nonprofit research and development organization. Students used the PCCs to research positions at the firm and draft questions for employees. This research assignment helped students to maximize their learning experience at the facility and to converse with employees.181
Administrative activities associated with course instruction
o SCTCS: SCTCS provided training in student financial aid. The grantee provided training in how to apply for financial aid to 264 individuals by the end of 2013.182
Activities complementing classroom instruction
o Foundation for California Community Colleges (FCCC): FCCC provided web-based Microsoft Office training through the Microsoft IT Academy. As of March 31, 2013, MESA students had passed 1,119 Microsoft certification exams. MESA staff provided ASR with data that strongly suggested that study materials provided through California Connects increase students’ likelihood of passing certification exams. Students’ average passing rate was more than eight times greater when a Microsoft-certified specialist introduced test
30
takers to the Microsoft IT Academy and GMetrix, a software program that generated practice tests structured to mimic Microsoft certification tests.183
o FCCC: FCCC provided basic digital literacy, Internet basics, and broadband service selection training through the Great Valley Center (GVC). As of March 31, 2013, 3,301 individuals had graduated from the GVC training program.184 Many GVC trainees were parents who can now use e-mail and learning management systems to maintain connections with teachers and school administration. The evaluation study team also heard examples of parents using online learning resources, search engines, and Google Translate to support their children’s educational needs.185
o FCCC: FCCC provided free laptops to community college students and required the students to provide computer training on topics of importance to their community. Training topics included basic computer use, e-mail, Skype, online banking, and Microsoft Excel. As of June 2013, California Connects distributed 5,799 laptops with up to 6 months of free broadband service to MESA programs at partner community colleges.186 MESA students had trained 10,871 individuals as of March 31, 2013.187 Students reported that they were able to devote more time to schoolwork because the laptops provided convenient, mobile access to broadband and Microsoft Office software.188 MESA directors reported instances of students using their laptops to create application materials to acquire scholarships, internships, and jobs.189
o SCTCS: SCTCS provided students with notebooks and iPod Touch rentals. Across the college system, more than 300 mobile devices such as laptops, tablets, and iPads were available for user checkout and use on or off campus for up to one week, making it more convenient for students to study and complete coursework for a variety of courses as part of their college curriculum. 190
Learning English or another language using online tools
o Technology for All (TFA): TFA provided access to language-based training, such as English for Speakers of Other Languages (ESOL), literacy improvement programs, and IBM's Reading Companion. Across the TFA project, staff delivered nearly 130,000 hours of ESOL training. Incorporating computers into ESOL training resulted in patrons improving both English-language skills and digital literacy skills.191
o CHA: CHA provided ESOL training for working-age, low-income adult residents of public housing through the Gateways program. Through the end of 2012, 692 students had participated in 35,066 hours of Gateways training. The grant-funded computers and the digital literacy skills gained through the Gateways program improved participants’ ability to interact with their children’s schooling and monitor academic progress. The acquisition of digital literacy and English skills improved users’ ability to pursue career objectives and participate in community activities.192
3.2.6 Potential Future PCC and SBA Education and Training Impacts
Several grantees provided resources and services with educational objectives, although grantees had limited data related to observed impacts.193 Projects that achieved similar outcomes, but did not collect quantitative or qualitative data related to impacts, include those described below. These potential impacts are not included in the analysis above and they may or may not occur.
Las Vegas-Clark County Urban League (LVUL): College and university students used the computer lab to take web-based and continuing education courses. Staff helped students navigate through websites to access their courses online and to use the computers more effectively.194 When these outcomes occurred in other projects, impacts included improved academic performance and students graduating from their degree programs.195
California Emerging Technology Fund (CETF): The Chicana/Latina Foundation, a project subrecipient, developed a train-the-trainer program that was successful in training parents to access information on students’ progress toward academic goals, including class schedules, reports from teachers, and grades. The grantee reported that parents who received training are

31
more comfortable participating in their children’s education, including being more likely to visit the school and ask questions, and more aware of the activities of the local educational system. Parents were also able to use e-mail to communicate with teachers and administrators.196
In addition to the benefits to students described above, some benefits to schools could happen in the future, including improving student retention. For example:
SCTCS: The grantee anticipated improved retention and increased enrollment in the South Carolina Technical College System due to the grant-funded upgrades. Computer center staff reported that grant-funded basic computer training helped students who struggled with computer skills to pass a required introductory computer course. Improved bandwidth also allowed the colleges to provide online video tutorials, which helped students learn to navigate online curriculum components.197
3.3 CCI Education and Training Impacts
3.3.1 CCI Education and Training Overview
The evaluation study team analyzed CCI case study reports with computer-assisted qualitative data analysis software to identify the associations between activities, outcomes, and impacts as reported by grantees. ASR employed benefits identified in literature to classify impacts, and in some cases outcomes. ASR aggregated similar results to find examples that may be representative of the benefits realized by BTOP grants outside of the evaluation study sample.
Figure 5 below shows the relationships among activities, outcomes, and impacts of the selected case study grants. Individual activities, outcomes, and impacts observed by the evaluation study team are included as boxes in the figure. Lines between boxes represent the different relationships identified by the evaluation study team. The figure only includes relationships observed in two or more grants. The lines also vary in color and thickness based on the number of grants exemplifying the relationship: relationships identified in two or three grants are identified by thin gray lines; relationships identified in four or five grants are identified by thin, red lines; and relationships identified in six or more grants are represented by thick red lines.
CAIs that received grant-funded connections realized impacts primarily at the organizational level, although interviewees also reported some individual impacts to students and teachers. The improved connectivity enabled CAIs to adopt new broadband-based tools, to improve the functionality of existing tools, and to access remote resources. These activities helped CAIs improve services, save resources, and collaborate with other organizations. They also helped improve student-teacher and parent-school interactions. The impacts cited by the largest number of CCI projects were expanded course offerings, increased productivity, and improved student academic performance. Some projects also helped to maintain or increase enrollment at educational institutions.
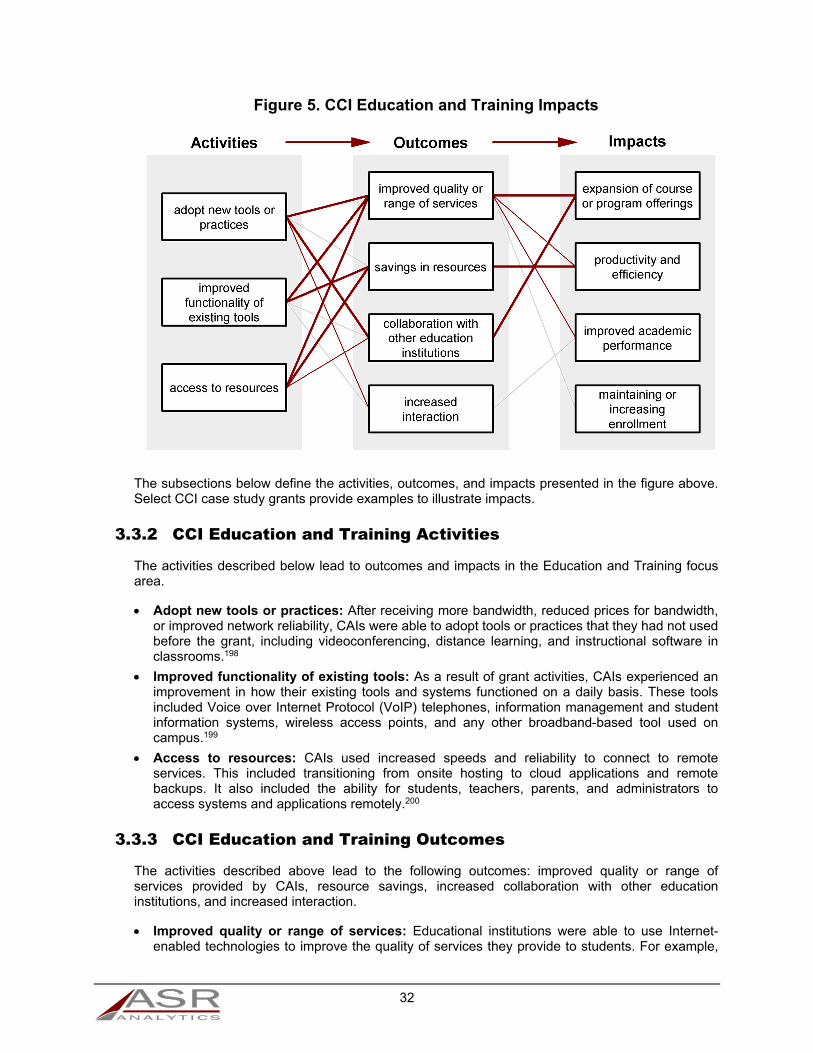
32
Figure 5. CCI Education and Training Impacts
The subsections below define the activities, outcomes, and impacts presented in the figure above. Select CCI case study grants provide examples to illustrate impacts.
3.3.2 CCI Education and Training Activities
The activities described below lead to outcomes and impacts in the Education and Training focus area.
Adopt new tools or practices: After receiving more bandwidth, reduced prices for bandwidth, or improved network reliability, CAIs were able to adopt tools or practices that they had not used before the grant, including videoconferencing, distance learning, and instructional software in classrooms.198
Improved functionality of existing tools: As a result of grant activities, CAIs experienced an improvement in how their existing tools and systems functioned on a daily basis. These tools included Voice over Internet Protocol (VoIP) telephones, information management and student information systems, wireless access points, and any other broadband-based tool used on campus.199
Access to resources: CAIs used increased speeds and reliability to connect to remote services. This included transitioning from onsite hosting to cloud applications and remote backups. It also included the ability for students, teachers, parents, and administrators to access systems and applications remotely.200
3.3.3 CCI Education and Training Outcomes
The activities described above lead to the following outcomes: improved quality or range of services provided by CAIs, resource savings, increased collaboration with other education institutions, and increased interaction.
Improved quality or range of services: Educational institutions were able to use Internet-enabled technologies to improve the quality of services they provide to students. For example,
33
CAIs were able to improve the process of standardized testing, provide technology in the classroom to enhance student engagement, and to increase access to Wi-Fi in student housing.201
Savings in resources: CAIs saved money or spent less staff time on tasks that were made more efficient through Internet-based technologies. While some CAIs saw savings after adopting new tools, this outcome was most often a result of improved functionality of existing tools and improved access to online resources.202
Collaboration with other education institutions: This outcome was a focus for many CCI projects. CAIs were able to collaborate better with other educational institutions, whether for research purposes, to improve course offerings, or to share other resources.203 This outcome was most often the result of adopting new tools or practices.204
Increased interaction: CAIs engage in activities that increased the quantity or quality of interactions between parents and schools, or between students and teachers.205 Individuals experienced this outcome most often after CAIs adopted new tools, including information systems that allowed parents and students to access them remotely, or classroom management applications that helped students interact with teachers outside of school.206
3.3.4 CCI Education and Training Impacts
The Education and Training impacts that occurred across the largest number of CCI projects were the expansion of course or program offerings and increased productivity. Each of these impacts occurred in at least nine different projects. CAIs reported improved academic performance in seven projects, and maintained or increased enrollment in three. The following list provides illustrative examples drawn from case study reports.
Expansion of course or program offerings: Grantees reported expanding course and program offerings as a result of improving services and collaborating with other education institutions.207 Most additional offerings were online classes, although some CAIs also offered new on-campus courses as a result of grant activities. CAIs were able to increase online course offerings because faster upload speeds allowed them to host classes on servers.208 Increased download speeds helped schools provide access to online classes for students while in classrooms.209
o OSHEAN: Increased capacity and access to affordable bandwidth through the new Beacon 2.0 network has facilitated the growth of the Community College of Rhode Island’s (CCRI) distance education program. CCRI reported that enrollment in the program increased by 112 percent between the fall 2012 and fall 2013 semesters. Without the improved broadband capacity, CCRI would not have been able to support the increase in students participating in distance education. As of September 2013, CCRI did not offer full degree programs via distance education, although many degree programs offered hybrid instruction options. CCRI is working toward developing the distance education program to offer Associate’s degree programs remotely.210
o MCNC: University of North Carolina at Pembroke (UNCP) is the third largest provider of online education in the University of North Carolina system in terms of the number of courses offered. UNCP offers a business entrepreneurship degree taught entirely online. Some on-site classes engage in interactive video communication with Richmond Community College and other community colleges for collaborative distance learning activities. While UNCP had capacity that was adequate to support online instruction, grant-funded connections to the North Carolina Research and Education Network (NCREN) made partnerships with community colleges possible.211
Productivity and efficiency: Saving resources enabled organizations to devote those resources to more productive uses. This impact was most often a result of improved access to cloud-based solutions that helped reduce staff time spent on maintenance and improved data transfer over a broadband connection.212
34
o Executive Office of the State of West Virginia (West Virginia): The fiber connection between the National Radio Astronomy Observatory (NRAO) and West Virginia University (WVU) provided by the grant has improved NRAO’s data-sharing capabilities and reduced research costs. Before the grant, the broadband connection serving NRAO was so limited that it could not support the transmission of datasets between NRAO telescopes and WVU. Datasets had to be saved on physical storage devices and driven from Green Bank to the university in Morgantown. This resulted in data collection delays of a week or more and required weekly travel of nearly 250 miles round trip. NRAO’s new fiber connection allows for the digital transmission of datasets, saving an estimated $250,000 per year in travel and data storage costs.213
o MCNC: Lee County Schools’ (LCS) connection to the NCREN has resulted in time savings for both technical and instructional staff. Increased bandwidth has facilitated the use of cloud-based applications, which eliminates the need for installation of software on students’ devices. As a result, technical staff are free to support instructional activities. A representative of LCS also expressed that the reliability of the new connection eliminates the need for teachers to spend extra time writing backup lesson plans in case their Internet-dependent plans cannot be used due to broadband service interruptions.214
Improved academic performance: Students in K-12 schools and institutions of higher learning were able to improve grades, pass tests, and increase standardized testing scores.215
o MCNC: Mooresville Graded School District (MGSD) administration believes its one-to-one computing initiative, supported by grant-funded connections to NCREN, has had significant impacts on student retention and performance. The graduation rate in MGSD has increased from 80 percent in 2008 to 93 percent in 2013, the second-highest district graduation rate in the state. In addition, attendance rates have risen, standardized test scores have improved in every subject, and teachers reported that students are more engaged.216
o Lane Council of Governments (LCOG): Since connecting to the new fiber network funded by the BTOP grant, Days Creek has been able to offer additional support for struggling middle school students. They have a four-day school week, but students who need extra help with schoolwork attend school on Fridays. This supplemental program is largely dependent on web content, including Achieve 3,000, which provides individualized instruction online for struggling students. The high school uses Assessment and Learning in Knowledge Spaces (ALEKS), a math tool that helps students track progress and assessment. Days Creek staff members reported that test scores have greatly improved because of this expanded educational opportunity.217
Maintaining or increasing enrollment: Some CAIs were able to improve student enrollment after adopting new tools or improving the functionality of existing tools, which enabled them to provide better services to students.218
o Clearwave: Southern Illinois University, a Clearwave customer, was not able to offer online programs to the extent that it wanted because of bandwidth constraints. The Clearwave connection has alleviated these constraints and allows Southern Illinois University to maintain enrollment without having to bring students to one campus.219
3.3.5 Potential Future CCI Education and Training Impacts
Although nearing completion at the time of the site visit, many of the CCI grants were still under construction. As a result, many CAIs had not yet been connected or had just received a connection. In these situations, interviewees discussed future potential impacts.220 Examples include those described below. These potential impacts are not included in the analysis above and they may or may not occur.
Massachusetts Technology Park (MassTech): The Southwick-Tolland-Granville Regional School District expects that the improved network connectivity will allow it to implement online standardized testing more reliably, with fewer interruptions in service. The connection is also

35
expected to allow the school to upload exams faster and to receive results more quickly. The superintendent reported that having results by the end of the school year, rather than the beginning of the following school year, would give teachers adequate time to adapt their curriculum to the results.221
Merit Network, Inc. (Merit): Lake Michigan College (LMC) IT staff members presented a model for shared services to their board. These could include consulting, managed hosting, and co-hosting services. For example, the college is interested in pursuing a partnership with another college to share data centers. This could allow LMC to receive better service for the same price. These potential partnerships are possible because of the 1 Gbps statewide network connecting institutions of higher learning.222
Clearwave Communications (Clearwave): Illinois Eastern Community Colleges (IECC) moved to a cloud-based solution for online education. IECC completed the shift from Angel, which IECC maintained in house, to Desire2Learn, a cloud-based solution. IECC is also exploring how to move its e-mail systems to the cloud. Moving to Microsoft Office 365, a web-based platform, will provide the benefits of cloud-based software, with the additional benefit that students would have access to Microsoft Office without requiring them to purchase it. This would save the students $70 to $100 each.223

36
Section 4. Healthcare Impacts This section describes the Healthcare impacts of the BTOP projects in the evaluation study sample. This focus area includes broadband-enabled activities undertaken by PCC and SBA projects to improve their own health or that of someone else. This definition includes not only sophisticated tasks such as viewing one’s medical records online, but also more common activities that might not involve a medical provider at all. In order for a program activity to be considered a Healthcare component of the project, it must be the grantee’s intention that the activity result in improved participation in self-care or care of others. Activities performed by healthcare institutions are intended to increase elements of the provision and administration of healthcare services.
The evaluation study team gathered data related to focus area impacts from evaluation study participants during site visits. The following subsections present a summary of the economic and social benefits described in case study reports.
4.1 Healthcare Potential Benefits
Table 4 presents the potential social and economic benefits related to Healthcare identified in literature and defined in Interim Report 1.

37
Table 4. Healthcare: Potential Social and Economic Benefits
Benefits to Patients
Improved patient information resulting from ease of accessibility, interactive features, and anonymity224
Improved patient choice of provider and treatment options225 Improved treatment outcomes for physical and mental illness226
Lower patient cost in time and transportation vs. telephone calls or face-to-face visits227 Improved patient care seeking228 More effective health promotion and disease prevention programs229 Faster, more accurate prescriptions230 Improved patient access to healthcare records and test results231 Reduction in duplicative paperwork and tests232 Improved ongoing care233 Improved patient outcomes by providing daily monitoring234 Reduced home care costs by reducing the number of unnecessary in-home visits235 Reduced hospital length of stay (LOS)236 Improved privacy and convenience in obtaining prescription medication or ordering
medications237 Greater availability of drugs for shut-in people, those who live far from a pharmacy, or those
in rural areas with limited pharmacy options238 Improved access to written product information239 Reduced cost of online prescription drugs240 Reduced drug interactions resulting from multiple prescriptions from different providers241 Improved patient-to-patient networking and support242
Benefits to Healthcare Providers
Cost savings from reduced unnecessary face-to-face time between health professionals and the “worried well”243
More convenient access to medical care because of asynchronous communications244 More complete medical records at lower cost245 Improved patient-provider relationship building246
Rapid information sharing among all healthcare providers for the same patient247
Improved appointment and treatment scheduling248 Improved range of health services249
4.2 PCC and SBA Healthcare Impacts
4.2.1 PCC and SBA Healthcare Overview
The evaluation study team analyzed Round 2 case study reports with computer-assisted qualitative data analysis software to identify the associations between activities, outcomes, and impacts as reported by grantees. ASR employed benefits identified in literature to classify impacts, and in some cases outcomes. ASR aggregated similar results to find examples that may be representative of the benefits realized by BTOP grants outside of the evaluation study sample.
Figure 6 below shows the relationships among activities, outcomes, and impacts of the selected case study grants. Individual activities, outcomes, and impacts observed by the evaluation study team are included as boxes in the figure. Lines between boxes represent the different relationships identified by the evaluation study team. The figure only includes relationships observed in two or
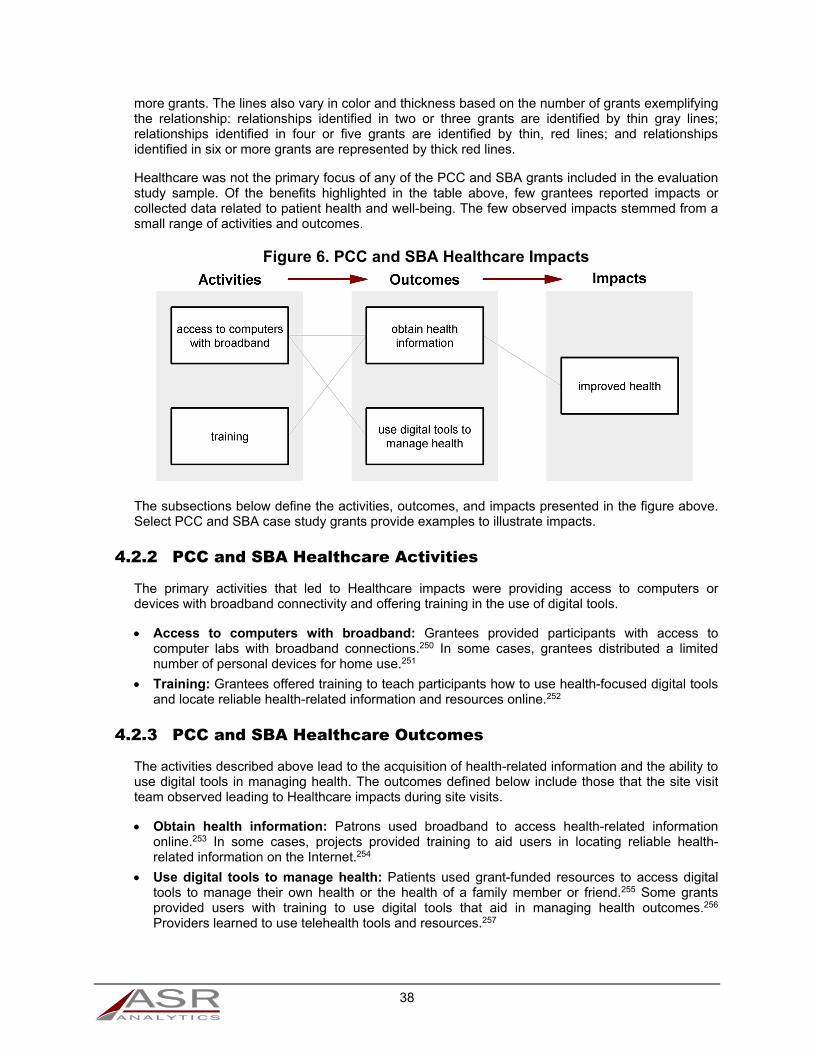
38
more grants. The lines also vary in color and thickness based on the number of grants exemplifying the relationship: relationships identified in two or three grants are identified by thin gray lines; relationships identified in four or five grants are identified by thin, red lines; and relationships identified in six or more grants are represented by thick red lines.
Healthcare was not the primary focus of any of the PCC and SBA grants included in the evaluation study sample. Of the benefits highlighted in the table above, few grantees reported impacts or collected data related to patient health and well-being. The few observed impacts stemmed from a small range of activities and outcomes.
Figure 6. PCC and SBA Healthcare Impacts
The subsections below define the activities, outcomes, and impacts presented in the figure above. Select PCC and SBA case study grants provide examples to illustrate impacts.
4.2.2 PCC and SBA Healthcare Activities
The primary activities that led to Healthcare impacts were providing access to computers or devices with broadband connectivity and offering training in the use of digital tools.
Access to computers with broadband: Grantees provided participants with access to computer labs with broadband connections.250 In some cases, grantees distributed a limited number of personal devices for home use.251
Training: Grantees offered training to teach participants how to use health-focused digital tools and locate reliable health-related information and resources online.252
4.2.3 PCC and SBA Healthcare Outcomes
The activities described above lead to the acquisition of health-related information and the ability to use digital tools in managing health. The outcomes defined below include those that the site visit team observed leading to Healthcare impacts during site visits.
Obtain health information: Patrons used broadband to access health-related information online.253 In some cases, projects provided training to aid users in locating reliable health-related information on the Internet.254
Use digital tools to manage health: Patients used grant-funded resources to access digital tools to manage their own health or the health of a family member or friend.255 Some grants provided users with training to use digital tools that aid in managing health outcomes.256 Providers learned to use telehealth tools and resources.257
39
4.2.4 PCC and SBA Healthcare Impacts
Due to data limitations, grantees had limited evidence to demonstrate improvements in patients’ health. The following list provides illustrative examples drawn from case study reports.
Improved health: Using computers with broadband access to obtain health-related information and digital tools to manage heath enabled some participants to improve their health conditions.258
o Florida Agricultural and Mechanical University (FAMU): The Bond Community Health Center’s Men’s Health Program used the Center for Public Computing and Workforce Development (CPCWD) to access the My Fitness Pal website and mobile application to promote healthier, more active lifestyles among uninsured or underinsured men. Participants used the CPCWD computers to access online resources and received training to use the technology to track caloric intake and exercise. The men learned healthier eating habits and developed exercise routines. The program manager reported that some participants lost weight and improved their health through the program.259
o Urban Affairs Coalition (UAC): Patrons improved their ability to care for themselves or family members suffering from a health-related issue. Social service organizations participating as project partners offered patrons access to health information online. Trainers assisted computer center patrons in locating reliable healthcare information online and suggested additional health and social services available through partner organizations.260
4.2.5 PCC and SBA Healthcare Longitudinal Analysis
The purpose of the longitudinal analysis is to compare observations from Round 1 with observations from Round 2 to identify changes over time. The evaluation study team will use these data in the Final Report to assess the impact of BTOP. In Interim Report 1, the evaluation study team presented a selection of baseline activities and outcomes observed during site visits conducted between July and December 2011 for each of the five focus areas presented in Interim Report 1. The evaluation study team identified data elements to measure potential benefits, based on the data grantees reported collecting or intended to collect.
During Round 2 site visits, performed between January and June 2013, the evaluation study team obtained the data related to the potential benefits defined in Interim Report 1 from case study participants, when such information was available. The data show that grant-provided programs and resources successfully supported patients accessing reliable health information online, and providers using more telehealth applications.
Developing awareness of health resources made available by broadband Internet, including websites, videos, support groups, and connections to medical providers
o California Emerging Technology Fund (CETF): CETF subrecipient Center for Accessible Technology (CforAT) created, delivered, and archived webinars via a fully accessible virtual classroom on accessibility-related topics and accessing healthcare information online. As of June 11, 2013, there have been 29,435 unique visitors to the website, well above CforAT’s goal of 5,000. As of January 2013, CforAT had provided 39 webinars to 1,100 participants.261 The webinars remain accessible through the website. CforAT noted that individuals who had begun to experience debilitating conditions that could affect their future work prospects attended some of its webinars focusing on adaptive technologies for the disabled. Especially common were repetitive strain injuries (RSI) due to workplace conditions.262
o Connect Arkansas: Connect Arkansas broadcasted a video developed by the University of Arkansas for Medical Sciences (UAMS) ("Jennifer's Story") to explain telehealth to viewers. The American Telemedicine Association (ATA) featured “Jennifer’s Story” on its

40
homepage. The video received 14,365 views between July 12, 2011, and April 28, 2013. Connect Arkansas created thirty-two videos over the course of the project. UAMS recorded a total of 17,998 views across all videos as of April 28, 2013.
o Connect Arkansas: Connect Arkansas provided users access to Quarterly Thought Symposium webinars on telehealth topics. Live quarterly webinars featured programs such as “Breakdown,” which discussed in-depth current topics in telehealth, and “30 Seconds with a Telehealth Expert,” which featured expert advice for establishing a telehealth network. As of February 28, 2013, a total of 483 participants attended these webinars.263
o Connect Arkansas: UAMS developed Learntelehealth.org to provide users online access to telehealth information, resources, and training modules. As of February 28, 2013, nearly 5,000 unique users had visited Learntelehealth.org, generating 8,292 total site visits. Nearly 1,200 users registered as members on the site.264
Using broadband to obtain health information
o Connect Arkansas: UAMS offered online training on the following topics: Overview of Telehealth, Telehealth Equipment, TelePresenting Best Practices, Building Your Telehealth Team, Creating Your Telehealth Project Plan, and Telemedicine Credentialing and Privileging. Since implementing the training modules in March 2011, users participated in 1,197 sessions. Users were able to complete tests and assessments to verify their knowledge. Of the 1,197 sessions, 31 percent of the users completed sessions. Of those completing a session, 98 percent achieved a passing grade.265
o Future Generations Graduate School (Future Generations): The web-based course “Living a Life with Chronic Conditions” provides content on chronic disease and a self-health management course. Thirty lab mentors who completed the course became aware of online healthcare resources and learned techniques to aid in caring for family members suffering from a chronic disease. Mentors supported PCC patrons seeking healthcare information online and suggested caregiving techniques for patrons to use.266
o Urban Affairs Coalition (UAC): UAC provided training in using the Internet to access reliable HIV/AIDS information, including understanding the importance of authority and currency with HIV/AIDS information. Philadelphia FIGHT, a project partner, reported training and participant data for other types of training, but no data were provided for HIV/AIDS information training. Philadelphia FIGHT provided patrons with assistance and instruction in locating health-related information on the Internet, including health problems that affect the progression of HIV/AIDS such as diabetes, heart disease, and hypertension. In addition, clients had access to the AIDS Library, where they could take courses and ask the staff about specific health questions. FIGHT also offered assistance on how to use newly developed smartphone applications to access reliable health information. Patrons used the information found online and in the AIDS Library to manage their health.267
Communicating with a healthcare provider online
o CETF: CETF provided “ask the expert” opinions where experts in the field answer user questions regarding a particular disability. As of January 2013, CforAT staff members responded to more than seventy “ask the expert” questions submitted over the web.268 Interviewees reported that the program engaged editors from around the country as experts on accessible technology.269 Answers to success stories helped individuals to find information on accessible technologies that was not otherwise available from online sources.
Providing self-care or care for another based on information obtained from the Internet
o C.K. Blandin Foundation (C.K. Blandin): C.K. Blandin provided touchscreen computers to ten seniors and laptops to their relatives (fifteen total) loaded with HomeStream software so seniors can engage in telemedicine and telehealth activities with support from their families. The Demonstration Community partners reported that ten seniors were eager to participate and are still using the computers in their homes. Instead of using the HomeStream software, seniors began using more general teleconference software to communicate with their families and communities about healthcare and other topics.
41
According to the project partner, the seniors are more engaged in the community. During the award period, all ten seniors who participated in the pilot were able to continue living in their homes.270
Teaching healthcare providers about broadband-enabled technologies and practices that can be used by their patients
o Connect Arkansas: Staff members visit individual healthcare facilities to teach staff how to use the Internet for distance health learning. Training options include “Telehealth 101” and hands-on workshops for a wide range of equipment. As of March 31 2013, UAMS had delivered 790 onsite training sessions.271 UAMS estimated it had visited nearly 80 percent of the facilities that received equipment through the UAMS CCI project.272
o Connect Arkansas: “Telehealth 101” provides an overview of telehealth, relevant technologies, strategy development, and sustainability. It is available as a live webinar and onsite training. As of March 31, 2013, 919 users had completed the Telehealth 101 training program, acquiring a fundamental understanding of the online technology. Approximately 80 percent of Telehealth 101 participants indicated that they were new to the topic of telehealth. UAMS reported that the training provided information on telehealth technologies and mitigated anxiety about using these technologies for the first time.273
4.2.6 Potential Future PCC and SBA Healthcare Impacts
In addition to the impacts described above, the evaluation study team observed outcomes that were not directly linked to observed impacts but that may lead to impacts in the future. These outcomes included individuals learning to find information related to specific conditions online, completing training to care for chronic conditions, learning techniques for implementing telehealth programs, communicating with healthcare providers electronically, and monitoring the condition of friends and family.274 Projects that achieved similar outcomes, but did not collect quantitative or qualitative data related to impacts, include those described below. These potential impacts are not included in the analysis above and they may or may not occur.
Connect Arkansas: Telehealth services saved practitioners and patients time and money in transportation, and offered patients facilitated access to improved treatment options. UAMS provided training and resources for healthcare providers to support the implementation of telehealth services. UAMS also implemented an outreach campaign to promote the benefits of telehealth for both patients and providers. The campaign included a program website featuring informational resources, educational videos, training modules, and games focused on telehealth. Through a combination of onsite training, online training, webinars, and seminars, UAMS delivered 4,122 hours of telehealth training to 1,512 people during the award period. More than 900 users completed the Telehealth 101 training program, acquiring a fundamental understanding of the online technology.275 The provision of this training is likely to result in practitioners increasing the range of healthcare services available through the adoption of telehealth.276
Urban Affairs Coalition (UAC): Philadelphia FIGHT provided patrons with assistance and instruction in locating health-related information on the Internet, including health problems that affect the progression of HIV/AIDS such as diabetes, heart disease, and hypertension. Clients had access to the AIDS Library, where they could take courses and ask the staff health questions. Patrons used the information found online and in the AIDS Library to manage their health.277 Obtaining access to information related to an existing condition is likely to improve participants’ ability to seek care.278
Future Generations Graduate School (Future Generations): As of February 2013, thirty lab mentors completed the Chronic Disease Self-Management training course, improving awareness of online resources and techniques to aid in caring for family members suffering from a chronic disease. Lab mentors provided guidance to computer center patrons seeking healthcare information online and suggested techniques to use as caregivers.279 Transferring

42
this knowledge is likely to result in improved ongoing care for those suffering from chronic conditions.280
4.3 CCI Healthcare Impacts
4.3.1 CCI Healthcare Overview
The evaluation study team analyzed CCI case study reports with computer-assisted qualitative data analysis software to identify the associations between activities, outcomes, and impacts as reported by grantees. ASR employed benefits identified in literature to classify impacts, and in some cases outcomes. ASR aggregated similar results to find examples that may be representative of the benefits realized by BTOP grants outside of the evaluation study sample.
Figure 7 below shows the relationships among activities, outcomes, and impacts of the selected case study grants. Individual activities, outcomes, and impacts observed by the evaluation study team are included as boxes in the figure. Lines between boxes represent the different relationships identified by the evaluation study team. The figure only includes relationships observed in two or more grants. The lines also vary in color and thickness based on the number of grants exemplifying the relationship: relationships identified in two or three grants are identified by thin gray lines; relationships identified in four or five grants are identified by thin, red lines; and relationships identified in six or more grants are represented by thick red lines. Impacts stemmed from a variety of activities and outcomes.
Observations reported by interviewees indicated that healthcare providers realized the majority of benefits in the Healthcare focus area for CCI projects. Improved provider productivity and efficiency was the most frequently observed impact among the grants included in the evaluation study sample, although interviewees also reported patients obtaining improved care. These categories are not mutually exclusive. Many healthcare activities will result in multiple types of impacts. For example, video consults between staff members in rural clinics and specialists in larger hospitals can increase provider efficiency and improve patient care.
Figure 7. CCI Healthcare Impacts
The subsections below define the activities, outcomes, and impacts presented in the figure above. Select CCI case study grants provide examples to illustrate impacts.

43
4.3.2 CCI Healthcare Activities
Activities include services or products implemented by CAIs and partners that reached targeted participants or populations. The primary activities that led to impacts were adopting new telehealth applications and improving the functionality of existing tools.
Adopt new telehealth applications: Increased bandwidth and improved network reliability obtained by connecting to CCI grant-funded fiber enabled CAIs to implement new telehealth applications to support organizational operations and services provided to patients.281
Improve functionality of existing tools: The bandwidth provided through the CCI grant-funded fiber connections enable healthcare providers to use tools, applications, and systems previously hindered by bandwidth limitations.282
4.3.3 CCI Healthcare Outcomes
The activities described above lead to the following outcomes:
Improved service: Increased capacity to use broadband-dependent tools and applications enable healthcare providers to improve services. Patients benefited from these services before the grant, but grant-funded activities allowed providers to serve patients faster or more reliably. CAIs realized improvements in service after improving tools they were already using, and adopting new ones.283 New services included the ability to track vital health statistics during in-home visits and the increased use of telemedicine.
Expanded operations: Healthcare providers use broadband networks to offer new types of service to patients, or expand existing services to a new geographic area, including interactive video consultations with health and mental health specialists. This outcome was most frequently the result of the adoption of new telehealth applications.284
Saved resources: Healthcare providers saved time and money. This outcome was primarily the result of adopting applications that allowed for the improved transmission of information, typically with video communications, between facilities.285
4.3.4 CCI Healthcare Impacts
The most prevalent impacts in this focus area include improved healthcare provider productivity and efficiency, improved patient care, and increased convenience for patients. The following list provides illustrative examples drawn from case study reports.
Improved healthcare provider productivity and efficiency: Healthcare providers use broadband-enabled technologies to increase the efficiency of internal operations.286 These operations primarily include transferring patient data between facilities, including medical records and radiological images.287 Efficiencies also result from the use of video conferencing between facilities.288 Some healthcare facilities were able to provide the same services with fewer employees or in a shorter period time.289
o Executive Office of the State of West Virginia (West Virginia): The West Virginia state trauma network includes five medical command centers. When a trauma incident occurs, paramedics relay patient information to a doctor at the medical command center. The doctor gives the paramedic directions for stabilizing the patient, including any drugs to administer. The command center also relies on feedback from paramedics to determine where to transport the patient. Before BTOP, these communications traveled on a microwave system. The new network, which is a dual microwave and fiber system, can accommodate more data, which has resulted in faster, clearer communications between command centers and those in the field.290
44
o OSHEAN: Connection to the network enables the CharterCARE health system to implement new applications, such as teleconferencing, telemedicine, and, in the future, virtual intensive care unit (ICU) services. CharterCARE explained that inpatient volumes are declining, and sharing staff across facilities is a cost-effective response to reduced resource needs. The ability to share pertinent data, such as records and radiology results, among locations facilitates the sharing of staff.291
o OneCommunity: The increased bandwidth provided by OneCommunity supports Magruder Hospital’s electronic medical record (EMR) system. The EMR system helps Magruder Hospital to improve patient safety and timeliness of treatment. The EMR system has improved the functionality of Magruder’s prescription system by reducing the time between the issuing of a prescription and the dispensing of medication from two-and-a-half hours to five minutes. The EMR system includes automated dispensing cabinets that increase the accuracy of prescriptions.292
Improved patient care: Healthcare providers use broadband-enabled technologies to improve the health of those they serve.293 Across CCI projects, this impact was most often observed after CAI activities allowed healthcare providers to improve existing services.294 The adoption of broadband-enabled technologies also facilitates faster and more convenient access to healthcare. For example, patients are able to obtain healthcare services closer to home.295
o University of Arkansas System (UAS): The Arkansas Stroke Assistance through Virtual Emergency Support (AR SAVES) program provides remote consultations for emergency room (ER) patients exhibiting stroke symptoms. AR SAVES links forty hospitals to neurologists at UAMS and at St. Edward Mercy Medical Center in Fort Smith, twenty-four hours a day. The neurologist can evaluate the patient and determine whether it is safe to administer tPA, a blood clot-busting drug. Administering the drug as soon as possible minimizes the side effects of stroke. The window of time for administering the drug is often missed when patients at a rural hospital must be transported to a larger facility that is equipped to evaluate stroke victims. AR SAVES reduces the need for transfers and allows patients to receive tPA in a shorter time. As a result, the chances of recovery are significantly improved, as is quality of life post-stroke. While the AR SAVES program operated before the Arkansas e-Link initiative, enhancements to the network and the distribution of teleconference-enabling units among hospitals enabled the AR SAVES program to grow. In the 2013 fiscal year alone, 594 patients were seen through AR SAVES and 151 doses of tPA were administered. This accounts for more than a third of all AR SAVES consults and more than 62 percent of tPA doses administered since the program’s inception in 2008.296
o Lane Council of Governments (LCOG): Some PeaceHealth clinics that have connected through the grant-funded fiber use the increased connection to support telehealth initiatives using mobile video conferencing carts at remote locations. These include interpretive services for non-English speakers and people with disabilities, and tele-stroke applications. For example, the PeaceHealth medical center in Florence, Oregon is piloting a tele-stroke program to provide on-call support and e-consults between doctors at the clinic and neurology specialists. These consultations can decrease the diagnosis time and provide faster access to treatment, which can save lives.297UAS: The project has allowed a healthcare provider to implement telemedicine practices at twelve of its sixteen sites. Telemedicine activities have significantly increased access to mental and behavioral healthcare for the rural, impoverished region that has had difficulty attracting doctors. Using telemedicine equipment to conduct patient sessions gives doctors more time to see patients, as they do not have to travel. Eliminating the need for patient travel minimizes the number of missed appointments and instances of discontinued care.298
4.3.5 Potential Future CCI Healthcare Impacts
Some projects provided resources and services targeting healthcare providers and patients, although they had limited data related to observed impacts.299 Projects that achieved similar
45
outcomes, but did not collect quantitative or qualitative data related to impacts, include those described below. These potential impacts are not included in the analysis above and they may or may not occur.
Massachusetts Technology Park (MassTech): The Executive Office of Public Safety and Security (EOPSS) expects that, due to the new fiber connections in western Massachusetts, it will be able to provide inmate telemedicine in correctional facilities. This could save money and time, and improve inmate healthcare.300
Merit Network, Inc. (Merit): North Country Community Mental Health is piloting the use of tele-psychiatry to communicate with other doctors’ offices rather than clients’ homes. The agency is participating in a University of Michigan program called Michigan Child Collaborative Care (MC3) to provide consulting psychiatry service to primary healthcare providers that are managing pediatric patients with behavioral health problems. The MC3 program would allow psychiatrists to consult with primary care physicians and their patients so that they can better manage behavioral health issues.301
46
Section 5. Government Services Impacts This section describes the Government Services impacts of the BTOP projects in the evaluation study sample. This focus area identifies how broadband improves services provided by government organizations to the public and includes both the provision and administration of public safety activities. Some government service impacts include enhanced government efficiency, improved continuity of services after disasters, and improved information sharing between citizens and government entities.
The evaluation study team gathered data related to focus area impacts from evaluation study participants during CCI site visits. The following subsections present an introduction to the Government Services focus area and a summary of the economic and social benefits described in the CCI case study reports.
5.1 Government Service Potential Benefits
The Government Services focus area was included in CCI case study reports to analyze benefits to CAIs, including government and public safety agencies such as law enforcement agencies, fire departments, and EMS. This section situates these benefits in the literature on how broadband affects public safety and other government institutions.
5.1.1 Broadband and Government
Local, state, and federal government agencies are implementing new practices that make use of broadband technologies to increase internal efficiency and improve communication with citizens.302 In 2009, 87 percent of adults agreed that it was important for governments to provide information to the public on government websites, and 46 percent of Internet users used the web to look up services provided by public agencies.303
The benefit discussed most often in the literature on government use of broadband is an improvement in operational efficiencies. For example, a 2008 study in the United Kingdom found that the cost of issuing vehicle excise licenses was cut by 45 percent after the process was moved online, saving the government about £8 million per year. Eighteen million people used the new system in 2008.304 In the United States, the federal Office of Management and Budget reported to Congress that certain federal e-government initiatives resulted in efficiencies totaling $508 million in fiscal year 2008. The United Nations estimated that e-government initiatives could result in cost savings between 10 and 50 percent.305
Broadband networks can also increase citizen access to government services and information, saving them time and improving government-citizen interaction. Van der Wee et al. (2012) found that the largest quantifiable benefit of transitioning from DSL to fiber broadband was a cost savings for citizens who would not have to travel to access government services.306 In Austria, an e-government registry automatically shares birth and marriage certificates between agencies without requiring individuals to request and transport the documents.307 In Virginia, residents can check wait times for services from the Department of Motor Vehicles.308 Government agencies at all levels have published an increasing amount of government information online, including meeting minutes, policy proposals, reports, and information on where to find services. Some agencies have also established online forums and blogs to foster policy discussions with citizens.309
47
5.1.2 Broadband and Public Safety
One of the five core purposes established by the Recovery Act for BTOP was to “improve access to, and use of, broadband service by public safety agencies.” In 2007, the Benton Foundation concluded that public safety communication networks were too outdated to respond adequately to emergencies, disasters, and systemic failures.310 In the last several years, government programs have supported public safety agencies’ adoption of broadband-based technologies to improve communications and services.311
One important benefit of broadband networks is an improved ability for government agencies to respond to incidents and emergencies. Police officers can use wireless networks to access the FBI’s National Crime Information Center in the field to quickly access fingerprint records, mug shots, and criminal histories. Firefighters can check traffic patterns and use electronic building plans to reduce response time.312 In Minneapolis, a public Wi-Fi network helped the city respond successfully to a major bridge collapse. Within twelve hours, emergency workers had audio and visual access to the entire bridge collapse area. The network connected government officials, emergency workers, families of victims, and ordinary citizens.313
Public safety agencies can also use broadband networks to transmit large amounts of video in real-time, which can increase their ability to monitor high-crime areas and public safety facilities, including jails and prisons. Remote monitoring can help law enforcement officials both to prevent and to respond better to incidents. This deters potential offenders, and helps police investigate crimes and identify suspects with more accuracy.314
Table 5 presents the potential social and economic benefits related to Government Services identified in literature. These benefits accrue as a result of streamlined intranet systems, broadband-based software applications, reliable data backups, reduced travel, and the easy dissemination of information using the Internet.

48
Table 5. Government Services: Potential Social and Economic Benefits
Benefits to Government Agencies
The use of broadband at all levels of government allows government entities to deliver services more efficiently. Intranet systems enable the secure and rapid exchange of information among government agencies. Governments are also able to store and safeguard massive quantities of data. By streamlining in-house operations with the use of broadband-supported tools, governments realize greater internal efficiency and productivity.315
Public safety entities, including police, fire, and emergency medical personnel, can reduce response times and improve the quality of services they provide with the use of broadband-supported applications and equipment.316
Law enforcement, investigative, and intelligence agencies may use broadband for incident prevention. Security and surveillance activities enabled by broadband, such as those that use global positioning system (GPS) technologies, reduce costs, counteract crime and acts of terror, save lives, and avoid injuries.317
Broadband connectivity helps to preserve continuity of government operations in the wake of disasters or epidemics.318
Broadband capabilities reduce the need to travel, through telework opportunities or online services.319
Benefits to the Public
Broadband improves the relationship between governments and their constituents. Diffusion of online information engages citizens and enhances transparency of government agencies.320
Online tools allow government entities to offer better customer service and support.321 The availability of online government or social services increases accessibility for disabled
citizens.322 Communication supported by broadband allows for greater information sharing between
public safety entities and citizens.323
5.2 CCI Government Services Impacts
5.2.1 CCI Government Services Overview
The evaluation study team analyzed CCI case study reports with computer-assisted qualitative data analysis software to identify the associations between activities, outcomes, and impacts as reported by grantees. ASR employed benefits identified in literature to classify impacts, and in some cases outcomes. ASR aggregated similar results to find examples that may be representative of the benefits realized by BTOP grants outside of the evaluation study sample.
Figure 8 below shows the relationships among activities, outcomes, and impacts of the selected case study grants. Individual activities, outcomes, and impacts observed by the evaluation study team are included as boxes in the figure. Lines between boxes represent the different relationships identified by the evaluation study team. The figure only includes relationships observed in two or more grants. The lines also vary in color and thickness based on the number of grants exemplifying the relationship: relationships identified in two or three grants are identified by thin gray lines; relationships identified in four or five grants are identified by thin, red lines; and relationships identified in six or more grants are represented by thick red lines.
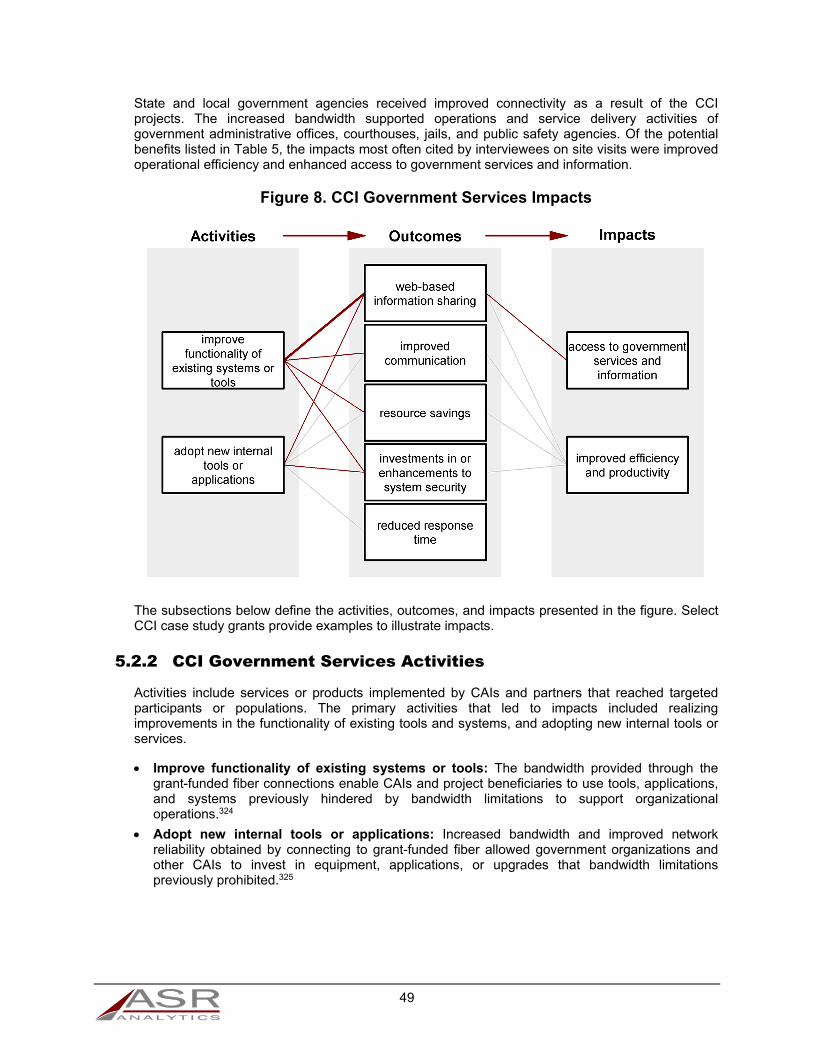
49
State and local government agencies received improved connectivity as a result of the CCI projects. The increased bandwidth supported operations and service delivery activities of government administrative offices, courthouses, jails, and public safety agencies. Of the potential benefits listed in Table 5, the impacts most often cited by interviewees on site visits were improved operational efficiency and enhanced access to government services and information.
Figure 8. CCI Government Services Impacts
The subsections below define the activities, outcomes, and impacts presented in the figure. Select CCI case study grants provide examples to illustrate impacts.
5.2.2 CCI Government Services Activities
Activities include services or products implemented by CAIs and partners that reached targeted participants or populations. The primary activities that led to impacts included realizing improvements in the functionality of existing tools and systems, and adopting new internal tools or services.
Improve functionality of existing systems or tools: The bandwidth provided through the grant-funded fiber connections enable CAIs and project beneficiaries to use tools, applications, and systems previously hindered by bandwidth limitations to support organizational operations.324
Adopt new internal tools or applications: Increased bandwidth and improved network reliability obtained by connecting to grant-funded fiber allowed government organizations and other CAIs to invest in equipment, applications, or upgrades that bandwidth limitations previously prohibited.325
50
5.2.3 CCI Government Services Outcomes
The activities described above increased web-based information sharing, improved communication, saved resources, enhanced system security, and reduced the amount of time required to respond to service disruptions. The outcomes defined below are not a complete list of outcomes from grantee activities, but rather those that the evaluation study team observed leading to Government Services impacts.
Web-based information sharing: Adopting new or realizing improvements in the functionality of existing systems enabled CAIs to access and share resources digitally, including large datasets and video content. Some CAIs use new wide area network (WAN) connectivity to collaborate in real-time with partner organizations or remotely located staff.326 Enhanced connectivity allows government agencies to move from paper-based to paperless information platforms.327 Web-based information sharing may also include CAIs leveraging increased bandwidth to access interactive training programs or digital media.328
Improved communication: The effective delivery of government and public safety services often requires the coordinated efforts of several departments, agencies, or systems, and is dependent upon reliable communication. Improved broadband connectivity provided by grant-funded fiber networks enabled CAIs to realize improvements to existing or implement new communication mechanisms, improving the speed and accuracy of information shared with colleagues, citizens, and other organizations.329
Resource savings: CAIs saved both personnel hours and money by using the increased bandwidth to operate resource-saving tools or applications.330
Investments in or enhancements to system security: Interviewees reported that the improved functionality of existing systems enabled them to implement or invest in the development of security mechanisms including disaster recovery, remote backups, and video surveillance.331
Reduced response time: Using connectivity to new fiber networks enabled CAIs to adopt bandwidth-intensive applications, which helped to reduce the amount of time required to respond to and resolve service outages.332
5.2.4 CCI Government Services Impacts
The most prevalent Government Services impacts reported by interviewees include organizational efficiency gains and improved access to government services and information. The enhanced connectivity provided by the grants also allowed government agencies to realize improved internal efficiencies.333 The following list provides illustrative examples drawn from case study reports.
Access to government services and information: Web-based information sharing facilitates the increase of online government services and content. By adopting digital information platforms, government organizations enhance the feasibility of submitting forms and applications, and communicating with agencies, officials, or representatives. Citizens can also use online applications to fill out forms or communicate with public safety agencies.334
o South Dakota Network, LLC (SDN): The increased network capacity and direct access at many government facilities has enabled more efficient government services, including Women, Infants, and Children (WIC), Supplemental Nutrition Assistance Program (SNAP), and Temporary Assistance for Needy Families (TANF). It allows the government to offer services consistently across the state, whether residents live in urban or rural areas.335
o OSHEAN: The Emergency Operations Center in Providence, Rhode Island is connected to BTOP-funded fiber and houses a studio to conduct press conferences with television and radio news channels, helping to ensure that accurate information is released to the public. Media representatives are able to remain within this facility during emergencies to ensure that information is immediately disseminated to the public as it is released.336

51
Improved efficiency and productivity: Organizations most commonly realized improvements to organizational efficiency as a result of improved communication, web-based information sharing, and resource savings. CCI projects increased bandwidth and network redundancy, allowing for the deployment of bandwidth-intensive devices, systems, and applications that streamline daily operations, improving the ability to achieve agency goals or provide services in support of organizational missions. Increased bandwidth also supports the efficient transfer of information and the use of equipment and applications that provide situational awareness critical to ensuring the continuity of services during emergencies.337
o OneCommunity: Cuyahoga County uses its fiber network and the affordability of service through OneCommunity to provide connectivity to support emergency services, including police headquarters, dispatchers, the Federal Bureau of Investigation (FBI), the Cleveland Regional Transit Authority, and police vehicles. The Cuyahoga Regional Information Services emergency system equips public safety vehicles with computers and license plate scanners, enabling law enforcement officers to access criminal records while on patrol.338
o OSHEAN: The Providence Department of Public Safety’s Emergency Operations Center uses the Beacon 2.0 network to communicate with the Providence Department of Public Works (DPW), which was connected to fiber through the project. Connecting to fiber improved the DPW’s ability to deploy resources. The DPW central office is able to communicate with trucks and vendors in the field in real-time, improving awareness of blockages and resources in the field. For example, an internal map analyzes GPS data from trucks and reports the time elapsed since a plow last cleared a particular street. Emergency and rescue services use this information to devise response strategies, such as determining the route a fire truck should take. Real-time data sharing was not possible before obtaining the fiber connection.339
o Executive Office of the State of West Virginia (West Virginia): The project expanded the state’s radio network by adding twelve new towers and funding upgrades to the existing tower sites. These additions and upgrades enabled the deployment of a new type of technology for radio communications that is more reliable and easier to manage remotely. Before the grant, if microwave communications were severed, public safety microwave tower sites remained out of service until a tower crew made repairs, taking up to eighteen hours in severe cases. The new, grant-funded IP-based system reroutes traffic during outages eliminating downtime during repairs. The State Interoperable Radio Network (SIRN) connections enabled more robust, reliable communication during storms. Additionally, each tower site has two dishes for redundancy in case one falls out of alignment. SIRN was relied upon for response efforts following a severe land storm in July 2012 and the after-effects of Hurricane Sandy in October 2012. SIRN representatives reported that the network functioned smoothly through both storms and no tower outages occurred.340
5.2.5 Potential Future CCI Government Services Benefits
In addition to the impacts described above, the evaluation study team observed Government Services outcomes that did not directly result in impacts. The potential benefits identified in the interviews focused on service continuity, access to online government services, emergency response, and operational efficiency.341 These potential impacts are not included in the analysis above and they may or may not occur.
Zayo Bandwidth, LLC (Zayo): The Utilities District of Western Indiana (UDWI) provides service to fire stations, volunteer fire departments, a regional airport in Bloomington, several schools, and government contractors through the Crane Naval Base. During severe storms, fire departments and schools serve as emergency shelters. UDWI’s emergency response plan makes a priority of providing shelter locations with electrical power in the event of an outage. An automated switching scheme, enabled by improved connectivity, will help to provide service to shelters during weather or other emergency related outages.342 This service will likely help preserve continuity of local government operations in the wake of weather emergencies.343
52
OneCommunity: The OneCommunity network enables the sharing of public safety services across communities. For example, Mansfield, Ohio implemented a next generation 9-1-1 system that receives phone calls, e-mails, and text messages. The county can host this service for other communities on the OneCommunity network, offering a shared service model to assist other communities in acquiring the next generation 9-1-1 service at a lower cost. There are several cities already on the network, and OneCommunity can build to other locations on or near the network, enabling participation in the shared service.344 The provision of this service will likely improve the response times and quality of services provided by participating public safety entities.345
LCOG: The City of Florence is upgrading its accounting software to take advantage of the increased connectivity it received from the LCOG project. The upgrade includes installing a server at City Hall to host its accounting database. Before BTOP, the city would not have been able to make this change due to limited connectivity between City Hall and other city offices. The upgrade will allow each department to see real-time budget data. The upgrade will also allow the city to transition to an online bill payment system to increase accounting efficiencies, to increase transparency, and to help prevent fraud and embezzlement.346
Massachusetts Technology Park (MassTech): The Executive Office of Public Safety and Security (EOPSS) reported that before BTOP, agencies in western Massachusetts connected to the state’s criminal justice information system via a 56 kbps frame relay network operating over T1 lines. Some agencies did not have direct access to the system, and instead connected with limited capabilities via the Internet. Agencies will now connect with a minimum symmetrical bandwidth of 50 Mbps. EOPSS expects that the network will greatly improve communication efficiencies between public safety agencies in western Massachusetts, and will facilitate the transition to next generation 9-1-1, next generation identification, and remote monitoring of jails and large public events.347
Clearwave Communications (Clearwave): The project provided a core network infrastructure, making it possible for the regional Next Generation 9-1-1 Consortium to develop and implement an emergency services IP network, databases, and data management software for improved emergency response services among fifteen counties in southern Illinois. The increased connectivity will enable greater coordination between 9-1-1 offices, increased redundancy to reduce service outages, new capabilities for rerouting emergency calls, GPS integration, mapping, texting, and streaming video.348
53
Section 6. Quality of Life/Civic Engagement Impacts This section describes the Quality of Life/Civic Engagement impacts of the BTOP projects in the evaluation study sample. This focus area includes those activities that create stronger and more integrated communities and those that promote interaction between citizens and their governments. Measuring the impact of broadband on quality of life has been difficult to achieve in some cases. The Pew Internet and American Life Project and the Monitor Institute noted that several of the indicators for measuring citizens’ sense of how their community information system is performing and their overall satisfaction with their community are difficult to measure and assess independently without complicated and expensive methodologies.349 Specific areas noted as difficult to measure, among others, are the availability of “quality of life” information from community organizations, and “effective opportunities” for citizens to have their voices heard.350
The evaluation study team gathered data related to focus area impacts from grantees in the evaluation study sample during site visits. The following subsections present a summary of the economic and social benefits described in case study reports.
6.1 Quality of Life/Civic Engagement Potential Benefits
Table 6 presents the potential social and economic benefits related to Quality of Life/Civic Engagement identified in literature and defined in Interim Report 1.
Table 6. Quality of Life/Civic Engagement: Potential Social and Economic Benefits
Improved communication between citizens and government entities351 Lowering the effective cost of civic engagement and community participation352 Increased political engagement and civic participation353 Increased volunteerism354 Improved social connections, especially in rural communities355
6.2 PCC and SBA Quality of Life/Civic Engagement Impacts
6.2.1 PCC and SBA Quality of Life/Civic Engagement Overview
The evaluation study team analyzed Round 2 case study reports with computer-assisted qualitative data analysis software to identify the associations between activities, outcomes, and impacts as reported by grantees. ASR employed benefits identified in literature to classify impacts, and in some cases outcomes. ASR aggregated similar results to find examples that may be representative of the benefits realized by BTOP grants outside of the evaluation study sample.
Figure 9 below shows the relationships among activities, outcomes, and impacts of the selected case study grants. Individual activities, outcomes, and impacts observed by the evaluation study team are included as boxes in the figure. Lines between boxes represent the different relationships identified by the evaluation study team. The figure only includes relationships observed in two or more grants. The lines also vary in color and thickness based on the number of grants exemplifying
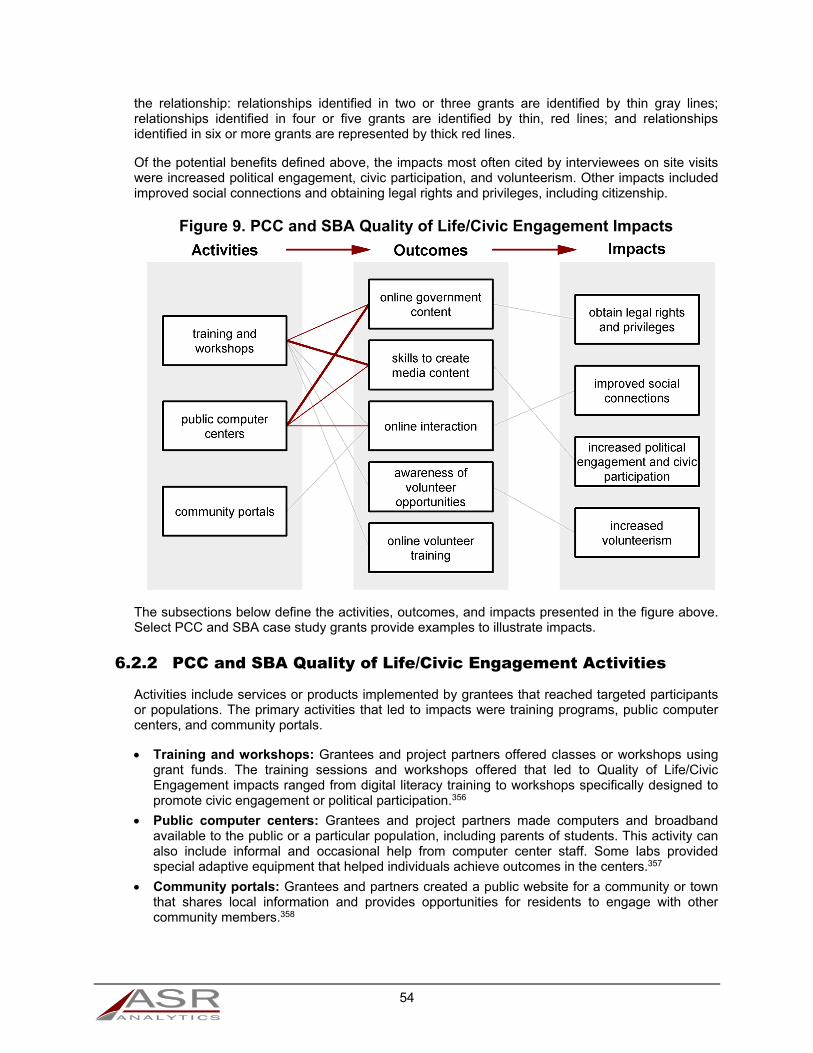
54
the relationship: relationships identified in two or three grants are identified by thin gray lines; relationships identified in four or five grants are identified by thin, red lines; and relationships identified in six or more grants are represented by thick red lines.
Of the potential benefits defined above, the impacts most often cited by interviewees on site visits were increased political engagement, civic participation, and volunteerism. Other impacts included improved social connections and obtaining legal rights and privileges, including citizenship.
Figure 9. PCC and SBA Quality of Life/Civic Engagement Impacts
The subsections below define the activities, outcomes, and impacts presented in the figure above. Select PCC and SBA case study grants provide examples to illustrate impacts.
6.2.2 PCC and SBA Quality of Life/Civic Engagement Activities
Activities include services or products implemented by grantees that reached targeted participants or populations. The primary activities that led to impacts were training programs, public computer centers, and community portals.
Training and workshops: Grantees and project partners offered classes or workshops using grant funds. The training sessions and workshops offered that led to Quality of Life/Civic Engagement impacts ranged from digital literacy training to workshops specifically designed to promote civic engagement or political participation.356
Public computer centers: Grantees and project partners made computers and broadband available to the public or a particular population, including parents of students. This activity can also include informal and occasional help from computer center staff. Some labs provided special adaptive equipment that helped individuals achieve outcomes in the centers.357
Community portals: Grantees and partners created a public website for a community or town that shares local information and provides opportunities for residents to engage with other community members.358

55
6.2.3 PCC and SBA Quality of Life/Civic Engagement Outcomes
The activities described above lead to the following outcomes:
Online government content: Residents are able to access government information and content online, reducing the barrier to submitting forms and communicating with government agencies. Individuals were better able to access government content online using public computer centers and after training that introduced residents to government websites.359
Skills to create media content: Individuals developed skills to create digital media content, including e-newsletters, radio broadcasts, online community forums, television shows and commercials, Facebook groups, and blogs. Participants developed these skills after participating in grant-funded training sessions and workshops and using open labs.360
Online interaction: Individuals use the Internet to communicate with family, friends, and neighbors. This outcome was most often the result of computer centers that provided computers and Internet access. Community portals also helped increase online interaction in geographic communities.361
Awareness of volunteer opportunities: Individuals use resources on the Internet to learn about local volunteer opportunities. Patrons used computer centers to find these resources, or became more aware of volunteer opportunities after training sessions or workshops.362
Online volunteer training: Individuals used computer center resources, including grant-provided computers and broadband access, to participate in required online volunteer training.363 A survey conducted by Future Generations Graduate School in April 2012 found that 69 percent of fire departments with PCCs used the facility to complete required training programs.364
6.2.4 PCC and SBA Quality of Life/Civic Engagement Impacts
The most prevalent Quality of Life/Civic Engagement impacts were increased political engagement and civic participation, social interaction, obtaining legal rights and privileges, and volunteering. The following list provides illustrative examples drawn from case study reports.
Obtain legal rights and privileges: This included individuals acquiring citizenship, driver’s licenses, or obtaining pardons after gaining the digital literacy skills to access government information online.365
o Foundation for California Community Colleges (FCCC): Some students who participated in digital literacy training went on to acquire United States citizenship after applying and studying online.366
o Delaware Division of Libraries (DDL): The Advancement through Pardons and Expungement (APEX) program used Job Centers to help patrons complete the pardon and expungement process. As of May 15, 2013, eighteen clients obtained pardons after receiving help. Obtaining a pardon restores a client’s civil rights, including the right to vote and hold public office.367
Improved social connections: Individuals and communities were able to improve social connections by interacting online, often in a way that was not possible without broadband. This impact was the result of access to computers through computer centers and new online spaces, including community portals.368
o C.K. Blandin Foundation (C.K. Blandin): Projects facilitated development of a computer center that makes computers accessible to people with disabilities. According to a staff member, the adaptive equipment, for example virtual keyboards at the computer center, allows users with disabilities to integrate more fully into the general community using online resources.369
o Future Generations Graduate School (Future Generations): A young boy used a computer center to communicate with his brother receiving cancer treatment in a different

56
city. The boy receiving treatment was able to stay in contact with his mother and brother when he was unable to see them for extended periods.370
Increased political engagement and civic participation: Individuals who experienced this impact most often participated in grant-funded training sessions and workshops that taught them how to create media content to raise awareness or engage in a political or civic issue.371
o Urban Affairs Coalition (UAC): Through structured training courses, participants learned to create community forums, radio broadcasts, commercials, television shows, and blogs that raise awareness of issues relevant to minorities, immigrants, youth, and the working poor. One group of participants organized the “Fight for Driver's Licenses” project to address a 2010 amendment to Pennsylvania state law prohibiting individuals from obtaining a driver's license using a tax identification number. Members of a radio program helped document and collect thousands of testimonials about how this issue affected Pennsylvania residents.372
o City of Chicago: Individuals who participated in civic engagement training lobbied the Illinois General Assembly using digital tools. Participants engaged legislators by contacting them via online faxing, e-mail, Facebook, and Twitter.373
Increased volunteerism: Individuals who started to volunteer or spent more time volunteering were primarily able to do so after completing required training online. Others became more aware of volunteer opportunities in their communities through the Internet.374
o Future Generations: Computer centers facilitated access to required firefighter training courses, reducing the time and effort necessary to participate as a volunteer. Volunteer firefighters stated that access to online training in the computer centers helped to recruit additional volunteers.375
o Cambridge Housing Authority (CHA): Parents who participated in educational training became more engaged in reading with their children and assisting with homework. According to interviewees, parents are actively volunteering in their children’s classrooms and in other community events.376
6.2.5 PCC and SBA Quality of Life/Civic Engagement Longitudinal Analysis
The purpose of the longitudinal analysis is to compare observations from Round 1 with observations from Round 2 to identify changes over time. The evaluation study team will use these data in the Final Report to assess the impact of BTOP. In Interim Report 1, the evaluation study team presented a selection of baseline activities and outcomes observed during site visits conducted between July and December 2011 for each of the five focus areas presented in Interim Report 1. The evaluation study team identified data elements to measure potential benefits, based on the data grantees reported collecting or intended to collect.
During Round 2 site visits, performed between January and June 2013, the evaluation study team obtained the data related to the potential benefits defined in Interim Report 1 from case study participants, when such information was available. The data show that grant-provided programs and resources successfully supported outcomes and impacts, including more efficient local government operations; increased ability for citizens to access government and community information online; improved ability to communicate with friends, families, and community members; and the removal of barriers to engaging in the democratic process.
Visiting a federal, state, or local government or community website
o C.K. Blandin Foundation (C.K. Blandin): The Stevens County/City of Morris Demonstration Community website listed community information related to employment, housing, healthcare, education, business, and recreation and links to local government sites, but the number of people served was not available. A project leader reported that the Stevens Forward website was no longer functional, but that aspects of the website were

57
being reused in a community portal, which would serve as a front page to direct traffic to the Stevens County website.377 According to the Community’s final report, another similar community portal “has increased the individual community members’ sense of belonging to a ‘village’.”378
o C.K. Blandin: The Big Stone County Public Internet Government Access Project provided public access to government information including Geographic Information Systems (GIS), highway project information, and county government forms. The Demonstration Community reported in its final narrative report that the website has made county government operations more efficient. Between May 2011 and February 2013, the website and GIS portal had experienced 128,600 visits. According to the Demonstration Community, the website is saving time in the courthouse for employees, helping to connect residents to businesses, and making community information more accessible.379
o C.K. Blandin: C.K. Blandin provided assistance to two rural cities, Bellingham and Echo, to create their own city websites. In its final narrative report, the Demonstration Community reported that this project provides a good model of how to create websites for small communities, but the number of people served was not available. Bellingham developed a WordPress site and Facebook page, which served mainly to disseminate information about its recent 125th anniversary celebration. Echo developed a website with forty-two distinct pages, including information about local businesses and ordinances. A Demonstration Community project leader reported that the websites helped increase access to government information.380
Researching or applying for government benefits online
o Las Vegas-Clark County Urban League (LVUL): The Department of Employment, Training, and Rehabilitation trained computer center staff to teach patrons how to sign up for unemployment benefits online using the department's new online process. Patrons used the PCCs to locate and apply for social services online, such as Medicaid and Medicare.381 Instructors enrolled new users in the Computer Basics course, where they received step-by-step instructions on how to use a computer, and one-on-one assistance to look up social services. LVUL provided monthly login totals from July 2010 through December 2012, where there were 568,966 logins across all PCCs. Logins do not represent a unique count of users and may include multiple logins by a single user in a single day.382 LVUL provided aggregate training data in its APRs, but these data did not indicate the hours devoted to specific training courses.
Obtaining government forms online
o C.K. Blandin: C.K. Blandin developed an interactive website for the City of Morris’s Rental Housing Licensing Program to provide inspection results, guidance, and educational information to past, current, and prospective tenants, landlords, and other interested parties. According to a project staff member, the City of Morris’s Rental Housing Licensing Program’s website blog receives between 119 and 728 hits per month. Residents can more easily find quality housing, and landlords have expressed appreciation for being able to advertise rentals through the site.383
o City of Chicago: The City of Chicago provided training on how to access and research government websites and other vital information online. ASR’s tabulation of the grantee’s 2012 APR indicates that the grantee provided 36,326 hours of digital literacy training and 518 hours of Quality of Life/Civic Engagement training.384 Everyday Digital trainers teach participants how to access city, state, and federal government information online. For example, one FamilyNet Center hosts sessions with families to research their tax bills and assessments online, identify any missing exemptions, and explain how to appeal an assessment.385 Trainers at the Chicago Lawn FamilyNet Center held group sessions to explain how to submit an online application to a temporary mortgage assistance program.386
Using e-mail, social networking, or blogs to discuss issues of interest with one’s fellow community members
58
o City of Chicago: The City of Chicago provided digital leadership training on how to use technology to enhance civic engagement and community organizing activities, including accessing government websites, using online resources for vital information, using social media for community organizing, advocating for the community, and performing outreach. ASR’s tabulation of the grantee’s 2012 APR indicates the grantee provided 518 hours of Quality of Life/Civic Engagement training.387 In Auburn Gresham, Civic 2.0 participants collaborated with the Neighborhood Recovery Initiative to lobby the Illinois General Assembly using digital tools. Participants engaged legislators by contacting them via online faxing, e-mail, Facebook, and Twitter.388 The Block Club Federation of Greater Englewood learned to use Gmail and other Google applications, such as Drive and Calendars, to share and organize information. Some block club presidents use Google tools to share meeting minutes, literature, and event dates with members.389
6.2.6 Potential Future PCC and SBA Quality of Life/Civic Engagement Impacts
In addition to the impacts described above, the evaluation study team observed outcomes that were not directly linked to observed impacts but that may lead to future impacts. These outcomes reflected a similar distribution to the outcomes that led to impacts as described above, and included accessing online government content; interacting with family, friends, and communities online; obtaining skills in creating digital media; and accessing online volunteer training.390 Projects that achieved similar outcomes, but did not collect quantitative or qualitative data related to impacts, include those described below. These potential impacts are not included in the analysis above and they may or may not occur.
Future Generations: A computer center mentor who was also the town mayor worked with the City Council to establish an online presence to post meeting minutes and other community information.391 Access to online government information may lead to increased political participation.392
C.K. Blandin: One grant-funded project created a website to post community videos. As of February 2013, the project had created and archived eighty-nine community videos, including high school football games and government and community meetings. They had more than 2,000 viewers for their archived content and another 2,200 unique views during live streaming events.393 In another grant-funded project, a similar community-oriented website led to increased social connections.394
6.3 CCI Quality of Life/Civic Engagement Impacts
6.3.1 CCI Quality of Life/Civic Engagement Overview
Many of the CAIs interviewed by the evaluation study team had recently obtained connectivity to new fiber networks, and thus had collected limited data related to Quality of Life/Civic Engagement impacts. However, interviewees did report outcomes likely to lead to impacts in the near future. Of these potential benefits, those most often cited by interviewees include increased citizen and government communication, increased political engagement, increased civic participation, and improved social connections. The evaluation study team analyzed CCI case study reports to determine the activities and outcomes that are most likely to generate impacts.
The subsections below define the observed activities and outcomes. Select CCI projects provide examples to illustrate potential impacts.
59
6.3.2 CCI Quality of Life/Civic Engagement Activities
Interviewees most commonly cited the following activities as those likely to generate future benefits in the Quality of Life/Civic Engagement focus area:
Improved functionality of existing tools and systems: Interviewees most commonly reported realizing improved functionality of existing systems upon obtaining increased bandwidth through CCI projects. Before BTOP, the use of these systems and applications was often limited or disrupted due to capacity constraints.395
Implement new systems or applications: Improved network capacity enabled CAIs to invest in new bandwidth-intensive applications, tools, and equipment to support operations.396
6.3.3 CCI Quality of Life/Civic Engagement Outcomes
The activities described above lead to improved participation in civic and community activities. The outcomes defined below are not a complete list of outcomes from grantee activities, but rather those that the site visit team observed leading to Quality of Life/Civic Engagement impacts among the CCI projects.
Improved quality or range of services: The improved functionality of existing systems enabled CAIs to allocate resources to improving the delivery of services, rather than address service interruptions or limited activity due to bandwidth constraints.397 For example, some libraries reported that increased bandwidth enables the increase of e-book circulation and the provision of digital media resources. CAIs also used new applications to share services with remote facilities or partner organizations, improving the range of available services.398
Access social or community platforms: Interviewees reported that patrons have historically used library and CAI Internet connections to access social media and networking applications. Increased capacity provided by CCI projects improves the speed and reliability with which patrons are able to engage in social networking.399
Access government information: Several of the libraries visited by the evaluation study team operate publicly accessible computer labs and provide technical assistance and services that facilitate online access to government agencies and public benefits. Connecting to grant-funded fiber networks increased speed and reliability, improving patrons’ ability to access government resources online.400
6.3.4 Potential Future CCI Quality of Life/Civic Engagement Impacts
Because many CAIs had just recently obtained improved connectivity through CCI projects at the time of the site visits, interviewees reported limited data related to impacts. Observed Quality of Life/Civic Engagement outcomes, however, suggest the potential future realization of additional benefits. Future impacts center on increased citizen and government communication, building social connections, and increased civic participation and volunteerism.401 Projects that achieved similar outcomes, but did not collect quantitative or qualitative data related to impacts, include those described below. These potential impacts are not included in the analysis above and they may or may not occur.
South Dakota Network, LLC (SDN): Madison Public Library staff members are preparing to help patrons understand and sign up for healthcare under the Affordable Care Act (ACA). They also used the connection to obtain training and access webinars on how the ACA will affect libraries and their patrons.402 Library staff members who completed the training program will likely help patrons apply for healthcare through the ACA. Guidance provided by trained staff members is also likely to improve the effectiveness of patrons’ online communication with government entities.403
60
Merit Network, Inc. (Merit): Increased bandwidth allows the Houghton Lake Public Library to enhance the programs and services it offers to patrons. For example, it plans to offer another For Kids By Kids project, incorporating videos of students talking about their favorite aspect of the Houghton Lake community. The provision of this service is likely to improve social connections among participants.404
Massachusetts Technology Park (MassTech): DSCI, the service provider for Massachusetts’s voter registration system, plans to use the grant-funded network to provide connectivity to sites in western Massachusetts. The network is expected to help DSCI deliver voter registration services more efficiently.405 Improving voter registration services could help increase political engagement and civic participation in the affected communities.406

61
Section 7. Digital Literacy Impacts This section describes the Digital Literacy focus area impacts of the BTOP projects in the evaluation study sample. This focus area is fundamental to all the others. Digital literacy defines a set of skills and abilities that enable an individual to interact with the digital aspects of culture, and to maintain a digital identity. In the National Broadband Plan, the FCC defines digital literacy as “the skills needed to use information and communications technology to find, evaluate, create, and communicate information.”407 Digital literacy has become increasingly important in obtaining an education, searching for employment, learning job-related skills, accessing government information, and other social and economic activities.408
The evaluation study team gathered data related to focus area impacts from evaluation study participants during site visits. The following subsections present a summary of the economic and social benefits described in case study reports.
7.1 Digital Literacy Potential Benefits
Access to broadband enables users to engage in a wide range of digital literacy activities, generating benefits to individuals, businesses, and communities. Digital Literacy is fundamental to all other focus areas, and includes skills and abilities that enable an individual to interact with the digital aspects of culture, and to maintain a digital identity. Possessing the skills necessary to complete basic digital functions, such as using a computer with a modern operating system, using e-mail, and obtaining information using Internet search tools, enhance an individual’s ability to realize the benefits of broadband connectivity.
Table 7 presents the potential social and economic benefits related to Digital Literacy identified in literature and defined in Interim Report 1.
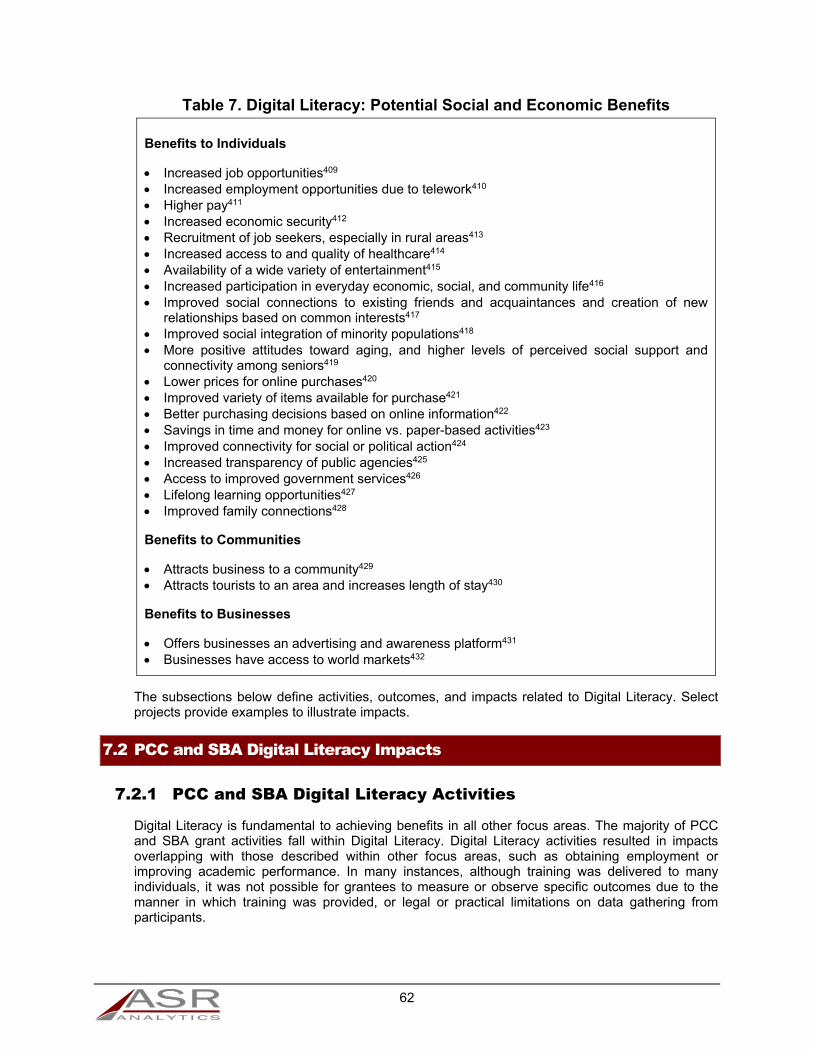
62
Table 7. Digital Literacy: Potential Social and Economic Benefits
Benefits to Individuals
Increased job opportunities409 Increased employment opportunities due to telework410 Higher pay411 Increased economic security412 Recruitment of job seekers, especially in rural areas413 Increased access to and quality of healthcare414 Availability of a wide variety of entertainment415 Increased participation in everyday economic, social, and community life416 Improved social connections to existing friends and acquaintances and creation of new
relationships based on common interests417 Improved social integration of minority populations418 More positive attitudes toward aging, and higher levels of perceived social support and
connectivity among seniors419 Lower prices for online purchases420 Improved variety of items available for purchase421 Better purchasing decisions based on online information422 Savings in time and money for online vs. paper-based activities423 Improved connectivity for social or political action424 Increased transparency of public agencies425 Access to improved government services426 Lifelong learning opportunities427 Improved family connections428
Benefits to Communities
Attracts business to a community429 Attracts tourists to an area and increases length of stay430
Benefits to Businesses
Offers businesses an advertising and awareness platform431 Businesses have access to world markets432
The subsections below define activities, outcomes, and impacts related to Digital Literacy. Select projects provide examples to illustrate impacts.
7.2 PCC and SBA Digital Literacy Impacts
7.2.1 PCC and SBA Digital Literacy Activities
Digital Literacy is fundamental to achieving benefits in all other focus areas. The majority of PCC and SBA grant activities fall within Digital Literacy. Digital Literacy activities resulted in impacts overlapping with those described within other focus areas, such as obtaining employment or improving academic performance. In many instances, although training was delivered to many individuals, it was not possible for grantees to measure or observe specific outcomes due to the manner in which training was provided, or legal or practical limitations on data gathering from participants.
63
Training: Digital literacy training includes instructor-led courses and self-paced, individual learning activities. Training topics range from basic computer operations to more advanced digital tools and techniques.433
Access to computers with broadband: Grant-funded workstations and Internet connections provided access to individuals without home connections due to financial or geographic limitations.434
Outreach: Outreach campaigns focused on promoting the benefits and capabilities of broadband.435
7.2.2 PCC and SBA Digital Literacy Outcomes
The most prominent outcome of grant-funded training and equipment was the acquisition of digital literacy skills. All PCC and SBA projects in the evaluation study sample reported instances of new users acquiring skills or existing users improving their digital literacy skillset.436 While all projects in the evaluation study sample offered programs to aid users in developing basic computer skills, some projects offered training and resources to help patrons build proficiency in more advanced digital applications.
7.2.3 PCC and SBA Digital Literacy Impacts
Potential social and economic benefits of improved digital literacy accrue across all of the focus areas, as digital literacy is foundational to the use of broadband. The most commonly observed impacts resulting from the acquisition of digital literacy skills include participants obtaining a job or a promotion. Grantees also reported instances of digital literacy skills improving social connections among trainees. The following list provides illustrative examples drawn from case study reports.
Obtain a job: As described in Section 2, the acquisition of basic digital literacy skills can improve participants’ ability to obtain employment by improving their professional skillset.437
o City of Chicago: Grant-funded programs offer digital literacy training and one-on-one employment and financial counseling programs. Program staff estimated that enrollees who completed digital literacy courses exhibited a job placement rate 13 percentage points higher than attendees who did not participate in the training. In 2011 and 2012, grant programs placed 1,118 employment-counseling enrollees in jobs.438
o City of Chicago: Some Everyday Digital graduates who were not enrolled in employment-specific training were able to translate their general digital literacy skills into Workforce and Economic Development outcomes. Examples include pay raises or promotions with their current employer because of their increased technical skills and enrollment in Certificate of High School Equivalency and associate degree programs at area community colleges.439
o C.K. Blandin Foundation (C.K. Blandin): The Minnesota Department of Employment and Economic Development (DEED) developed digital literacy training curriculum and made it available to all Demonstration Communities, as well as to other organizations in rural Minnesota. The grantee reported that many users retained jobs, were promoted, or were placed in new jobs due to the training.440
Improved Social Connections: Digital literacy skills enabled users to realize improved social connections. These connections include relationships with family and friends, and senior social participation. Learning to use a computer and broadband enabled participants to communicate with friends and family via e-mail and social media sites.441
o Cambridge Housing Authority (CHA): Participants learned to use the Internet to connect to their families, to their community, to their native countries, and to information about their interests and goals, including reading online news or job searching. Students learned to use the Internet to save money communicating with relatives, which is of particular importance to students, as many are speaking with those in their native countries via telephone.442
64
o Foundation for California Community Colleges (FCCC): After completing digital literacy training, many trainees turned to web-based tools as their primary means of maintaining social connections. According to student trainers, most of the trainees continued to use their Skype or social media accounts after training. Trainers also reported similar impacts regarding Gmail accounts, which trainees established during training.443
Benefits to individuals: While all PCC and SBA projects in the evaluation study sample offered some form of digital literacy training, few had mechanisms in place to measure the benefits realized by participants.444 As outlined in Table 7, literature has shown that the acquiring digital literacy skills can lead to a wide variety of social and economic impacts for individuals.
o Technology for All (TFA): Computer centers helped individuals transition to more permanent housing. Staff used the grant-funded computers to train patrons in personal financial management skills and to search for housing. TFA staff reported that, since 2010, more than 1,000 people had found permanent housing using grant-funded equipment and services.445
o C.K. Blandin: Project partners reported that students in the digital literacy training sessions were able to continue their education successfully after completing the class. For example, two students who were struggling in community college attended a digital literacy class, and were then able to go back to school and complete their classes at the community college. These students graduated in spring 2013 with associate degrees.446
7.2.4 PCC and SBA Digital Literacy Longitudinal Analysis
The purpose of the longitudinal analysis is to compare observations from Round 1 with observations from Round 2 to identify changes over time. The evaluation study team will use these data in the Final Report to assess the impact of BTOP. In Interim Report 1, the evaluation study team presented a selection of baseline activities and outcomes observed during site visits conducted between July and December 2011 for each of the five focus areas presented in Interim Report 1. The evaluation study team identified data elements to measure potential benefits, based on the data grantees reported collecting or intended to collect.
During Round 2 site visits, performed between January and June 2013, the evaluation study team obtained the data related to the potential benefits defined in Interim Report 1 from case study participants, when such information was available. Data collected during Round 2 site visits indicate that grantees continued to provide services and resources to support the development of individuals’ digital skillset, enabling the realization of a wide range of benefits attributable to their ability to interact with digital aspects of culture.
Be aware of the benefits of broadband technology
o C.K. Blandin Foundation (C.K. Blandin): Regional Development Commissions (RDC) provide outreach and coordinate and promote statewide partner resources. By the end of the award period, project partners had reached 256,018 individuals through media awareness campaigns and by convening events carried out by RDCs.447 Through the end of 2013, the grant delivered 18,022 hours of digital literacy training.448 The project generated a total of 56,663 new subscribers. 449
o California Emerging Technology Fund (CETF): CETF expanded twenty-seven 2-1-1 telephone line centers and databases in California to include broadband services in the 2-1-1 umbrella of resources. As of June 11, 2013, 2-1-1 screened more than 250,000 callers. Based on an assessment of skill level and technology ownership, they referred more than 45,000 callers to resources for obtaining a computer or digital literacy skills. Of these, 2-1-1 estimates that 7,478 households subscribed to broadband due to the information presented during screening calls.450
65
Be able to use a computer with a modern operating system, including understanding how to use a keyboard, a mouse, and a visual interface incorporating icons and folders and a web browser, such as Internet Explorer, Google Chrome, or Firefox
o Cambridge Housing Authority (CHA): CHA provided access to computers with broadband in or near public housing complexes and provided training in basic computing and Internet skills. CHA discontinued the collection of data for monthly tenant services reports.451 By the end of 2012, 692 students had participated in 35,066 hours of Gateways training.452 CHA delivered 19,541 hours of Strictly Computers training to 585 participants. Throughout the award period, 362 participants completed 8,871 hours of Parents ROCK training.453 According to interviewees, the primary impacts to users include the acquisition of digital literacy skills, improved social connections, and an enhanced awareness of the Internet’s capabilities. Digital literacy skills improved foreign-born residents’ ability to access the most effective English language-learning resources, to connect with the local community, and to communicate with relatives in their native countries.454
o Foundation for California Community Colleges (FCCC): FCCC provided training in basic digital literacy. After training, many participants adopted web-based tools as a primary means of maintaining social connections. Trainers reported that most of the trainees continued to use Skype, social media, and Gmail accounts after training.455 Evaluator and site visit data were not provided.
Shop for and obtain an affordable computer with adequate capabilities, including locating organizations/services that distribute free or low-cost computers
o Connect Arkansas: Connect Arkansas offered a series of technology workshops to develop basic digital literacy and Internet skills targeting low-income K-12 students who qualify for free or reduced cost lunch and do not have a computer at home. A parent or family member is required to attend the class with each student. Students who complete the three-day training program receive a free computer. Connect Arkansas distributed 1,174 free, refurbished computers to qualifying families trained through its Computers 4 Kids program through March 31, 2013. Sixty-two percent of program participants subscribed to broadband upon completion of the course, suggesting that one of the barriers to adoption was the cost of a computer. Survey data indicated that participants gained an improved set of digital literacy skills and a greater understanding of computers and the Internet. Parents learned about computer security and navigating the Internet. Students learned to assemble computers through a hands-on exercise and received an overview of basic Microsoft Office programs and the Internet.456
o Urban Affairs Coalition (UAC): UAC distributed 5,000 laptops to public housing residents participating in an eight-hour computer and Internet basics course. By the end of June 2013, 5,048 Philadelphia Housing Authority (PHA) residents completed the training course and earned a free netbook. Users gained skills to engage in a variety of activities, including basic computer operations, using e-mail and social media, online job searching, accessing government services, and managing personal finances. PHA residents reported using their netbooks and skills gained through training to apply for jobs, complete community college course assignments, and use online banking services.457
o UAC: UAC offered low-cost broadband subscriptions to program participants. UAC encourages home broadband adoption by promoting two low-cost Internet access options, Comcast Internet Essentials and Wilco/Mobile Citizen’s Internet. UAC reported that by the end of June 2013, more than 1,900 households and 50 businesses or CAIs subscribed to broadband through these programs. The grantee reported that for some users, the reduced cost of access eliminated a major barrier to home subscription.458
o FCCC: FCCC provided training to create informed broadband consumers. According to FCCC’s reports, by March 31, 2013, at least 9,151 individuals had subscribed to broadband as a direct result of California Connects activities. This value reflects MESA program participants and survey respondents who indicated that they subscribed to broadband during the grant period. This estimate likely under represents the extent to which broadband subscriptions had grown, as trainees may share information and skills
66
with family and friends.459 Training and outreach methods generated new broadband subscriptions as those reached by grant programming learned the value of broadband. Trainers stated that trainees frequently purchased personal computers after completing training.460
Understand how to perform basic online activities
o City of Chicago: The City of Chicago provided training in basic computer skills, e-mail, locating information on the Internet, using spreadsheets, taking classes online, downloading forms, uploading photographs, creating a website, social networking sites, and downloading music. The grantee reported in its 2012 APR that it provided 36,326 hours of digital literacy training.461 FamilyNet Center managers reported that students adopted e-mail, Skype, and social media to maintain more frequent contact with relatives and friends abroad. They also observed parents become more involved in their children’s lives through a greater understanding of social media sites and the use of PowerSchool, an online application used by Chicago Public Schools (CPS) to track students’ attendance and progress. 462 Some Everyday Digital graduates who were not enrolled in employment-specific training were able to translate their general digital literacy skills into outcomes, including pay raises or promotions, due to their increased technical skills or enrollment in Certificate of High School Equivalency and associate degree programs at area community colleges.463
o FCCC: FCCC provided training in e-mail and Internet safety. As of March 31, 2013, 3,301 individuals had graduated from the GVC training program.464 Parents who participated in GVC training learned to use e-mail and learning management systems to maintain connections with teachers and school administrators. GVC trainers provided examples of parent participants who gained the skills necessary to use online learning resources, search engines, and Google Translate to support their children’s educational needs.465
Be able to use software and applications to present and manipulate documents and data, including word processing, creating spreadsheets, creating presentations, and creating or manipulating simple databases
o Las Vegas-Clark County Urban League (LVUL): LVUL provided training in Microsoft Office applications and other basic computing. In its 2012 APR, LVUL reported delivering 47,877 hours of digital literacy training.466 During the site visit, instructors indicated that, by taking basic computer and Internet courses, patrons learned to use social media to communicate with family who live in different cities or states, or in a foreign country. Course participants also used their newly acquired skills to check e-mail, create documents using Microsoft Word, purchase items online, and perform online banking.467
o Technology for All (TFA): TFA provided advanced training in Microsoft Office applications. The project devoted more than 800,000 training hours to Basic Internet and Computer Use training, which represented the most popular training class of the project. TFA trainers observed progress in digital literacy skills of users. Many PCC users stated that they struggled with basic computer skills, such as using the keyboard, copying and pasting, and finding information online. Likewise, these users lacked skills and experience in more advanced activities such as Microsoft Word, Excel, and PowerPoint, and digital communication. For example, a semester-long class began with basic training and concluded with Microsoft Office Suite training. At the end of the class, participants who started with little to no computer experience were able to create their own graduation announcements using Microsoft Publisher.468
7.3 CCI Digital Literacy Impacts
7.3.1 CCI Digital Literacy Activities
Digital literacy is fundamental to achieving benefits in all other focus areas. As a result, Digital Literacy activities result in impacts that overlap with those described within other focus areas. In

67
many instances, although digital literacy training was available and delivered to individuals, it was not possible for grantees to measure outcomes or impacts.
Training: Some CAIs delivered digital literacy training programs, including instructor-led courses and self-paced, individual learning activities. Training topics may include basic computer operations through more advanced digital tools and techniques.469
Access to broadband: CAIs obtained broadband connections through grant-funded fiber networks, providing access to individuals without home connections because of financial or geographic limitations.470
7.3.2 CCI Digital Literacy Outcomes
The most prominent outcome of CAIs delivering training and providing clients with reliable broadband access was the acquisition of digital literacy skills. Some CAIs offered programs to aid users in developing basic computer skills, while others offered training and resources to help patrons build proficiency in more mission-specific applications.471 For example, some libraries provide training to teach patrons how to use a tablet for e-reading. This outcome may also include practicing an existing or new digital skillset to engage with digital aspects of culture.
7.3.3 CCI Digital Literacy Impacts
Potential social and economic benefits of improved digital literacy accrue across all of the focus areas, as digital literacy is foundational to the use of broadband. The most commonly observed impacts resulting from the acquisition of digital literacy skills and broadband access include participants engaging in economic, social, and community life, and accessing a variety of entertainment. Although broadband access and digital literacy skills allow for the realization of numerous benefits, interviewees had limited data related to digital literacy impacts. The following list provides illustrative examples drawn from case study reports.
Increased participation in everyday economic, social, and community life: Training participants use digital literacy skills and broadband access to interact with peers, family members, and their communities via e-mail, social media, and other interactive platforms.
o MCNC: Digital literacy initiatives in higher education focus on providing access rather than training. This is largely accomplished by the provision of public computer labs and wireless networks. College representatives remarked that a great deal of traffic on these networks is related to personal use, including social media, e-mail, and entertainment. Nearly all reported an upward trend in wireless network utilization, which they attributed to the increasing popularity of mobile devices. Connecting to the North Carolina Research and Education Network (NCREN) has allowed these institutions to obtain greater bandwidth to accommodate increased levels of traffic that they may not have been able to afford otherwise. This is particularly true for colleges in rural areas where Internet providers are sparse.472
Access to entertainment: Digital literacy skills and a reliable broadband connection enable users to access a wide variety of entertainment.473
o Executive Office of the State of West Virginia (West Virginia): Improved library connections have led to an expansion of services. Both libraries the evaluation study team visited are members of the West Virginia Digital Entertainment Library Initiative (WVDELI), a consortium of ten libraries that share digital materials for circulation. Each library invested $10,000 worth of content, totaling 35,000 items available for checkout. Bridgeport Public Library (BPL) has doubled the number of online research databases and added Zinio, an online magazine subscription service, and Freegal, a free music download service. Kanawha County Public Library (KCPL) also purchased a license for Freegal that was implemented in October 2013. Bandwidth constraints existing before the grant-funded upgrade would have limited the use of these services.474
68
General benefits to individuals: Although some of the CAIs interviewed offered digital literacy training or resources, few had mechanisms in place to measure the benefits realized by participants. In addition to the impacts described above, interviewees reported outcomes that had not yet directly resulted in impacts, but likely will lead to impacts in the near future.475 Literature has shown that the acquisition of digital literacy skills can lead to a range of social and economic impacts for individuals.
o MCNC: Lee County Schools (LCS) has emphasized digital literacy development among instructional staff since the deployment of its one-to-one laptop program. Teachers completed fourteen hours of staff training. They are also required to participate in monthly technology training.476
o West Virginia: BPL and the KCPL offer one-on-one training ranging from device usage, including iPad, Kindle, and Nook, to software usage, such as Microsoft Word, Excel, and Publisher. BPL stated that its wireless network has improved significantly because of the grant and it is considering purchasing laptops to hold group training sessions.477
69
Section 8. Best Practices Each of the forty-two case study reports the evaluation study team developed included a section describing the grantee’s successful tools, techniques, and strategies. In total, the evaluation study team described more than 400 of these items. The evaluation study team analyzed and synthesized these topics to describe the best practices included in this section.
8.1 PCC and SBA
Tailoring course material: PCC and SBA grantees found that patrons receiving training, especially training in digital literacy, responded best to tailored courses that addressed specific tasks and goals, rather than more general curricula about broadband technology. Teaching students how to do specific things, such as signing up for a broadband connection or searching for a job online, resulted in greater student motivation and achievement.478 Curriculum should be tailored, as needed, to meet the expectations of the community it serves.479 Teachers should also ideally possess some familiarity with the background of the target population for the program.480
Understanding specific needs: Several grantees reported using entry interviews or surveys to gather information about what a new broadband user’s specific interests were, in order to direct them to appropriate courses or to tailor course content to their needs.481 PCC and SBA grantees also reported that modification of course content based on student progress and that feedback helped to increase or retain student interest.482 Some PCC and SBA grantees did not initially expect the low levels of adoption readiness presented by some patrons, especially among speakers of a language other than English, and those with low levels of literacy. A modified curriculum or instructional approach was often used to address these issues.483
Offering support and encouragement: PCC and SBA programs commonly mentioned activities intended to support and encourage students. Personal interactions with instructors, including reminders to students of upcoming classes, follow-up communications with students who miss a class, and quarterly correspondence with students to track progress, were all cited as activities that improve class attendance and student retention.484 Some grantees employed tangible rewards to increase student participation and retention. Examples of this included earned netbooks or computers and graduation ceremonies or certificates for passing curriculum components.485
Connecting to brick-and-mortar locations: Grantees reported that broadband training complements other services, such as job training and social service assistance, which might be offered in the same location as the computer lab. Colocation with other services that offer referrals and tie-ins to the activities of the organization hosting the computer center were used to increase the relevance of the broadband training offered.486
Paying attention to privacy, security, and data storage: Grantees reported that students were concerned about losing their data or passwords, as is the case with many computer users. Computer centers took steps to address these concerns in order to increase the level of confidence students would have in using the computer center. Specific activities included establishing a centralized e-mail account for online password resets, providing secure storage of usernames and passwords in written form, centralized password management for all centers in the grantee’s network, the use of server backups to preserve student’s work, and attention to computer security settings to protect personal information.487
Leveraging, improving, and sustaining partnerships: Many PCC and SBA grantees described partners as essential to the success of their projects. Partners helped grantees to take on projects that were larger in scope and complexity.488 Grantees found that established

70
partners, especially those with whom they had pre-existing relationships, were the most valuable additions to the project team.489 SBA and PCC grantees found that relationships with partners provided not only resources and capabilities for the project, but also resulted in referrals for students to other partner activities.490 PCC and SBA grantees often stated that managing and improving partner relationships took significant effort, and that it was especially important to maintain strong lines of communication.491
Engaging the community: PCC and SBA grantees described how community engagement improves project outcomes.492 Each community has different needs, and devolving administration to the community level helps to improve interest in the program and increases successful outcomes.493 At the same time, community partners should be chosen carefully to align interests with the program.494
Using traditional means of communication for outreach, instead of a website or e-mail: Postal mail, telephone calls, 1-800 numbers, door-to-door outreach, and radio broadcasts were all reported as methods that resulted in successful engagement with prospective students, as many did not have Internet access at home.495 Word-of-mouth and the use of community members to promote awareness is an important aspect of communication.496 Outreach events held at familiar brick-and-mortar locations provide a place for social connection.497 Outreach events may also be held at PCCs, especially to increase awareness.498
Standardizing hardware purchases and planning for flexible use: Standardization of equipment facilitates a consistent user experience, improves outcomes, facilitates maintenance, and reduces costs.499 Using laptops or all-in-one workstations increases program flexibility and allows for relocation of computers.500 Grantees also reported that mobile labs can help to reach community members, and that hardware other than computer workstations, such as teleconferencing equipment, is also helpful to achieve program goals.501
8.1.1 Challenges Broadband availability affects project success: Broadband connectivity was not always
available at host sites. This made instruction more difficult.502 Wireless hotspots were used to support projects in areas with no broadband service.503 The cost of broadband made a home connection unaffordable for some, especially those affected by the economic downturn.504 Local ISPs were seen as potentially helpful partners, although success in cooperating to achieve program goals was mixed.505
Reporting project results requires extensive data management: Grantees reported that accurately capturing information about the impacts of their activities was an ongoing challenge. Challenges in this area resulted in a quantitative view of the impacts of the program limited largely to information captured in PPRs and other reports to NTIA. Four aspects of data gathering and management were especially problematic:
o The definition of program goals and activities defined by grantees at times did not align with terms used by NTIA. For example, one grantee developed goals using different definitions for average users per week, number of users trained, and training hours. This resulted in training targets that were over- or understated versus the capabilities developed by the grantees.506
o An estimate of broadband subscriptions as a result of project activities was especially difficult to obtain.507
o Data gathering methodologies were difficult to implement and maintain throughout the life of the project. PCC and SBA grantees reported using off-the-shelf tools like ServicePoint, Excel templates, online database tools, and paper reports to capture data. While most grantees eventually settled on a reporting methodology, what worked for one grantee was unhelpful to another.508
o The gathering of data on the population served was problematic. Members of the vulnerable populations targeted by grants were unlikely to complete mandatory surveys, limiting the comprehensiveness of data obtained using these methods.509
71
o Some grantees reported that they were not able to collect detailed outcome data due to human subject research restrictions that prevented gathering longitudinal data on individuals or surveying minors.510
8.2 CCI
CCI projects offered relatively fewer examples of best practices than PCC and SBA projects, and these best practices were widely shared across grantees. All grantees in the sample had some experience in the telecommunications space. Many of the factors that contributed to project success were continuations of proven business models as applied to the construction of infrastructure, and are not included here. The two best practices below summarize how these grantees rapidly built the BTOP-funded network in a compressed timeframe. Challenges with Environmental Assessments were the major hurdle to overcome in meeting this schedule, as described by several grantees.
Explaining the benefits of broadband: Grantees leveraged existing relationships with potential CAIs, elected officials, and community leaders to identify potential CAIs and to promote the benefits of the BTOP-funded projects.511 Some grantees developed estimates of the benefits of broadband use, potential cost savings, and return on investment to better inform potential CAIs of the benefits of the project.512 Grantees reported that public events and educational meetings were useful in educating potential users on the benefits of broadband.513
Flexible and dynamic bandwidth allocation: Some grantees allowed CAIs to better understand their broadband needs and to increase their level of service as their needs grow.514 These grantees connected CAIs using technologies that allow for instantaneous bandwidth increases for specific events or when needs increase.515 One grantee gave existing customers access to 1 Gbps for a trial period in order to help customers determine bandwidth need.516
Collaborative planning with partners and subscribers: Grantees planned network infrastructure to take into account the location of CAIs and businesses that could potentially use it.517 This meant including ISPs in the planning and development of the network.518 Grantees also facilitated matching between ISPs and CAIs, which provided CAIs with more information regarding broadband subscribership choices.519 Several grantees used interconnection and fiber swap agreements to increase the scope and utility of the BTOP infrastructure.520
8.2.1 Challenges Environmental Assessments: At least half of the grantees in the evaluation study sample did
not clearly understand or plan for the required Environmental Assessment. This resulted in unexpected costs and project delays of up to one year, as well as unexpected costs for work effort.521

72
Section 9. Conclusions The Recovery Act instructed NTIA to implement BTOP to promote five core purposes:522
1. Provide access to broadband service to consumers residing in unserved areas of the country.
2. Provide improved access to broadband service to consumers residing in underserved areas of the country.
3. Provide broadband education, awareness, training, access, equipment, and support to:
a. Schools, libraries, medical and healthcare providers, community colleges and other institutions of higher learning, and other community support organizations.
b. Organizations and agencies that provide outreach, access, equipment, and support services to facilitate greater use of broadband services by vulnerable populations (e.g., low-income, unemployed, seniors).
c. Job-creating strategic facilities located in state- or federally designated economic development zones.
4. Improve access to, and use of, broadband service by public safety agencies.
5. Stimulate the demand for broadband, economic growth, and job creation.
This section summarizes findings from the evaluation study team’s forty-two site visits and grantee-reported data describing how BTOP grantees encouraged the fulfillment of these Recovery Act goals. The evaluation study team found evidence that BTOP supported each of these goals, although not all grantees intended to support each goal.
9.1 Improve Access to Unserved and Underserved Areas of the Country
The first two goals of the Recovery Act encourage improved access for unserved and underserved areas:
Provide access to broadband service to consumers residing in unserved areas of the country.
Provide improved access to broadband service to consumers residing in underserved areas of the country.
9.1.1 Improved Access to Unserved and Underserved Areas through PCC and SBA Grants
The PCC and SBA grants provided computer and broadband resources, such as hardware, software, training, and support, to vulnerable populations. PCC grants provided access to equipment and broadband primarily through public computer centers and limited distribution of computers to individuals. SBA grants provided affordable computer and broadband access by distributing personal devices, such as laptops, and providing access to affordable broadband subscriptions to eligible individuals. The objective of these activities was to maximize broadband access and adoption. Access and adoption are expected to induce positive social and economic outcomes among vulnerable populations, including low-income individuals, the unemployed, seniors, children, minorities, and people with disabilities.523 The following are examples of PCC and SBA projects that engaged in activities aimed at achieving these goals.
Cambridge Housing Authority (CHA): CHA’s Community Computer Centers program provided funding to reopen and establish public computer centers and provided the members of

73
vulnerable populations with digital literacy, software, and job training.524 CHA reopened and expanded three public computer centers that serve approximately 10,000 public housing residents, including low-income households, immigrants, seniors, and minorities.525
The City of Chicago: This project funded the Smart Communities program to promote broadband access and adoption among low-income, minority, English for speakers of other languages (ESOL), senior, and youth populations in Chicago’s Auburn Gresham, Chicago Lawn, Englewood, Humboldt Park, and Pilsen neighborhoods.526 The project also established the Civic 2.0 program, which connects community leaders to digital resources. The project’s Business Resource Networks (BRN) worked with small and medium-sized business owners to help integrate the use of technology, broadband in particular, into their day-to-day operations. As of December 2012, BRN consultants provided technology assessments for 461 community businesses in the service area, resulting in 335 technology action plans. During the grant period, BRN coordinators distributed desktop computers to 100 local business owners.527
9.1.2 Improved Access to Unserved and Underserved Areas through CCI Grants
CCI projects funded by BTOP are predominantly middle mile projects, although a small number of last mile projects were awarded. CCI grants are intended to improve available broadband capabilities for CAIs, to facilitate the development of last mile services in unserved and underserved areas, and to promote economic growth. This investment through the BTOP grant is intended to “lay the foundation for the ultimate provision of reasonably priced end-user broadband services” through open and nondiscriminatory interconnection strategies to enable last mile providers to have open access to the network.528
There is considerable debate on the impact of open access policies on the competiveness of the broadband market.529 Open access is implemented through a wide variety of strategies. “These can range from commercial or voluntary arrangements, between communication operators and third-parties, to regulatory intervention aimed at promoting certain policy objectives, such as expanding broadband availability, increasing competition, or promoting investment that may otherwise not be economic, such as in the case of enabling the establishment and treatment of shared facilities.”530 The impact of open access will be dependent upon how well the practices and policies help to reduce the time, cost, and difficulty for last mile providers to interconnect to the network.531 The impact also depends on how well the policy mechanisms ensure competitive pricing for wholesale services in the event of the presence of a middle mile provider that may also be a last mile provider.532
CCI projects provided high-speed broadband services over fiber-based open access networks to unserved and underserved areas of the country. This improved infrastructure facilitated direct, grant-funded connections to CAIs in these unserved and underserved areas. It also provides an incentive for third-party service providers to connect to the network to offer competitively priced, enhanced service offerings to CAIs, households, and businesses. The grantees interviewed by the evaluation study team were able to leverage resources such as existing relationships with CAIs, state and local governments, and economic development organizations to demonstrate demand for enhanced connectivity and services that the grants could provide.533
Grantees also were able to leverage their own organizational resources and strategic purchasing policies to negotiate favorable terms on interconnection agreements to regional data centers and major Internet exchange points. These resources allowed the grantees to obtain access and services at reduced costs and to develop pricing models that allow CAIs and third-party service providers to obtain affordable network connectivity at speeds that were not possible before BTOP.534 Effective working relationships with network operators and service providers allowed grantees to facilitate agreements with third-party providers that provided network design, operations, or maintenance services. These activities helped to maximize the versatility of the grant-funded network.535

74
Figure 10 displays the number of CAIs connected by CCI grantees, starting in the third quarter of 2010 through the third quarter of 2013.536 CCI grantees were successful in connecting almost 20,000 CAIs during this time. As grantee award periods started to end in the last quarter of 2012, these grantees no longer submitted quarterly reports. In these cases, the total number of connected CAIs reported in the grant’s last PPR was included in subsequent quarters. Connected CAIs were assumed to continue their connection in future reporting periods based on the most recently available PPR. These instances are noted with “Estimated” in the figure below. As of June 30, 2013, sixty-one projects had completed their project activities.537
Figure 10. Cumulative CCI Community Anchor Institution Connections
In addition to CAI connections, the number of interconnection points built into the networks and the existence of signed service agreements between the grantee and third-party service providers, are useful short-term indicators of the efficacy of open access policies. These components help lay the foundation upon which providers can use the open network infrastructure to access affordable connectivity to provide competitive broadband services. As of September 30, 2013, CCI grants had constructed nearly 7,000 points of interconnection to encourage third-party service providers to use the network. In addition to interconnection points, grantees established agreements with third-party service providers and broadband wholesalers to operate on their networks. Figure 11, below, displays the number of signed agreements by quarter during the grant award period.538 As of September 30, 2013, CCI grantees had nearly 800 signed agreements with third-party service providers and broadband wholesalers. As grantee award periods started to end in the last quarter of 2012, these grantees no longer submitted quarterly reports. In these cases, the total number of signed agreements reported in the grant’s last PPR was included in subsequent quarters. Signed agreements were assumed to continue their agreement in future reporting periods based on the most recently available PPR. These instances are noted with “estimated” in the figure below. Although the figures reported below are cumulative, some grantees made modifications to the previously reported number of agreements in subsequent quarters. These modifications may result in a reduction in the count of signed agreements from one period to the next. No adjustments were made to previous reporting periods to account for changes made in future reporting periods.
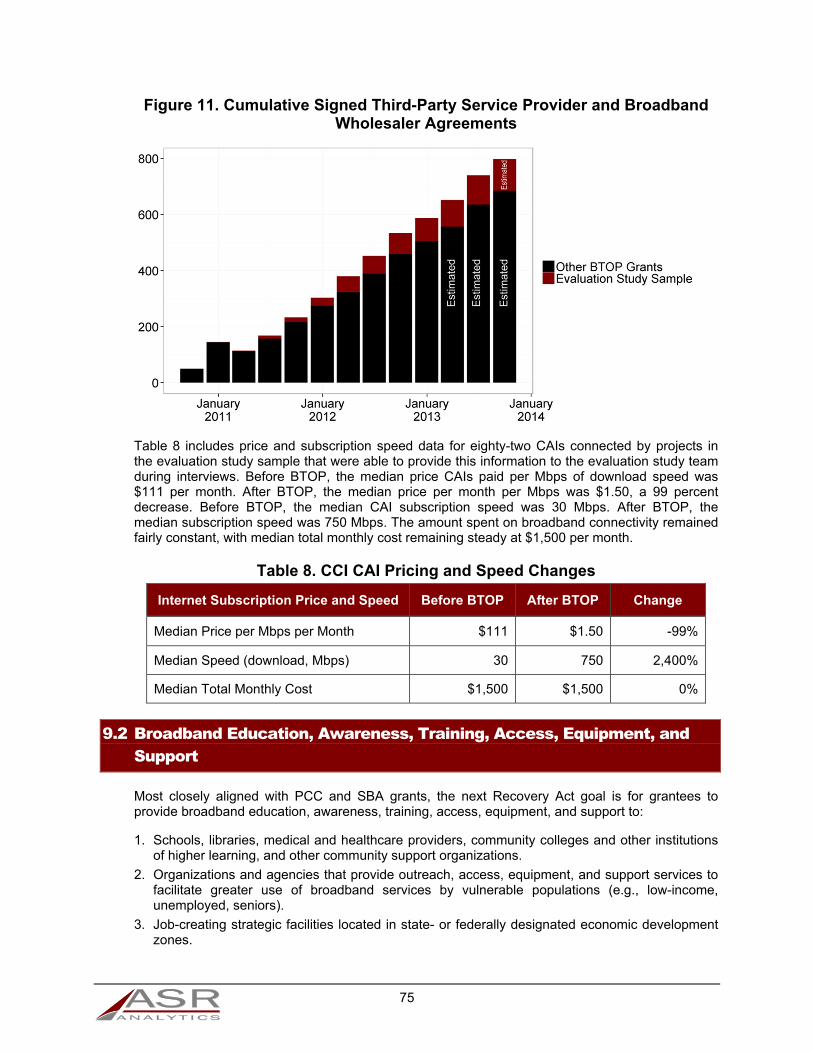
75
Figure 11. Cumulative Signed Third-Party Service Provider and Broadband Wholesaler Agreements
Table 8 includes price and subscription speed data for eighty-two CAIs connected by projects in the evaluation study sample that were able to provide this information to the evaluation study team during interviews. Before BTOP, the median price CAIs paid per Mbps of download speed was $111 per month. After BTOP, the median price per month per Mbps was $1.50, a 99 percent decrease. Before BTOP, the median CAI subscription speed was 30 Mbps. After BTOP, the median subscription speed was 750 Mbps. The amount spent on broadband connectivity remained fairly constant, with median total monthly cost remaining steady at $1,500 per month.
Table 8. CCI CAI Pricing and Speed Changes
Internet Subscription Price and Speed Before BTOP After BTOP Change
Median Price per Mbps per Month $111 $1.50 -99%
Median Speed (download, Mbps) 30 750 2,400%
Median Total Monthly Cost $1,500 $1,500 0%
9.2 Broadband Education, Awareness, Training, Access, Equipment, and Support
Most closely aligned with PCC and SBA grants, the next Recovery Act goal is for grantees to provide broadband education, awareness, training, access, equipment, and support to:
1. Schools, libraries, medical and healthcare providers, community colleges and other institutions of higher learning, and other community support organizations.
2. Organizations and agencies that provide outreach, access, equipment, and support services to facilitate greater use of broadband services by vulnerable populations (e.g., low-income, unemployed, seniors).
3. Job-creating strategic facilities located in state- or federally designated economic development zones.
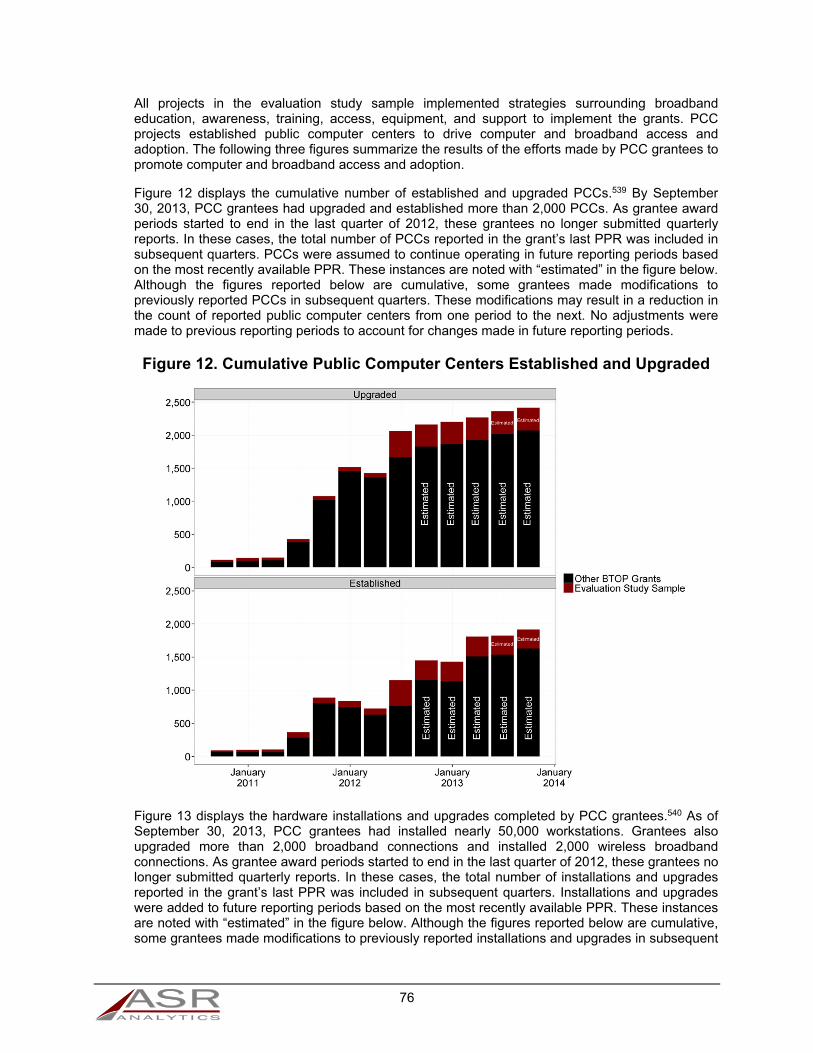
76
All projects in the evaluation study sample implemented strategies surrounding broadband education, awareness, training, access, equipment, and support to implement the grants. PCC projects established public computer centers to drive computer and broadband access and adoption. The following three figures summarize the results of the efforts made by PCC grantees to promote computer and broadband access and adoption.
Figure 12 displays the cumulative number of established and upgraded PCCs.539 By September 30, 2013, PCC grantees had upgraded and established more than 2,000 PCCs. As grantee award periods started to end in the last quarter of 2012, these grantees no longer submitted quarterly reports. In these cases, the total number of PCCs reported in the grant’s last PPR was included in subsequent quarters. PCCs were assumed to continue operating in future reporting periods based on the most recently available PPR. These instances are noted with “estimated” in the figure below. Although the figures reported below are cumulative, some grantees made modifications to previously reported PCCs in subsequent quarters. These modifications may result in a reduction in the count of reported public computer centers from one period to the next. No adjustments were made to previous reporting periods to account for changes made in future reporting periods.
Figure 12. Cumulative Public Computer Centers Established and Upgraded
Figure 13 displays the hardware installations and upgrades completed by PCC grantees.540 As of September 30, 2013, PCC grantees had installed nearly 50,000 workstations. Grantees also upgraded more than 2,000 broadband connections and installed 2,000 wireless broadband connections. As grantee award periods started to end in the last quarter of 2012, these grantees no longer submitted quarterly reports. In these cases, the total number of installations and upgrades reported in the grant’s last PPR was included in subsequent quarters. Installations and upgrades were added to future reporting periods based on the most recently available PPR. These instances are noted with “estimated” in the figure below. Although the figures reported below are cumulative, some grantees made modifications to previously reported installations and upgrades in subsequent

77
quarters. These modifications may result in the downward trends seen below. No adjustments were made to previous reporting periods to account for changes made in future reporting periods.
Figure 13. Cumulative PCC Hardware Installations and Upgrades
Figure 14 includes the average number of weekly PCC users by quarter.541 In ten of the thirteen quarters, PCC grantees had a combined average of at least 1 million weekly users. Individual users may be counted more than once. PCC grantees served the largest number of weekly users in the third quarter of 2012.

78
Figure 14. Average Weekly PCC Users
9.3 Public Safety Agencies
The fourth goal of the Recovery Act is to improve access to, and use of, broadband service by public safety agencies. With the exception of the Future Generations SBA grant, the SBA and PCC grants in the evaluation study sample did not implement programs or engage in activities in support of public safety initiatives. Conversely, each of the CCI grants enabled public safety activities, with the exception of Zayo Bandwidth’s Indiana Middle Mile Fiber for Schools, Communities, and Anchor Institutions project. APR data show that through the end of 2012, CCI grantees connected 3,036 Public Safety entities out of a total of 23,128 connected entities (13 percent).542 Section 5 above describes the impacts observed at the public safety institutions the evaluation study team interviewed during site visits.
9.4 Demand for Broadband, Economic Growth, and Job Creation
The final Recovery Act goal is to stimulate the demand for broadband, economic growth, and job creation. The central activities of PCC and SBA grants are intended to spur economic development and job creation by providing computer and broadband-based technology training and support at the individual level. Implementation of each project results in job creation to the extent that staff members are required to operate facilities and carry out grant activities, such as equipment distribution, outreach and awareness campaigns, training, and support.
Over the short term, the CCI projects spur immediate demand for construction jobs and related employment to design and build the networks. Short-term economic impacts are described in the Short-Term Economic Impacts Report.543
9.4.1 Demand for Broadband
The following figure illustrates the positive impact of BTOP projects on the demand for broadband among businesses and households. Figure 15 shows the cumulative number of household subscribers as a result of SBA projects.544 As of September 30, 2013, SBA projects were successful in getting more than 800,000 households to subscribe to broadband. As grantee award periods started to end in the last quarter of 2012, these grantees no longer submitted quarterly

79
reports. In these cases, the total number of subscribers reported in the grant’s last PPR was included in subsequent quarters. Subscribers were assumed to continue with their subscriptions in future reporting periods based on the most recently available PPR. These instances are noted with “estimated” in the figure below.
Figure 15. Cumulative SBA New Household Subscribers
In addition to the household subscriptions described above, more than 7,000 businesses had subscribed to broadband as of September 30, 2013.
9.4.2 Economic Growth
All three BTOP project types spur economic growth. The PCC and SBA grants foster this growth by promoting broadband adoption, which results in impacts at the individual level, such as increasing broadband education and awareness in schools and training a skilled workforce. CCI projects spur economic growth by promoting broadband availability through the provision of broadband infrastructure. This approach allows communities to attract and retain businesses and supports online entrepreneurship and growth of existing small businesses. An example for each project type is included below.
Florida Agricultural and Mechanical University (FAMU): FAMU’s PCC grant created a new computer center and provided workforce training focused on industry certifications, education, and virtual learning services for student and nonstudent populations.545 The project funded access to training programs and industry certifications for small and disadvantaged businesses and employment training for individuals. The center also hosted interns through Professional Opportunities Program for Students, Inc., which emphasized the personal and professional development of high school students. Patrons use the computer center to complete coursework and finish their college degrees.546
Connect Arkansas: This SBA project focused on teaching the basics of digital literacy, online entrepreneurship, and access to telehealth services.547 Connect Arkansas’ Workforce and Economic Development programs targeted students, entrepreneurs, and existing small businesses. The student component emphasized the integration of entrepreneurship into the state’s high school curriculum. The other major component focused on online entrepreneurship and using broadband to help existing businesses build an online presence. The overarching goal of the project was to foster sustainable economic development and to help Arkansas succeed in an economy increasingly reliant on Internet-based technology.548
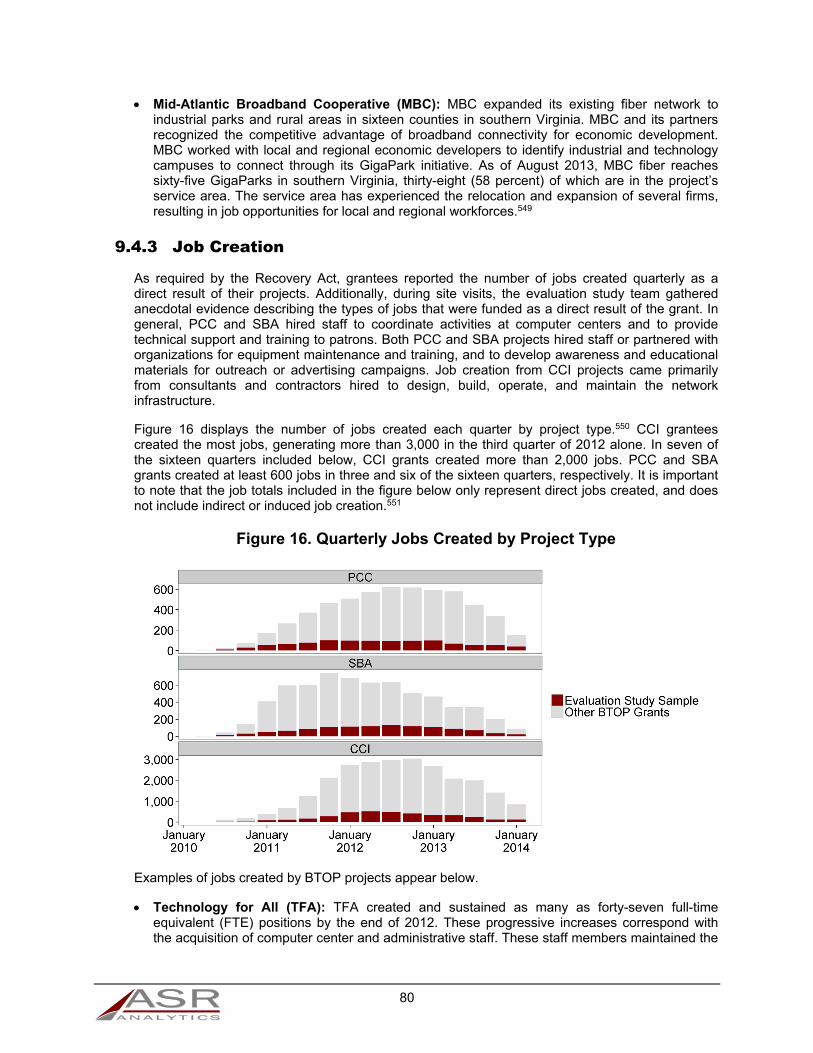
80
Mid-Atlantic Broadband Cooperative (MBC): MBC expanded its existing fiber network to industrial parks and rural areas in sixteen counties in southern Virginia. MBC and its partners recognized the competitive advantage of broadband connectivity for economic development. MBC worked with local and regional economic developers to identify industrial and technology campuses to connect through its GigaPark initiative. As of August 2013, MBC fiber reaches sixty-five GigaParks in southern Virginia, thirty-eight (58 percent) of which are in the project’s service area. The service area has experienced the relocation and expansion of several firms, resulting in job opportunities for local and regional workforces.549
9.4.3 Job Creation
As required by the Recovery Act, grantees reported the number of jobs created quarterly as a direct result of their projects. Additionally, during site visits, the evaluation study team gathered anecdotal evidence describing the types of jobs that were funded as a direct result of the grant. In general, PCC and SBA hired staff to coordinate activities at computer centers and to provide technical support and training to patrons. Both PCC and SBA projects hired staff or partnered with organizations for equipment maintenance and training, and to develop awareness and educational materials for outreach or advertising campaigns. Job creation from CCI projects came primarily from consultants and contractors hired to design, build, operate, and maintain the network infrastructure.
Figure 16 displays the number of jobs created each quarter by project type.550 CCI grantees created the most jobs, generating more than 3,000 in the third quarter of 2012 alone. In seven of the sixteen quarters included below, CCI grants created more than 2,000 jobs. PCC and SBA grants created at least 600 jobs in three and six of the sixteen quarters, respectively. It is important to note that the job totals included in the figure below only represent direct jobs created, and does not include indirect or induced job creation.551
Figure 16. Quarterly Jobs Created by Project Type
Examples of jobs created by BTOP projects appear below.
Technology for All (TFA): TFA created and sustained as many as forty-seven full-time equivalent (FTE) positions by the end of 2012. These progressive increases correspond with the acquisition of computer center and administrative staff. These staff members maintained the
81
PCC facilities, computers, and software. Staff members also regularly traveled between sites to teach classes. Austin Free-Net, a project partner, employed 17.5 FTE employees to support the project efforts, including hiring 13 previously unemployed individuals.552
Urban Affairs Coalition (UAC): The project funded as many as fifty-three FTE positions by the end of June 2012. As of December 2012, the project had sustained more than forty-five FTE positions. The project experienced an increase of nearly twenty FTE positions during the third quarter of 2011, corresponding with the opening of thirteen new training sites and expanded training options across partner organizations.553
Clearwave Communications (Clearwave): The project directly funded more than eighteen FTE positions during four consecutive quarters beginning quarter four of 2011. Clearwave did not report any direct jobs with BTOP funding following the third quarter of 2012. Job creation as a result of the grant appears to have occurred mostly within Clearwave itself, where employment expanded from thirty-two to seventy.554
82
Section 10. Next Steps for the Evaluation Study This section provides a roadmap for the duration of the study and additional information about the matched pairs analysis that ASR will use in the Final Report to assess the economic and social impacts of CCI projects. The goal of this section is to outline the remaining steps to be taken in this analysis, and to present refinements to the methodology presented in the Study Design based on the results of the CCI Case Studies.
10.1 Roadmap for the Remainder of the Study
In June 2014, ASR will deliver a draft Final Report that quantitatively and qualitatively assesses the economic and social impact of BTOP grants (including CCI, PCC, and SBA projects). The centerpiece of the Final Report will be an assessment of how and to what extent BTOP grant awards have achieved economic and social benefits in areas served by the grantees in the sample, and an extrapolation of these benefits to the BTOP program as a whole.
NTIA will have the opportunity to review the draft Final Report and engage peer reviewers, as well as government personnel, to provide constructive critiques of the draft intended to improve the quality of the Final Report.555 ASR will submit a revised Final Report to NTIA in September 2014, along with all raw data that created a foundation for the analysis and conclusions. The data will be delivered in a format that will allow future researchers to utilize them.556 These data will also include the underlying data used to create the Short-Term Economic Impacts Report ASR submitted to NTIA in 2013. This raw data delivery will not include the data used to create the individual case study reports. These data were provided to NTIA in September 2013 for PCC and SBA grants and March 2014 for CCI grants.
As discussed in Section 1.2, ASR performed site visits with twenty-seven BTOP grantees. ASR will contact each grantee during the second quarter of 2014 to understand the extent to which programs initially funded by BTOP are able to continue operating without BTOP funds. ASR will use the results from these follow-up calls to round out the conclusions presented in the Final Report, to the extent possible.
ASR will also request the most recently approved PPRs and APRs from NTIA in April 2014 (see Section 10.12.3 for more information). If these data are available, ASR will provide a final summary of grantee activities in the Final Report.
10.2 Modifications to the Statistical Methodology
Section 5 of the Study Design describes the statistical estimation methodology suggested at the beginning of the project for estimating short-, intermediate-, and long-term impacts of BTOP grants. This analysis was intended to produce material to be incorporated into the Final Report. The statistical estimation methodology was primarily designed to characterize the economic impacts of BTOP CCI grants, although some of the social impacts would also be considered.
Based on information gathered during site visits, the results of the research the evaluation study team has undertaken to date, and contract modifications that have occurred since the statistical estimation methodology was designed, ASR believes that refinements and changes to the methodology are required before the creation of the Final Report. The following subsections describe the statistical methodology the evaluation study team will use in the Final Report, replacing Section 5 of the Study Design.

83
10.3 Purpose of the Statistical Estimation Methodology
The statistical estimation methodology described in the following subsections is intended to quantitatively estimate the economic and social impacts of BTOP CCI grants. During site visits, the evaluation study team obtained little quantitative information on the social and economic impacts of PCC and SBA projects. As noted in the Study Design, it was likely that the qualitative methodology employed would provide a substantial portion of the basis for the analysis provided in the case study reports, and in the “Impact” sections above. Quantitative measures were not consistently gathered by PCC and SBA grantees, as shown by the completed longitudinal analysis sections, also included in the “Impact” sections above. This report includes quantitative data available to the evaluation study team, but quantitative data that may be used consistently for PCC and SBA cases are limited to APR and PPR data. The evaluation study team intends to provide an analysis of data from APRs in the Final Report, if these data are available as of April 11, 2014. This topic is discussed further at the end of this section.
The impacts of CCI grants are more amenable to quantitative analysis, and the information below describes the methodology for extrapolating the social and economic benefits of BTOP CCI grants based on changes in broadband availability that may be attributed to BTOP CCI programs.
10.4 Estimating Short-Term Economic Impacts
ASR has already completed the analysis of BTOP’s short-term economic impacts. Instead of delivering these results with the Final Report, ASR agreed to a contract modification with the government to provide this portion of the Final Report on September 30, 2013. The Final Report will include a summary of the findings presented in the Short-Term Economic Impacts Report.
10.5 Estimating Intermediate-Term and Long-Term Impacts
During the site visits, CCI grant recipients provided the evaluation study team with information on the construction and capacity of the infrastructure they built. A matched pair analysis of treatment and control counties is appropriate given the data provided during interviews and focus groups. The following subsections provide additional information about the matched pairs analysis that ASR will use in the Final Report to provide information about the potential economic and social impacts of CCI projects. The goal of this section is to outline the remaining steps to be taken in this analysis. It replaces the methodology presented in Section 5 of the Study Design in its entirety.
10.6 Matched Pairs Selection
As described in the Study Design, an effective and well-established way to develop estimates of the effects of programs such as BTOP is the use of matched pairs analysis. ASR has developed a matched pairs analysis framework that compares changes in the availability of broadband at the county-level between counties that are served by a selected BTOP CCI grant (treatment counties) and similar counties (control counties). By examining the differences in availability across a large number of treatment-control pairs, it is possible to develop an estimate of the increase in broadband availability, if any, in treatment counties that can be ascribed to BTOP. In other words, the matched pairs analysis provides a means to examine what might have occurred “but for” the BTOP program. To the extent that BTOP CCI counties experience faster growth in broadband availability than similar counties that did not receive a BTOP CCI grant, one can conclude that BTOP may have had an impact on the availability of broadband.
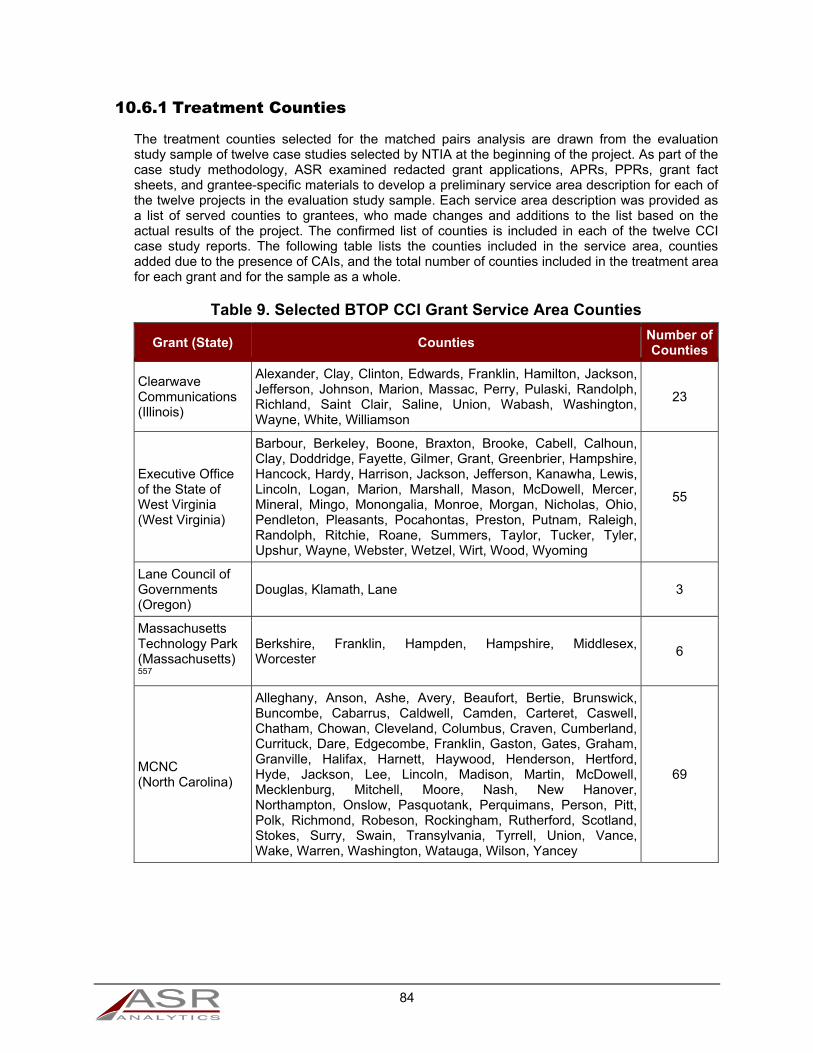
84
10.6.1 Treatment Counties
The treatment counties selected for the matched pairs analysis are drawn from the evaluation study sample of twelve case studies selected by NTIA at the beginning of the project. As part of the case study methodology, ASR examined redacted grant applications, APRs, PPRs, grant fact sheets, and grantee-specific materials to develop a preliminary service area description for each of the twelve projects in the evaluation study sample. Each service area description was provided as a list of served counties to grantees, who made changes and additions to the list based on the actual results of the project. The confirmed list of counties is included in each of the twelve CCI case study reports. The following table lists the counties included in the service area, counties added due to the presence of CAIs, and the total number of counties included in the treatment area for each grant and for the sample as a whole.
Table 9. Selected BTOP CCI Grant Service Area Counties
Grant (State) Counties Number of Counties
Clearwave Communications (Illinois)
Alexander, Clay, Clinton, Edwards, Franklin, Hamilton, Jackson, Jefferson, Johnson, Marion, Massac, Perry, Pulaski, Randolph, Richland, Saint Clair, Saline, Union, Wabash, Washington, Wayne, White, Williamson
23
Executive Office of the State of West Virginia (West Virginia)
Barbour, Berkeley, Boone, Braxton, Brooke, Cabell, Calhoun, Clay, Doddridge, Fayette, Gilmer, Grant, Greenbrier, Hampshire, Hancock, Hardy, Harrison, Jackson, Jefferson, Kanawha, Lewis, Lincoln, Logan, Marion, Marshall, Mason, McDowell, Mercer, Mineral, Mingo, Monongalia, Monroe, Morgan, Nicholas, Ohio, Pendleton, Pleasants, Pocahontas, Preston, Putnam, Raleigh, Randolph, Ritchie, Roane, Summers, Taylor, Tucker, Tyler, Upshur, Wayne, Webster, Wetzel, Wirt, Wood, Wyoming
55
Lane Council of Governments (Oregon)
Douglas, Klamath, Lane 3
Massachusetts Technology Park (Massachusetts)557
Berkshire, Franklin, Hampden, Hampshire, Middlesex, Worcester
6
MCNC (North Carolina)
Alleghany, Anson, Ashe, Avery, Beaufort, Bertie, Brunswick, Buncombe, Cabarrus, Caldwell, Camden, Carteret, Caswell, Chatham, Chowan, Cleveland, Columbus, Craven, Cumberland, Currituck, Dare, Edgecombe, Franklin, Gaston, Gates, Graham, Granville, Halifax, Harnett, Haywood, Henderson, Hertford, Hyde, Jackson, Lee, Lincoln, Madison, Martin, McDowell, Mecklenburg, Mitchell, Moore, Nash, New Hanover, Northampton, Onslow, Pasquotank, Perquimans, Person, Pitt, Polk, Richmond, Robeson, Rockingham, Rutherford, Scotland, Stokes, Surry, Swain, Transylvania, Tyrrell, Union, Vance, Wake, Warren, Washington, Watauga, Wilson, Yancey
69
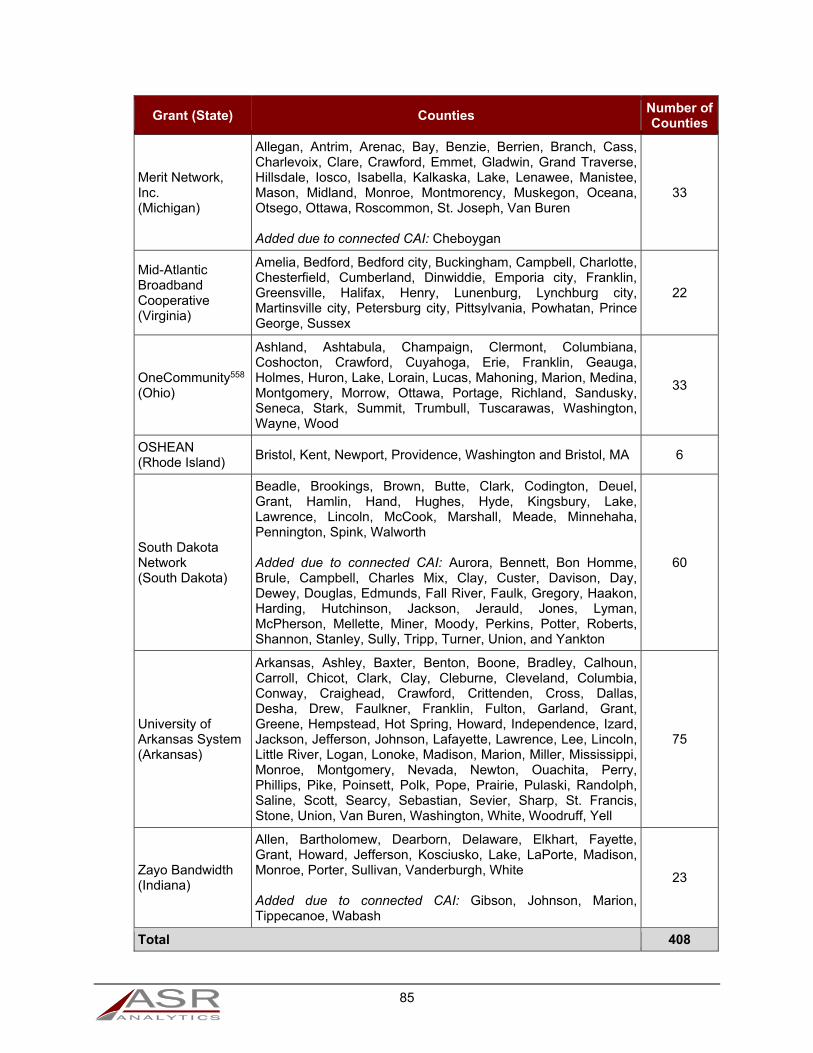
85
Grant (State) Counties Number of Counties
Merit Network, Inc. (Michigan)
Allegan, Antrim, Arenac, Bay, Benzie, Berrien, Branch, Cass, Charlevoix, Clare, Crawford, Emmet, Gladwin, Grand Traverse, Hillsdale, Iosco, Isabella, Kalkaska, Lake, Lenawee, Manistee, Mason, Midland, Monroe, Montmorency, Muskegon, Oceana, Otsego, Ottawa, Roscommon, St. Joseph, Van Buren Added due to connected CAI: Cheboygan
33
Mid-Atlantic Broadband Cooperative (Virginia)
Amelia, Bedford, Bedford city, Buckingham, Campbell, Charlotte, Chesterfield, Cumberland, Dinwiddie, Emporia city, Franklin, Greensville, Halifax, Henry, Lunenburg, Lynchburg city, Martinsville city, Petersburg city, Pittsylvania, Powhatan, Prince George, Sussex
22
OneCommunity558
(Ohio)
Ashland, Ashtabula, Champaign, Clermont, Columbiana, Coshocton, Crawford, Cuyahoga, Erie, Franklin, Geauga, Holmes, Huron, Lake, Lorain, Lucas, Mahoning, Marion, Medina, Montgomery, Morrow, Ottawa, Portage, Richland, Sandusky, Seneca, Stark, Summit, Trumbull, Tuscarawas, Washington, Wayne, Wood
33
OSHEAN (Rhode Island)
Bristol, Kent, Newport, Providence, Washington and Bristol, MA 6
South Dakota Network (South Dakota)
Beadle, Brookings, Brown, Butte, Clark, Codington, Deuel, Grant, Hamlin, Hand, Hughes, Hyde, Kingsbury, Lake, Lawrence, Lincoln, McCook, Marshall, Meade, Minnehaha, Pennington, Spink, Walworth Added due to connected CAI: Aurora, Bennett, Bon Homme, Brule, Campbell, Charles Mix, Clay, Custer, Davison, Day, Dewey, Douglas, Edmunds, Fall River, Faulk, Gregory, Haakon, Harding, Hutchinson, Jackson, Jerauld, Jones, Lyman, McPherson, Mellette, Miner, Moody, Perkins, Potter, Roberts, Shannon, Stanley, Sully, Tripp, Turner, Union, and Yankton
60
University of Arkansas System (Arkansas)
Arkansas, Ashley, Baxter, Benton, Boone, Bradley, Calhoun, Carroll, Chicot, Clark, Clay, Cleburne, Cleveland, Columbia, Conway, Craighead, Crawford, Crittenden, Cross, Dallas, Desha, Drew, Faulkner, Franklin, Fulton, Garland, Grant, Greene, Hempstead, Hot Spring, Howard, Independence, Izard, Jackson, Jefferson, Johnson, Lafayette, Lawrence, Lee, Lincoln, Little River, Logan, Lonoke, Madison, Marion, Miller, Mississippi, Monroe, Montgomery, Nevada, Newton, Ouachita, Perry, Phillips, Pike, Poinsett, Polk, Pope, Prairie, Pulaski, Randolph, Saline, Scott, Searcy, Sebastian, Sevier, Sharp, St. Francis, Stone, Union, Van Buren, Washington, White, Woodruff, Yell
75
Zayo Bandwidth (Indiana)
Allen, Bartholomew, Dearborn, Delaware, Elkhart, Fayette, Grant, Howard, Jefferson, Kosciusko, Lake, LaPorte, Madison, Monroe, Porter, Sullivan, Vanderburgh, White Added due to connected CAI: Gibson, Johnson, Marion, Tippecanoe, Wabash
23
Total 408

86
10.6.2 Potential Control Counties
Each county in the treatment group shown above requires a control county for comparison. These control counties should be similar in relevant aspects to the treatment counties in order to provide a baseline against which to judge the impact on availability of the BTOP projects. Table 10 shows the steps taken to arrive at the population of potential control counties. Each step is also described below.
The list of prospective counties began with a complete list of counties and county equivalents in the United States, excluding Alaska and Hawaii. ASR then researched the proposed service area counties of every submitted application for BTOP CCI grants using the Broadband Application Database, excluding applications that proposed to cover exclusively Alaska, Hawaii, Puerto Rico, or other Island Areas of the United States, applications based on satellite broadband service, and public safety network applications.559 The team primarily drew from the Executive Summaries and Public Notice Responses components of the database. In any case where the service area was unclear, the team searched for other sources of publicly available data. The result was a list of 503 counties that had not been included in a BTOP application. In order to account for potential differences between applicants and non-applicants, counties that had not been mentioned in an application were removed from the population of potential control counties, leaving 2,640 counties.
The second step in the control county selection process was to remove those counties that had applied for and received a BTOP or Broadband Initiatives Program (BIP) grant. These counties would not be suitable controls because of federally sponsored activity that would be expected to take place. As shown in Table 10, 1,744 counties were rejected for this reason. Counties were identified as having benefited from a BTOP or BIP grant if they were mentioned in an application that received an award, or if a CAI or point of presence (POP) in the Connecting America’s Communities map was located within their borders.560 The result of applying this filter was the identification of 896 counties that could be considered potential control counties.
Table 10. Potential Control Counties in the United States
All Counties in the United States 3,143
Less counties in Alaska and Hawaii 3,109
Less counties not in proposed BTOP service area 2,640
Less counties in awarded BTOP or BIP grant service area561 896 Potential Controls
Table 11 summarizes the data presented in Table 9 and Table 10 above. Out of the 3,143 counties in the United States, the evaluation study team removed 1,839 counties from this analysis, leaving 408 treatment counties and 896 potential control counties.
Table 11. Number of Counties in Treatment, Control, and Discarded Groups
Group Frequency
Treatment counties 408
Potential control counties 896
Removed from analysis 1,839
Total 3,143

87
10.7 Selecting Matching Counties
Each county in the treatment group must be matched to a control county that is similar in its broadband-relevant characteristics. Following Gillett et al., the evaluation study team used nearest-neighbor matching to develop the control group for the matched pairs samples of counties.562 This function finds a control area for each geographic area receiving BTOP funding. ASR performed this match using data obtained from the Federal Communications Commission (FCC). The FCC provided these data at the request of NTIA. The data allowed ASR to develop county-level estimates of the following broadband-relevant county attributes:
Broadband availability: For the purposes of this analysis, NTIA requested the evaluation study team define broadband as high-speed wireline or fixed wireless service that has two-way data transmission with advertised speeds of at least 768 kbps upstream (upload) and at least 3 Mbps downstream (download). At NTIA’s request, the National Broadband Map (NBM) team provided the evaluation study team with census block-level broadband coverage for the June 30, 2011 NBM release.563 The evaluation study team aggregated the broadband coverage by calculating the county-level broadband availability rate, the total population with broadband availability divided by the sum of block total populations.
Population: The data provided by the NBM team includes census block populations.564 The evaluation study team aggregated these data by calculating the total county population, the sum of block total populations.
Rurality: The data provided by the NBM team includes a block-level urban/rural block flag.565 The evaluation study team calculated the county-level rural population percentage as the sum of the populations of rural blocks in a county divided by the sum of the populations of all blocks in the county.
These will be the primary characteristics on which the treatment to control county matches are performed. Table 12 below presents descriptive statistics of the data identified above for the treatment and potential control counties.566
Table 12. Descriptive Statistics of Matching Variables
Variable StatisticTreatmentCounties
Potential Control Counties
Population (June 30, 2011)
Mean 78,336.84 83,212.59
Median 27,283.50 21,940.50
Availability (June 30, 2011)
Mean 73.17% 78.93%
Median 82.85% 85.87%
Rurality (June 30, 2011)
Mean 63.66% 65.81%
Median 64.26% 70.15%
According to the Economics and Statistics Administration (ESA) and NTIA, certain vulnerable populations are less likely to have adopted broadband, or are more likely to benefit from it.567 Based on the Notice of Funds Availability (NOFA) and an extensive literature review, the evaluation study team identified and discussed four vulnerable populations in Interim Report 1: those in poverty, individuals sixty-five years of age or older, minorities, and those who speak languages other than English in the home.568

88
10.8 Rurality
Rural areas are more likely to have lower levels of broadband availability, all other things being equal.569 The data provided to ASR by the NBM team includes measure of rurality at the census block-level. Figure 17 below illustrates the distribution of the percentage of population in a county living in a rural area, computed as the population-weighted average of census block-level rurality statistics.
Figure 17. Distribution of Rural Percentage of Population in Treatment and Potential Control Counties
As shown in Figure 17, a substantial number of counties are completely rural, with other counties exhibiting a distribution of rurality values centered around 50 to 60 percent. Treatment counties that are 100 percent rural will be matched, described below, to control counties that are also 100 percent rural. Treatment counties that are not completely rural are matched to controls that are close to the same level of rurality on a percentage basis.
10.9 Matching
The evaluation study team will match treatment counties to control counties using restricted nearest neighbor matching.570 Nearest neighbor matching selects the most similar control county for each treatment county independently of any other matches.571 Restricted matching eliminates possible control counties where the values of matching variables are too dissimilar to the treatment county’s values.
The evaluation study team first matched treatment counties to controls on the values of broadband availability as of June 30, 2011, natural logarithm of population, rural percentage of population, and a rural county binary variable.572 The evaluation study team imposed several restrictions on possible matches, as described below.
1. Completely rural counties may only match to completely rural counties, and counties with a rural population less than 100 percent may only match to counties with a rural population less than 100 percent.

89
2. Broadband availability in the selected control county must be within 1 percentage point of broadband availability in the treatment county. If no matches are possible, this restriction loosens by a factor of 1.1 (e.g., 1 percentage point, 1.1 percentage points, 1.21 percentage points, and so on) until a match is found.
3. The value of the log of population of the treatment county must be within one-half of a standard deviation of the log of population of the value of the treatment county.573
The evaluation study team used the Mahalanobis distance metric to determine the similarity between treatment and control counties.574 The evaluation study team then used the nearest neighbor algorithm to select the control county most similar to each treatment county based on the restrictions listed above.575 This methodology and the restrictions described above help ensure that individual county matches and the resulting treatment and control groups were similar in the level of broadband availability before the effects of BTOP, and that the basic character of the counties is similar. Table 13 below presents summary statistics of the three variables used in the matching process. Appendix A lists the individual county matches and variable values.
Table 13. Descriptive Statistics of Matching Variables for Matched Pairs
Variable StatisticTreatmentCounties
ControlCounties
Population (June 30, 2011)
Mean 78,336.84 79,025.05
Median 27,283.50 26,996.50
Availability (June 30, 2011)
Mean 73.17% 73.15%
Median 82.85% 82.86%
Rurality (June 30, 2011)
Mean 63.66% 64.96%
Median 64.26% 68.13%
10.10 Sensitivity Testing
In order to examine the sensitivity of the effect of BTOP to the matching methodology, the evaluation study team performed a second round of matching. The evaluation study team identified demographic information about vulnerable populations as an additional factor that could be used to match counties. The evaluation study team used the following county-level measurements of these vulnerable populations: percentage of the population in poverty, percentage of population sixty-five years of age and older, percentage minority, and percentage that speak languages other than English in the home.576 The team used Census 2010 estimates of county-level population percentages of individuals sixty-five and older and minorities and American Community Survey 2006-2010 estimates of county poverty rates and the percentage of population speaking a language other than English in the home.577
Table 14 presents descriptive statistics of vulnerable populations for the treatment counties and control counties, as well as for all counties in the United States less Alaska and Hawaii.578
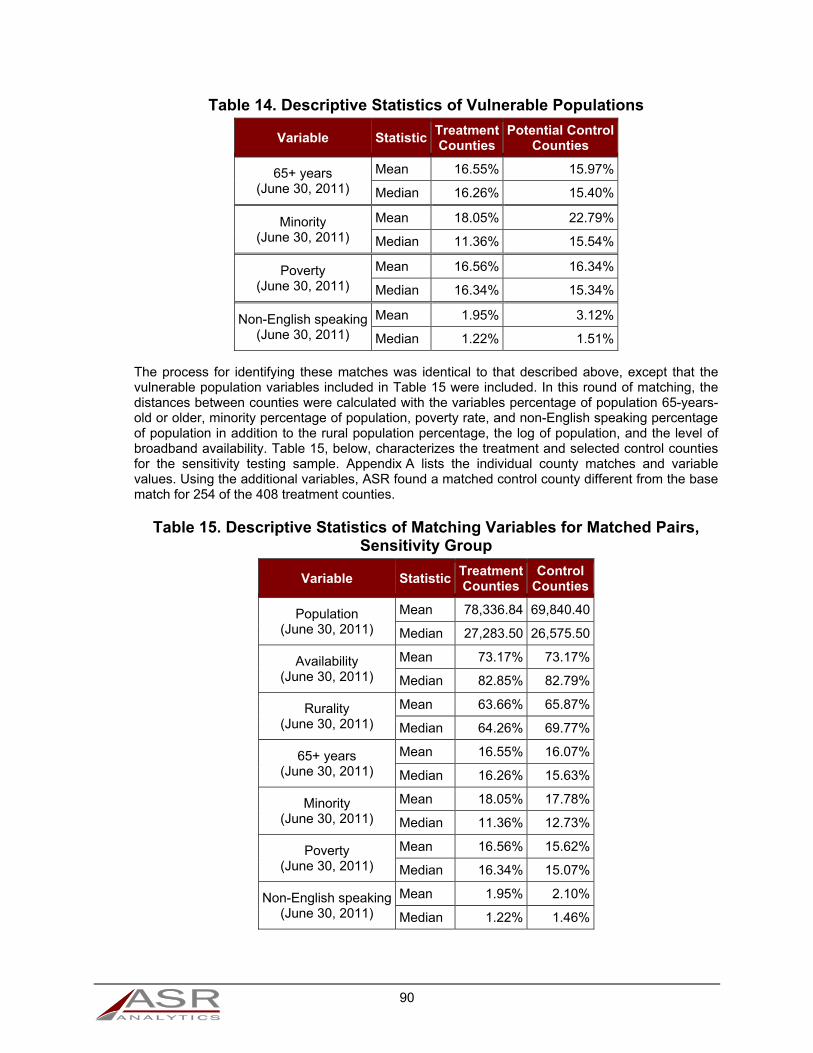
90
Table 14. Descriptive Statistics of Vulnerable Populations
Variable StatisticTreatmentCounties
Potential Control Counties
65+ years (June 30, 2011)
Mean 16.55% 15.97%
Median 16.26% 15.40%
Minority (June 30, 2011)
Mean 18.05% 22.79%
Median 11.36% 15.54%
Poverty (June 30, 2011)
Mean 16.56% 16.34%
Median 16.34% 15.34%
Non-English speaking(June 30, 2011)
Mean 1.95% 3.12%
Median 1.22% 1.51%
The process for identifying these matches was identical to that described above, except that the vulnerable population variables included in Table 15 were included. In this round of matching, the distances between counties were calculated with the variables percentage of population 65-years-old or older, minority percentage of population, poverty rate, and non-English speaking percentage of population in addition to the rural population percentage, the log of population, and the level of broadband availability. Table 15, below, characterizes the treatment and selected control counties for the sensitivity testing sample. Appendix A lists the individual county matches and variable values. Using the additional variables, ASR found a matched control county different from the base match for 254 of the 408 treatment counties.
Table 15. Descriptive Statistics of Matching Variables for Matched Pairs, Sensitivity Group
Variable StatisticTreatmentCounties
Control Counties
Population (June 30, 2011)
Mean 78,336.84 69,840.40
Median 27,283.50 26,575.50
Availability (June 30, 2011)
Mean 73.17% 73.17%
Median 82.85% 82.79%
Rurality (June 30, 2011)
Mean 63.66% 65.87%
Median 64.26% 69.77%
65+ years (June 30, 2011)
Mean 16.55% 16.07%
Median 16.26% 15.63%
Minority (June 30, 2011)
Mean 18.05% 17.78%
Median 11.36% 12.73%
Poverty (June 30, 2011)
Mean 16.56% 15.62%
Median 16.34% 15.07%
Non-English speaking(June 30, 2011)
Mean 1.95% 2.10%
Median 1.22% 1.46%
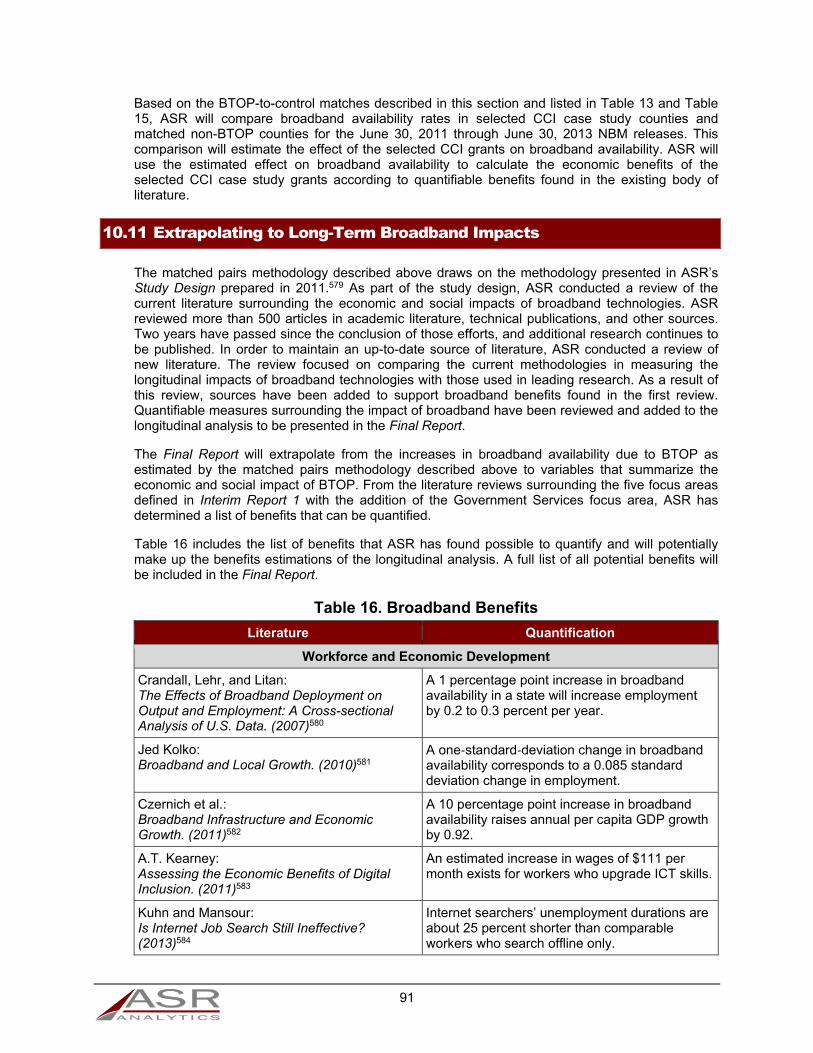
91
Based on the BTOP-to-control matches described in this section and listed in Table 13 and Table 15, ASR will compare broadband availability rates in selected CCI case study counties and matched non-BTOP counties for the June 30, 2011 through June 30, 2013 NBM releases. This comparison will estimate the effect of the selected CCI grants on broadband availability. ASR will use the estimated effect on broadband availability to calculate the economic benefits of the selected CCI case study grants according to quantifiable benefits found in the existing body of literature.
10.11 Extrapolating to Long-Term Broadband Impacts
The matched pairs methodology described above draws on the methodology presented in ASR’s Study Design prepared in 2011.579 As part of the study design, ASR conducted a review of the current literature surrounding the economic and social impacts of broadband technologies. ASR reviewed more than 500 articles in academic literature, technical publications, and other sources. Two years have passed since the conclusion of those efforts, and additional research continues to be published. In order to maintain an up-to-date source of literature, ASR conducted a review of new literature. The review focused on comparing the current methodologies in measuring the longitudinal impacts of broadband technologies with those used in leading research. As a result of this review, sources have been added to support broadband benefits found in the first review. Quantifiable measures surrounding the impact of broadband have been reviewed and added to the longitudinal analysis to be presented in the Final Report.
The Final Report will extrapolate from the increases in broadband availability due to BTOP as estimated by the matched pairs methodology described above to variables that summarize the economic and social impact of BTOP. From the literature reviews surrounding the five focus areas defined in Interim Report 1 with the addition of the Government Services focus area, ASR has determined a list of benefits that can be quantified.
Table 16 includes the list of benefits that ASR has found possible to quantify and will potentially make up the benefits estimations of the longitudinal analysis. A full list of all potential benefits will be included in the Final Report.
Table 16. Broadband Benefits
Literature Quantification
Workforce and Economic Development
Crandall, Lehr, and Litan: The Effects of Broadband Deployment on Output and Employment: A Cross-sectional Analysis of U.S. Data. (2007)580
A 1 percentage point increase in broadband availability in a state will increase employment by 0.2 to 0.3 percent per year.
Jed Kolko: Broadband and Local Growth. (2010)581
A one‐standard‐deviation change in broadband availability corresponds to a 0.085 standard deviation change in employment.
Czernich et al.: Broadband Infrastructure and Economic Growth. (2011)582
A 10 percentage point increase in broadband availability raises annual per capita GDP growth by 0.92.
A.T. Kearney: Assessing the Economic Benefits of Digital Inclusion. (2011)583
An estimated increase in wages of $111 per month exists for workers who upgrade ICT skills.
Kuhn and Mansour: Is Internet Job Search Still Ineffective? (2013)584
Internet searchers’ unemployment durations are about 25 percent shorter than comparable workers who search offline only.
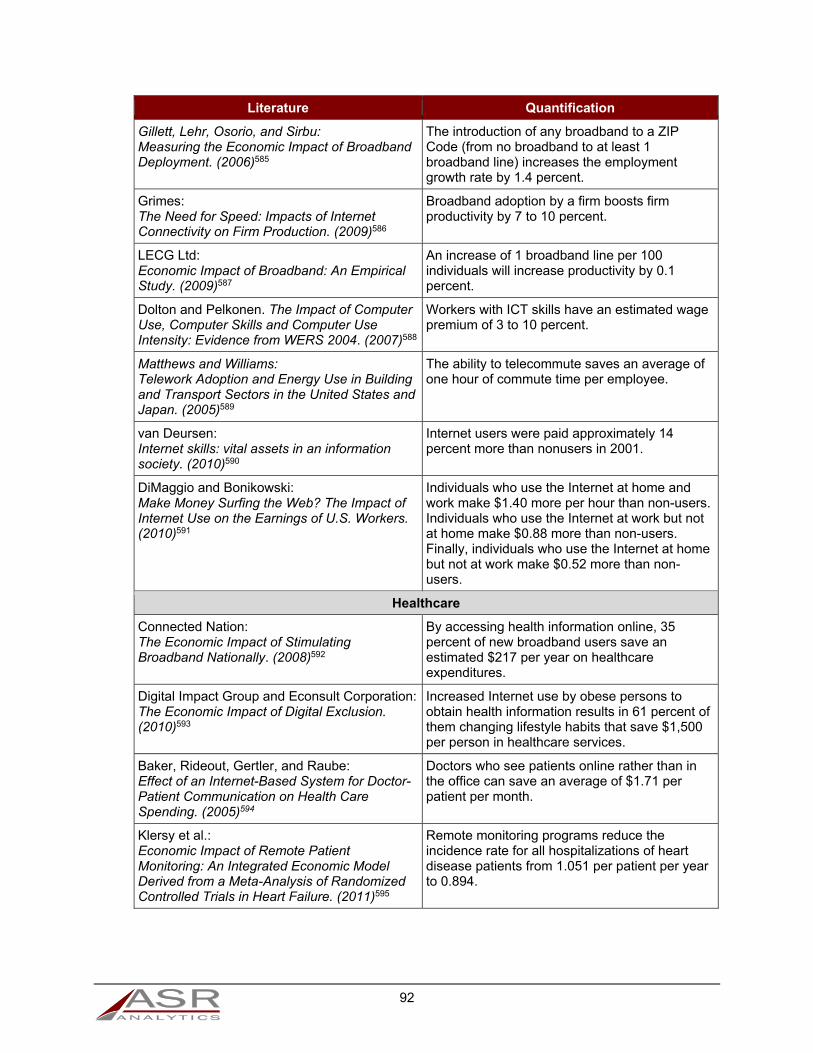
92
Literature Quantification
Gillett, Lehr, Osorio, and Sirbu: Measuring the Economic Impact of Broadband Deployment. (2006)585
The introduction of any broadband to a ZIP Code (from no broadband to at least 1 broadband line) increases the employment growth rate by 1.4 percent.
Grimes: The Need for Speed: Impacts of Internet Connectivity on Firm Production. (2009)586
Broadband adoption by a firm boosts firm productivity by 7 to 10 percent.
LECG Ltd: Economic Impact of Broadband: An Empirical Study. (2009)587
An increase of 1 broadband line per 100 individuals will increase productivity by 0.1 percent.
Dolton and Pelkonen. The Impact of Computer Use, Computer Skills and Computer Use Intensity: Evidence from WERS 2004. (2007)588
Workers with ICT skills have an estimated wage premium of 3 to 10 percent.
Matthews and Williams: Telework Adoption and Energy Use in Building and Transport Sectors in the United States and Japan. (2005)589
The ability to telecommute saves an average of one hour of commute time per employee.
van Deursen: Internet skills: vital assets in an information society. (2010)590
Internet users were paid approximately 14 percent more than nonusers in 2001.
DiMaggio and Bonikowski: Make Money Surfing the Web? The Impact of Internet Use on the Earnings of U.S. Workers. (2010)591
Individuals who use the Internet at home and work make $1.40 more per hour than non-users. Individuals who use the Internet at work but not at home make $0.88 more than non-users. Finally, individuals who use the Internet at home but not at work make $0.52 more than non-users.
Healthcare
Connected Nation: The Economic Impact of Stimulating Broadband Nationally. (2008)592
By accessing health information online, 35 percent of new broadband users save an estimated $217 per year on healthcare expenditures.
Digital Impact Group and Econsult Corporation: The Economic Impact of Digital Exclusion. (2010)593
Increased Internet use by obese persons to obtain health information results in 61 percent of them changing lifestyle habits that save $1,500 per person in healthcare services.
Baker, Rideout, Gertler, and Raube: Effect of an Internet-Based System for Doctor-Patient Communication on Health Care Spending. (2005)594
Doctors who see patients online rather than in the office can save an average of $1.71 per patient per month.
Klersy et al.: Economic Impact of Remote Patient Monitoring: An Integrated Economic Model Derived from a Meta-Analysis of Randomized Controlled Trials in Heart Failure. (2011)595
Remote monitoring programs reduce the incidence rate for all hospitalizations of heart disease patients from 1.051 per patient per year to 0.894.
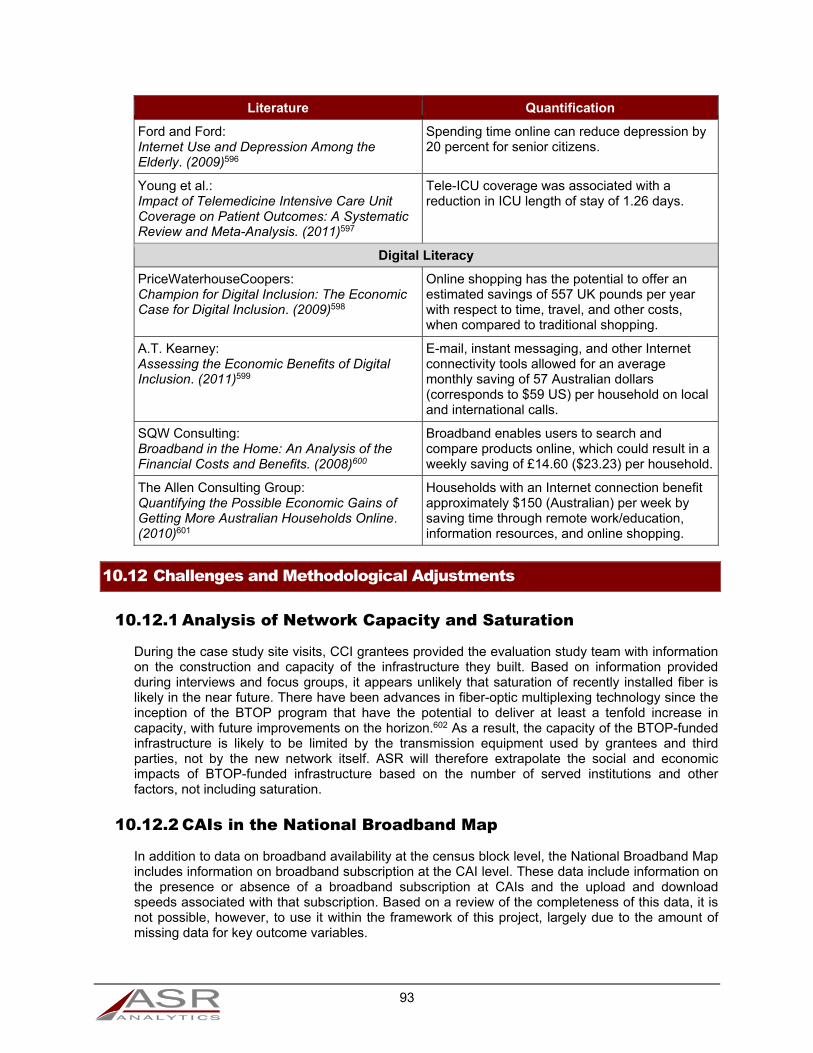
93
Literature Quantification
Ford and Ford: Internet Use and Depression Among the Elderly. (2009)596
Spending time online can reduce depression by 20 percent for senior citizens.
Young et al.: Impact of Telemedicine Intensive Care Unit Coverage on Patient Outcomes: A Systematic Review and Meta-Analysis. (2011)597
Tele-ICU coverage was associated with a reduction in ICU length of stay of 1.26 days.
Digital Literacy
PriceWaterhouseCoopers: Champion for Digital Inclusion: The Economic Case for Digital Inclusion. (2009)598
Online shopping has the potential to offer an estimated savings of 557 UK pounds per year with respect to time, travel, and other costs, when compared to traditional shopping.
A.T. Kearney: Assessing the Economic Benefits of Digital Inclusion. (2011)599
E-mail, instant messaging, and other Internet connectivity tools allowed for an average monthly saving of 57 Australian dollars (corresponds to $59 US) per household on local and international calls.
SQW Consulting: Broadband in the Home: An Analysis of the Financial Costs and Benefits. (2008)600
Broadband enables users to search and compare products online, which could result in a weekly saving of £14.60 ($23.23) per household.
The Allen Consulting Group: Quantifying the Possible Economic Gains of Getting More Australian Households Online. (2010)601
Households with an Internet connection benefit approximately $150 (Australian) per week by saving time through remote work/education, information resources, and online shopping.
10.12 Challenges and Methodological Adjustments
10.12.1 Analysis of Network Capacity and Saturation
During the case study site visits, CCI grantees provided the evaluation study team with information on the construction and capacity of the infrastructure they built. Based on information provided during interviews and focus groups, it appears unlikely that saturation of recently installed fiber is likely in the near future. There have been advances in fiber-optic multiplexing technology since the inception of the BTOP program that have the potential to deliver at least a tenfold increase in capacity, with future improvements on the horizon.602 As a result, the capacity of the BTOP-funded infrastructure is likely to be limited by the transmission equipment used by grantees and third parties, not by the new network itself. ASR will therefore extrapolate the social and economic impacts of BTOP-funded infrastructure based on the number of served institutions and other factors, not including saturation.
10.12.2 CAIs in the National Broadband Map
In addition to data on broadband availability at the census block level, the National Broadband Map includes information on broadband subscription at the CAI level. These data include information on the presence or absence of a broadband subscription at CAIs and the upload and download speeds associated with that subscription. Based on a review of the completeness of this data, it is not possible, however, to use it within the framework of this project, largely due to the amount of missing data for key outcome variables.

94
Table 17 presents a tabulation of the data completeness in two matched waves of the NBM, one from June 2011 and a second from June 2013. The figures presented include CAIs from the treatment and control counties for the base matched pairs case described above. Tabulations for the sensitivity analysis case produce similar overall results. As shown in the table, there are a substantial number of CAIs reporting data in both the treatment and control counties. However, relatively few of these are reporting broadband subscription information, and fewer still are reporting download speeds. In addition, matching CAIs between waves is not possible in many cases. This is due in part to the absence of a unique identifier for CAIs in the NBM data, the creation of which is beyond the scope of the NBM project. A second cause is the apparent addition of CAIs to later waves, indicating the potential for missing data in the first wave.
Overall, approximately 14 percent (10,301/76,121=0.14) of the CAIs in the treatment and control counties have download speed data available in both waves. Approximately 18 percent of the CAIs in treatment and control counties have subscription information for both waves (13,786/76,121=0.18). These levels of data completeness do not support the use of NBM CAI data to analyze the effects of BTOP on CAIs in the treatment and control counties. Data completeness might be improved somewhat with improved matching of CAIs between waves, but not enough to overcome the fundamental lack of data for most of the CAIs in the data set. As a result, ASR will not include NBM CAI data in the Final Report.
Table 17. Community Anchor Institutions in Treatment Counties and Base-Case Selected Control Counties
County Type
NBM Release
CAIs
Data Availability
Broadband Subscriber Download Speed
2011-06 2013-062011-06 & 2013-06
2011-06 2013-06 2011-06 & 2013-06
Treatment
2011-06 only 7,682 4,028 1,098
2013-06 only 12,949 8,114 7,431
2011-06 & 2013-06
25,998 9,214 12,185 9,103 7,595 9,697 6,767
Total 46,629 13,242 20,299 9,103 8,693 17,128 6,767
Control
2011-06 only 6,500 2,174 1,603
2013-06 only 10,912 3,368 3,256
2011-06 & 2013-06
12,080 4,787 7,001 4,683 3,601 6,317 3,534
Total 29,492 6,961 10,369 4,683 5,204 9,573 3,534
Total
2011-06 only 14,182 6,202 2,701
2013-06 only 23,861 11,482 10,687
2011-06 & 2013-06
38,078 14,001 19,186 13,786 11,196 16,014 10,301
Total 76,121 20,203 30,668 13,786 13,897 26,701 10,301
10.12.3 Availability of Grantee-Reported Data
ASR plans to include summary statistics and analysis derived from data reported by grantees to NTIA in the Final Report. Based on a review of APR and PPR data available as of March 2014, ASR will review the possibility of presenting data related to training hours, new household and

95
business subscriptions, and available lab hours. As described in Section 1, ASR receives these data from NTIA. The evaluation study team must receive new APR and PPR data no later than April 11, 2014 to allow enough time to review and analyze the data for inclusion in the Final Report. If the evaluation study team does not have new grantee-reported data by this time, the Final Report will include observations based on the previous data request from December 2013. The 2012 APR is the most recently available APR in the current data provided by NTIA.

96
Appendix A. Matched Counties The table below lists the 408 counties that make up the service areas of the CCI grants in the evaluation study sample. Service area counties are listed at the top of each row with county names aligned flush to the left border of the county column.
As described in Section 10, the evaluation study team matched service area counties to counties covered by rejected BTOP grants and not covered by awarded BTOP and BIP grants. The first matches are listed immediately below the service area counties in each row. The values of the matching variables availability, population, and rural population percentage are included for service area counties and their respective matches.
The second matches are listed below the first matches, at the bottom of each row. The variables percent of population 65 years or older, minority population percentage, non-English speaking population percentage, and poverty rate were used for to identify the second matches, so values of those variables are included for service area counties and second matches. All values are from the June 30, 2011 release of the NBM.
County Availability Population Rural 65+ Minority Non-English Poverty
The Arkansas Healthcare, Higher Education, Public Safety, & Research Integrated Broadband Initiative (75 counties)
Arkansas, AR 94.31% 18,899 36.36% 16.38% 28.96% 1.90% 18.94%1 Ware, GA 93.88% 36,772 31.49%
Ware, GA 93.88% 36,772 31.49% 15.23% 35.05% 2.53% 20.49%Ashley, AR 78.15% 21,661 51.68% 16.22% 31.81% 1.77% 18.46%
2 Franklin, KS 78.65% 26,055 54.15% Seneca, NY 78.51% 34,878 60.67% 15.52% 9.23% 1.59% 13.86%Baxter, AR 94.74% 42,192 69.41% 28.09% 4.04% 0.68% 15.52%
3 Atascosa, TX 93.90% 45,331 67.38% Tillamook, OR 94.07% 25,251 75.51% 20.88% 13.26% 3.35% 16.90%Benton, AR 96.82% 229,769 50.75% 12.19% 23.37% 6.98% 11.73%
4 Lake, FL 96.20% 306,105 44.58% Montgomery, TX 96.47% 474,292 49.98% 10.40% 28.77% 7.51% 10.85%Boone, AR 72.00% 37,425 63.37% 18.08% 4.78% 0.90% 15.98%
5 Dillon, SC 71.16% 31,920 67.89% Avoyelles, LA 71.98% 42,306 66.35% 14.44% 33.74% 2.09% 23.22%Bradley, AR 59.75% 11,475 53.50% 17.74% 41.99% 6.71% 30.44%
6 Fergus, MT 59.03% 11,677 49.37% Fergus, MT 59.03% 11,677 49.37% 21.49% 4.32% 0.66% 14.70%Calhoun, AR 7.86% 5,343 100.00% 17.19% 26.62% 0.76% 11.94%
7 Mahnomen, MN 8.77% 5,451 100.00% Chouteau, MT 7.90% 5,832 100.00% 17.34% 24.53% 0.15% 21.00%Carroll, AR 75.98% 27,753 74.17% 18.69% 15.97% 5.36% 17.24%
8 Tate, MS 75.67% 29,185 73.10% Cedar, MO 75.42% 13,837 74.94% 22.36% 3.93% 0.99% 17.87%Chicot, AR 75.53% 11,583 41.42% 18.21% 59.65% 2.60% 34.14%
9 Pemiscot, MO 74.56% 18,072 35.43% Pemiscot, MO 74.56% 18,072 35.43% 14.72% 30.36% 0.37% 31.77%Clark, AR 73.18% 23,141 58.05% 14.83% 29.65% 1.83% 23.77%
10 Harlan, KY 72.60% 29,313 58.37%

97
County Availability Population Rural 65+ Minority Non-English Poverty
Neosho, KS 73.34% 16,512 48.45% 17.36% 8.33% 0.86% 16.95%Clay, AR 92.79% 15,884 60.34% 20.02% 3.15% 0.40% 18.72%
11 Dunklin, MO 91.80% 31,813 50.97% Dunklin, MO 91.80% 31,813 50.97% 16.49% 17.07% 2.11% 23.62%Cleburne, AR 82.77% 26,079 76.74% 23.56% 4.14% 0.89% 17.43%
12 Union, MS 83.52% 27,294 78.17% Johnson, TN 82.90% 18,248 85.57% 17.69% 4.77% 0.67% 23.75%Cleveland, AR 70.75% 8,620 100.00% 16.30% 14.90% 0.10% 15.11%
13 Gallatin, KY 70.27% 8,594 100.00% Putnam, IL 71.30% 6,020 100.00% 17.80% 5.86% 0.69% 10.86%Columbia, AR 73.63% 24,314 58.18% 16.00% 40.76% 0.94% 22.87%
14 Marengo, AL 72.81% 20,861 70.61% Washington, GA 73.91% 21,304 71.21% 13.60% 55.92% 0.84% 27.64%Conway, AR 64.30% 21,394 74.80% 16.89% 17.58% 1.90% 16.98%
15 Wayne, MS 65.14% 20,616 79.78% Humphreys, TN 64.34% 18,547 81.32% 17.29% 5.61% 0.77% 12.91%Craighead, AR 97.44% 98,303 37.33% 12.17% 20.41% 2.25% 19.40%
16 Madison, TN 97.54% 98,457 33.83% Pickens, SC 98.26% 120,303 43.76% 13.41% 12.80% 2.28% 16.59%Crawford, AR 91.70% 62,827 57.13% 13.29% 13.20% 3.44% 18.28%
17 Lee, MS 90.97% 83,536 52.45% Hopkins, KY 91.12% 46,938 50.33% 15.44% 10.61% 1.68% 18.19%Crittenden, AR 88.17% 51,154 26.50% 10.76% 54.76% 0.96% 27.37%
18 Boyle, KY 88.87% 28,694 40.86% Lafayette, MS 87.68% 48,082 57.02% 10.47% 29.17% 1.45% 24.08%Cross, AR 72.88% 17,781 59.70% 15.44% 25.33% 0.40% 16.71%
19 Clay, MS 72.13% 20,481 58.10% Neosho, KS 73.34% 16,512 48.45% 17.36% 8.33% 0.86% 16.95%Dallas, AR 80.98% 8,006 55.36% 18.16% 45.87% 0.87% 17.72%
20 Randolph, GA 80.42% 7,630 52.14% Randolph, GA 80.42% 7,630 52.14% 17.83% 63.97% 0.92% 28.05%Desha, AR 90.13% 12,808 32.35% 15.14% 53.24% 2.09% 27.57%
21 York, NE 89.34% 13,681 47.68% Emanuel, GA 90.67% 22,875 69.44% 13.99% 39.23% 3.03% 24.20%Drew, AR 58.02% 18,480 52.46% 14.78% 32.00% 1.51% 23.65%
22 Richland, WI 58.86% 17,989 72.21% Richland, WI 58.86% 17,989 72.21% 18.01% 3.92% 1.13% 11.50%Faulkner, AR 96.62% 115,958 55.00% 9.99% 17.58% 2.36% 15.30%
23 Livingston, LA 97.47% 132,001 60.87% Livingston, LA 97.47% 132,001 60.87% 9.90% 9.89% 1.09% 11.36%Franklin, AR 85.69% 18,182 84.88% 16.59% 6.22% 1.38% 17.79%
24 Rockcastle, KY 86.10% 17,266 87.13% Webster, KY 85.21% 13,517 82.86% 15.12% 10.19% 1.13% 15.98%Fulton, AR 88.83% 12,233 92.77% 22.39% 3.59% 0.37% 20.28%
25 Montgomery, GA 87.86% 9,144 99.31% Elbert, GA 89.74% 20,062 72.69% 16.81% 35.75% 1.98% 22.99%Garland, AR 94.49% 97,233 39.41% 20.93% 16.04% 2.78% 17.75%
26 Spotsylvania, VA 94.14% 122,743 36.95% Etowah, AL 95.28% 104,667 43.57% 15.81% 20.72% 1.69% 16.85%Grant, AR 79.89% 17,978 75.62% 14.51% 5.89% 0.74% 8.84%
27 Westmoreland, VA 79.96% 17,714 72.61% Pierce, GA 79.97% 19,269 79.93% 14.03% 15.45% 1.83% 15.44%Greene, AR 72.71% 42,585 49.02% 14.34% 4.57% 1.10% 16.41%
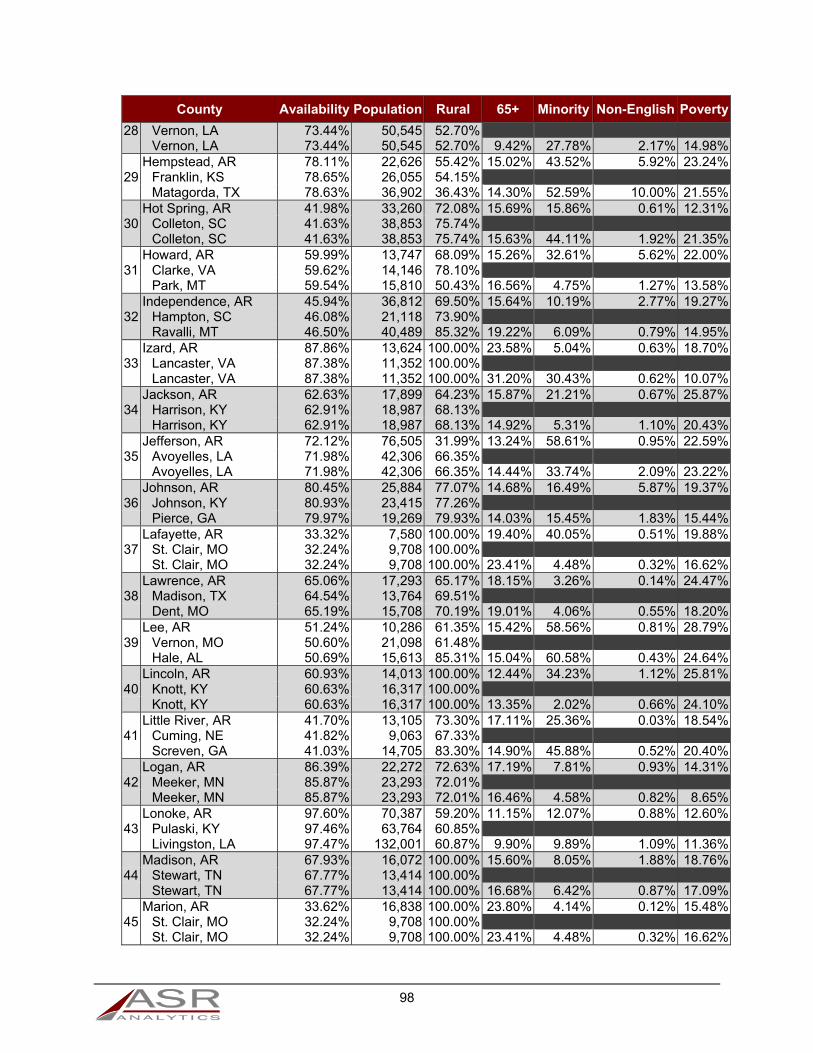
98
County Availability Population Rural 65+ Minority Non-English Poverty
28 Vernon, LA 73.44% 50,545 52.70% Vernon, LA 73.44% 50,545 52.70% 9.42% 27.78% 2.17% 14.98%Hempstead, AR 78.11% 22,626 55.42% 15.02% 43.52% 5.92% 23.24%
29 Franklin, KS 78.65% 26,055 54.15% Matagorda, TX 78.63% 36,902 36.43% 14.30% 52.59% 10.00% 21.55%Hot Spring, AR 41.98% 33,260 72.08% 15.69% 15.86% 0.61% 12.31%
30 Colleton, SC 41.63% 38,853 75.74% Colleton, SC 41.63% 38,853 75.74% 15.63% 44.11% 1.92% 21.35%Howard, AR 59.99% 13,747 68.09% 15.26% 32.61% 5.62% 22.00%
31 Clarke, VA 59.62% 14,146 78.10% Park, MT 59.54% 15,810 50.43% 16.56% 4.75% 1.27% 13.58%Independence, AR 45.94% 36,812 69.50% 15.64% 10.19% 2.77% 19.27%
32 Hampton, SC 46.08% 21,118 73.90% Ravalli, MT 46.50% 40,489 85.32% 19.22% 6.09% 0.79% 14.95%Izard, AR 87.86% 13,624 100.00% 23.58% 5.04% 0.63% 18.70%
33 Lancaster, VA 87.38% 11,352 100.00% Lancaster, VA 87.38% 11,352 100.00% 31.20% 30.43% 0.62% 10.07%Jackson, AR 62.63% 17,899 64.23% 15.87% 21.21% 0.67% 25.87%
34 Harrison, KY 62.91% 18,987 68.13% Harrison, KY 62.91% 18,987 68.13% 14.92% 5.31% 1.10% 20.43%Jefferson, AR 72.12% 76,505 31.99% 13.24% 58.61% 0.95% 22.59%
35 Avoyelles, LA 71.98% 42,306 66.35% Avoyelles, LA 71.98% 42,306 66.35% 14.44% 33.74% 2.09% 23.22%Johnson, AR 80.45% 25,884 77.07% 14.68% 16.49% 5.87% 19.37%
36 Johnson, KY 80.93% 23,415 77.26% Pierce, GA 79.97% 19,269 79.93% 14.03% 15.45% 1.83% 15.44%Lafayette, AR 33.32% 7,580 100.00% 19.40% 40.05% 0.51% 19.88%
37 St. Clair, MO 32.24% 9,708 100.00% St. Clair, MO 32.24% 9,708 100.00% 23.41% 4.48% 0.32% 16.62%Lawrence, AR 65.06% 17,293 65.17% 18.15% 3.26% 0.14% 24.47%
38 Madison, TX 64.54% 13,764 69.51% Dent, MO 65.19% 15,708 70.19% 19.01% 4.06% 0.55% 18.20%Lee, AR 51.24% 10,286 61.35% 15.42% 58.56% 0.81% 28.79%
39 Vernon, MO 50.60% 21,098 61.48% Hale, AL 50.69% 15,613 85.31% 15.04% 60.58% 0.43% 24.64%Lincoln, AR 60.93% 14,013 100.00% 12.44% 34.23% 1.12% 25.81%
40 Knott, KY 60.63% 16,317 100.00% Knott, KY 60.63% 16,317 100.00% 13.35% 2.02% 0.66% 24.10%Little River, AR 41.70% 13,105 73.30% 17.11% 25.36% 0.03% 18.54%
41 Cuming, NE 41.82% 9,063 67.33% Screven, GA 41.03% 14,705 83.30% 14.90% 45.88% 0.52% 20.40%Logan, AR 86.39% 22,272 72.63% 17.19% 7.81% 0.93% 14.31%
42 Meeker, MN 85.87% 23,293 72.01% Meeker, MN 85.87% 23,293 72.01% 16.46% 4.58% 0.82% 8.65%Lonoke, AR 97.60% 70,387 59.20% 11.15% 12.07% 0.88% 12.60%
43 Pulaski, KY 97.46% 63,764 60.85% Livingston, LA 97.47% 132,001 60.87% 9.90% 9.89% 1.09% 11.36%Madison, AR 67.93% 16,072 100.00% 15.60% 8.05% 1.88% 18.76%
44 Stewart, TN 67.77% 13,414 100.00% Stewart, TN 67.77% 13,414 100.00% 16.68% 6.42% 0.87% 17.09%Marion, AR 33.62% 16,838 100.00% 23.80% 4.14% 0.12% 15.48%
45 St. Clair, MO 32.24% 9,708 100.00% St. Clair, MO 32.24% 9,708 100.00% 23.41% 4.48% 0.32% 16.62%

99
County Availability Population Rural 65+ Minority Non-English Poverty
Miller, AR 95.83% 43,693 45.38% 13.76% 29.38% 1.13% 18.05%46 Dyer, TN 95.25% 38,409 45.52%
Troup, GA 96.18% 67,901 49.05% 12.38% 39.73% 2.23% 19.84%Mississippi, AR 90.46% 46,508 36.76% 12.23% 39.53% 1.90% 25.49%
47 Russell, AL 91.14% 53,503 36.93% Russell, AL 91.14% 53,503 36.93% 12.69% 47.89% 0.64% 23.29%Monroe, AR 81.34% 7,962 63.46% 18.91% 44.18% 1.25% 22.45%
48 Brown, KS 81.66% 9,955 69.80% Randolph, GA 80.42% 7,630 52.14% 17.83% 63.97% 0.92% 28.05%Montgomery, AR 74.42% 9,547 100.00% 22.41% 7.18% 0.33% 19.77%
49 McLean, KY 74.33% 9,512 100.00% Polk, TN 74.21% 16,744 100.00% 17.07% 3.35% 0.48% 18.44%Nevada, AR 75.39% 8,878 70.82% 17.65% 34.86% 0.20% 20.00%
50 Jasper, IL 75.97% 9,629 69.97% Barton, MO 75.21% 12,182 65.92% 17.19% 5.63% 0.92% 15.69%Newton, AR 4.60% 8,291 100.00% 20.42% 5.23% 0.43% 22.48%
51 Reynolds, MO 6.43% 6,683 100.00% Reynolds, MO 6.43% 6,683 100.00% 20.06% 3.93% 0.24% 21.25%Ouachita, AR 72.83% 25,865 57.76% 17.04% 43.70% 0.47% 19.92%
52 Harlan, KY 72.60% 29,313 58.37% Marengo, AL 72.81% 20,861 70.61% 16.28% 54.31% 0.34% 22.66%Perry, AR 70.08% 10,508 100.00% 16.73% 6.38% 0.07% 15.10%
53 Gallatin, KY 70.27% 8,594 100.00% Daviess, MO 71.06% 8,351 100.00% 17.09% 2.63% 2.85% 13.79%Phillips, AR 36.69% 21,310 47.77% 14.96% 65.37% 0.54% 32.43%
54 Upshur, TX 35.28% 39,522 82.77% Upshur, TX 35.28% 39,522 82.77% 15.75% 17.94% 2.07% 13.09%Pike, AR 87.55% 11,203 100.00% 17.38% 11.76% 1.72% 20.66%
55 Lancaster, VA 87.38% 11,352 100.00% Atchison, MO 88.10% 5,593 100.00% 21.58% 2.27% 0.62% 13.12%Poinsett, AR 85.91% 24,521 62.91% 15.86% 10.99% 0.62% 25.83%
56 New Madrid, MO 85.65% 18,677 64.68% Campbell, TN 86.03% 40,836 59.40% 17.22% 2.96% 0.60% 23.16%Polk, AR 78.42% 20,701 74.58% 19.48% 10.23% 2.85% 20.41%
57 Clay, KY 77.90% 21,913 80.05% Alcorn, MS 79.28% 37,219 69.82% 15.89% 15.50% 1.27% 19.14%Pope, AR 95.88% 62,812 57.74% 13.14% 13.10% 2.93% 18.17%
58 Laurens, GA 95.59% 48,769 61.45% Madison, KY 96.71% 83,828 48.56% 11.23% 9.59% 1.55% 18.86%Prairie, AR 91.88% 8,565 100.00% 19.70% 14.29% 0.42% 15.24%
59 Crosby, TX 90.99% 6,006 100.00% Crockett, TN 91.79% 14,605 100.00% 16.42% 22.85% 3.00% 18.73%Pulaski, AR 98.87% 384,787 17.12% 11.99% 44.69% 3.63% 16.38%
60 Prince William, VA 99.35% 407,391 19.37% Jefferson, AL 98.73% 657,964 16.11% 13.13% 48.33% 2.76% 15.47%Randolph, AR 83.51% 17,974 68.62% 18.70% 4.13% 0.70% 19.66%
61 Lee, TX 83.85% 16,668 73.21% Adair, KY 82.72% 18,589 74.66% 15.32% 5.89% 0.91% 21.33%St. Francis, AR 55.42% 27,754 50.90% 12.20% 57.63% 1.89% 29.62%
62 Lampasas, TX 54.66% 20,055 66.89% Clarke, AL 55.16% 25,662 75.61% 16.16% 46.03% 0.09% 29.19%Saline, AR 93.14% 109,720 56.46% 14.82% 11.03% 1.20% 9.93%
63 Hunterdon, NJ 94.04% 127,754 56.91%

100
County Availability Population Rural 65+ Minority Non-English Poverty
Nassau, FL 92.89% 74,979 59.52% 16.24% 12.15% 0.70% 9.29%Scott, AR 68.60% 11,403 73.85% 17.05% 14.65% 2.23% 23.91%
64 Lewis, TN 69.16% 12,174 72.50% Iron, MO 68.65% 10,523 78.16% 17.86% 4.40% 0.12% 21.58%Searcy, AR 64.31% 8,303 100.00% 21.29% 4.82% 0.27% 22.74%
65 Trousdale, TN 64.01% 8,019 100.00% Wayne, MO 64.21% 13,421 100.00% 21.41% 3.46% 0.22% 19.80%Sebastian, AR 98.62% 127,130 25.00% 13.14% 27.17% 7.22% 18.04%
66 Houston, GA 99.61% 142,265 23.96% Butte, CA 99.61% 221,156 19.98% 15.37% 24.81% 6.11% 18.40%Sevier, AR 88.37% 17,462 61.72% 12.59% 38.94% 17.34% 22.86%
67 Crisp, GA 88.51% 23,524 47.65% Irwin, GA 88.23% 9,573 75.24% 15.57% 29.56% 3.63% 25.38%Sharp, AR 82.92% 17,291 82.53% 23.95% 5.01% 0.64% 21.54%
68 Johnson, TN 82.90% 18,248 85.57% Johnson, TN 82.90% 18,248 85.57% 17.69% 4.77% 0.67% 23.75%Stone, AR 81.98% 12,508 100.00% 22.80% 3.89% 0.15% 23.38%
69 Lewis, KY 82.36% 13,907 100.00% Lewis, KY 82.36% 13,907 100.00% 14.73% 1.59% 0.30% 27.54%Union, AR 86.32% 41,489 51.12% 15.56% 38.23% 1.62% 21.38%
70 Campbell, TN 86.03% 40,836 59.40% Scotts Bluff, NE 86.72% 37,273 32.37% 16.81% 24.45% 3.32% 15.05%Van Buren, AR 69.08% 17,430 100.00% 22.68% 5.86% 0.48% 22.55%
71 Pickens, AL 68.28% 19,548 100.00% Pickens, AL 68.28% 19,548 100.00% 16.89% 44.16% 0.91% 26.89%Washington, AR 96.32% 207,427 32.96% 9.67% 25.86% 9.05% 17.88%
72 Alachua, FL 96.49% 249,578 29.09% Warren, KY 95.85% 116,228 38.58% 10.93% 18.44% 5.17% 18.52%White, AR 92.49% 78,320 56.68% 14.07% 10.44% 1.56% 15.71%
73 Nassau, FL 92.89% 74,979 59.52% Sevier, TN 92.28% 91,637 68.52% 15.48% 8.36% 2.50% 13.48%Woodruff, AR 89.23% 7,068 100.00% 17.81% 30.56% 0.01% 22.89%
74 Emery, UT 89.86% 11,144 100.00% Emery, UT 89.86% 11,144 100.00% 12.46% 7.91% 1.45% 10.02%Yell, AR 54.61% 22,549 82.21% 15.40% 23.28% 9.24% 17.67%
75 Hubbard, MN 55.54% 20,488 83.12% Lampasas, TX 54.66% 20,055 66.89% 15.76% 24.60% 4.80% 14.58%
BEACON 2.0 (6 counties)
Bristol, MA 99.69% 546,670 11.85% 14.20% 14.40% 8.31% 11.32%1 New Castle, DE 99.69% 541,539 9.56%
Greenville, SC 99.53% 462,075 21.88% 12.76% 29.70% 5.59% 14.12%Bristol, RI 100.00% 49,394 0.37% 16.73% 5.66% 4.65% 6.51%
2 Manassas city, VA 100.00% 37,427 0.00% Floyd, IN 99.95% 75,236 26.18% 12.95% 10.82% 1.08% 10.82%Kent, RI 99.84% 164,554 7.64% 15.69% 8.44% 2.47% 7.91%
3 Schenectady, NY 99.57% 155,858 8.47% Schenectady, NY 99.57% 155,858 8.47% 14.92% 22.83% 3.35% 11.13%Newport, RI 99.82% 81,874 12.18% 16.97% 12.13% 2.20% 7.26%
4 Schenectady, NY 99.57% 155,858 8.47% Schenectady, NY 99.57% 155,858 8.47% 14.92% 22.83% 3.35% 11.13%Providence, RI 99.88% 623,823 6.34% 13.47% 33.88% 13.08% 15.42%
5 Monmouth, NJ 99.54% 628,061 7.87% Rockland, NY 99.99% 313,524 1.32% 13.42% 34.66% 15.49% 11.26%

101
County Availability Population Rural 65+ Minority Non-English Poverty
Washington, RI 99.06% 125,845 32.64% 14.98% 7.60% 1.94% 7.44%6 Stafford, VA 98.50% 129,118 32.76%
Saratoga, NY 99.55% 220,062 35.59% 13.66% 7.27% 1.51% 6.36%
Illinois Broadband Opportunities Partnership – Southern (23 counties)
Alexander, IL 13.92% 8,038 62.64% 16.96% 39.51% 0.80% 20.10%1 Blaine, OK 8.60% 12,068 57.86%
Blaine, OK 8.60% 12,068 57.86% 14.44% 37.10% 10.08% 14.79%Clay, IL 77.92% 13,768 64.84% 17.86% 2.79% 0.72% 16.26%
2 Marshall, KS 78.29% 10,142 71.41% Henry, MO 77.14% 22,089 50.38% 19.51% 4.68% 1.37% 16.39%Clinton, IL 99.03% 37,956 46.36% 14.45% 7.93% 0.86% 7.83%
3 DeKalb, IN 99.94% 42,345 44.18% DeKalb, IN 99.94% 42,345 44.18% 13.12% 4.30% 1.35% 9.03%Edwards, IL 54.26% 6,665 100.00% 17.72% 2.47% 0.25% 12.20%
4 Caldwell, MO 53.17% 9,419 100.00% Caldwell, MO 53.17% 9,419 100.00% 16.72% 4.13% 0.39% 15.92%Franklin, IL 77.27% 39,593 50.69% 18.40% 3.05% 0.36% 19.80%
5 Sumter, GA 77.09% 32,657 47.59% Henry, MO 77.14% 22,089 50.38% 19.51% 4.68% 1.37% 16.39%Hamilton, IL 37.94% 8,484 68.52% 19.76% 2.64% 0.40% 14.48%
6 Screven, GA 41.03% 14,705 83.30% Screven, GA 41.03% 14,705 83.30% 14.90% 45.88% 0.52% 20.40%Jackson, IL 88.88% 59,893 42.17% 11.63% 24.03% 1.90% 28.46%
7 Leavenworth, KS 88.23% 76,769 40.16% Crawford, KS 89.86% 39,171 36.60% 13.96% 10.97% 2.33% 17.72%Jefferson, IL 58.74% 38,804 58.22% 16.19% 12.64% 0.86% 17.08%
8 Winston, AL 58.89% 24,370 84.72% Winston, AL 58.89% 24,370 84.72% 17.70% 5.09% 0.97% 20.61%Johnson, IL 28.38% 12,615 87.61% 17.22% 12.13% 0.74% 13.56%
9 Goochland, VA 32.08% 22,377 94.55% Goochland, VA 32.08% 22,377 94.55% 14.91% 23.64% 1.97% 7.08%Marion, IL 78.04% 39,317 44.71% 17.55% 7.56% 0.67% 16.51%
10 Sumter, GA 77.09% 32,657 47.59% Henry, MO 77.14% 22,089 50.38% 19.51% 4.68% 1.37% 16.39%Massac, IL 59.27% 15,340 52.72% 18.39% 10.17% 0.26% 13.73%
11 Park, MT 59.54% 15,810 50.43% Park, MT 59.54% 15,810 50.43% 16.56% 4.75% 1.27% 13.58%Perry, IL 77.38% 22,246 56.62% 15.73% 12.92% 1.25% 14.03%
12 Bamberg, SC 76.89% 15,948 57.27% Park, WY 76.55% 28,734 46.30% 17.52% 7.50% 1.06% 8.97%Pulaski, IL 36.47% 6,010 100.00% 18.24% 36.10% 2.27% 22.69%
13 Lincoln, ID 36.66% 5,290 100.00% Stillwater, MT 36.55% 9,220 100.00% 16.40% 4.71% 0.57% 9.49%Randolph, IL 88.26% 33,292 57.09% 15.95% 13.57% 0.98% 10.42%
14 Lafayette, MS 87.68% 48,082 57.02% Roane, TN 87.90% 54,339 52.44% 18.56% 6.33% 0.54% 13.37%Richland, IL 86.92% 16,074 43.48% 19.16% 3.45% 1.15% 13.78%
15 Humphreys, MS 86.29% 9,354 48.13% Pratt, KS 86.37% 9,642 36.98% 18.87% 8.74% 1.59% 9.97%St. Clair, IL 99.86% 270,689 16.99% 12.52% 37.10% 1.36% 15.50%
16 Butte, CA 99.61% 221,156 19.98% Harrison, MS 99.36% 183,513 28.96% 11.73% 32.80% 3.44% 15.25%Saline, IL 76.33% 24,869 38.63% 18.40% 7.63% 0.69% 18.36%
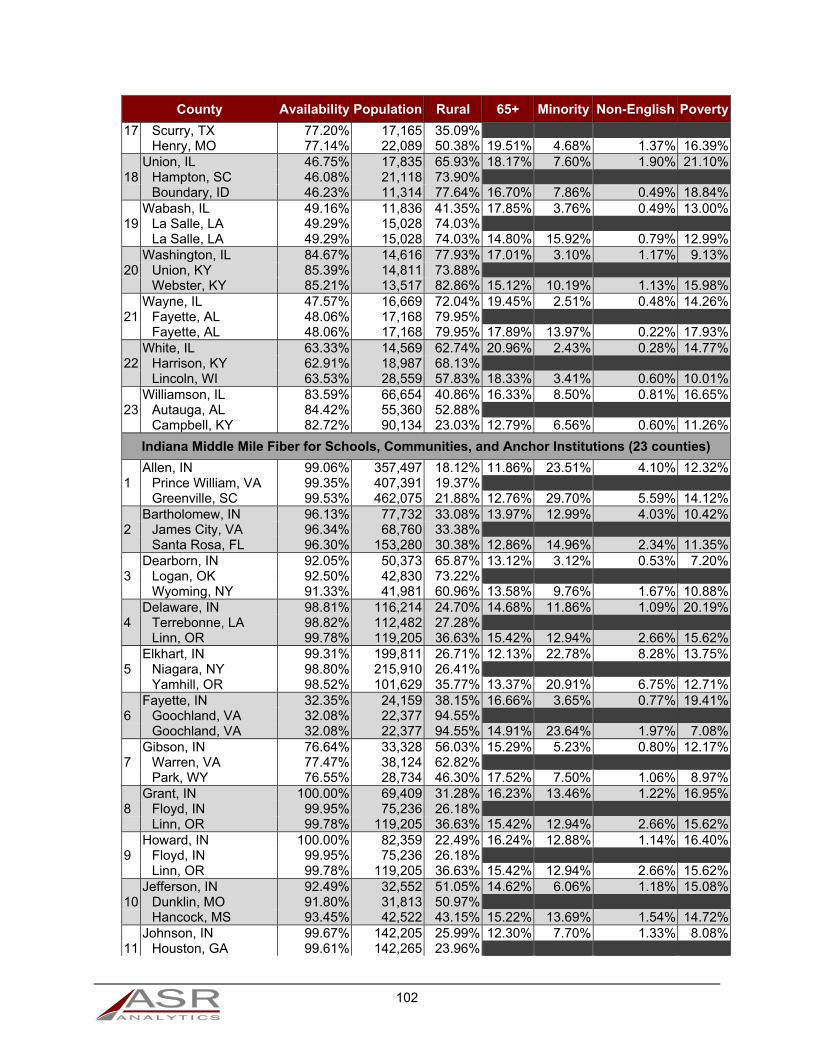
102
County Availability Population Rural 65+ Minority Non-English Poverty
17 Scurry, TX 77.20% 17,165 35.09% Henry, MO 77.14% 22,089 50.38% 19.51% 4.68% 1.37% 16.39%Union, IL 46.75% 17,835 65.93% 18.17% 7.60% 1.90% 21.10%
18 Hampton, SC 46.08% 21,118 73.90% Boundary, ID 46.23% 11,314 77.64% 16.70% 7.86% 0.49% 18.84%Wabash, IL 49.16% 11,836 41.35% 17.85% 3.76% 0.49% 13.00%
19 La Salle, LA 49.29% 15,028 74.03% La Salle, LA 49.29% 15,028 74.03% 14.80% 15.92% 0.79% 12.99%Washington, IL 84.67% 14,616 77.93% 17.01% 3.10% 1.17% 9.13%
20 Union, KY 85.39% 14,811 73.88% Webster, KY 85.21% 13,517 82.86% 15.12% 10.19% 1.13% 15.98%Wayne, IL 47.57% 16,669 72.04% 19.45% 2.51% 0.48% 14.26%
21 Fayette, AL 48.06% 17,168 79.95% Fayette, AL 48.06% 17,168 79.95% 17.89% 13.97% 0.22% 17.93%White, IL 63.33% 14,569 62.74% 20.96% 2.43% 0.28% 14.77%
22 Harrison, KY 62.91% 18,987 68.13% Lincoln, WI 63.53% 28,559 57.83% 18.33% 3.41% 0.60% 10.01%Williamson, IL 83.59% 66,654 40.86% 16.33% 8.50% 0.81% 16.65%
23 Autauga, AL 84.42% 55,360 52.88% Campbell, KY 82.72% 90,134 23.03% 12.79% 6.56% 0.60% 11.26%
Indiana Middle Mile Fiber for Schools, Communities, and Anchor Institutions (23 counties)
Allen, IN 99.06% 357,497 18.12% 11.86% 23.51% 4.10% 12.32%1 Prince William, VA 99.35% 407,391 19.37%
Greenville, SC 99.53% 462,075 21.88% 12.76% 29.70% 5.59% 14.12%Bartholomew, IN 96.13% 77,732 33.08% 13.97% 12.99% 4.03% 10.42%
2 James City, VA 96.34% 68,760 33.38% Santa Rosa, FL 96.30% 153,280 30.38% 12.86% 14.96% 2.34% 11.35%Dearborn, IN 92.05% 50,373 65.87% 13.12% 3.12% 0.53% 7.20%
3 Logan, OK 92.50% 42,830 73.22% Wyoming, NY 91.33% 41,981 60.96% 13.58% 9.76% 1.67% 10.88%Delaware, IN 98.81% 116,214 24.70% 14.68% 11.86% 1.09% 20.19%
4 Terrebonne, LA 98.82% 112,482 27.28% Linn, OR 99.78% 119,205 36.63% 15.42% 12.94% 2.66% 15.62%Elkhart, IN 99.31% 199,811 26.71% 12.13% 22.78% 8.28% 13.75%
5 Niagara, NY 98.80% 215,910 26.41% Yamhill, OR 98.52% 101,629 35.77% 13.37% 20.91% 6.75% 12.71%Fayette, IN 32.35% 24,159 38.15% 16.66% 3.65% 0.77% 19.41%
6 Goochland, VA 32.08% 22,377 94.55% Goochland, VA 32.08% 22,377 94.55% 14.91% 23.64% 1.97% 7.08%Gibson, IN 76.64% 33,328 56.03% 15.29% 5.23% 0.80% 12.17%
7 Warren, VA 77.47% 38,124 62.82% Park, WY 76.55% 28,734 46.30% 17.52% 7.50% 1.06% 8.97%Grant, IN 100.00% 69,409 31.28% 16.23% 13.46% 1.22% 16.95%
8 Floyd, IN 99.95% 75,236 26.18% Linn, OR 99.78% 119,205 36.63% 15.42% 12.94% 2.66% 15.62%Howard, IN 100.00% 82,359 22.49% 16.24% 12.88% 1.14% 16.40%
9 Floyd, IN 99.95% 75,236 26.18% Linn, OR 99.78% 119,205 36.63% 15.42% 12.94% 2.66% 15.62%Jefferson, IN 92.49% 32,552 51.05% 14.62% 6.06% 1.18% 15.08%
10 Dunklin, MO 91.80% 31,813 50.97% Hancock, MS 93.45% 42,522 43.15% 15.22% 13.69% 1.54% 14.72%Johnson, IN 99.67% 142,205 25.99% 12.30% 7.70% 1.33% 8.08%
11 Houston, GA 99.61% 142,265 23.96%

103
County Availability Population Rural 65+ Minority Non-English Poverty
Outagamie, WI 99.15% 177,805 32.56% 11.79% 10.37% 2.89% 8.52%Kosciusko, IN 92.92% 77,590 53.80% 13.54% 10.12% 3.58% 10.00%
12 Nassau, FL 92.89% 74,979 59.52% Tioga, NY 93.89% 50,908 65.83% 15.71% 3.95% 0.69% 9.63%Lake, IN 99.27% 499,485 8.46% 13.28% 44.73% 5.05% 16.08%
13 Brevard, FL 99.87% 545,206 8.47% Jefferson, LA 99.58% 430,477 1.17% 13.64% 43.99% 7.28% 14.23%LaPorte, IN 89.90% 112,258 41.37% 14.23% 18.64% 2.23% 13.76%
14 Florence, SC 90.55% 137,717 43.53% Taylor, TX 90.70% 132,211 19.26% 13.20% 32.99% 3.88% 16.48%Madison, IN 99.79% 131,698 27.16% 15.37% 13.72% 1.04% 14.73%
15 Terrebonne, LA 98.82% 112,482 27.28% Niagara, NY 98.80% 215,910 26.41% 15.89% 12.73% 1.46% 12.76%Marion, IN 99.94% 907,727 4.24% 10.64% 40.46% 5.88% 17.32%
16 Westchester, NY 100.00% 951,909 3.78% Greenville, SC 99.53% 462,075 21.88% 12.76% 29.70% 5.59% 14.12%Monroe, IN 100.00% 139,205 23.54% 10.18% 13.87% 3.12% 25.53%
17 Houston, GA 99.61% 142,265 23.96% Linn, OR 99.78% 119,205 36.63% 15.42% 12.94% 2.66% 15.62%Porter, IN 99.09% 166,243 25.41% 12.39% 14.06% 2.05% 9.45%
18 Hernando, FL 98.94% 177,919 26.49% Clark, IN 100.00% 112,109 29.96% 12.75% 14.83% 2.26% 11.82%Sullivan, IN 53.91% 21,359 76.31% 14.84% 7.19% 0.67% 11.86%
19 Fairfield, SC 53.01% 23,726 77.32% Mercer, IL 54.11% 16,365 79.32% 18.26% 3.18% 0.54% 9.33%Tippecanoe, IN 98.02% 175,482 19.55% 9.48% 19.63% 5.15% 19.98%
20 Shawnee, KS 98.10% 179,127 19.22% Douglas, KS 97.52% 111,521 22.56% 8.90% 18.31% 3.37% 19.12%Vanderburgh, IN 100.00% 179,709 13.39% 14.41% 14.82% 1.69% 15.56%
21 Indian River, FL 99.90% 139,878 16.57% Schenectady, NY 99.57% 155,858 8.47% 14.92% 22.83% 3.35% 11.13%Wabash, IN 69.85% 32,591 49.14% 18.10% 4.62% 0.63% 11.59%
22 Llano, TX 69.44% 19,323 54.41% Giles, TN 69.56% 29,476 75.66% 16.65% 14.46% 0.69% 17.13%White, IN 84.98% 24,522 68.14% 17.17% 8.82% 3.21% 9.52%
23 Wayne, KY 85.26% 20,900 69.99% Meeker, MN 85.87% 23,293 72.01% 16.46% 4.58% 0.82% 8.65%
The Massachusetts Broadband Institute: MassBroadband 123 (6 counties)
Berkshire, MA 94.56% 130,446 31.94% 18.58% 9.37% 2.30% 11.57%1 Spotsylvania, VA 94.14% 122,743 36.95%
Etowah, AL 95.28% 104,667 43.57% 15.81% 20.72% 1.69% 16.85%Franklin, MA 86.26% 71,191 56.13% 15.24% 7.56% 2.00% 11.28%
2 Campbell, TN 86.03% 40,836 59.40% Newton, MO 87.04% 58,523 66.71% 15.24% 12.30% 2.60% 16.29%Hampden, MA 99.49% 464,871 10.27% 14.18% 32.29% 9.94% 17.20%
3 New Castle, DE 99.69% 541,539 9.56% Richmond, NY 100.00% 471,738 0.00% 12.66% 35.96% 11.44% 10.34%Hampshire, MA 97.99% 158,172 29.29% 12.67% 13.81% 3.44% 11.73%
4 Hernando, FL 98.94% 177,919 26.49% Rensselaer, NY 97.59% 159,760 32.35% 13.55% 14.35% 2.55% 11.72%Middlesex, MA 99.85% 1,508,165 3.97% 13.11% 23.47% 8.89% 7.61%
5 Suffolk, NY 99.92% 1,491,785 3.13% Suffolk, NY 99.92% 1,491,785 3.13% 13.51% 28.43% 8.94% 5.75%
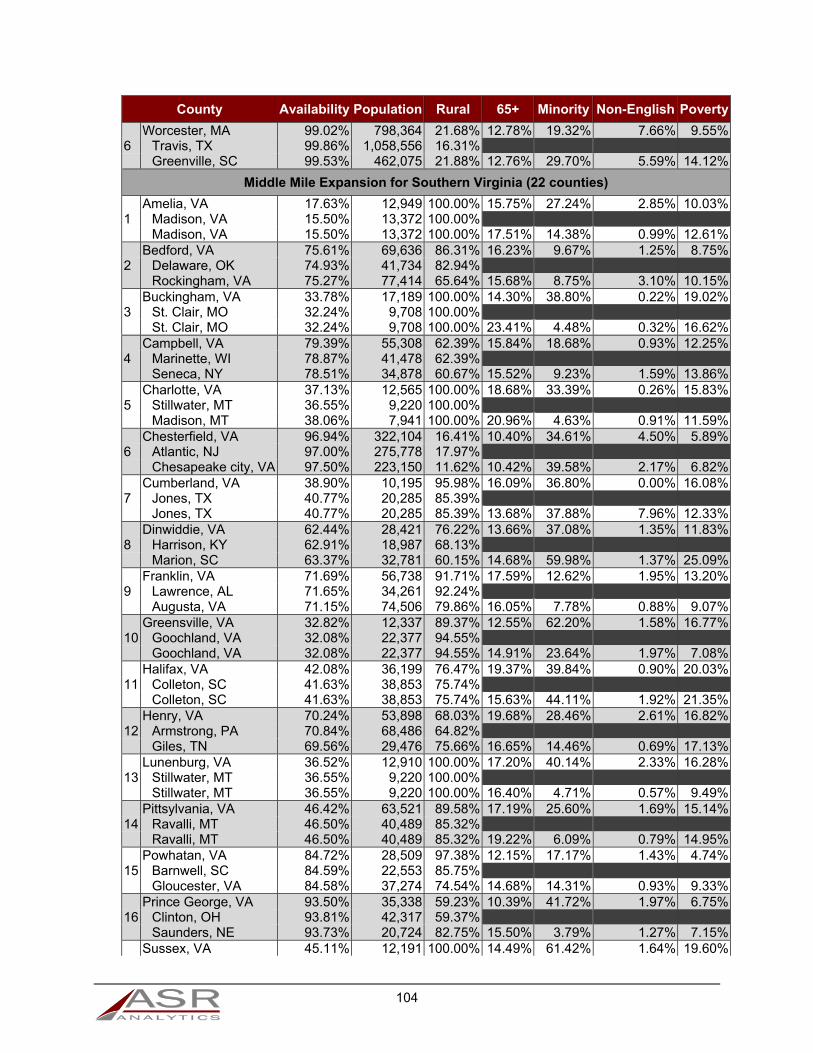
104
County Availability Population Rural 65+ Minority Non-English Poverty
Worcester, MA 99.02% 798,364 21.68% 12.78% 19.32% 7.66% 9.55%6 Travis, TX 99.86% 1,058,556 16.31%
Greenville, SC 99.53% 462,075 21.88% 12.76% 29.70% 5.59% 14.12%
Middle Mile Expansion for Southern Virginia (22 counties)
Amelia, VA 17.63% 12,949 100.00% 15.75% 27.24% 2.85% 10.03%1 Madison, VA 15.50% 13,372 100.00%
Madison, VA 15.50% 13,372 100.00% 17.51% 14.38% 0.99% 12.61%Bedford, VA 75.61% 69,636 86.31% 16.23% 9.67% 1.25% 8.75%
2 Delaware, OK 74.93% 41,734 82.94% Rockingham, VA 75.27% 77,414 65.64% 15.68% 8.75% 3.10% 10.15%Buckingham, VA 33.78% 17,189 100.00% 14.30% 38.80% 0.22% 19.02%
3 St. Clair, MO 32.24% 9,708 100.00% St. Clair, MO 32.24% 9,708 100.00% 23.41% 4.48% 0.32% 16.62%Campbell, VA 79.39% 55,308 62.39% 15.84% 18.68% 0.93% 12.25%
4 Marinette, WI 78.87% 41,478 62.39% Seneca, NY 78.51% 34,878 60.67% 15.52% 9.23% 1.59% 13.86%Charlotte, VA 37.13% 12,565 100.00% 18.68% 33.39% 0.26% 15.83%
5 Stillwater, MT 36.55% 9,220 100.00% Madison, MT 38.06% 7,941 100.00% 20.96% 4.63% 0.91% 11.59%Chesterfield, VA 96.94% 322,104 16.41% 10.40% 34.61% 4.50% 5.89%
6 Atlantic, NJ 97.00% 275,778 17.97% Chesapeake city, VA 97.50% 223,150 11.62% 10.42% 39.58% 2.17% 6.82%Cumberland, VA 38.90% 10,195 95.98% 16.09% 36.80% 0.00% 16.08%
7 Jones, TX 40.77% 20,285 85.39% Jones, TX 40.77% 20,285 85.39% 13.68% 37.88% 7.96% 12.33%Dinwiddie, VA 62.44% 28,421 76.22% 13.66% 37.08% 1.35% 11.83%
8 Harrison, KY 62.91% 18,987 68.13% Marion, SC 63.37% 32,781 60.15% 14.68% 59.98% 1.37% 25.09%Franklin, VA 71.69% 56,738 91.71% 17.59% 12.62% 1.95% 13.20%
9 Lawrence, AL 71.65% 34,261 92.24% Augusta, VA 71.15% 74,506 79.86% 16.05% 7.78% 0.88% 9.07%Greensville, VA 32.82% 12,337 89.37% 12.55% 62.20% 1.58% 16.77%
10 Goochland, VA 32.08% 22,377 94.55% Goochland, VA 32.08% 22,377 94.55% 14.91% 23.64% 1.97% 7.08%Halifax, VA 42.08% 36,199 76.47% 19.37% 39.84% 0.90% 20.03%
11 Colleton, SC 41.63% 38,853 75.74% Colleton, SC 41.63% 38,853 75.74% 15.63% 44.11% 1.92% 21.35%Henry, VA 70.24% 53,898 68.03% 19.68% 28.46% 2.61% 16.82%
12 Armstrong, PA 70.84% 68,486 64.82% Giles, TN 69.56% 29,476 75.66% 16.65% 14.46% 0.69% 17.13%Lunenburg, VA 36.52% 12,910 100.00% 17.20% 40.14% 2.33% 16.28%
13 Stillwater, MT 36.55% 9,220 100.00% Stillwater, MT 36.55% 9,220 100.00% 16.40% 4.71% 0.57% 9.49%Pittsylvania, VA 46.42% 63,521 89.58% 17.19% 25.60% 1.69% 15.14%
14 Ravalli, MT 46.50% 40,489 85.32% Ravalli, MT 46.50% 40,489 85.32% 19.22% 6.09% 0.79% 14.95%Powhatan, VA 84.72% 28,509 97.38% 12.15% 17.17% 1.43% 4.74%
15 Barnwell, SC 84.59% 22,553 85.75% Gloucester, VA 84.58% 37,274 74.54% 14.68% 14.31% 0.93% 9.33%Prince George, VA 93.50% 35,338 59.23% 10.39% 41.72% 1.97% 6.75%
16 Clinton, OH 93.81% 42,317 59.37% Saunders, NE 93.73% 20,724 82.75% 15.50% 3.79% 1.27% 7.15%Sussex, VA 45.11% 12,191 100.00% 14.49% 61.42% 1.64% 19.60%
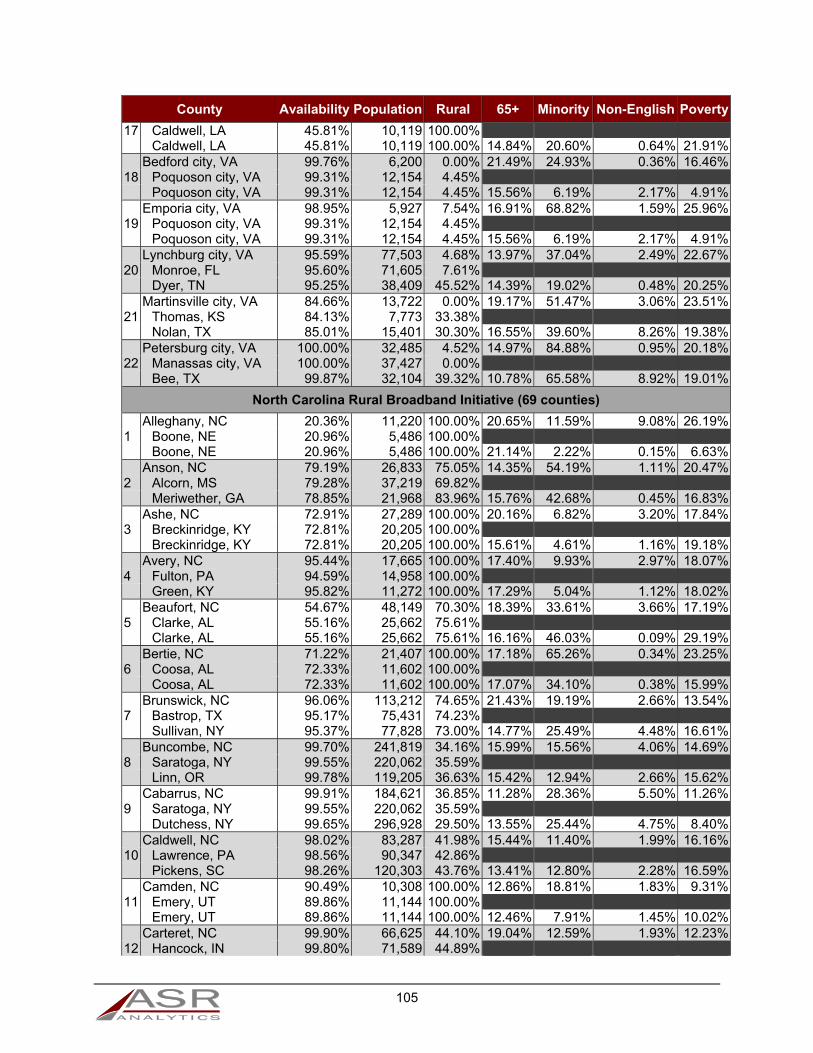
105
County Availability Population Rural 65+ Minority Non-English Poverty
17 Caldwell, LA 45.81% 10,119 100.00% Caldwell, LA 45.81% 10,119 100.00% 14.84% 20.60% 0.64% 21.91%Bedford city, VA 99.76% 6,200 0.00% 21.49% 24.93% 0.36% 16.46%
18 Poquoson city, VA 99.31% 12,154 4.45% Poquoson city, VA 99.31% 12,154 4.45% 15.56% 6.19% 2.17% 4.91%Emporia city, VA 98.95% 5,927 7.54% 16.91% 68.82% 1.59% 25.96%
19 Poquoson city, VA 99.31% 12,154 4.45% Poquoson city, VA 99.31% 12,154 4.45% 15.56% 6.19% 2.17% 4.91%Lynchburg city, VA 95.59% 77,503 4.68% 13.97% 37.04% 2.49% 22.67%
20 Monroe, FL 95.60% 71,605 7.61% Dyer, TN 95.25% 38,409 45.52% 14.39% 19.02% 0.48% 20.25%Martinsville city, VA 84.66% 13,722 0.00% 19.17% 51.47% 3.06% 23.51%
21 Thomas, KS 84.13% 7,773 33.38% Nolan, TX 85.01% 15,401 30.30% 16.55% 39.60% 8.26% 19.38%Petersburg city, VA 100.00% 32,485 4.52% 14.97% 84.88% 0.95% 20.18%
22 Manassas city, VA 100.00% 37,427 0.00% Bee, TX 99.87% 32,104 39.32% 10.78% 65.58% 8.92% 19.01%
North Carolina Rural Broadband Initiative (69 counties)
Alleghany, NC 20.36% 11,220 100.00% 20.65% 11.59% 9.08% 26.19%1 Boone, NE 20.96% 5,486 100.00%
Boone, NE 20.96% 5,486 100.00% 21.14% 2.22% 0.15% 6.63%Anson, NC 79.19% 26,833 75.05% 14.35% 54.19% 1.11% 20.47%
2 Alcorn, MS 79.28% 37,219 69.82% Meriwether, GA 78.85% 21,968 83.96% 15.76% 42.68% 0.45% 16.83%Ashe, NC 72.91% 27,289 100.00% 20.16% 6.82% 3.20% 17.84%
3 Breckinridge, KY 72.81% 20,205 100.00% Breckinridge, KY 72.81% 20,205 100.00% 15.61% 4.61% 1.16% 19.18%Avery, NC 95.44% 17,665 100.00% 17.40% 9.93% 2.97% 18.07%
4 Fulton, PA 94.59% 14,958 100.00% Green, KY 95.82% 11,272 100.00% 17.29% 5.04% 1.12% 18.02%Beaufort, NC 54.67% 48,149 70.30% 18.39% 33.61% 3.66% 17.19%
5 Clarke, AL 55.16% 25,662 75.61% Clarke, AL 55.16% 25,662 75.61% 16.16% 46.03% 0.09% 29.19%Bertie, NC 71.22% 21,407 100.00% 17.18% 65.26% 0.34% 23.25%
6 Coosa, AL 72.33% 11,602 100.00% Coosa, AL 72.33% 11,602 100.00% 17.07% 34.10% 0.38% 15.99%Brunswick, NC 96.06% 113,212 74.65% 21.43% 19.19% 2.66% 13.54%
7 Bastrop, TX 95.17% 75,431 74.23% Sullivan, NY 95.37% 77,828 73.00% 14.77% 25.49% 4.48% 16.61%Buncombe, NC 99.70% 241,819 34.16% 15.99% 15.56% 4.06% 14.69%
8 Saratoga, NY 99.55% 220,062 35.59% Linn, OR 99.78% 119,205 36.63% 15.42% 12.94% 2.66% 15.62%Cabarrus, NC 99.91% 184,621 36.85% 11.28% 28.36% 5.50% 11.26%
9 Saratoga, NY 99.55% 220,062 35.59% Dutchess, NY 99.65% 296,928 29.50% 13.55% 25.44% 4.75% 8.40%Caldwell, NC 98.02% 83,287 41.98% 15.44% 11.40% 1.99% 16.16%
10 Lawrence, PA 98.56% 90,347 42.86% Pickens, SC 98.26% 120,303 43.76% 13.41% 12.80% 2.28% 16.59%Camden, NC 90.49% 10,308 100.00% 12.86% 18.81% 1.83% 9.31%
11 Emery, UT 89.86% 11,144 100.00% Emery, UT 89.86% 11,144 100.00% 12.46% 7.91% 1.45% 10.02%Carteret, NC 99.90% 66,625 44.10% 19.04% 12.59% 1.93% 12.23%
12 Hancock, IN 99.80% 71,589 44.89%

106
County Availability Population Rural 65+ Minority Non-English Poverty
Henry, IN 99.88% 49,384 49.82% 16.18% 5.11% 0.67% 13.70%Caswell, NC 63.97% 23,609 100.00% 15.83% 38.81% 1.60% 21.67%
13 Pendleton, KY 63.92% 14,825 100.00% Wayne, MO 64.21% 13,421 100.00% 21.41% 3.46% 0.22% 19.80%Chatham, NC 85.06% 64,883 84.86% 18.32% 28.85% 6.74% 12.22%
14 Barry, MI 85.98% 58,960 80.79% St. Clair, AL 85.69% 86,680 88.00% 13.05% 12.74% 1.11% 10.63%Chowan, NC 85.57% 14,908 67.08% 19.66% 38.89% 2.58% 17.37%
15 New Madrid, MO 85.65% 18,677 64.68% Milam, TX 84.82% 24,760 56.24% 17.39% 34.50% 5.96% 17.61%Cleveland, NC 96.14% 98,275 58.35% 14.96% 25.78% 1.68% 19.37%
16 Genesee, NY 97.12% 59,748 61.37% Etowah, AL 95.28% 104,667 43.57% 15.81% 20.72% 1.69% 16.85%Columbus, NC 82.33% 58,265 89.23% 15.20% 39.64% 2.45% 21.36%
17 Walker, AL 82.86% 66,914 76.84% Walker, AL 82.86% 66,914 76.84% 16.25% 9.60% 0.73% 18.59%Craven, NC 82.65% 103,842 42.93% 15.27% 32.93% 2.69% 16.01%
18 Campbell, KY 82.72% 90,134 23.03% Dickson, TN 82.57% 50,248 70.81% 13.26% 9.64% 1.30% 13.96%Cumberland, NC 99.33% 320,965 14.66% 9.45% 52.81% 3.19% 16.60%
19 Gloucester, NJ 98.75% 291,283 16.60% Bibb, GA 99.79% 155,657 19.93% 12.66% 57.89% 2.11% 22.39%Currituck, NC 91.43% 23,992 100.00% 12.91% 11.34% 1.39% 8.47%
20 King George, VA 90.96% 24,642 100.00% Pike, GA 91.17% 18,421 100.00% 12.29% 13.22% 0.24% 10.49%Dare, NC 99.38% 33,674 29.55% 15.23% 11.38% 3.59% 10.52%
21 Geary, KS 98.70% 35,428 30.82% Woodford, KY 99.04% 25,168 39.50% 13.00% 13.57% 4.53% 11.29%Edgecombe, NC 63.64% 56,234 50.31% 14.33% 62.23% 1.78% 22.26%
22 Washington, TX 63.15% 34,013 57.21% Marion, SC 63.37% 32,781 60.15% 14.68% 59.98% 1.37% 25.09%Franklin, NC 85.04% 62,081 93.76% 12.67% 36.52% 3.93% 15.03%
23 St. Clair, AL 85.69% 86,680 88.00% St. Clair, AL 85.69% 86,680 88.00% 13.05% 12.74% 1.11% 10.63%Gaston, NC 99.65% 210,385 24.61% 13.24% 24.15% 2.99% 16.65%
24 Niagara, NY 98.80% 215,910 26.41% Harrison, MS 99.36% 183,513 28.96% 11.73% 32.80% 3.44% 15.25%Gates, NC 50.86% 12,463 100.00% 15.01% 37.00% 0.41% 20.46%
25 Washington, KY 50.07% 11,812 100.00% Johnson, GA 50.05% 10,123 100.00% 13.92% 37.69% 0.48% 27.68%Graham, NC 67.55% 8,814 100.00% 19.66% 10.37% 1.90% 19.52%
26 Stewart, TN 67.77% 13,414 100.00% Stewart, TN 67.77% 13,414 100.00% 16.68% 6.42% 0.87% 17.09%Granville, NC 87.45% 60,998 72.34% 12.42% 42.34% 3.86% 11.91%
27 Jefferson, TN 87.54% 52,288 78.84% Shelby, KY 88.00% 43,178 64.62% 12.03% 19.00% 4.74% 11.41%Halifax, NC 83.13% 54,600 57.61% 16.16% 60.56% 1.39% 23.85%
28 Dickson, TN 82.57% 50,248 70.81% Union, MS 83.52% 27,294 78.17% 14.46% 20.21% 2.62% 19.83%Harnett, NC 98.04% 117,966 73.20% 10.42% 35.73% 5.32% 16.47%
29 Oswego, NY 97.68% 121,640 63.35% Hays, TX 97.23% 164,415 59.86% 8.46% 41.40% 6.32% 16.40%Haywood, NC 97.57% 59,173 50.64% 21.03% 6.21% 1.35% 12.26%
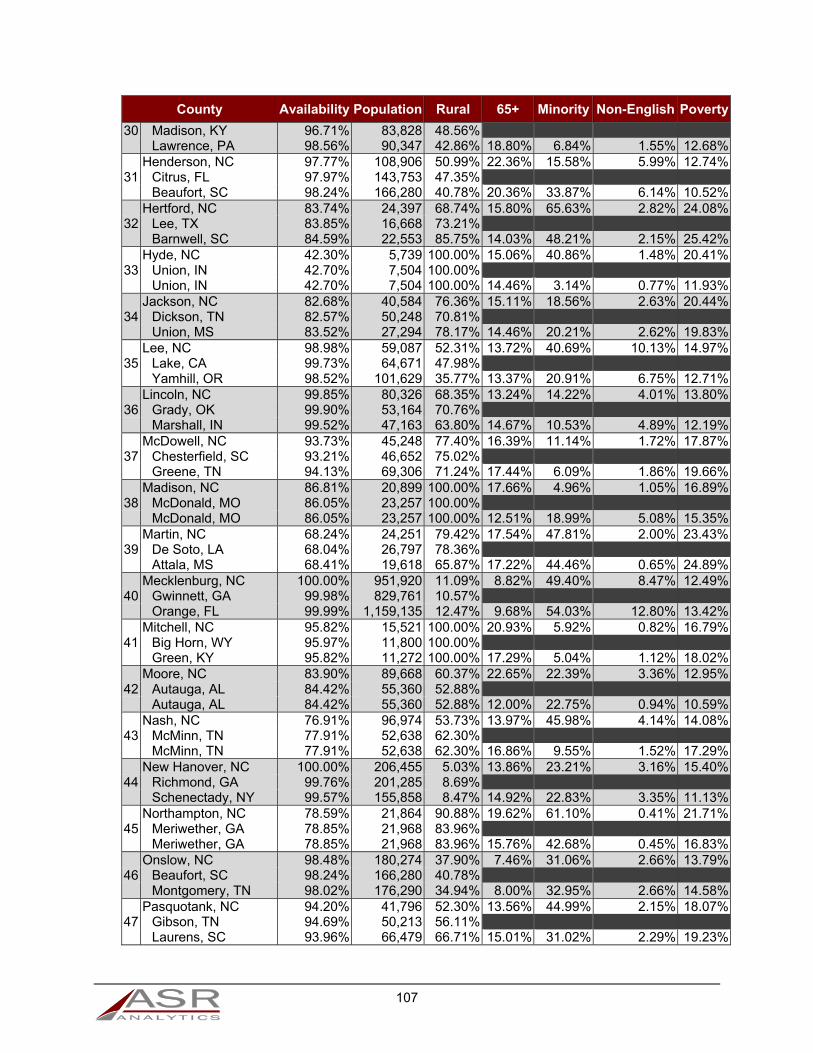
107
County Availability Population Rural 65+ Minority Non-English Poverty
30 Madison, KY 96.71% 83,828 48.56% Lawrence, PA 98.56% 90,347 42.86% 18.80% 6.84% 1.55% 12.68%Henderson, NC 97.77% 108,906 50.99% 22.36% 15.58% 5.99% 12.74%
31 Citrus, FL 97.97% 143,753 47.35% Beaufort, SC 98.24% 166,280 40.78% 20.36% 33.87% 6.14% 10.52%Hertford, NC 83.74% 24,397 68.74% 15.80% 65.63% 2.82% 24.08%
32 Lee, TX 83.85% 16,668 73.21% Barnwell, SC 84.59% 22,553 85.75% 14.03% 48.21% 2.15% 25.42%Hyde, NC 42.30% 5,739 100.00% 15.06% 40.86% 1.48% 20.41%
33 Union, IN 42.70% 7,504 100.00% Union, IN 42.70% 7,504 100.00% 14.46% 3.14% 0.77% 11.93%Jackson, NC 82.68% 40,584 76.36% 15.11% 18.56% 2.63% 20.44%
34 Dickson, TN 82.57% 50,248 70.81% Union, MS 83.52% 27,294 78.17% 14.46% 20.21% 2.62% 19.83%Lee, NC 98.98% 59,087 52.31% 13.72% 40.69% 10.13% 14.97%
35 Lake, CA 99.73% 64,671 47.98% Yamhill, OR 98.52% 101,629 35.77% 13.37% 20.91% 6.75% 12.71%Lincoln, NC 99.85% 80,326 68.35% 13.24% 14.22% 4.01% 13.80%
36 Grady, OK 99.90% 53,164 70.76% Marshall, IN 99.52% 47,163 63.80% 14.67% 10.53% 4.89% 12.19%McDowell, NC 93.73% 45,248 77.40% 16.39% 11.14% 1.72% 17.87%
37 Chesterfield, SC 93.21% 46,652 75.02% Greene, TN 94.13% 69,306 71.24% 17.44% 6.09% 1.86% 19.66%Madison, NC 86.81% 20,899 100.00% 17.66% 4.96% 1.05% 16.89%
38 McDonald, MO 86.05% 23,257 100.00% McDonald, MO 86.05% 23,257 100.00% 12.51% 18.99% 5.08% 15.35%Martin, NC 68.24% 24,251 79.42% 17.54% 47.81% 2.00% 23.43%
39 De Soto, LA 68.04% 26,797 78.36% Attala, MS 68.41% 19,618 65.87% 17.22% 44.46% 0.65% 24.89%Mecklenburg, NC 100.00% 951,920 11.09% 8.82% 49.40% 8.47% 12.49%
40 Gwinnett, GA 99.98% 829,761 10.57% Orange, FL 99.99% 1,159,135 12.47% 9.68% 54.03% 12.80% 13.42%Mitchell, NC 95.82% 15,521 100.00% 20.93% 5.92% 0.82% 16.79%
41 Big Horn, WY 95.97% 11,800 100.00% Green, KY 95.82% 11,272 100.00% 17.29% 5.04% 1.12% 18.02%Moore, NC 83.90% 89,668 60.37% 22.65% 22.39% 3.36% 12.95%
42 Autauga, AL 84.42% 55,360 52.88% Autauga, AL 84.42% 55,360 52.88% 12.00% 22.75% 0.94% 10.59%Nash, NC 76.91% 96,974 53.73% 13.97% 45.98% 4.14% 14.08%
43 McMinn, TN 77.91% 52,638 62.30% McMinn, TN 77.91% 52,638 62.30% 16.86% 9.55% 1.52% 17.29%New Hanover, NC 100.00% 206,455 5.03% 13.86% 23.21% 3.16% 15.40%
44 Richmond, GA 99.76% 201,285 8.69% Schenectady, NY 99.57% 155,858 8.47% 14.92% 22.83% 3.35% 11.13%Northampton, NC 78.59% 21,864 90.88% 19.62% 61.10% 0.41% 21.71%
45 Meriwether, GA 78.85% 21,968 83.96% Meriwether, GA 78.85% 21,968 83.96% 15.76% 42.68% 0.45% 16.83%Onslow, NC 98.48% 180,274 37.90% 7.46% 31.06% 2.66% 13.79%
46 Beaufort, SC 98.24% 166,280 40.78% Montgomery, TN 98.02% 176,290 34.94% 8.00% 32.95% 2.66% 14.58%Pasquotank, NC 94.20% 41,796 52.30% 13.56% 44.99% 2.15% 18.07%
47 Gibson, TN 94.69% 50,213 56.11% Laurens, SC 93.96% 66,479 66.71% 15.01% 31.02% 2.29% 19.23%
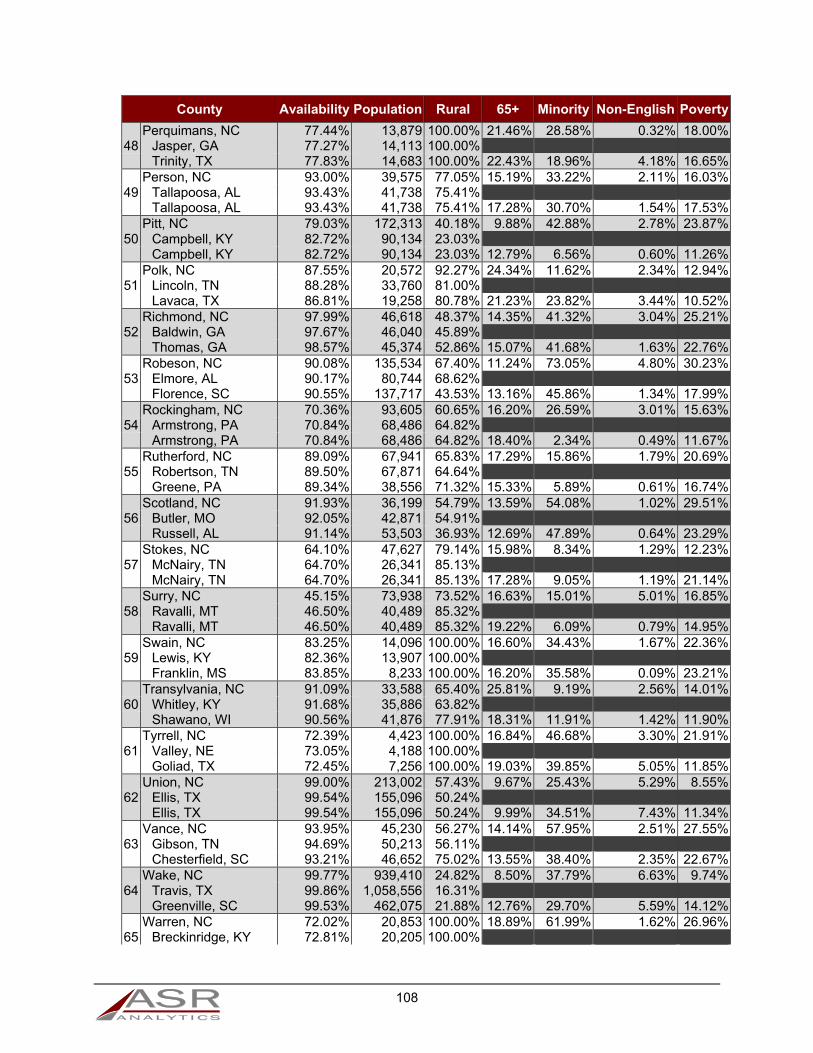
108
County Availability Population Rural 65+ Minority Non-English Poverty
Perquimans, NC 77.44% 13,879 100.00% 21.46% 28.58% 0.32% 18.00%48 Jasper, GA 77.27% 14,113 100.00%
Trinity, TX 77.83% 14,683 100.00% 22.43% 18.96% 4.18% 16.65%Person, NC 93.00% 39,575 77.05% 15.19% 33.22% 2.11% 16.03%
49 Tallapoosa, AL 93.43% 41,738 75.41% Tallapoosa, AL 93.43% 41,738 75.41% 17.28% 30.70% 1.54% 17.53%Pitt, NC 79.03% 172,313 40.18% 9.88% 42.88% 2.78% 23.87%
50 Campbell, KY 82.72% 90,134 23.03% Campbell, KY 82.72% 90,134 23.03% 12.79% 6.56% 0.60% 11.26%Polk, NC 87.55% 20,572 92.27% 24.34% 11.62% 2.34% 12.94%
51 Lincoln, TN 88.28% 33,760 81.00% Lavaca, TX 86.81% 19,258 80.78% 21.23% 23.82% 3.44% 10.52%Richmond, NC 97.99% 46,618 48.37% 14.35% 41.32% 3.04% 25.21%
52 Baldwin, GA 97.67% 46,040 45.89% Thomas, GA 98.57% 45,374 52.86% 15.07% 41.68% 1.63% 22.76%Robeson, NC 90.08% 135,534 67.40% 11.24% 73.05% 4.80% 30.23%
53 Elmore, AL 90.17% 80,744 68.62% Florence, SC 90.55% 137,717 43.53% 13.16% 45.86% 1.34% 17.99%Rockingham, NC 70.36% 93,605 60.65% 16.20% 26.59% 3.01% 15.63%
54 Armstrong, PA 70.84% 68,486 64.82% Armstrong, PA 70.84% 68,486 64.82% 18.40% 2.34% 0.49% 11.67%Rutherford, NC 89.09% 67,941 65.83% 17.29% 15.86% 1.79% 20.69%
55 Robertson, TN 89.50% 67,871 64.64% Greene, PA 89.34% 38,556 71.32% 15.33% 5.89% 0.61% 16.74%Scotland, NC 91.93% 36,199 54.79% 13.59% 54.08% 1.02% 29.51%
56 Butler, MO 92.05% 42,871 54.91% Russell, AL 91.14% 53,503 36.93% 12.69% 47.89% 0.64% 23.29%Stokes, NC 64.10% 47,627 79.14% 15.98% 8.34% 1.29% 12.23%
57 McNairy, TN 64.70% 26,341 85.13% McNairy, TN 64.70% 26,341 85.13% 17.28% 9.05% 1.19% 21.14%Surry, NC 45.15% 73,938 73.52% 16.63% 15.01% 5.01% 16.85%
58 Ravalli, MT 46.50% 40,489 85.32% Ravalli, MT 46.50% 40,489 85.32% 19.22% 6.09% 0.79% 14.95%Swain, NC 83.25% 14,096 100.00% 16.60% 34.43% 1.67% 22.36%
59 Lewis, KY 82.36% 13,907 100.00% Franklin, MS 83.85% 8,233 100.00% 16.20% 35.58% 0.09% 23.21%Transylvania, NC 91.09% 33,588 65.40% 25.81% 9.19% 2.56% 14.01%
60 Whitley, KY 91.68% 35,886 63.82% Shawano, WI 90.56% 41,876 77.91% 18.31% 11.91% 1.42% 11.90%Tyrrell, NC 72.39% 4,423 100.00% 16.84% 46.68% 3.30% 21.91%
61 Valley, NE 73.05% 4,188 100.00% Goliad, TX 72.45% 7,256 100.00% 19.03% 39.85% 5.05% 11.85%Union, NC 99.00% 213,002 57.43% 9.67% 25.43% 5.29% 8.55%
62 Ellis, TX 99.54% 155,096 50.24% Ellis, TX 99.54% 155,096 50.24% 9.99% 34.51% 7.43% 11.34%Vance, NC 93.95% 45,230 56.27% 14.14% 57.95% 2.51% 27.55%
63 Gibson, TN 94.69% 50,213 56.11% Chesterfield, SC 93.21% 46,652 75.02% 13.55% 38.40% 2.35% 22.67%Wake, NC 99.77% 939,410 24.82% 8.50% 37.79% 6.63% 9.74%
64 Travis, TX 99.86% 1,058,556 16.31% Greenville, SC 99.53% 462,075 21.88% 12.76% 29.70% 5.59% 14.12%Warren, NC 72.02% 20,853 100.00% 18.89% 61.99% 1.62% 26.96%
65 Breckinridge, KY 72.81% 20,205 100.00%
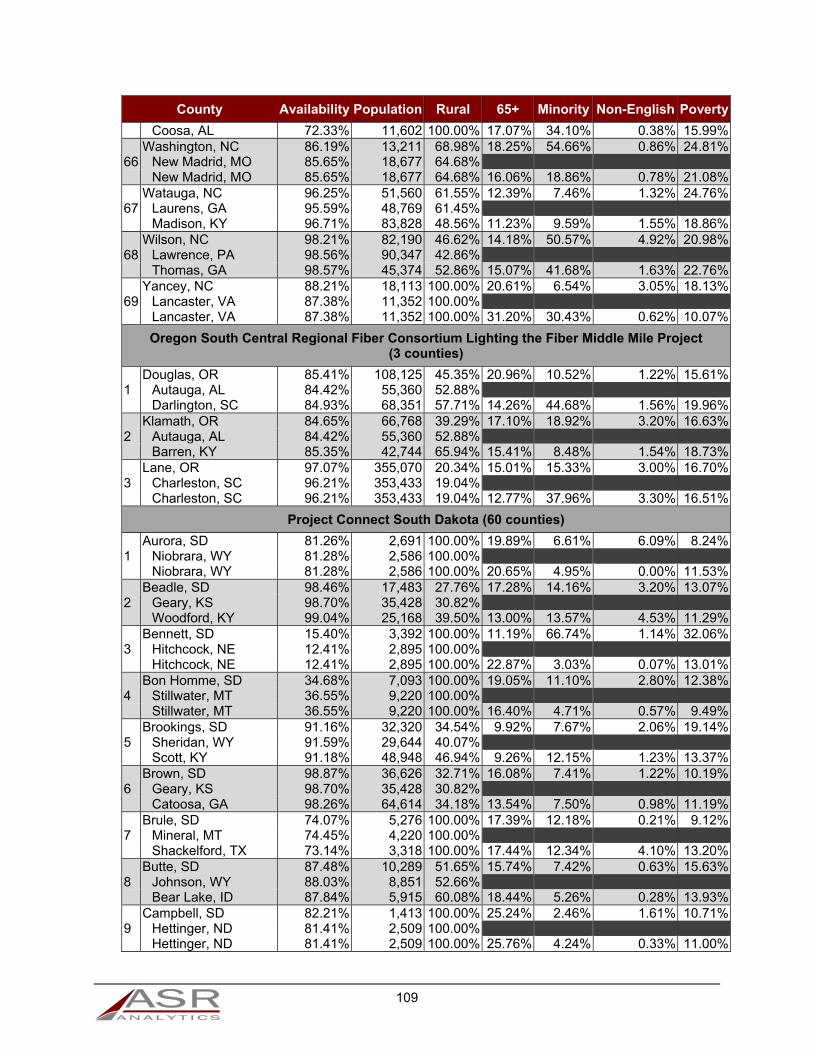
109
County Availability Population Rural 65+ Minority Non-English Poverty
Coosa, AL 72.33% 11,602 100.00% 17.07% 34.10% 0.38% 15.99%Washington, NC 86.19% 13,211 68.98% 18.25% 54.66% 0.86% 24.81%
66 New Madrid, MO 85.65% 18,677 64.68% New Madrid, MO 85.65% 18,677 64.68% 16.06% 18.86% 0.78% 21.08%Watauga, NC 96.25% 51,560 61.55% 12.39% 7.46% 1.32% 24.76%
67 Laurens, GA 95.59% 48,769 61.45% Madison, KY 96.71% 83,828 48.56% 11.23% 9.59% 1.55% 18.86%Wilson, NC 98.21% 82,190 46.62% 14.18% 50.57% 4.92% 20.98%
68 Lawrence, PA 98.56% 90,347 42.86% Thomas, GA 98.57% 45,374 52.86% 15.07% 41.68% 1.63% 22.76%Yancey, NC 88.21% 18,113 100.00% 20.61% 6.54% 3.05% 18.13%
69 Lancaster, VA 87.38% 11,352 100.00% Lancaster, VA 87.38% 11,352 100.00% 31.20% 30.43% 0.62% 10.07%
Oregon South Central Regional Fiber Consortium Lighting the Fiber Middle Mile Project (3 counties)
Douglas, OR 85.41% 108,125 45.35% 20.96% 10.52% 1.22% 15.61%1 Autauga, AL 84.42% 55,360 52.88%
Darlington, SC 84.93% 68,351 57.71% 14.26% 44.68% 1.56% 19.96%Klamath, OR 84.65% 66,768 39.29% 17.10% 18.92% 3.20% 16.63%
2 Autauga, AL 84.42% 55,360 52.88% Barren, KY 85.35% 42,744 65.94% 15.41% 8.48% 1.54% 18.73%Lane, OR 97.07% 355,070 20.34% 15.01% 15.33% 3.00% 16.70%
3 Charleston, SC 96.21% 353,433 19.04% Charleston, SC 96.21% 353,433 19.04% 12.77% 37.96% 3.30% 16.51%
Project Connect South Dakota (60 counties)
Aurora, SD 81.26% 2,691 100.00% 19.89% 6.61% 6.09% 8.24%1 Niobrara, WY 81.28% 2,586 100.00%
Niobrara, WY 81.28% 2,586 100.00% 20.65% 4.95% 0.00% 11.53%Beadle, SD 98.46% 17,483 27.76% 17.28% 14.16% 3.20% 13.07%
2 Geary, KS 98.70% 35,428 30.82% Woodford, KY 99.04% 25,168 39.50% 13.00% 13.57% 4.53% 11.29%Bennett, SD 15.40% 3,392 100.00% 11.19% 66.74% 1.14% 32.06%
3 Hitchcock, NE 12.41% 2,895 100.00% Hitchcock, NE 12.41% 2,895 100.00% 22.87% 3.03% 0.07% 13.01%Bon Homme, SD 34.68% 7,093 100.00% 19.05% 11.10% 2.80% 12.38%
4 Stillwater, MT 36.55% 9,220 100.00% Stillwater, MT 36.55% 9,220 100.00% 16.40% 4.71% 0.57% 9.49%Brookings, SD 91.16% 32,320 34.54% 9.92% 7.67% 2.06% 19.14%
5 Sheridan, WY 91.59% 29,644 40.07% Scott, KY 91.18% 48,948 46.94% 9.26% 12.15% 1.23% 13.37%Brown, SD 98.87% 36,626 32.71% 16.08% 7.41% 1.22% 10.19%
6 Geary, KS 98.70% 35,428 30.82% Catoosa, GA 98.26% 64,614 34.18% 13.54% 7.50% 0.98% 11.19%Brule, SD 74.07% 5,276 100.00% 17.39% 12.18% 0.21% 9.12%
7 Mineral, MT 74.45% 4,220 100.00% Shackelford, TX 73.14% 3,318 100.00% 17.44% 12.34% 4.10% 13.20%Butte, SD 87.48% 10,289 51.65% 15.74% 7.42% 0.63% 15.63%
8 Johnson, WY 88.03% 8,851 52.66% Bear Lake, ID 87.84% 5,915 60.08% 18.44% 5.26% 0.28% 13.93%Campbell, SD 82.21% 1,413 100.00% 25.24% 2.46% 1.61% 10.71%
9 Hettinger, ND 81.41% 2,509 100.00% Hettinger, ND 81.41% 2,509 100.00% 25.76% 4.24% 0.33% 11.00%

110
County Availability Population Rural 65+ Minority Non-English Poverty
Charles Mix, SD 63.24% 9,102 100.00% 17.73% 35.38% 0.80% 24.05%10 Wilkinson, MS 62.88% 9,865 100.00%
Tensas, LA 63.80% 5,164 100.00% 17.29% 58.53% 1.21% 32.36%Clark, SD 38.93% 3,640 100.00% 21.78% 2.57% 3.63% 13.06%
11 Nance, NE 39.92% 3,717 100.00% Nance, NE 39.92% 3,717 100.00% 19.06% 2.89% 0.11% 9.80%Clay, SD 85.27% 13,976 25.97% 10.25% 9.95% 1.23% 23.96%
12 Nolan, TX 85.01% 15,401 30.30% Clinch, GA 85.85% 6,863 65.12% 12.77% 33.27% 0.64% 25.66%Codington, SD 87.71% 27,290 27.26% 14.88% 5.38% 0.58% 12.67%
13 Scotts Bluff, NE 86.72% 37,273 32.37% Silver Bow, MT 87.58% 34,350 13.02% 16.42% 7.85% 1.06% 17.79%Custer, SD 15.64% 8,199 100.00% 21.49% 7.21% 0.49% 9.66%
14 Madison, VA 15.50% 13,372 100.00% Madison, VA 15.50% 13,372 100.00% 17.51% 14.38% 0.99% 12.61%Davison, SD 100.00% 19,418 25.82% 16.92% 6.19% 0.45% 13.78%
15 Seward, KS 99.65% 23,366 14.35% Clark, KY 99.78% 35,953 37.09% 14.17% 9.00% 1.64% 16.03%Day, SD 68.75% 5,643 100.00% 22.92% 12.36% 0.58% 12.45%
16 Stafford, KS 69.15% 4,360 100.00% Stafford, KS 69.15% 4,360 100.00% 20.96% 14.24% 3.64% 14.01%Deuel, SD 84.29% 4,396 100.00% 19.23% 3.30% 1.26% 6.10%
17 Mason, TX 83.97% 4,072 100.00% Stark, IL 84.20% 5,962 100.00% 19.92% 2.80% 0.12% 11.20%Dewey, SD 10.85% 5,207 100.00% 9.72% 79.10% 0.98% 30.51%
18 Hitchcock, NE 12.41% 2,895 100.00% Hitchcock, NE 12.41% 2,895 100.00% 22.87% 3.03% 0.07% 13.01%Douglas, SD 100.00% 2,914 100.00% 24.22% 3.70% 2.29% 9.75%
19 Hamilton, KS 99.35% 2,703 100.00% Mills, TX 99.39% 4,994 100.00% 23.46% 18.48% 7.15% 15.75%Edmunds, SD 87.39% 4,098 100.00% 21.69% 3.00% 6.94% 11.64%
20 Atchison, MO 88.10% 5,593 100.00% Atchison, MO 88.10% 5,593 100.00% 21.58% 2.27% 0.62% 13.12%Fall River, SD 15.21% 7,086 52.38% 23.09% 12.62% 0.38% 17.36%
21 Blaine, OK 8.60% 12,068 57.86% Blaine, OK 8.60% 12,068 57.86% 14.44% 37.10% 10.08% 14.79%Faulk, SD 79.37% 2,339 100.00% 23.69% 1.73% 5.36% 17.93%
22 Niobrara, WY 81.28% 2,586 100.00% Throckmorton, TX 81.14% 1,654 100.00% 24.56% 11.46% 3.04% 13.25%Grant, SD 70.84% 7,257 57.61% 18.53% 3.86% 3.83% 11.61%
23 Anderson, KS 70.89% 8,082 59.58% Anderson, KS 70.89% 8,082 59.58% 20.16% 4.05% 0.93% 12.35%Gregory, SD 15.52% 4,285 100.00% 23.72% 10.61% 0.27% 16.05%
24 Hitchcock, NE 12.41% 2,895 100.00% Hitchcock, NE 12.41% 2,895 100.00% 22.87% 3.03% 0.07% 13.01%Haakon, SD 39.62% 1,913 100.00% 21.73% 5.89% 0.45% 12.53%
25 McCone, MT 39.01% 1,719 100.00% McCone, MT 39.01% 1,719 100.00% 22.03% 2.60% 0.19% 8.58%Hamlin, SD 24.39% 5,936 100.00% 17.28% 3.79% 1.60% 7.52%
26 Marion, TX 23.35% 10,407 100.00% Marion, TX 23.35% 10,407 100.00% 21.52% 28.28% 0.84% 23.18%Hand, SD 68.60% 3,445 100.00% 25.27% 1.84% 0.00% 13.08%
27 Lincoln, KS 69.29% 3,190 100.00%
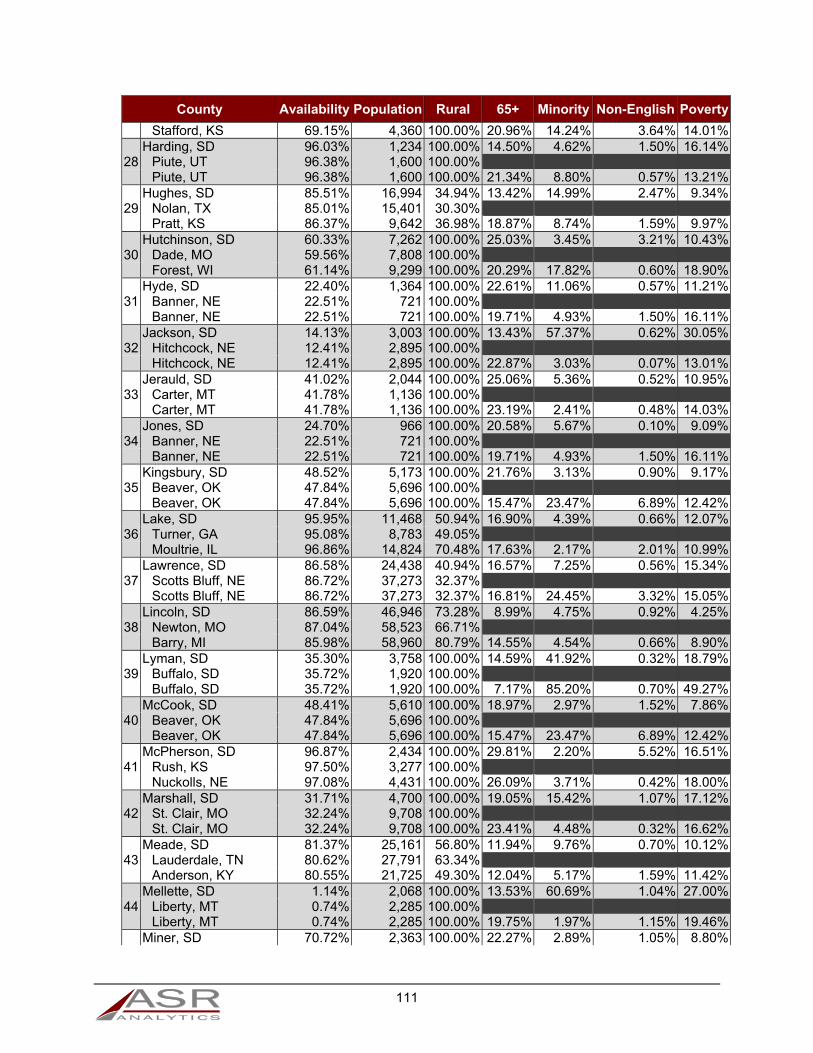
111
County Availability Population Rural 65+ Minority Non-English Poverty
Stafford, KS 69.15% 4,360 100.00% 20.96% 14.24% 3.64% 14.01%Harding, SD 96.03% 1,234 100.00% 14.50% 4.62% 1.50% 16.14%
28 Piute, UT 96.38% 1,600 100.00% Piute, UT 96.38% 1,600 100.00% 21.34% 8.80% 0.57% 13.21%Hughes, SD 85.51% 16,994 34.94% 13.42% 14.99% 2.47% 9.34%
29 Nolan, TX 85.01% 15,401 30.30% Pratt, KS 86.37% 9,642 36.98% 18.87% 8.74% 1.59% 9.97%Hutchinson, SD 60.33% 7,262 100.00% 25.03% 3.45% 3.21% 10.43%
30 Dade, MO 59.56% 7,808 100.00% Forest, WI 61.14% 9,299 100.00% 20.29% 17.82% 0.60% 18.90%Hyde, SD 22.40% 1,364 100.00% 22.61% 11.06% 0.57% 11.21%
31 Banner, NE 22.51% 721 100.00% Banner, NE 22.51% 721 100.00% 19.71% 4.93% 1.50% 16.11%Jackson, SD 14.13% 3,003 100.00% 13.43% 57.37% 0.62% 30.05%
32 Hitchcock, NE 12.41% 2,895 100.00% Hitchcock, NE 12.41% 2,895 100.00% 22.87% 3.03% 0.07% 13.01%Jerauld, SD 41.02% 2,044 100.00% 25.06% 5.36% 0.52% 10.95%
33 Carter, MT 41.78% 1,136 100.00% Carter, MT 41.78% 1,136 100.00% 23.19% 2.41% 0.48% 14.03%Jones, SD 24.70% 966 100.00% 20.58% 5.67% 0.10% 9.09%
34 Banner, NE 22.51% 721 100.00% Banner, NE 22.51% 721 100.00% 19.71% 4.93% 1.50% 16.11%Kingsbury, SD 48.52% 5,173 100.00% 21.76% 3.13% 0.90% 9.17%
35 Beaver, OK 47.84% 5,696 100.00% Beaver, OK 47.84% 5,696 100.00% 15.47% 23.47% 6.89% 12.42%Lake, SD 95.95% 11,468 50.94% 16.90% 4.39% 0.66% 12.07%
36 Turner, GA 95.08% 8,783 49.05% Moultrie, IL 96.86% 14,824 70.48% 17.63% 2.17% 2.01% 10.99%Lawrence, SD 86.58% 24,438 40.94% 16.57% 7.25% 0.56% 15.34%
37 Scotts Bluff, NE 86.72% 37,273 32.37% Scotts Bluff, NE 86.72% 37,273 32.37% 16.81% 24.45% 3.32% 15.05%Lincoln, SD 86.59% 46,946 73.28% 8.99% 4.75% 0.92% 4.25%
38 Newton, MO 87.04% 58,523 66.71% Barry, MI 85.98% 58,960 80.79% 14.55% 4.54% 0.66% 8.90%Lyman, SD 35.30% 3,758 100.00% 14.59% 41.92% 0.32% 18.79%
39 Buffalo, SD 35.72% 1,920 100.00% Buffalo, SD 35.72% 1,920 100.00% 7.17% 85.20% 0.70% 49.27%McCook, SD 48.41% 5,610 100.00% 18.97% 2.97% 1.52% 7.86%
40 Beaver, OK 47.84% 5,696 100.00% Beaver, OK 47.84% 5,696 100.00% 15.47% 23.47% 6.89% 12.42%McPherson, SD 96.87% 2,434 100.00% 29.81% 2.20% 5.52% 16.51%
41 Rush, KS 97.50% 3,277 100.00% Nuckolls, NE 97.08% 4,431 100.00% 26.09% 3.71% 0.42% 18.00%Marshall, SD 31.71% 4,700 100.00% 19.05% 15.42% 1.07% 17.12%
42 St. Clair, MO 32.24% 9,708 100.00% St. Clair, MO 32.24% 9,708 100.00% 23.41% 4.48% 0.32% 16.62%Meade, SD 81.37% 25,161 56.80% 11.94% 9.76% 0.70% 10.12%
43 Lauderdale, TN 80.62% 27,791 63.34% Anderson, KY 80.55% 21,725 49.30% 12.04% 5.17% 1.59% 11.42%Mellette, SD 1.14% 2,068 100.00% 13.53% 60.69% 1.04% 27.00%
44 Liberty, MT 0.74% 2,285 100.00% Liberty, MT 0.74% 2,285 100.00% 19.75% 1.97% 1.15% 19.46%Miner, SD 70.72% 2,363 100.00% 22.27% 2.89% 1.05% 8.80%
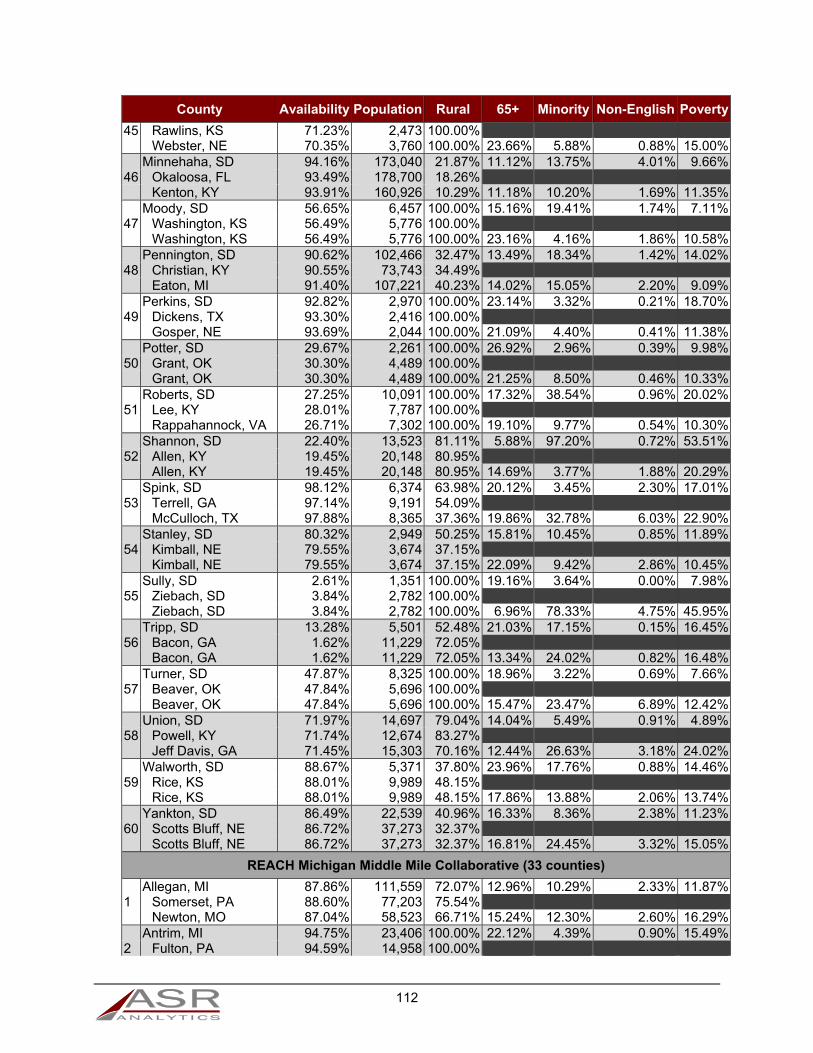
112
County Availability Population Rural 65+ Minority Non-English Poverty
45 Rawlins, KS 71.23% 2,473 100.00% Webster, NE 70.35% 3,760 100.00% 23.66% 5.88% 0.88% 15.00%Minnehaha, SD 94.16% 173,040 21.87% 11.12% 13.75% 4.01% 9.66%
46 Okaloosa, FL 93.49% 178,700 18.26% Kenton, KY 93.91% 160,926 10.29% 11.18% 10.20% 1.69% 11.35%Moody, SD 56.65% 6,457 100.00% 15.16% 19.41% 1.74% 7.11%
47 Washington, KS 56.49% 5,776 100.00% Washington, KS 56.49% 5,776 100.00% 23.16% 4.16% 1.86% 10.58%Pennington, SD 90.62% 102,466 32.47% 13.49% 18.34% 1.42% 14.02%
48 Christian, KY 90.55% 73,743 34.49% Eaton, MI 91.40% 107,221 40.23% 14.02% 15.05% 2.20% 9.09%Perkins, SD 92.82% 2,970 100.00% 23.14% 3.32% 0.21% 18.70%
49 Dickens, TX 93.30% 2,416 100.00% Gosper, NE 93.69% 2,044 100.00% 21.09% 4.40% 0.41% 11.38%Potter, SD 29.67% 2,261 100.00% 26.92% 2.96% 0.39% 9.98%
50 Grant, OK 30.30% 4,489 100.00% Grant, OK 30.30% 4,489 100.00% 21.25% 8.50% 0.46% 10.33%Roberts, SD 27.25% 10,091 100.00% 17.32% 38.54% 0.96% 20.02%
51 Lee, KY 28.01% 7,787 100.00% Rappahannock, VA 26.71% 7,302 100.00% 19.10% 9.77% 0.54% 10.30%Shannon, SD 22.40% 13,523 81.11% 5.88% 97.20% 0.72% 53.51%
52 Allen, KY 19.45% 20,148 80.95% Allen, KY 19.45% 20,148 80.95% 14.69% 3.77% 1.88% 20.29%Spink, SD 98.12% 6,374 63.98% 20.12% 3.45% 2.30% 17.01%
53 Terrell, GA 97.14% 9,191 54.09% McCulloch, TX 97.88% 8,365 37.36% 19.86% 32.78% 6.03% 22.90%Stanley, SD 80.32% 2,949 50.25% 15.81% 10.45% 0.85% 11.89%
54 Kimball, NE 79.55% 3,674 37.15% Kimball, NE 79.55% 3,674 37.15% 22.09% 9.42% 2.86% 10.45%Sully, SD 2.61% 1,351 100.00% 19.16% 3.64% 0.00% 7.98%
55 Ziebach, SD 3.84% 2,782 100.00% Ziebach, SD 3.84% 2,782 100.00% 6.96% 78.33% 4.75% 45.95%Tripp, SD 13.28% 5,501 52.48% 21.03% 17.15% 0.15% 16.45%
56 Bacon, GA 1.62% 11,229 72.05% Bacon, GA 1.62% 11,229 72.05% 13.34% 24.02% 0.82% 16.48%Turner, SD 47.87% 8,325 100.00% 18.96% 3.22% 0.69% 7.66%
57 Beaver, OK 47.84% 5,696 100.00% Beaver, OK 47.84% 5,696 100.00% 15.47% 23.47% 6.89% 12.42%Union, SD 71.97% 14,697 79.04% 14.04% 5.49% 0.91% 4.89%
58 Powell, KY 71.74% 12,674 83.27% Jeff Davis, GA 71.45% 15,303 70.16% 12.44% 26.63% 3.18% 24.02%Walworth, SD 88.67% 5,371 37.80% 23.96% 17.76% 0.88% 14.46%
59 Rice, KS 88.01% 9,989 48.15% Rice, KS 88.01% 9,989 48.15% 17.86% 13.88% 2.06% 13.74%Yankton, SD 86.49% 22,539 40.96% 16.33% 8.36% 2.38% 11.23%
60 Scotts Bluff, NE 86.72% 37,273 32.37% Scotts Bluff, NE 86.72% 37,273 32.37% 16.81% 24.45% 3.32% 15.05%
REACH Michigan Middle Mile Collaborative (33 counties)
Allegan, MI 87.86% 111,559 72.07% 12.96% 10.29% 2.33% 11.87%1 Somerset, PA 88.60% 77,203 75.54%
Newton, MO 87.04% 58,523 66.71% 15.24% 12.30% 2.60% 16.29%Antrim, MI 94.75% 23,406 100.00% 22.12% 4.39% 0.90% 15.49%
2 Fulton, PA 94.59% 14,958 100.00%

113
County Availability Population Rural 65+ Minority Non-English Poverty
Fulton, PA 94.59% 14,958 100.00% 17.14% 3.09% 0.35% 13.32%Arenac, MI 65.20% 15,619 100.00% 20.30% 4.20% 0.67% 16.50%
3 Wayne, MO 64.21% 13,421 100.00% Wayne, MO 64.21% 13,421 100.00% 21.41% 3.46% 0.22% 19.80%Bay, MI 96.44% 107,349 30.13% 16.24% 8.84% 0.94% 13.16%
4 Daviess, KY 96.76% 97,261 26.29% Daviess, KY 96.76% 97,261 26.29% 14.61% 9.98% 1.14% 14.58%Benzie, MI 87.63% 17,369 100.00% 20.64% 4.95% 0.83% 11.05%
5 Lancaster, VA 87.38% 11,352 100.00% Lancaster, VA 87.38% 11,352 100.00% 31.20% 30.43% 0.62% 10.07%Berrien, MI 95.34% 156,402 32.18% 16.29% 23.87% 2.74% 16.42%
6 Santa Rosa, FL 96.30% 153,280 30.38% Etowah, AL 95.28% 104,667 43.57% 15.81% 20.72% 1.69% 16.85%Branch, MI 85.51% 44,715 70.30% 14.72% 9.13% 3.55% 16.94%
7 Gloucester, VA 84.58% 37,274 74.54% Rhea, TN 85.87% 32,183 70.23% 15.71% 7.88% 1.99% 19.15%Cass, MI 81.76% 51,957 79.55% 15.98% 12.60% 1.36% 13.89%
8 Dickson, TN 82.57% 50,248 70.81% Dickson, TN 82.57% 50,248 70.81% 13.26% 9.64% 1.30% 13.96%Charlevoix, MI 94.97% 25,736 72.21% 18.62% 5.19% 1.12% 11.25%
9 Tillamook, OR 94.07% 25,251 75.51% Dickinson, KS 94.71% 20,009 66.73% 18.05% 7.30% 0.17% 11.06%Cheboygan, MI 70.46% 25,738 83.31% 21.49% 6.99% 0.31% 16.31%
10 Neshoba, MS 70.06% 29,958 78.24% Giles, TN 69.56% 29,476 75.66% 16.65% 14.46% 0.69% 17.13%Clare, MI 67.80% 30,497 77.55% 19.94% 4.25% 1.04% 21.92%
11 De Soto, LA 68.04% 26,797 78.36% Eastland, TX 67.49% 18,575 61.72% 19.85% 17.82% 3.81% 21.01%Crawford, MI 83.93% 13,895 73.73% 20.80% 3.47% 0.38% 17.98%
12 Lee, TX 83.85% 16,668 73.21% Allen, KS 83.32% 13,232 58.03% 18.29% 8.12% 0.12% 12.65%Emmet, MI 78.45% 32,632 73.75% 16.63% 7.84% 1.10% 9.03%
13 Alcorn, MS 79.28% 37,219 69.82% Warren, VA 77.47% 38,124 62.82% 12.72% 11.26% 2.38% 9.55%Gladwin, MI 52.93% 25,196 90.21% 22.78% 3.07% 0.72% 19.01%
14 Fairfield, SC 53.01% 23,726 77.32% Fairfield, SC 53.01% 23,726 77.32% 14.88% 62.02% 0.61% 22.70%Grand Traverse, MI 98.09% 87,445 54.73% 14.98% 6.67% 0.70% 9.69%
15 Pulaski, KY 97.46% 63,764 60.85% Genesee, NY 97.12% 59,748 61.37% 15.63% 8.47% 1.33% 11.73%Hillsdale, MI 74.35% 46,332 76.04% 15.73% 4.12% 0.74% 15.63%
16 Delaware, OK 74.93% 41,734 82.94% Morrison, MN 74.23% 33,242 73.12% 16.04% 3.08% 1.17% 13.05%Iosco, MI 78.98% 25,639 58.39% 26.09% 4.55% 1.29% 16.22%
17 Marlboro, SC 78.84% 29,133 58.11% Marinette, WI 78.87% 41,478 62.39% 19.77% 3.57% 1.03% 13.62%Isabella, MI 83.99% 70,266 55.17% 9.71% 12.51% 1.70% 29.71%
18 Darlington, SC 84.93% 68,351 57.71% Darlington, SC 84.93% 68,351 57.71% 14.26% 44.68% 1.56% 19.96%Kalkaska, MI 83.50% 17,051 84.78% 16.54% 4.06% 0.45% 16.87%
19 Johnson, TN 82.90% 18,248 85.57% Union, MS 83.52% 27,294 78.17% 14.46% 20.21% 2.62% 19.83%Lake, MI 36.64% 11,254 100.00% 23.71% 14.23% 0.58% 19.52%
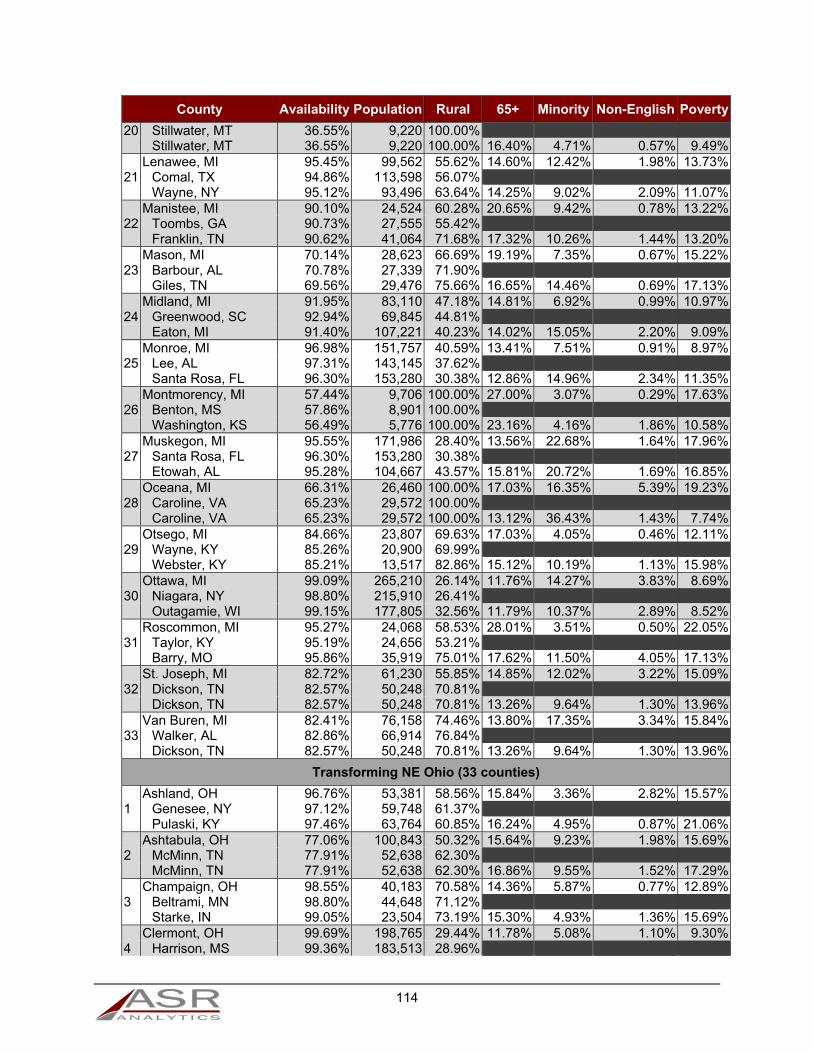
114
County Availability Population Rural 65+ Minority Non-English Poverty
20 Stillwater, MT 36.55% 9,220 100.00% Stillwater, MT 36.55% 9,220 100.00% 16.40% 4.71% 0.57% 9.49%Lenawee, MI 95.45% 99,562 55.62% 14.60% 12.42% 1.98% 13.73%
21 Comal, TX 94.86% 113,598 56.07% Wayne, NY 95.12% 93,496 63.64% 14.25% 9.02% 2.09% 11.07%Manistee, MI 90.10% 24,524 60.28% 20.65% 9.42% 0.78% 13.22%
22 Toombs, GA 90.73% 27,555 55.42% Franklin, TN 90.62% 41,064 71.68% 17.32% 10.26% 1.44% 13.20%Mason, MI 70.14% 28,623 66.69% 19.19% 7.35% 0.67% 15.22%
23 Barbour, AL 70.78% 27,339 71.90% Giles, TN 69.56% 29,476 75.66% 16.65% 14.46% 0.69% 17.13%Midland, MI 91.95% 83,110 47.18% 14.81% 6.92% 0.99% 10.97%
24 Greenwood, SC 92.94% 69,845 44.81% Eaton, MI 91.40% 107,221 40.23% 14.02% 15.05% 2.20% 9.09%Monroe, MI 96.98% 151,757 40.59% 13.41% 7.51% 0.91% 8.97%
25 Lee, AL 97.31% 143,145 37.62% Santa Rosa, FL 96.30% 153,280 30.38% 12.86% 14.96% 2.34% 11.35%Montmorency, MI 57.44% 9,706 100.00% 27.00% 3.07% 0.29% 17.63%
26 Benton, MS 57.86% 8,901 100.00% Washington, KS 56.49% 5,776 100.00% 23.16% 4.16% 1.86% 10.58%Muskegon, MI 95.55% 171,986 28.40% 13.56% 22.68% 1.64% 17.96%
27 Santa Rosa, FL 96.30% 153,280 30.38% Etowah, AL 95.28% 104,667 43.57% 15.81% 20.72% 1.69% 16.85%Oceana, MI 66.31% 26,460 100.00% 17.03% 16.35% 5.39% 19.23%
28 Caroline, VA 65.23% 29,572 100.00% Caroline, VA 65.23% 29,572 100.00% 13.12% 36.43% 1.43% 7.74%Otsego, MI 84.66% 23,807 69.63% 17.03% 4.05% 0.46% 12.11%
29 Wayne, KY 85.26% 20,900 69.99% Webster, KY 85.21% 13,517 82.86% 15.12% 10.19% 1.13% 15.98%Ottawa, MI 99.09% 265,210 26.14% 11.76% 14.27% 3.83% 8.69%
30 Niagara, NY 98.80% 215,910 26.41% Outagamie, WI 99.15% 177,805 32.56% 11.79% 10.37% 2.89% 8.52%Roscommon, MI 95.27% 24,068 58.53% 28.01% 3.51% 0.50% 22.05%
31 Taylor, KY 95.19% 24,656 53.21% Barry, MO 95.86% 35,919 75.01% 17.62% 11.50% 4.05% 17.13%St. Joseph, MI 82.72% 61,230 55.85% 14.85% 12.02% 3.22% 15.09%
32 Dickson, TN 82.57% 50,248 70.81% Dickson, TN 82.57% 50,248 70.81% 13.26% 9.64% 1.30% 13.96%Van Buren, MI 82.41% 76,158 74.46% 13.80% 17.35% 3.34% 15.84%
33 Walker, AL 82.86% 66,914 76.84% Dickson, TN 82.57% 50,248 70.81% 13.26% 9.64% 1.30% 13.96%
Transforming NE Ohio (33 counties)
Ashland, OH 96.76% 53,381 58.56% 15.84% 3.36% 2.82% 15.57%1 Genesee, NY 97.12% 59,748 61.37%
Pulaski, KY 97.46% 63,764 60.85% 16.24% 4.95% 0.87% 21.06%Ashtabula, OH 77.06% 100,843 50.32% 15.64% 9.23% 1.98% 15.69%
2 McMinn, TN 77.91% 52,638 62.30% McMinn, TN 77.91% 52,638 62.30% 16.86% 9.55% 1.52% 17.29%Champaign, OH 98.55% 40,183 70.58% 14.36% 5.87% 0.77% 12.89%
3 Beltrami, MN 98.80% 44,648 71.12% Starke, IN 99.05% 23,504 73.19% 15.30% 4.93% 1.36% 15.69%Clermont, OH 99.69% 198,765 29.44% 11.78% 5.08% 1.10% 9.30%
4 Harrison, MS 99.36% 183,513 28.96%

115
County Availability Population Rural 65+ Minority Non-English Poverty
Outagamie, WI 99.15% 177,805 32.56% 11.79% 10.37% 2.89% 8.52%Columbiana, OH 86.30% 107,031 44.59% 16.50% 5.11% 0.75% 15.98%
5 Newton, MO 87.04% 58,523 66.71% Newton, MO 87.04% 58,523 66.71% 15.24% 12.30% 2.60% 16.29%Coshocton, OH 72.04% 36,554 63.16% 16.24% 3.44% 1.34% 17.04%
6 Bell, KY 71.41% 28,572 64.92% Avoyelles, LA 71.98% 42,306 66.35% 14.44% 33.74% 2.09% 23.22%Crawford, OH 97.62% 43,276 36.82% 17.81% 3.56% 0.55% 13.01%
7 Jessamine, KY 98.35% 49,782 35.97% McCracken, KY 96.89% 65,901 30.20% 16.78% 16.08% 0.92% 15.29%Cuyahoga, OH 100.00% 1,265,168 1.52% 15.51% 38.60% 4.07% 16.39%
8 Nassau, NY 100.00% 1,338,208 0.20% Pinellas, FL 99.79% 908,900 0.49% 21.18% 23.10% 5.50% 12.08%Erie, OH 99.43% 76,779 27.87% 17.26% 15.07% 1.15% 12.50%
9 Floyd, IN 99.95% 75,236 26.18% Schenectady, NY 99.57% 155,858 8.47% 14.92% 22.83% 3.35% 11.13%Franklin, OH 99.99% 1,169,410 5.00% 9.95% 32.69% 4.82% 17.02%
10 Suffolk, NY 99.92% 1,491,785 3.13% Monmouth, NJ 99.54% 628,061 7.87% 13.75% 23.31% 7.10% 6.27%Geauga, OH 97.77% 93,285 66.16% 15.50% 3.88% 3.42% 7.62%
11 Adams, PA 97.94% 101,969 62.25% Adams, PA 97.94% 101,969 62.25% 15.73% 9.44% 2.94% 7.58%Holmes, OH 59.30% 42,261 93.91% 11.33% 1.79% 15.28% 13.29%
12 Pontotoc, MS 58.84% 30,086 85.76% Pontotoc, MS 58.84% 30,086 85.76% 12.79% 21.45% 3.97% 16.38%Huron, OH 96.12% 59,544 48.80% 13.56% 8.35% 2.87% 14.53%
13 Troup, GA 96.18% 67,901 49.05% Henderson, KY 96.99% 46,285 44.94% 14.16% 11.84% 0.90% 14.39%Lake, OH 99.90% 230,129 9.88% 16.07% 9.15% 2.71% 8.05%
14 Richmond, GA 99.76% 201,285 8.69% Schenectady, NY 99.57% 155,858 8.47% 14.92% 22.83% 3.35% 11.13%Lorain, OH 98.82% 303,128 22.29% 14.31% 19.85% 2.37% 13.11%
15 Prince William, VA 99.35% 407,391 19.37% Niagara, NY 98.80% 215,910 26.41% 15.89% 12.73% 1.46% 12.76%Lucas, OH 99.92% 438,808 7.69% 13.08% 29.02% 1.86% 18.01%
16 Seminole, FL 100.00% 424,240 8.22% Fayette, KY 99.36% 299,460 12.47% 10.53% 26.95% 5.20% 17.40%Mahoning, OH 99.31% 236,125 16.71% 17.88% 22.44% 2.27% 16.59%
17 Butte, CA 99.61% 221,156 19.98% Sullivan, TN 99.53% 157,365 28.02% 18.63% 5.61% 0.76% 15.86%Marion, OH 97.72% 66,445 32.51% 14.24% 10.18% 0.61% 17.35%
18 Catoosa, GA 98.26% 64,614 34.18% Daviess, KY 96.76% 97,261 26.29% 14.61% 9.98% 1.14% 14.58%Medina, OH 99.49% 173,351 37.73% 13.11% 4.95% 1.49% 6.28%
19 Hendricks, IN 99.26% 148,160 40.27% Saratoga, NY 99.55% 220,062 35.59% 13.66% 7.27% 1.51% 6.36%Montgomery, OH 99.96% 531,016 5.65% 15.14% 27.33% 1.78% 15.67%
20 Ocean, NJ 99.58% 576,732 4.74% Jefferson, LA 99.58% 430,477 1.17% 13.64% 43.99% 7.28% 14.23%Morrow, OH 89.76% 34,749 89.65% 13.44% 3.03% 1.09% 10.81%
21 Bedford, PA 88.87% 49,771 84.65% Oconto, WI 89.89% 37,667 81.98% 15.99% 3.96% 0.92% 11.78%Ottawa, OH 97.79% 41,215 55.76% 18.99% 6.39% 0.97% 9.02%

116
County Availability Population Rural 65+ Minority Non-English Poverty
22 Thomas, GA 98.57% 45,374 52.86% Martin, MN 98.28% 20,803 52.62% 20.71% 5.15% 1.31% 8.97%Portage, OH 99.08% 161,414 42.81% 12.90% 8.61% 1.00% 13.47%
23 Sussex, NJ 99.54% 149,452 44.00% Pickens, SC 98.26% 120,303 43.76% 13.41% 12.80% 2.28% 16.59%Richland, OH 94.33% 123,601 33.54% 16.28% 13.46% 1.16% 12.38%
24 Spotsylvania, VA 94.14% 122,743 36.95% Etowah, AL 95.28% 104,667 43.57% 15.81% 20.72% 1.69% 16.85%Sandusky, OH 97.29% 60,686 43.89% 15.28% 13.81% 1.70% 10.87%
25 Salem, NJ 96.99% 66,378 43.39% Salem, NJ 96.99% 66,378 43.39% 15.01% 23.22% 2.76% 10.13%Seneca, OH 97.44% 56,462 46.19% 14.85% 8.82% 0.95% 11.94%
26 Salem, NJ 96.99% 66,378 43.39% Henderson, KY 96.99% 46,285 44.94% 14.16% 11.84% 0.90% 14.39%Stark, OH 99.59% 374,961 14.76% 16.24% 12.27% 1.21% 12.73%
27 Gloucester, NJ 98.75% 291,283 16.60% Niagara, NY 98.80% 215,910 26.41% 15.89% 12.73% 1.46% 12.76%Summit, OH 99.98% 539,131 5.86% 14.58% 20.33% 1.93% 13.76%
28 Ocean, NJ 99.58% 576,732 4.74% Greenville, SC 99.53% 462,075 21.88% 12.76% 29.70% 5.59% 14.12%Trumbull, OH 97.47% 207,961 28.45% 17.41% 11.85% 1.30% 15.35%
29 Alachua, FL 96.49% 249,578 29.09% Blount, TN 96.61% 124,928 39.91% 16.07% 7.94% 1.94% 11.75%Tuscarawas, OH 87.91% 92,397 43.92% 16.39% 4.29% 2.01% 12.78%
30 Hanover, VA 87.63% 100,251 43.31% Roane, TN 87.90% 54,339 52.44% 18.56% 6.33% 0.54% 13.37%Washington, OH 78.23% 61,562 65.86% 17.47% 4.04% 0.59% 15.18%
31 McMinn, TN 77.91% 52,638 62.30% McMinn, TN 77.91% 52,638 62.30% 16.86% 9.55% 1.52% 17.29%Wayne, OH 90.60% 114,449 54.28% 14.57% 5.30% 4.45% 9.87%
32 Lee, MS 90.97% 83,536 52.45% Clinton, MI 90.81% 75,539 63.58% 12.87% 9.47% 1.68% 8.48%Wood, OH 98.61% 125,737 36.02% 12.26% 9.93% 1.42% 12.16%
33 Stafford, VA 98.50% 129,118 32.76% Outagamie, WI 99.15% 177,805 32.56% 11.79% 10.37% 2.89% 8.52%
West Virginia Statewide Broadband Infrastructure Project (55 counties)
Barbour, WV 48.29% 16,812 85.28% 16.64% 3.52% 0.27% 18.38%1 Fayette, AL 48.06% 17,168 79.95%
Fayette, AL 48.06% 17,168 79.95% 17.89% 13.97% 0.22% 17.93%Berkeley, WV 91.47% 106,934 53.62% 11.38% 14.20% 1.57% 10.13%
2 Lee, MS 90.97% 83,536 52.45% Clinton, MI 90.81% 75,539 63.58% 12.87% 9.47% 1.68% 8.48%Boone, WV 30.73% 24,620 87.65% 14.17% 1.66% 0.06% 19.27%
3 Goochland, VA 32.08% 22,377 94.55% Goochland, VA 32.08% 22,377 94.55% 14.91% 23.64% 1.97% 7.08%Braxton, WV 64.82% 14,648 100.00% 17.53% 2.18% 0.43% 21.04%
4 Pendleton, KY 63.92% 14,825 100.00% Wayne, MO 64.21% 13,421 100.00% 21.41% 3.46% 0.22% 19.80%Brooke, WV 68.07% 23,793 42.90% 19.12% 3.44% 0.53% 11.03%
5 Bourbon, KS 68.67% 15,128 52.33% Bourbon, KS 68.67% 15,128 52.33% 17.32% 8.04% 0.41% 15.51%Cabell, WV 84.46% 96,241 25.11% 15.95% 9.14% 0.63% 20.62%
6 Imperial, CA 84.08% 181,396 25.24%

117
County Availability Population Rural 65+ Minority Non-English Poverty
Darlington, SC 84.93% 68,351 57.71% 14.26% 44.68% 1.56% 19.96%Calhoun, WV 8.19% 7,742 100.00% 18.16% 2.12% 0.21% 20.55%
7 Chouteau, MT 7.90% 5,832 100.00% Chouteau, MT 7.90% 5,832 100.00% 17.34% 24.53% 0.15% 21.00%Clay, WV 9.48% 9,441 100.00% 15.68% 1.52% 0.00% 23.68%
8 Mahnomen, MN 8.77% 5,451 100.00% Mahnomen, MN 8.77% 5,451 100.00% 15.80% 50.16% 0.33% 23.60%Doddridge, WV 46.73% 8,221 100.00% 16.20% 3.37% 0.00% 25.10%
9 Ballard, KY 46.41% 8,284 100.00% Caldwell, LA 45.81% 10,119 100.00% 14.84% 20.60% 0.64% 21.91%Fayette, WV 30.78% 45,934 60.75% 16.95% 7.12% 0.43% 21.29%
10 Goochland, VA 32.08% 22,377 94.55% Goochland, VA 32.08% 22,377 94.55% 14.91% 23.64% 1.97% 7.08%Gilmer, WV 57.41% 8,765 100.00% 13.72% 20.03% 3.25% 30.25%
11 Benton, MS 57.86% 8,901 100.00% Todd, KY 57.60% 12,547 100.00% 14.22% 13.35% 4.47% 21.40%Grant, WV 39.70% 12,224 78.46% 18.34% 2.67% 0.24% 12.86%
12 Jones, TX 40.77% 20,285 85.39% Jones, TX 40.77% 20,285 85.39% 13.68% 37.88% 7.96% 12.33%Greenbrier, WV 18.81% 35,526 71.26% 19.27% 6.06% 0.40% 19.35%
13 Allen, KY 19.45% 20,148 80.95% Allen, KY 19.45% 20,148 80.95% 14.69% 3.77% 1.88% 20.29%Hampshire, WV 1.52% 24,451 100.00% 16.27% 3.41% 0.26% 16.38%
14 Trinity, CA 0.52% 14,032 100.00% Trinity, CA 0.52% 14,032 100.00% 20.09% 16.45% 1.47% 15.07%Hancock, WV 90.17% 30,366 33.64% 18.76% 5.00% 0.45% 14.78%
15 Crawford, KS 89.86% 39,171 36.60% Unicoi, TN 90.55% 18,337 47.45% 19.66% 5.27% 2.31% 18.78%Hardy, WV 0.00% 14,194 100.00% 16.61% 7.76% 3.72% 14.91%
16 Trinity, CA 0.52% 14,032 100.00% Trinity, CA 0.52% 14,032 100.00% 20.09% 16.45% 1.47% 15.07%Harrison, WV 81.41% 69,479 43.13% 16.51% 5.02% 0.53% 18.88%
17 Payne, OK 80.84% 77,604 36.10% Payne, OK 80.84% 77,604 36.10% 10.42% 20.29% 2.96% 23.42%Jackson, WV 68.36% 29,157 75.98% 17.68% 2.22% 0.23% 18.11%
18 Hardeman, TN 68.75% 27,183 75.97% Parke, IN 68.92% 17,224 83.96% 15.62% 4.58% 2.91% 15.76%Jefferson, WV 87.30% 54,385 72.19% 11.80% 14.83% 1.19% 8.39%
19 Newton, MO 87.04% 58,523 66.71% Shelby, KY 88.00% 43,178 64.62% 12.03% 19.00% 4.74% 11.41%Kanawha, WV 35.27% 192,254 24.86% 16.74% 11.44% 0.60% 13.73%
20 Horry, SC 50.09% 280,753 50.76% Horry, SC 50.09% 280,753 50.76% 17.11% 22.72% 4.36% 16.13%Lewis, WV 80.16% 16,580 71.36% 17.88% 2.49% 0.14% 19.62%
21 Westmoreland, VA 79.96% 17,714 72.61% Stoddard, MO 80.81% 29,839 70.14% 17.84% 3.46% 0.27% 18.00%Lincoln, WV 58.92% 21,694 100.00% 15.12% 1.32% 0.05% 26.64%
22 Vilas, WI 58.77% 21,222 100.00% Brown, IN 59.44% 15,017 100.00% 17.19% 3.16% 0.64% 10.81%Logan, WV 23.33% 36,687 79.95% 15.17% 3.97% 0.18% 21.81%
23 Allen, KY 19.45% 20,148 80.95% Allen, KY 19.45% 20,148 80.95% 14.69% 3.77% 1.88% 20.29%McDowell, WV 24.97% 21,888 89.19% 16.54% 11.20% 0.31% 32.62%
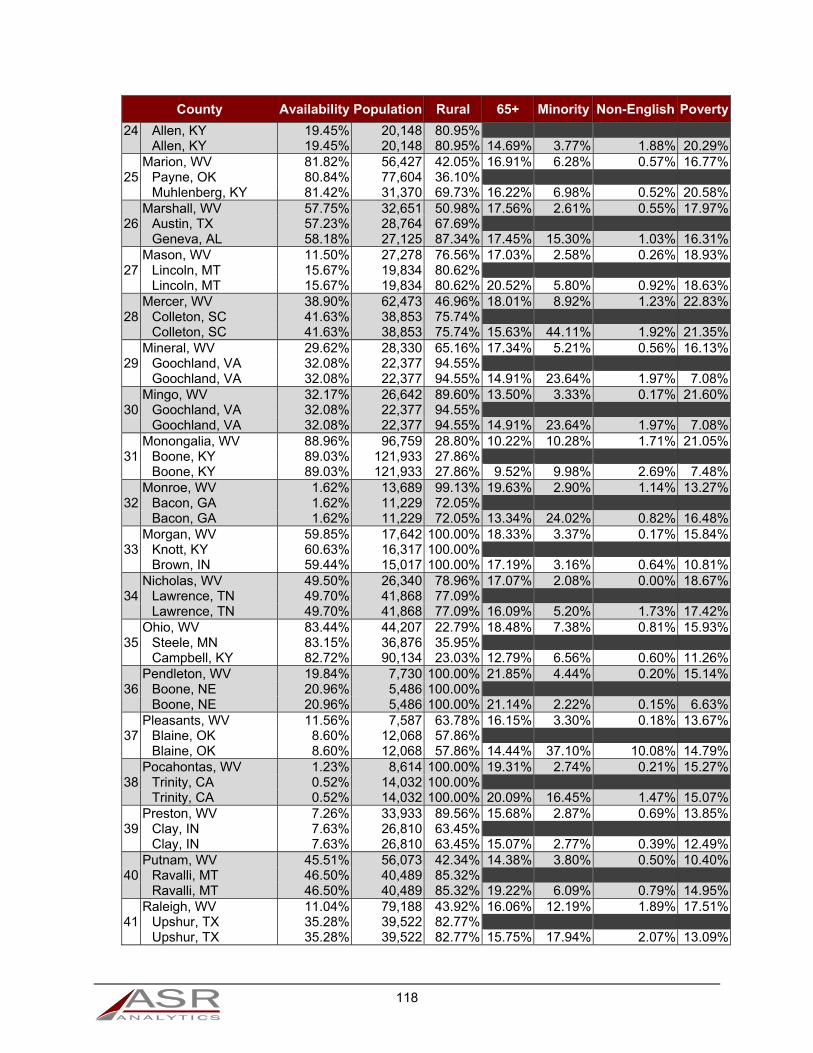
118
County Availability Population Rural 65+ Minority Non-English Poverty
24 Allen, KY 19.45% 20,148 80.95% Allen, KY 19.45% 20,148 80.95% 14.69% 3.77% 1.88% 20.29%Marion, WV 81.82% 56,427 42.05% 16.91% 6.28% 0.57% 16.77%
25 Payne, OK 80.84% 77,604 36.10% Muhlenberg, KY 81.42% 31,370 69.73% 16.22% 6.98% 0.52% 20.58%Marshall, WV 57.75% 32,651 50.98% 17.56% 2.61% 0.55% 17.97%
26 Austin, TX 57.23% 28,764 67.69% Geneva, AL 58.18% 27,125 87.34% 17.45% 15.30% 1.03% 16.31%Mason, WV 11.50% 27,278 76.56% 17.03% 2.58% 0.26% 18.93%
27 Lincoln, MT 15.67% 19,834 80.62% Lincoln, MT 15.67% 19,834 80.62% 20.52% 5.80% 0.92% 18.63%Mercer, WV 38.90% 62,473 46.96% 18.01% 8.92% 1.23% 22.83%
28 Colleton, SC 41.63% 38,853 75.74% Colleton, SC 41.63% 38,853 75.74% 15.63% 44.11% 1.92% 21.35%Mineral, WV 29.62% 28,330 65.16% 17.34% 5.21% 0.56% 16.13%
29 Goochland, VA 32.08% 22,377 94.55% Goochland, VA 32.08% 22,377 94.55% 14.91% 23.64% 1.97% 7.08%Mingo, WV 32.17% 26,642 89.60% 13.50% 3.33% 0.17% 21.60%
30 Goochland, VA 32.08% 22,377 94.55% Goochland, VA 32.08% 22,377 94.55% 14.91% 23.64% 1.97% 7.08%Monongalia, WV 88.96% 96,759 28.80% 10.22% 10.28% 1.71% 21.05%
31 Boone, KY 89.03% 121,933 27.86% Boone, KY 89.03% 121,933 27.86% 9.52% 9.98% 2.69% 7.48%Monroe, WV 1.62% 13,689 99.13% 19.63% 2.90% 1.14% 13.27%
32 Bacon, GA 1.62% 11,229 72.05% Bacon, GA 1.62% 11,229 72.05% 13.34% 24.02% 0.82% 16.48%Morgan, WV 59.85% 17,642 100.00% 18.33% 3.37% 0.17% 15.84%
33 Knott, KY 60.63% 16,317 100.00% Brown, IN 59.44% 15,017 100.00% 17.19% 3.16% 0.64% 10.81%Nicholas, WV 49.50% 26,340 78.96% 17.07% 2.08% 0.00% 18.67%
34 Lawrence, TN 49.70% 41,868 77.09% Lawrence, TN 49.70% 41,868 77.09% 16.09% 5.20% 1.73% 17.42%Ohio, WV 83.44% 44,207 22.79% 18.48% 7.38% 0.81% 15.93%
35 Steele, MN 83.15% 36,876 35.95% Campbell, KY 82.72% 90,134 23.03% 12.79% 6.56% 0.60% 11.26%Pendleton, WV 19.84% 7,730 100.00% 21.85% 4.44% 0.20% 15.14%
36 Boone, NE 20.96% 5,486 100.00% Boone, NE 20.96% 5,486 100.00% 21.14% 2.22% 0.15% 6.63%Pleasants, WV 11.56% 7,587 63.78% 16.15% 3.30% 0.18% 13.67%
37 Blaine, OK 8.60% 12,068 57.86% Blaine, OK 8.60% 12,068 57.86% 14.44% 37.10% 10.08% 14.79%Pocahontas, WV 1.23% 8,614 100.00% 19.31% 2.74% 0.21% 15.27%
38 Trinity, CA 0.52% 14,032 100.00% Trinity, CA 0.52% 14,032 100.00% 20.09% 16.45% 1.47% 15.07%Preston, WV 7.26% 33,933 89.56% 15.68% 2.87% 0.69% 13.85%
39 Clay, IN 7.63% 26,810 63.45% Clay, IN 7.63% 26,810 63.45% 15.07% 2.77% 0.39% 12.49%Putnam, WV 45.51% 56,073 42.34% 14.38% 3.80% 0.50% 10.40%
40 Ravalli, MT 46.50% 40,489 85.32% Ravalli, MT 46.50% 40,489 85.32% 19.22% 6.09% 0.79% 14.95%Raleigh, WV 11.04% 79,188 43.92% 16.06% 12.19% 1.89% 17.51%
41 Upshur, TX 35.28% 39,522 82.77% Upshur, TX 35.28% 39,522 82.77% 15.75% 17.94% 2.07% 13.09%
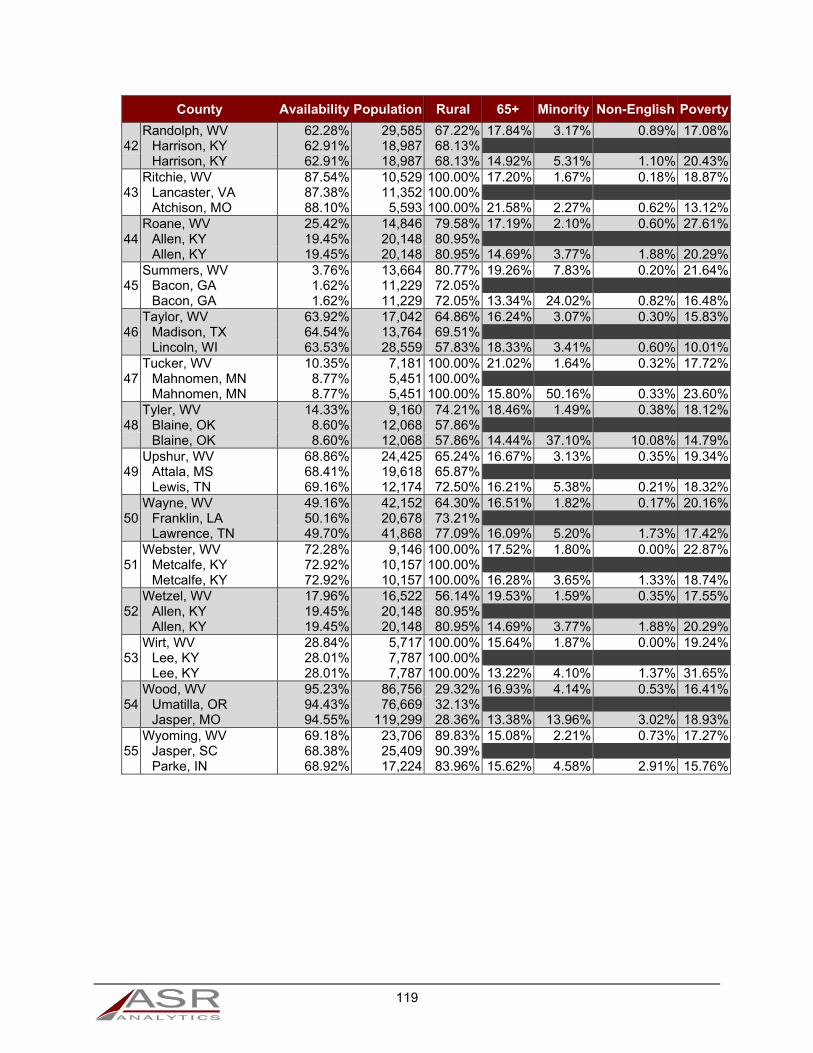
119
County Availability Population Rural 65+ Minority Non-English Poverty
Randolph, WV 62.28% 29,585 67.22% 17.84% 3.17% 0.89% 17.08%42 Harrison, KY 62.91% 18,987 68.13%
Harrison, KY 62.91% 18,987 68.13% 14.92% 5.31% 1.10% 20.43%Ritchie, WV 87.54% 10,529 100.00% 17.20% 1.67% 0.18% 18.87%
43 Lancaster, VA 87.38% 11,352 100.00% Atchison, MO 88.10% 5,593 100.00% 21.58% 2.27% 0.62% 13.12%Roane, WV 25.42% 14,846 79.58% 17.19% 2.10% 0.60% 27.61%
44 Allen, KY 19.45% 20,148 80.95% Allen, KY 19.45% 20,148 80.95% 14.69% 3.77% 1.88% 20.29%Summers, WV 3.76% 13,664 80.77% 19.26% 7.83% 0.20% 21.64%
45 Bacon, GA 1.62% 11,229 72.05% Bacon, GA 1.62% 11,229 72.05% 13.34% 24.02% 0.82% 16.48%Taylor, WV 63.92% 17,042 64.86% 16.24% 3.07% 0.30% 15.83%
46 Madison, TX 64.54% 13,764 69.51% Lincoln, WI 63.53% 28,559 57.83% 18.33% 3.41% 0.60% 10.01%Tucker, WV 10.35% 7,181 100.00% 21.02% 1.64% 0.32% 17.72%
47 Mahnomen, MN 8.77% 5,451 100.00% Mahnomen, MN 8.77% 5,451 100.00% 15.80% 50.16% 0.33% 23.60%Tyler, WV 14.33% 9,160 74.21% 18.46% 1.49% 0.38% 18.12%
48 Blaine, OK 8.60% 12,068 57.86% Blaine, OK 8.60% 12,068 57.86% 14.44% 37.10% 10.08% 14.79%Upshur, WV 68.86% 24,425 65.24% 16.67% 3.13% 0.35% 19.34%
49 Attala, MS 68.41% 19,618 65.87% Lewis, TN 69.16% 12,174 72.50% 16.21% 5.38% 0.21% 18.32%Wayne, WV 49.16% 42,152 64.30% 16.51% 1.82% 0.17% 20.16%
50 Franklin, LA 50.16% 20,678 73.21% Lawrence, TN 49.70% 41,868 77.09% 16.09% 5.20% 1.73% 17.42%Webster, WV 72.28% 9,146 100.00% 17.52% 1.80% 0.00% 22.87%
51 Metcalfe, KY 72.92% 10,157 100.00% Metcalfe, KY 72.92% 10,157 100.00% 16.28% 3.65% 1.33% 18.74%Wetzel, WV 17.96% 16,522 56.14% 19.53% 1.59% 0.35% 17.55%
52 Allen, KY 19.45% 20,148 80.95% Allen, KY 19.45% 20,148 80.95% 14.69% 3.77% 1.88% 20.29%Wirt, WV 28.84% 5,717 100.00% 15.64% 1.87% 0.00% 19.24%
53 Lee, KY 28.01% 7,787 100.00% Lee, KY 28.01% 7,787 100.00% 13.22% 4.10% 1.37% 31.65%Wood, WV 95.23% 86,756 29.32% 16.93% 4.14% 0.53% 16.41%
54 Umatilla, OR 94.43% 76,669 32.13% Jasper, MO 94.55% 119,299 28.36% 13.38% 13.96% 3.02% 18.93%Wyoming, WV 69.18% 23,706 89.83% 15.08% 2.21% 0.73% 17.27%
55 Jasper, SC 68.38% 25,409 90.39% Parke, IN 68.92% 17,224 83.96% 15.62% 4.58% 2.91% 15.76%
120
Notes
1 National Telecommunications and Information Administration, “BTOP Evaluation Study,” Program Reports, 2013, http://www2.ntia.doc.gov/BTOP-Reports#evaluation.
2 National Telecommunications and Information Administration, “Statement of Work for Broadband Technology Opportunities Program (BTOP) Evaluation Study,” 2010.
3 National Telecommunications and Information Administration, “Statement of Work for Broadband Technology Opportunities Program (BTOP) Evaluation Study,” July 26, 2010.
4 ASR Analytics, BTOP Evaluation Study Design, 2011.
5 National Telecommunications and Information Administration, “Statement of Work for Broadband Technology Opportunities Program (BTOP) Evaluation Study,” 2010.
6 National Telecommunications and Information Administration, “Statement of Work for Broadband Technology Opportunities Program (BTOP) Evaluation Study,” 2010.
7 National Telecommunications and Information Administration, “About,” BroadbandUSA: Connecting America’s Communities (Washington, DC, June 11, 2012), http://www2.ntia.doc.gov/about.
8 The total number of BTOP awards announced by September 30, 2010 was 233. As of June 30, 2013, this number was 224. The resource listed below provides more details about terminated and refused awards.
National Telecommunications and Information Administration, Broadband Technology Opportunities Program (BTOP) Quarterly Program Status Report (Washington, DC, March 2012), http://www.ntia.doc.gov/files/ntia/publications/12th-btop-quarterly-congressional-report-march-2012.pdf.
9 National Telecommunications and Information Administration, Broadband Technology Opportunities Program (BTOP) Quarterly Program Status Report.
10 National Telecommunications and Information Administration, “About.”
11 Rural Utilities Service and National Telecommunications and Information Administration, “Broadband Initiatives Program & Broadband Technology Opportunities Program,” Federal Register 74, no. 130 (July 09, 2009): 33104–34, http://www.gpo.gov/fdsys/pkg/FR-2009-07-09/pdf/FR-2009-07-09.pdf.
12 Robert K Yin, Case Study Research: Design and Methods, 4th ed. (Los Angeles, CA: SAGE Publications, 2009).
13 ASR Analytics, BTOP Evaluation Study Design, 2011.
14 ASR Analytics, Cambridge Housing Authority Public Computer Center Round 2, Broadband Technology Opportunities Program Evaluation Study (Order Number D10PD18645), July 10, 2013.
15 ASR Analytics, Delaware Department of State (Delaware Division of Libraries) Public Computer Center Round 2, Broadband Technology Opportunities Program Evaluation Study (Order Number D10PD18645), December 19, 2013.

121
16 ASR Analytics, Florida Agricultural and Mechanical University Public Computer Center Round 2, Broadband Technology Opportunities Program Evaluation Study (Order Number D10PD18645), September 13, 2013.
17 ASR Analytics, Las Vegas-Clark County Urban League Public Computer Center Round 2, Broadband Technology Opportunities Program Evaluation Study (Order Number D10PD18645), August 01, 2013.
18 ASR Analytics, Michigan State University Public Computer Center Round 2, Broadband Technology Opportunities Program Evaluation Study (Order Number D10PD18645), August 29, 2013.
19 ASR Analytics, South Carolina State Board for Technical and Comprehensive Education Public Computer Center Round 2, Broadband Technology Opportunities Program Evaluation Study (Order Number D10PD18645), September 11, 2013.
20 ASR Analytics, Technology for All, Inc. Public Computer Center Round 2, Broadband Technology Opportunities Program Evaluation Study (Order Number D10PD18645), September 16, 2013.
21 ASR Analytics, WorkForce West Virginia Public Computer Center Round 2, Broadband Technology Opportunities Program Evaluation Study (Order Number D10PD18645), September 23, 2013.
22 ASR Analytics, C.K. Blandin Foundation Sustainable Broadband Adoption Round 2, Broadband Technology Opportunities Program Evaluation Study (Order Number D10PD18645), August 15, 2013.
23 ASR Analytics, California Emerging Technology Fund Sustainable Broadband Adoption Round 2, Broadband Technology Opportunities Program Evaluation Study (Order Number D10PD18645), September 09, 2013.
24 ASR Analytics, Smart Chicago Sustainable Broadband Adoption Round 2, Broadband Technology Opportunities Program Evaluation Study (Order Number D10PD18645), July 10, 2013.
25 ASR Analytics, Connect Arkansas Sustainable Broadband Adoption Round 2, Broadband Technology Opportunities Program Evaluation Study (Order Number D10PD18645), September 10, 2013.
26 ASR Analytics, Foundation for California Community Colleges Sustainable Broadband Adoption Round 2, Broadband Technology Opportunities Program Evaluation Study (Order Number D10PD18645), September 12, 2013.
27 ASR Analytics, Future Generations Sustainable Broadband Adoption Round 2, Broadband Technology Opportunities Program Evaluation Study (Order Number D10PD18645), August 08, 2013.
28 ASR Analytics, Urban Affairs Coalition Sustainable Broadband Adoption Round 2, Broadband Technology Opportunities Program Evaluation Study (Order Number D10PD18645), September 10, 2013.
29 ASR Analytics, Clearwave Communications Comprehensive Community Infrastructure, Broadband Technology Opportunities Program Evaluation Study (Order Number D10PD18645), December 03, 2013.
30 ASR Analytics, Executive Office of the State of West Virginia Comprehensive Community Infrastructure, Broadband Technology Opportunities Program Evaluation Study (Order Number D10PD18645), March 25, 2014.

122
31 ASR Analytics, Lane Council of Governments Comprehensive Community Infrastructure, Broadband Technology Opportunities Program Evaluation Study (Order Number D10PD18645), April 04, 2014.
32 ASR Analytics, Massachusetts Technology Park Comprehensive Community Infrastructure, Broadband Technology Opportunities Program Evaluation Study (Order Number D10PD18645), March 19, 2014.
33 ASR Analytics, MCNC Comprehensive Community Infrastructure, Broadband Technology Opportunities Program Evaluation Study (Order Number D10PD18645), March 04, 2014.
34 ASR Analytics, Merit Network, Inc. Comprehensive Community Infrastructure, Broadband Technology Opportunities Program Evaluation Study (Order Number D10PD18645), March 04, 2014.
35 ASR Analytics, Mid-Atlantic Broadband Cooperative Comprehensive Community Infrastructure, Broadband Technology Opportunities Program Evaluation Study (Order Number D10PD18645), February 06, 2014.
36 ASR Analytics, OneCommunity Comprehensive Community Infrastructure, Broadband Technology Opportunities Program Evaluation Study (Order Number D10PD18645), April 21, 2014.
37 ASR Analytics, OSHEAN, Inc. Comprehensive Community Infrastructure, Broadband Technology Opportunities Program Evaluation Study (Order Number D10PD18645), March 10, 2014.
38 ASR Analytics, South Dakota Network Comprehensive Community Infrastructure, Broadband Technology Opportunities Program Evaluation Study (Order Number D10PD18645), February 05, 2014.
39 ASR Analytics, University of Arkansas System Comprehensive Community Infrastructure, Broadband Technology Opportunities Program Evaluation Study (Order Number D10PD18645), March 11, 2014.
40 ASR Analytics, Zayo Group Comprehensive Community Infrastructure, Broadband Technology Opportunities Program Evaluation Study (Order Number D10PD18645), February 06, 2014.
41 Ellen Taylor-Powell, Larry Jones, and Ellen Henert, Enhancing Program Performance with Logic Models (Madison, WI: University of Wisconsin-Extension, 2003), http://www.uwex.edu/ces/lmcourse/.
42 Taylor-Powell, Jones, and Henert, Enhancing Program Performance with Logic Models.
43 Taylor-Powell, Jones, and Henert, Enhancing Program Performance with Logic Models.
44 NTIA requested that the evaluation study team use this definition to match the analysis performed on the National Broadband Map (NBM), which is different from the definition used in the NOFA: advertised speeds of at least 768 kbps downstream and at least 200 kbps upstream.
National Telecommunications and Information Administration, “Broadband Technology Opportunities Program Notices” (Washington, DC, January 22, 2010), http://www.ntia.doc.gov/files/ntia/publications/fr_btopnofa_100115_0.pdf.
45 Rural Utilities Service and National Telecommunications and Information Administration, “Broadband Initiatives Program & Broadband Technology Opportunities Program.”
46 Klaus Krippendorff, Content Analysis: An Introduction, 2nd ed. (Thousand Oaks, CA: SAGE Publications, 2004).

123
47 Robert W. Crandall, William H. Lehr, and Robert E. Litan, The Effects of Broadband Deployment on Output and Employment: A Cross-Sectional Analysis of U.S. Data, Issues in Economic Policy (Washington, DC: The Brookings Institution, July 2007), http://www.brookings.edu/research/papers/2007/06/labor-crandall.
Jed Kolko, “Broadband and Local Growth” (2010), http://www.broadbandillinois.org/uploads/cms/documents/ssrn-id1680597.pdf.
Krishna Jayakar and Eun-A Park, “Broadband Availability and Employment: An Analysis of County-Level Data from the National Broadband Map,” Journal of Information Policy 3 (2013): 181–200, http://jip.vmhost.psu.edu/ojs/index.php/jip/article/viewArticle/121.
48 Roger Perez, “The Advantages of Internet Job Searching,” Livestrong, August 09, 2010, http://www.livestrong.com/article/199545-the-advantages-of-internet-job-searching/.
Robert D. Atkinson et al., The Internet Economy 25 Years After .com: Transforming Commerce & Life (Washington, DC: Information Technology and Innovation Foundation, March 15, 2010), http://www.itif.org/publications/internet-economy-25-years-after-com.
Atkinson et al., The Internet Economy 25 Years After .com: Transforming Commerce & Life.
Michael Ann Dean, “Using the Internet in the Job Search,” in Employment Options for Foreign Service Family Members (Washington, DC: Family Liaison Office, United States Department of State, 2001), 31–48, http://www.state.gov/m/dghr/flo/c21652.htm.
Ibrahim Kholilul Rohman and Erik Bohlin, “Impact of Broadband Speed on Household Income: Comparing OECD and BIC” (2013), http://www.econstor.eu/handle/10419/88531.
49 Dean, “Using the Internet in the Job Search.”
50 USDA Economic Research Service, “Rural Digital Economy: Online Activities,” Briefing Rooms, August 13, 2009, http://ers.usda.gov/Briefing/Telecom/demandservice.htm.
51 USDA Economic Research Service, “Rural Digital Economy: Online Activities.”
52 USDA Economic Research Service, “Rural Digital Economy: Online Activities.”
Business Link, “Benefits of Selling Online,” Create an Online Shop, August 28, 2012, http://www.businesslink.gov.uk/bdotg/action/detail?itemId=1073792461&type=RESOURCES.
James Prieger, “The Broadband Digital Divide and the Economic Benefits of Mobile Broadband for Rural Areas” (2012), http://papers.ssrn.com/sol3/papers.cfm?abstract_id=2258112.
53 Peter Stenberg et al., Broadband Internet’s Value for Rural America, ERR-78 (United States Department of Agriculture Economic Research Service, August 2009), http://www.ers.usda.gov/publications/err-economic-research-report/err78.aspx.
54 Stenberg et al., Broadband Internet’s Value for Rural America, August 2009.
Larry F. Darby, Joseph P. Jr. Fuhr, and Stephen B. Pociask, The Internet Ecosystem: Employment Impacts of National Broadband Policy (Washington, DC: The American Consumer Institute, January 28, 2010), http://www.theamericanconsumer.org/wp-content/uploads/2010/01/aci-jobs-study-final1.pdf.
55 Business Link, “Advantages and Disadvantages of Using Social Media,” Online Business Networking and Social Networking, August 28, 2012, http://www.businesslink.gov.uk/bdotg/action/detail?itemId=1081912566&type=RESOURCES.
56 Mark L. Burton and Michael J. Hicks, The Residential and Commercial Benefits of Rural Broadband: Evidence from Central Appalachia (Huntington, WV: Center for Business and
124
Economic Research Marshall University, July 2005), http://www.marshall.edu/cber/research/broadband/Final Rural Broadband July 2005.pdf.
LECG Ltd., Economic Impact of Broadband: An Empirical Study (London, UK, February 22, 2009), http://www.connectivityscorecard.org/images/uploads/media/Report_BroadbandStudy_LECG_March6.pdf.
Arthur Grimes, Cleo Ren, and Phillip Stevens, “The Need for Speed: Impacts of Internet Connectivity on Firm Productivity” (2009), http://papers.ssrn.com/sol3/papers.cfm?abstract_id=1604247.
57 ASR Analytics, Cambridge Housing Authority Public Computer Center Round 2, 13.
ASR Analytics, Urban Affairs Coalition Sustainable Broadband Adoption Round 2, 12.
ASR Analytics, Technology for All, Inc. Public Computer Center Round 2, 9.
ASR Analytics, South Carolina State Board for Technical and Comprehensive Education Public Computer Center Round 2, 10.
ASR Analytics, Las Vegas-Clark County Urban League Public Computer Center Round 2, 10.
ASR Analytics, Florida Agricultural and Mechanical University Public Computer Center Round 2, 8.
ASR Analytics, Foundation for California Community Colleges Sustainable Broadband Adoption Round 2, 13.
ASR Analytics, California Emerging Technology Fund Sustainable Broadband Adoption Round 2, 14.
ASR Analytics, Delaware Department of State (Delaware Division of Libraries) Public Computer Center Round 2, 8.
ASR Analytics, WorkForce West Virginia Public Computer Center Round 2, 11.
ASR Analytics, Future Generations Sustainable Broadband Adoption Round 2, 13.
ASR Analytics, Smart Chicago Sustainable Broadband Adoption Round 2, 18.
ASR Analytics, C.K. Blandin Foundation Sustainable Broadband Adoption Round 2, 8.
ASR Analytics, Michigan State University Public Computer Center Round 2, 11.
58 ASR Analytics, South Carolina State Board for Technical and Comprehensive Education Public Computer Center Round 2, 10.
ASR Analytics, Smart Chicago Sustainable Broadband Adoption Round 2, 16.
ASR Analytics, Urban Affairs Coalition Sustainable Broadband Adoption Round 2, 12.
ASR Analytics, Technology for All, Inc. Public Computer Center Round 2, 9.
ASR Analytics, Las Vegas-Clark County Urban League Public Computer Center Round 2, 10.
ASR Analytics, Future Generations Sustainable Broadband Adoption Round 2, 13.
ASR Analytics, Foundation for California Community Colleges Sustainable Broadband Adoption Round 2, 13.
ASR Analytics, C.K. Blandin Foundation Sustainable Broadband Adoption Round 2, 8.
ASR Analytics, California Emerging Technology Fund Sustainable Broadband Adoption Round 2, 14.
125
ASR Analytics, WorkForce West Virginia Public Computer Center Round 2, 15.
ASR Analytics, Delaware Department of State (Delaware Division of Libraries) Public Computer Center Round 2, 10.
ASR Analytics, Cambridge Housing Authority Public Computer Center Round 2, 13.
59 ASR Analytics, Delaware Department of State (Delaware Division of Libraries) Public Computer Center Round 2, 10.
ASR Analytics, South Carolina State Board for Technical and Comprehensive Education Public Computer Center Round 2, 10.
60 ASR Analytics, Florida Agricultural and Mechanical University Public Computer Center Round 2, 8.
ASR Analytics, Connect Arkansas Sustainable Broadband Adoption Round 2, 13.
ASR Analytics, Smart Chicago Sustainable Broadband Adoption Round 2, 16.
ASR Analytics, C.K. Blandin Foundation Sustainable Broadband Adoption Round 2, 8.
ASR Analytics, Urban Affairs Coalition Sustainable Broadband Adoption Round 2, 13.
ASR Analytics, Technology for All, Inc. Public Computer Center Round 2, 10.
ASR Analytics, Foundation for California Community Colleges Sustainable Broadband Adoption Round 2, 13.
61 ASR Analytics, WorkForce West Virginia Public Computer Center Round 2, 11.
ASR Analytics, Technology for All, Inc. Public Computer Center Round 2, 9.
ASR Analytics, South Carolina State Board for Technical and Comprehensive Education Public Computer Center Round 2, 10.
ASR Analytics, Michigan State University Public Computer Center Round 2, 12.
ASR Analytics, Las Vegas-Clark County Urban League Public Computer Center Round 2, 10.
ASR Analytics, Delaware Department of State (Delaware Division of Libraries) Public Computer Center Round 2, 8.
ASR Analytics, C.K. Blandin Foundation Sustainable Broadband Adoption Round 2, 8.
ASR Analytics, Urban Affairs Coalition Sustainable Broadband Adoption Round 2, 12.
ASR Analytics, Future Generations Sustainable Broadband Adoption Round 2, 13.
62 ASR Analytics, WorkForce West Virginia Public Computer Center Round 2, 11.
63 ASR Analytics, Michigan State University Public Computer Center Round 2, 12.
ASR Analytics, Florida Agricultural and Mechanical University Public Computer Center Round 2, 8.
ASR Analytics, C.K. Blandin Foundation Sustainable Broadband Adoption Round 2, 8.
ASR Analytics, Smart Chicago Sustainable Broadband Adoption Round 2, 16.
ASR Analytics, South Carolina State Board for Technical and Comprehensive Education Public Computer Center Round 2, 15.
ASR Analytics, Future Generations Sustainable Broadband Adoption Round 2, 13.
ASR Analytics, WorkForce West Virginia Public Computer Center Round 2, 9.
126
ASR Analytics, Connect Arkansas Sustainable Broadband Adoption Round 2, 13.
64 ASR Analytics, WorkForce West Virginia Public Computer Center Round 2, 11.
ASR Analytics, Technology for All, Inc. Public Computer Center Round 2, 9.
ASR Analytics, Las Vegas-Clark County Urban League Public Computer Center Round 2, 10.
ASR Analytics, Future Generations Sustainable Broadband Adoption Round 2, 13.
ASR Analytics, Delaware Department of State (Delaware Division of Libraries) Public Computer Center Round 2, 11.
ASR Analytics, California Emerging Technology Fund Sustainable Broadband Adoption Round 2, 15.
ASR Analytics, Florida Agricultural and Mechanical University Public Computer Center Round 2, 8.
65 ASR Analytics, Foundation for California Community Colleges Sustainable Broadband Adoption Round 2, 13.
ASR Analytics, Florida Agricultural and Mechanical University Public Computer Center Round 2, 8.
ASR Analytics, C.K. Blandin Foundation Sustainable Broadband Adoption Round 2, 9.
66 ASR Analytics, WorkForce West Virginia Public Computer Center Round 2, 11.
ASR Analytics, Technology for All, Inc. Public Computer Center Round 2, 9.
ASR Analytics, South Carolina State Board for Technical and Comprehensive Education Public Computer Center Round 2, 10.
ASR Analytics, Michigan State University Public Computer Center Round 2, 12.
ASR Analytics, Las Vegas-Clark County Urban League Public Computer Center Round 2, 10.
ASR Analytics, Delaware Department of State (Delaware Division of Libraries) Public Computer Center Round 2, 8.
ASR Analytics, C.K. Blandin Foundation Sustainable Broadband Adoption Round 2, 8.
ASR Analytics, Urban Affairs Coalition Sustainable Broadband Adoption Round 2, 12.
ASR Analytics, Future Generations Sustainable Broadband Adoption Round 2, 13.
ASR Analytics, Florida Agricultural and Mechanical University Public Computer Center Round 2, 8.
ASR Analytics, California Emerging Technology Fund Sustainable Broadband Adoption Round 2, 14.
ASR Analytics, Cambridge Housing Authority Public Computer Center Round 2, 13.
ASR Analytics, Foundation for California Community Colleges Sustainable Broadband Adoption Round 2, 13.
67ASR Analytics, Smart Chicago Sustainable Broadband Adoption Round 2, 16.
ASR Analytics, South Carolina State Board for Technical and Comprehensive Education Public Computer Center Round 2, 10.
ASR Analytics, Technology for All, Inc. Public Computer Center Round 2, 9.
ASR Analytics, Las Vegas-Clark County Urban League Public Computer Center Round 2, 10.
ASR Analytics, Future Generations Sustainable Broadband Adoption Round 2, 13.
127
ASR Analytics, Foundation for California Community Colleges Sustainable Broadband Adoption Round 2, 13.
ASR Analytics, C.K. Blandin Foundation Sustainable Broadband Adoption Round 2, 8.
ASR Analytics, California Emerging Technology Fund Sustainable Broadband Adoption Round 2, 14.
ASR Analytics, WorkForce West Virginia Public Computer Center Round 2, 12.
ASR Analytics, Delaware Department of State (Delaware Division of Libraries) Public Computer Center Round 2, 10.
ASR Analytics, Cambridge Housing Authority Public Computer Center Round 2, 13.
ASR Analytics, Urban Affairs Coalition Sustainable Broadband Adoption Round 2, 12.
68ASR Analytics, Urban Affairs Coalition Sustainable Broadband Adoption Round 2, 12.
ASR Analytics, Technology for All, Inc. Public Computer Center Round 2, 9.
ASR Analytics, South Carolina State Board for Technical and Comprehensive Education Public Computer Center Round 2, 10.
ASR Analytics, Las Vegas-Clark County Urban League Public Computer Center Round 2, 10.
ASR Analytics, Florida Agricultural and Mechanical University Public Computer Center Round 2, 8.
ASR Analytics, Delaware Department of State (Delaware Division of Libraries) Public Computer Center Round 2, 8.
ASR Analytics, WorkForce West Virginia Public Computer Center Round 2, 11.
ASR Analytics, Foundation for California Community Colleges Sustainable Broadband Adoption Round 2, 13.
ASR Analytics, Michigan State University Public Computer Center Round 2, 11.
ASR Analytics, Smart Chicago Sustainable Broadband Adoption Round 2, 18.
ASR Analytics, Connect Arkansas Sustainable Broadband Adoption Round 2, 13.
ASR Analytics, Future Generations Sustainable Broadband Adoption Round 2, 13.
ASR Analytics, C.K. Blandin Foundation Sustainable Broadband Adoption Round 2, 8.
69ASR Analytics, Florida Agricultural and Mechanical University Public Computer Center Round 2, 8.
ASR Analytics, Connect Arkansas Sustainable Broadband Adoption Round 2, 13.
ASR Analytics, Technology for All, Inc. Public Computer Center Round 2, 10.
ASR Analytics, Foundation for California Community Colleges Sustainable Broadband Adoption Round 2, 13.
ASR Analytics, Smart Chicago Sustainable Broadband Adoption Round 2, 16.
ASR Analytics, Future Generations Sustainable Broadband Adoption Round 2, 13.
ASR Analytics, WorkForce West Virginia Public Computer Center Round 2, 9.
ASR Analytics, Michigan State University Public Computer Center Round 2, 12.
ASR Analytics, C.K. Blandin Foundation Sustainable Broadband Adoption Round 2, 8.

128
70 ASR Analytics, C.K. Blandin Foundation Sustainable Broadband Adoption Round 2, 8.
ASR Analytics, Smart Chicago Sustainable Broadband Adoption Round 2, 16.
ASR Analytics, Urban Affairs Coalition Sustainable Broadband Adoption Round 2, 13.
ASR Analytics, Connect Arkansas Sustainable Broadband Adoption Round 2, 13.
ASR Analytics, Future Generations Sustainable Broadband Adoption Round 2, 13.
71 ASR Analytics, Foundation for California Community Colleges Sustainable Broadband Adoption Round 2, 13.
ASR Analytics, Florida Agricultural and Mechanical University Public Computer Center Round 2, 8.
ASR Analytics, Connect Arkansas Sustainable Broadband Adoption Round 2, 13.
ASR Analytics, South Carolina State Board for Technical and Comprehensive Education Public Computer Center Round 2, 15.
72 ASR Analytics, WorkForce West Virginia Public Computer Center Round 2, 11.
ASR Analytics, Urban Affairs Coalition Sustainable Broadband Adoption Round 2, 12.
ASR Analytics, Technology for All, Inc. Public Computer Center Round 2, 9.
ASR Analytics, South Carolina State Board for Technical and Comprehensive Education Public Computer Center Round 2, 10.
ASR Analytics, Michigan State University Public Computer Center Round 2, 12.
ASR Analytics, Las Vegas-Clark County Urban League Public Computer Center Round 2, 10.
ASR Analytics, Future Generations Sustainable Broadband Adoption Round 2, 13.
ASR Analytics, Foundation for California Community Colleges Sustainable Broadband Adoption Round 2, 13.
ASR Analytics, Florida Agricultural and Mechanical University Public Computer Center Round 2, 8.
ASR Analytics, Delaware Department of State (Delaware Division of Libraries) Public Computer Center Round 2, 7.
ASR Analytics, C.K. Blandin Foundation Sustainable Broadband Adoption Round 2, 8.
ASR Analytics, Smart Chicago Sustainable Broadband Adoption Round 2, 16.
ASR Analytics, California Emerging Technology Fund Sustainable Broadband Adoption Round 2, 14.
73 ASR Analytics, Delaware Department of State (Delaware Division of Libraries) Public Computer Center, Broadband Technology Opportunities Program Evaluation Study (Order Number D10PD18645), December 19, 2013, 7.
74 ASR Analytics, Technology For All, Inc. Public Computer Center, Broadband Technology Opportunities Program Evaluation Study (Order Number D10PD18645), September 16, 2013, 9.
75 ASR Analytics, California Emerging Technology Fund Sustainable Broadband Adoption, Broadband Technology Opportunities Program Evaluation Study (Order Number D10PD18645), September 09, 2013, 14.
76 ASR Analytics, Michigan State University Public Computer Center Round 2, 12.
ASR Analytics, Florida Agricultural and Mechanical University Public Computer Center Round 2, 8.
129
ASR Analytics, C.K. Blandin Foundation Sustainable Broadband Adoption Round 2, 8.
77 ASR Analytics, Foundation for California Community Colleges Sustainable Broadband Adoption Round 2, 13.
ASR Analytics, Florida Agricultural and Mechanical University Public Computer Center Round 2, 8.
ASR Analytics, Connect Arkansas Sustainable Broadband Adoption Round 2, 8.
78 ASR Analytics, Florida Agricultural and Mechanical University Public Computer Center, Broadband Technology Opportunities Program Evaluation Study (Order Number D10PD18645), September 13, 2013, 8.
79 ASR Analytics, Foundation for California Community Colleges Sustainable Broadband Adoption Round 2, 13.
ASR Analytics, C.K. Blandin Foundation Sustainable Broadband Adoption Round 2, 9.
ASR Analytics, Smart Chicago Sustainable Broadband Adoption Round 2, 16.
ASR Analytics, Florida Agricultural and Mechanical University Public Computer Center Round 2, 8.
80 ASR Analytics, C.K. Blandin Foundation Sustainable Broadband Adoption, Broadband Technology Opportunities Program Evaluation Study (Order Number D10PD18645), August 15, 2013, 9.
81 ASR Analytics, Smart Chicago Sustainable Broadband Adoption, Broadband Technology Opportunities Program Evaluation Study (Order Number D10PD18645), July 2013, 17.
82 Florida Department of Transportation and Construction Estimating Institute, “Construction Management Development Program and Bond Guarantee Program,” 2013, http://www.dot.state.fl.us/equalopportunityoffice/BDISS/CEI_CMDP_BGP_Brochure.pdf.
83 ASR Analytics, Florida Agricultural and Mechanical University Public Computer Center, 8.
84 ASR Analytics, Delaware Department of State (Delaware Division of Libraries) Public Computer Center Round 2, 12.
85 ASR Analytics, Technology for All, Inc. Public Computer Center Round 2, 9.
86 National Association of Colleges and Employers, “Class of 2013: Paid Interns Outpace Unpaid Peers in Job Offers, Salaries,” 2013.
National Association of Colleges and Employers, “Class of 2012: 60 Percent of Paid Interns Got Job Offers,” 2012.
87 ASR Analytics, Michigan State University Public Computer Center Round 2, 10.
88 ASR Analytics, Smart Chicago Sustainable Broadband Adoption Round 2, 6.
89 ASR Analytics, Delaware Department of State (Delaware Division of Libraries) Public Computer Center Round 2, 11.
90 ASR Analytics, Connect Arkansas Sustainable Broadband Adoption Round 2, 8.
91 ASR Analytics, Connect Arkansas Sustainable Broadband Adoption Round 2, 10.
92 ASR Analytics, C.K. Blandin Foundation Sustainable Broadband Adoption Round 2, 8.
93 ASR Analytics, Connect Arkansas Sustainable Broadband Adoption Round 2, 8.
94 In Interim Report 1, this activity was included in the Quality of Life/Civic Engagement focus area.
95 ASR Analytics, Smart Chicago Sustainable Broadband Adoption, 16.
130
96 ASR Analytics, Cambridge Housing Authority Public Computer Center Round 2, 13.
ASR Analytics, South Carolina State Board for Technical and Comprehensive Education Public Computer Center Round 2, 10.
97 ASR Analytics, Cambridge Housing Authority Public Computer Center Round 2, 13.
ASR Analytics, Urban Affairs Coalition Sustainable Broadband Adoption Round 2, 12.
ASR Analytics, Technology for All, Inc. Public Computer Center Round 2, 9.
ASR Analytics, South Carolina State Board for Technical and Comprehensive Education Public Computer Center Round 2, 10.
ASR Analytics, Michigan State University Public Computer Center Round 2, 11.
ASR Analytics, Las Vegas-Clark County Urban League Public Computer Center Round 2, 10.
ASR Analytics, Future Generations Sustainable Broadband Adoption Round 2, 13.
ASR Analytics, Foundation for California Community Colleges Sustainable Broadband Adoption Round 2, 13.
ASR Analytics, Florida Agricultural and Mechanical University Public Computer Center Round 2, 8.
ASR Analytics, Delaware Department of State (Delaware Division of Libraries) Public Computer Center Round 2, 7.
ASR Analytics, Connect Arkansas Sustainable Broadband Adoption Round 2, 8.
ASR Analytics, C.K. Blandin Foundation Sustainable Broadband Adoption Round 2, 8.
ASR Analytics, Smart Chicago Sustainable Broadband Adoption Round 2, 16.
ASR Analytics, California Emerging Technology Fund Sustainable Broadband Adoption Round 2, 14.
ASR Analytics, WorkForce West Virginia Public Computer Center Round 2, 11.
98 ASR Analytics, South Carolina State Board for Technical and Comprehensive Education Public Computer Center Round 2, 15.
99 Burton and Hicks, The Residential and Commercial Benefits of Rural Broadband: Evidence from Central Appalachia.
LECG Ltd., Economic Impact of Broadband: An Empirical Study, February 22, 2009.
100 ASR Analytics, Connect Arkansas Sustainable Broadband Adoption Round 2, 8.
101 Business Link, “Advantages and Disadvantages of Using Social Media.”
102 ASR Analytics, WorkForce West Virginia Public Computer Center, Broadband Technology Opportunities Program Evaluation Study (Order Number D10PD18645), September 23, 2013, 20.
103 Crandall, Lehr, and Litan, The Effects of Broadband Deployment on Output and Employment: A Cross-Sectional Analysis of U.S. Data.
104 ASR Analytics, University of Arkansas System Comprehensive Community Infrastructure, 20.
ASR Analytics, Clearwave Communications Comprehensive Community Infrastructure, 19.
ASR Analytics, Mid-Atlantic Broadband Cooperative Comprehensive Community Infrastructure, 16.
ASR Analytics, Merit Network, Inc. Comprehensive Community Infrastructure, 16.

131
ASR Analytics, OneCommunity Comprehensive Community Infrastructure, 17.
ASR Analytics, OSHEAN, Inc. Comprehensive Community Infrastructure, 18.
ASR Analytics, South Dakota Network Comprehensive Community Infrastructure, 20.
ASR Analytics, Executive Office of the State of West Virginia Comprehensive Community Infrastructure, 22.
ASR Analytics, Zayo Group Comprehensive Community Infrastructure, 18.
105 ASR Analytics, Lane Council of Governments Comprehensive Community Infrastructure, 18.
ASR Analytics, Mid-Atlantic Broadband Cooperative Comprehensive Community Infrastructure, 15.
ASR Analytics, Merit Network, Inc. Comprehensive Community Infrastructure, 16.
ASR Analytics, Massachusetts Technology Park Comprehensive Community Infrastructure, 21.
ASR Analytics, OSHEAN, Inc. Comprehensive Community Infrastructure, 19.
ASR Analytics, OneCommunity Comprehensive Community Infrastructure, 17.
ASR Analytics, South Dakota Network Comprehensive Community Infrastructure, 21.
ASR Analytics, Executive Office of the State of West Virginia Comprehensive Community Infrastructure, 22.
ASR Analytics, Zayo Group Comprehensive Community Infrastructure, 19.
106 ASR Analytics, OneCommunity Comprehensive Community Infrastructure, 17.
ASR Analytics, Zayo Group Comprehensive Community Infrastructure, 19.
ASR Analytics, OSHEAN, Inc. Comprehensive Community Infrastructure, 19.
ASR Analytics, South Dakota Network Comprehensive Community Infrastructure, 21.
ASR Analytics, Merit Network, Inc. Comprehensive Community Infrastructure, 16.
ASR Analytics, Clearwave Communications Comprehensive Community Infrastructure, 19.
107 ASR Analytics, University of Arkansas System Comprehensive Community Infrastructure, 20.
ASR Analytics, Clearwave Communications Comprehensive Community Infrastructure, 19.
ASR Analytics, Lane Council of Governments Comprehensive Community Infrastructure, 18.
ASR Analytics, Mid-Atlantic Broadband Cooperative Comprehensive Community Infrastructure, 16.
ASR Analytics, Merit Network, Inc. Comprehensive Community Infrastructure, 16.
ASR Analytics, OneCommunity Comprehensive Community Infrastructure, 17.
ASR Analytics, OSHEAN, Inc. Comprehensive Community Infrastructure, 18.
ASR Analytics, South Dakota Network Comprehensive Community Infrastructure, 20.
ASR Analytics, Zayo Group Comprehensive Community Infrastructure, 19.
108 ASR Analytics, Zayo Group Comprehensive Community Infrastructure, 19.
ASR Analytics, OSHEAN, Inc. Comprehensive Community Infrastructure, 18.
109 ASR Analytics, Merit Network, Inc. Comprehensive Community Infrastructure, 16.
ASR Analytics, Zayo Group Comprehensive Community Infrastructure, 19.

132
110 ASR Analytics, Lane Council of Governments Comprehensive Community Infrastructure, 18.
ASR Analytics, Mid-Atlantic Broadband Cooperative Comprehensive Community Infrastructure, 15.
ASR Analytics, Merit Network, Inc. Comprehensive Community Infrastructure, 16.
ASR Analytics, South Dakota Network Comprehensive Community Infrastructure, 21.
ASR Analytics, Zayo Group Comprehensive Community Infrastructure, 19.
111 ASR Analytics, University of Arkansas System Comprehensive Community Infrastructure, 20.
ASR Analytics, Clearwave Communications Comprehensive Community Infrastructure, 19.
ASR Analytics, Merit Network, Inc. Comprehensive Community Infrastructure, 17.
ASR Analytics, South Dakota Network Comprehensive Community Infrastructure, 20.
ASR Analytics, Executive Office of the State of West Virginia Comprehensive Community Infrastructure, 22.
ASR Analytics, Zayo Group Comprehensive Community Infrastructure, 19.
112 ASR Analytics, South Dakota Network Comprehensive Community Infrastructure, 20.
ASR Analytics, Clearwave Communications Comprehensive Community Infrastructure, 19.
ASR Analytics, University of Arkansas System Comprehensive Community Infrastructure, 20.
ASR Analytics, Zayo Group Comprehensive Community Infrastructure, 18.
113 ASR Analytics, Merit Network, Inc. Comprehensive Community Infrastructure, 16.
ASR Analytics, OSHEAN, Inc. Comprehensive Community Infrastructure, 18.
ASR Analytics, South Dakota Network Comprehensive Community Infrastructure, 21.
ASR Analytics, Executive Office of the State of West Virginia Comprehensive Community Infrastructure, 22.
ASR Analytics, Zayo Group Comprehensive Community Infrastructure, 19.
114 ASR Analytics, Zayo Group Comprehensive Community Infrastructure, 20.
115 ASR Analytics, Mid-Atlantic Broadband Cooperative Comprehensive Community Infrastructure, 15.
ASR Analytics, Massachusetts Technology Park Comprehensive Community Infrastructure, 21.
ASR Analytics, OneCommunity Comprehensive Community Infrastructure, 17.
ASR Analytics, OSHEAN, Inc. Comprehensive Community Infrastructure, 19.
ASR Analytics, Zayo Group Comprehensive Community Infrastructure, 21.
116 ASR Analytics, Clearwave Communications Comprehensive Community Infrastructure, 19.
ASR Analytics, Merit Network, Inc. Comprehensive Community Infrastructure, 16.
ASR Analytics, OneCommunity Comprehensive Community Infrastructure, 18.
ASR Analytics, OSHEAN, Inc. Comprehensive Community Infrastructure, 18.
ASR Analytics, South Dakota Network Comprehensive Community Infrastructure, 21.
ASR Analytics, Zayo Group Comprehensive Community Infrastructure, 19.

133
117 ASR Analytics, University of Arkansas System Comprehensive Community Infrastructure, 20.
ASR Analytics, Clearwave Communications Comprehensive Community Infrastructure, 19.
ASR Analytics, Merit Network, Inc. Comprehensive Community Infrastructure, 17.
ASR Analytics, Zayo Group Comprehensive Community Infrastructure, 18.
118 ASR Analytics, OSHEAN, Inc. Comprehensive Community Infrastructure, 19.
119 ASR Analytics, Zayo Group Comprehensive Community Infrastructure, 19.
120 ASR Analytics, Merit Network, Inc. Comprehensive Community Infrastructure, 17.
121 ASR Analytics, Mid-Atlantic Broadband Cooperative Comprehensive Community Infrastructure, 15.
ASR Analytics, Merit Network, Inc. Comprehensive Community Infrastructure, 16.
ASR Analytics, South Dakota Network Comprehensive Community Infrastructure, 21.
ASR Analytics, Zayo Group Comprehensive Community Infrastructure, 19.
122 ASR Analytics, Merit Network, Inc. Comprehensive Community Infrastructure, 17.
123 ASR Analytics, Mid-Atlantic Broadband Cooperative Comprehensive Community Infrastructure, 16.
124 ASR Analytics, Mid-Atlantic Broadband Cooperative Comprehensive Community Infrastructure, 15.
125 ASR Analytics, Mid-Atlantic Broadband Cooperative Comprehensive Community Infrastructure, 16.
126 ASR Analytics, Merit Network, Inc. Comprehensive Community Infrastructure, 16.
127 ASR Analytics, Lane Council of Governments Comprehensive Community Infrastructure, 18.
ASR Analytics, Mid-Atlantic Broadband Cooperative Comprehensive Community Infrastructure, 15.
ASR Analytics, Massachusetts Technology Park Comprehensive Community Infrastructure, 21.
ASR Analytics, OSHEAN, Inc. Comprehensive Community Infrastructure, 19.
ASR Analytics, South Dakota Network Comprehensive Community Infrastructure, 22.
ASR Analytics, Zayo Group Comprehensive Community Infrastructure, 19.
128 ASR Analytics, Mid-Atlantic Broadband Cooperative Comprehensive Community Infrastructure, 16.
129 ASR Analytics, Mid-Atlantic Broadband Cooperative Comprehensive Community Infrastructure, 15.
130 ASR Analytics, Clearwave Communications Comprehensive Community Infrastructure, 19.
ASR Analytics, South Dakota Network Comprehensive Community Infrastructure, 20.
ASR Analytics, Zayo Group Comprehensive Community Infrastructure, 19.
131 ASR Analytics, South Dakota Network Comprehensive Community Infrastructure, 20.
132 ASR Analytics, Clearwave Communications Comprehensive Community Infrastructure, 19.
133 ASR Analytics, University of Arkansas System Comprehensive Community Infrastructure, 20.
134
ASR Analytics, Lane Council of Governments Comprehensive Community Infrastructure, 18.
ASR Analytics, Mid-Atlantic Broadband Cooperative Comprehensive Community Infrastructure, 16.
ASR Analytics, Merit Network, Inc. Comprehensive Community Infrastructure, 16.
ASR Analytics, OneCommunity Comprehensive Community Infrastructure, 17.
ASR Analytics, OSHEAN, Inc. Comprehensive Community Infrastructure, 18.
ASR Analytics, South Dakota Network Comprehensive Community Infrastructure, 20.
ASR Analytics, Executive Office of the State of West Virginia Comprehensive Community Infrastructure, 22.
ASR Analytics, Zayo Group Comprehensive Community Infrastructure, 18.
134 ASR Analytics, Executive Office of the State of West Virginia Comprehensive Community Infrastructure, 22.
135 Perez, “The Advantages of Internet Job Searching.”
Atkinson et al., The Internet Economy 25 Years After .com: Transforming Commerce & Life.
Dean, “Using the Internet in the Job Search.”
Burton and Hicks, The Residential and Commercial Benefits of Rural Broadband: Evidence from Central Appalachia.
LECG Ltd., Economic Impact of Broadband: An Empirical Study, February 22, 2009.
136 ASR Analytics, OSHEAN, Inc. Comprehensive Community Infrastructure, 19.
137 Burton and Hicks, The Residential and Commercial Benefits of Rural Broadband: Evidence from Central Appalachia.
LECG Ltd., Economic Impact of Broadband: An Empirical Study, February 22, 2009.
138 ASR Analytics, Zayo Group Comprehensive Community Infrastructure, 21.
139 USDA Economic Research Service, “Rural Digital Economy: Online Activities.”
Business Link, “Benefits of Selling Online.”
140 Jörg Wittwer and Martin Senkbeil, “Is Students’ Computer Use at Home Related to Their Mathematical Performance at School?,” Computers & Education 50, no. 4 (May 2008): 1558–1571, doi:10.1016/j.compedu.2007.03.001.
Barbara Means et al., Evaluation of Evidence-Based Practices in Online Learning: A Meta-Analysis and Review of Online Learning Studies (Washington, DC: United States Department of Education, September 2010), http://www2.ed.gov/rschstat/eval/tech/evidence-based-practices/finalreport.pdf.
Means et al., Evaluation of Evidence-Based Practices in Online Learning: A Meta-Analysis and Review of Online Learning Studies.
Juan Moran et al., “Technology and Reading Performance in the Middle-School Grades: A Meta-Analysis with Recommendations for Policy and Practice,” Journal of Literacy Research 40, no. 1 (January 2008): 6–58, doi:10.1080/10862960802070483.
Shapley Research Associates and Texas Center for Educational Research, Final Outcomes for a Four–Year Study (2004–05 to 2007–08), Evaluation of the Texas Technology Immersion Pilot (eTxTIP), January 2009, http://www.tcer.org/research/etxtip/.

135
Gil Valentine et al., Children and Young People’s Home Use of ICT for Educational Purposes: The Impact on Attainment at Key Stages 1-4, RB672, August 2005, https://www.education.gov.uk/publications/RSG/Parentscarersandfamilies/Page12/RB672.
Mizuko Ito et al., Living and Learning with New Media Summary of Findings from the Digital Youth Project, The John D. and Catherine T. MacArthur Foundation Reports on Digital Media and Learning, November 2008, http://digitalyouth.ischool.berkeley.edu/files/report/digitalyouth-WhitePaper.pdf.
Don Passey et al., The Motivational Effect of ICT on Pupils, RR523 (Lancaster, UK: University of Lancaster, April 2004), https://www.education.gov.uk/publications/RSG/ICTSCH/Page1/RR523.
British Educational Communications and Technology Agency, Extending Opportunity: Final Report of the Minister’s Taskforce on Home Access to Technology (Coventry, UK, July 2008), http://dera.ioe.ac.uk/8285/.
Nancy Protheroe, “Technology and Student Achievement,” Principal, November 2005, http://www.naesp.org/resources/2/Principal/2005/N-Dp46.pdf.
Marie Hyland et al., “Are Classroom Internet Use and Academic Performance Higher after Government Broadband Subsidies to Primary Schools?” (2013), http://www.econstor.eu/handle/10419/88520.
141 Carly Shuler, Pockets of Potential: Using Mobile Technologies to Promote Children’s Learning (New York, NY: The Joan Gans Cooney Center, January 2009), http://joanganzcooneycenter.org/Reports-23.html.
Communications Workers of America, Speed Matters: Benefits of Broadband (Washington, DC, 2009), http://files.cwa-union.org/speedmatters/CWA_Benefits_of_Broadbandr_2010.pdf.
Scott M. Andes and Daniel D. Castro, Opportunities and Innovations in the Mobile Broadband Economy, The Information Technology and Innovation Foundation, 2010, http://www.itif.org/files/2010-mobile-innovations.pdf.
Linda Ann Hulbert and Regina C. McBride, “Utilizing Videoconferencing in Library Education: A Team Teaching Approach,” Journal of Education for Library and Information Science 45, no. 1 (2004): 25–35, http://www.jstor.org/stable/40323919.
Communications Workers of America, Speed Matters: Benefits of Broadband.
142 Robert LaRose et al., Closing the Rural Broadband Gap, Final Technical Report, November 30, 2008, https://www.msu.edu/~larose/ruralbb/.
Julius Genachowski, “Broadband: Our Enduring Engine for Prosperity and Opportunity,” in NARUC Conference (Washington, DC, 2010), http://hraunfoss.fcc.gov/edocs_public/attachmatch/DOC-296262A1.pdf.
Robert W. Fairlie and Samantha H. Grunberg, “Access to Technology and the Transfer Function of Community Colleges: Evidence from a Field Experiment” (2013), https://www.econstor.eu/dspace/bitstream/10419/90111/1/dp7764.pdf.
143 Ruth H. Moody and Michael P. Bobic, “Teaching the Net Generation without Leaving the Rest of Us Behind: How Technology in the Classroom Influences Student Composition,” Politics & Policy 39, no. 2 (April 29, 2011): 169–194, doi:10.1111/j.1747-1346.2011.00287.x.
Joanne Gikas and Michael M. Grant, “Mobile Computing Devices in Higher Education: Student Perspectives on Learning with Cellphones, Smartphones & Social Media,” Internet and Higher Education 19 (2013): 18–26,
136
https://www.academia.edu/3748701/Mobile_Computing_Devices_in_Higher_Education_Student_Perspectives_on_Learning_with_Cellphones_Smartphones_and_Social_Media.
Darrell M. West, “Mobile Learning: Transforming Education, Engaging Students, and Improving Outcomes” (2013), http://safeschooluniversity.com/pdfs/issues/eLearning/motivation/MobileLearning.pdf.
Bradford S. Bell and Jessica E. Federman, “E-Learning in Postsecondary Education,” The Future of Children 23, no. 1 (2013), http://futureofchildren.org/futureofchildren/publications/docs/23_01_08.pdf.
144 Susan Stansberry and Stephoni Case, “26B-E: Teaching with Facebook as a Learning Management System (TED),” in Annual Meeting of the AECT Convention (Hyatt Regency Orange County, Anaheim, CA: Association for Educational Communications and Technology, 2010), http://convention2.allacademic.com/one/aect/aect10/index.php?click_key=1&cmd=Multi+Search+Search+Load+Publication&publication_id=430535&PHPSESSID=jgkifdqag6qgtckajo0k657jc7.
145 Jessica Briskin et al., “26B-K: Smart Apps: An Analysis of Educational Applications Available on Smartphones and the Implications for Mobile Learning (D&D),” in Annual Meeting of the AECT Convention (Hyatt Regency Orange County, Anaheim, CA: Association for Educational Communications and Technology, 2010), http://convention2.allacademic.com/one/aect/aect10/index.php?click_key=1&cmd=Multi+Search+Search+Load+Publication&publication_id=430393&PHPSESSID=jgkifdqag6qgtckajo0k657jc7.
146 Robert W. Fairlie, “The Effects of Home Computers on School Enrollment,” Working Paper, September 2003, http://cjtc.ucsc.edu/docs/r_schoolcomp6.pdf.
147 The South Dakota Bureau of Information and Telecommunications, “Broadband Benefits for Rural Areas,” February 01, 2011, http://broadband.sd.gov/Benefits-Rural.aspx.
148 Robert D. Atkinson and Daniel D. Castro, Digital Quality of Life: Understanding the Personal and Social Benefits of the Information Technology Revolution (Washington, DC: Information Technology and Information Foundation, October 01, 2008), http://www.itif.org/files/DQOL.pdf.
IBM Learning Solutions, IBM’s Learning Transformation Story (Somers, NY: IBM Global Services, June 2004), http://www-304.ibm.com/easyaccess/fileserve?contentid=183268.
149 ASR Analytics, Cambridge Housing Authority Public Computer Center Round 2, 2; ASR Analytics, Smart Chicago Sustainable Broadband Adoption Round 2, 13; ASR Analytics, C.K. Blandin Foundation Sustainable Broadband Adoption Round 2, 12; ASR Analytics, Florida Agricultural and Mechanical University Public Computer Center Round 2, 10; ASR Analytics, Future Generations Sustainable Broadband Adoption Round 2, 16; ASR Analytics, Las Vegas-Clark County Urban League Public Computer Center Round 2, 10; ASR Analytics, Michigan State University Public Computer Center Round 2, 6; ASR Analytics, South Carolina State Board for Technical and Comprehensive Education Public Computer Center Round 2, 8; ASR Analytics, Technology for All, Inc. Public Computer Center Round 2, 10; ASR Analytics, WorkForce West Virginia Public Computer Center Round 2, 15.
150 ASR Analytics, Florida Agricultural and Mechanical University Public Computer Center Round 2, 16; ASR Analytics, C.K. Blandin Foundation Sustainable Broadband Adoption Round 2, 12.
151 ASR Analytics, Las Vegas-Clark County Urban League Public Computer Center Round 2, 10; ASR Analytics, Cambridge Housing Authority Public Computer Center Round 2, 11; ASR Analytics, Smart Chicago Sustainable Broadband Adoption Round 2, 21.
152 ASR Analytics, California Emerging Technology Fund Sustainable Broadband Adoption Round 2, 13; ASR Analytics, Cambridge Housing Authority Public Computer Center Round 2, 9; ASR Analytics, Smart Chicago Sustainable Broadband Adoption Round 2, 22; ASR Analytics, C.K.

137
Blandin Foundation Sustainable Broadband Adoption Round 2, 12; ASR Analytics, Connect Arkansas Sustainable Broadband Adoption Round 2, 11; ASR Analytics, Delaware Department of State (Delaware Division of Libraries) Public Computer Center Round 2, 14; ASR Analytics, Florida Agricultural and Mechanical University Public Computer Center Round 2, 10; ASR Analytics, Foundation for California Community Colleges Sustainable Broadband Adoption Round 2, 12; ASR Analytics, Future Generations Sustainable Broadband Adoption Round 2, 18; ASR Analytics, Las Vegas-Clark County Urban League Public Computer Center Round 2, 11; ASR Analytics, Michigan State University Public Computer Center Round 2, 10; ASR Analytics, South Carolina State Board for Technical and Comprehensive Education Public Computer Center Round 2, 6; ASR Analytics, Technology for All, Inc. Public Computer Center Round 2, 11; ASR Analytics, Urban Affairs Coalition Sustainable Broadband Adoption Round 2, 14.
153 ASR Analytics, Cambridge Housing Authority Public Computer Center Round 2, 10; ASR Analytics, C.K. Blandin Foundation Sustainable Broadband Adoption Round 2, 11; ASR Analytics, Foundation for California Community Colleges Sustainable Broadband Adoption Round 2, 20; ASR Analytics, South Carolina State Board for Technical and Comprehensive Education Public Computer Center Round 2, 14; ASR Analytics, Technology for All, Inc. Public Computer Center Round 2, 12.
154 ASR Analytics, California Emerging Technology Fund Sustainable Broadband Adoption Round 2, 16; ASR Analytics, C.K. Blandin Foundation Sustainable Broadband Adoption Round 2, 11; ASR Analytics, Foundation for California Community Colleges Sustainable Broadband Adoption Round 2, 12; ASR Analytics, Urban Affairs Coalition Sustainable Broadband Adoption Round 2, 24.
155 ASR Analytics, California Emerging Technology Fund Sustainable Broadband Adoption Round 2, 13; ASR Analytics, C.K. Blandin Foundation Sustainable Broadband Adoption Round 2, 11; ASR Analytics, Foundation for California Community Colleges Sustainable Broadband Adoption Round 2, 6; ASR Analytics, South Carolina State Board for Technical and Comprehensive Education Public Computer Center Round 2, 8.
156 ASR Analytics, Cambridge Housing Authority Public Computer Center Round 2, 11; ASR Analytics, Smart Chicago Sustainable Broadband Adoption Round 2, 22; ASR Analytics, C.K. Blandin Foundation Sustainable Broadband Adoption Round 2, 12; ASR Analytics, Connect Arkansas Sustainable Broadband Adoption Round 2, 12; ASR Analytics, Delaware Department of State (Delaware Division of Libraries) Public Computer Center Round 2, 14; ASR Analytics, Florida Agricultural and Mechanical University Public Computer Center Round 2, 10; ASR Analytics, Foundation for California Community Colleges Sustainable Broadband Adoption Round 2, 12; ASR Analytics, Las Vegas-Clark County Urban League Public Computer Center Round 2, 11; ASR Analytics, Michigan State University Public Computer Center Round 2, 10; ASR Analytics, South Carolina State Board for Technical and Comprehensive Education Public Computer Center Round 2, 8; ASR Analytics, Technology for All, Inc. Public Computer Center Round 2, 11; ASR Analytics, Urban Affairs Coalition Sustainable Broadband Adoption Round 2, 14.
157 ASR Analytics, C.K. Blandin Foundation Sustainable Broadband Adoption Round 2, 11; ASR Analytics, Foundation for California Community Colleges Sustainable Broadband Adoption Round 2, 12; ASR Analytics, Cambridge Housing Authority Public Computer Center Round 2, 11; ASR Analytics, Michigan State University Public Computer Center Round 2, 6; ASR Analytics, South Carolina State Board for Technical and Comprehensive Education Public Computer Center Round 2, 8; ASR Analytics, Technology for All, Inc. Public Computer Center Round 2, 11.
158 ASR Analytics, Cambridge Housing Authority Public Computer Center Round 2, 12; ASR Analytics, Smart Chicago Sustainable Broadband Adoption Round 2, 22; ASR Analytics, C.K. Blandin Foundation Sustainable Broadband Adoption Round 2, 11; ASR Analytics, Florida Agricultural and Mechanical University Public Computer Center Round 2, 10; ASR Analytics, Future Generations Sustainable Broadband Adoption Round 2, 16; ASR Analytics, Las Vegas-

138
Clark County Urban League Public Computer Center Round 2, 10; ASR Analytics, Michigan State University Public Computer Center Round 2, 10; ASR Analytics, South Carolina State Board for Technical and Comprehensive Education Public Computer Center Round 2, 8; ASR Analytics, Technology for All, Inc. Public Computer Center Round 2, 10; ASR Analytics, WorkForce West Virginia Public Computer Center Round 2, 15; ASR Analytics, California Emerging Technology Fund Sustainable Broadband Adoption Round 2, 16; ASR Analytics, Foundation for California Community Colleges Sustainable Broadband Adoption Round 2, 12; ASR Analytics, Urban Affairs Coalition Sustainable Broadband Adoption Round 2, 24.
159 ASR Analytics, C.K. Blandin Foundation Sustainable Broadband Adoption Round 2, 11.
160 ASR Analytics, C.K. Blandin Foundation Sustainable Broadband Adoption Round 2, 11; ASR Analytics, Foundation for California Community Colleges Sustainable Broadband Adoption Round 2, 6; ASR Analytics, South Carolina State Board for Technical and Comprehensive Education Public Computer Center Round 2, 8; ASR Analytics, Technology for All, Inc. Public Computer Center Round 2, 11; ASR Analytics, Urban Affairs Coalition Sustainable Broadband Adoption Round 2, 14; ASR Analytics, Smart Chicago Sustainable Broadband Adoption Round 2, 21; ASR Analytics, Las Vegas-Clark County Urban League Public Computer Center Round 2, 10.
161 ASR Analytics, C.K. Blandin Foundation Sustainable Broadband Adoption Round 2, 11; ASR Analytics, California Emerging Technology Fund Sustainable Broadband Adoption Round 2, 13; ASR Analytics, Cambridge Housing Authority Public Computer Center Round 2, 10; ASR Analytics, Smart Chicago Sustainable Broadband Adoption Round 2, 13; ASR Analytics, Foundation for California Community Colleges Sustainable Broadband Adoption Round 2, 25; ASR Analytics, South Carolina State Board for Technical and Comprehensive Education Public Computer Center Round 2, 14; ASR Analytics, Technology for All, Inc. Public Computer Center Round 2, 12.
162 ASR Analytics, Cambridge Housing Authority Public Computer Center Round 2, 10; ASR Analytics, C.K. Blandin Foundation Sustainable Broadband Adoption Round 2, 11.
163 ASR Analytics, C.K. Blandin Foundation Sustainable Broadband Adoption Round 2, 11; ASR Analytics, Foundation for California Community Colleges Sustainable Broadband Adoption Round 2, 25; ASR Analytics, South Carolina State Board for Technical and Comprehensive Education Public Computer Center Round 2, 14; ASR Analytics, California Emerging Technology Fund Sustainable Broadband Adoption Round 2, 13; ASR Analytics, Cambridge Housing Authority Public Computer Center Round 2, 11; ASR Analytics, Smart Chicago Sustainable Broadband Adoption Round 2, 13.
164 ASR Analytics, Florida Agricultural and Mechanical University Public Computer Center Round 2, 10; ASR Analytics, Foundation for California Community Colleges Sustainable Broadband Adoption Round 2, 12; ASR Analytics, Las Vegas-Clark County Urban League Public Computer Center Round 2, 11; ASR Analytics, Michigan State University Public Computer Center Round 2, 6; ASR Analytics, Technology for All, Inc. Public Computer Center Round 2, 11.
165 ASR Analytics, Future Generations Sustainable Broadband Adoption Round 2, 18; ASR Analytics, Technology for All, Inc. Public Computer Center Round 2, 10; ASR Analytics, Las Vegas-Clark County Urban League Public Computer Center Round 2, 10; ASR Analytics, Smart Chicago Sustainable Broadband Adoption Round 2, 21; ASR Analytics, Foundation for California Community Colleges Sustainable Broadband Adoption Round 2, 6; ASR Analytics, South Carolina State Board for Technical and Comprehensive Education Public Computer Center Round 2, 8; ASR Analytics, Urban Affairs Coalition Sustainable Broadband Adoption Round 2, 14; ASR Analytics, C.K. Blandin Foundation Sustainable Broadband Adoption Round 2, 12.
166 ASR Analytics, Urban Affairs Coalition Sustainable Broadband Adoption Round 2, 24; ASR Analytics, C.K. Blandin Foundation Sustainable Broadband Adoption Round 2, 12; ASR Analytics, Florida Agricultural and Mechanical University Public Computer Center Round 2, 10.
139
167 ASR Analytics, C.K. Blandin Foundation Sustainable Broadband Adoption Round 2, 11; ASR Analytics, Delaware Department of State (Delaware Division of Libraries) Public Computer Center Round 2, 14.
168 ASR Analytics, Foundation for California Community Colleges Sustainable Broadband Adoption Round 2, 12.
169 ASR Analytics, Delaware Department of State (Delaware Division of Libraries) Public Computer Center Round 2, 14.
170 ASR Analytics, Urban Affairs Coalition Sustainable Broadband Adoption Round 2, 14.
171 ASR Analytics, Florida Agricultural and Mechanical University Public Computer Center Round 2, 25.
172 ASR Analytics, California Emerging Technology Fund Sustainable Broadband Adoption Round 2, 16; ASR Analytics, Technology for All, Inc. Public Computer Center Round 2, 12; ASR Analytics, C.K. Blandin Foundation Sustainable Broadband Adoption Round 2, 11; ASR Analytics, Cambridge Housing Authority Public Computer Center Round 2, 12; ASR Analytics, Florida Agricultural and Mechanical University Public Computer Center Round 2, 13.
173 ASR Analytics, California Emerging Technology Fund Sustainable Broadband Adoption Round 2, 16; ASR Analytics, Technology for All, Inc. Public Computer Center Round 2, 12; ASR Analytics, C.K. Blandin Foundation Sustainable Broadband Adoption Round 2, 11.
174 ASR Analytics, Cambridge Housing Authority Public Computer Center Round 2, 12; ASR Analytics, Florida Agricultural and Mechanical University Public Computer Center Round 2, 13; ASR Analytics, Technology for All, Inc. Public Computer Center Round 2, 12.
175 ASR Analytics, C.K. Blandin Foundation Sustainable Broadband Adoption Round 2, 12.
176 ASR Analytics, Technology for All, Inc. Public Computer Center Round 2, 12.
177 Representatives of Midlands Technical College, “Interview with Authors,” January 31, 2013.
178 ASR Analytics, Delaware Department of State (Delaware Division of Libraries) Public Computer Center Round 2, 16.
179 ASR Analytics, Delaware Department of State (Delaware Division of Libraries) Public Computer Center Round 2, 14.
180 ASR Analytics, Cambridge Housing Authority Public Computer Center Round 2, 9.
181 ASR Analytics, Cambridge Housing Authority Public Computer Center Round 2, 14.
182 National Telecommunications and Information Administration, “Post-Award Monitoring (PAM) Database,” 2013.
183 ASR Analytics, Foundation for California Community Colleges Sustainable Broadband Adoption Round 2, 12.
184 ASR Analytics, Foundation for California Community Colleges Sustainable Broadband Adoption Round 2, 10.
185 ASR Analytics, Foundation for California Community Colleges Sustainable Broadband Adoption Round 2, 12.
186 ASR Analytics, Foundation for California Community Colleges Sustainable Broadband Adoption Round 2, 1.

140
187 ASR Analytics, Foundation for California Community Colleges Sustainable Broadband Adoption Round 2, 10.
188 ASR Analytics, Foundation for California Community Colleges Sustainable Broadband Adoption Round 2, 12.
189 ASR Analytics, Foundation for California Community Colleges Sustainable Broadband Adoption Round 2, 3.
190 ASR Analytics, South Carolina State Board for Technical and Comprehensive Education Public Computer Center Round 2, 14.
191 ASR Analytics, Technology for All, Inc. Public Computer Center Round 2, 11.
192 ASR Analytics, Cambridge Housing Authority Public Computer Center Round 2, 2.
193 ASR Analytics, California Emerging Technology Fund Sustainable Broadband Adoption Round 2, 13; ASR Analytics, Cambridge Housing Authority Public Computer Center Round 2, 9; ASR Analytics, Smart Chicago Sustainable Broadband Adoption Round 2, 13; ASR Analytics, C.K. Blandin Foundation Sustainable Broadband Adoption Round 2, 11; ASR Analytics, Connect Arkansas Sustainable Broadband Adoption Round 2, 11; ASR Analytics, Florida Agricultural and Mechanical University Public Computer Center Round 2, 10; ASR Analytics, Foundation for California Community Colleges Sustainable Broadband Adoption Round 2, 12; ASR Analytics, Future Generations Sustainable Broadband Adoption Round 2, 16; ASR Analytics, Las Vegas-Clark County Urban League Public Computer Center Round 2, 10; ASR Analytics, Michigan State University Public Computer Center Round 2, 9; ASR Analytics, South Carolina State Board for Technical and Comprehensive Education Public Computer Center Round 2, 8; ASR Analytics, Technology for All, Inc. Public Computer Center Round 2, 11; ASR Analytics, Urban Affairs Coalition Sustainable Broadband Adoption Round 2, 14; ASR Analytics, WorkForce West Virginia Public Computer Center Round 2, 15.
194 ASR Analytics, Las Vegas-Clark County Urban League Public Computer Center Round 2, 10.
195 ASR Analytics, Florida Agricultural and Mechanical University Public Computer Center Round 2, 10; ASR Analytics, Urban Affairs Coalition Sustainable Broadband Adoption Round 2, 24.
196 ASR Analytics, California Emerging Technology Fund Sustainable Broadband Adoption Round 2, 16.
197 ASR Analytics, South Carolina State Board for Technical and Comprehensive Education Public Computer Center Round 2, 8.
198 ASR Analytics, OSHEAN, Inc. Comprehensive Community Infrastructure, 13; ASR Analytics, Zayo Group Comprehensive Community Infrastructure, 14; ASR Analytics, University of Arkansas System Comprehensive Community Infrastructure, 26; ASR Analytics, Clearwave Communications Comprehensive Community Infrastructure, 13; ASR Analytics, Lane Council of Governments Comprehensive Community Infrastructure, 13; ASR Analytics, Mid-Atlantic Broadband Cooperative Comprehensive Community Infrastructure, 13; ASR Analytics, MCNC Comprehensive Community Infrastructure, 13; ASR Analytics, Merit Network, Inc. Comprehensive Community Infrastructure, 13; ASR Analytics, Massachusetts Technology Park Comprehensive Community Infrastructure, 17; ASR Analytics, OneCommunity Comprehensive Community Infrastructure, 13; ASR Analytics, South Dakota Network Comprehensive Community Infrastructure, 12; ASR Analytics, Executive Office of the State of West Virginia Comprehensive Community Infrastructure, 15.
199 ASR Analytics, University of Arkansas System Comprehensive Community Infrastructure, 26; ASR Analytics, Clearwave Communications Comprehensive Community Infrastructure, 13; ASR Analytics, Lane Council of Governments Comprehensive Community Infrastructure, 13; ASR Analytics, Mid-Atlantic Broadband Cooperative Comprehensive Community Infrastructure, 13; ASR

141
Analytics, MCNC Comprehensive Community Infrastructure, 13; ASR Analytics, Merit Network, Inc. Comprehensive Community Infrastructure, 14; ASR Analytics, Massachusetts Technology Park Comprehensive Community Infrastructure, 18; ASR Analytics, OneCommunity Comprehensive Community Infrastructure, 12; ASR Analytics, OSHEAN, Inc. Comprehensive Community Infrastructure, 13; ASR Analytics, South Dakota Network Comprehensive Community Infrastructure, 12; ASR Analytics, Executive Office of the State of West Virginia Comprehensive Community Infrastructure, 14; ASR Analytics, Zayo Group Comprehensive Community Infrastructure, 13.
200 ASR Analytics, OneCommunity Comprehensive Community Infrastructure, 13; ASR Analytics, OSHEAN, Inc. Comprehensive Community Infrastructure, 13; ASR Analytics, Zayo Group Comprehensive Community Infrastructure, 15; ASR Analytics, University of Arkansas System Comprehensive Community Infrastructure, 27; ASR Analytics, Clearwave Communications Comprehensive Community Infrastructure, 14; ASR Analytics, Lane Council of Governments Comprehensive Community Infrastructure, 14; ASR Analytics, Mid-Atlantic Broadband Cooperative Comprehensive Community Infrastructure, 13; ASR Analytics, MCNC Comprehensive Community Infrastructure, 14; ASR Analytics, Merit Network, Inc. Comprehensive Community Infrastructure, 15; ASR Analytics, Massachusetts Technology Park Comprehensive Community Infrastructure, 18; ASR Analytics, South Dakota Network Comprehensive Community Infrastructure, 13; ASR Analytics, Executive Office of the State of West Virginia Comprehensive Community Infrastructure, 14.
201 ASR Analytics, University of Arkansas System Comprehensive Community Infrastructure, 26; ASR Analytics, Clearwave Communications Comprehensive Community Infrastructure, 13; ASR Analytics, Lane Council of Governments Comprehensive Community Infrastructure, 13; ASR Analytics, Mid-Atlantic Broadband Cooperative Comprehensive Community Infrastructure, 13; ASR Analytics, MCNC Comprehensive Community Infrastructure, 13; ASR Analytics, Merit Network, Inc. Comprehensive Community Infrastructure, 13; ASR Analytics, Massachusetts Technology Park Comprehensive Community Infrastructure, 18; ASR Analytics, OSHEAN, Inc. Comprehensive Community Infrastructure, 13; ASR Analytics, South Dakota Network Comprehensive Community Infrastructure, 12; ASR Analytics, Executive Office of the State of West Virginia Comprehensive Community Infrastructure, 14; ASR Analytics, Zayo Group Comprehensive Community Infrastructure, 13; ASR Analytics, OneCommunity Comprehensive Community Infrastructure, 13.
202 ASR Analytics, University of Arkansas System Comprehensive Community Infrastructure, 28; ASR Analytics, Clearwave Communications Comprehensive Community Infrastructure, 13; ASR Analytics, Lane Council of Governments Comprehensive Community Infrastructure, 13; ASR Analytics, Mid-Atlantic Broadband Cooperative Comprehensive Community Infrastructure, 13; ASR Analytics, MCNC Comprehensive Community Infrastructure, 14; ASR Analytics, Merit Network, Inc. Comprehensive Community Infrastructure, 14; ASR Analytics, Massachusetts Technology Park Comprehensive Community Infrastructure, 18; ASR Analytics, OneCommunity Comprehensive Community Infrastructure, 13; ASR Analytics, OSHEAN, Inc. Comprehensive Community Infrastructure, 14; ASR Analytics, South Dakota Network Comprehensive Community Infrastructure, 15; ASR Analytics, Executive Office of the State of West Virginia Comprehensive Community Infrastructure, 15; ASR Analytics, Zayo Group Comprehensive Community Infrastructure, 15.
203 ASR Analytics, University of Arkansas System Comprehensive Community Infrastructure, 26; ASR Analytics, Clearwave Communications Comprehensive Community Infrastructure, 13; ASR Analytics, MCNC Comprehensive Community Infrastructure, 14; ASR Analytics, Merit Network, Inc. Comprehensive Community Infrastructure, 13; ASR Analytics, Massachusetts Technology Park Comprehensive Community Infrastructure, 17; ASR Analytics, OneCommunity Comprehensive Community Infrastructure, 12; ASR Analytics, OSHEAN, Inc. Comprehensive Community Infrastructure, 14; ASR Analytics, Executive Office of the State of West Virginia Comprehensive

142
Community Infrastructure, 14; ASR Analytics, Zayo Group Comprehensive Community Infrastructure, 14.
204 ASR Analytics, University of Arkansas System Comprehensive Community Infrastructure, 26; ASR Analytics, Clearwave Communications Comprehensive Community Infrastructure, 13; ASR Analytics, MCNC Comprehensive Community Infrastructure, 14; ASR Analytics, Merit Network, Inc. Comprehensive Community Infrastructure, 13; ASR Analytics, Massachusetts Technology Park Comprehensive Community Infrastructure, 17; ASR Analytics, OneCommunity Comprehensive Community Infrastructure, 13; ASR Analytics, Zayo Group Comprehensive Community Infrastructure.
205 ASR Analytics, University of Arkansas System Comprehensive Community Infrastructure, 27; ASR Analytics, Lane Council of Governments Comprehensive Community Infrastructure, 14; ASR Analytics, Mid-Atlantic Broadband Cooperative Comprehensive Community Infrastructure, 13; ASR Analytics, Merit Network, Inc. Comprehensive Community Infrastructure, 14; ASR Analytics, OSHEAN, Inc. Comprehensive Community Infrastructure, 15; ASR Analytics, South Dakota Network Comprehensive Community Infrastructure, 15; ASR Analytics, Executive Office of the State of West Virginia Comprehensive Community Infrastructure, 14.
206 ASR Analytics, University of Arkansas System Comprehensive Community Infrastructure, 28; ASR Analytics, Lane Council of Governments Comprehensive Community Infrastructure, 14; ASR Analytics, Merit Network, Inc. Comprehensive Community Infrastructure, 14; ASR Analytics, OSHEAN, Inc. Comprehensive Community Infrastructure, 15; ASR Analytics, South Dakota Network Comprehensive Community Infrastructure, 15.
207 ASR Analytics, University of Arkansas System Comprehensive Community Infrastructure, 26; ASR Analytics, Clearwave Communications Comprehensive Community Infrastructure, 13; ASR Analytics, Mid-Atlantic Broadband Cooperative Comprehensive Community Infrastructure, 13; ASR Analytics, MCNC Comprehensive Community Infrastructure, 14; ASR Analytics, Merit Network, Inc. Comprehensive Community Infrastructure, 13; ASR Analytics, Massachusetts Technology Park Comprehensive Community Infrastructure, 17; ASR Analytics, OneCommunity Comprehensive Community Infrastructure, 13; ASR Analytics, OSHEAN, Inc. Comprehensive Community Infrastructure, 13; ASR Analytics, South Dakota Network Comprehensive Community Infrastructure, 12; ASR Analytics, Executive Office of the State of West Virginia Comprehensive Community Infrastructure, 14; ASR Analytics, Zayo Group Comprehensive Community Infrastructure, 13.
208 ASR Analytics, University of Arkansas System Comprehensive Community Infrastructure, 26; ASR Analytics, Clearwave Communications Comprehensive Community Infrastructure, 13; ASR Analytics, Mid-Atlantic Broadband Cooperative Comprehensive Community Infrastructure, 13; ASR Analytics, MCNC Comprehensive Community Infrastructure, 14; ASR Analytics, Merit Network, Inc. Comprehensive Community Infrastructure, 13; ASR Analytics, Massachusetts Technology Park Comprehensive Community Infrastructure, 17; ASR Analytics, OneCommunity Comprehensive Community Infrastructure, 13; ASR Analytics, OSHEAN, Inc. Comprehensive Community Infrastructure, 13; ASR Analytics, South Dakota Network Comprehensive Community Infrastructure, 12; ASR Analytics, Executive Office of the State of West Virginia Comprehensive Community Infrastructure, 14; ASR Analytics, Zayo Group Comprehensive Community Infrastructure, 13.
209 ASR Analytics, University of Arkansas System Comprehensive Community Infrastructure, 27; ASR Analytics, OSHEAN, Inc. Comprehensive Community Infrastructure, 13.
210 ASR Analytics, OSHEAN, Inc. Comprehensive Community Infrastructure, 13.
211 ASR Analytics, MCNC Comprehensive Community Infrastructure, 14.

143
212 ASR Analytics, University of Arkansas System Comprehensive Community Infrastructure, 28; ASR Analytics, Clearwave Communications Comprehensive Community Infrastructure, 14; ASR Analytics, Lane Council of Governments Comprehensive Community Infrastructure, 14; ASR Analytics, Mid-Atlantic Broadband Cooperative Comprehensive Community Infrastructure, 14; ASR Analytics, MCNC Comprehensive Community Infrastructure, 14; ASR Analytics, Merit Network, Inc. Comprehensive Community Infrastructure, 14; ASR Analytics, Massachusetts Technology Park Comprehensive Community Infrastructure, 18; ASR Analytics, OSHEAN, Inc. Comprehensive Community Infrastructure, 15; ASR Analytics, Executive Office of the State of West Virginia Comprehensive Community Infrastructure, 14; ASR Analytics, Zayo Group Comprehensive Community Infrastructure, 16.
213 ASR Analytics, Executive Office of the State of West Virginia Comprehensive Community Infrastructure, 15.
214 ASR Analytics, MCNC Comprehensive Community Infrastructure, 14.
215 ASR Analytics, University of Arkansas System Comprehensive Community Infrastructure, 28; ASR Analytics, Lane Council of Governments Comprehensive Community Infrastructure, 14; ASR Analytics, MCNC Comprehensive Community Infrastructure, 13; ASR Analytics, Merit Network, Inc. Comprehensive Community Infrastructure, 14; ASR Analytics, OSHEAN, Inc. Comprehensive Community Infrastructure, 14; ASR Analytics, South Dakota Network Comprehensive Community Infrastructure, 14; ASR Analytics, Executive Office of the State of West Virginia Comprehensive Community Infrastructure, 15.
216 ASR Analytics, MCNC Comprehensive Community Infrastructure, 14.
217 ASR Analytics, Lane Council of Governments Comprehensive Community Infrastructure, 14.
218 ASR Analytics, Clearwave Communications Comprehensive Community Infrastructure, 13; ASR Analytics, MCNC Comprehensive Community Infrastructure, 13; ASR Analytics, Zayo Group Comprehensive Community Infrastructure, 13.
219 ASR Analytics, Clearwave Communications Comprehensive Community Infrastructure, 13.
220 ASR Analytics, Lane Council of Governments Comprehensive Community Infrastructure, 13; ASR Analytics, Clearwave Communications Comprehensive Community Infrastructure, 13; ASR Analytics, Mid-Atlantic Broadband Cooperative Comprehensive Community Infrastructure, 13; ASR Analytics, MCNC Comprehensive Community Infrastructure, 14; ASR Analytics, Merit Network, Inc. Comprehensive Community Infrastructure, 14; ASR Analytics, Massachusetts Technology Park Comprehensive Community Infrastructure, 17; ASR Analytics, OneCommunity Comprehensive Community Infrastructure, 13; ASR Analytics, OSHEAN, Inc. Comprehensive Community Infrastructure, 13; ASR Analytics, South Dakota Network Comprehensive Community Infrastructure, 12; ASR Analytics, Executive Office of the State of West Virginia Comprehensive Community Infrastructure, 14; ASR Analytics, Zayo Group Comprehensive Community Infrastructure, 14.
221 ASR Analytics, Massachusetts Technology Park Comprehensive Community Infrastructure, 19.
222 ASR Analytics, Merit Network, Inc. Comprehensive Community Infrastructure, 15.
223 ASR Analytics, Clearwave Communications Comprehensive Community Infrastructure, 14.
224 Ingrida Lusis and Pam Mason, Paradigm Shift: The New World of Hearing Health Care Delivery, 2012.
Wen-ying Sylvia Chou et al., “Web 2.0 for Health Promotion: Reviewing the Current Evidence,” American Journal of Public Health 103, no. 1 (2013), http://ajph.aphapublications.org/doi/pdf/10.2105/AJPH.2012.301071.

144
225 David McDaid and A-La Park, Online Health: Untangling the Web, 2010. 226 Y. Zhou et al., “Improved Quality at Kaiser Permanente through Email between Physicians and Patients.,” Health Affairs 7 (2009): 1370–1375.
George Lauer, “Seniors Who Use Internet Could Reap Health Benefits, Studies Show,” December 01, 2009, http://www.ihealthbeat.org/features/2009/seniors-who-use-internet-could-reap-health-benefits-studies-show.aspx.
Brian Whitacrea and Lara Brooksa, “Do Broadband Adoption Rates Impact a Community’s Health?,” Behaviour & Information Technology (2013).
227 Cheryl A. Moyer, “Online Patient-Provider Communication: How Will It Fit?,” The Electronic Journal of Communication 17, no. 3 & 4 (2007), http://www.cios.org/EJCPUBLIC/017/3/01732.HTML.
228 C.B. White et al., “A Content Analysis of E-Mail Communication Between Patients and Their Providers: Patients Get the Message,” Journal of the American Medical Informatics Association 11, no. 4 (2004): 260–267.
229 Moyer, “Online Patient-Provider Communication: How Will It Fit?”.
230 HealthIT.gov, “Benefits of Health IT,” August 28, 2012, http://www.healthit.gov/patients-families/health-it-makes-health-care-convenient.
231 HealthIT.gov, “Benefits of Health IT.”
232 HealthIT.gov, “Benefits of Health IT.”
233 HealthIT.gov, “Benefits of Health IT.”
234 The South Dakota Bureau of Information and Telecommunications, “Broadband Benefits for Rural Areas,” February 01, 2011.
235 The South Dakota Bureau of Information and Telecommunications, “Broadband Benefits for Rural Areas,” February 01, 2011.
236 The South Dakota Bureau of Information and Telecommunications, “Broadband Benefits for Rural Areas,” February 01, 2011.
237 John Henkel, “Buying Drugs Online: It’s Convenient and Private, but Beware of ‘Rogue Sites,’” November 10, 2011, http://www.fda.gov/Drugs/EmergencyPreparedness/BioterrorismandDrugPreparedness/ucm137269.htm.
238 Henkel, “Buying Drugs Online: It’s Convenient and Private, but Beware of ‘Rogue Sites.’”
239 Henkel, “Buying Drugs Online: It’s Convenient and Private, but Beware of ‘Rogue Sites.’”
240 Stephen Miller, “Online Tools Help Consumers Make Cost-Effective Decisions on Drugs, Routine Care” (Alexandria, VA: Society for Human Resource Management, November 23, 2010), http://www.shrm.org/hrdisciplines/benefits/Articles/Pages/CostTools.aspx.
241 Broadband for America, “Health Care” (Washington, DC, 2011), http://www.broadbandforamerica.com/benefits/healthcare.
242 Broadband for America, “Health Care.”
243 Jagjit Singh Bhatia and Sagri Sharma, “Telemedicine Endurance - Empowering Care Recipients in Asian Telemedicine Setup,” Studies in Health Technology and Informatics 137 (January 2008): 17–25, http://booksonline.iospress.nl/Content/View.aspx?piid=9181.

145
David McDaid and A-La Park, Online Health: Untangling the Web, 2010.
244 Moyer, “Online Patient-Provider Communication: How Will It Fit?”.
245 Moyer, “Online Patient-Provider Communication: How Will It Fit?”.
246 Audiey C. Kao et al., “The Relationship Between Method of Physician Payment and Patient Trust,” JAMA: The Journal of the American Medical Association 280, no. 19 (November 18, 1998): 1708–1714, doi:10.1001/jama.280.19.1708.
Audiey C. Kao et al., “Patients’ Trust in Their Physicians: Effects of Choice, Continuity, and Payment Method,” Journal of General Internal Medicine 13, no. 10 (October 1998): 681–686, http://www.ncbi.nlm.nih.gov/pmc/articles/PMC1500897/.
247 HealthIT.gov, “Benefits of Health IT.”
248 HealthIT.gov, “Benefits of Health IT.”
249 The South Dakota Bureau of Information and Telecommunications, “Broadband Benefits for Rural Areas,” February 01, 2011.
250 ASR Analytics, C.K. Blandin Foundation Sustainable Broadband Adoption Round 2, 14.
ASR Analytics, Florida Agricultural and Mechanical University Public Computer Center Round 2, 14.
ASR Analytics, Urban Affairs Coalition Sustainable Broadband Adoption Round 2, 15.
251 ASR Analytics, C.K. Blandin Foundation Sustainable Broadband Adoption Round 2, 14.
252 ASR Analytics, Florida Agricultural and Mechanical University Public Computer Center Round 2, 14.
ASR Analytics, Connect Arkansas Sustainable Broadband Adoption Round 2, 14.
ASR Analytics, Future Generations Sustainable Broadband Adoption Round 2, 18.
ASR Analytics, Urban Affairs Coalition Sustainable Broadband Adoption Round 2, 15.
253 ASR Analytics, Florida Agricultural and Mechanical University Public Computer Center Round 2, 14.
ASR Analytics, Urban Affairs Coalition Sustainable Broadband Adoption Round 2, 15.
254 ASR Analytics, Future Generations Sustainable Broadband Adoption Round 2, 18.
ASR Analytics, Urban Affairs Coalition Sustainable Broadband Adoption Round 2, 15.
255 ASR Analytics, Florida Agricultural and Mechanical University Public Computer Center Round 2, 14.
ASR Analytics, C.K. Blandin Foundation Sustainable Broadband Adoption Round 2, 14.
256 ASR Analytics, Florida Agricultural and Mechanical University Public Computer Center Round 2, 14.
257 ASR Analytics, Connect Arkansas Sustainable Broadband Adoption Round 2, 14.
258 ASR Analytics, Florida Agricultural and Mechanical University Public Computer Center Round 2, 14.
ASR Analytics, Urban Affairs Coalition Sustainable Broadband Adoption Round 2, 15.

146
259 ASR Analytics, Florida Agricultural and Mechanical University Public Computer Center Round 2, 14.
260 ASR Analytics, Urban Affairs Coalition Sustainable Broadband Adoption Round 2, 15.
261 ASR Analytics, California Emerging Technology Fund Sustainable Broadband Adoption Round 2, 4.
262 ASR Analytics, California Emerging Technology Fund Sustainable Broadband Adoption Round 2, 17.
263 ASR Analytics, Connect Arkansas Sustainable Broadband Adoption Round 2, 16.
264 ASR Analytics, Connect Arkansas Sustainable Broadband Adoption Round 2, 15.
265 ASR Analytics, Connect Arkansas Sustainable Broadband Adoption Round 2, 16.
266 ASR Analytics, Future Generations Sustainable Broadband Adoption Round 2, 5.
267 ASR Analytics, Urban Affairs Coalition Sustainable Broadband Adoption Round 2, 15.
268 ASR Analytics, California Emerging Technology Fund Sustainable Broadband Adoption Round 2, 13.
269 Representatives of Center for Accessible Technology, “Interview with Authors,” January 15, 2013.
270 ASR Analytics, C.K. Blandin Foundation Sustainable Broadband Adoption Round 2, 14.
271 University of Arkansas for Medical Sciences, “SCTRC Follow Up Information,” 2013.
272 ASR Analytics, Connect Arkansas Sustainable Broadband Adoption Round 2, 14.
273 ASR Analytics, Connect Arkansas Sustainable Broadband Adoption Round 2, 14.
274 ASR Analytics, Connect Arkansas Sustainable Broadband Adoption Round 2, 14.
ASR Analytics, C.K. Blandin Foundation Sustainable Broadband Adoption Round 2, 14.
ASR Analytics, Future Generations Sustainable Broadband Adoption Round 2, 18.
ASR Analytics, Urban Affairs Coalition Sustainable Broadband Adoption Round 2, 15.
275 ASR Analytics, Connect Arkansas Sustainable Broadband Adoption Round 2, 14.
276 The South Dakota Bureau of Information and Telecommunications, “Broadband Benefits for Rural Areas,” 2011.
277 ASR Analytics, Urban Affairs Coalition Sustainable Broadband Adoption Round 2, 15.
278 White et al., “A Content Analysis of E-Mail Communication Between Patients and Their Providers: Patients Get the Message.”
279 ASR Analytics, Future Generations Sustainable Broadband Adoption Round 2, 18.
280 White et al., “A Content Analysis of E-Mail Communication Between Patients and Their Providers: Patients Get the Message.”
281 ASR Analytics, Executive Office of the State of West Virginia Comprehensive Community Infrastructure, 21; ASR Analytics, South Dakota Network Comprehensive Community Infrastructure, 18; ASR Analytics, OSHEAN, Inc. Comprehensive Community Infrastructure, 17; ASR Analytics, OneCommunity Comprehensive Community Infrastructure, 14; ASR Analytics, Massachusetts Technology Park Comprehensive Community Infrastructure, 22; ASR Analytics, Merit Network, Inc. Comprehensive Community Infrastructure, 20; ASR Analytics, Lane Council of
147
Governments Comprehensive Community Infrastructure, 17; ASR Analytics, University of Arkansas System Comprehensive Community Infrastructure, 20.
282 ASR Analytics, Executive Office of the State of West Virginia Comprehensive Community Infrastructure, 21; ASR Analytics, South Dakota Network Comprehensive Community Infrastructure, 18; ASR Analytics, OSHEAN, Inc. Comprehensive Community Infrastructure, 17; ASR Analytics, OneCommunity Comprehensive Community Infrastructure, 15; ASR Analytics, Massachusetts Technology Park Comprehensive Community Infrastructure, 23; ASR Analytics, Merit Network, Inc. Comprehensive Community Infrastructure, 19; ASR Analytics, Lane Council of Governments Comprehensive Community Infrastructure, 10; ASR Analytics, University of Arkansas System Comprehensive Community Infrastructure, 19; ASR Analytics, Clearwave Communications Comprehensive Community Infrastructure, 18.
283 ASR Analytics, University of Arkansas System Comprehensive Community Infrastructure, 20; ASR Analytics, Clearwave Communications Comprehensive Community Infrastructure, 18; ASR Analytics, Lane Council of Governments Comprehensive Community Infrastructure, 10; ASR Analytics, Merit Network, Inc. Comprehensive Community Infrastructure, 20; ASR Analytics, Massachusetts Technology Park Comprehensive Community Infrastructure, 23; ASR Analytics, OneCommunity Comprehensive Community Infrastructure, 14; ASR Analytics, OSHEAN, Inc. Comprehensive Community Infrastructure, 17; ASR Analytics, South Dakota Network Comprehensive Community Infrastructure, 18; ASR Analytics, Executive Office of the State of West Virginia Comprehensive Community Infrastructure, 20.
284 ASR Analytics, University of Arkansas System Comprehensive Community Infrastructure, 19; ASR Analytics, Merit Network, Inc. Comprehensive Community Infrastructure, 19; ASR Analytics, Massachusetts Technology Park Comprehensive Community Infrastructure, 22; ASR Analytics, OneCommunity Comprehensive Community Infrastructure, 15; ASR Analytics, South Dakota Network Comprehensive Community Infrastructure, 18.
285 ASR Analytics, University of Arkansas System Comprehensive Community Infrastructure, 20; ASR Analytics, OSHEAN, Inc. Comprehensive Community Infrastructure, 18.
286 ASR Analytics, University of Arkansas System Comprehensive Community Infrastructure, 21; ASR Analytics, Clearwave Communications Comprehensive Community Infrastructure, 18; ASR Analytics, Lane Council of Governments Comprehensive Community Infrastructure, 10; ASR Analytics, Merit Network, Inc. Comprehensive Community Infrastructure, 20; ASR Analytics, OneCommunity Comprehensive Community Infrastructure, 16; ASR Analytics, OSHEAN, Inc. Comprehensive Community Infrastructure, 18; ASR Analytics, South Dakota Network Comprehensive Community Infrastructure, 19; ASR Analytics, Executive Office of the State of West Virginia Comprehensive Community Infrastructure, 21.
287 ASR Analytics, University of Arkansas System Comprehensive Community Infrastructure, 22; ASR Analytics, Clearwave Communications Comprehensive Community Infrastructure, 18; ASR Analytics, Lane Council of Governments Comprehensive Community Infrastructure, 10; ASR Analytics, Merit Network, Inc. Comprehensive Community Infrastructure, 20; ASR Analytics, OneCommunity Comprehensive Community Infrastructure, 16; ASR Analytics, OSHEAN, Inc. Comprehensive Community Infrastructure, 18; ASR Analytics, South Dakota Network Comprehensive Community Infrastructure, 19; ASR Analytics, Executive Office of the State of West Virginia Comprehensive Community Infrastructure, 21.
288 ASR Analytics, University of Arkansas System Comprehensive Community Infrastructure, 21; ASR Analytics, Merit Network, Inc. Comprehensive Community Infrastructure, 20; ASR Analytics, OneCommunity Comprehensive Community Infrastructure, 16; ASR Analytics, Executive Office of the State of West Virginia Comprehensive Community Infrastructure, 21.
148
289 ASR Analytics, OSHEAN, Inc. Comprehensive Community Infrastructure, 18; ASR Analytics, OneCommunity Comprehensive Community Infrastructure, 15.
290 ASR Analytics, Executive Office of the State of West Virginia Comprehensive Community Infrastructure, 21.
291 ASR Analytics, OSHEAN, Inc. Comprehensive Community Infrastructure, 18.
292 ASR Analytics, OneCommunity Comprehensive Community Infrastructure, 16.
293 ASR Analytics, University of Arkansas System Comprehensive Community Infrastructure, 23; ASR Analytics, Lane Council of Governments Comprehensive Community Infrastructure, 17; ASR Analytics, OneCommunity Comprehensive Community Infrastructure, 14; ASR Analytics, OSHEAN, Inc. Comprehensive Community Infrastructure, 17; ASR Analytics, South Dakota Network Comprehensive Community Infrastructure, 18; ASR Analytics, Executive Office of the State of West Virginia Comprehensive Community Infrastructure, 20.
294 ASR Analytics, University of Arkansas System Comprehensive Community Infrastructure, 23; ASR Analytics, Lane Council of Governments Comprehensive Community Infrastructure, 17; ASR Analytics, OneCommunity Comprehensive Community Infrastructure, 14; ASR Analytics, OSHEAN, Inc. Comprehensive Community Infrastructure, 17; ASR Analytics, South Dakota Network Comprehensive Community Infrastructure, 18; ASR Analytics, Executive Office of the State of West Virginia Comprehensive Community Infrastructure, 20.
295 ASR Analytics, University of Arkansas System Comprehensive Community Infrastructure, 19; ASR Analytics, South Dakota Network Comprehensive Community Infrastructure, 18.
296 ASR Analytics, University of Arkansas System Comprehensive Community Infrastructure, 15.
297 ASR Analytics, Lane Council of Governments Comprehensive Community Infrastructure, 18.
298 ASR Analytics, University of Arkansas System Comprehensive Community Infrastructure, 15.
299 ASR Analytics, University of Arkansas System Comprehensive Community Infrastructure, 21; ASR Analytics, Merit Network, Inc. Comprehensive Community Infrastructure, 19; ASR Analytics, Massachusetts Technology Park Comprehensive Community Infrastructure, 22; ASR Analytics, OneCommunity Comprehensive Community Infrastructure, 15; ASR Analytics, Executive Office of the State of West Virginia Comprehensive Community Infrastructure, 21.
300 ASR Analytics, Massachusetts Technology Park Comprehensive Community Infrastructure, 23.
301 ASR Analytics, Merit Network, Inc. Comprehensive Community Infrastructure, 20.
302 Sean Williams, “Fiber Broadband : A Foundation for Social and Economic Growth” (2013): 67–75.
303 Aaron Smith, Government Online, Pew Internet & American Life Project, April 27, 2010, http://www.pewinternet.org/files/old-media//Files/Reports/2010/PIP_Government_Online_2010_with_topline.pdf.
304 Williams, “Fiber Broadband : A Foundation for Social and Economic Growth.”
305 Jonathan Rintels, An Action Plan for America Using Technology and Innovation to Address Our Nation’s Critical Challenges- A Report for the New Administration from the Benton Foundation, 2008, 34, http://benton.org/sites/benton.org/files/Benton_Foundation_Action_Plan.pdf.
306 Marlies Van der Wee et al., “Identifying and Quantifying the Indirect Benefits of Broadband Networks: A Bottom-up Approach,” in Moving Forward with Future Technologies: Opening a Platform for All, 2012, https://biblio.ugent.be/input/download?func=downloadFile&recordOId=3259119&fileOId=3259120.
149
307 Robert D. Atkinson and Daniel D. Castro, Digital Quality of Life: Understanding the Personal and Social Benefits of the Information Technology Revolution (Washington, DC: Information Technology and Information Foundation, October 01, 2008), 141, http://www.itif.org/files/DQOL.pdf.
308 Atkinson and Castro, Digital Quality of Life: Understanding the Personal and Social Benefits of the Information Technology Revolution, October 01, 2008, 140.
309 Atkinson and Castro, Digital Quality of Life: Understanding the Personal and Social Benefits of the Information Technology Revolution, October 01, 2008, 141.
310 Rintels, An Action Plan for America Using Technology and Innovation to Address Our Nation’s Critical Challenges- A Report for the New Administration from the Benton Foundation, 2008, 28.
311 “Public Safety,” March 05, 2014, http://www.ntia.doc.gov/category/public-safety.
312 Atkinson and Castro, Digital Quality of Life: Understanding the Personal and Social Benefits of the Information Technology Revolution, October 01, 2008, 126.
313 Rintels, An Action Plan for America Using Technology and Innovation to Address Our Nation’s Critical Challenges- A Report for the New Administration from the Benton Foundation, 2008.
314 Atkinson and Castro, Digital Quality of Life: Understanding the Personal and Social Benefits of the Information Technology Revolution, October 01, 2008, 118.
315 Columbia Telecommunications Corporation, Benefits Beyond the Balance Sheet: Quantifying the Business Case for Fiber-to-the-Premises in Seattle, 2009, http://www.seattle.gov/broadband/docs/SeattleFTTNBenefits_091109.pdf.
Federal Communications Commission, Connecting America: The National Broadband Plan, 2010, http://www.broadband.gov/plan/.
Van der Wee et al., “Identifying and Quantifying the Indirect Benefits of Broadband Networks: A Bottom-up Approach.”
316 Federal Communications Commission, Connecting America: The National Broadband Plan; Van Der Wee, “Identifying and Quantifying the Indirect Benefits of Broadband Networks: A Bottom-up Approach” (2012).
317 Atkinson and Castro, Digital Quality of Life: Understanding the Personal and Social Benefits of the Information Technology Revolution, October 01, 2008.
Columbia Telecommunications Corporation, Benefits Beyond the Balance Sheet: Quantifying the Business Case for Fiber-to-the-Premises in Seattle.
Federal Communications Commission, Connecting America: The National Broadband Plan.
Jonathan Rintels, An Action Plan for America Using Technology and Innovation to Address Our Nation’s Critical Challenges- A Report for the New Administration from the Benton Foundation, 2008, http://benton.org/sites/benton.org/files/Benton_Foundation_Action_Plan.pdf.
318 Rintels, An Action Plan for America Using Technology and Innovation to Address Our Nation’s Critical Challenges- A Report for the New Administration from the Benton Foundation, 2008.
319 Columbia Telecommunications Corporation, Benefits Beyond the Balance Sheet: Quantifying the Business Case for Fiber-to-the-Premises in Seattle.
Federal Communications Commission, Connecting America: The National Broadband Plan.
IBM, “IBM Survey Reveals New Type of Energy Concern,” IBM News Room (Armonk, NY, August 25, 2011), http://www-03.ibm.com/press/us/en/pressrelease/35271.wss.
150
Wee, “Identifying and Quantifying the Indirect Benefits of Broadband Networks: A Bottom-up Approach.”
320 Atkinson and Castro, Digital Quality of Life: Understanding the Personal and Social Benefits of the Information Technology Revolution, October 01, 2008.
Federal Communications Commission, Connecting America: The National Broadband Plan.
321 Federal Communications Commission, Connecting America: The National Broadband Plan.
Williams, “Fiber Broadband : A Foundation for Social and Economic Growth.”
322 Federal Communications Commission, Connecting America: The National Broadband Plan.
323 Atkinson and Castro, Digital Quality of Life: Understanding the Personal and Social Benefits of the Information Technology Revolution, October 01, 2008.
Columbia Telecommunications Corporation, Benefits Beyond the Balance Sheet: Quantifying the Business Case for Fiber-to-the-Premises in Seattle.
324 ASR Analytics, Lane Council of Governments Comprehensive Community Infrastructure, 15.
ASR Analytics, MCNC Comprehensive Community Infrastructure, 21.
ASR Analytics, Merit Network, Inc. Comprehensive Community Infrastructure, 21.
ASR Analytics, Massachusetts Technology Park Comprehensive Community Infrastructure, Broadband Technology Opportunities Program Evaluation Study (Order Number D10PD18645), March 19, 2014, 14.
ASR Analytics, OneCommunity Comprehensive Community Infrastructure, Broadband Technology Opportunities Program Evaluation Study (Order Number D10PD18645), April 21, 2014, 20.
ASR Analytics, OSHEAN, Inc. Comprehensive Community Infrastructure, Broadband Technology Opportunities Program Evaluation Study (Order Number D10PD18645), March 10, 2014, 21.
ASR Analytics, South Dakota Network Comprehensive Community Infrastructure, Broadband Technology Opportunities Program Evaluation Study (Order Number D10PD18645), February 05, 2014, 16.
ASR Analytics, WorkForce West Virginia Public Computer Center Round 2, Broadband Technology Opportunities Program Evaluation Study (Order Number D10PD18645), September 23, 2013, 17.
325 ASR Analytics, Clearwave Communications Comprehensive Community Infrastructure, 16.
ASR Analytics, Lane Council of Governments Comprehensive Community Infrastructure, 15.
ASR Analytics, Merit Network, Inc. Comprehensive Community Infrastructure, 22.
ASR Analytics, Massachusetts Technology Park Comprehensive Community Infrastructure, 14.
ASR Analytics, OneCommunity Comprehensive Community Infrastructure, 20.
ASR Analytics, OSHEAN, Inc. Comprehensive Community Infrastructure, 22.
ASR Analytics, South Dakota Network Comprehensive Community Infrastructure, 16.
ASR Analytics, Executive Office of the State of West Virginia Comprehensive Community Infrastructure, 17.
ASR Analytics, Zayo Group Comprehensive Community Infrastructure, 22.
326 ASR Analytics, Lane Council of Governments Comprehensive Community Infrastructure, 16.
151
327 ASR Analytics, Lane Council of Governments Comprehensive Community Infrastructure, 15.
ASR Analytics, Massachusetts Technology Park Comprehensive Community Infrastructure, 14.
ASR Analytics, OneCommunity Comprehensive Community Infrastructure, 20.
ASR Analytics, OSHEAN, Inc. Comprehensive Community Infrastructure, 21.
ASR Analytics, South Dakota Network Comprehensive Community Infrastructure, 16.
ASR Analytics, Executive Office of the State of West Virginia Comprehensive Community Infrastructure, 17.
328 ASR Analytics, South Dakota Network Comprehensive Community Infrastructure, 16.
ASR Analytics, Executive Office of the State of West Virginia Comprehensive Community Infrastructure, 17.
ASR Analytics, Merit Network, Inc. Comprehensive Community Infrastructure, 22.
329 ASR Analytics, Clearwave Communications Comprehensive Community Infrastructure, 16.
ASR Analytics, MCNC Comprehensive Community Infrastructure, 21.
ASR Analytics, Massachusetts Technology Park Comprehensive Community Infrastructure, 14.
ASR Analytics, OSHEAN, Inc. Comprehensive Community Infrastructure, 21.
ASR Analytics, Executive Office of the State of West Virginia Comprehensive Community Infrastructure, 17.
330 ASR Analytics, Lane Council of Governments Comprehensive Community Infrastructure, 15.
ASR Analytics, Massachusetts Technology Park Comprehensive Community Infrastructure, 14.
ASR Analytics, OneCommunity Comprehensive Community Infrastructure, 20.
ASR Analytics, South Dakota Network Comprehensive Community Infrastructure, 16.
ASR Analytics, Executive Office of the State of West Virginia Comprehensive Community Infrastructure, 18.ASR Analytics, Lane Council of Governments Comprehensive Community Infrastructure, 15.
331 ASR Analytics, Lane Council of Governments Comprehensive Community Infrastructure, 15.
ASR Analytics, Merit Network, Inc. Comprehensive Community Infrastructure, 21.
ASR Analytics, Massachusetts Technology Park Comprehensive Community Infrastructure, 14.
ASR Analytics, OSHEAN, Inc. Comprehensive Community Infrastructure, 21.
ASR Analytics, Executive Office of the State of West Virginia Comprehensive Community Infrastructure, 18.
332 ASR Analytics, Massachusetts Technology Park Comprehensive Community Infrastructure, 16.
ASR Analytics, Zayo Group Comprehensive Community Infrastructure, 22.
ASR Analytics, Executive Office of the State of West Virginia Comprehensive Community Infrastructure, 17.
333 ASR Analytics, Lane Council of Governments Comprehensive Community Infrastructure, 15.
ASR Analytics, Merit Network, Inc. Comprehensive Community Infrastructure, 21.
ASR Analytics, OneCommunity Comprehensive Community Infrastructure, 20.
152
ASR Analytics, OSHEAN, Inc. Comprehensive Community Infrastructure, 21.
ASR Analytics, South Dakota Network Comprehensive Community Infrastructure, 16.
ASR Analytics, Executive Office of the State of West Virginia Comprehensive Community Infrastructure, 17.
334 ASR Analytics, Lane Council of Governments Comprehensive Community Infrastructure, 16.
ASR Analytics, OSHEAN, Inc. Comprehensive Community Infrastructure, 21.
ASR Analytics, South Dakota Network Comprehensive Community Infrastructure, 16.
ASR Analytics, Executive Office of the State of West Virginia Comprehensive Community Infrastructure, 19.
335 ASR Analytics, South Dakota Network Comprehensive Community Infrastructure, 19.
336 ASR Analytics, OSHEAN, Inc. Comprehensive Community Infrastructure, 22.
337 ASR Analytics, OSHEAN, Inc. Comprehensive Community Infrastructure, 21.
ASR Analytics, Executive Office of the State of West Virginia Comprehensive Community Infrastructure, 17.
ASR Analytics, Massachusetts Technology Park Comprehensive Community Infrastructure, 16.
338 ASR Analytics, OneCommunity Comprehensive Community Infrastructure, 23.
339 ASR Analytics, OSHEAN, Inc. Comprehensive Community Infrastructure, 25.
340 ASR Analytics, Executive Office of the State of West Virginia Comprehensive Community Infrastructure, 23.
341 ASR Analytics, Clearwave Communications Comprehensive Community Infrastructure, 16.
ASR Analytics, Lane Council of Governments Comprehensive Community Infrastructure, 15.
ASR Analytics, MCNC Comprehensive Community Infrastructure, 21.
ASR Analytics, Merit Network, Inc. Comprehensive Community Infrastructure, 22.
ASR Analytics, Massachusetts Technology Park Comprehensive Community Infrastructure, 14.
ASR Analytics, OneCommunity Comprehensive Community Infrastructure, 20.
ASR Analytics, OSHEAN, Inc. Comprehensive Community Infrastructure, 21.
ASR Analytics, South Dakota Network Comprehensive Community Infrastructure, 16.
ASR Analytics, Zayo Group Comprehensive Community Infrastructure, 22.
342 ASR Analytics, Zayo Group Comprehensive Community Infrastructure, 22.
343 Rintels, An Action Plan for America Using Technology and Innovation to Address Our Nation’s Critical Challenges- A Report for the New Administration from the Benton Foundation, 2008.
344 ASR Analytics, OneCommunity Comprehensive Community Infrastructure, 24.
345 Federal Communications Commission, Connecting America: The National Broadband Plan.
Wee, “Identifying and Quantifying the Indirect Benefits of Broadband Networks: A Bottom-up Approach.”
346 ASR Analytics, Lane Council of Governments Comprehensive Community Infrastructure, 15.
153
ASR Analytics, Massachusetts Technology Park Comprehensive Community Infrastructure, 14.
348 ASR Analytics, Clearwave Communications Comprehensive Community Infrastructure, 4.
349 Lee Rainie et al., How the Public Perceives Community Information Systems, Internet and American Life Project (Washington, DC: Pew Research Center, March 01, 2011), http://pewinternet.org/Reports/2011/08-Community-Information-Systems.aspx.
350 Rainie et al., How the Public Perceives Community Information Systems.
351 Gro Sandkjaer Hanssen, “E-Communication: Strengthening the Ties between Councillors and Citizens in Norwegian Local Government?,” Scandinavian Political Studies 31, no. 3 (September 2008): 333–361, doi:10.1111/j.1467-9477.2008.00209.x.
352 James Prieger, “The Economic Benefits of Mobile Broadband,” School of Public Policy Working Papers (Malibu, CA: Pepperdine University, May 15, 2012), http://digitalcommons.pepperdine.edu/sppworkingpapers/38.
353 Hernando Rojas and Eulalia Puig-i-Abril, “Mobilizers Mobilized: Information, Expression, Mobilization and Participation in the Digital Age,” Journal of Computer-Mediated Communication 14, no. 4 (July 2009): 902–927, doi:10.1111/j.1083-6101.2009.01475.x.
Darrell M. West, Ten Facts about Mobile Broadband (Washington, DC: The Brookings Institution, December 08, 2011), http://www.brookings.edu/research/papers/2011/12/08-mobile-broadband-west.
Michael J. Stern, Alison E. Adams, and Jeffrey Boase, “Rural Community Participation, Social Networks, and Broadband Use: Examples from Localized and National Survey Data,” Agricultural and Resource Economics Review 40, no. 2 (August 2011): 158–171, http://purl.umn.edu/117769.
Stern, Adams, and Boase, “Rural Community Participation, Social Networks, and Broadband Use: Examples from Localized and National Survey Data.”
Shelley Boulianne, “Does Internet Use Affect Engagement? A Meta-Analysis of Research,” Political Communication 26, no. 2 (May 11, 2009): 193–211, doi:10.1080/10584600902854363.
Jessica Lavariega Manforti and Jose Marichal, “The Role of Digital Skills in the Formation Trust and Efficacy Among Latinos,” in Western Political Science Association Annual Conference (San Antonio, TX, 2011), http://papers.ssrn.com/sol3/papers.cfm?abstract_id=1767233.
Namsu Park, Kerk F. Kee, and Sebastián Valenzuela, “Being Immersed in Social Networking Environment: Facebook Groups, Uses and Gratifications, and Social Outcomes.,” CyberPsychology & Behavior 12, no. 6 (December 2009): 729–33, doi:10.1089/cpb.2009.0003.
Josh Pasek, “Building Social Capital in Young People: The Role of Mass Media and Life Outlook,” Working Paper, 2009, http://umich.academia.edu/JoshPasek/Papers/97408/Building_Social_Capital_in_Young_People_The_Role_of_Mass_Media_and_Life_Outlook.
Marko M. Skoric and Grace Kwan, “Do Facebook and Video Games Promote Political Participation Among Youth? Evidence from Singapore,” Journal of E-Democracy and Open Government 3, no. 1 (2011): 70–79, http://www.jedem.org/article/view/49.
Marta Cantijoch, David Cutts, and Rachel Gibson, “Internet Use and Political Engagement: The Role of E-Campaigning as a Pathway to Online Political Participation” (2013), https://escholarship.org/uc/item/538243k2.
Filipe Campante, Ruben Durante, and Francesco Sobbrio, “Politics 2.0: The Multifaceted Effect of Broadband Internet on Political Participation” (2013), http://www.iae.csic.es/investigatorsMaterial/a13174085038513.pdf.
154
354 Lee Rainie, Kristen Purcell, and Aaron Smith, The Social Side of the Internet, Internet and American Life Project (Washington, DC: Pew Research Center, January 18, 2011), http://pewinternet.org/Reports/2011/The-Social-Side-of-the-Internet.aspx.
355 LaRose et al., Closing the Rural Broadband Gap, Final Technical Report.
356 ASR Analytics, California Emerging Technology Fund Sustainable Broadband Adoption Round 2, 18.
ASR Analytics, Cambridge Housing Authority Public Computer Center Round 2, 9.
ASR Analytics, Smart Chicago Sustainable Broadband Adoption Round 2, 19.
ASR Analytics, Delaware Department of State (Delaware Division of Libraries) Public Computer Center Round 2, 16.
ASR Analytics, Foundation for California Community Colleges Sustainable Broadband Adoption Round 2, 8.
ASR Analytics, Future Generations Sustainable Broadband Adoption Round 2, 16.
ASR Analytics, Las Vegas-Clark County Urban League Public Computer Center Round 2, 9.
ASR Analytics, Technology for All, Inc. Public Computer Center Round 2, 12.
ASR Analytics, Urban Affairs Coalition Sustainable Broadband Adoption Round 2, 11.
357 ASR Analytics, California Emerging Technology Fund Sustainable Broadband Adoption Round 2, 18.
ASR Analytics, Smart Chicago Sustainable Broadband Adoption Round 2, 21.
ASR Analytics, C.K. Blandin Foundation Sustainable Broadband Adoption Round 2, 10.
ASR Analytics, Delaware Department of State (Delaware Division of Libraries) Public Computer Center Round 2, 16.
ASR Analytics, Future Generations Sustainable Broadband Adoption Round 2, 14.
ASR Analytics, Las Vegas-Clark County Urban League Public Computer Center Round 2, 11.
ASR Analytics, Michigan State University Public Computer Center Round 2, 12.
ASR Analytics, Technology for All, Inc. Public Computer Center Round 2, 12.
ASR Analytics, Urban Affairs Coalition Sustainable Broadband Adoption Round 2, 15.
ASR Analytics, WorkForce West Virginia Public Computer Center Round 2, 12.
358 ASR Analytics, Smart Chicago Sustainable Broadband Adoption Round 2, 19.
ASR Analytics, C.K. Blandin Foundation Sustainable Broadband Adoption Round 2, 12.
359 ASR Analytics, California Emerging Technology Fund Sustainable Broadband Adoption Round 2, 18.
ASR Analytics, Smart Chicago Sustainable Broadband Adoption Round 2, 21.
ASR Analytics, C.K. Blandin Foundation Sustainable Broadband Adoption Round 2, 13.
ASR Analytics, Delaware Department of State (Delaware Division of Libraries) Public Computer Center Round 2, 16.
ASR Analytics, Foundation for California Community Colleges Sustainable Broadband Adoption Round 2, 14.

155
ASR Analytics, Future Generations Sustainable Broadband Adoption Round 2, 15.
ASR Analytics, Las Vegas-Clark County Urban League Public Computer Center Round 2, 11.
ASR Analytics, Michigan State University Public Computer Center Round 2, 12.
ASR Analytics, Technology for All, Inc. Public Computer Center Round 2, 12.
ASR Analytics, Urban Affairs Coalition Sustainable Broadband Adoption Round 2, 15.
ASR Analytics, WorkForce West Virginia Public Computer Center Round 2, 12.
360 ASR Analytics, Smart Chicago Sustainable Broadband Adoption Round 2, 21.
ASR Analytics, C.K. Blandin Foundation Sustainable Broadband Adoption Round 2, 10.
ASR Analytics, Foundation for California Community Colleges Sustainable Broadband Adoption Round 2, 14.
ASR Analytics, Future Generations Sustainable Broadband Adoption Round 2, 15.
ASR Analytics, Las Vegas-Clark County Urban League Public Computer Center Round 2, 9.
ASR Analytics, Michigan State University Public Computer Center Round 2, 12.
ASR Analytics, Technology for All, Inc. Public Computer Center Round 2, 12.
ASR Analytics, Urban Affairs Coalition Sustainable Broadband Adoption Round 2, 11.
361 ASR Analytics, Cambridge Housing Authority Public Computer Center Round 2, 9.
ASR Analytics, Smart Chicago Sustainable Broadband Adoption Round 2, 19.
ASR Analytics, C.K. Blandin Foundation Sustainable Broadband Adoption Round 2, 12.
ASR Analytics, Future Generations Sustainable Broadband Adoption Round 2, 20.
ASR Analytics, Technology for All, Inc. Public Computer Center Round 2, 12.
362 ASR Analytics, Cambridge Housing Authority Public Computer Center Round 2, 12.
ASR Analytics, Smart Chicago Sustainable Broadband Adoption Round 2, 21.
ASR Analytics, Future Generations Sustainable Broadband Adoption Round 2, 14.
363 ASR Analytics, Foundation for California Community Colleges Sustainable Broadband Adoption Round 2, 8.
ASR Analytics, Future Generations Sustainable Broadband Adoption Round 2, 14.
364 ASR Analytics, Future Generations Sustainable Broadband Adoption Round 2, 17.
365 ASR Analytics, Delaware Department of State (Delaware Division of Libraries) Public Computer Center Round 2, 16.
ASR Analytics, Foundation for California Community Colleges Sustainable Broadband Adoption Round 2, 14.
366 ASR Analytics, Foundation for California Community Colleges Sustainable Broadband Adoption Round 2, 14.
367 ASR Analytics, Delaware Department of State (Delaware Division of Libraries) Public Computer Center Round 2, 16.
368 ASR Analytics, Cambridge Housing Authority Public Computer Center Round 2, 9.

156
ASR Analytics, C.K. Blandin Foundation Sustainable Broadband Adoption Round 2, 12.
ASR Analytics, Future Generations Sustainable Broadband Adoption Round 2, 20.
369 ASR Analytics, C.K. Blandin Foundation Sustainable Broadband Adoption Round 2, 12.
370 ASR Analytics, Future Generations Sustainable Broadband Adoption, 20.
371 ASR Analytics, Smart Chicago Sustainable Broadband Adoption Round 2, 21.
ASR Analytics, Michigan State University Public Computer Center Round 2, 12.
ASR Analytics, Technology for All, Inc. Public Computer Center Round 2, 12.
ASR Analytics, Urban Affairs Coalition Sustainable Broadband Adoption Round 2, 15.
372 ASR Analytics, Urban Affairs Coalition Sustainable Broadband Adoption Round 2, 15.
373 ASR Analytics, Smart Chicago Sustainable Broadband Adoption Round 2, 21.
374 ASR Analytics, Cambridge Housing Authority Public Computer Center Round 2, 12.
ASR Analytics, Future Generations Sustainable Broadband Adoption Round 2, 14.
ASR Analytics, Las Vegas-Clark County Urban League Public Computer Center Round 2, 9.
375 ASR Analytics, Future Generations Sustainable Broadband Adoption, 14.
376 ASR Analytics, Cambridge Housing Authority Public Computer Center Round 2, 12.
377 Representative of Stevens County Demonstration Community, “Interview with Author,” March 20, 2013.
378 ASR Analytics, C.K. Blandin Foundation Sustainable Broadband Adoption, 13.
379 ASR Analytics, C.K. Blandin Foundation Sustainable Broadband Adoption, 13.
380 ASR Analytics, C.K. Blandin Foundation Sustainable Broadband Adoption, 13.
381 ASR Analytics, Las Vegas-Clark County Urban League Public Computer Center Round 2, 11.
382 ASR Analytics, Las Vegas-Clark County Urban League Public Computer Center Round 2, 13.
383 ASR Analytics, C.K. Blandin Foundation Sustainable Broadband Adoption, 12.
384 ASR Analytics, Smart Chicago Sustainable Broadband Adoption Round 2, 10.
385 ASR Analytics, Smart Chicago Sustainable Broadband Adoption Round 2, 21.
386 ASR Analytics, Smart Chicago Sustainable Broadband Adoption Round 2, 21.
387 ASR Analytics, Smart Chicago Sustainable Broadband Adoption Round 2, 10.
388 ASR Analytics, Smart Chicago Sustainable Broadband Adoption Round 2, 21.
389 ASR Analytics, Smart Chicago Sustainable Broadband Adoption Round 2, 21.
390 ASR Analytics, California Emerging Technology Fund Sustainable Broadband Adoption Round 2, 18.
ASR Analytics, Smart Chicago Sustainable Broadband Adoption Round 2, 19.
ASR Analytics, C.K. Blandin Foundation Sustainable Broadband Adoption Round 2, 10.
ASR Analytics, Delaware Department of State (Delaware Division of Libraries) Public Computer Center Round 2, 16.
157
ASR Analytics, Foundation for California Community Colleges Sustainable Broadband Adoption Round 2, 8.
ASR Analytics, Future Generations Sustainable Broadband Adoption Round 2, 15.
ASR Analytics, Las Vegas-Clark County Urban League Public Computer Center Round 2, 11.
ASR Analytics, Michigan State University Public Computer Center Round 2, 12.
ASR Analytics, Technology for All, Inc. Public Computer Center Round 2, 12.
ASR Analytics, Urban Affairs Coalition Sustainable Broadband Adoption Round 2, 11.
ASR Analytics, WorkForce West Virginia Public Computer Center Round 2, 12.
391 ASR Analytics, Future Generations Sustainable Broadband Adoption Round 2, 16.
392 West, Ten Facts about Mobile Broadband.
393 ASR Analytics, C.K. Blandin Foundation Sustainable Broadband Adoption Round 2, 12.
394 ASR Analytics, C.K. Blandin Foundation Sustainable Broadband Adoption Round 2, 13.
395 ASR Analytics, Merit Network, Inc. Comprehensive Community Infrastructure, 23.
ASR Analytics, South Dakota Network Comprehensive Community Infrastructure, 23.
ASR Analytics, OneCommunity Comprehensive Community Infrastructure, 21.
396 ASR Analytics, Clearwave Communications Comprehensive Community Infrastructure, 21.
ASR Analytics, OneCommunity Comprehensive Community Infrastructure, 21.
397 ASR Analytics, OneCommunity Comprehensive Community Infrastructure, 21.
ASR Analytics, South Dakota Network Comprehensive Community Infrastructure, 23.
ASR Analytics, Merit Network, Inc. Comprehensive Community Infrastructure, 23.
398 ASR Analytics, Clearwave Communications Comprehensive Community Infrastructure, 21.
ASR Analytics, OneCommunity Comprehensive Community Infrastructure, 21.
399 ASR Analytics, South Dakota Network Comprehensive Community Infrastructure, 23.
ASR Analytics, Merit Network, Inc. Comprehensive Community Infrastructure, 23.
400 ASR Analytics, Merit Network, Inc. Comprehensive Community Infrastructure, 23.
ASR Analytics, OneCommunity Comprehensive Community Infrastructure, 21.
401 ASR Analytics, Merit Network, Inc. Comprehensive Community Infrastructure, 23.
ASR Analytics, OneCommunity Comprehensive Community Infrastructure, 21.
ASR Analytics, South Dakota Network Comprehensive Community Infrastructure, 23.
ASR Analytics, Clearwave Communications Comprehensive Community Infrastructure, 21.
402 ASR Analytics, South Dakota Network Comprehensive Community Infrastructure, 23.
403 Hanssen, “E-Communication: Strengthening the Ties between Councillors and Citizens in Norwegian Local Government?”.
404 LaRose et al., Closing the Rural Broadband Gap, Final Technical Report.
405 ASR Analytics, Massachusetts Technology Park Comprehensive Community Infrastructure, 27.
158
406 Rojas and Puig-i-Abril, “Mobilizers Mobilized: Information, Expression, Mobilization and Participation in the Digital Age.”
West, Ten Facts about Mobile Broadband.
Stern, Adams, and Boase, “Rural Community Participation, Social Networks, and Broadband Use: Examples from Localized and National Survey Data.”
Stern, Adams, and Boase, “Rural Community Participation, Social Networks, and Broadband Use: Examples from Localized and National Survey Data.”
Boulianne, “Does Internet Use Affect Engagement? A Meta-Analysis of Research.”
Manforti and Marichal, “The Role of Digital Skills in the Formation Trust and Efficacy Among Latinos.”
Park, Kee, and Valenzuela, “Being Immersed in Social Networking Environment: Facebook Groups, Uses and Gratifications, and Social Outcomes.”
Pasek, “Building Social Capital in Young People: The Role of Mass Media and Life Outlook.”
Skoric and Kwan, “Do Facebook and Video Games Promote Political Participation Among Youth? Evidence from Singapore.”
Cantijoch, Cutts, and Gibson, “Internet Use and Political Engagement: The Role of E-Campaigning as a Pathway to Online Political Participation.”
Campante, Durante, and Sobbrio, “Politics 2.0: The Multifaceted Effect of Broadband Internet on Political Participation.”
407 Federal Communications Commission, Connecting America: The National Broadband Plan.
408 Julius Genachowski, “Remarks on Broadband Adoption,” 2011, http://www.fcc.gov/document/chairman-genachowski-broadband-adoption.
Judy Hoffman et al., Libraries Connect Communities: Public Library Funding & Technology Access Study 2010-2011 (Digital supplement of American Libraries magazine, June 2011), http://www.ala.org/research/initiatives/plftas/2010_2011.
Carlos A. Manjarrez and Kyle Schoembs, Who’s in the Queue? A Demographic Analysis of Public Access Computer Users and Uses in U.S. Public Libraries, Research Brief Series, No. 4 (IMLS-2011-RB-04) (Washington, DC: Institute of Museum and Library Services, June 2011), http://www.imls.gov/assets/1/AssetManager/Brief2011_04.pdf.
George S. Ford, Internet Use and Labor Market Participation: Additional Insights from New and Old Data, Phoenix Center Perspectives 11-04 (Phoenix Center for Advanced Legal and Economic Policy Studies, August 18, 2011), http://www.phoenix-center.org/perspectives/Perspective11-04Final.pdf.
Common Sense Media, Digital Literacy and Citizenship in the 21st Century: Educating, Empowering, and Protecting America’s Kids (San Francisco, CA, March 2011).
409 Maria E. Wynne and Lane F. Cooper, Power Up: The Campaign for Digital Inclusion (Office of Economic Development and Innovation, Microsoft Corporation, June 2007), http://www.digitalaccess.org/pdf/White_Paper.pdf.
410 Atkinson and Castro, Digital Quality of Life: Understanding the Personal and Social Benefits of the Information Technology Revolution, October 01, 2008.
411 A.J.A.M. van Deursen, “Internet Skills: Vital Assets in an Information Society” (Enschede, The Netherlands: University of Twente, November 01, 2010), doi:10.3990/1.9789036530866.
159
412 Wynne and Cooper, Power Up: The Campaign for Digital Inclusion.
413 The State of Michigan, “The Benefits of Broadband,” August 27, 2012, http://michigan.gov/broadband/0,1607,7-250-48184_48185---,00.html.
414 The State of Michigan, “The Benefits of Broadband.”
415 The State of Michigan, “The Benefits of Broadband.”
416 Andrew Scarvell, “Digital Literacy and Awareness in Australia’ S New Global Frontier,” in First Media and Information Literacy Forum (Fez, Morocco: UNESCO, 2011), http://scarvell.net/andrew/blog/?page_id=15.
417 Kirsti Ala-Mutka, Learning in Informal Online Networks and Communities (Seville, Spain: Institute for Prospective Technological Studies, 2010), http://ipts.jrc.ec.europa.eu/publications/pub.cfm?id=3059.
418 Christine Redecker, Alexandra Haché, and Clara Centeno, Using Information and Communication Technologies to Promote Education and Employment Opportunities for Immigrants and Ethnic Minorities (Seville, Spain: Institute for Prospective Technological Studies, May 2010), http://ipts.jrc.ec.europa.eu/publications/pub.cfm?id=3219.
419 Michael J. Cody et al., “Silver Surfers: Training and Evaluating Internet Use among Older Adult Learners,” Communication Education 48, no. 4 (October 1999): 269–286, doi:10.1080/03634529909379178.
420 Sven Lindmark, Web 2.0: Where Does Europe Stand? (Seville, Spain: The Institute for Prospective Technological Studies, 2009), http://ipts.jrc.ec.europa.eu/publications/pub.cfm?id=2539.
421 Atkinson and Castro, Digital Quality of Life: Understanding the Personal and Social Benefits of the Information Technology Revolution, October 01, 2008.
422 Atkinson and Castro, Digital Quality of Life: Understanding the Personal and Social Benefits of the Information Technology Revolution, October 01, 2008.
423 Communications Workers of America, Speed Matters: Benefits of Broadband.
424 Kirsti Ala-Mutka et al., “The Socio-Economic Impact of Social Computing,” in Proceedings of a Validation and Policy Options Workshop, ed. Yves Punie (Seville, Spain: Institute for Prospective Technological Studies, 2008), doi:10.2791/55459.
425 David Osimo, Web 2 .0 in Government: Why and How? (Seville, Spain: Institute for Prospective Technological Studies, 2008), http://ipts.jrc.ec.europa.eu/publications/pub.cfm?id=1565.
426 A.J.A.M. van Deursen and J.A.G.M. van Dijk, “Improving Digital Skills for the Use of Online Public Information and Services,” Government Information Quarterly 26, no. 2 (April 2009): 333–340, doi:10.1016/j.giq.2008.11.002.
Osimo, Web 2 .0 in Government: Why and How?.
427 Osimo, Web 2 .0 in Government: Why and How?.
428 Communications Workers of America, Speed Matters: Benefits of Broadband.
429 The State of Michigan, “The Benefits of Broadband.”
430 The State of Michigan, “The Benefits of Broadband.”
431 The State of Michigan, “The Benefits of Broadband.”
160
432 Atkinson and Castro, Digital Quality of Life: Understanding the Personal and Social Benefits of the Information Technology Revolution, October 01, 2008.
433 ASR Analytics, Cambridge Housing Authority Public Computer Center Round 2, 8.
ASR Analytics, California Emerging Technology Fund Sustainable Broadband Adoption Round 2, 11.
ASR Analytics, Smart Chicago Sustainable Broadband Adoption Round 2, 12.
ASR Analytics, C.K. Blandin Foundation Sustainable Broadband Adoption Round 2, 10.
ASR Analytics, Connect Arkansas Sustainable Broadband Adoption Round 2, 11.
ASR Analytics, Delaware Department of State (Delaware Division of Libraries) Public Computer Center Round 2, 13.
ASR Analytics, Florida Agricultural and Mechanical University Public Computer Center Round 2, 12.
ASR Analytics, Foundation for California Community Colleges Sustainable Broadband Adoption Round 2, 8.
ASR Analytics, Future Generations Sustainable Broadband Adoption Round 2, 10.
ASR Analytics, Las Vegas-Clark County Urban League Public Computer Center Round 2, 8.
ASR Analytics, Michigan State University Public Computer Center Round 2, 9.
ASR Analytics, South Carolina State Board for Technical and Comprehensive Education Public Computer Center Round 2, 9.
ASR Analytics, Technology for All, Inc. Public Computer Center Round 2, 8.
ASR Analytics, Urban Affairs Coalition Sustainable Broadband Adoption Round 2, 11.
ASR Analytics, WorkForce West Virginia Public Computer Center Round 2, 12.
434 ASR Analytics, Cambridge Housing Authority Public Computer Center Round 2, 8.
ASR Analytics, California Emerging Technology Fund Sustainable Broadband Adoption Round 2, 11.
ASR Analytics, Smart Chicago Sustainable Broadband Adoption Round 2, 12.
ASR Analytics, C.K. Blandin Foundation Sustainable Broadband Adoption Round 2, 10.
ASR Analytics, Connect Arkansas Sustainable Broadband Adoption Round 2, 11.
ASR Analytics, Delaware Department of State (Delaware Division of Libraries) Public Computer Center Round 2, 13.
ASR Analytics, Florida Agricultural and Mechanical University Public Computer Center Round 2, 12.
ASR Analytics, Foundation for California Community Colleges Sustainable Broadband Adoption Round 2, 8.
ASR Analytics, Future Generations Sustainable Broadband Adoption Round 2, 10.
ASR Analytics, Las Vegas-Clark County Urban League Public Computer Center Round 2, 8.
ASR Analytics, Michigan State University Public Computer Center Round 2, 9.
161
ASR Analytics, South Carolina State Board for Technical and Comprehensive Education Public Computer Center Round 2, 9.
ASR Analytics, Technology for All, Inc. Public Computer Center Round 2, 8.
ASR Analytics, Urban Affairs Coalition Sustainable Broadband Adoption Round 2, 11.
ASR Analytics, WorkForce West Virginia Public Computer Center Round 2, 12.
435 ASR Analytics, California Emerging Technology Fund Sustainable Broadband Adoption Round 2, 8.
ASR Analytics, Smart Chicago Sustainable Broadband Adoption Round 2, 12.
ASR Analytics, C.K. Blandin Foundation Sustainable Broadband Adoption Round 2, 10.
ASR Analytics, Connect Arkansas Sustainable Broadband Adoption Round 2, 11.
ASR Analytics, Foundation for California Community Colleges Sustainable Broadband Adoption Round 2, 8.
ASR Analytics, Future Generations Sustainable Broadband Adoption Round 2, 10.
ASR Analytics, Technology for All, Inc. Public Computer Center Round 2, 6.
ASR Analytics, Urban Affairs Coalition Sustainable Broadband Adoption Round 2, 11.
436 ASR Analytics, Cambridge Housing Authority Public Computer Center Round 2, 8.
ASR Analytics, California Emerging Technology Fund Sustainable Broadband Adoption Round 2, 11.
ASR Analytics, Smart Chicago Sustainable Broadband Adoption Round 2, 12.
ASR Analytics, C.K. Blandin Foundation Sustainable Broadband Adoption Round 2, 10.
ASR Analytics, Connect Arkansas Sustainable Broadband Adoption Round 2, 11.
ASR Analytics, Delaware Department of State (Delaware Division of Libraries) Public Computer Center Round 2, 13.
ASR Analytics, Florida Agricultural and Mechanical University Public Computer Center Round 2, 12.
ASR Analytics, Foundation for California Community Colleges Sustainable Broadband Adoption Round 2, 8.
ASR Analytics, Future Generations Sustainable Broadband Adoption Round 2, 10.
ASR Analytics, Las Vegas-Clark County Urban League Public Computer Center Round 2, 8.
ASR Analytics, Michigan State University Public Computer Center Round 2, 9.
ASR Analytics, South Carolina State Board for Technical and Comprehensive Education Public Computer Center Round 2, 9.
ASR Analytics, Technology for All, Inc. Public Computer Center Round 2, 8.
ASR Analytics, Urban Affairs Coalition Sustainable Broadband Adoption Round 2, 11.
ASR Analytics, WorkForce West Virginia Public Computer Center Round 2, 12.
437 ASR Analytics, California Emerging Technology Fund Sustainable Broadband Adoption Round 2, 14.
162
ASR Analytics, C.K. Blandin Foundation Sustainable Broadband Adoption Round 2, 10.
ASR Analytics, Delaware Department of State (Delaware Division of Libraries) Public Computer Center Round 2, 10.
ASR Analytics, Foundation for California Community Colleges Sustainable Broadband Adoption Round 2, 13.
ASR Analytics, South Carolina State Board for Technical and Comprehensive Education Public Computer Center Round 2, 10.
ASR Analytics, Future Generations Sustainable Broadband Adoption Round 2, 13.
ASR Analytics, Urban Affairs Coalition Sustainable Broadband Adoption Round 2, 12.
438 ASR Analytics, Smart Chicago Sustainable Broadband Adoption Round 2, 16.
439 ASR Analytics, Smart Chicago Sustainable Broadband Adoption Round 2, 16.
440 ASR Analytics, C.K. Blandin Foundation Sustainable Broadband Adoption Round 2, 8.
441 ASR Analytics, Cambridge Housing Authority Public Computer Center Round 2, 9.
ASR Analytics, Foundation for California Community Colleges Sustainable Broadband Adoption Round 2, 16.
442 ASR Analytics, Cambridge Housing Authority Public Computer Center Round 2, 9.
443 ASR Analytics, Foundation for California Community Colleges Sustainable Broadband Adoption Round 2, 8.
444 ASR Analytics, Cambridge Housing Authority Public Computer Center Round 2, 8.
ASR Analytics, California Emerging Technology Fund Sustainable Broadband Adoption Round 2, 11.
ASR Analytics, Smart Chicago Sustainable Broadband Adoption Round 2, 12.
ASR Analytics, C.K. Blandin Foundation Sustainable Broadband Adoption Round 2, 10.
ASR Analytics, Connect Arkansas Sustainable Broadband Adoption Round 2, 11.
ASR Analytics, Delaware Department of State (Delaware Division of Libraries) Public Computer Center Round 2, 13.
ASR Analytics, Florida Agricultural and Mechanical University Public Computer Center Round 2, 12.
ASR Analytics, Foundation for California Community Colleges Sustainable Broadband Adoption Round 2, 8.
ASR Analytics, Future Generations Sustainable Broadband Adoption Round 2, 10.
ASR Analytics, Las Vegas-Clark County Urban League Public Computer Center Round 2, 8.
ASR Analytics, Michigan State University Public Computer Center Round 2, 9.
ASR Analytics, South Carolina State Board for Technical and Comprehensive Education Public Computer Center Round 2, 9.
ASR Analytics, Technology for All, Inc. Public Computer Center Round 2, 8.
ASR Analytics, Urban Affairs Coalition Sustainable Broadband Adoption Round 2, 11.
ASR Analytics, WorkForce West Virginia Public Computer Center Round 2, 12.
163
445 ASR Analytics, Technology for All, Inc. Public Computer Center Round 2, 8.
446 ASR Analytics, C.K. Blandin Foundation Sustainable Broadband Adoption Round 2, 11.
447 ASR Analytics, C.K. Blandin Foundation Sustainable Broadband Adoption Round 2, 16.
448 ASR Analytics, C.K. Blandin Foundation Sustainable Broadband Adoption Round 2, 7.
449 ASR Analytics, C.K. Blandin Foundation Sustainable Broadband Adoption Round 2, 20.
450 ASR Analytics, California Emerging Technology Fund Sustainable Broadband Adoption Round 2, 23.
451 ASR Analytics, Cambridge Housing Authority Public Computer Center Round 2, 16.
452 ASR Analytics, Cambridge Housing Authority Public Computer Center Round 2, 8.
453 ASR Analytics, Cambridge Housing Authority Public Computer Center Round 2, 9.
454 ASR Analytics, Cambridge Housing Authority Public Computer Center Round 2, 6.
455 ASR Analytics, Foundation for California Community Colleges Sustainable Broadband Adoption Round 2, 8.
456 ASR Analytics, Connect Arkansas Sustainable Broadband Adoption Round 2, 11.
457 ASR Analytics, Urban Affairs Coalition Sustainable Broadband Adoption Round 2, 11.
458 ASR Analytics, Urban Affairs Coalition Sustainable Broadband Adoption Round 2, 19.
459 ASR Analytics, Foundation for California Community Colleges Sustainable Broadband Adoption Round 2, 16.
460 ASR Analytics, Foundation for California Community Colleges Sustainable Broadband Adoption Round 2, 8.
461 ASR Analytics, Smart Chicago Sustainable Broadband Adoption Round 2, 11.
462 ASR Analytics, Smart Chicago Sustainable Broadband Adoption Round 2, 12.
463 ASR Analytics, Smart Chicago Sustainable Broadband Adoption Round 2, 16.
464 ASR Analytics, Foundation for California Community Colleges Sustainable Broadband Adoption Round 2, 10.
465 ASR Analytics, Foundation for California Community Colleges Sustainable Broadband Adoption Round 2, 12.
466 ASR Analytics, Las Vegas-Clark County Urban League Public Computer Center Round 2, 7.
467 ASR Analytics, Las Vegas-Clark County Urban League Public Computer Center Round 2, 9.
468 ASR Analytics, Technology for All, Inc. Public Computer Center Round 2, 8.
469 ASR Analytics, Executive Office of the State of West Virginia Comprehensive Community Infrastructure, 23.
ASR Analytics, MCNC Comprehensive Community Infrastructure, 20.
470 ASR Analytics, MCNC Comprehensive Community Infrastructure, 21.
ASR Analytics, Executive Office of the State of West Virginia Comprehensive Community Infrastructure, 23.

164
471 ASR Analytics, Executive Office of the State of West Virginia Comprehensive Community Infrastructure, 23.
ASR Analytics, MCNC Comprehensive Community Infrastructure, 20.
472 ASR Analytics, MCNC Comprehensive Community Infrastructure, 20.
473 ASR Analytics, MCNC Comprehensive Community Infrastructure, 21.
ASR Analytics, Executive Office of the State of West Virginia Comprehensive Community Infrastructure, 23.
474 ASR Analytics, Executive Office of the State of West Virginia Comprehensive Community Infrastructure, 24.
475 ASR Analytics, MCNC Comprehensive Community Infrastructure, 19.
ASR Analytics, Executive Office of the State of West Virginia Comprehensive Community Infrastructure, 23.
476 ASR Analytics, MCNC Comprehensive Community Infrastructure, 19.
477 ASR Analytics, Executive Office of the State of West Virginia Comprehensive Community Infrastructure, 23.
478 ASR Analytics, Cambridge Housing Authority Public Computer Center Round 2, 23.
ASR Analytics, Cambridge Housing Authority Public Computer Center Round 2, 23.
ASR Analytics, California Emerging Technology Fund Sustainable Broadband Adoption Round 2, 35.
ASR Analytics, Smart Chicago Sustainable Broadband Adoption Round 2, 33.
ASR Analytics, Foundation for California Community Colleges Sustainable Broadband Adoption Round 2, 23.
ASR Analytics, Future Generations Sustainable Broadband Adoption Round 2, 31.
ASR Analytics, C.K. Blandin Foundation Sustainable Broadband Adoption Round 2, 30.
ASR Analytics, Las Vegas-Clark County Urban League Public Computer Center Round 2, 24.
ASR Analytics, “Cambridge Housing Authority Community Computer Centers Public Computer Centers (PCC),” Broadband Technology Opportunities Program Evaluation Study (Order Number D10PD18645) (Potomac, MD, June 18, 2012), 33.
ASR Analytics, “Connect Arkansas Expanding Broadband Use in Arkansas through Education Sustainable Broadband Adoption (SBA),” Broadband Technology Opportunities Program Evaluation Study (Order Number D10PD18645) (Potomac, MD, June 18, 2012), 41.
ASR Analytics, Delaware Department of State (Delaware Division of Libraries) Public Computer Center Round 2, 28.
ASR Analytics, “Technology for All, Inc.: Texas Connects Coalition Public Computer Center (PCC),” Broadband Technology Opportunities Program Evaluation Study (Order Number D10PD18645) (Potomac, MD, June 18, 2012), 36.
ASR Analytics, “Technology for All, Inc.: Texas Connects Coalition Public Computer Center (PCC),” 36.
ASR Analytics, Technology for All, Inc. Public Computer Center Round 2, 23.
165
ASR Analytics, C.K. Blandin Foundation Sustainable Broadband Adoption Round 2, 29.
ASR Analytics, Delaware Department of State (Delaware Division of Libraries) Public Computer Center Round 2, 28.
ASR Analytics, Delaware Department of State (Delaware Division of Libraries) Public Computer Center Round 2, 28.
ASR Analytics, Delaware Department of State (Delaware Division of Libraries) Public Computer Center Round 2, 28.
ASR Analytics, Urban Affairs Coalition Sustainable Broadband Adoption Round 2, 26.)
479 ASR Analytics, “California Emerging Technology Fund: Broadband Awareness and Adoption Sustainable Broadband Adoption (SBA),” Broadband Technology Opportunities Program Evaluation Study (Order Number D10PD18645) (Potomac, MD, June 18, 2012), 61.
ASR Analytics, “California Emerging Technology Fund: Broadband Awareness and Adoption Sustainable Broadband Adoption (SBA),” 61.
ASR Analytics, Smart Chicago Sustainable Broadband Adoption Round 2, 33.
ASR Analytics, “Foundation for California Community Colleges: California Connects Sustainable Broadband Adoption (SBA),” Broadband Technology Opportunities Program Evaluation Study (Order Number D10PD18645) (Potomac, MD, June 18, 2012), 33.
480 ASR Analytics, “Cambridge Housing Authority Community Computer Centers Public Computer Centers (PCC),” 33.
ASR Analytics, Cambridge Housing Authority Public Computer Center Round 2, 23.
481 ASR Analytics, Smart Chicago Sustainable Broadband Adoption Round 2, 34.
ASR Analytics, Technology for All, Inc. Public Computer Center Round 2, 23.
ASR Analytics, Technology for All, Inc. Public Computer Center Round 2, 23.
ASR Analytics, Smart Chicago Sustainable Broadband Adoption Round 2, 33.
482 ASR Analytics, “Cambridge Housing Authority Community Computer Centers Public Computer Centers (PCC),” 33.
ASR Analytics, California Emerging Technology Fund Sustainable Broadband Adoption Round 2, 35.
ASR Analytics, “Connect Arkansas Expanding Broadband Use in Arkansas through Education Sustainable Broadband Adoption (SBA),” 40.
ASR Analytics, Future Generations Sustainable Broadband Adoption Round 2, 31.
ASR Analytics, Connect Arkansas Sustainable Broadband Adoption Round 2, 28.
ASR Analytics, Connect Arkansas Sustainable Broadband Adoption Round 2, 28.
ASR Analytics, Technology for All, Inc. Public Computer Center Round 2, 23.
ASR Analytics, WorkForce West Virginia Public Computer Center Round 2, 28.
ASR Analytics, Foundation for California Community Colleges Sustainable Broadband Adoption Round 2, 23.
483 ASR Analytics, “Cambridge Housing Authority Community Computer Centers Public Computer Centers (PCC),” 33.
166
ASR Analytics, C.K. Blandin Foundation Sustainable Broadband Adoption Round 2, 30.
ASR Analytics, WorkForce West Virginia Public Computer Center Round 2, 28.
ASR Analytics, “Cambridge Housing Authority Community Computer Centers Public Computer Centers (PCC),” 33.
ASR Analytics, Cambridge Housing Authority Public Computer Center Round 2, 24.
ASR Analytics, Urban Affairs Coalition Sustainable Broadband Adoption Round 2, 23.
ASR Analytics, Technology for All, Inc. Public Computer Center Round 2, 23.
ASR Analytics, “Urban Affairs Coalition: Freedom Rings Sustainable Broadband Adoption (SBA),” Broadband Technology Opportunities Program Evaluation Study (Order Number D10PD18645) (Potomac, MD, June 18, 2012), 38.
ASR Analytics, Foundation for California Community Colleges Sustainable Broadband Adoption Round 2, 23.
484 ASR Analytics, Cambridge Housing Authority Public Computer Center Round 2, 23.
ASR Analytics, Urban Affairs Coalition Sustainable Broadband Adoption Round 2, 26.
ASR Analytics, Delaware Department of State (Delaware Division of Libraries) Public Computer Center Round 2, 28.
ASR Analytics, Smart Chicago Sustainable Broadband Adoption Round 2, 33.
ASR Analytics, “Technology for All, Inc.: Texas Connects Coalition Public Computer Center (PCC),” 36.
ASR Analytics, Smart Chicago Sustainable Broadband Adoption Round 2, 33.
485 ASR Analytics, Smart Chicago Sustainable Broadband Adoption Round 2, 33.
ASR Analytics, Michigan State University Public Computer Center Round 2, 26.
ASR Analytics, Smart Chicago Sustainable Broadband Adoption Round 2, 34.
ASR Analytics, Urban Affairs Coalition Sustainable Broadband Adoption Round 2, 26.
486 ASR Analytics, Smart Chicago Sustainable Broadband Adoption Round 2, 34.
ASR Analytics, Connect Arkansas Sustainable Broadband Adoption Round 2, 28.
ASR Analytics, Cambridge Housing Authority Public Computer Center Round 2, 23.
ASR Analytics, Urban Affairs Coalition Sustainable Broadband Adoption Round 2, 26.
487 ASR Analytics, Delaware Department of State (Delaware Division of Libraries) Public Computer Center Round 2, 5, 28.
ASR Analytics, “Future Generations Graduate School: Equipping West Virginia’s Fire and Rescue Squads with Technology and Training to Serve Communities Sustainable Broadband Adoption (SBA),” Broadband Technology Opportunities Program Evaluation Study (Order Number D10PD18645) (Potomac, MD, June 18, 2012), 47.
ASR Analytics, Technology For All, Inc. Public Computer Center Round 2, 24, 35.
ASR Analytics, “Future Generations Graduate School: Equipping West Virginia’s Fire and Rescue Squads with Technology and Training to Serve Communities Sustainable Broadband Adoption (SBA),” 47.
167
ASR Analytics, Cambridge Housing Authority Public Computer Center Round 2, 23.
ASR Analytics, Smart Chicago Sustainable Broadband Adoption Round 2, 34.
488 ASR Analytics, C.K. Blandin Foundation Sustainable Broadband Adoption Round 2, 29.
ASR Analytics, “California Emerging Technology Fund: Broadband Awareness and Adoption Sustainable Broadband Adoption (SBA),” 60.
ASR Analytics, “Florida A&M University: The FAMU Center for Public Computing and Workforce Development Public Computer Center (PCC),” Broadband Technology Opportunities Program Evaluation Study (Order Number D10PD18645) (Potomac, MD, June 18, 2012), 32.
489 ASR Analytics, “C.K. Blandin Foundation: Minnesota Intelligent Rural Communities Sustainable Broadband Adoption (SBA),” Broadband Technology Opportunities Program Evaluation Study (Order Number D10PD18645) (Potomac, MD, June 18, 2012), 46.
ASR Analytics, Smart Chicago Sustainable Broadband Adoption Round 2, 34.
ASR Analytics, “Foundation for California Community Colleges: California Connects Sustainable Broadband Adoption (SBA),” 33.
ASR Analytics, Smart Chicago Sustainable Broadband Adoption Round 2, 34.
490 ASR Analytics, Smart Chicago Sustainable Broadband Adoption Round 2, 33.
ASR Analytics, Florida Agricultural and Mechanical University Public Computer Center Round 2, 23.
ASR Analytics, WorkForce West Virginia Public Computer Center Round 2, 28.
ASR Analytics, “Future Generations Graduate School: Equipping West Virginia’s Fire and Rescue Squads with Technology and Training to Serve Communities Sustainable Broadband Adoption (SBA),” 47.
ASR Analytics, Florida Agricultural and Mechanical University Public Computer Center Round 2, 23.
491 ASR Analytics, “Foundation for California Community Colleges: California Connects Sustainable Broadband Adoption (SBA),” 33.
ASR Analytics, “Las Vegas Clark County Urban League: Access to Computer Technology and Instruction in Online Networking (ACTION) Public Computer Center (PCC),” Broadband Technology Opportunities Program Evaluation Study (Order Number D10PD18645) (Potomac, MD, June 18, 2012), 40.
ASR Analytics, “SC State Board for Technical and Comprehensive Education: Reach for Success Public Computer Centers (PCC),” Broadband Technology Opportunities Program Evaluation Study (Order Number D10PD18645) (Potomac, MD, June 18, 2012), 37.
ASR Analytics, “Urban Affairs Coalition: Freedom Rings Sustainable Broadband Adoption (SBA),” 37.
ASR Analytics, “Foundation for California Community Colleges: California Connects Sustainable Broadband Adoption (SBA),” 33.
ASR Analytics, C.K. Blandin Foundation Sustainable Broadband Adoption Round 2, 30.
ASR Analytics, C.K. Blandin Foundation Sustainable Broadband Adoption Round 2, 29.
ASR Analytics, California Emerging Technology Fund Sustainable Broadband Adoption Round 2, 35.

168
ASR Analytics, “Foundation for California Community Colleges: California Connects Sustainable Broadband Adoption (SBA),” 33.
492 ASR Analytics, “C.K. Blandin Foundation: Minnesota Intelligent Rural Communities Sustainable Broadband Adoption (SBA),” 45.
ASR Analytics, California Emerging Technology Fund Sustainable Broadband Adoption Round 2, 36.
ASR Analytics, Smart Chicago Sustainable Broadband Adoption Round 2, 34.
ASR Analytics, Delaware Department of State (Delaware Division of Libraries) Public Computer Center Round 2, 38.
ASR Analytics, Foundation for California Community Colleges Sustainable Broadband Adoption Round 2, 23.
ASR Analytics, Future Generations Sustainable Broadband Adoption Round 2, 32.
ASR Analytics, “Technology for All, Inc.: Texas Connects Coalition Public Computer Center (PCC),” 36.
493 ASR Analytics, “C.K. Blandin Foundation: Minnesota Intelligent Rural Communities Sustainable Broadband Adoption (SBA),” 45.
ASR Analytics, “C.K. Blandin Foundation: Minnesota Intelligent Rural Communities Sustainable Broadband Adoption (SBA),” 45.
ASR Analytics, C.K. Blandin Foundation Sustainable Broadband Adoption Round 2, 30.
ASR Analytics, C.K. Blandin Foundation Sustainable Broadband Adoption Round 2, 30.
ASR Analytics, C.K. Blandin Foundation Sustainable Broadband Adoption Round 2, 29.
ASR Analytics, “Technology for All, Inc.: Texas Connects Coalition Public Computer Center (PCC),” 36.
ASR Analytics, Smart Chicago Sustainable Broadband Adoption Round 2, 34.
ASR Analytics, South Carolina State Board for Technical and Comprehensive Education Public Computer Center Round 2, 21.
494 ASR Analytics, “Foundation for California Community Colleges: California Connects Sustainable Broadband Adoption (SBA),” 33.
ASR Analytics, Future Generations Sustainable Broadband Adoption Round 2, 32.
495 ASR Analytics, “California Emerging Technology Fund: Broadband Awareness and Adoption Sustainable Broadband Adoption (SBA),” 61.
ASR Analytics, C.K. Blandin Foundation Sustainable Broadband Adoption Round 2, 30.
ASR Analytics, “Cambridge Housing Authority Community Computer Centers Public Computer Centers (PCC),” 33.
ASR Analytics, “Connect Arkansas Expanding Broadband Use in Arkansas through Education Sustainable Broadband Adoption (SBA),” 41.
ASR Analytics, “Foundation for California Community Colleges: California Connects Sustainable Broadband Adoption (SBA),” 33.
ASR Analytics, Foundation for California Community Colleges Sustainable Broadband Adoption Round 2, 23.
169
ASR Analytics, “Urban Affairs Coalition: Freedom Rings Sustainable Broadband Adoption (SBA),” 39.
ASR Analytics, Urban Affairs Coalition Sustainable Broadband Adoption Round 2, 26.
496 ASR Analytics, Smart Chicago Sustainable Broadband Adoption Round 2, 35.
ASR Analytics, Foundation for California Community Colleges Sustainable Broadband Adoption Round 2, 24.
ASR Analytics, Urban Affairs Coalition Sustainable Broadband Adoption Round 2, 26.
ASR Analytics, “California Emerging Technology Fund: Broadband Awareness and Adoption Sustainable Broadband Adoption (SBA),” 61.
ASR Analytics, California Emerging Technology Fund Sustainable Broadband Adoption Round 2, 35.
ASR Analytics, Smart Chicago Sustainable Broadband Adoption Round 2, 35.
497 ASR Analytics, Cambridge Housing Authority Public Computer Center Round 2, 24.
ASR Analytics, “Connect Arkansas Expanding Broadband Use in Arkansas through Education Sustainable Broadband Adoption (SBA),” 40.
ASR Analytics, “Delaware Division of Libraries: Job/Learning Labs Public Computer Center (PCC),” Broadband Technology Opportunities Program Evaluation Study (Order Number D10PD18645) (Potomac, MD, June 18, 2012), 47.
ASR Analytics, California Emerging Technology Fund Sustainable Broadband Adoption Round 2, 36.
ASR Analytics, California Emerging Technology Fund Sustainable Broadband Adoption Round 2, 36.
498 ASR Analytics, Future Generations Sustainable Broadband Adoption Round 2, 31.
ASR Analytics, “Las Vegas Clark County Urban League: Access to Computer Technology and Instruction in Online Networking (ACTION) Public Computer Center (PCC),” 41.
ASR Analytics, Technology for All, Inc. Public Computer Center Round 2, 23.
499 ASR Analytics, C.K. Blandin Foundation Sustainable Broadband Adoption Round 2, 30.
ASR Analytics, “Cambridge Housing Authority Community Computer Centers Public Computer Centers (PCC),” 33.
ASR Analytics, “Las Vegas Clark County Urban League: Access to Computer Technology and Instruction in Online Networking (ACTION) Public Computer Center (PCC),” 41.
ASR Analytics, “Michigan State University: Evidence Based Computer Centers II Public Computer Centers (PCC),” Broadband Technology Opportunities Program Evaluation Study (Order Number D10PD18645) (Potomac, MD, June 18, 2012), 23.
ASR Analytics, Michigan State University Public Computer Center Round 2, 26.
ASR Analytics, Michigan State University Public Computer Center Round 2, 26.
ASR Analytics, Michigan State University Public Computer Center Round 2, 26.
ASR Analytics, “SC State Board for Technical and Comprehensive Education: Reach for Success Public Computer Centers (PCC),” 37.
170
ASR Analytics, “SC State Board for Technical and Comprehensive Education: Reach for Success Public Computer Centers (PCC),” 38.
ASR Analytics, South Carolina State Board for Technical and Comprehensive Education Public Computer Center Round 2, 21.
ASR Analytics, “Technology for All, Inc.: Texas Connects Coalition Public Computer Center (PCC),” 36.
ASR Analytics, “WorkForce West Virginia: One-Stop Public Computer Center Modernization Public Computer Center (PCC),” Broadband Technology Opportunities Program Evaluation Study (Order Number D10PD18645) (Potomac, MD, June 18, 2012), 25.
ASR Analytics, “Las Vegas Clark County Urban League: Access to Computer Technology and Instruction in Online Networking (ACTION) Public Computer Center (PCC),” 41.
ASR Analytics, WorkForce West Virginia Public Computer Center Round 2, 28.
500 ASR Analytics, “Cambridge Housing Authority Community Computer Centers Public Computer Centers (PCC),” 33.
ASR Analytics, Cambridge Housing Authority Public Computer Center Round 2, 23.
ASR Analytics, WorkForce West Virginia Public Computer Center Round 2, 28.
501 ASR Analytics, “California Emerging Technology Fund: Broadband Awareness and Adoption Sustainable Broadband Adoption (SBA),” 61.
ASR Analytics, Florida Agricultural and Mechanical University Public Computer Center Round 2, 23.
ASR Analytics, “SC State Board for Technical and Comprehensive Education: Reach for Success Public Computer Centers (PCC),” 38.
ASR Analytics, “WorkForce West Virginia: One-Stop Public Computer Center Modernization Public Computer Center (PCC),” 26.
502 ASR Analytics, “Connect Arkansas Expanding Broadband Use in Arkansas through Education Sustainable Broadband Adoption (SBA),” 40.
ASR Analytics, “Foundation for California Community Colleges: California Connects Sustainable Broadband Adoption (SBA),” 33.
ASR Analytics, “Future Generations Graduate School: Equipping West Virginia’s Fire and Rescue Squads with Technology and Training to Serve Communities Sustainable Broadband Adoption (SBA),” 46.
ASR Analytics, South Carolina State Board for Technical and Comprehensive Education Public Computer Center Round 2, 21.
ASR Analytics, “Technology for All, Inc.: Texas Connects Coalition Public Computer Center (PCC),” 36.
ASR Analytics, “City of Chicago: Smart Chicago Sustainable Broadband Adoption (SBA),” Broadband Technology Opportunities Program Evaluation Study (Order Number D10PD18645) (Potomac, MD, June 18, 2012), 53.
503 ASR Analytics, “California Emerging Technology Fund: Broadband Awareness and Adoption Sustainable Broadband Adoption (SBA),” 37, 46, 54;

171
ASR Analytics, California Emerging Technology Fund Sustainable Broadband Adoption Round 2, 36.
ASR Analytics, “Connect Arkansas Expanding Broadband Use in Arkansas through Education Sustainable Broadband Adoption (SBA),” 41.
504 ASR Analytics, “City of Chicago: Smart Chicago Sustainable Broadband Adoption (SBA),” 53.
ASR Analytics, “California Emerging Technology Fund: Broadband Awareness and Adoption Sustainable Broadband Adoption (SBA),” 61.
505 ASR Analytics, WorkForce West Virginia Public Computer Center Round 2, 28.
ASR Analytics, C.K. Blandin Foundation Sustainable Broadband Adoption Round 2, 30.
ASR Analytics, C.K. Blandin Foundation Sustainable Broadband Adoption Round 2, 30.
ASR Analytics, “California Emerging Technology Fund: Broadband Awareness and Adoption Sustainable Broadband Adoption (SBA),” 61.
ASR Analytics, California Emerging Technology Fund Sustainable Broadband Adoption Round 2, 35.
ASR Analytics, California Emerging Technology Fund Sustainable Broadband Adoption Round 2, 36.
ASR Analytics, “Future Generations Graduate School: Equipping West Virginia’s Fire and Rescue Squads with Technology and Training to Serve Communities Sustainable Broadband Adoption (SBA),” 46.
ASR Analytics, “Las Vegas Clark County Urban League: Access to Computer Technology and Instruction in Online Networking (ACTION) Public Computer Center (PCC),” 40.
506 ASR Analytics, “Technology for All, Inc.: Texas Connects Coalition Public Computer Center (PCC),” 35.
507 ASR Analytics, “California Emerging Technology Fund: Broadband Awareness and Adoption Sustainable Broadband Adoption (SBA),” 61.
ASR Analytics, “City of Chicago: Smart Chicago Sustainable Broadband Adoption (SBA),” 53;
ASR Analytics, Smart Chicago Sustainable Broadband Adoption Round 2, 35;
ASR Analytics, “Delaware Division of Libraries: Job/Learning Labs Public Computer Center (PCC),” 46;
ASR Analytics, Delaware Department of State (Delaware Division of Libraries) Public Computer Center Round 2, 29.
ASR Analytics, “Future Generations Graduate School: Equipping West Virginia’s Fire and Rescue Squads with Technology and Training to Serve Communities Sustainable Broadband Adoption (SBA),” 46;
ASR Analytics, Future Generations Sustainable Broadband Adoption Round 2, 32;
ASR Analytics, Las Vegas-Clark County Urban League Public Computer Center Round 2, 24;
ASR Analytics, “Michigan State University: Evidence Based Computer Centers II Public Computer Centers (PCC),” 23;
ASR Analytics, South Carolina State Board for Technical and Comprehensive Education Public Computer Center Round 2, 21;
172
ASR Analytics, Technology For All, Inc. Public Computer Center Round 2, 24;
ASR Analytics, Urban Affairs Coalition Sustainable Broadband Adoption Round 2, 27.
508 ASR Analytics, “Delaware Division of Libraries: Job/Learning Labs Public Computer Center (PCC),” 47.
ASR Analytics, “SC State Board for Technical and Comprehensive Education: Reach for Success Public Computer Centers (PCC),” 37.
ASR Analytics, Technology for All, Inc. Public Computer Center Round 2, 24.
ASR Analytics, “City of Chicago: Smart Chicago Sustainable Broadband Adoption (SBA),” 53.
ASR Analytics, Foundation for California Community Colleges Sustainable Broadband Adoption Round 2, 23.
509 ASR Analytics, “California Emerging Technology Fund: Broadband Awareness and Adoption Sustainable Broadband Adoption (SBA),” 61;
ASR Analytics, Smart Chicago Sustainable Broadband Adoption Round 2, 35;
ASR Analytics, Technology For All, Inc. Public Computer Center Round 2, 24.
510 ASR Analytics, WorkForce West Virginia Public Computer Center Round 2, 40; ASR Analytics, Las Vegas-Clark County Urban League Public Computer Center Round 2, 24; Representatives of Chicago Smart Communities, “Interview with Authors,” February 28, 2013.
511 ASR Analytics, University of Arkansas System Comprehensive Community Infrastructure, 28.
ASR Analytics, Clearwave Communications Comprehensive Community Infrastructure, 28.
ASR Analytics, Zayo Group Comprehensive Community Infrastructure, 26.
ASR Analytics, South Dakota Network Comprehensive Community Infrastructure, 29.
512 ASR Analytics, University of Arkansas System Comprehensive Community Infrastructure, 28.
ASR Analytics, Clearwave Communications Comprehensive Community Infrastructure, 28.
ASR Analytics, Massachusetts Technology Park Comprehensive Community Infrastructure, 29.
513 ASR Analytics, University of Arkansas System Comprehensive Community Infrastructure, 28.
ASR Analytics, University of Arkansas System Comprehensive Community Infrastructure, 28.
ASR Analytics, Clearwave Communications Comprehensive Community Infrastructure, 28.
ASR Analytics, Massachusetts Technology Park Comprehensive Community Infrastructure, 29.
ASR Analytics, Mid-Atlantic Broadband Cooperative Comprehensive Community Infrastructure, 21.
ASR Analytics, Merit Network, Inc. Comprehensive Community Infrastructure, 28.
514 ASR Analytics, Clearwave Communications Comprehensive Community Infrastructure, 28.
ASR Analytics, Merit Network, Inc. Comprehensive Community Infrastructure, 29.
515 ASR Analytics, Clearwave Communications Comprehensive Community Infrastructure, 28.
ASR Analytics, Merit Network, Inc. Comprehensive Community Infrastructure, 16.
ASR Analytics, South Dakota Network Comprehensive Community Infrastructure, 16.
ASR Analytics, MCNC Comprehensive Community Infrastructure, 3.

173
516 ASR Analytics, Merit Network, Inc. Comprehensive Community Infrastructure, 29.
517 ASR Analytics, Mid-Atlantic Broadband Cooperative Comprehensive Community Infrastructure, 22.
ASR Analytics, OneCommunity Comprehensive Community Infrastructure, 27.
518 ASR Analytics, Zayo Group Comprehensive Community Infrastructure, 27.
ASR Analytics, Lane Council of Governments Comprehensive Community Infrastructure, 26.
ASR Analytics, MCNC Comprehensive Community Infrastructure, 25.
ASR Analytics, Merit Network, Inc. Comprehensive Community Infrastructure, 28.
ASR Analytics, OSHEAN, Inc. Comprehensive Community Infrastructure, 28.
ASR Analytics, South Dakota Network Comprehensive Community Infrastructure, 28.
519 ASR Analytics, Massachusetts Technology Park Comprehensive Community Infrastructure, 29.
ASR Analytics, Mid-Atlantic Broadband Cooperative Comprehensive Community Infrastructure, 22.
ASR Analytics, Merit Network, Inc. Comprehensive Community Infrastructure, 28.
ASR Analytics, Zayo Group Comprehensive Community Infrastructure, 27.
520 ASR Analytics, Clearwave Communications Comprehensive Community Infrastructure, 28.
ASR Analytics, Lane Council of Governments Comprehensive Community Infrastructure, 25.
ASR Analytics, Mid-Atlantic Broadband Cooperative Comprehensive Community Infrastructure, 21.
ASR Analytics, OneCommunity Comprehensive Community Infrastructure, 27.
521 ASR Analytics, University of Arkansas System Comprehensive Community Infrastructure, 28.
ASR Analytics, Clearwave Communications Comprehensive Community Infrastructure, 24.
ASR Analytics, Lane Council of Governments Comprehensive Community Infrastructure, 26.
ASR Analytics, Massachusetts Technology Park Comprehensive Community Infrastructure, 29.
ASR Analytics, Merit Network, Inc. Comprehensive Community Infrastructure, 29.
ASR Analytics, Executive Office of the State of West Virginia Comprehensive Community Infrastructure, 26.
522 ASR Analytics, BTOP Evaluation Study Design, 2011.
Rural Utilities Service and National Telecommunications and Information Administration, “Broadband Initiatives Program & Broadband Technology Opportunities Program.”
523 Rural Utilities Service and National Telecommunications and Information Administration, “Broadband Initiatives Program & Broadband Technology Opportunities Program.”
524 National Telecommunications and Information Administration, Cambridge Housing Authority Community Computer Centers, BroadbandUSA: Connecting America’s Communities, accessed February 22, 2012, http://www2.ntia.doc.gov/grantees/CambridgeHousingAuthority.
525 ASR Analytics, Cambridge Housing Authority Public Computer Center Round 2, 4.
526 National Telecommunications and Information Administration, City of Chicago SmartChicago Public Computer Centers Fact Sheet, BroadbandUSA: Connecting America’s Communities, August 2010, http://www2.ntia.doc.gov/files/grantees/cityofchicago.pdf.
174
527 ASR Analytics, Smart Chicago Sustainable Broadband Adoption Round 2, 7.
528 National Telecommunications and Information Administration, “Broadband Technology Opportunities Program Notices.”
529 Jonathan E. Nuechterlein and Philip J. Weiser, Digital Crossroads: American Telecommunications Policy in the Internet Age (Cambridge, MA: The MIT Press, 2005).
530 OECD, “Broadband Networks and Open Access,” OECD Digital Economy Papers no. 218 (March 04, 2013).
531 William H. Lehr, Marvin Sirbu, and Sharon Gillett, “Broadband Open Access: Lessons from Municipal Network Case Studies,” 2008.
532 Lehr, Sirbu, and Gillett, “Broadband Open Access: Lessons from Municipal Network Case Studies.”
533 ASR Analytics, Executive Office of the State of West Virginia Comprehensive Community Infrastructure, 25;
ASR Analytics, Merit Network, Inc. Comprehensive Community Infrastructure, 26;
ASR Analytics, OSHEAN, Inc. Comprehensive Community Infrastructure, 23;
ASR Analytics, South Dakota Network Comprehensive Community Infrastructure, 28;
ASR Analytics, Zayo Group Comprehensive Community Infrastructure, 23.
534 ASR Analytics, Clearwave Communications Comprehensive Community Infrastructure, 24;
ASR Analytics, Massachusetts Technology Park Comprehensive Community Infrastructure, 28;
ASR Analytics, MCNC Comprehensive Community Infrastructure, 23;
ASR Analytics, Mid-Atlantic Broadband Cooperative Comprehensive Community Infrastructure, 19;
ASR Analytics, OneCommunity Comprehensive Community Infrastructure, 24;
ASR Analytics, OSHEAN, Inc. Comprehensive Community Infrastructure, 26;
ASR Analytics, South Dakota Network Comprehensive Community Infrastructure, 26.
535 ASR Analytics, Executive Office of the State of West Virginia Comprehensive Community Infrastructure, 25;
ASR Analytics, Lane Council of Governments Comprehensive Community Infrastructure, 21;
ASR Analytics, Merit Network, Inc. Comprehensive Community Infrastructure, 27;
ASR Analytics, University of Arkansas System Comprehensive Community Infrastructure, 23;
ASR Analytics, Zayo Group Comprehensive Community Infrastructure, 25.
536 National Telecommunications and Information Administration, “Post-Award Monitoring (PAM) Database.”
537 The total number of BTOP awards announced by September 30, 2010 was 233. As of June 30, 2013, this number was 224. The resource listed below provides more details about terminated and refused awards.
http://www.ntia.doc.gov/files/ntia/publications/ntia_btop_18th_quarterly_report.pdf
538 National Telecommunications and Information Administration, “Post-Award Monitoring (PAM) Database.”
175
539 National Telecommunications and Information Administration, “Post-Award Monitoring (PAM) Database.”
540 National Telecommunications and Information Administration, “Post-Award Monitoring (PAM) Database.”
541 National Telecommunications and Information Administration, “Post-Award Monitoring (PAM) Database.”
542 National Telecommunications and Information Administration, “Post-Award Monitoring (PAM) Database.”
543 ASR Analytics, Short-Term Economic Impacts Report, Broadband Technology Opportunities Program Evaluation Study (Order Number D10PD18645) (Potomac, MD, September 30, 2013), https://asranalyticsmicrosoftonlinecom-11.sharepoint.microsoftonline.com/projects/NTIA/BTOP/Deliverables/Deliverable O/Short-Term Economic Impacts/Short-Term Economic Impacts Report - Submitted 2013-09-30.pdf.
544 National Telecommunications and Information Administration, “Post-Award Monitoring (PAM) Database.”
545 National Telecommunications and Information Administration, “Florida A&M University The FAMU Center for Public Computing and Workforce Development Fact Sheet,” September 2010, http://www2.ntia.doc.gov/files/grantees/factsheetflfloridaam.pdf.
546 ASR Analytics, Florida Agricultural and Mechanical University Public Computer Center Round 2, 8, 10.
547 National Telecommunications and Information Administration, “Connect Arkansas Expanding Broadband Use in Arkansas Through Education Fact Sheet,” Broadband USA Connecting America’s Communities, 2010, http://www2.ntia.doc.gov/files/grantees/factsheetarconnectarkansas.pdf.
548 ASR Analytics, Connect Arkansas Sustainable Broadband Adoption Round 2, 30.
549 ASR Analytics, Mid-Atlantic Broadband Cooperative Comprehensive Community Infrastructure, 24.
550 The Recovery Accountability and Transparency Board, “Recovery API,” Recovery.gov (Washington, DC, March 20, 2013), http://www.recovery.gov/FAQ/Developer/Pages/RecoveryAPI.aspx.
551 Recovery.org provides the following guidance and example for calculating grant-funded jobs:
1. If a normal full-time schedule is 40 hours a week, multiply 40 hours x 52 weeks = 2,080 Total Hours per year.
2. Divide 2,080 Total Hours by 4 to equal 520 regular quarterly hours.
3. If two full-time employees each worked 520 hours (1,040 hours) for the quarter and another half-time employee worked 260 hours, the Total Hours for the three employees is 1300 (520 + 520 + 260 = 1300).
4. Divide 1300 by 520 to equal 2.5 Recovery funded jobs during that quarter.
For more information, visit http://www.recovery.gov/News/featured/Pages/Calculator.aspx
552 ASR Analytics, Technology for All, Inc. Public Computer Center Round 2, 17.
553 ASR Analytics, Urban Affairs Coalition Sustainable Broadband Adoption Round 2, 6.
554 ASR Analytics, Clearwave Communications Comprehensive Community Infrastructure, 19.
176
555 National Telecommunications and Information Administration, “Statement of Work for Broadband Technology Opportunities Program (BTOP) Evaluation Study,” July 26, 2010.
556 National Telecommunications and Information Administration, “Statement of Work for Broadband Technology Opportunities Program (BTOP) Evaluation Study,” July 26, 2010.
557 Suffolk County, Massachusetts was removed from the service area because it contained no connected CAIs and is different from the listed counties in size and demographic makeup.
558 All service area counties were determined by connected CAI locations and BTOP-funded fiber routes.
559 National Telecommunications and Information Administration, “Application Search,” Broadband USA, 2014, http://www.ntia.doc.gov/legacy/broadbandgrants/applications/results.htm.
560 National Telecommunications and Information Administration, “NTIA’s BTOP Map,” Connecting America’s Communities (Washington, DC, August 15, 2013), http://www2.ntia.doc.gov/BTOPmap/; United States Census Bureau, “2010 TIGER/Line® Shapefiles” (Washington, DC, June 19, 2012), http://www.census.gov/geo/www/cob/cbf_counties.html.
561 1,269 counties fell within the service area of an awarded BTOP grant only, 183 fell within a BIP service area only, and 292 fell within both a BTOP and BIP service area for a total of 1,744 unique counties.
562 Sharon E. Gillett et al., Measuring Broadband’s Economic Impact, National Technical Assistance, Training, Research, and Evaluation Project #99-07-13829 (Washington, DC: United States Department of Commerce, February 28, 2006), http://cfp.mit.edu/publications/CFP_Papers/Measuring_bb_econ_impact-final.pdf.
563 National Telecommunications and Information Administration and Federal Communications Commission, “State Broadband Initiative,” February 12, 2014.
564 National Telecommunications and Information Administration and Federal Communications Commission, “State Broadband Initiative.”
565 National Telecommunications and Information Administration and Federal Communications Commission, “State Broadband Initiative.”
566 National Telecommunications and Information Administration and Federal Communications Commission, “State Broadband Initiative.”
567 Economics and Statistics Administration and National Telecommunications and Information Administration, Exploring the Digital Nation: Computer and Internet Use at Home (United States Department of Commerce, November 09, 2011), http://www.ntia.doc.gov/report/2011/exploring-digital-nation-computer-and-internet-use-home.
568 ASR Analytics, Progress towards BTOP Goals: Interim Report on PCC and SBA Case Studies, Broadband Technology Opportunities Program Evaluation Study (Order Number D10PD18645) (Potomac, MD, October 15, 2012), http://www.ntia.doc.gov/report/2012/progress-towards-btop-goals-interim-report-pcc-and-sba-case-studies.
National Telecommunications and Information Administration, “Broadband Technology Opportunities Program Notices.”
569 Peter Stenberg et al., Broadband Internet’s Value for Rural America, ERR-78 (Washington, DC: United States Department of Agriculture Economic Research Service, August 2009), 9–10, http://www.ers.usda.gov/publications/err-economic-research-report/err78.aspx.
570 As implemented in the Match function in the Matching package for R.

177
Gillett et al., Measuring Broadband’s Economic Impact.
Jasjeet S. Sekhon, “Multivariate and Propensity Score Matching Software with Automated Balance Optimization: The Matching Package for R,” Journal of Statistical Software 42, no. 7 (June 2011).
R Development Core Team, R: A Language and Environment for Statistical Computing (Vienna, Austria, 2012), http://www.r-project.org/.
571 Similarity in matching is the inverse of the distance between two sets of observations. The evaluation study team uses the Mahalanobis distance metric to calculate the distances between treatment counties and all possible control counties.
572 Broadband availability and rural percentage of population are the county-level aggregate statistics described in Section 10.6.1. The natural logarithm of population was used because the untransformed population is very non-normally distributed. The rural county binary variable takes the value of one where a county has a 100 percent rural population and zero otherwise.
573 The natural logarithm of population was used because the untransformed population is very non-normally distributed. A constant restriction (i.e., one-half standard deviation) on the log value also translates to a variable restriction on the population value. That is, the restriction is tighter the lower the population and looser the higher the population
574 Andrew Gelman and Jennifer Hill, “Causal Inference Using More Advanced Models,” in Data Analysis Using Regression and Multilevel/Hierarchical Models (Cambridge, MA: Cambridge University Press, 2006), 199–233, doi:10.1017/CBO9780511790942.
575 Nearest neighbor matching with replacement was used. This allows a control county to be matched to more than one treatment county.
576 ASR Analytics, Progress towards BTOP Goals: Interim Report on PCC and SBA Case Studies.
577 United States Census Bureau, 2010 Census Summary File 1, vol. 3 (Washington, DC, March 2012), http://www.census.gov/prod/cen2010/doc/sf1.pdf#page=474.
578 United States Census Bureau, 2010 Census Summary File 1; United States Census Bureau, “2006-2010 ACS 5-Year Summary File,” American Community Survey (Washington, DC, December 08, 2011), http://www.census.gov/acs/www/data_documentation/2010_release/.
United States Census Bureau, “2006-2010 ACS 5-Year Summary File.”
579 ASR Analytics, Study Design, Broadband Technology Opportunities Program Evaluation Study (Order Number D10PD18645) (Potomac, MD, March 25, 2011).
580 Crandall, Lehr, and Litan, The Effects of Broadband Deployment on Output and Employment: A Cross-Sectional Analysis of U.S. Data.
581 Kolko, “Broadband and Local Growth.”
582 Nina Czernich et al., “Broadband Infrastructure and Economic Growth,” The Economic Journal 121, no. 552 (May 12, 2011): 505–532, doi:10.1111/j.1468-0297.2011.02420.x.
583 A.T. Kearney, Assessing the Economic Benefits of Digital Inclusion, 2011, http://www.infoxchange.net.au/sites/default/files/Assessing the economic benefits of digital inclusion_0.pdf.
584 Peter Kuhn and Hani Mansour, “Is Internet Job Search Still Ineffective?,” Forthcoming in The Economic Journal (December 2013), doi:10.1111/ecoj.12119.
585 Sharon Eisner Gillett et al., Measuring the Economic Impact of Broadband Deployment, National Technical Assistance, Training, Research, and Evaluation Project #99-07-13829
178
(Washington, DC: United States Department of Commerce, February 28, 2006), http://cfp.mit.edu/publications/CFP_Papers/Measuring_bb_econ_impact-final.pdf.
586 Arthur Grimes, Cleo Ren, and Phillip Stevens, “The Need for Speed: Impacts of Internet Connectivity on Firm Productivity” (2009), http://papers.ssrn.com/sol3/papers.cfm?abstract_id=1604247.
587 LECG Ltd., Economic Impact of Broadband: An Empirical Study (London, UK, February 22, 2009), http://www.connectivityscorecard.org/images/uploads/media/Report_BroadbandStudy_LECG_March6.pdf.
588 Peter Dolton and Panu Pelkonen, The Impact of Computer Use, Computer Skills and Computer Use Intensity: Evidence from WERS 2004 (London, August 2007), http://eprints.lse.ac.uk/19389/.
589 H. Scott Matthews and Eric Williams, “Telework Adoption and Energy Use in Building and Transport Sectors in the United States and Japan,” Journal of Infrastructure Systems 11, no. 1 (March 2005): 21–30, doi:10.1061/(ASCE)1076-0342(2005)11:1(21).
590 Alexander J.A.M. van Deursen, “Internet Skills: Vital Assets in an Information Society” (Enschede, The Netherlands: University of Twente, November 01, 2010), doi:10.3990/1.9789036530866.
591 P. DiMaggio and B. Bonikowski, “Make Money Surfing the Web? The Impact of Internet Use on the Earnings of U.S. Workers,” American Sociological Review 73, no. 2 (April 01, 2008): 227–250, doi:10.1177/000312240807300203.
592 Connected Nation, The Economic Impact of Stimulating Broadband Nationally, February 21, 2008, http://www.connectednation.org/_documents/connected_nation_eis_study_full_report_02212008.pdf.
593 Digital Impact Group, “The Economic Impact of Digital Exclusion” 19104, no. 215 (2010), http://www.econsult.com/articles/030810_costofexclusion.pdf.
594 Laurence Baker et al., “Effect of an Internet-Based System for Doctor-Patient Communication on Health Care Spending,” Journal of the American Medical Informatics Association 12, no. 5 (2005): 530–6, doi:10.1197/jamia.M1778.
595 Catherine Klersy et al., “Economic Impact of Remote Patient Monitoring: An Integrated Economic Model Derived from a Meta-Analysis of Randomized Controlled Trials in Heart Failure,” European Journal of Heart Failure 13, no. 4 (April 2011): 450–9, doi:10.1093/eurjhf/hfq232.
596 George S. Ford and Sherry G. Ford, “Internet Use and Depression Among the Elderly,” October 2009, http://www.phoenix-center.org/pcpp/PCPP38Final.pdf.
597 Lance Brendan Young et al., “Impact of Telemedicine Intensive Care Unit Coverage on Patient Outcomes: A Systematic Review and Meta-Analysis,” Archives of Internal Medicine 171, no. 6 (March 28, 2011): 498–506, doi:10.1001/archinternmed.2011.61.
598 PriceWaterhouseCoopers, Champion for Digital Inclusion: The Economic Case for Digital Inclusion, October 2009, http://www.parliamentandinternet.org.uk/uploads/Final_report.pdf.
599 A.T. Kearney, Assessing the Economic Benefits of Digital Inclusion.
600 SQW Consulting, Broadband in the Home: An Analysis of the Financial Costs and Benefits, Final Report to the Post Office, September 18, 2008, http://www.sqw.co.uk/files/8713/8712/1234/83.pdf.

179
601 The Allen Consulting Group, Quantifying the Possible Economic Gains of Getting More Australian Households Online, November 2010, http://www.acilallen.com.au/cms_files/acgquantifyingonline2010.pdf.
602 D.J. Richardson, J.M. Fini, and L.E. Nelson, “Space Division Multiplexing in Optical Fibres,” March 15, 2013, http://arxiv.org/abs/1303.3908.

180
Glossary Acronym Definition
ACA Affordable Care Act
ACS American Community Survey
ACTION Access to Computer Technology and Instruction in Online Networking
AFN Austin Free-Net
AISD Austin Independent School District
ALEKS Assessment and Learning in Knowledge Spaces
APEX Advancement through Pardons and Expungement
APR Annual Performance Progress Report
AR SAVES Arkansas Stroke Assistance through Virtual Emergency Support
ASR ASR Analytics, LLC
ATA American Telemedicine Association
BAA Broadband Awareness and Adoption
BIP Broadband Initiatives Program
BPL Bridgeport Public Library
BRN Business Resource Network
BTOP Broadband Technology Opportunities Program
C.K. Blandin C. K. Blandin Foundation
CAE Christina Adult Education
CAI Community anchor institution
CCC California Community College
CCI Comprehensive Community Infrastructure
CCP Community College of Philadelphia
CCRI Community College of Rhode Island
CETF California Emerging Technology Fund
CforAT Center for Accessible Technology
CHA Cambridge Housing Authority
Clearwave Clearwave Communications
CPCWD Center for Public Computing and Workforce Development
CPS Chicago Public Schools
CPUC California Public Utilities Commission
DDL Delaware Division of Libraries
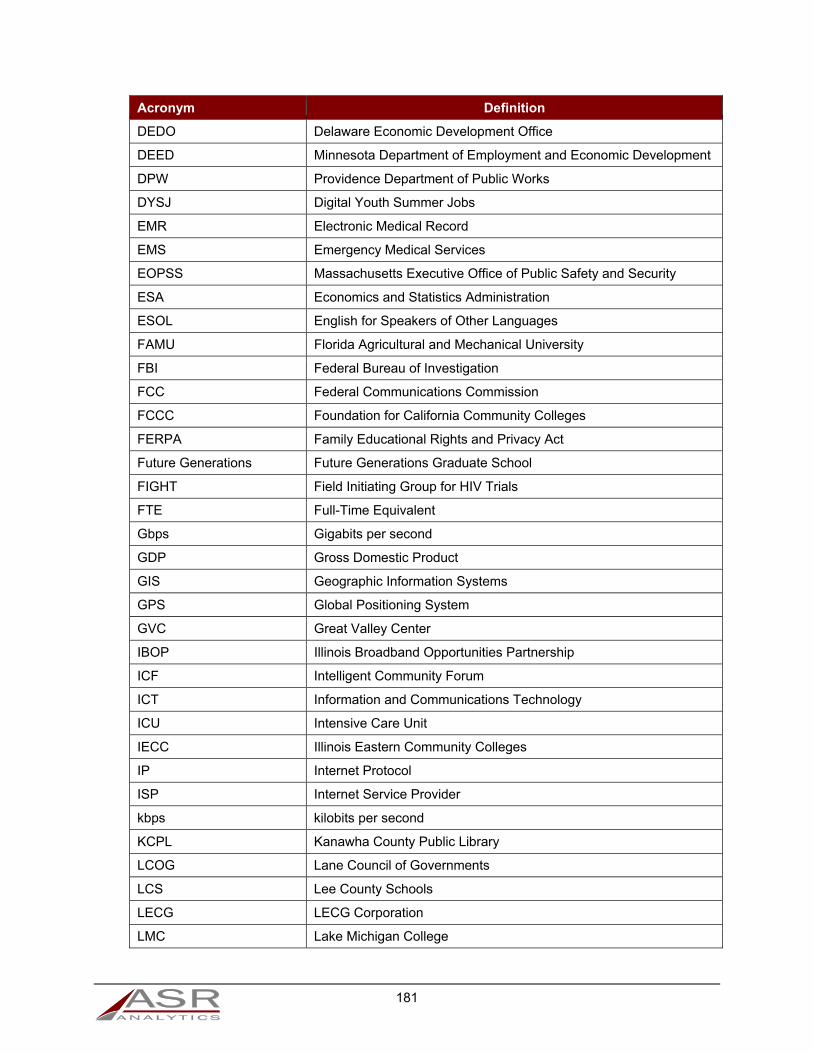
181
Acronym Definition
DEDO Delaware Economic Development Office
DEED Minnesota Department of Employment and Economic Development
DPW Providence Department of Public Works
DYSJ Digital Youth Summer Jobs
EMR Electronic Medical Record
EMS Emergency Medical Services
EOPSS Massachusetts Executive Office of Public Safety and Security
ESA Economics and Statistics Administration
ESOL English for Speakers of Other Languages
FAMU Florida Agricultural and Mechanical University
FBI Federal Bureau of Investigation
FCC Federal Communications Commission
FCCC Foundation for California Community Colleges
FERPA Family Educational Rights and Privacy Act
Future Generations Future Generations Graduate School
FIGHT Field Initiating Group for HIV Trials
FTE Full-Time Equivalent
Gbps Gigabits per second
GDP Gross Domestic Product
GIS Geographic Information Systems
GPS Global Positioning System
GVC Great Valley Center
IBOP Illinois Broadband Opportunities Partnership
ICF Intelligent Community Forum
ICT Information and Communications Technology
ICU Intensive Care Unit
IECC Illinois Eastern Community Colleges
IP Internet Protocol
ISP Internet Service Provider
kbps kilobits per second
KCPL Kanawha County Public Library
LCOG Lane Council of Governments
LCS Lee County Schools
LECG LECG Corporation
LMC Lake Michigan College
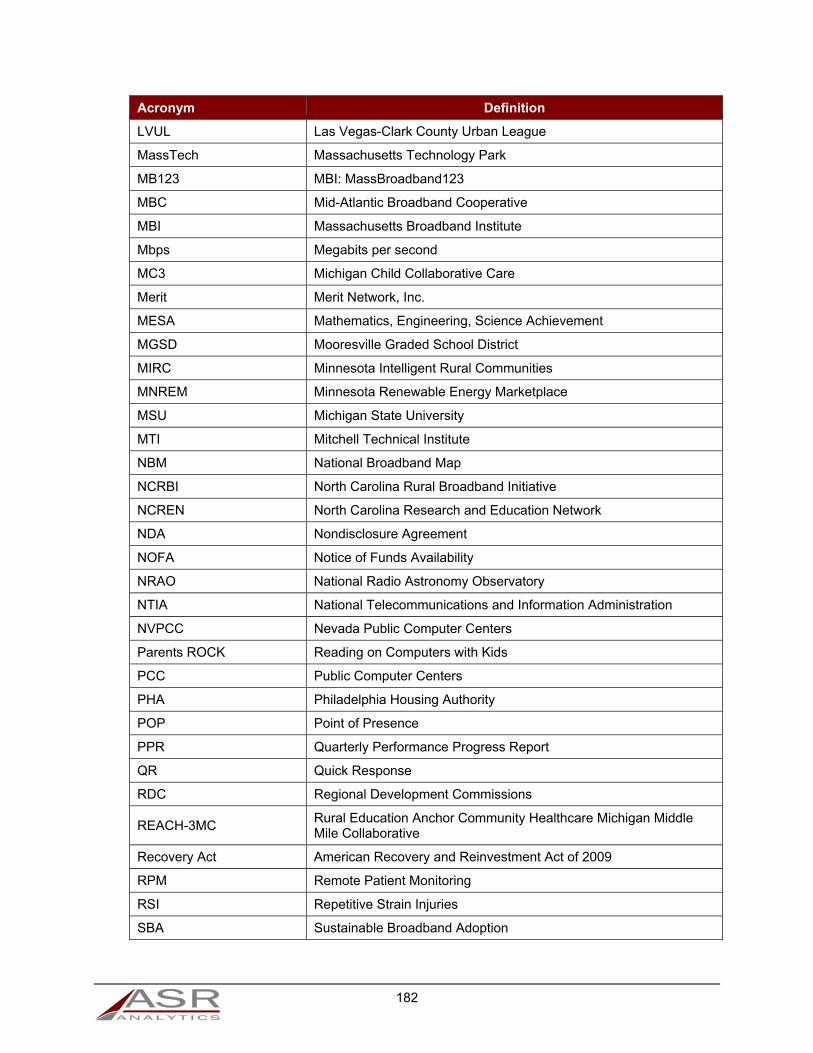
182
Acronym Definition
LVUL Las Vegas-Clark County Urban League
MassTech Massachusetts Technology Park
MB123 MBI: MassBroadband123
MBC Mid-Atlantic Broadband Cooperative
MBI Massachusetts Broadband Institute
Mbps Megabits per second
MC3 Michigan Child Collaborative Care
Merit Merit Network, Inc.
MESA Mathematics, Engineering, Science Achievement
MGSD Mooresville Graded School District
MIRC Minnesota Intelligent Rural Communities
MNREM Minnesota Renewable Energy Marketplace
MSU Michigan State University
MTI Mitchell Technical Institute
NBM National Broadband Map
NCRBI North Carolina Rural Broadband Initiative
NCREN North Carolina Research and Education Network
NDA Nondisclosure Agreement
NOFA Notice of Funds Availability
NRAO National Radio Astronomy Observatory
NTIA National Telecommunications and Information Administration
NVPCC Nevada Public Computer Centers
Parents ROCK Reading on Computers with Kids
PCC Public Computer Centers
PHA Philadelphia Housing Authority
POP Point of Presence
PPR Quarterly Performance Progress Report
QR Quick Response
RDC Regional Development Commissions
REACH-3MC Rural Education Anchor Community Healthcare Michigan Middle Mile Collaborative
Recovery Act American Recovery and Reinvestment Act of 2009
RPM Remote Patient Monitoring
RSI Repetitive Strain Injuries
SBA Sustainable Broadband Adoption

183
Acronym Definition
SCMW South Central Michigan Works
SCTCS South Carolina Technical College System
SDN South Dakota Network, LLC
SIH Southern Illinois Healthcare
SIRN State Interoperable Radio Network
SNAP Supplemental Nutrition Assistance Program
TANF Temporary Assistance for Needy Families
TFA Technology for All
TMLP Taunton Municipal Lighting Plant
UAC Urban Affairs Coalition
UAMS University of Arkansas for Medical Sciences
UAS University of Arkansas System
UDWI Utilities District of Western Indiana
UME University of Minnesota Extension
UNCP University of North Carolina at Pembroke
VoIP Voice over Internet Protocol
WAN Wide Area Network
West Virginia Executive Office of the State of West Virginia
WFWV WorkForce West Virginia
WIC Women, Infants, and Children
WVDE West Virginia Department of Education
WVDELI West Virginia Digital Entertainment Library Initiative
WVU West Virginia University
Zayo Zayo Bandwidth, LLC
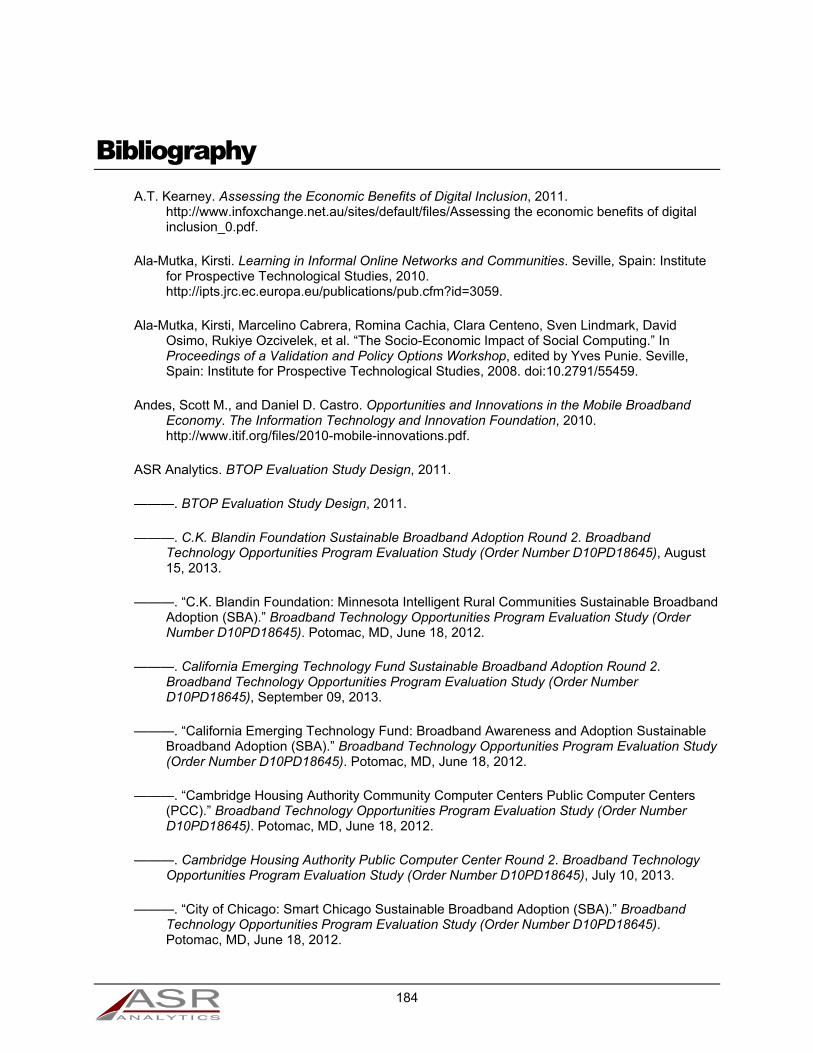
184
Bibliography A.T. Kearney. Assessing the Economic Benefits of Digital Inclusion, 2011.
http://www.infoxchange.net.au/sites/default/files/Assessing the economic benefits of digital inclusion_0.pdf.
Ala-Mutka, Kirsti. Learning in Informal Online Networks and Communities. Seville, Spain: Institute for Prospective Technological Studies, 2010. http://ipts.jrc.ec.europa.eu/publications/pub.cfm?id=3059.
Ala-Mutka, Kirsti, Marcelino Cabrera, Romina Cachia, Clara Centeno, Sven Lindmark, David Osimo, Rukiye Ozcivelek, et al. “The Socio-Economic Impact of Social Computing.” In Proceedings of a Validation and Policy Options Workshop, edited by Yves Punie. Seville, Spain: Institute for Prospective Technological Studies, 2008. doi:10.2791/55459.
Andes, Scott M., and Daniel D. Castro. Opportunities and Innovations in the Mobile Broadband Economy. The Information Technology and Innovation Foundation, 2010. http://www.itif.org/files/2010-mobile-innovations.pdf.
ASR Analytics. BTOP Evaluation Study Design, 2011.
———. BTOP Evaluation Study Design, 2011.
———. C.K. Blandin Foundation Sustainable Broadband Adoption Round 2. Broadband Technology Opportunities Program Evaluation Study (Order Number D10PD18645), August 15, 2013.
———. “C.K. Blandin Foundation: Minnesota Intelligent Rural Communities Sustainable Broadband Adoption (SBA).” Broadband Technology Opportunities Program Evaluation Study (Order Number D10PD18645). Potomac, MD, June 18, 2012.
———. California Emerging Technology Fund Sustainable Broadband Adoption Round 2. Broadband Technology Opportunities Program Evaluation Study (Order Number D10PD18645), September 09, 2013.
———. “California Emerging Technology Fund: Broadband Awareness and Adoption Sustainable Broadband Adoption (SBA).” Broadband Technology Opportunities Program Evaluation Study (Order Number D10PD18645). Potomac, MD, June 18, 2012.
———. “Cambridge Housing Authority Community Computer Centers Public Computer Centers (PCC).” Broadband Technology Opportunities Program Evaluation Study (Order Number D10PD18645). Potomac, MD, June 18, 2012.
———. Cambridge Housing Authority Public Computer Center Round 2. Broadband Technology Opportunities Program Evaluation Study (Order Number D10PD18645), July 10, 2013.
———. “City of Chicago: Smart Chicago Sustainable Broadband Adoption (SBA).” Broadband Technology Opportunities Program Evaluation Study (Order Number D10PD18645). Potomac, MD, June 18, 2012.

185
———. Clearwave Communications Comprehensive Community Infrastructure. Broadband Technology Opportunities Program Evaluation Study (Order Number D10PD18645), December 03, 2013.
———. “Connect Arkansas Expanding Broadband Use in Arkansas through Education Sustainable Broadband Adoption (SBA).” Broadband Technology Opportunities Program Evaluation Study (Order Number D10PD18645). Potomac, MD, June 18, 2012.
———. Connect Arkansas Sustainable Broadband Adoption Round 2. Broadband Technology Opportunities Program Evaluation Study (Order Number D10PD18645), September 10, 2013.
———. Delaware Department of State (Delaware Division of Libraries) Public Computer Center Round 2. Broadband Technology Opportunities Program Evaluation Study (Order Number D10PD18645), December 19, 2013.
———. “Delaware Division of Libraries: Job/Learning Labs Public Computer Center (PCC).” Broadband Technology Opportunities Program Evaluation Study (Order Number D10PD18645). Potomac, MD, June 18, 2012.
———. Executive Office of the State of West Virginia Comprehensive Community Infrastructure. Broadband Technology Opportunities Program Evaluation Study (Order Number D10PD18645), March 25, 2014.
———. “Florida A&M University: The FAMU Center for Public Computing and Workforce Development Public Computer Center (PCC).” Broadband Technology Opportunities Program Evaluation Study (Order Number D10PD18645). Potomac, MD, June 18, 2012.
———. Florida Agricultural and Mechanical University Public Computer Center Round 2. Broadband Technology Opportunities Program Evaluation Study (Order Number D10PD18645), September 13, 2013.
———. Foundation for California Community Colleges Sustainable Broadband Adoption Round 2. Broadband Technology Opportunities Program Evaluation Study (Order Number D10PD18645), September 12, 2013.
———. “Foundation for California Community Colleges: California Connects Sustainable Broadband Adoption (SBA).” Broadband Technology Opportunities Program Evaluation Study (Order Number D10PD18645). Potomac, MD, June 18, 2012.
———. “Future Generations Graduate School: Equipping West Virginia’s Fire and Rescue Squads with Technology and Training to Serve Communities Sustainable Broadband Adoption (SBA).” Broadband Technology Opportunities Program Evaluation Study (Order Number D10PD18645). Potomac, MD, June 18, 2012.
———. Future Generations Sustainable Broadband Adoption Round 2. Broadband Technology Opportunities Program Evaluation Study (Order Number D10PD18645), August 08, 2013.
———. Lane Council of Governments Comprehensive Community Infrastructure. Broadband Technology Opportunities Program Evaluation Study (Order Number D10PD18645), April 04, 2014.
———. “Las Vegas Clark County Urban League: Access to Computer Technology and Instruction in Online Networking (ACTION) Public Computer Center (PCC).” Broadband Technology

186
Opportunities Program Evaluation Study (Order Number D10PD18645). Potomac, MD, June 18, 2012.
———. Las Vegas-Clark County Urban League Public Computer Center Round 2. Broadband Technology Opportunities Program Evaluation Study (Order Number D10PD18645), August 01, 2013.
———. Massachusetts Technology Park Comprehensive Community Infrastructure. Broadband Technology Opportunities Program Evaluation Study (Order Number D10PD18645), March 19, 2014.
———. MCNC Comprehensive Community Infrastructure. Broadband Technology Opportunities Program Evaluation Study (Order Number D10PD18645), March 04, 2014.
———. Merit Network, Inc. Comprehensive Community Infrastructure. Broadband Technology Opportunities Program Evaluation Study (Order Number D10PD18645), March 04, 2014.
———. Michigan State University Public Computer Center Round 2. Broadband Technology Opportunities Program Evaluation Study (Order Number D10PD18645), August 29, 2013.
———. “Michigan State University: Evidence Based Computer Centers II Public Computer Centers (PCC).” Broadband Technology Opportunities Program Evaluation Study (Order Number D10PD18645). Potomac, MD, June 18, 2012.
———. Mid-Atlantic Broadband Cooperative Comprehensive Community Infrastructure. Broadband Technology Opportunities Program Evaluation Study (Order Number D10PD18645), February 06, 2014.
———. OneCommunity Comprehensive Community Infrastructure. Broadband Technology Opportunities Program Evaluation Study (Order Number D10PD18645), April 21, 2014.
———. OSHEAN, Inc. Comprehensive Community Infrastructure. Broadband Technology Opportunities Program Evaluation Study (Order Number D10PD18645), March 10, 2014.
———. Progress towards BTOP Goals: Interim Report on PCC and SBA Case Studies. Broadband Technology Opportunities Program Evaluation Study (Order Number D10PD18645). Potomac, MD, October 15, 2012. http://www.ntia.doc.gov/report/2012/progress-towards-btop-goals-interim-report-pcc-and-sba-case-studies.
———. “SC State Board for Technical and Comprehensive Education: Reach for Success Public Computer Centers (PCC).” Broadband Technology Opportunities Program Evaluation Study (Order Number D10PD18645). Potomac, MD, June 18, 2012.
———. Short-Term Economic Impacts Report. Broadband Technology Opportunities Program Evaluation Study (Order Number D10PD18645). Potomac, MD, September 30, 2013. https://asranalyticsmicrosoftonlinecom-11.sharepoint.microsoftonline.com/projects/NTIA/BTOP/Deliverables/Deliverable O/Short-Term Economic Impacts/Short-Term Economic Impacts Report - Submitted 2013-09-30.pdf.
———. Smart Chicago Sustainable Broadband Adoption Round 2. Broadband Technology Opportunities Program Evaluation Study (Order Number D10PD18645), July 10, 2013.

187
———. South Carolina State Board for Technical and Comprehensive Education Public Computer Center Round 2. Broadband Technology Opportunities Program Evaluation Study (Order Number D10PD18645), September 11, 2013.
———. South Dakota Network Comprehensive Community Infrastructure. Broadband Technology Opportunities Program Evaluation Study (Order Number D10PD18645), February 05, 2014.
———. Study Design. Broadband Technology Opportunities Program Evaluation Study (Order Number D10PD18645). Potomac, MD, March 25, 2011.
———. Technology for All, Inc. Public Computer Center Round 2. Broadband Technology Opportunities Program Evaluation Study (Order Number D10PD18645), September 16, 2013.
———. “Technology for All, Inc.: Texas Connects Coalition Public Computer Center (PCC).” Broadband Technology Opportunities Program Evaluation Study (Order Number D10PD18645). Potomac, MD, June 18, 2012.
———. University of Arkansas System Comprehensive Community Infrastructure. Broadband Technology Opportunities Program Evaluation Study (Order Number D10PD18645), March 11, 2014.
———. Urban Affairs Coalition Sustainable Broadband Adoption Round 2. Broadband Technology Opportunities Program Evaluation Study (Order Number D10PD18645), September 10, 2013.
———. “Urban Affairs Coalition: Freedom Rings Sustainable Broadband Adoption (SBA).” Broadband Technology Opportunities Program Evaluation Study (Order Number D10PD18645). Potomac, MD, June 18, 2012.
———. WorkForce West Virginia Public Computer Center Round 2. Broadband Technology Opportunities Program Evaluation Study (Order Number D10PD18645), September 23, 2013.
———. “WorkForce West Virginia: One-Stop Public Computer Center Modernization Public Computer Center (PCC).” Broadband Technology Opportunities Program Evaluation Study (Order Number D10PD18645). Potomac, MD, June 18, 2012.
———. Zayo Group Comprehensive Community Infrastructure. Broadband Technology Opportunities Program Evaluation Study (Order Number D10PD18645), February 06, 2014.
Atkinson, Robert D., and Daniel D. Castro. Digital Quality of Life: Understanding the Personal and Social Benefits of the Information Technology Revolution. Washington, DC: Information Technology and Information Foundation, October 01, 2008. http://www.itif.org/files/DQOL.pdf.
———. Digital Quality of Life: Understanding the Personal and Social Benefits of the Information Technology Revolution. Washington, DC: Information Technology and Information Foundation, October 01, 2008. http://www.itif.org/files/DQOL.pdf.
Atkinson, Robert D., Stephen J. Ezell, Scott M. Andes, Daniel D. Castro, and Richard Bennett. The Internet Economy 25 Years After .com: Transforming Commerce & Life. Washington, DC: Information Technology and Innovation Foundation, March 15, 2010. http://www.itif.org/publications/internet-economy-25-years-after-com.
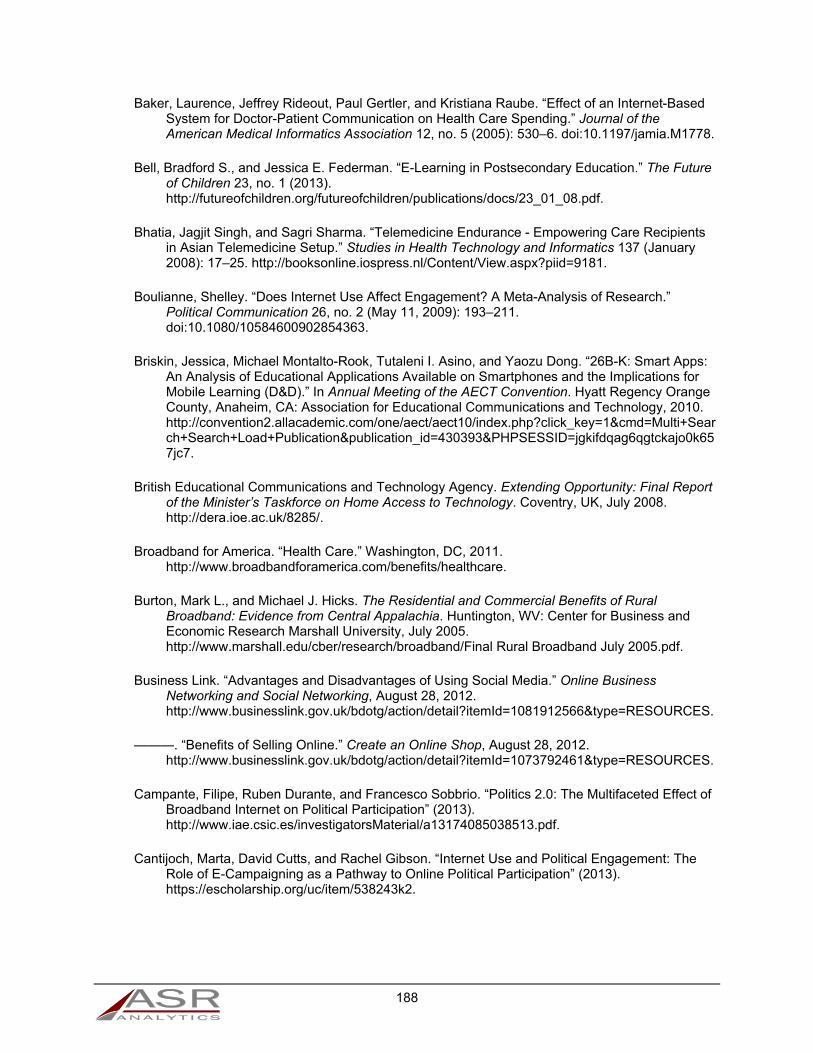
188
Baker, Laurence, Jeffrey Rideout, Paul Gertler, and Kristiana Raube. “Effect of an Internet-Based System for Doctor-Patient Communication on Health Care Spending.” Journal of the American Medical Informatics Association 12, no. 5 (2005): 530–6. doi:10.1197/jamia.M1778.
Bell, Bradford S., and Jessica E. Federman. “E-Learning in Postsecondary Education.” The Future of Children 23, no. 1 (2013). http://futureofchildren.org/futureofchildren/publications/docs/23_01_08.pdf.
Bhatia, Jagjit Singh, and Sagri Sharma. “Telemedicine Endurance - Empowering Care Recipients in Asian Telemedicine Setup.” Studies in Health Technology and Informatics 137 (January 2008): 17–25. http://booksonline.iospress.nl/Content/View.aspx?piid=9181.
Boulianne, Shelley. “Does Internet Use Affect Engagement? A Meta-Analysis of Research.” Political Communication 26, no. 2 (May 11, 2009): 193–211. doi:10.1080/10584600902854363.
Briskin, Jessica, Michael Montalto-Rook, Tutaleni I. Asino, and Yaozu Dong. “26B-K: Smart Apps: An Analysis of Educational Applications Available on Smartphones and the Implications for Mobile Learning (D&D).” In Annual Meeting of the AECT Convention. Hyatt Regency Orange County, Anaheim, CA: Association for Educational Communications and Technology, 2010. http://convention2.allacademic.com/one/aect/aect10/index.php?click_key=1&cmd=Multi+Search+Search+Load+Publication&publication_id=430393&PHPSESSID=jgkifdqag6qgtckajo0k657jc7.
British Educational Communications and Technology Agency. Extending Opportunity: Final Report of the Minister’s Taskforce on Home Access to Technology. Coventry, UK, July 2008. http://dera.ioe.ac.uk/8285/.
Broadband for America. “Health Care.” Washington, DC, 2011. http://www.broadbandforamerica.com/benefits/healthcare.
Burton, Mark L., and Michael J. Hicks. The Residential and Commercial Benefits of Rural Broadband: Evidence from Central Appalachia. Huntington, WV: Center for Business and Economic Research Marshall University, July 2005. http://www.marshall.edu/cber/research/broadband/Final Rural Broadband July 2005.pdf.
Business Link. “Advantages and Disadvantages of Using Social Media.” Online Business Networking and Social Networking, August 28, 2012. http://www.businesslink.gov.uk/bdotg/action/detail?itemId=1081912566&type=RESOURCES.
———. “Benefits of Selling Online.” Create an Online Shop, August 28, 2012. http://www.businesslink.gov.uk/bdotg/action/detail?itemId=1073792461&type=RESOURCES.
Campante, Filipe, Ruben Durante, and Francesco Sobbrio. “Politics 2.0: The Multifaceted Effect of Broadband Internet on Political Participation” (2013). http://www.iae.csic.es/investigatorsMaterial/a13174085038513.pdf.
Cantijoch, Marta, David Cutts, and Rachel Gibson. “Internet Use and Political Engagement: The Role of E-Campaigning as a Pathway to Online Political Participation” (2013). https://escholarship.org/uc/item/538243k2.
189
Chou, Wen-ying Sylvia, Abby Prestin, Claire Lyons, and Kuang-yi Wen. “Web 2.0 for Health Promotion: Reviewing the Current Evidence.” American Journal of Public Health 103, no. 1 (2013). http://ajph.aphapublications.org/doi/pdf/10.2105/AJPH.2012.301071.
Cody, Michael J., Deborah Dunn, Shari Hoppin, and Pamela Wendt. “Silver Surfers: Training and Evaluating Internet Use among Older Adult Learners.” Communication Education 48, no. 4 (October 1999): 269–286. doi:10.1080/03634529909379178.
Columbia Telecommunications Corporation. Benefits Beyond the Balance Sheet: Quantifying the Business Case for Fiber-to-the-Premises in Seattle, 2009. http://www.seattle.gov/broadband/docs/SeattleFTTNBenefits_091109.pdf.
Common Sense Media. Digital Literacy and Citizenship in the 21st Century: Educating, Empowering, and Protecting America’s Kids. San Francisco, CA, March 2011.
Communications Workers of America. Speed Matters: Benefits of Broadband. Washington, DC, 2009. http://files.cwa-union.org/speedmatters/CWA_Benefits_of_Broadbandr_2010.pdf.
Connected Nation. The Economic Impact of Stimulating Broadband Nationally, February 21, 2008. http://www.connectednation.org/_documents/connected_nation_eis_study_full_report_02212008.pdf.
Crandall, Robert W., William H. Lehr, and Robert E. Litan. The Effects of Broadband Deployment on Output and Employment: A Cross-Sectional Analysis of U.S. Data. Issues in Economic Policy. Washington, DC: The Brookings Institution, July 2007. http://www.brookings.edu/research/papers/2007/06/labor-crandall.
Czernich, Nina, Oliver Falck, Tobias Kretschmer, and Ludger Woessmann. “Broadband Infrastructure and Economic Growth.” The Economic Journal 121, no. 552 (May 12, 2011): 505–532. doi:10.1111/j.1468-0297.2011.02420.x.
Darby, Larry F., Joseph P. Jr. Fuhr, and Stephen B. Pociask. The Internet Ecosystem: Employment Impacts of National Broadband Policy. Washington, DC: The American Consumer Institute, January 28, 2010. http://www.theamericanconsumer.org/wp-content/uploads/2010/01/aci-jobs-study-final1.pdf.
Dean, Michael Ann. “Using the Internet in the Job Search.” In Employment Options for Foreign Service Family Members, 31–48. Washington, DC: Family Liaison Office, United States Department of State, 2001. http://www.state.gov/m/dghr/flo/c21652.htm.
Digital Impact Group. “The Economic Impact of Digital Exclusion” 19104, no. 215 (2010). http://www.econsult.com/articles/030810_costofexclusion.pdf.
DiMaggio, P., and B. Bonikowski. “Make Money Surfing the Web? The Impact of Internet Use on the Earnings of U.S. Workers.” American Sociological Review 73, no. 2 (April 01, 2008): 227–250. doi:10.1177/000312240807300203.
Dolton, Peter, and Panu Pelkonen. The Impact of Computer Use, Computer Skills and Computer Use Intensity: Evidence from WERS 2004. London, August 2007. http://eprints.lse.ac.uk/19389/.
Economics and Statistics Administration, and National Telecommunications and Information Administration. Exploring the Digital Nation: Computer and Internet Use at Home. United

190
States Department of Commerce, November 09, 2011. http://www.ntia.doc.gov/report/2011/exploring-digital-nation-computer-and-internet-use-home.
Fairlie, Robert W. “The Effects of Home Computers on School Enrollment.” Working Paper, September 2003. http://cjtc.ucsc.edu/docs/r_schoolcomp6.pdf.
Fairlie, Robert W., and Samantha H. Grunberg. “Access to Technology and the Transfer Function of Community Colleges: Evidence from a Field Experiment” (2013). https://www.econstor.eu/dspace/bitstream/10419/90111/1/dp7764.pdf.
Federal Communications Commission. Connecting America: The National Broadband Plan, 2010. http://www.broadband.gov/plan/.
Florida Department of Transportation, and Construction Estimating Institute. “Construction Management Development Program and Bond Guarantee Program,” 2013. http://www.dot.state.fl.us/equalopportunityoffice/BDISS/CEI_CMDP_BGP_Brochure.pdf.
Ford, George S. Internet Use and Labor Market Participation: Additional Insights from New and Old Data. Phoenix Center Perspectives 11-04. Phoenix Center for Advanced Legal and Economic Policy Studies, August 18, 2011. http://www.phoenix-center.org/perspectives/Perspective11-04Final.pdf.
Ford, George S., and Sherry G. Ford. “Internet Use and Depression Among the Elderly,” October 2009. http://www.phoenix-center.org/pcpp/PCPP38Final.pdf.
Gelman, Andrew, and Jennifer Hill. “Causal Inference Using More Advanced Models.” In Data Analysis Using Regression and Multilevel/Hierarchical Models, 199–233. Cambridge, MA: Cambridge University Press, 2006. doi:10.1017/CBO9780511790942.
Genachowski, Julius. “Broadband: Our Enduring Engine for Prosperity and Opportunity.” In NARUC Conference. Washington, DC, 2010. http://hraunfoss.fcc.gov/edocs_public/attachmatch/DOC-296262A1.pdf.
———. “Remarks on Broadband Adoption,” 2011. http://www.fcc.gov/document/chairman-genachowski-broadband-adoption.
Gikas, Joanne, and Michael M. Grant. “Mobile Computing Devices in Higher Education: Student Perspectives on Learning with Cellphones, Smartphones & Social Media.” Internet and Higher Education 19 (2013): 18–26. https://www.academia.edu/3748701/Mobile_Computing_Devices_in_Higher_Education_Student_Perspectives_on_Learning_with_Cellphones_Smartphones_and_Social_Media.
Gillett, Sharon E., William H. Lehr, Carlos A. Osorio, and Marvin A. Sirbu. Measuring Broadband’s Economic Impact. National Technical Assistance, Training, Research, and Evaluation Project #99-07-13829. Washington, DC: United States Department of Commerce, February 28, 2006. http://cfp.mit.edu/publications/CFP_Papers/Measuring_bb_econ_impact-final.pdf.
Gillett, Sharon Eisner, William H. Lehr, Carlos A. Osorio, and Marvin A. Sirbu. Measuring the Economic Impact of Broadband Deployment. National Technical Assistance, Training, Research, and Evaluation Project #99-07-13829. Washington, DC: United States Department of Commerce, February 28, 2006. http://cfp.mit.edu/publications/CFP_Papers/Measuring_bb_econ_impact-final.pdf.
191
Grimes, Arthur, Cleo Ren, and Phillip Stevens. “The Need for Speed: Impacts of Internet Connectivity on Firm Productivity” (2009). http://papers.ssrn.com/sol3/papers.cfm?abstract_id=1604247.
———. “The Need for Speed: Impacts of Internet Connectivity on Firm Productivity” (2009). http://papers.ssrn.com/sol3/papers.cfm?abstract_id=1604247.
Hanssen, Gro Sandkjaer. “E-Communication: Strengthening the Ties between Councillors and Citizens in Norwegian Local Government?” Scandinavian Political Studies 31, no. 3 (September 2008): 333–361. doi:10.1111/j.1467-9477.2008.00209.x.
HealthIT.gov. “Benefits of Health IT,” August 28, 2012. http://www.healthit.gov/patients-families/health-it-makes-health-care-convenient.
Henkel, John. “Buying Drugs Online: It’s Convenient and Private, but Beware of ‘Rogue Sites,’” November 10, 2011. http://www.fda.gov/Drugs/EmergencyPreparedness/BioterrorismandDrugPreparedness/ucm137269.htm.
Hoffman, Judy, John Carlo Bertot, Denise M. Davis, and Larra Clark. Libraries Connect Communities: Public Library Funding & Technology Access Study 2010-2011. Digital supplement of American Libraries magazine, June 2011. http://www.ala.org/research/initiatives/plftas/2010_2011.
Hulbert, Linda Ann, and Regina C. McBride. “Utilizing Videoconferencing in Library Education: A Team Teaching Approach.” Journal of Education for Library and Information Science 45, no. 1 (2004): 25–35. http://www.jstor.org/stable/40323919.
Hyland, Marie, Richard Layte, Sean Lyons, Selina McCoy, and Mary Silles. “Are Classroom Internet Use and Academic Performance Higher after Government Broadband Subsidies to Primary Schools?” (2013). http://www.econstor.eu/handle/10419/88520.
IBM. “IBM Survey Reveals New Type of Energy Concern.” IBM News Room. Armonk, NY, August 25, 2011. http://www-03.ibm.com/press/us/en/pressrelease/35271.wss.
IBM Learning Solutions. IBM’s Learning Transformation Story. Somers, NY: IBM Global Services, June 2004. http://www-304.ibm.com/easyaccess/fileserve?contentid=183268.
Ito, Mizuko, Heather Horst, Matteo Brittanit, Danah Boyd, Becky Herr-Stephenson, Patricia G. Lange, C.J. Pascoe, and Laura Robinson. Living and Learning with New Media Summary of Findings from the Digital Youth Project. The John D. and Catherine T. MacArthur Foundation Reports on Digital Media and Learning, November 2008. http://digitalyouth.ischool.berkeley.edu/files/report/digitalyouth-WhitePaper.pdf.
Jayakar, Krishna, and Eun-A Park. “Broadband Availability and Employment: An Analysis of County-Level Data from the National Broadband Map.” Journal of Information Policy 3 (2013): 181–200. http://jip.vmhost.psu.edu/ojs/index.php/jip/article/viewArticle/121.
Kao, Audiey C., Diane C. Green, Nancy A. Davis, Jeffrey P. Koplan, and Paul D. Cleary. “Patients’ Trust in Their Physicians: Effects of Choice, Continuity, and Payment Method.” Journal of General Internal Medicine 13, no. 10 (October 1998): 681–686. http://www.ncbi.nlm.nih.gov/pmc/articles/PMC1500897/.

192
Kao, Audiey C., Diane C. Green, Alan M. Zaslavsky, Jeffrey P. Koplan, and Paul D. Cleary. “The Relationship Between Method of Physician Payment and Patient Trust.” JAMA: The Journal of the American Medical Association 280, no. 19 (November 18, 1998): 1708–1714. doi:10.1001/jama.280.19.1708.
Klersy, Catherine, Annalisa De Silvestri, Gabriella Gabutti, Arturo Raisaro, Moreno Curti, François Regoli, and Angelo Auricchio. “Economic Impact of Remote Patient Monitoring: An Integrated Economic Model Derived from a Meta-Analysis of Randomized Controlled Trials in Heart Failure.” European Journal of Heart Failure 13, no. 4 (April 2011): 450–9. doi:10.1093/eurjhf/hfq232.
Kolko, Jed. “Broadband and Local Growth” (2010). http://www.broadbandillinois.org/uploads/cms/documents/ssrn-id1680597.pdf.
Krippendorff, Klaus. Content Analysis: An Introduction. 2nd ed. Thousand Oaks, CA: SAGE Publications, 2004.
Kuhn, Peter, and Hani Mansour. “Is Internet Job Search Still Ineffective?” Forthcoming in The Economic Journal (December 2013). doi:10.1111/ecoj.12119.
LaRose, Robert, Jennifer L. Gregg, Sharon Stover, Joseph Straubhaar, and Nobuya Inagaki. Closing the Rural Broadband Gap, Final Technical Report, November 30, 2008. https://www.msu.edu/~larose/ruralbb/.
Lauer, George. “Seniors Who Use Internet Could Reap Health Benefits, Studies Show,” December 01, 2009. http://www.ihealthbeat.org/features/2009/seniors-who-use-internet-could-reap-health-benefits-studies-show.aspx.
LECG Ltd. Economic Impact of Broadband: An Empirical Study. London, UK, February 22, 2009. http://www.connectivityscorecard.org/images/uploads/media/Report_BroadbandStudy_LECG_March6.pdf.
———. Economic Impact of Broadband: An Empirical Study. London, UK, February 22, 2009. http://www.connectivityscorecard.org/images/uploads/media/Report_BroadbandStudy_LECG_March6.pdf.
Lehr, William H., Marvin Sirbu, and Sharon Gillett. “Broadband Open Access: Lessons from Municipal Network Case Studies,” 2008.
Lindmark, Sven. Web 2.0: Where Does Europe Stand? Seville, Spain: The Institute for Prospective Technological Studies, 2009. http://ipts.jrc.ec.europa.eu/publications/pub.cfm?id=2539.
Lusis, Ingrida, and Pam Mason. Paradigm Shift: The New World of Hearing Health Care Delivery, 2012.
Manforti, Jessica Lavariega, and Jose Marichal. “The Role of Digital Skills in the Formation Trust and Efficacy Among Latinos.” In Western Political Science Association Annual Conference. San Antonio, TX, 2011. http://papers.ssrn.com/sol3/papers.cfm?abstract_id=1767233.
Manjarrez, Carlos A., and Kyle Schoembs. Who’s in the Queue? A Demographic Analysis of Public Access Computer Users and Uses in U.S. Public Libraries. Research Brief Series, No. 4 (IMLS-2011-RB-04). Washington, DC: Institute of Museum and Library Services, June 2011. http://www.imls.gov/assets/1/AssetManager/Brief2011_04.pdf.

193
Matthews, H. Scott, and Eric Williams. “Telework Adoption and Energy Use in Building and Transport Sectors in the United States and Japan.” Journal of Infrastructure Systems 11, no. 1 (March 2005): 21–30. doi:10.1061/(ASCE)1076-0342(2005)11:1(21).
McDaid, David, and A-La Park. Online Health: Untangling the Web, 2010.
———. Online Health: Untangling the Web, 2010.
Means, Barbara, Yukie Toyama, Robert Murphy, Marianne Bakia, and Karla Jones. Evaluation of Evidence-Based Practices in Online Learning: A Meta-Analysis and Review of Online Learning Studies. Washington, DC: United States Department of Education, September 2010. http://www2.ed.gov/rschstat/eval/tech/evidence-based-practices/finalreport.pdf.
Miller, Stephen. “Online Tools Help Consumers Make Cost-Effective Decisions on Drugs, Routine Care.” Alexandria, VA: Society for Human Resource Management, November 23, 2010. http://www.shrm.org/hrdisciplines/benefits/Articles/Pages/CostTools.aspx.
Moody, Ruth H., and Michael P. Bobic. “Teaching the Net Generation without Leaving the Rest of Us Behind: How Technology in the Classroom Influences Student Composition.” Politics & Policy 39, no. 2 (April 29, 2011): 169–194. doi:10.1111/j.1747-1346.2011.00287.x.
Moran, Juan, Richard Ferdig, P. David Pearson, James Wardrop, and Robert Blomeyer. “Technology and Reading Performance in the Middle-School Grades: A Meta-Analysis with Recommendations for Policy and Practice.” Journal of Literacy Research 40, no. 1 (January 2008): 6–58. doi:10.1080/10862960802070483.
Moyer, Cheryl A. “Online Patient-Provider Communication: How Will It Fit?” The Electronic Journal of Communication 17, no. 3 & 4 (2007). http://www.cios.org/EJCPUBLIC/017/3/01732.HTML.
National Association of Colleges and Employers. “Class of 2012: 60 Percent of Paid Interns Got Job Offers,” 2012.
———. “Class of 2013: Paid Interns Outpace Unpaid Peers in Job Offers, Salaries,” 2013.
National Telecommunications and Information Administration. “About.” BroadbandUSA: Connecting America’s Communities. Washington, DC, June 11, 2012. http://www2.ntia.doc.gov/about.
———. “Application Search.” Broadband USA, 2014. http://www.ntia.doc.gov/legacy/broadbandgrants/applications/results.htm.
———. Broadband Technology Opportunities Program (BTOP) Quarterly Program Status Report. Washington, DC, March 2012. http://www.ntia.doc.gov/files/ntia/publications/12th-btop-quarterly-congressional-report-march-2012.pdf.
———. “Broadband Technology Opportunities Program Notices.” Washington, DC, January 22, 2010. http://www.ntia.doc.gov/files/ntia/publications/fr_btopnofa_100115_0.pdf.
———. “BTOP Evaluation Study.” Program Reports, 2013. http://www2.ntia.doc.gov/BTOP-Reports#evaluation.
———. Cambridge Housing Authority Community Computer Centers. BroadbandUSA: Connecting America’s Communities. Accessed February 22, 2012. http://www2.ntia.doc.gov/grantees/CambridgeHousingAuthority.
194
———. City of Chicago SmartChicago Public Computer Centers Fact Sheet. BroadbandUSA: Connecting America’s Communities, August 2010. http://www2.ntia.doc.gov/files/grantees/cityofchicago.pdf.
———. “Connect Arkansas Expanding Broadband Use in Arkansas Through Education Fact Sheet.” Broadband USA Connecting America’s Communities, 2010. http://www2.ntia.doc.gov/files/grantees/factsheetarconnectarkansas.pdf.
———. “Florida A&M University The FAMU Center for Public Computing and Workforce Development Fact Sheet,” September 2010. http://www2.ntia.doc.gov/files/grantees/factsheetflfloridaam.pdf.
———. “NTIA’s BTOP Map.” Connecting America’s Communities. Washington, DC, August 15, 2013. http://www2.ntia.doc.gov/BTOPmap/.
———. “Post-Award Monitoring (PAM) Database,” 2013.
———. “Statement of Work for Broadband Technology Opportunities Program (BTOP) Evaluation Study,” 2010.
———. “Statement of Work for Broadband Technology Opportunities Program (BTOP) Evaluation Study,” July 26, 2010.
National Telecommunications and Information Administration, and Federal Communications Commission. “State Broadband Initiative,” February 12, 2014.
Nuechterlein, Jonathan E., and Philip J. Weiser. Digital Crossroads: American Telecommunications Policy in the Internet Age. Cambridge, MA: The MIT Press, 2005.
OECD. “Broadband Networks and Open Access.” OECD Digital Economy Papers no. 218 (March 04, 2013).
Osimo, David. Web 2 .0 in Government: Why and How? Seville, Spain: Institute for Prospective Technological Studies, 2008. http://ipts.jrc.ec.europa.eu/publications/pub.cfm?id=1565.
Park, Namsu, Kerk F. Kee, and Sebastián Valenzuela. “Being Immersed in Social Networking Environment: Facebook Groups, Uses and Gratifications, and Social Outcomes.” CyberPsychology & Behavior 12, no. 6 (December 2009): 729–33. doi:10.1089/cpb.2009.0003.
Pasek, Josh. “Building Social Capital in Young People: The Role of Mass Media and Life Outlook.” Working Paper, 2009. http://umich.academia.edu/JoshPasek/Papers/97408/Building_Social_Capital_in_Young_People_The_Role_of_Mass_Media_and_Life_Outlook.
Passey, Don, Colin Rogers, Joan Machell, and Gilly McHugh. The Motivational Effect of ICT on Pupils. RR523. Lancaster, UK: University of Lancaster, April 2004. https://www.education.gov.uk/publications/RSG/ICTSCH/Page1/RR523.
Perez, Roger. “The Advantages of Internet Job Searching.” Livestrong, August 09, 2010. http://www.livestrong.com/article/199545-the-advantages-of-internet-job-searching/.
195
PriceWaterhouseCoopers. Champion for Digital Inclusion: The Economic Case for Digital Inclusion, October 2009. http://www.parliamentandinternet.org.uk/uploads/Final_report.pdf.
Prieger, James. “The Broadband Digital Divide and the Economic Benefits of Mobile Broadband for Rural Areas” (2012). http://papers.ssrn.com/sol3/papers.cfm?abstract_id=2258112.
———. “The Economic Benefits of Mobile Broadband.” School of Public Policy Working Papers. Malibu, CA: Pepperdine University, May 15, 2012. http://digitalcommons.pepperdine.edu/sppworkingpapers/38.
Protheroe, Nancy. “Technology and Student Achievement.” Principal, November 2005. http://www.naesp.org/resources/2/Principal/2005/N-Dp46.pdf.
“Public Safety,” March 05, 2014. http://www.ntia.doc.gov/category/public-safety.
R Development Core Team. R: A Language and Environment for Statistical Computing. Vienna, Austria, 2012. http://www.r-project.org/.
Rainie, Lee, Kristen Purcell, Tony Siesfeld, and Mayur Patel. How the Public Perceives Community Information Systems. Internet and American Life Project. Washington, DC: Pew Research Center, March 01, 2011. http://pewinternet.org/Reports/2011/08-Community-Information-Systems.aspx.
Rainie, Lee, Kristen Purcell, and Aaron Smith. The Social Side of the Internet. Internet and American Life Project. Washington, DC: Pew Research Center, January 18, 2011. http://pewinternet.org/Reports/2011/The-Social-Side-of-the-Internet.aspx.
Redecker, Christine, Alexandra Haché, and Clara Centeno. Using Information and Communication Technologies to Promote Education and Employment Opportunities for Immigrants and Ethnic Minorities. Seville, Spain: Institute for Prospective Technological Studies, May 2010. http://ipts.jrc.ec.europa.eu/publications/pub.cfm?id=3219.
Representative of Stevens County Demonstration Community. “Interview with Author,” March 20, 2013.
Representatives of Center for Accessible Technology. “Interview with Authors,” January 15, 2013.
Representatives of Chicago Smart Communities. “Interview with Authors,” February 28, 2013.
Representatives of Midlands Technical College. “Interview with Authors,” January 31, 2013.
Richardson, D.J., J.M. Fini, and L.E. Nelson. “Space Division Multiplexing in Optical Fibres,” March 15, 2013. http://arxiv.org/abs/1303.3908.
Rintels, Jonathan. An Action Plan for America Using Technology and Innovation to Address Our Nation’s Critical Challenges- A Report for the New Administration from the Benton Foundation, 2008. http://benton.org/sites/benton.org/files/Benton_Foundation_Action_Plan.pdf.
———. An Action Plan for America Using Technology and Innovation to Address Our Nation’s Critical Challenges- A Report for the New Administration from the Benton Foundation, 2008. http://benton.org/sites/benton.org/files/Benton_Foundation_Action_Plan.pdf.

196
Rohman, Ibrahim Kholilul, and Erik Bohlin. “Impact of Broadband Speed on Household Income: Comparing OECD and BIC” (2013). http://www.econstor.eu/handle/10419/88531.
Rojas, Hernando, and Eulalia Puig-i-Abril. “Mobilizers Mobilized: Information, Expression, Mobilization and Participation in the Digital Age.” Journal of Computer-Mediated Communication 14, no. 4 (July 2009): 902–927. doi:10.1111/j.1083-6101.2009.01475.x.
Rural Utilities Service, and National Telecommunications and Information Administration. “Broadband Initiatives Program & Broadband Technology Opportunities Program.” Federal Register 74, no. 130 (July 09, 2009): 33104–34. http://www.gpo.gov/fdsys/pkg/FR-2009-07-09/pdf/FR-2009-07-09.pdf.
Scarvell, Andrew. “Digital Literacy and Awareness in Australia’ S New Global Frontier.” In First Media and Information Literacy Forum. Fez, Morocco: UNESCO, 2011. http://scarvell.net/andrew/blog/?page_id=15.
Sekhon, Jasjeet S. “Multivariate and Propensity Score Matching Software with Automated Balance Optimization: The Matching Package for R.” Journal of Statistical Software 42, no. 7 (June 2011).
Shapley Research Associates, and Texas Center for Educational Research. Final Outcomes for a Four–Year Study (2004–05 to 2007–08). Evaluation of the Texas Technology Immersion Pilot (eTxTIP), January 2009. http://www.tcer.org/research/etxtip/.
Shuler, Carly. Pockets of Potential: Using Mobile Technologies to Promote Children’s Learning. New York, NY: The Joan Gans Cooney Center, January 2009. http://joanganzcooneycenter.org/Reports-23.html.
Skoric, Marko M., and Grace Kwan. “Do Facebook and Video Games Promote Political Participation Among Youth? Evidence from Singapore.” Journal of E-Democracy and Open Government 3, no. 1 (2011): 70–79. http://www.jedem.org/article/view/49.
Smith, Aaron. Government Online. Pew Internet & American Life Project, April 27, 2010. http://www.pewinternet.org/files/old-media//Files/Reports/2010/PIP_Government_Online_2010_with_topline.pdf.
SQW Consulting. Broadband in the Home: An Analysis of the Financial Costs and Benefits. Final Report to the Post Office, September 18, 2008. http://www.sqw.co.uk/files/8713/8712/1234/83.pdf.
Stansberry, Susan, and Stephoni Case. “26B-E: Teaching with Facebook as a Learning Management System (TED).” In Annual Meeting of the AECT Convention. Hyatt Regency Orange County, Anaheim, CA: Association for Educational Communications and Technology, 2010. http://convention2.allacademic.com/one/aect/aect10/index.php?click_key=1&cmd=Multi+Search+Search+Load+Publication&publication_id=430535&PHPSESSID=jgkifdqag6qgtckajo0k657jc7.
Stenberg, Peter, Mitchell Morehart, Stephen Vogel, John Cromartie, Vince Breneman, and Dennis Brown. Broadband Internet’s Value for Rural America. ERR-78. United States Department of Agriculture Economic Research Service, August 2009. http://www.ers.usda.gov/publications/err-economic-research-report/err78.aspx.
197
———. Broadband Internet’s Value for Rural America. ERR-78. Washington, DC: United States Department of Agriculture Economic Research Service, August 2009. http://www.ers.usda.gov/publications/err-economic-research-report/err78.aspx.
Stern, Michael J., Alison E. Adams, and Jeffrey Boase. “Rural Community Participation, Social Networks, and Broadband Use: Examples from Localized and National Survey Data.” Agricultural and Resource Economics Review 40, no. 2 (August 2011): 158–171. http://purl.umn.edu/117769.
Taylor-Powell, Ellen, Larry Jones, and Ellen Henert. Enhancing Program Performance with Logic Models. Madison, WI: University of Wisconsin-Extension, 2003. http://www.uwex.edu/ces/lmcourse/.
The Allen Consulting Group. Quantifying the Possible Economic Gains of Getting More Australian Households Online, November 2010. http://www.acilallen.com.au/cms_files/acgquantifyingonline2010.pdf.
The Recovery Accountability and Transparency Board. “Recovery API.” Recovery.gov. Washington, DC, March 20, 2013. http://www.recovery.gov/FAQ/Developer/Pages/RecoveryAPI.aspx.
The South Dakota Bureau of Information and Telecommunications. “Broadband Benefits for Rural Areas,” 2011.
———. “Broadband Benefits for Rural Areas,” February 01, 2011. http://broadband.sd.gov/Benefits-Rural.aspx.
The State of Michigan. “The Benefits of Broadband,” August 27, 2012. http://michigan.gov/broadband/0,1607,7-250-48184_48185---,00.html.
United States Census Bureau. “2006-2010 ACS 5-Year Summary File.” American Community Survey. Washington, DC, December 08, 2011. http://www.census.gov/acs/www/data_documentation/2010_release/.
———. 2010 Census Summary File 1. Vol. 3. Washington, DC, March 2012. http://www.census.gov/prod/cen2010/doc/sf1.pdf#page=474.
———. “2010 TIGER/Line® Shapefiles.” Washington, DC, June 19, 2012. http://www.census.gov/geo/www/cob/cbf_counties.html.
University of Arkansas for Medical Sciences. “SCTRC Follow Up Information,” 2013.
USDA Economic Research Service. “Rural Digital Economy: Online Activities.” Briefing Rooms, August 13, 2009. http://ers.usda.gov/Briefing/Telecom/demandservice.htm.
Valentine, Gil, Jackie Marsh, Charles Pattie, and BMRB. Children and Young People’s Home Use of ICT for Educational Purposes: The Impact on Attainment at Key Stages 1-4. RB672, August 2005. https://www.education.gov.uk/publications/RSG/Parentscarersandfamilies/Page12/RB672.
Van der Wee, Marlies, Menno Driesse, Bernd Vandersteegen, Pierre Van Wijnsberge, Sofie Verbrugge, Bert Sadowski, and Mario Pickavet. “Identifying and Quantifying the Indirect Benefits of Broadband Networks: A Bottom-up Approach.” In Moving Forward with Future
198
Technologies: Opening a Platform for All, 2012. https://biblio.ugent.be/input/download?func=downloadFile&recordOId=3259119&fileOId=3259120.
Van Deursen, A.J.A.M. “Internet Skills: Vital Assets in an Information Society.” Enschede, The Netherlands: University of Twente, November 01, 2010. doi:10.3990/1.9789036530866.
Van Deursen, A.J.A.M., and J.A.G.M. van Dijk. “Improving Digital Skills for the Use of Online Public Information and Services.” Government Information Quarterly 26, no. 2 (April 2009): 333–340. doi:10.1016/j.giq.2008.11.002.
Van Deursen, Alexander J.A.M. “Internet Skills: Vital Assets in an Information Society.” Enschede, The Netherlands: University of Twente, November 01, 2010. doi:10.3990/1.9789036530866.
Wee, Van Der. “Identifying and Quantifying the Indirect Benefits of Broadband Networks: A Bottom-up Approach” (2012).
West, Darrell M. “Mobile Learning: Transforming Education, Engaging Students, and Improving Outcomes” (2013). http://safeschooluniversity.com/pdfs/issues/eLearning/motivation/MobileLearning.pdf.
———. Ten Facts about Mobile Broadband. Washington, DC: The Brookings Institution, December 08, 2011. http://www.brookings.edu/research/papers/2011/12/08-mobile-broadband-west.
Whitacrea, Brian, and Lara Brooksa. “Do Broadband Adoption Rates Impact a Community’s Health?” Behaviour & Information Technology (2013).
White, C.B., C.A. Moyer, D.T. Stern, and S.J. Katz. “A Content Analysis of E-Mail Communication Between Patients and Their Providers: Patients Get the Message.” Journal of the American Medical Informatics Association 11, no. 4 (2004): 260–267.
Williams, Sean. “Fiber Broadband : A Foundation for Social and Economic Growth” (2013): 67–75.
Wittwer, Jörg, and Martin Senkbeil. “Is Students’ Computer Use at Home Related to Their Mathematical Performance at School?” Computers & Education 50, no. 4 (May 2008): 1558–1571. doi:10.1016/j.compedu.2007.03.001.
Wynne, Maria E., and Lane F. Cooper. Power Up: The Campaign for Digital Inclusion. Office of Economic Development and Innovation, Microsoft Corporation, June 2007. http://www.digitalaccess.org/pdf/White_Paper.pdf.
Yin, Robert K. Case Study Research: Design and Methods. 4th ed. Los Angeles, CA: SAGE Publications, 2009.
Young, Lance Brendan, Paul S. Chan, Xin Lu, Brahmajee K. Nallamothu, Comilla Sasson, and Peter M. Cram. “Impact of Telemedicine Intensive Care Unit Coverage on Patient Outcomes: A Systematic Review and Meta-Analysis.” Archives of Internal Medicine 171, no. 6 (March 28, 2011): 498–506. doi:10.1001/archinternmed.2011.61.
Zhou, Y., M. Kanter, J. Wang, and T. Garrido. “Improved Quality at Kaiser Permanente through Email between Physicians and Patients.” Health Affairs 7 (2009): 1370–1375.

199